Article

Variation Characteristic Analysis of Water Content at the Flow Channel of Proton Exchange Membrane Fuel Cell

1
School of Mechanical-Electronic and Vehicle Engineering, Beijing University of Civil Engineering and Architecture, Beijing 100044, China
2
State Key Laboratory of Automotive Safety and Energy, Tsinghua University, Beijing 100084, China
*
Authors to whom correspondence should be addressed.
Submission received: 10 March 2022 / Revised: 24 April 2022 / Accepted: 25 April 2022 / Published: 29 April 2022
(This article belongs to the Special Issue Design, Testing and Fault Diagnosis for Fuel Cells)

Abstract

:
The performance of proton exchange membrane fuel cells (PEMFCs) is directly affected by the nonlinear variations in water content. To study the variation in water content and its effect on PEMFC performance, the water condensation rate (WCR) model is established, which determines the proportional relationship between evaporation and condensation rates in terms of the switch function, and the two-phase flow evolution and pressure drop are considered as well. The WCR model is imported into Fluent software through a user-defined function for simulation, and the test system is established under different operating conditions. Then, the contours of H2O molar concentrations and polarization curves are analyzed and compared. The results show that the condensation rate value of the cathode channel is from 1.05 to 1.55 times higher than that of the anode channel. The WCR model can predict the variation in water content and improve the accuracy of the performance calculation by from 9% to 31%. The accuracy of the WCR model is especially improved, by 31%, at high current densities compared with the Fluent model when the inlet pressure is 30 kPa.

1. Introduction

For years, we have witnessed noteworthy scientific progress in proton exchange membrane fuel cells (PEMFCs), a novel type of electrochemical generation assembly, with high stability, reliability, and an energy conversion efficiency of up to 60%, which directly convert chemical energy into electric energy [1,2,3,4,5,6]. They are suitable for automotive applications, due to their higher power density, lower operating temperature, zero-emission and lack of range anxiety, versus lithium-ion battery and internal combustion engine [7,8,9]. However, PEMFC still faces many difficulties in its commercialization. Among them, the water content changes are difficult to control due to the operating conditions and external environment, which results in drying or flooding inside the PEMFC, and subsequently limits the output performance and accelerates fuel cell degradation [7]. Meanwhile, the water state and its evolution are quite complicated in the fuel cell, involving a phase transition, gas-liquid coupling flow, and water transport, which are closely related to the internal conditions [10,11]. The water state in the fuel cell, determining the proton conductivity and mass transfer efficiency, significantly affects the output performance and the operating stability [10,11,12]. Therefore, one of the keys to increasing durability and accelerating the commercialization of PEMFC is to investigate the water content variation [13,14,15,16]. Additionally, it is of decisive significance to study the transfer mechanism and liquid water content at various levels [17,18,19,20].
Recently, scholars have studied the water content distribution through simulations in almost every respect, which mainly include the establishment of a single-phase flow and two-phase flow models. The single-phase flow model is based on the condition that the inlet of the PEMFC is gas-phase flow, and the fact that import and export parameters of the model are significant when studying the variations in water content. Li et al. [21] discovered a relationship between the cathode pressure drop and voltage change by establishing a single-phase flow cathode model, which estimated the water content in the flow channel, and the calculation error was less than 10%. However, most scholars focus on the two-phase flow model, which can accurately describe the complex material transfer process and electrochemical reactions in the PEMFC. Shen et al. [22] studied the dynamic properties of two-phase flow in the flow channel and found that the phase transition seriously affects the morphology, distribution, and migration of the water. Zhang et al. [23] established a three-dimensional gas-liquid two-phase flow model to study water condensation and evaporation in PEMFC channels. The results showed that the vapor concentration in the cathode channel was much higher than the saturation concentration. Han et al. [24] studied different water evaporation mechanisms in PEMFC. It was found that the current density in a PEMFC, considering evaporation and condensation, was much lower than that in the case of not considering, especially in the cathode side.
Moreover, it is convenient to gain the working principle and research the effect of phase change and liquid water content in PEMFC. The two-phase model has been established and extensively studied, and water transport theory [25] and parameter-varying-design [26,27] have been widely focused on. Bao et al. [28] developed a two-phase model to simulate droplet flow in a fuel cell channel, where the droplet movement was identified based on the separation rate and position. The results highlighted that the flow rate interacts with droplet dynamics and that the surface parameters of the flow channel had little effect on liquid removal efficiency. Xie et al. [29] conducted a 3D numerical simulation of water behavior, showing that the water coverage rate on the top wall of the flow channel was much higher, which hinders the velocity of the two-phase flow. Sun et al. [30] conducted a two-dimensional numerical simulation to study the flow of liquid water in the flow channel using the phase-field method. The results showed that different contact angle distributions had a significant impact on the transport of liquid water. When the GDL at the bottom was more hydrophilic than the GDL at the top, liquid water was more likely to naturally accumulate at the bottom, resulting in a higher water content. Therefore, relevant parameters of liquid water can successfully be used to control the variation in phase changes and the detailed changes in water content inside the PEMFC [31,32,33,34,35]. Scholars have studied the effects of surface tension, gravity, and adhesion, and proposed several improved serpentine flow fields to improve the performance of PEMFCs [36,37,38]. Malhotra et al. [18] studied the characteristics of an air-water two-phase flow in a rectangular serpentine microchannel and proposed a modified friction coefficient for the pressure drop. Afra et al. [39] established a visual water injection experimental system to observe water transport through a transparent GDL. Although comprehensive research has been carried out on the variation in water content, the majority of researchers have mainly estimated changes in water content based on the characteristic parameters of liquid [40,41,42,43,44]. However, the relevant liquid parameters of different flow channels are also different, and it is difficult to conduct a unified simulation [45,46]. The condensation rate, as a parameter that can be used to measure the water phenomenon in fuel cells, can be applied to various types of flow channels in fuel cell simulations.
In this paper, a water condensation rate (WCR) model of PEMFC is established based on the conditions of the water-gas interface, which considers the effect of the evaporation-condensation ratio and the pressure drop on water content. Furthermore, the WCR model numerically simulates the fluid flow problem and the migration and diffusion of liquid water at various layers. Then, the schedule diagram of the simulation is shown, and the model is meshed by GAMBIT software. The WCR model is imported into the Fluent software through a user-defined function. The operating conditions are managed through a fuel cell testing system with a temperature of 75 °C, relative humidity of 100%, and inlet pressure from 10 kPa to 40 kPa. Finally, the contours of the water content molar concentrations, polarization curves, and condensation rate curves are compared and analyzed.

2. WCR Model

2.1. Condensation Rate

In gas channels, the only possible heat generation or dissipation occurs during the phase changes. Evaporation occurs when liquid water exists in the gas stream; meanwhile, the gas is unsaturated in case either the pressure decreases or the temperature increases. Condensation occurs when the gas is already fully saturated or the temperature of gas steam drops. Moreover, condensation may also occur when the reactant gas or its components (hydrogen or oxygen) “disappear” in the electrochemical reaction.
Assuming an ideal gas and neglecting interactions between individual molecules, the condensation rate in the flow channel can be estimated as [47]:
R H 2 O ( g ) , c o n d = P P s a t y w P P s a t R H 2 O ( v ) i n
where   R H 2 O ( g ) , c o n d and R H 2 O ( v ) i n is the rate of condensation (g·s−1) and the inlet water flow rate (g·s−1), P is the fluid pressure in the flow channel (kPa), P s a t is the saturated vapor pressure (kPa), y w is the mole fraction of water vapor.
When P s a t / y w > P , the same equation can also apply to the evaporation process in the flow channel if liquid water exists in the gas stream:
R H 2 O ( l ) , e v a p = P s a t y w P P P s a t R H 2 O ( v ) i n
Moreover, in case of evaporation, it may be easier to deal with water content x w , defined as the mass ratio of water vapor and dry gas instead of y w .
R H 2 O ( l ) , e v a p = m i n [ R H 2 O ( l ) R g a s ( x s a t x w ) ]
where x s a t is the maximum mass fraction of water vapor in dry gas (at saturation).
Notes that Equations (1)–(3) are based on the whole flow channel. The condensation and evaporation of water depend on the local mass and heat transfer conditions. In the actual situation, the rates of water condensation and evaporation depend on the local conditions, e.g., local pressure, pore structure and water–gas interface. A volumetric condensation rate at local positions should be redefined, as demonstrated in [48].
r H 2 O , c o n d = ( p wv p sat ) h p c
where r H 2 O , c o n d is the volumetric water condensation rate in a local position (g·s1·m3), p wv and p sat are the local fluid pressure and the saturated vapor pressure (kPa), respectively, h p c is the condensation parameter.
The parameter, h p c , is determined as [49,50]
h p c = c r M H 2 O ( 1 s ) R T
where c r is the rate constant, c r = 100 s−1, M H 2 O is the molar mass of water (g·mol1), s is the liquid water saturation, R is universal gas constant (8.314 J·mol−1·K−1), T is the working temperature (K).
Therefore, the volumetric condensation rate of water in a local position is defined as:
r H 2 O , c o n d = ( 1 s ) c r p wv p sat R T M H 2 O
The actual local rate of evaporation also depends on local conditions. According to the local evaporation theory of Bosiakovic [51], the rate is proportional to the phase-change surface area per unit volume. The condensation rate at a local position can be derived from the analogy between heat and mass transport:
r H 2 O , e v a p = Ψ ( x sat x H 2 O ( g ) ) M H 2 O A f g
where r H 2 O , e v a p is the volumetric evaporation rate of water in a local position (g·s1·m3), Ψ is an evaporation coefficient (g·m−2·s−1), x sat is the maximum mass fraction of water vapor in dry gas (at saturation), x H 2 O ( g ) is the fraction of water vapor in dry gas, M H 2 O is the molar mass of water (g·mol1), A f g is the phase-change surface area per unit volume (m1).
The evaporation coefficient Ψ can be determined from the dimensionless Lewis factor [51]:
Ψ c p α = [ D ρ c p κ ( 1 + x H 2 O ( g ) ) ] 1 i ( v h v d ) m i M H 2 O M g a s + x H 2 O ( g ) x s a t x H 2 O ( g ) l n M H 2 O M g a s + x s a t M H 2 O M g a s + x H 2 O ( g )
where c p is the heat capacity (J·g−1·K−1), α is the heat transfer coefficient (W·m2·K−1), D is the diffusion of water vapor through gas (m2·s−1), ρ is the density of humid air (g·m−3), κ is the thermal conductivity of humid gas (W·m−1·K−1), v h is the kinematic viscosity of humid gas (m2·s−1),   v d is the kinematic viscosity in dry gas (m2·s−1), M g a s is the molar mass of gas (g·mol−1), m and i are the coefficients, at approximately 0.75 and 0.33 [51].
The local evaporation rate depends on local conditions, especially at the water-vapor interface.
The switching function q  is defined as: q = 1 + | ( y w p p sat ) | / ( y w p p sat ) 2 .
Gas flowing through the channels experiences pressure loss, including the frictional loss and discrete loss. In previous research, the pressure drop is often used to indicate the amount of water in the channels of the PEM fuel cells for water fault diagnosis. Moreover, the pressure drop has a great impact on the water condensation rates. Pei et al. [52] present the calculation formula of pressure drops in the anode. According to the theoretical derivation and experimental verification, the anode gas pressure drop Δ p f , a n , can be obtained as:
Δ p f , a n = 1.1748 × 10 9 ( C d + C w ) 2 L T 275.7 n ( C d C w ) 3 ( p H 2 p sat ,   H 2 ) p H 2 0.0263 ( λ H 2 0.5 ) I , ( 313 K T 373 K )
where Δ p f , a n is the pressure drop of the anode (kPa), C w , is the width of flow channels (m), C d is the depth of flow channels (m), L is the length of flow channels (m), n is the number of flow channels, p H 2 and p sat ,   H 2 are the inlet pressure, saturation pressure of hydrogen (kPa), λ H 2 is the excess coefficient of hydrogen, and I is the total current (A).
For the cathode channel, Li et al. [21] developed an efficient and practical approach to determine the cathodic pressure drop of two-phase flow. This approach can be conducted online under different operating conditions. The cathode gas pressure drop Δ p f , a n theory’s calculated value formula can be estimated using Li’s equation, as demonstrated in [21]:
Δ p f , c a t = 1.907 × 10 13 L n A D h 2 R T 1.6392 p O 2 R H · p s a t , O 2 I λ O 2 + 7.609 × 10 17 ξ A i n 2 R T ( 29 p O 2 11 R H · p s a t ) ( p O 2 R H · p s a t ) 2 I 2 λ O 2 2
where Δ p f , a n is the pressure drop of the cathode (kPa), A is the cross-sectional area of a channel (m2), A i n is the cross-sectional area of inlet pipe (m2), D h is the hydraulic diameter of a channel (m), p O 2 and p sat ,   O 2 are the inlet pressure and saturation pressure for oxygen at the cathode. ξ is the local loss coefficient and λ O 2 is the oxygen excess coefficient.
Therefore, the local pressure at a point in the flow channel is: p =   p i n Δ p f .   p i n is the inlet pressure of the anode or cathode (i.e., p H 2 or p O 2 ). And the water vapor pressure is based on the vapor molar fraction and the local pressure, p wv = p   y w .
According to the water-vapor interface conditions, the condensation rate expression is:
r H 2 O , c o n d = c r [ ( 1 s ) q p wv p sat R T M H 2 O ( 1 q ) s ρ l ]
where q is the switching function and ρ l is liquid water density (g·m−3).

2.2. Channel and GDL/CL Diffusion Transmission

According to Newton’s second law, the momentum equation is as follows [47]:
( ρ υ ) t + · ( ρ υ υ ) = p + ( μ eff υ ) + S m
where υ is the velocity vector (m·s1), μ eff is the average viscosity (kg·m−1·s−1), and S m is a momentum source term.
For fuel cells, the momentum source terms are different at various layers. For gas channels: S m = 0. For backing layers and voids of the catalyst layers: S m = μ K ε v [47], where K is the permeability of the gas diffusion layer or the catalyst layer (m2), and ε is the porosity of the gas diffusion layer.
The liquid water transport behavior is also different at various layers. In the GDL, gas convection is the key to affecting liquid water transport, so the volume fraction governing equation for liquid water formation and transport is [53]:
( ε ρ l s ) t + · ( ρ l V l s ) = r w
where V l is the liquid phase rate (m·s−1).
In the CL, the main driving force for liquid water transport is the pressure of the capillary, so the convection term in the diffusion layer is replaced by the capillary diffusion term to obtain the liquid water transport equation [53]:
( ε ρ l s ) t + · ( ρ l K s 3 μ l d p c d s s ) = r w
where μ l is the viscosity (kg·m−1·s−1), and p c is the pressure of the capillary (kPa).

2.3. Boundary Conditions

In the CL, the liquid water transport equation can be seen from the above equation, in which the generation of water is also considered.
ρ d u d z = 1 2 F d i d z
where i is the current density in the electrolyte (A·cm2), F is the Faraday’s constant.
According to the relationship between the current and overpotential, the electron movement in a substantial part of the catalyst conforms to Ohm’s law.
i s = κ s e f f d Φ s d z
where i s is the current density in the catalyst (A·cm2), κ s e f f is the effective electric conductivity of the GDL (S·cm1), F is the Faraday’s constant, Φ s is the potential in the catalysts (V).
Therefore, to meet the electrical neutrality of the CL, the boundary conditions can be set as:
d i s d z + d i d z = 0
In the GDL, materials are mainly based on carbon fiber materials, which are hydrophobic. Although, in the catalyst layer, oxygen is considered to be dissolved in the water present in the electrolyte phase, the amount of oxygen and nitrogen dissolved in liquid water traveling through the GDL is negligible compared with the amount of oxygen and nitrogen in the gas phase.
d N O 2 , g d z = 0
At the junction of the GDL and CL, z = δm + δcl, and the current in the solid phase is continuous with the total flux of water,
κ d Φ s d z | c l = κ e f f d Φ s d z | g d l
ρ ε m ε w u | c l = ρ u | c l + N H 2 O
The ionic current at the boundary between the GDL and the CL is zero:
d Φ m d z | g d l = 0
On the surface of the GDL, z = δm + δcl + δgdl. Therefore, the boundary conditions at the contact point with the flow channel can be set as:
p = p i n ,   y N 2 = y N 2 i n ,   u x = 0 ,   Φ z = 0 .

3. Simulation

3.1. Schedule Diagram of the Simulation

To research water condensation rates in the PEMFC, the trajectories of gaseous water and liquid water should be calculated independently. It is necessary to establish a geometric model and conduct grid division for simulation. Firstly, the geometric model with a serpentine flow field is established, and the checked grid is imported into the user-defined function model. Secondly, the PEMFC model is defined in the ANSYS Fluent 15.0 fuel cell module. The pressure and interface exchange coefficient are coupled to describe the discrete equation in the simulation process. Meanwhile, relevant parameters such as boundary conditions and materials are set. Finally, the WCR model is initialized and all discretization transport equations are solved. The function curve convergence in the calculation process is considered, and the relevant parameters are adjusted to make the function curve converge. As the PEMFC catalyst layer is very thin, it is difficult to converge if single precision is used. In the simulation, the double precision option was chosen. The convergence criteria for all the species and the energy calculation residuals were set to 108.

3.2. Geometric Model and Mesh

A three-dimensional steady-state PEMFC model was employed in this work. Cell properties of the fuel cell model were based on the actual PEMFC, as listed in Table 1. Meshes employed in this model are shown in Figure 1. When multiple volumes are meshed, a finite number of discrete points should be used to replace the previous continuous space, and the topological relationships should be considered. The HEXCORE method was adopted to combine the advantages of the Cartesian mesh and the unstructured mesh, which significantly reduces the number of mesh and improves the quality. In the geometric model, the fluid velocity gradient near the solid wall area was sizeable. To accurately simulate fluid flow, the orthogonality and mesh resolution of the wall grid were improved to meet the wall viscosity effect. The number of mesh element numbers reached almost 3,287,582, and the anode and cathode flow channels elements were 234,475 and 284,940, respectively. The mesh type for channels and collector plates was Hybrid, and that for other parts was Hex.
Before carrying out simulations, the mesh independence test was also conducted with different mesh elements. The relative error was less than 0.5%. As a result, the mesh with 3,287,582, elements was used for simulation by considering the computational cost and accuracy.

3.3. Boundary Conditions and Model Parameters

Boundary conditions were set according to the actual state. Table 2 lists the fluid region and boundary conditions for the PEMFC simulation. All the inlet zones (mass flow inlet type) were specified as “mass flow inlet”. All the outlet zones (pressure outlet type) were specified as “pressure outlet”. The surfaces of the gas channels were set to “wall”. A no-slip boundary condition was applied to the cell and manifold walls. The inlet temperature was equal to the operating temperature, which was specified as the temperature on the internal surface of cells. The water vapor concentration was calculated using the relative humidity and partial pressure in the inlet mixture, which is a function of temperature. Other detailed modeling parameters of the model are shown in Table 3.

4. Experimental Setup

In this experiment, an intelligent fuel cell test system with temperature control was used to measure the performance of PEMFCs.
As shown in Figure 2, the system includes a real-time multichannel measurement module, high-precision flow rate control module, data processing module, online diagnosis module, and data storage module. The reaction gas by the air pump and hydrogen cylinder discharge through the pressure reducing valve, filter into the humidity control device. The gas humidity at the inlets is regulated by varying the temperature and dew point, which are controlled by electric heaters and cooling fans. The gas flow rates are controlled by mass flow controllers. In addition, the test method adopted the volt-ampere cycle method, which was used to cross-test the fuel cell.
Moreover, an electronic load was connected to the fuel cell. Voltage monitoring signal lines were connected to the corresponding voltage sampling module, which can adjust related parameters according to the experimental situation online (e.g., temperature, pressure, and flow rate). The temperature of the heater band was usually about 5 °C above the inlet temperature, to prevent gas cooling. Step heating was used in the experiment to ensure the stability of the heating process.
Experiments on the effects of the evaporation-condensation ratio and pressure drop were conducted on a 168 cm2 fuel cell. The experiment was performed under four operating conditions, which are described in Table 3. The difference between each case was the gas inlet pressure: 10 kPa, 20 kPa, 30 kPa, and 40 kPa. The relative humidity of anode gas and cathode gas at the inlet were both 100%. The operating temperature was 75 °C. The stoichiometric ratios of hydrogen and oxygen were, respectively, 2.0 and 2.0. The fuel cell used in these experiments is described in Table 4.

5. Results and Discussion

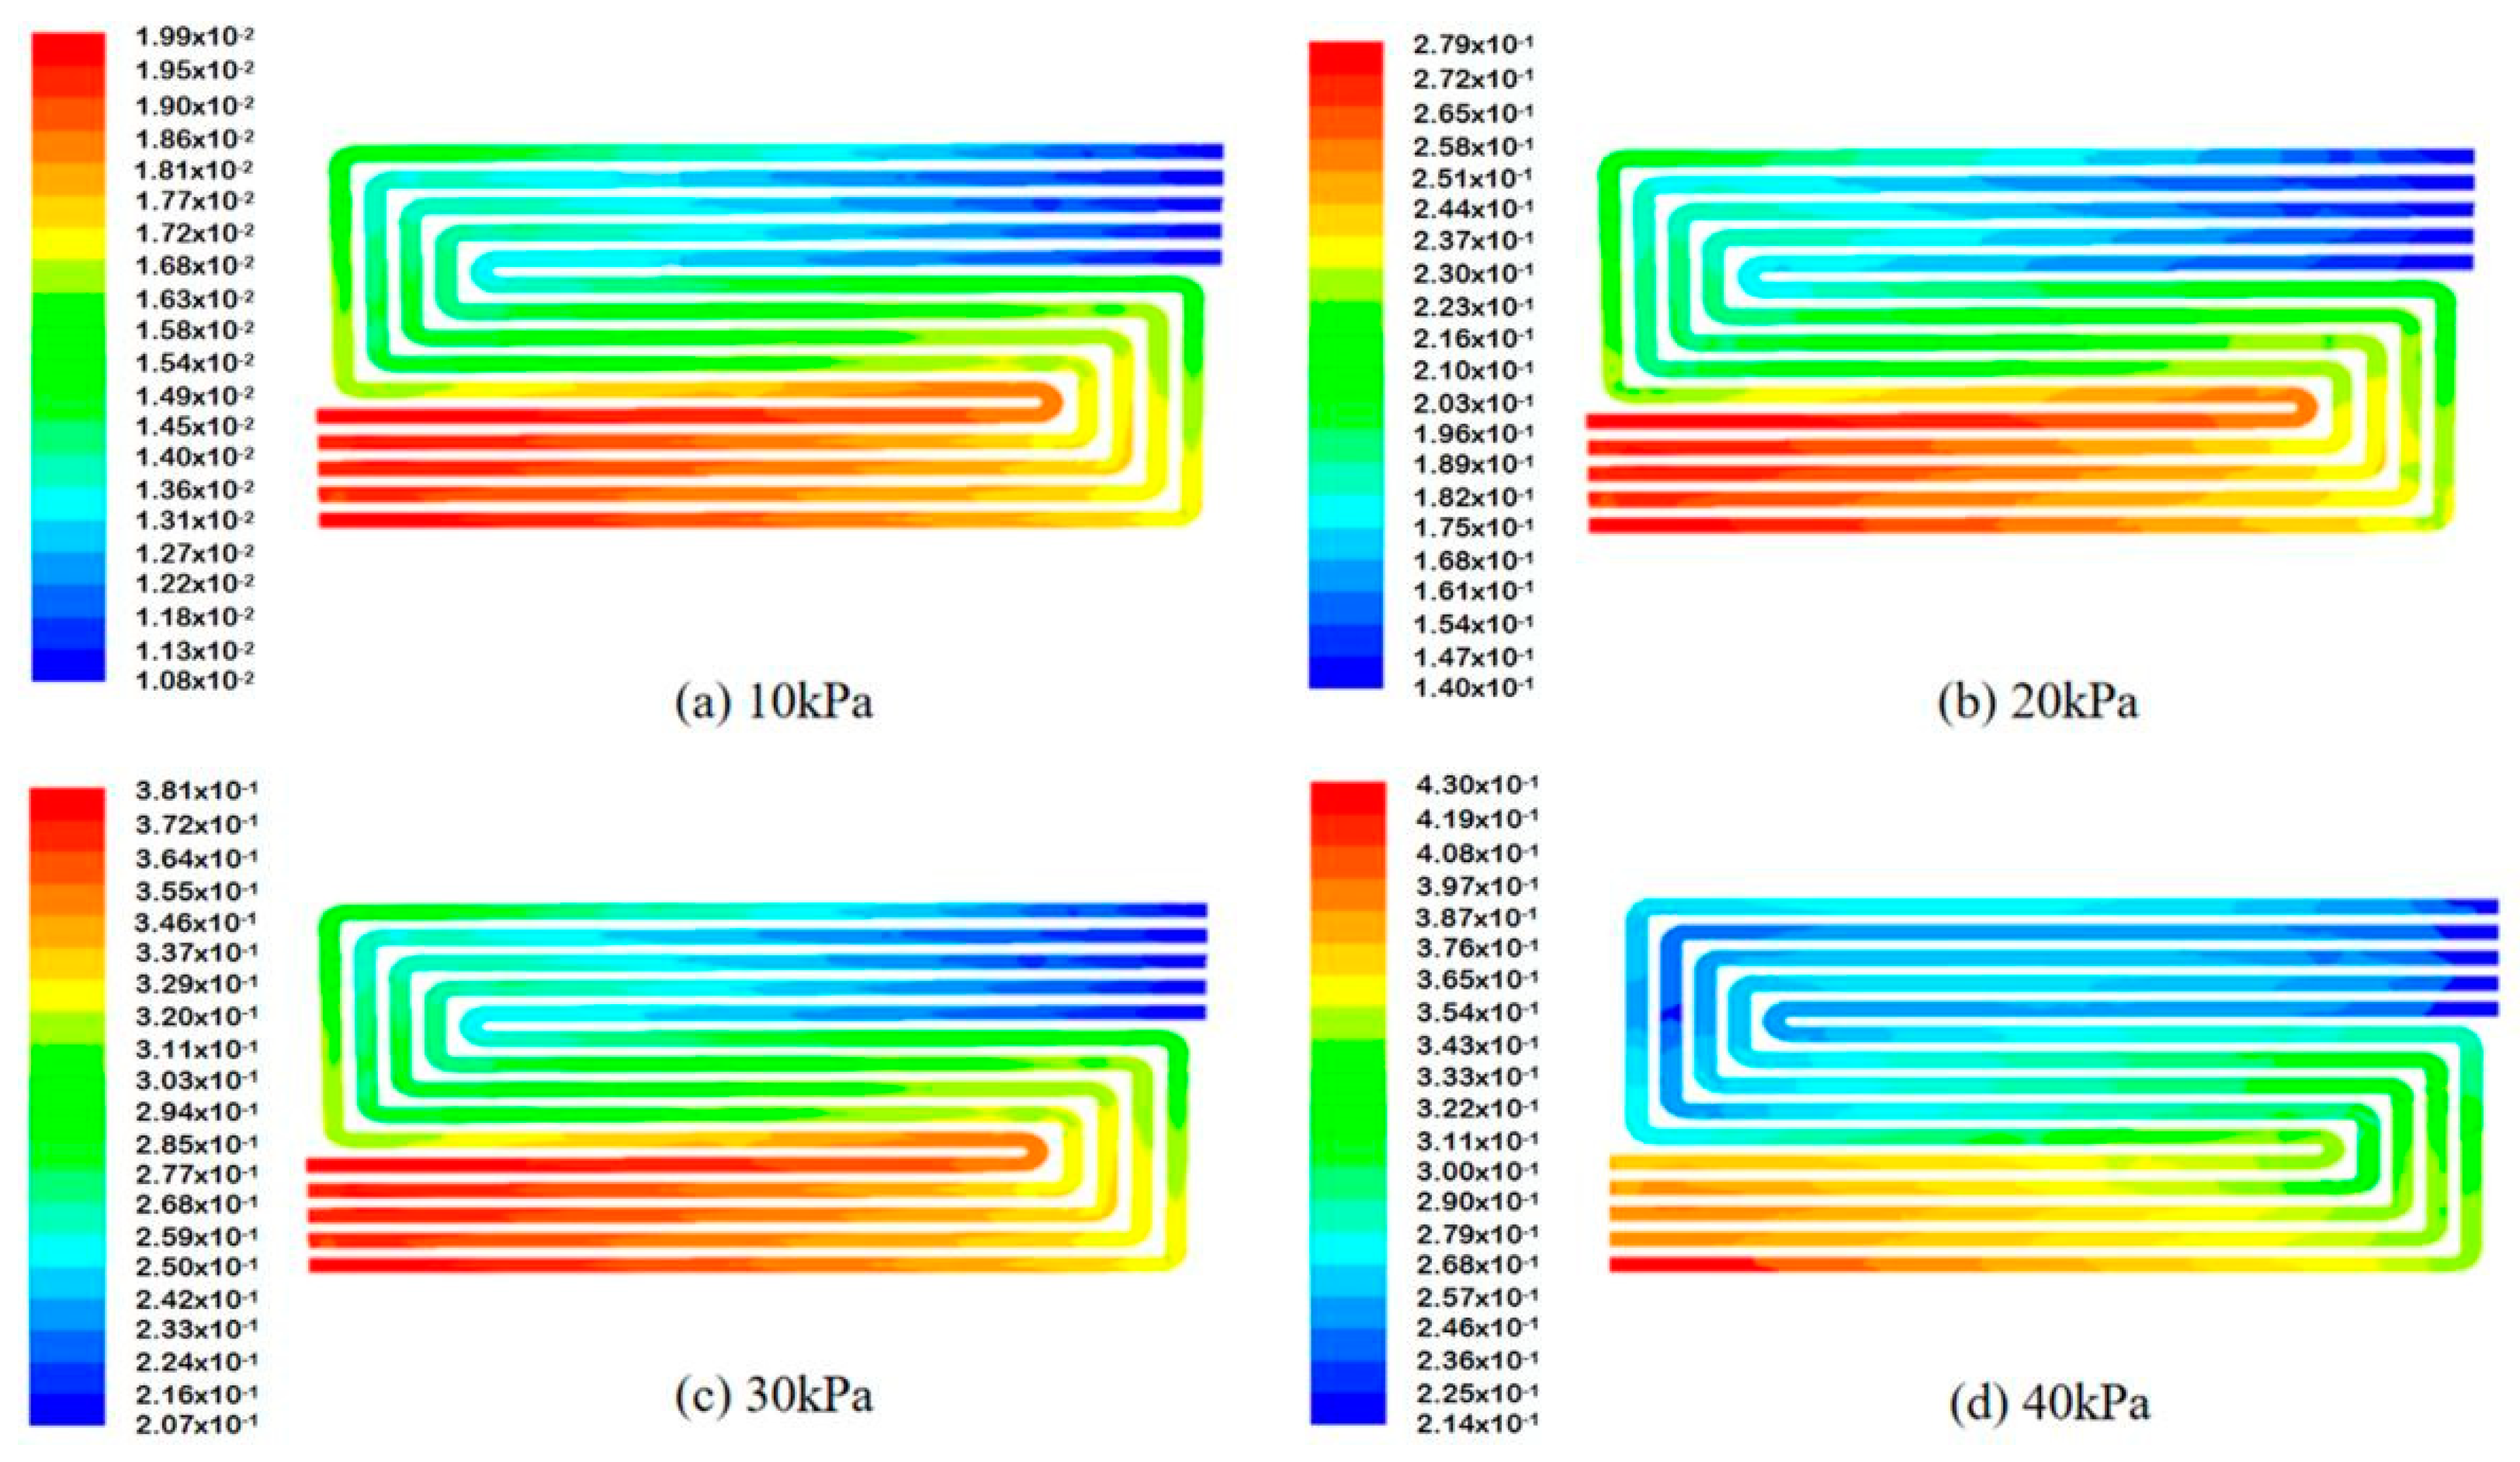
5.1. Contours of Water Content Molar Concentrations

5.1.1. Cathode Channels

The molar concentration of water content under different pressures were compared to study the influence of water content changes on the cathode channel of the PEMFC. The operating conditions were 75 °C, 100% RH, and 10 kPa, 20 kPa, 30 kPa and 40 kPa, respectively. Figure 3a–d indicate that the molar concentrations of the water content were 1.08 × 10⁻²–1.99 × 10⁻² kmol·m3, 1.40 × 10⁻¹–2.79 × 10⁻¹ kmol·m3, 2.07 × 10⁻¹–3.81 × 10⁻¹ kmol·m3 and 2.14 × 10⁻¹–4.30 × 10⁻¹ kmol·m3, respectively. The changes in the molar concentration of water content in the anode channel were 0.91 × 10⁻² kmol·m3, 1.39 × 10⁻¹ kmol·m3, 1.75 × 10⁻¹ kmol·m3 and 2.16 × 101 kmol·m3, respectively. This means that, at high inlet pressure, the variation in water content in the channel is more significant. Based on the water condensation rates equation mentioned above, the high inlet pressure may contribute to high condensation rates. Moreover, the water produced by the electrochemical reaction remains in the cathode channel. A high inlet pressure may have a positive effect on the consumption rate of hydrogen and oxygen, which may result in the formation of large amounts of water.

5.1.2. Anode Channels

In Figure 4, the molar concentration of the water content under different pressure conditions is compared to study the influence of the water content change on the anode channel of the PEMFC. The operating conditions are 75 °C, 100% RH, and 10 kPa, 20 kPa, 30 kPa and 40 kPa, respectively. Figure 4a–d indicate that the molar concentrations of water content are 1.00 × 10⁻²–1.10×10⁻² kmol·m3, 1.92 × 10⁻¹–2.09 × 10⁻¹ kmol·m3, 1.61 × 10⁻² –3.23 × 10⁻¹ kmol·m3 and 8.23 × 10⁻²–4.06 × 10⁻¹ kmol·m3. Therefore, the differences in water content molar concentration in the anode channel are 0.10 × 10⁻² kmol·m3, 0.17 × 10⁻¹ kmol·m3, 3.07 × 10⁻¹ kmol·m3, and 3.24 × 101 kmol·m3, respectively. As shown in Figure 4., changes in water content variation follow the same trend in the cathode. With the increase in inlet pressure, the pressure drop inside the PEMFC increases, which will lead to a higher condensation rate for water vapor.

5.2. Condensation Rate Curves

The condensation rates of water content in the flow channels under different pressure conditions are compared in Figure 5. The operating conditions were 75 °C, 100% relative humidity, and 10 kPa, 20 kPa, 30 kPa and 40 kPa, respectively.
The condensation rates for different inlet pressures in the cathode channel are 0.99 × 10⁶–2.89 × 10⁶ g·s1, 1.40 × 10⁶–5.56 × 10⁶ g·s1, 1.65 × 10⁶–8.55 × 10⁶ g·s1, 1.96 × 10⁶–1.10 × 10⁵ g·s1 for 10 kPa, 20 kPa, 30 kPa and 40 kPa, respectively. The condensation rates for different inlet pressures in the anode channel are 0.81 × 10⁶–2.57 × 10⁶ g·s1, 1.12 × 10⁶–5.15 × 10⁶ g·s1, 1.29 × 10⁶–8.12 × 10⁶ g·s1, 1.60 × 10⁶–9.59 × 10⁶ g·s1 for 10 kPa, 20 kPa, 30 kPa and 40 kPa, respectively. With increasing inlet pressure, the water condensation rates in the cathode and anode channels increase from the lowest values of 2.89 × 10⁶ g·s1 and 2.57 × 10⁶ g·s1 to 1.10 × 10⁵ g·s1 and 9.59 × 10⁶ g·s1, respectively.
According to the WCR model, the condensation rate is greater than the evaporation rate and is closely related to the pressure. As the intake pressure rises steeply, the pressure drop increases, increasing the condensation rate and the water content in the flow channel [15]. According to Figure 5, the condensation rate of the cathode channel is larger than that of the anode channel, and the condensation rate near the inlet reaches the maximum. At 80 mm and 175 mm from the inlet, the condensation rate rises slightly due to the shear stress generated at the inflection point of the serpentine channel, resulting in increased local friction, which reduces the gas-liquid two-phase rate and slightly increases the vapor molar fraction [41]. At the inflection point of the channel, the fluid flow is unstable, and the fluid mixing is also improved. More reactive gases are transferred to active sites of the catalysts, which makes the electrochemical reaction more intense and significantly increases the local current density. Hence, the water content and condensation rate increase with the increasing of the inlet pressure, thus enhancing the working performance.

5.3. Polarization Curves

5.3.1. Intake Pressure 10 kPa

When the inlet pressure is 10 kPa, the inlet temperature is 75 °C, and the relative inlet humidity is 100%, the polarization curve is shown in Figure 6a. The water content gradually increased along the channel direction and tended to be stable. At the stage of low current density (0–50 mA·cm2), the WCR model values and Fluent model values are close to coincidence, and the voltage decreases linearly with increasing current. In particular, the voltage of the WCR model directly drops from 1.03 V to 0.90 V, which decreases by 2.6 × 10⁻³ V (mA·cm2)1. The voltage of the Fluent model decreased from 1.03 V to 0.92 V, which was a decrease of 2.2 × 10⁻³ V (mA·cm2)1. The experimental voltage dropped from 0.99 V to 0.81 V, which decreased by 3.6 × 10⁻³ V (mA·cm2)1. Under the terms of low current density, the accuracy of the WCR model is higher than that of the Fluent model. In this case, the hydrogen crossover and internal current loss are small, and the electrochemical reaction rate and condensation rates are relatively slow [54].
The amount of water generated is meager and the water content inside the fuel cell is insufficient, which causes the membrane to dry out and the ohmic impedance to continue to increase, resulting in a drop in the voltage. Moreover, the amount of water migration is less than the anti-diffusion of water; in other words, the amount of water generated by the electrochemical reaction and humidified by the reaction gas is less than the amount of water discharged by the fuel cell, which will lead to the dehydration of the proton exchange membrane and damage to the fuel cell life and performance. When the current density increases from 50 mA·cm2 to 280 mA·cm2, the voltage linearly decreases with the increasing current. The voltage of the WCR model decreases from 0.90 V to 0.76 V, the voltage of the Fluent model decreases from 0.93 V to 0.79 V, and experimental voltage decreases from 0.81 V to 0.65 V, with average declines of 6.08 × 10⁻⁴ V (mA·cm2)1, 6.08 × 10⁻⁴ V (mA·cm2)1 and 6.95 × 10⁻⁴ V (mA·cm2)1, respectively. The accuracy of the WCR model is 21% higher than that of the Fluent model. At this point, the water generated by the humidification reaction gas and the electrochemical reaction means that the membrane is completely hydrated. In addition, the gradual increase in the condensation rate contributes to the increase in the liquid water content, and some water remains in the CL, which is conducive to enhancing the overall conductivity of the polymer and making the voltage drop slowly. When the current density is larger than 280 mA·cm2, the voltage drops slightly with increasing current. Among them, the voltage of the WCR model decreases from 0.74 V to 0.69 V, the voltage of the Fluent model decreases from 0.79 V to 0.75 V, the experiment voltage decreases from 0.65 V to 0.60 V, with average declines of 7.14 × 10⁻⁴ V (mA·cm2)1, 5.71 × 10⁻⁴ V (mA·cm2)1, and 7.141 × 10⁻⁴ V (mA·cm2)1, respectively. The reason for the slight recovery in the voltage drop is that the current density increases, and the water content of the anode side film gradually decreases, under the condition of high inlet humidity, resulting in a large amount of water being migrated to the cathode. Furthermore, the water content of the anode side decreased sharply, while the water content of the cathode side greatly increased, which resulted in a blockage of the capillary pores of the porous electrode, obstructing the transfer of oxygen, aggravating the concentration polarization and significantly decreasing the fuel cell potential. Sahraoui M. et al. [55] found that water migration and porous electrode plugging had a greater impact on the performance of fuel cells. When the current density is relatively high, the accuracy of the WCR model is approximately 18% higher than that of the Fluent model.

5.3.2. Intake Pressure 20 kPa

When the inlet pressure is 20 kPa, the inlet temperature is 75 °C, and the relative inlet humidity is 100%, the polarization curve is shown in Figure 6b. At the stage of lower current density (0–50 mA·cm2), the voltage of the WCR model decreased from 1.04 V to 0.91 V, which decreased by 1.8 × 10⁻³ V (mA·cm2)1. The experimental voltage decreased from 0.98 V to 0.80 V, a decrease of 3.6 × 10⁻³ V (mA·cm2)1. The voltage of the Fluent model decreased from 1.05 V to 0.92 V, which decreased by 2.6 × 10⁻³ V (mA·cm2)1. The curves of the WCR model are similar to those of the Fluent model when the current density is low. The reason for this is that the condensation rate of the Fluent model and WCR model is much higher than the experimental value as the pressure increases, resulting in the water content calculated by the model being relatively higher than the experimental values. The accuracy of the WCR model at this stage is 8% higher than that of the Fluent model. When the current density gradually increased to 260 mA·cm2, the voltage of the WCR model decreased from 0.91 V to 0.72 V, the voltage of the Fluent model decreased from 0.92 V to 0.78 V, and the experimental voltage decreased from 0.80 V to 0.66 V, with average declines of 9.04 × 10⁻⁴ V (mA·cm2)1, 6.67 × 10⁻⁴ V (mA·cm2)1 and 6.67 × 10⁻⁴ V (mA·cm2)1, respectively. As the current density increases, the reason that the WCR model is closer to the experimental value is that the proton exchange membrane gradually completely hydrates, and some liquid water in the local area will evaporate and spread. While the condensation rate value of the WCR model takes the proportion of evaporation and condensation into consideration, and combines evaporation and condensation for calculation, so the error is relatively small. When the current density is greater than 260 mA·cm2, the voltage drop gradually decreases, respectively. Comparatively, the accuracy of the WCR model is approximately 20% higher than that of the Fluent model.

5.3.3. Intake Pressure 30 kPa

When the inlet pressure is 30 kPa, the relative inlet humidity is 100%, and the inlet temperature is 75 °C, the polarization curve is shown in Figure 6c. When the current density was between 0 and 50 mA·cm2, the experimental voltage decreased from 0.99 V to 0.87 V, and the decrease in the value was 2.4 × 10⁻³ V (mA·cm2)1. The voltage of the WCR model decreased from 1.03 V to 0.92 V, which was a decrease of 2.2 × 10⁻³ V (mA·cm2)1. The voltage of the Fluent model decreased from 1.05 V to 0.94 V, a decrease of 2.2 × 10⁻³ V (mA·cm2)1. The difference between the WCR model and Fluent model is very small when the current density is lower. Therefore, the experimental value is low, while the simulation value of the WCR model and the Fluent model is relatively high. When the current density is less than 260 mA·cm2, the experimental voltage decreases from 0.87 V to 0.71 V, the voltage of the Fluent model decreases from 0.92 V to 0.81 V, the voltage of the WCR model decreased from 0.91 V to 0.76 V, and the average declines are 7.62 × 10⁻⁴ V (mA·cm2)1, 5.24 × 10⁻⁴ V (mA·cm2)1 and 7.14 × 10⁻⁴ mV (mA·cm2)1. As the current density gradually increases, the accuracy of the WCR model is approximately 31% higher than that of the Fluent model at high current densities. According to the WCR model, the evaporation and condensation ratios under different pressures constantly change, and the effect of the water content changes on the PEMFC is also variable, while the water content calculated by the FLUENT model is single. The influence of the water content on the PEMFC increases as the current density increases, so the WCR model is closer to the experimental value. Additionally, the variation trend of the power density uncovers the phenomenon that the power density is linearly related to the current density [56]. When the current density is above 260 mA·cm2, the voltage drop gradually decreases, the experimental voltage decreases from 0.71 V to 0.62 V, the voltage of the Fluent model decreases from 0.81 V to 0.73 V, and the voltage of the WCR model decreased from 0.76 V to 0.68 V, and the average declines are 6.42 × 10⁻⁴ V (mA·cm2)1, 5.71 × 10⁻⁴ V (mA·cm2)1 and 5.71 × 10⁻⁴ V (mA·cm2)1. Comparatively, the accuracy of the WCR model is approximately 22% higher than that of the Fluent model.

5.3.4. Intake Pressure 40 kPa

When the inlet pressure is 40 kPa, the relative inlet humidity is 100%, and the inlet temperature is 75 °C, the polarization curve is shown in Figure 6d. The experimental voltage decreased from 1.00 V to 0.90 V, and the decrease in the value is 2.0 × 10⁻³ V (mA·cm2)1 when the current density is no more than 50 mA·cm2. The voltage of the WCR model decreased from 1.04 V to 0.94 V, which was a decrease of 2.0 × 10⁻³ V (mA·cm2)1. The voltage of the Fluent model decreased from 1.06 V to 0.98 V, which decreased by 1.6 × 10⁻³ V (mA·cm2)1. When the current density is relatively small, the accuracy of the WCR model is higher than that of the Fluent model. When the current density is between 50 and 260 mA·cm2, the experimental voltage decreased from 0.90 V to 0.74 V, the voltage of the WCR model decreased from 0.94 V to 0.83 V, and the voltage of the Fluent model decreased from 0.98 V to 0.84 V, with average declines of 7.61 × 10⁻⁴ V (mA·cm2)1, 5.24 × 10⁻⁴ V (mA·cm2)1 and 6.67 × 10⁻⁴ V (mA·cm2)1, respectively. As the voltage drop of a PEMFC is mainly affected by the internal resistance of the PEMFC, the internal resistance of the PEM is related to the liquid water content of the PEMFC [57]. The water in the PEMFC mainly consists of the water carried by the intake gas and generated by the electrochemical reaction, among which the phase transition is one of the main factors for the change in water content. At this stage (0–50 mA·cm2), the moisture content of the inlet gas has a great influence on the performance of the PEMFC. With the increase in current density, the electrochemical reaction inside the PEMFC gradually increases, which causes the temperature and pressure inside the fuel cell to rise, so the amount of liquid water generated by the electrochemical reaction increases. When the current density is between 50 and 260 mA·cm2, the electrochemical reaction and phase transition inside the PEMFC play a dominant role in the influence of the PEMFC.
According to the WCR model, the ratio of evaporation and condensation is constantly changing under different pressures, thus affecting the rate of water content change, while the Fluent model only calculates the change in a single direction of evaporation or condensation. The change in water content in the flow channel is more significant due to the increase in current density, and the difference between the WCR model and Fluent model increases. When the current density is above 260 mA·cm2, the voltage drop gradually decreases, the experimental voltage decreases from 0.74 V to 0.65 V, the voltage of the WCR model decreases from 0.81 V to 0.70 V, the voltage of the Fluent model decreases from 0.83 V to 0.75 V, and the average declines are 6.42 × 10⁻⁴ V (mA·cm2)1, 7.85 × 10⁻⁴ V (mA·cm2)1 and 5.71 × 10⁻⁴ V (mA·cm2)1. Comparatively, the accuracy of the WCR model is approximately 20% higher than that of the Fluent model. The variation trend of the power density shows that the power density and current density are approximately linear.

6. Conclusions

The WCR model was established to study the variation in the water content by combining the condensation rate and evaporation rate, and the water transfer processes in the GDL and CL were simulated. The experimental values, Fluent values, and WCR model values under different experimental conditions were compared and analyzed, and the software simulation accuracy was improved. The WCR model has a guiding significance for the optimal design of water management under different current densities, and can effectively avoid the problem of water flooding or dehydration in fuel cells. More concretely:
(1) Under the condition of 100% relative humidity, when the inlet pressure increases, the condensation rate and water content inside the fuel cell increase, and the pressure difference between the two sides of the membrane increases, which speeds up the transfer rate of protons on the membrane, increasing the electromotive force output by the fuel cells.
(2) The pressure drop changes gradually increase along the flow channel, the condensation rate decreases, and the evaporation rate increases, so the water content changes tend to be stable. Furthermore, the condensation rate value of the cathode channel is from 1.05 to 1.55 larger than that of the anode channel. A high condensation rate is one of the crucial factors leading to the phenomenon of cathode flooding.
(3) When the inlet temperature is 75 °C, the inlet relative humidity is 100%, the inlet pressure is 10 kPa, and the current density is 260 mA·cm2, the accuracy of the WCR model is approximately 21% higher than the Fluent model compared with the experimental values. When the inlet pressure is 30 kPa, the WCR model is approximately 31% higher than the Fluent model at high current densities.

Author Contributions

L.Z. and P.P. proposed innovative points on the analysis of the variation characteristics of the water content in the flow channel of the PEMFC. L.Z. performed the calculations and paper writing. L.Z. and Y.L. performed the funding acquisition. L.Z., L.W. and X.L. performed the investigation and experimental validation. L.W. and Y.W. performed the review and editing of the paper. All authors have read and agreed to the published version of the manuscript.

Funding

This work was supported by the State Key Laboratory of Automotive Safety and Energy under Project [No. KFY2218]; Beijing Postdoctoral Research Foundation [No. 21009920007]; Fundamental Research Funds for the Beijing Universities [No. X21057].

Institutional Review Board Statement

Not applicable.

Informed Consent Statement

Not applicable.

Conflicts of Interest

The authors declare that they have no known competing financial interests or personal relationships that could have appeared to influence the work reported in this paper.

Symbols

R H 2 O ( g ) , c o n d Water condensation rate (g·s−1)
R H 2 O ( l ) , e v a p Water evaporation rate (g·s−1)
R H 2 O ( v ) i n Inlet water flow rate (g·s−1)
r H 2 O , c o n d Volumetric water condensation rate in a local position (g·s−1·m−3)
r H 2 O , e v a p Volumetric water evaporation rate in a local position (g·s−1·m−3)
PFluid pressure in the flow channel (kPa)
PsatSaturated vapor pressure (kPa)
pwvLocal pressure at a point in the flow channel (kPa)
psatSaturated vapor pressure at a point in the flow channel (kPa)
p H 2 Inlet pressure of hydrogen (kPa)
p sat ,   H 2 Saturation pressure of hydrogen (kPa)
p O 2 Inlet pressure for oxygen (kPa)
p sat ,   O 2 Saturation pressure for oxygen (kPa)
pcCapillary pressure (kPa)
Δ p f , a n Pressure drop in the anode (kPa)
Δ p f , c a t Pressure drop in the cathode (kPa)
xwMass fraction of water
xsatThe maximum mass fraction of water vapor in dry gas
x H 2 O ( g ) The fraction of water vapor in dry gas
ywMole fraction of water vapor
M H 2 O Molar mass of water (g·mol−1)
M g a s Molar mass of gas (g·mol−1)
D Diffusion coefficient of water vapor through the gas (m2·s−1)
R Universal gas constant (8.314 J·mol−1·K−1)
TWorking temperature (K)
AfgPhase-change surface area per unit volume (m−1)
ITotal current (A)
i s Current density in the catalyst (A·cm−2)
CdDepth of flow channels (m)
CwWidth of flow channels (m)
LLength of flow channels (m)
nNumber of flow channels
ACross-sectional area of a channel (m2)
AinCross sectional area of inlet pipe (m2)
DhHydraulic diameter of a channel (m)
hpcCondensation parameter
crRate constant (s−1)
sLiquid water saturation
cpHeat capacity (J·g−1·K−1)
κ Thermal conductivity of humid gas (W·m−1·K−1)
vdKinematic viscosity of dry gas (m2·s−1)
vhKinematic viscosity of humid gas (m2·s−1)
qSwitching function
KPermeability of the gas diffusion layer or the catalyst layer (m2)
υ Velocity vector (m·s1)
SmMomentum source term
VlLiquid phase rate (m·s1)
κ s e f f Effective electric conductivity of the GDL (S·cm1)

Greek Letters

μeffAverage viscosity (kg·m−1·s−1)
Ψ Evaporation coefficient (g·m−2·s−1)
α Heat transfer coefficient (W·m2·K−1)
ρDensity of humid air (g·m−3)
ρlDensity of liquid water (g·m−3)
λ H 2 Hydrogen excess coefficient
λO2Oxygen excess coefficient
ξLocal loss coefficient
μlViscosity (kg·m−1·s−1)
εPorosity
Φ Potential (V)

Abbreviations

PEMFCProton exchange membrane fuel cell
WCRWater condensation rate
GDLGas diffusion layers
CLCatalyst layer

Superscripts and Subscripts

H2OWater
H2Hydrogen
O2Oxygen
condCondensation
evapEvaporation
inInlet
satSaturation
anAnode
catCathode
gGas
lLiquid

References

  1. Ren, P.; Pei, P.; Chen, D.; Li, Y.; Wu, Z.; Zhang, L.; Li, Z.; Wang, M.; Wang, H.; Wang, B.; et al. Novel analytic method of membrane electrode assembly parameters for fuel cell consistency evaluation by micro-current excitation. Appl. Energy 2021, 306, 118068. [Google Scholar] [CrossRef]
  2. Liu, Q.; Lan, F.; Chen, J.; Zeng, C.; Wang, J. A review of proton exchange membrane fuel cell water management: Membrane electrode assembly. J. Power Sources 2021, 517, 230723. [Google Scholar] [CrossRef]
  3. Li, Y.; Pei, P.; Wu, Z.; Ren, P.; Jia, X.; Chen, D.; Huang, S. Approaches to avoid flooding in association with pressure drop in proton exchange membrane fuel cells. Appl. Energy 2018, 224, 42–51. [Google Scholar] [CrossRef]
  4. Fathy, A.; Rezk, H.; Nassef, A.M. Robust hydrogen-consumption-minimization strategy based salp swarm algorithm for energy management of fuel cell/supercapacitor/batteries in highly fluctuated load condition. Renew. Energy 2019, 139, 147–160. [Google Scholar] [CrossRef]
  5. Liu, Y.; Bai, S.; Wei, P.; Pei, P.; Yao, S.; Sun, H. Numerical and experimental investigation of the asymmetric humidification and dynamic temperature in proton exchange membrane fuel cell. Fuel Cells 2020, 20, 48–59. [Google Scholar] [CrossRef]
  6. Ren, P.; Pei, P.; Chen, D.; Li, Y.; Wang, H.; Fu, X.; Zhang, L.; Wang, M.; Song, X. Micro-current excitation for efficient diagnosis of membrane electrode assemblies in fuel cell stacks: Error analysis and method optimization. Energy Convers. Manag. 2022, 258, 115489. [Google Scholar] [CrossRef]
  7. Ren, P.; Pei, P.; Li, Y.; Wu, Z.; Chen, D.; Huang, S. Degradation mechanisms of proton exchange membrane fuel cell under typical automotive operating conditions. Prog. Energy Combust. Sci. 2020, 80, 100859. [Google Scholar] [CrossRef]
  8. Wu, F.; Maier, J.; Yu, Y. Guidelines and trends for next-generation rechargeable lithium and lithium-ion batteries. Chem. Soc. Rev. 2020, 49, 1569–1614. [Google Scholar] [CrossRef] [PubMed]
  9. Zhang, H.; Sun, C. Cost-effective iron-based aqueous redox flow batteries for large-scale energy storage application: A review. J. Power Sources 2021, 493, 229445. [Google Scholar] [CrossRef]
  10. Jayakumar, A.; Sethu, S.P.; Ramos, M.V.; Robertson, J.; Al-Jumaily, A. A technical review on gas diffusion, mechanism and medium of PEM fuel cell. Ionics 2015, 21, 1–18. [Google Scholar] [CrossRef]
  11. Jiao, K.; Li, X. Water transport in polymer electrolyte membrane fuel cells. Prog. Energy Combust. Sci. 2011, 37, 221–291. [Google Scholar] [CrossRef]
  12. Sun, C.; Negro, E.; Nale, A.; Pagot, G.; Vezzù, K.; Zawodzinski, T.A.; Meda, L.; Gambaro, C.; Di Noto, V. An efficient barrier toward vanadium crossover in redox flow batteries: The bilayer [Nafion/(WO3)x] hybrid inorganic-organic membrane. Electrochim. Acta 2021, 378, 138133. [Google Scholar] [CrossRef]
  13. Tardy, E.; Courtois, F.; Chandesris, M.; Poirot-Crouvezier, J.-P.; Morin, A.; Bultel, Y. Investigation of liquid water heterogeneities in large area PEM fuel cells using a pseudo-3D multiphysics model. Int. J. Heat Mass Transf. 2019, 145, 118720. [Google Scholar] [CrossRef]
  14. Afshari, E.; Ziaei-Rad, M.; Shariati, Z. A study on using metal foam as coolant fluid distributor in the polymer electrolyte membrane fuel cell. Int. J. Hydrogen Energy 2016, 41, 1902–1912. [Google Scholar] [CrossRef]
  15. Kim, J.; Luo, G.; Wang, C.-Y. Modeling liquid water re-distributions in bi-porous layer flow-fields of proton exchange membrane fuel cells. J. Power Sources 2018, 400, 284–295. [Google Scholar] [CrossRef]
  16. Abdollahzadeh, M.; Ribeirinha, P.; Boaventura, M.; Mendes, A. Three-dimensional modeling of PEMFC with contaminated anode fuel. Energy 2018, 152, 939–959. [Google Scholar] [CrossRef]
  17. Passalacqua, E.; Squadrito, G.; Lufrano, F.; Patti, A.; Giorgi, L. Effects of the diffusion layer characteristics on the performance of polymer electrolyte fuel cell electrodes. J. Appl. Electrochem. 2001, 31, 449–454. [Google Scholar] [CrossRef]
  18. Malhotra, S.; Ghosh, S. Effects of channel diameter on flow pattern and pressure drop for air–water flow in serpentine gas channels of PEM fuel cell-An Ex situ experiment. Exp. Therm. Fluid Sci. 2019, 100, 233–250. [Google Scholar] [CrossRef]
  19. Noguer, N.; Candusso, D.; Kouta, R.; Harel, F.; Charon, W.; Coquery, G. A PEMFC multi-physical model to evaluate the consequences of parameter uncertainty on the fuel cell performance. Int. J. Hydrogen Energy 2015, 40, 3968–3980. [Google Scholar] [CrossRef]
  20. Chen, H.; Liu, B.; Zhang, T.; Pei, P. Influencing sensitivities of critical operating parameters on PEMFC output performance and gas distribution quality under different electrical load conditions. Appl. Energy 2019, 255, 113849. [Google Scholar] [CrossRef]
  21. Li, Y.; Pei, P.; Wu, Z.; Xu, H.; Chen, D.; Huang, S. Novel approach to determine cathode two-phase-flow pressure drop of proton exchange membrane fuel cell and its application on water management. Appl. Energy 2017, 190, 713–724. [Google Scholar] [CrossRef]
  22. Shen, J.; Zeng, L.; Liu, Z.; Liu, W. Performance investigation of PEMFC with rectangle blockages in Gas Channel based on field synergy principle. Heat Mass Transf. 2018, 55, 811–822. [Google Scholar] [CrossRef]
  23. Zhang, G.; Jiao, K. Three-dimensional multi-phase simulation of PEMFC at high current density utilizing Eulerian-Eulerian model and two-fluid model. Energy Convers. Manag. 2018, 176, 409–421. [Google Scholar] [CrossRef]
  24. Han, C.; Chen, Z. Numerical simulation for the effect of vaporization intensity in membrane on the performance of PEM fuel cell. Numer. Heat Transf. Part A Appl. 2018, 73, 177–194. [Google Scholar] [CrossRef]
  25. Lei, H.; Huang, H.; Li, C.; Pan, M.; Guo, X.; Chen, Y.; Liu, M.; Wang, T. Numerical simulation of water droplet transport characteristics in cathode channel of proton exchange membrane fuel cell with tapered slope structures. Int. J. Hydrogen Energy 2020, 45, 29331–29344. [Google Scholar] [CrossRef]
  26. Falagüerra, T.; Muñoz, P.; Correa, G. Analysis of the cathode side of a PEMFC varying design parameters to optimize current distribution and power density. J. Electroanal. Chem. 2021, 880, 114820. [Google Scholar] [CrossRef]
  27. Lim, I.S.; Park, J.Y.; Kang, D.G.; Choi, S.H.; Kang, B.; Kim, M.S. Numerical study for in-plane gradient effects of cathode gas diffusion layer on PEMFC under low humidity condition. Int. J. Hydrogen Energy 2020, 45, 19745–19760. [Google Scholar] [CrossRef]
  28. Bao, Y.; Gan, Y. Roughness effects of gas diffusion layers on droplet dynamics in PEMFC flow channels. Int. J. Hydrogen Energy 2020, 45, 17869–17881. [Google Scholar] [CrossRef]
  29. Xie, X.; Yin, B.; Xu, S.; Jia, H.; Dong, F.; Chen, X. Effects of microstructure shape parameters on water removal in a PEMFC lotus-like flow channel. Int. J. Hydrogen Energy 2020, 47, 3473–3483. [Google Scholar] [CrossRef]
  30. Sun, Y.; Bao, C.; Jiang, Z.; Zhang, X.; Gao, T. A two-dimensional numerical study of liquid water breakthrough in gas diffusion layer based on phase field method. J. Power Sources 2020, 448, 227352. [Google Scholar] [CrossRef]
  31. Hu, Z.; Xu, L.; Li, J.; Hu, J.; Xu, X.; Du, X.; Sun, W.; Ouyang, M. A cell interaction phenomenon in a multi-cell stack under one cell suffering fuel starvation. Energy Convers. Manag. 2018, 174, 465–474. [Google Scholar] [CrossRef]
  32. Bodner, M.; Schenk, A.; Salaberger, D.; Rami, M.; Hochenauer, C.; Hacker, V. Air starvation induced degradation in polymer electrolyte fuel cells. Fuel Cells 2017, 17, 18–26. [Google Scholar] [CrossRef] [Green Version]
  33. Chen, H.; Zhao, X.; Zhang, T.; Pei, P. The reactant starvation of the proton exchange membrane fuel cells for vehicular applications: A review. Energy Convers. Manag. 2019, 182, 282–298. [Google Scholar] [CrossRef]
  34. Hu, J.; Xu, L.; Li, J.; Fang, C.; Cheng, S.; Ouyang, M.; Hong, P. Model-based estimation of liquid saturation in cathode gas diffusion layer and current density difference under proton exchange membrane fuel cell flooding. Int. J. Hydrogen Energy 2015, 40, 14187–14201. [Google Scholar] [CrossRef]
  35. Xia, L.; Zhang, C.; Hu, M.; Jiang, S.; Chin, C.S.; Gao, Z.; Liao, Q. Investigation of parameter effects on the performance of high-temperature PEM fuel cell. Int. J. Hydrogen Energy 2018, 43, 23441–23449. [Google Scholar] [CrossRef]
  36. Zhang, G.; Fan, L.; Sun, J.; Jiao, K. A 3D model of PEMFC considering detailed multiphase flow and anisotropic transport properties. Int. J. Heat Mass Transf. 2017, 115, 714–724. [Google Scholar] [CrossRef]
  37. Min, C.; He, J.; Wang, K.; Xie, L.; Yang, X. A comprehensive analysis of secondary flow effects on the performance of PEMFCs with modified serpentine flow fields. Energy Convers. Manag. 2019, 180, 1217–1224. [Google Scholar] [CrossRef]
  38. Houreh, N.B.; Shokouhmand, H.; Afshari, E. Effect of inserting obstacles in flow field on a membrane humidifier performance for PEMFC application: A CFD model. Int. J. Hydrogen Energy 2019, 44, 30420–30439. [Google Scholar] [CrossRef]
  39. Afra, M.; Nazari, M.; Kayhani, M.H.; Sharifpur, M.; Meyer, J. 3D experimental visualization of water flooding in proton exchange membrane fuel cells. Energy 2019, 175, 967–977. [Google Scholar] [CrossRef]
  40. Mammar, K.; Saadaoui, F.; Laribi, S. Design of a PEM fuel cell model for flooding and drying diagnosis using fuzzy logic clustering. Renew. Energy Focus 2019, 30, 123–130. [Google Scholar] [CrossRef]
  41. Zhang, T.; Wang, P.; Chen, H.; Pei, P. A review of automotive proton exchange membrane fuel cell degradation under start-stop operating condition. Appl. Energy 2018, 223, 249–262. [Google Scholar] [CrossRef]
  42. Chen, B.; Wang, J.; Yang, T.; Cai, Y.; Zhang, C.; Chan, S.H.; Yu, Y.; Tu, Z. Carbon corrosion and performance degradation mechanism in a proton exchange membrane fuel cell with dead-ended anode and cathode. Energy 2016, 106, 54–62. [Google Scholar] [CrossRef]
  43. Wang, B.; Wu, K.; Xi, F.; Xuan, J.; Xie, X.; Wang, X.; Jiao, K. Numerical analysis of operating conditions effects on PEMFC with anode recirculation. Energy 2019, 173, 844–856. [Google Scholar] [CrossRef]
  44. Yang, Z.; Du, Q.; Jia, Z.; Yang, C.; Jiao, K. Effects of operating conditions on water and heat management by a transient multi-dimensional PEMFC system model. Energy 2019, 183, 462–476. [Google Scholar] [CrossRef]
  45. Xu, Y.; Qiu, D.; Yi, P.; Lan, S.; Peng, L. An integrated model of the water transport in nonuniform compressed gas diffusion layers for PEMFC. Int. J. Hydrogen Energy 2019, 44, 13777–13785. [Google Scholar] [CrossRef]
  46. Ijaodola, O.; Hassan, Z.E.-; Ogungbemi, E.; Khatib, F.; Wilberforce, T.; Thompson, J.; Olabi, A. Energy efficiency improvements by investigating the water flooding management on proton exchange membrane fuel cell (PEMFC). Energy 2019, 179, 246–267. [Google Scholar] [CrossRef]
  47. Barbir, F. PEM Fuel Cells: Theory and Practice; Elsevier Academic Press: Cambridge, MA, USA, 2012. [Google Scholar]
  48. Wu, H.; Li, X.; Berg, P. On the modeling of water transport in polymer electrolyte membrane fuel cells. Electrochim. Acta 2009, 54, 6913–6927. [Google Scholar] [CrossRef]
  49. Meng, H. A two-phase non-isothermal mixed-domain PEM fuel cell model and its application to two-dimensional simulations. J. Power Sources 2007, 168, 218–228. [Google Scholar] [CrossRef]
  50. Lu, J.B.; Wei, G.H.; Zhu, F.J.; Yan, X.H.; Zhang, J.L. Pressure effect on the PEMFC performance. Fuel Cells 2019, 19, 211–220. [Google Scholar] [CrossRef]
  51. Bosnjakovic, F.; Perry, L.B. Technical Thermodynamics; Holt, Rinehart & Winston: New York, NY, USA, 1965. [Google Scholar]
  52. Pei, P.; Ouyang, M.; Feng, W.; Lu, L.; Huang, H.; Zhang, J. Hydrogen pressure drop characteristics in a fuel cell stack. Int. J. Hydrogen Energy. 2006, 31, 371–377. [Google Scholar] [CrossRef]
  53. Ye, Q.; Van Nguyen, T. Three-dimensional simulation of liquid water distribution in a PEMFC with experimentally measured capillary functions. J. Electrochem. Soc. 2007, 154, B1242–B1251. [Google Scholar] [CrossRef]
  54. Han, J.; Yu, S.; Yi, S. Adaptive control for robust air flow management in an automotive fuel cell system. Appl. Energy 2017, 190, 73–83. [Google Scholar] [CrossRef]
  55. Sahraoui, M.; Kharrat, C.; Halouani, K. Two-dimensional modeling of electrochemical and transport phenomena in the porous structures of a PEMFC. Int. J. Hydrogen Energy 2009, 34, 3091–3103. [Google Scholar] [CrossRef]
  56. Falcão, D.S.; Rangel, C.M.; Pinho, C.; Pinto, A.M.F.R. Water transport through a Proton-Exchange Membrane (PEM) fuel cell operating near ambient conditions: Experimental and modeling studies. Energy Fuels 2008, 23, 397–402. [Google Scholar] [CrossRef]
  57. Liu, Y.; Fan, L.; Pei, P.; Yao, S.; Wang, F. Asymptotic analysis for the inlet relative humidity effects on the performance of proton exchange membrane fuel cell. Appl. Energy 2018, 213, 573–584. [Google Scholar] [CrossRef]
Figure 1. Meshes employed in this model.
Energies 15 03280 g001
Figure 2. Experimental setup: 1—hydrogen cylinder, 2—pressure reducing valve, 3—pressure regulating valve, 4—pressure sensor, 5—temperature sensor, 6—hydrogen flow meter, 7—proportional valve, 8—differential pressure sensor, 9—electronic load, 10—AC impedance tester, 11—nitrogen cylinder, 12—humidifier, 13—radiator, 14—de-ionized water tank, 15—water pump, 16—hydrogen concentration sensor, 17—solenoid valve, 18—safety alarm device, 19—electromagnetic exhaust valve, 20—hydrogen recovery device, 21—safety alarm device, 22—electromagnetic exhaust valve, 23—air pump, 24—electromagnetic exhaust valve, 25—pressure reducing valve, 26—pressure sensor, 27—temperature sensor, 28—oxygen flow meter, 29—proportional valve, 30—humidifier, 31—differential pressure sensor.
Energies 15 03280 g002
Figure 3. Water content in the cathode channel under different inlet pressures: (a) 10 kPa, (b) 20 kPa, (c) 30 kPa, (d) 40 kPa.
Energies 15 03280 g003
Figure 4. Water content in the anode channel under different inlet pressures: (a) 10 kPa, (b) 20 kPa, (c) 30 kPa, (d) 40 kPa.
Energies 15 03280 g004
Figure 5. Condensation rate curves in the flow channels under different inlet pressures: (a) 10 kPa, (b) 20 kPa, (c) 30 kPa, (d) 40 kPa.
Energies 15 03280 g005
Figure 6. Polarization curves at different inlet pressures: (a) 10 kPa, (b) 20 kPa, (c) 30 kPa, (d) 40 kPa.
Energies 15 03280 g006
Table 1. Cell properties of the fuel cell model.
StructureValueUnits
Active area 1.68 × 10 4 m 2
Channel length 2.50 × 10 2 m
Channel width 1.20 × 10 4 m
Channel depth of the anode 0.60 × 10 4 m
Channel depth of the cathode 0.80 × 10 4 m
Channel number5.00--
Thickness of proton exchange membrane 1.50 × 10 5 m
Thickness of gas diffusion layer 2.30 × 10 4 m
Thickness of catalytic layer 1.50 × 10 5 m
Table 2. Fluid region and boundary.
NameRegionType
collector-aSOLID1 interface/other wall
collector-cSOLID1 interface/other wall
diff-a FLUIDFLUID1 interface/other wall
diff-c FLUIDFLUID1 interface/other wall
cata-a FLUIDFLUID1 interface/other wall
cata-c FLUIDFLUID1 interface/other wall
mem FLUIDFLUID1 interface/other wall
ch-a FLUIDFLUID1 mass-flow inlets/1 pressure-outlet
ch-c FLUIDFLUID1 mass-flow inlets/1 pressure-outlet
Table 3. Detailed model parameters and operating conditions.
ParameterValueUnits
Thermal conductivity of the catalyst layer1.5W·(m·K)−1
Thermal conductivity of the current collector20W·(m·K)−1
Electrical conductivity of the gas diffusion layer2500S·m−1
Electrical conductivity of the catalyst layer2500S·m−1
Electrical conductivity of the current collector20,000S·m−1
Porosity of the gas diffusion layer0.5--
Porosity of the catalyst layer0.28--
Membrane equivalent weight1100kg·kmol−1
Hydrogen reference exchange current density4000A·m−2
Anode reference concentration1kmol·m−3
Anode transfer coefficient0.5--
Oxygen reference exchange current density5.75A·m−2
Cathode reference concentration1kmol·m−3
Cathode transfer coefficient0.5--
Open circuit voltage0.95V
Leakage current0A
Electrochemical equivalent of hydrogen1.05 × 10−8kg·(A·s)−1
Electrochemical equivalent of oxygen8.29 × 10−8kg·(A·s)−1
Reference diffusivity of hydrogen9.15 × 10−5m2·s−1
Reference diffusivity of oxygen2.2 × 10−5m2·s−1
Reference diffusivity of water2.56 × 10−5m2·s−1
Anode catalyst layer surface/volume ratio2 × 106m−1
Cathode catalyst layer surface/volume ratio1 × 107m−1
Operating temperature75°C
Operating pressure10, 20, 30, 40kPa
Anode inlet gas flow rate7L·min1
Cathode inlet gas flow rate15L·min−1
Anode relative humidity100%
Cathode relative humidity100%
Table 4. Parameters of the single fuel cell.
ParameterFuel Cell
Area of membrane (cm2)168
Flow fieldMulti-serpentines
MembraneNafionTM117
GDLToray 200 um
Cat. loading0.1/0.4 mg·cm2
Material of bipolar plateMetal
Publisher’s Note: MDPI stays neutral with regard to jurisdictional claims in published maps and institutional affiliations.

