
Understanding Energy Behavioral Changes Due to COVID-19 in the Residents of Dubai Using Electricity Consumption Data and Their Impacts
 , , ,
, , ,
Abstract
: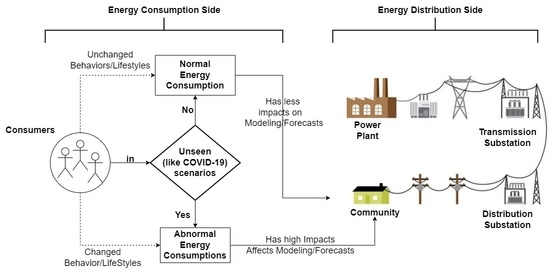
1. Introduction
2. Background
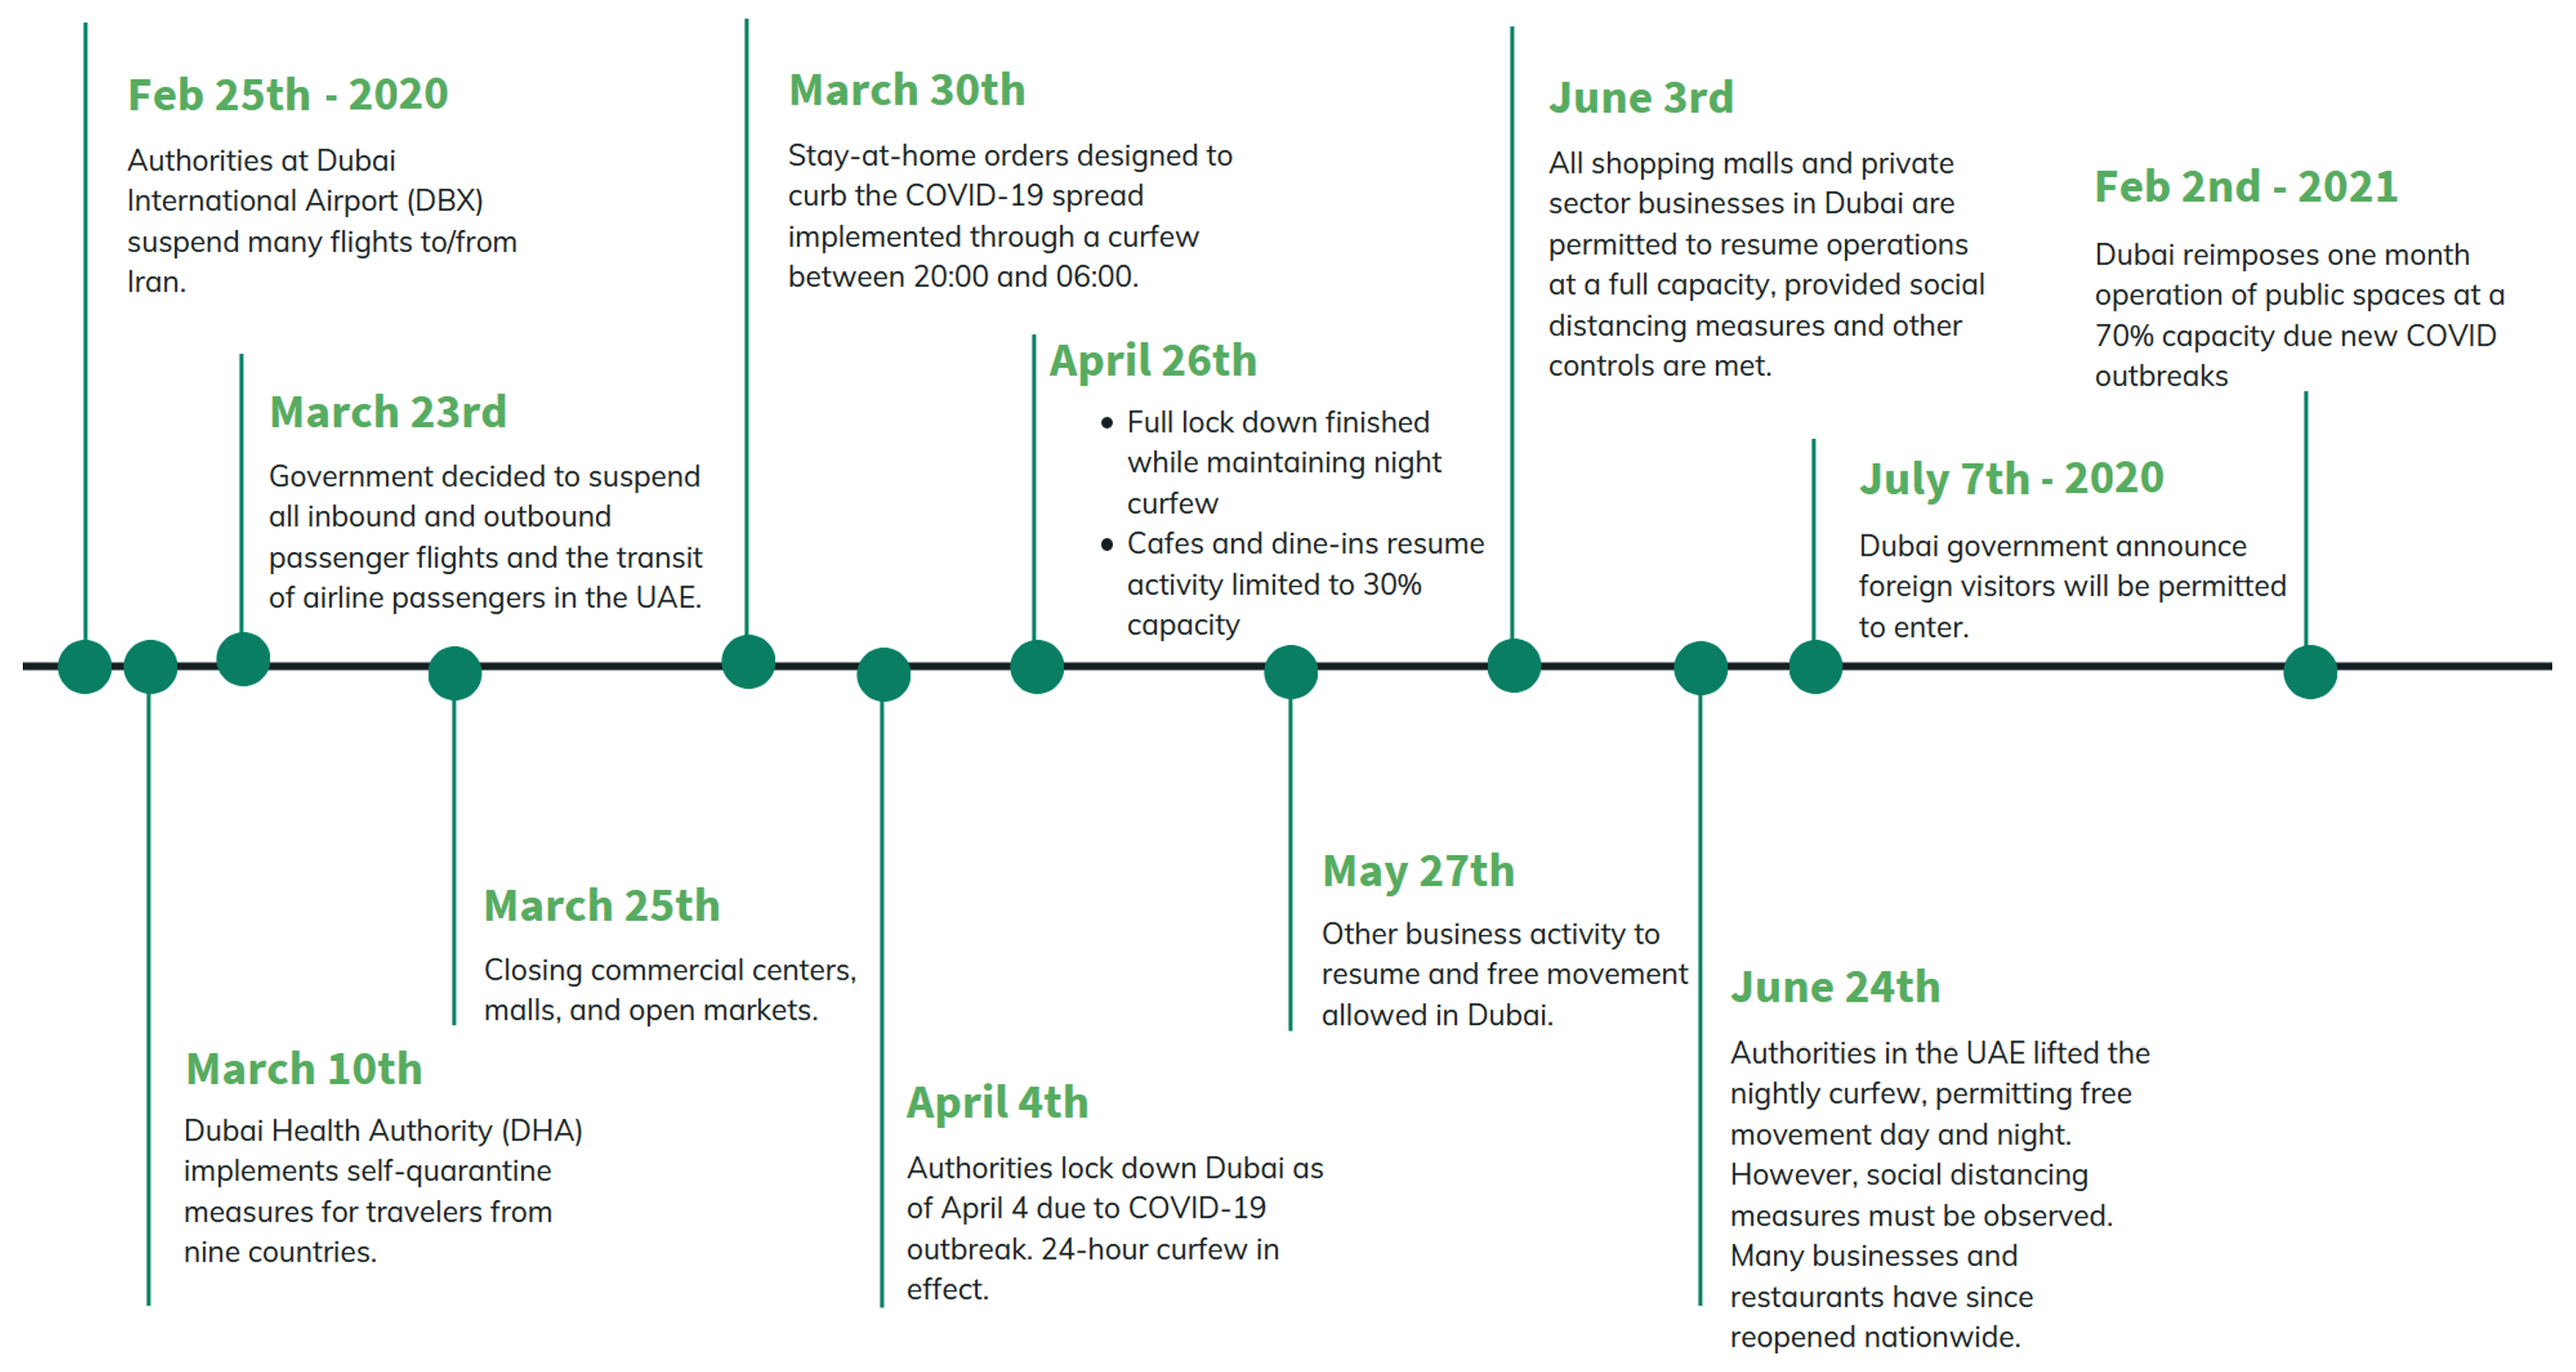
2.1. COVID-19 in the United Arab Emirates (UAE)
- Strengthening economic and business continuations;
- The National Disinfection Program and social distancing rules

- 25 February 2020: Authorities at Dubai International Airport (DBX) suspended many flights to/from Iran.
- 23 March 2020: The government suspended all inbound and outbound passenger flights and the transit of airline passengers in the UAE.
- 25 March 2020: Closing orders were issued for commercial centers, malls, and open markets.
- 30 March 2020: Stay-at-home orders were designed to curb the COVID-19 spread implemented through a curfew between 20:00 and 06:00.
- 4 April 2020: Authorities locked down Dubai as of 4 April due to the COVID-19 outbreak; a 24-h curfew was in effect.
- 26 April 2020: The full lockdown ended while maintaining a night curfew. Cafes and dine-ins resumed activity (limited to 30% capacity).
- 27 May 2020: Other business activities resumed and free movement was allowed in Dubai.
- 3 June 2020: All shopping malls and private sector businesses in Dubai were permitted to resume operations at full capacity, provided social distancing measures and other controls were met.
- 24 June 2020: Authorities in the UAE lifted the nightly curfew while permitting free movement day and night. However, social distancing measures were to be observed. Many businesses and restaurants have since reopened nationwide.
- 7 July 2020: The Dubai government announced that foreign visitors would be permitted to enter.
- 2 February 2021: Dubai reimposed one month of operations in public spaces at 70% capacity due to new COVID-19 outbreaks
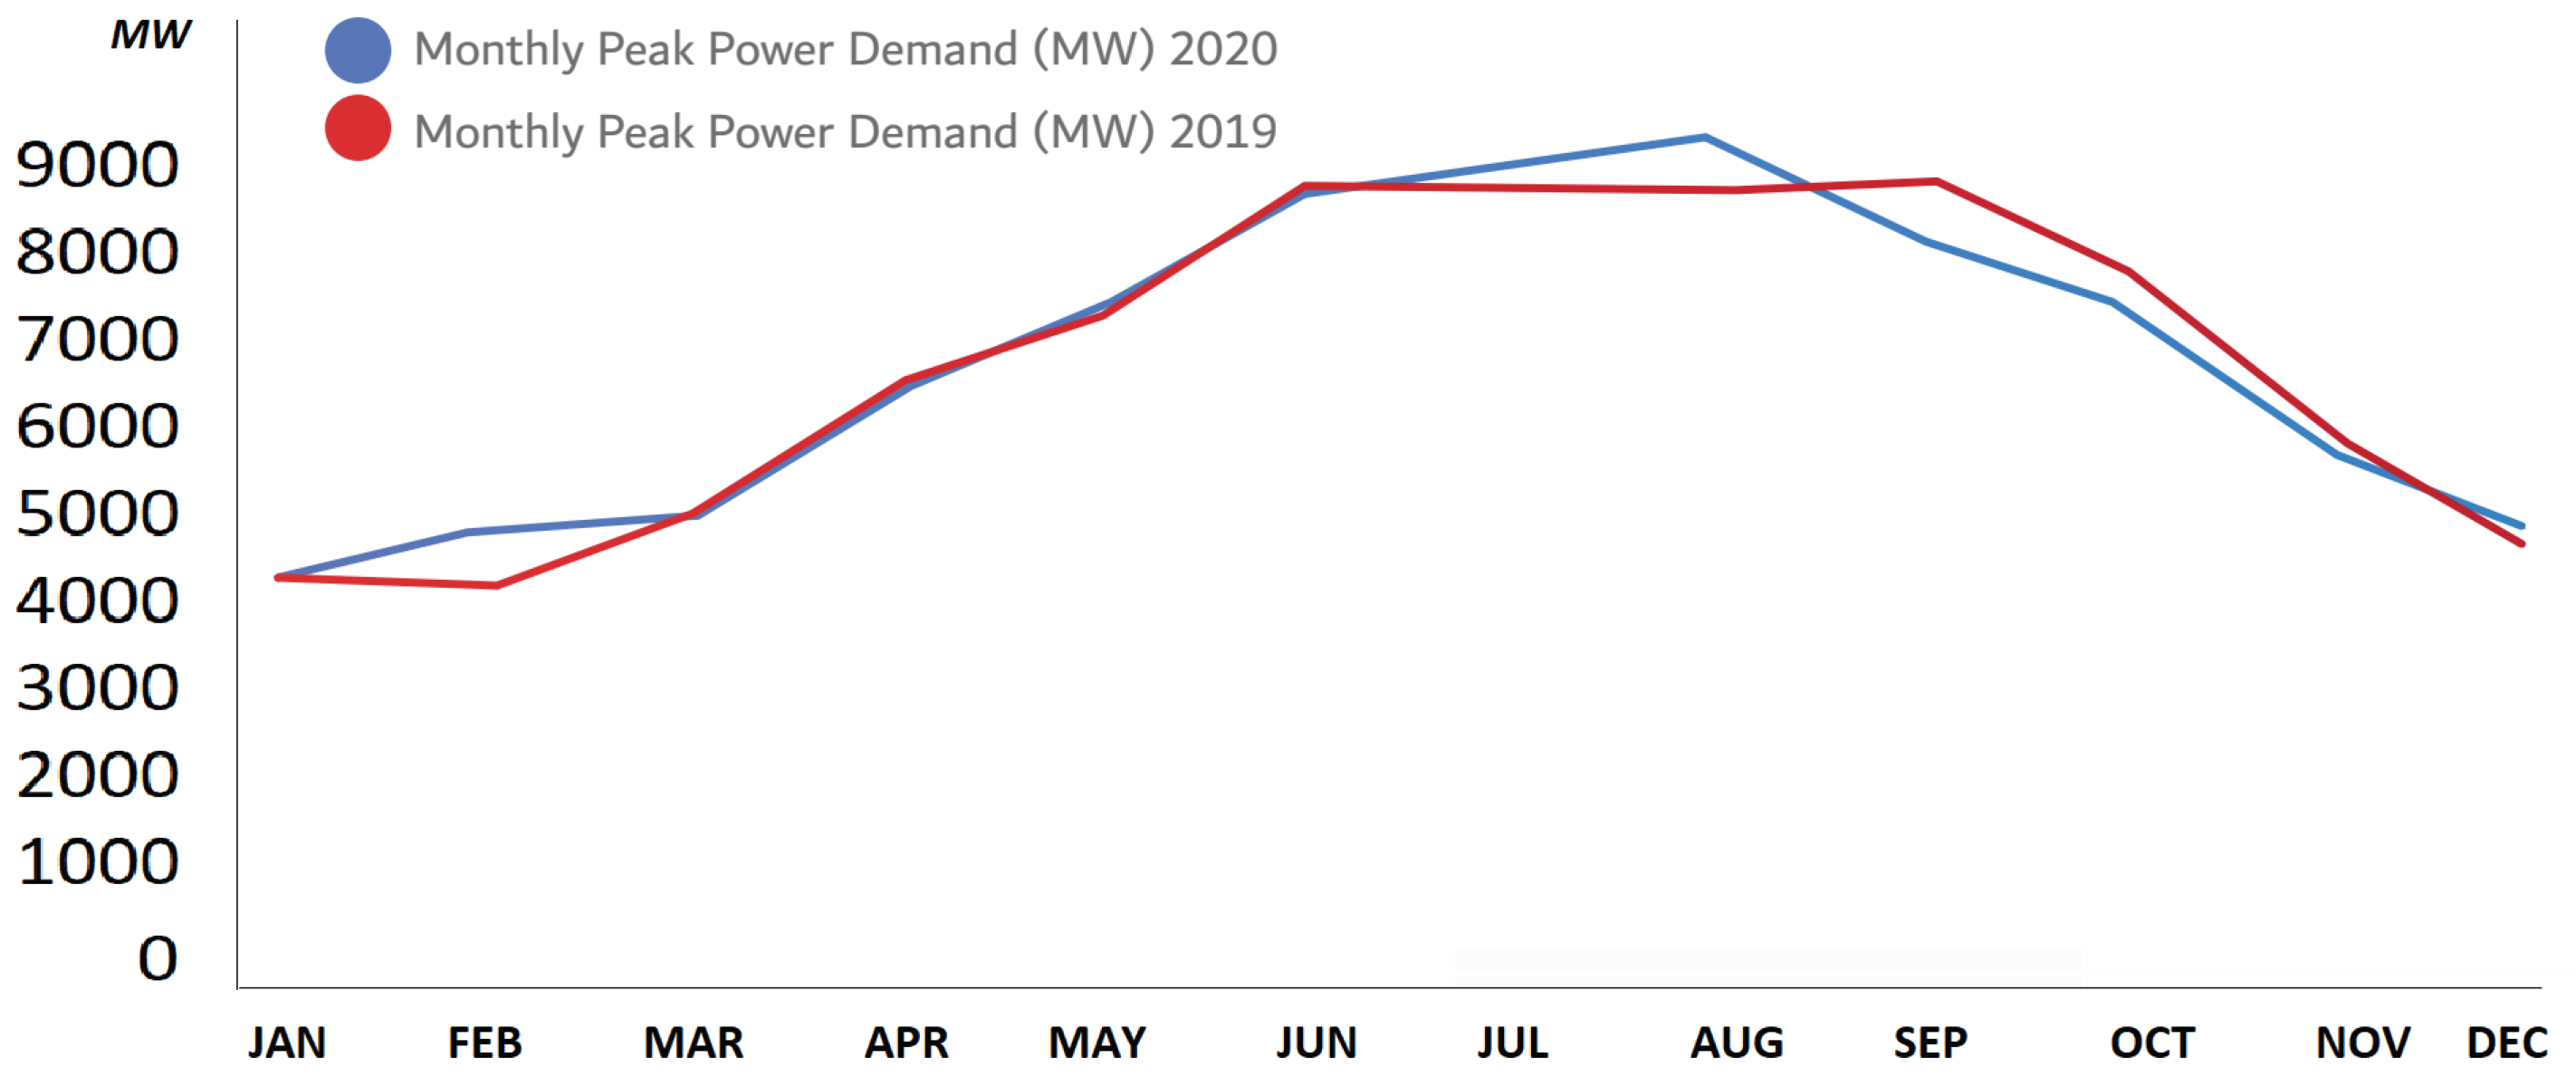
2.2. Understanding Load Profiles during the COVID-19 Lockdown
2.3. Profile Data of Residential User Surveys
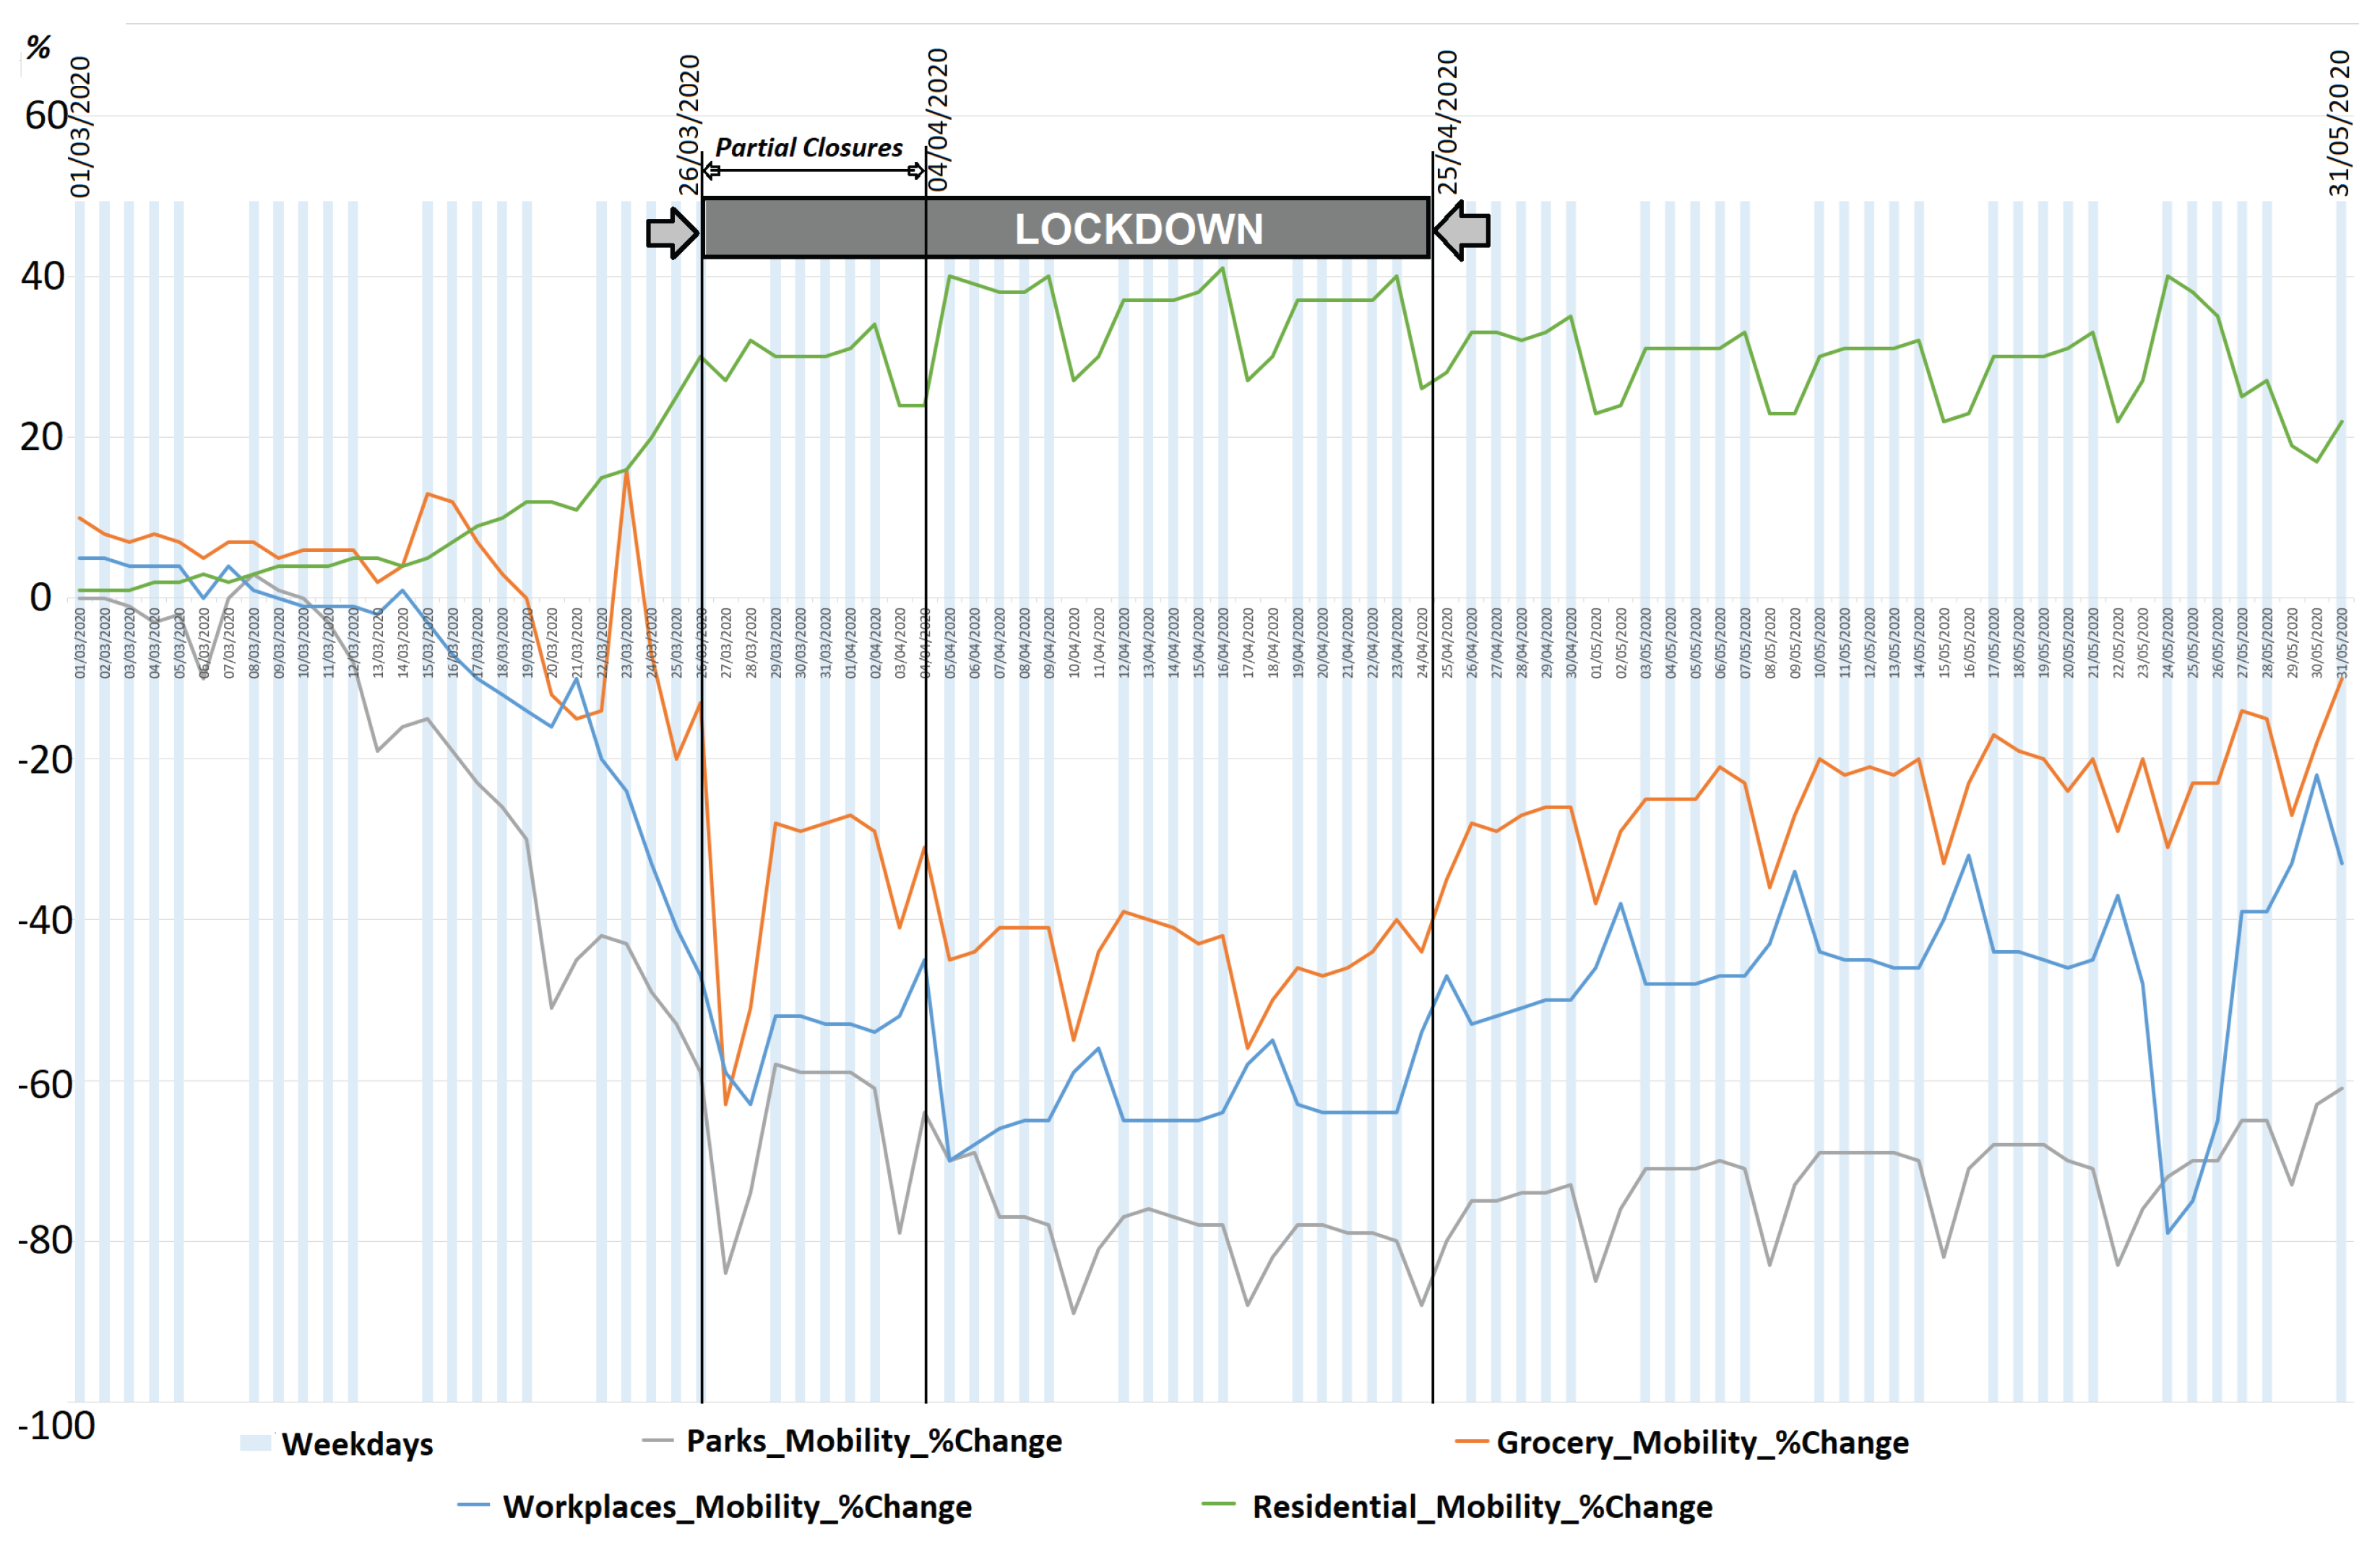
2.4. Regional Mobility Data for Dubai during COVID-19 Lockdown
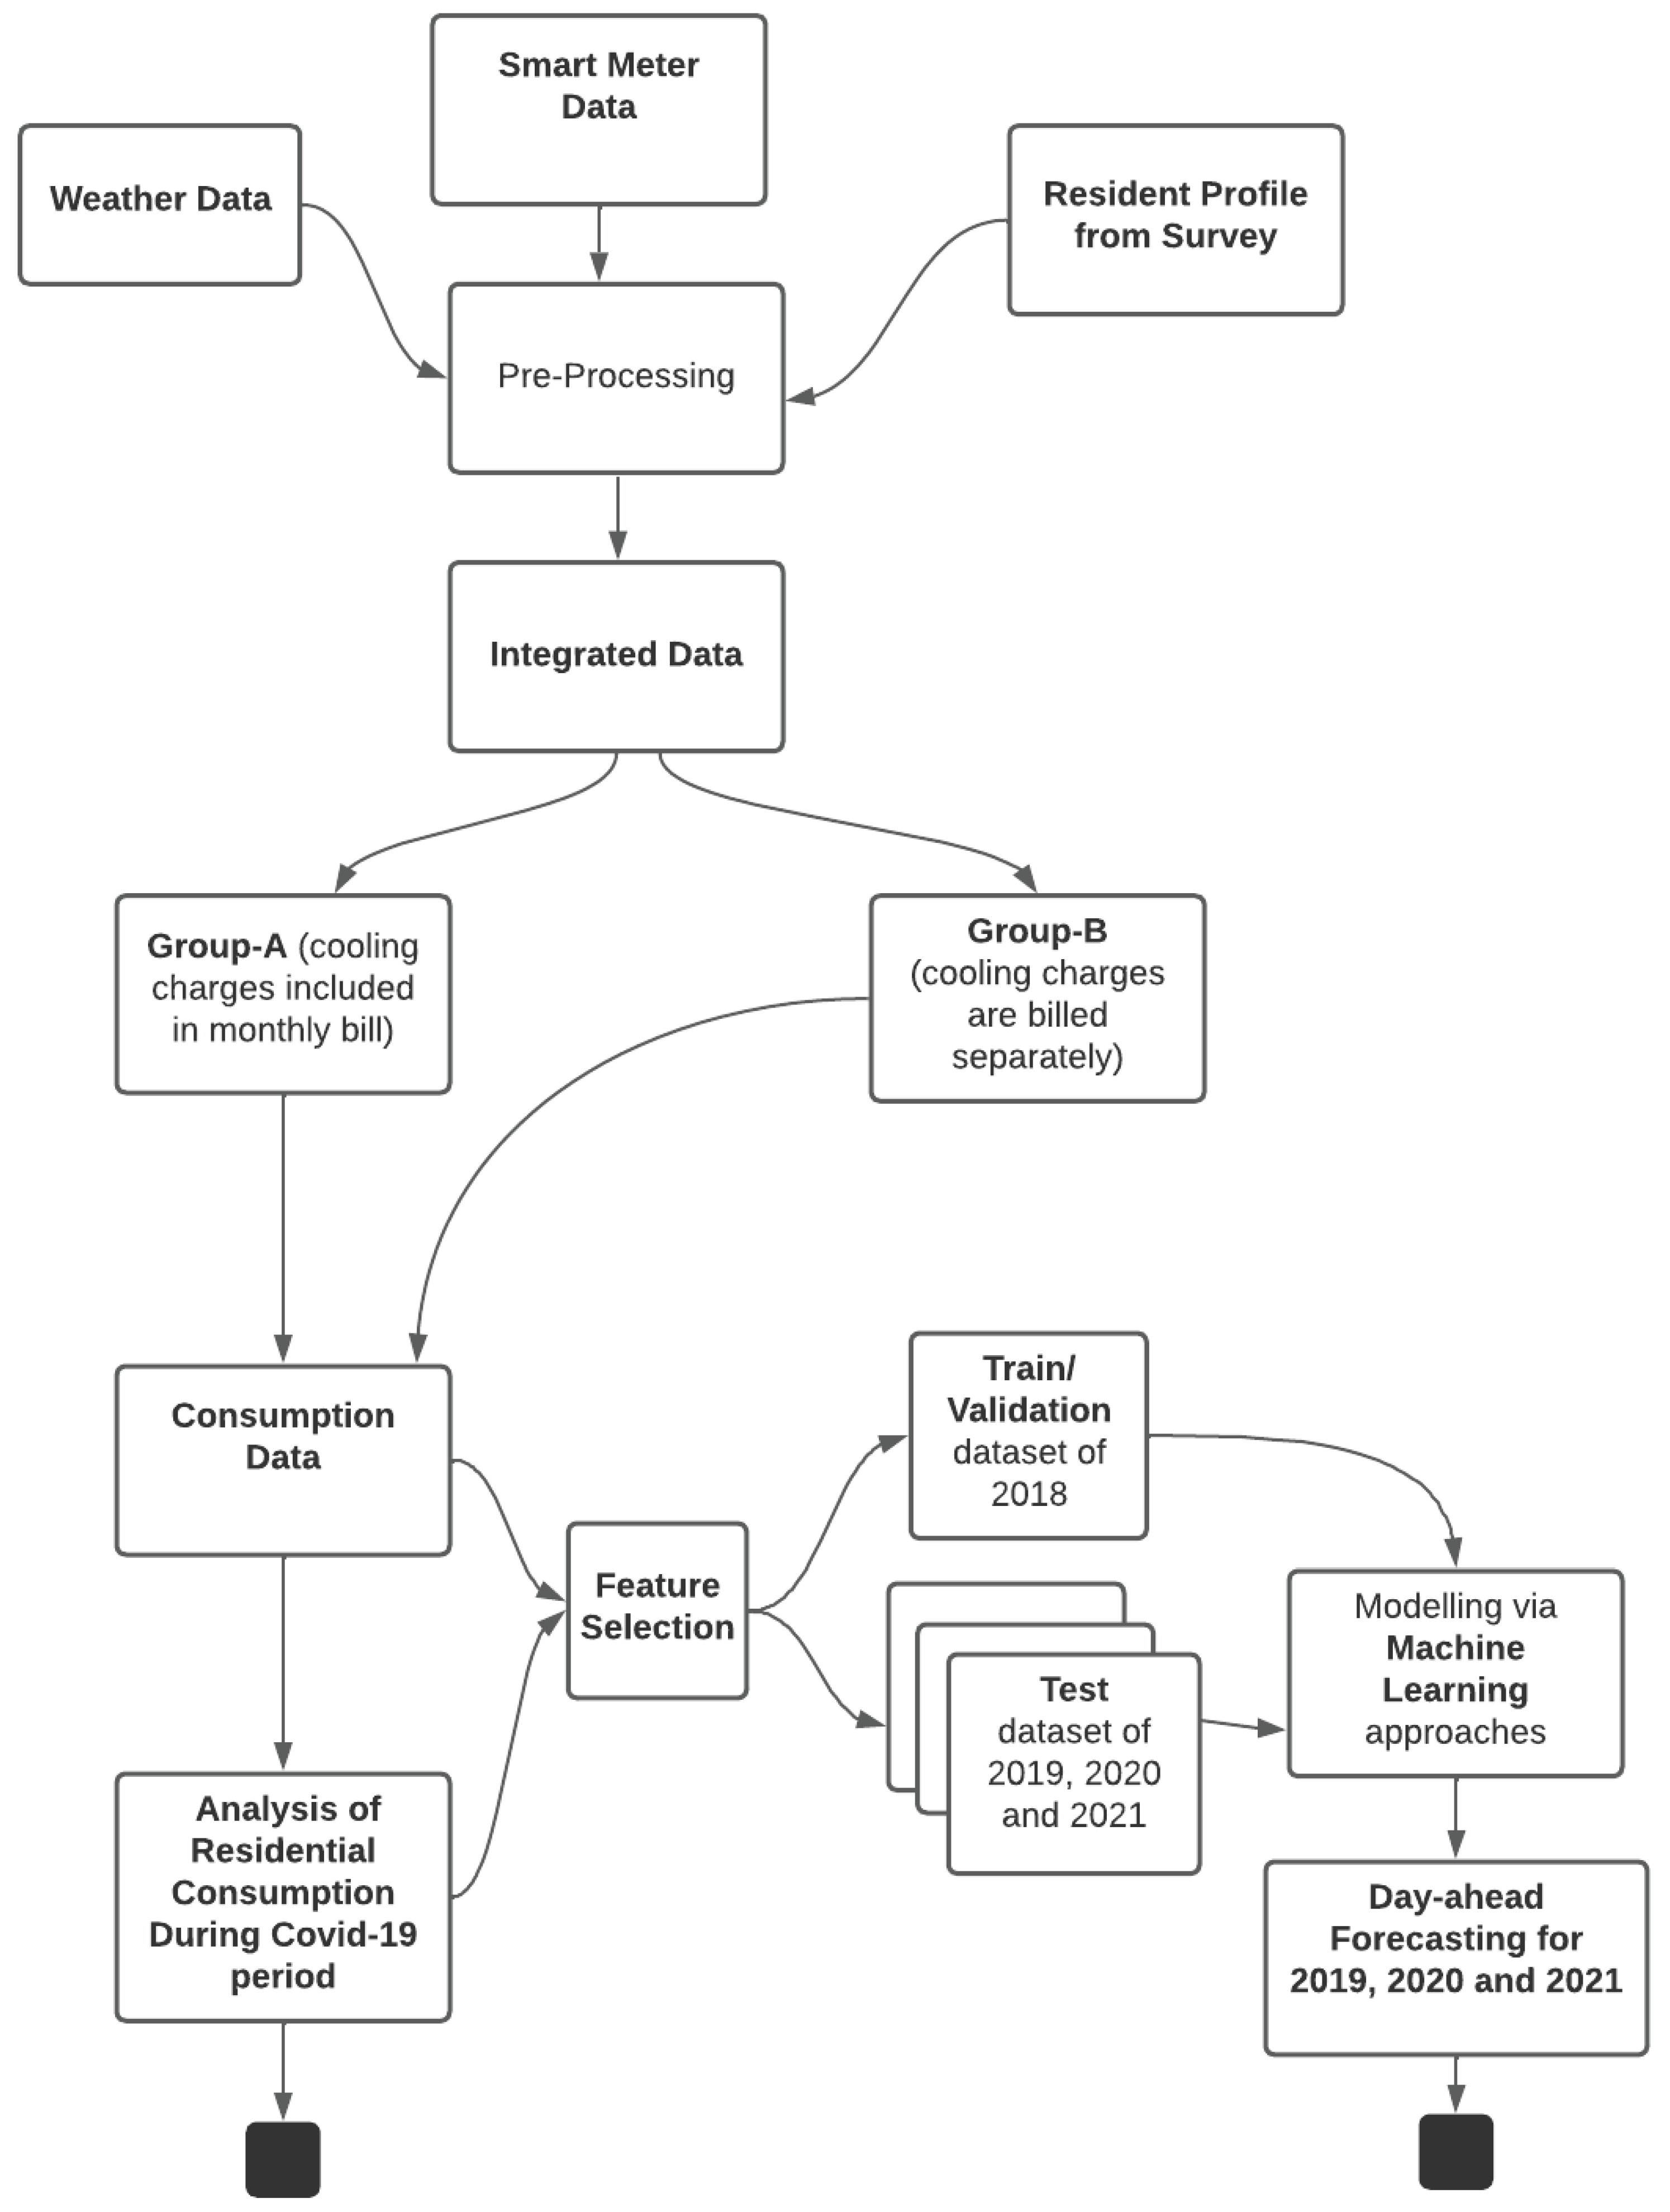
3. Methodology
3.1. About Data
- Pre-lockdown: March 2020;
- Full-lockdown: April 2020;
- Post-lockdown: May 2020.
3.2. Behavioral Data Analysis
3.3. Data Modeling
3.3.1. Machine Learning Methods
Support Vector Regression
Random Forest
Deep Learning
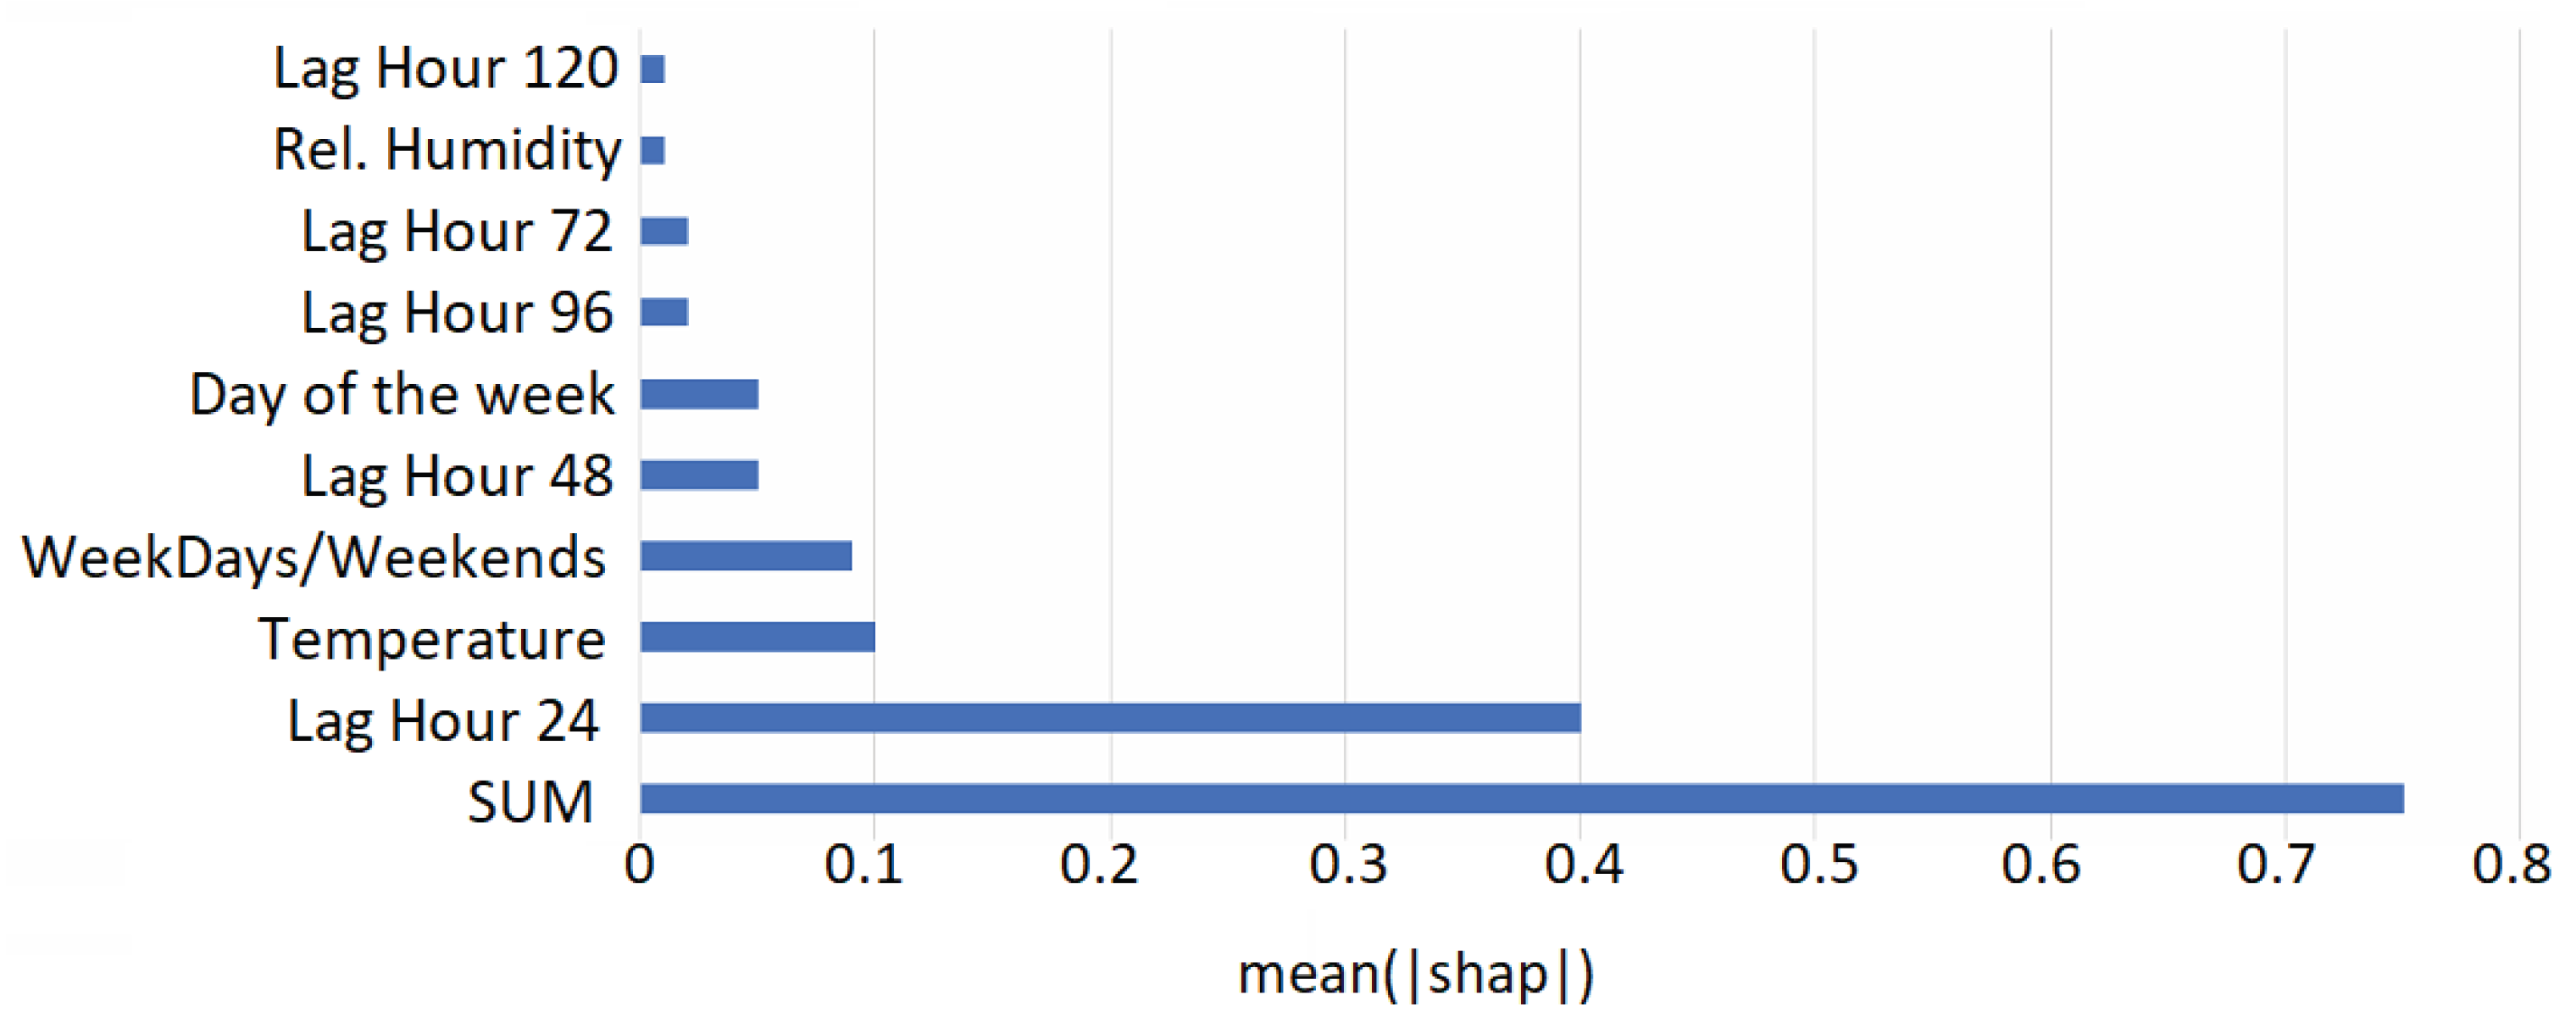
3.3.2. Feature Selection vs. Importance of Features in the Model
Feature Selection
Importance of Features in the Model
3.3.3. Evaluation Metrics
Root Mean Square Error
Mean Absolute Error
Mean Absolute Percentage Error
4. Observations and Results
4.1. Behavioral Analysis
4.1.1. The Need for High-Resolution Data
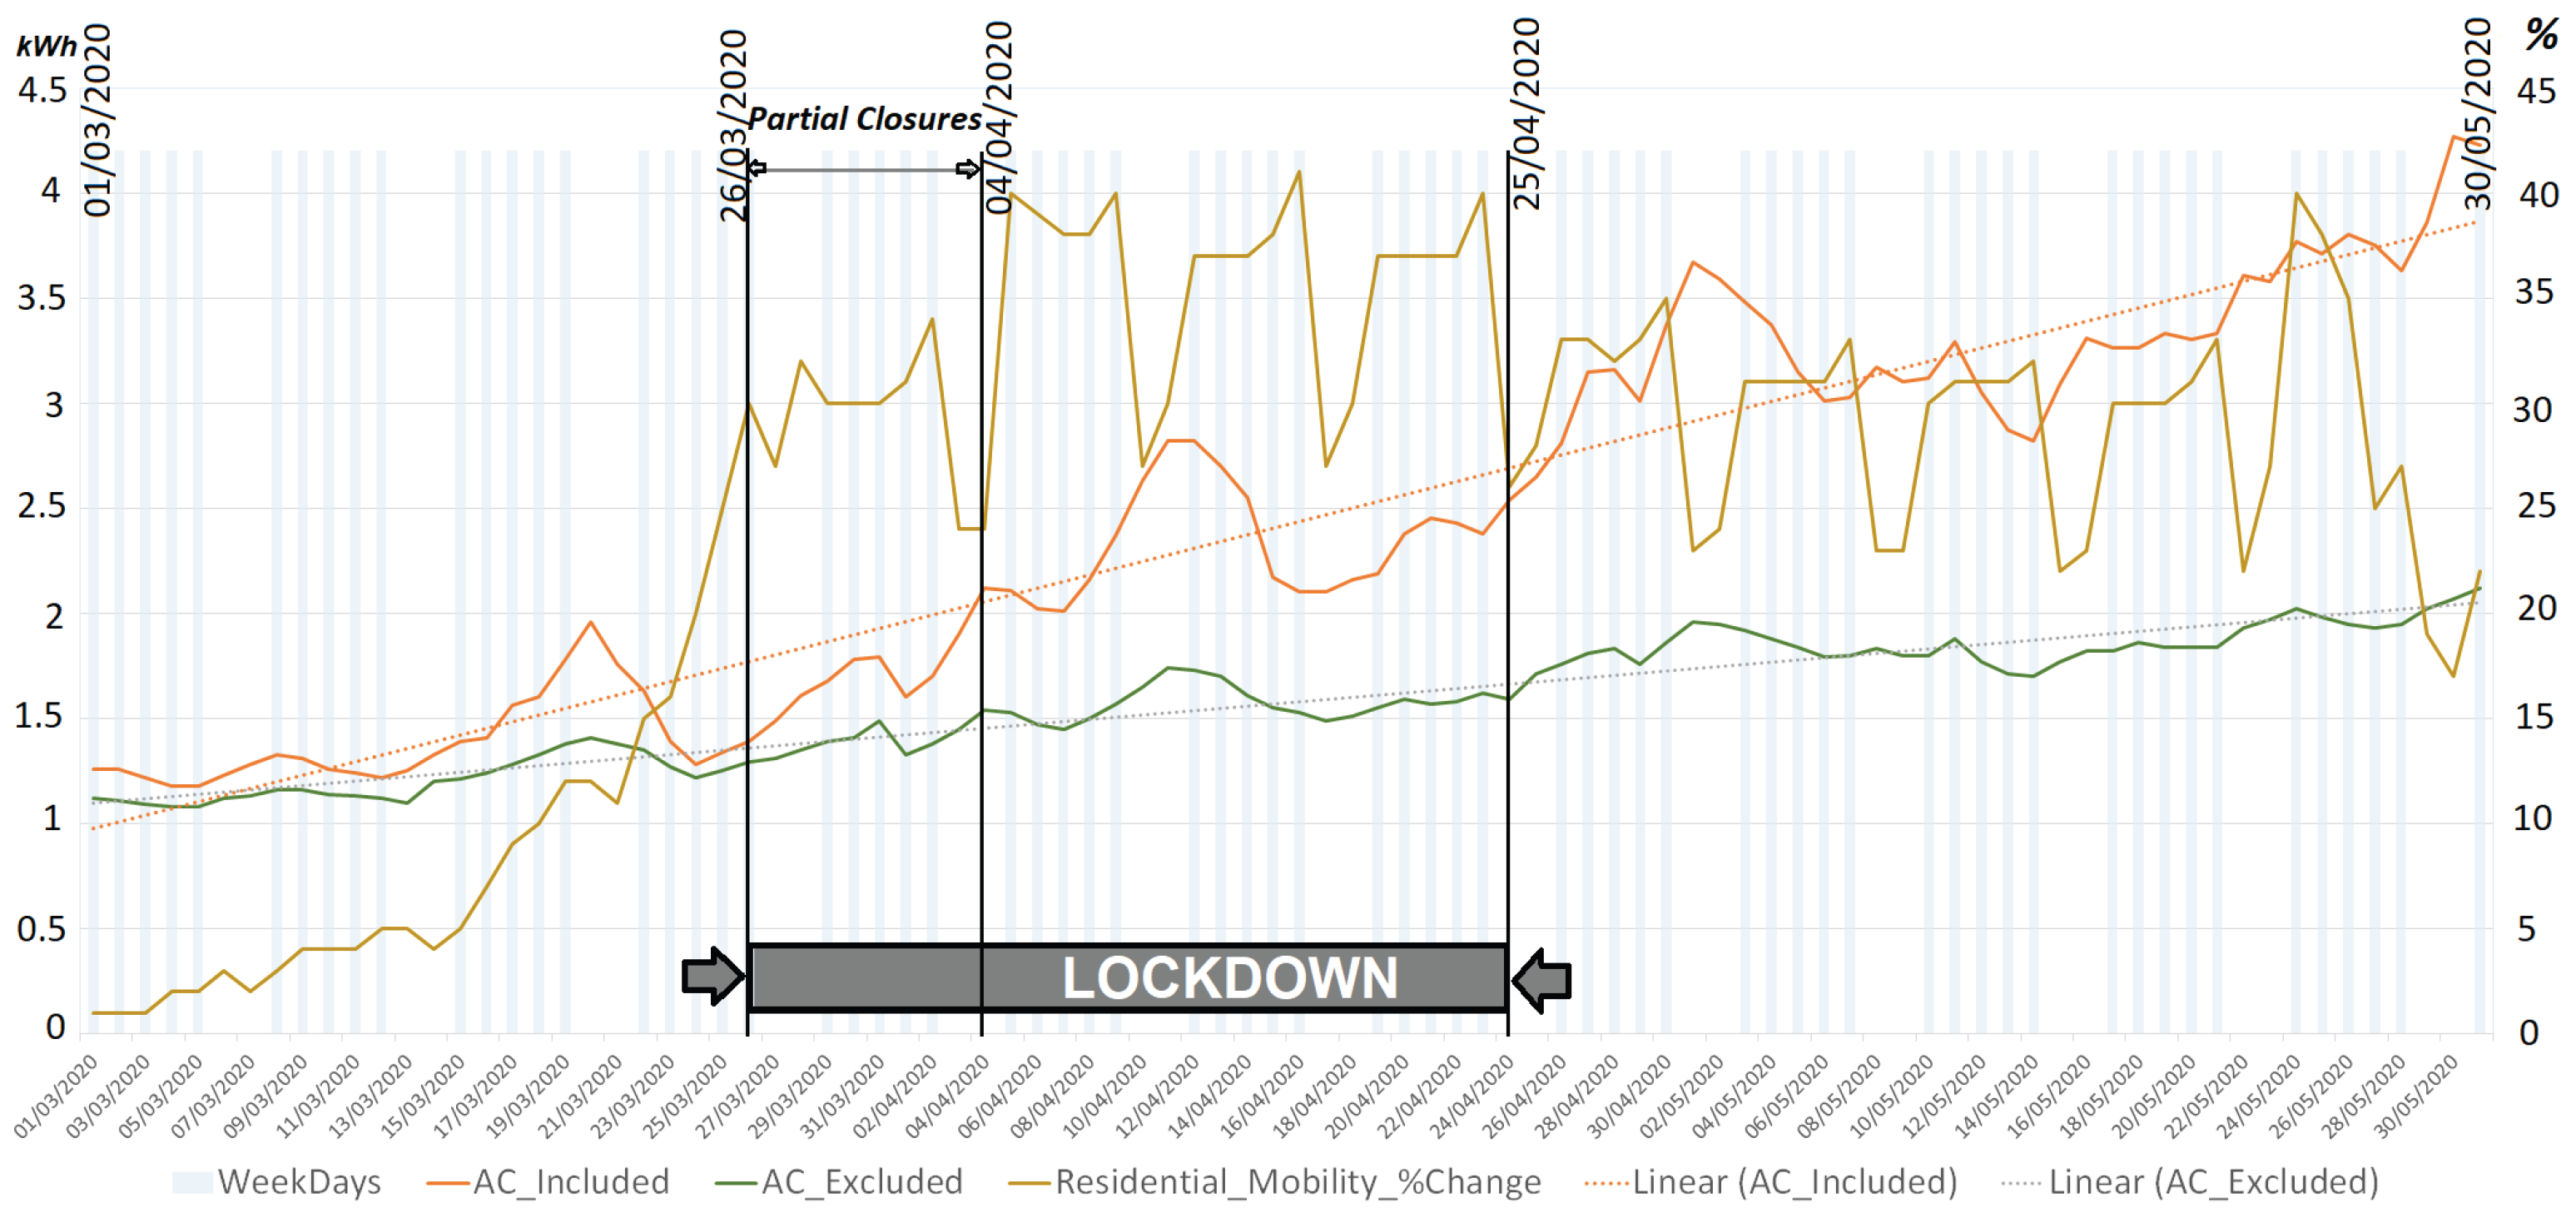
4.1.2. The Effect of Mobility Restriction
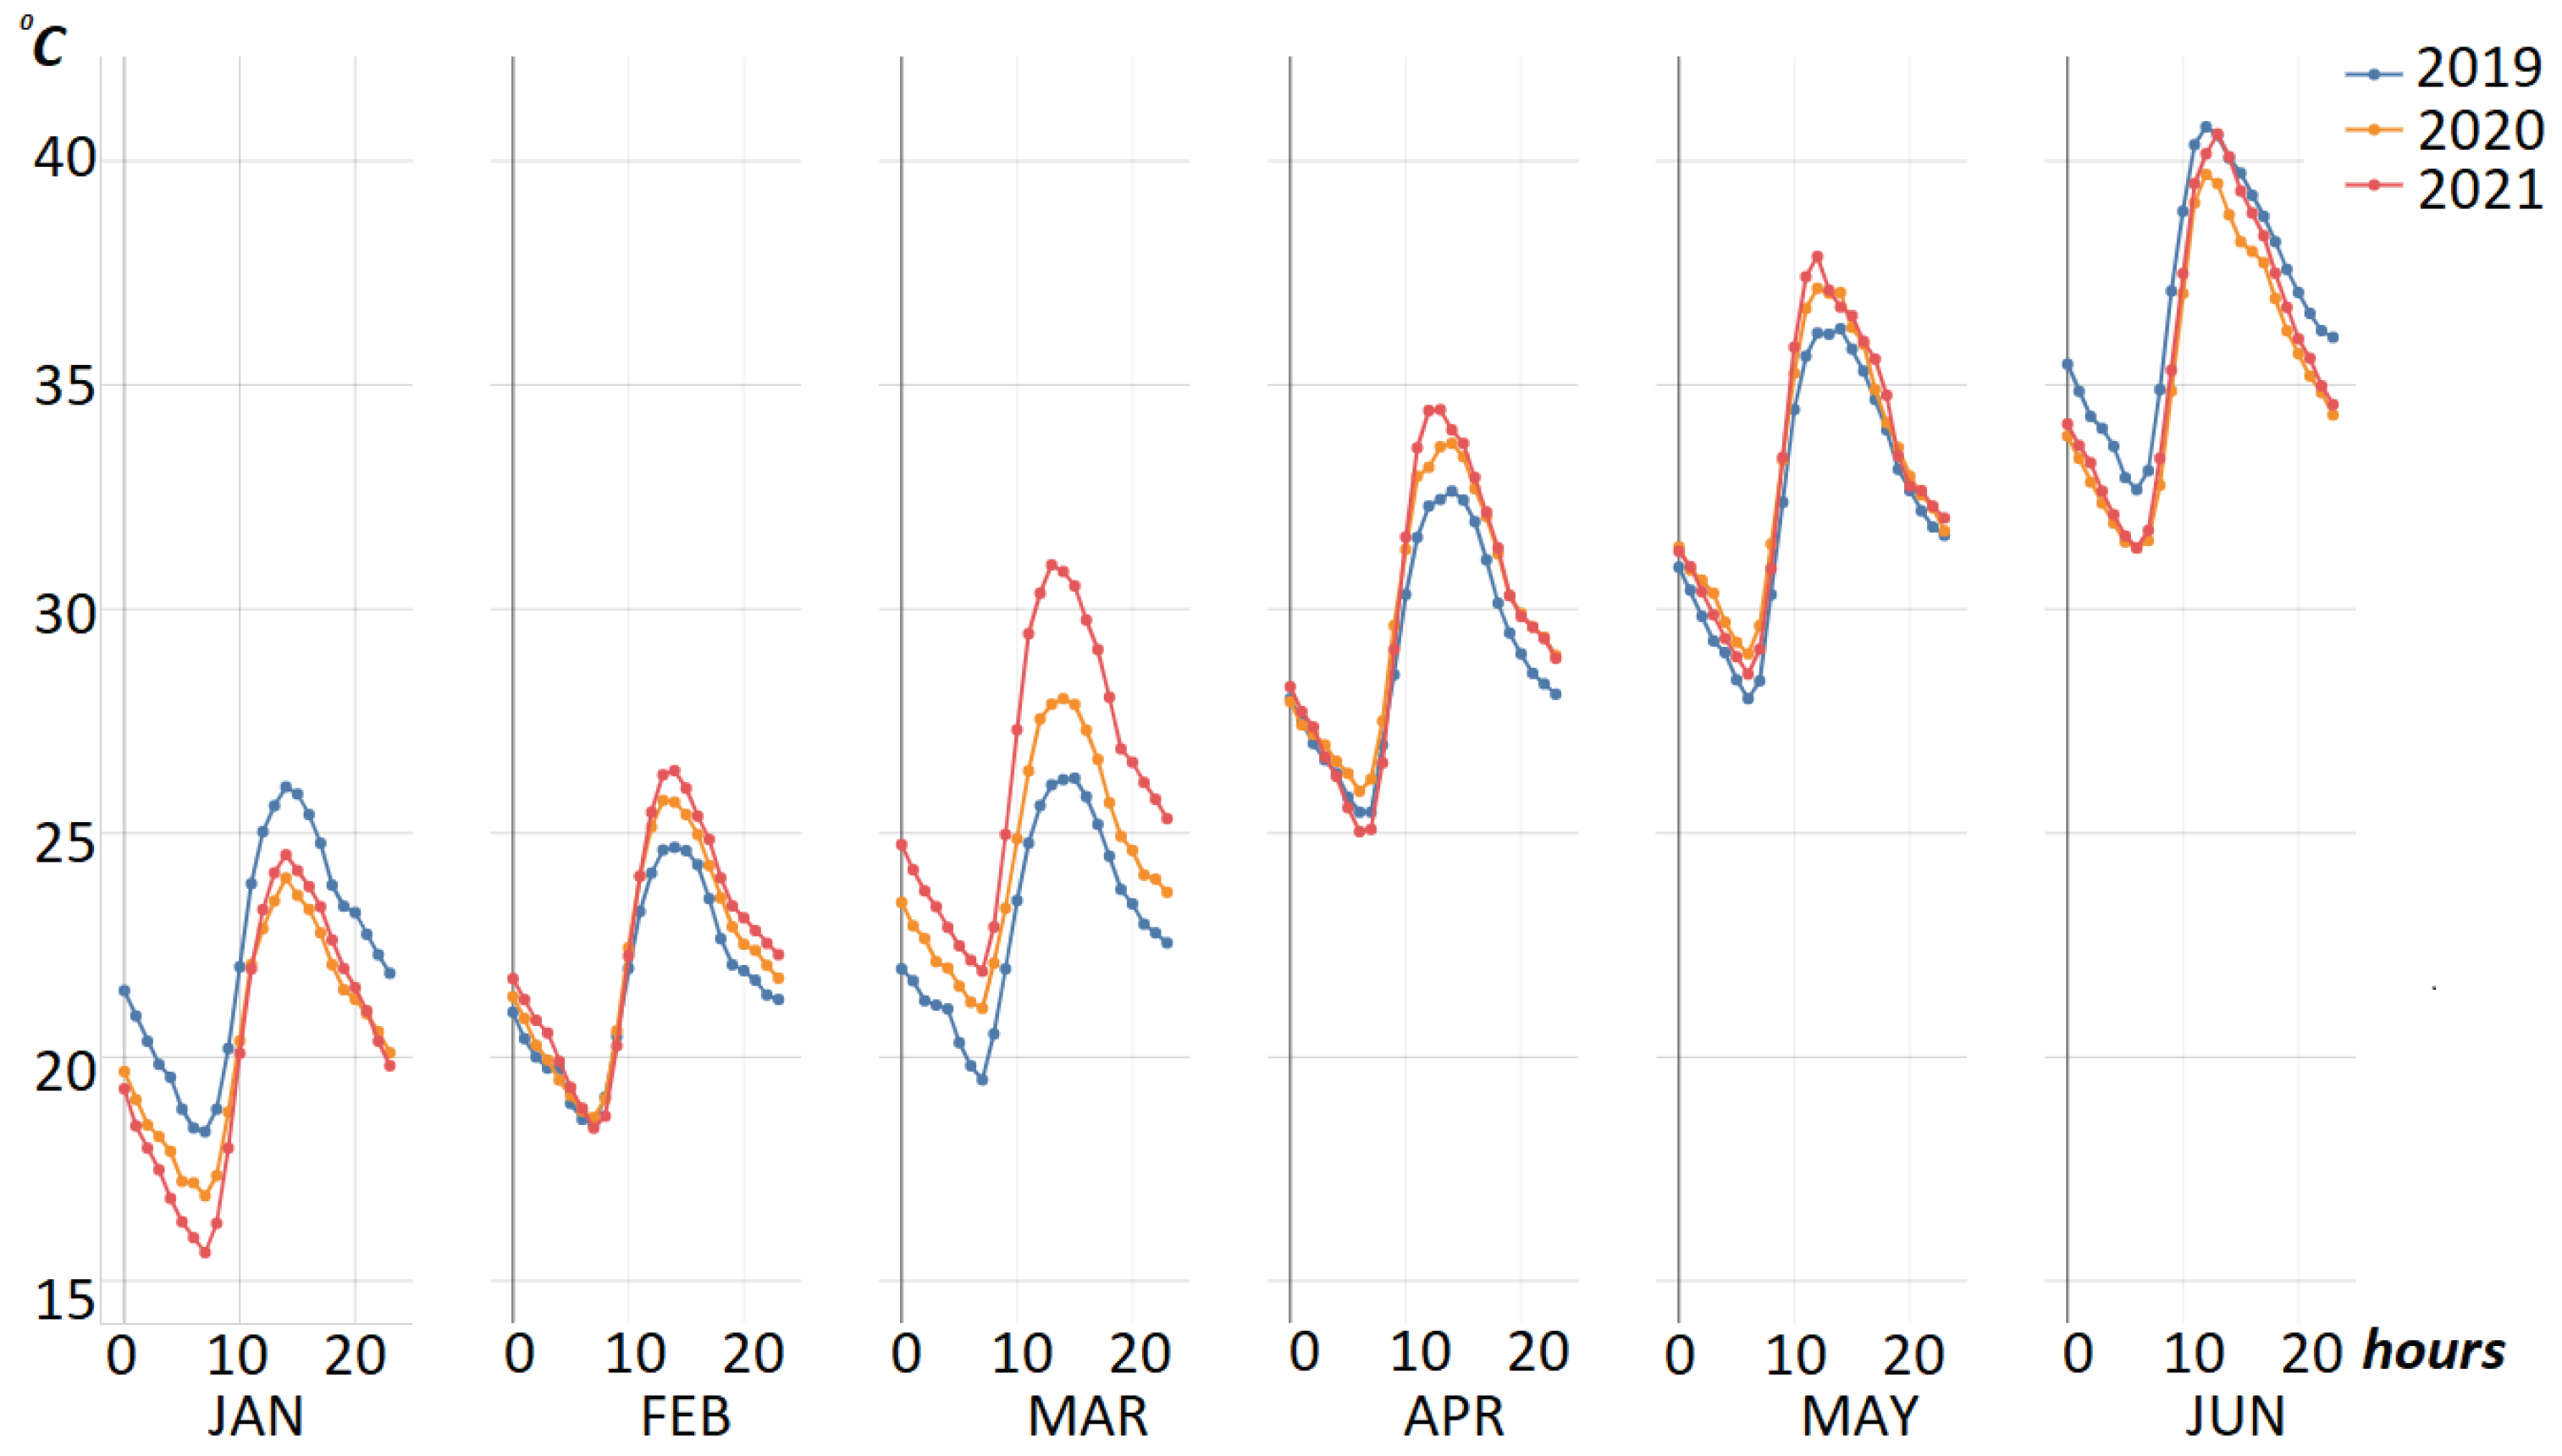
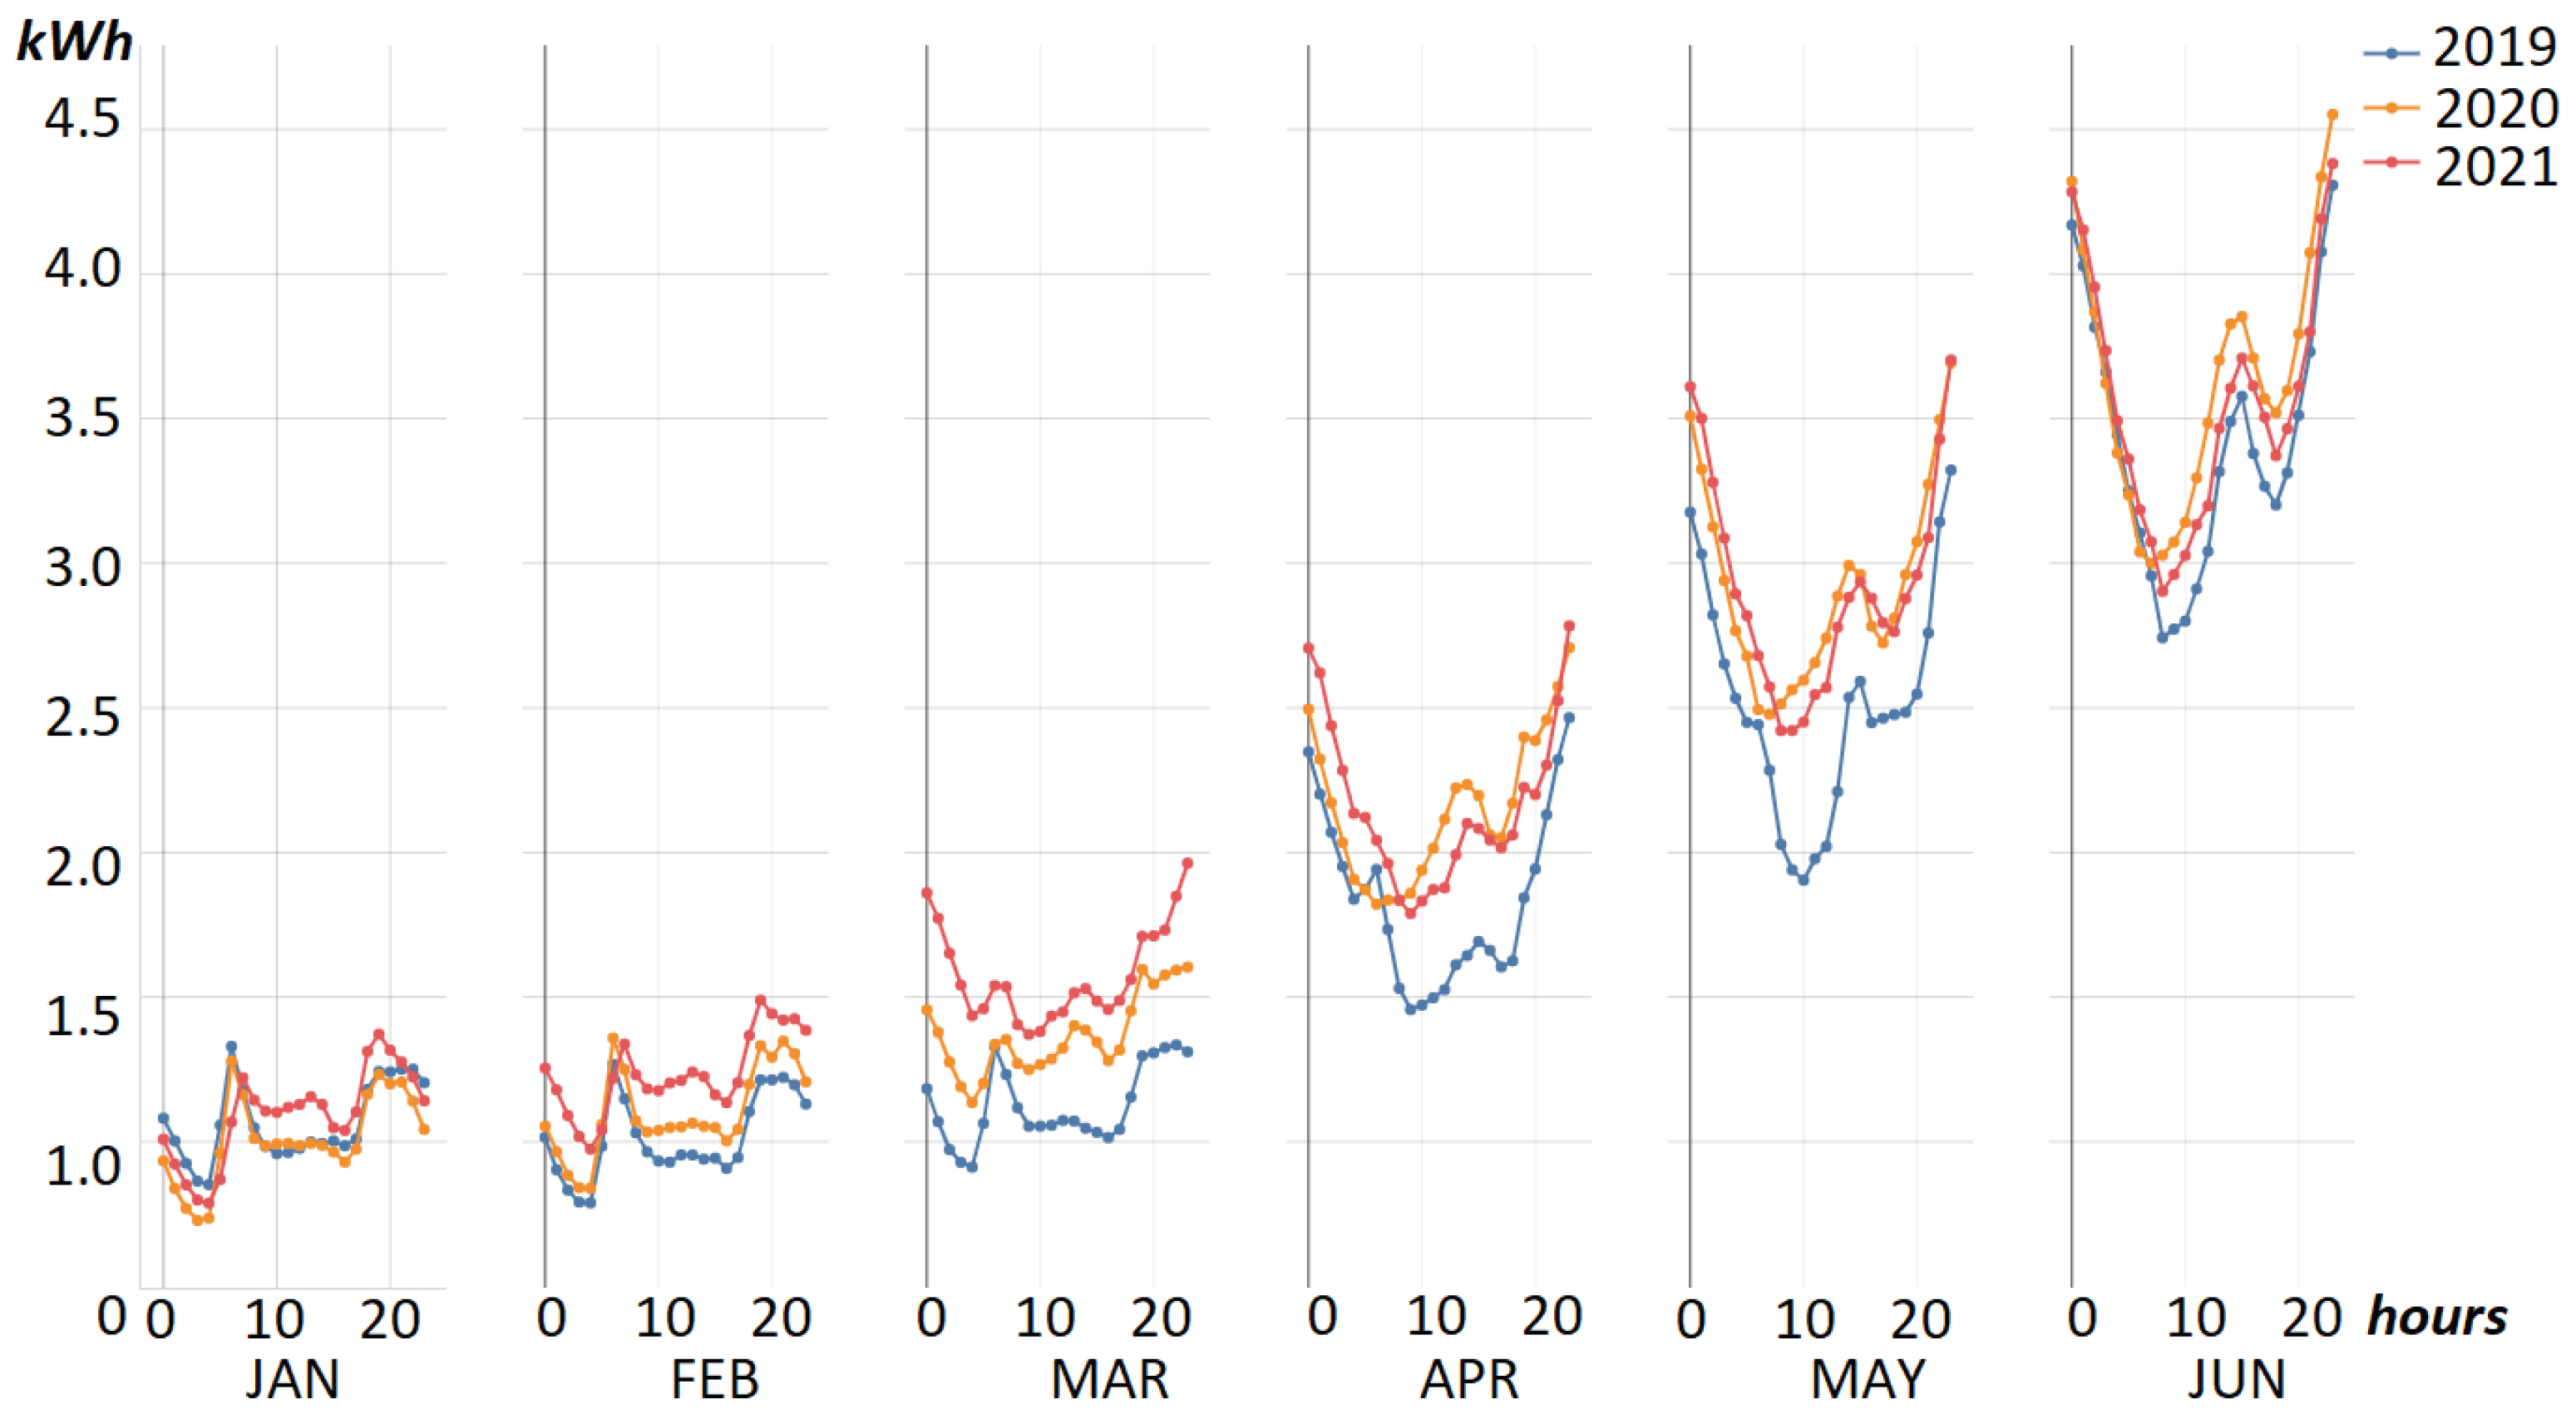
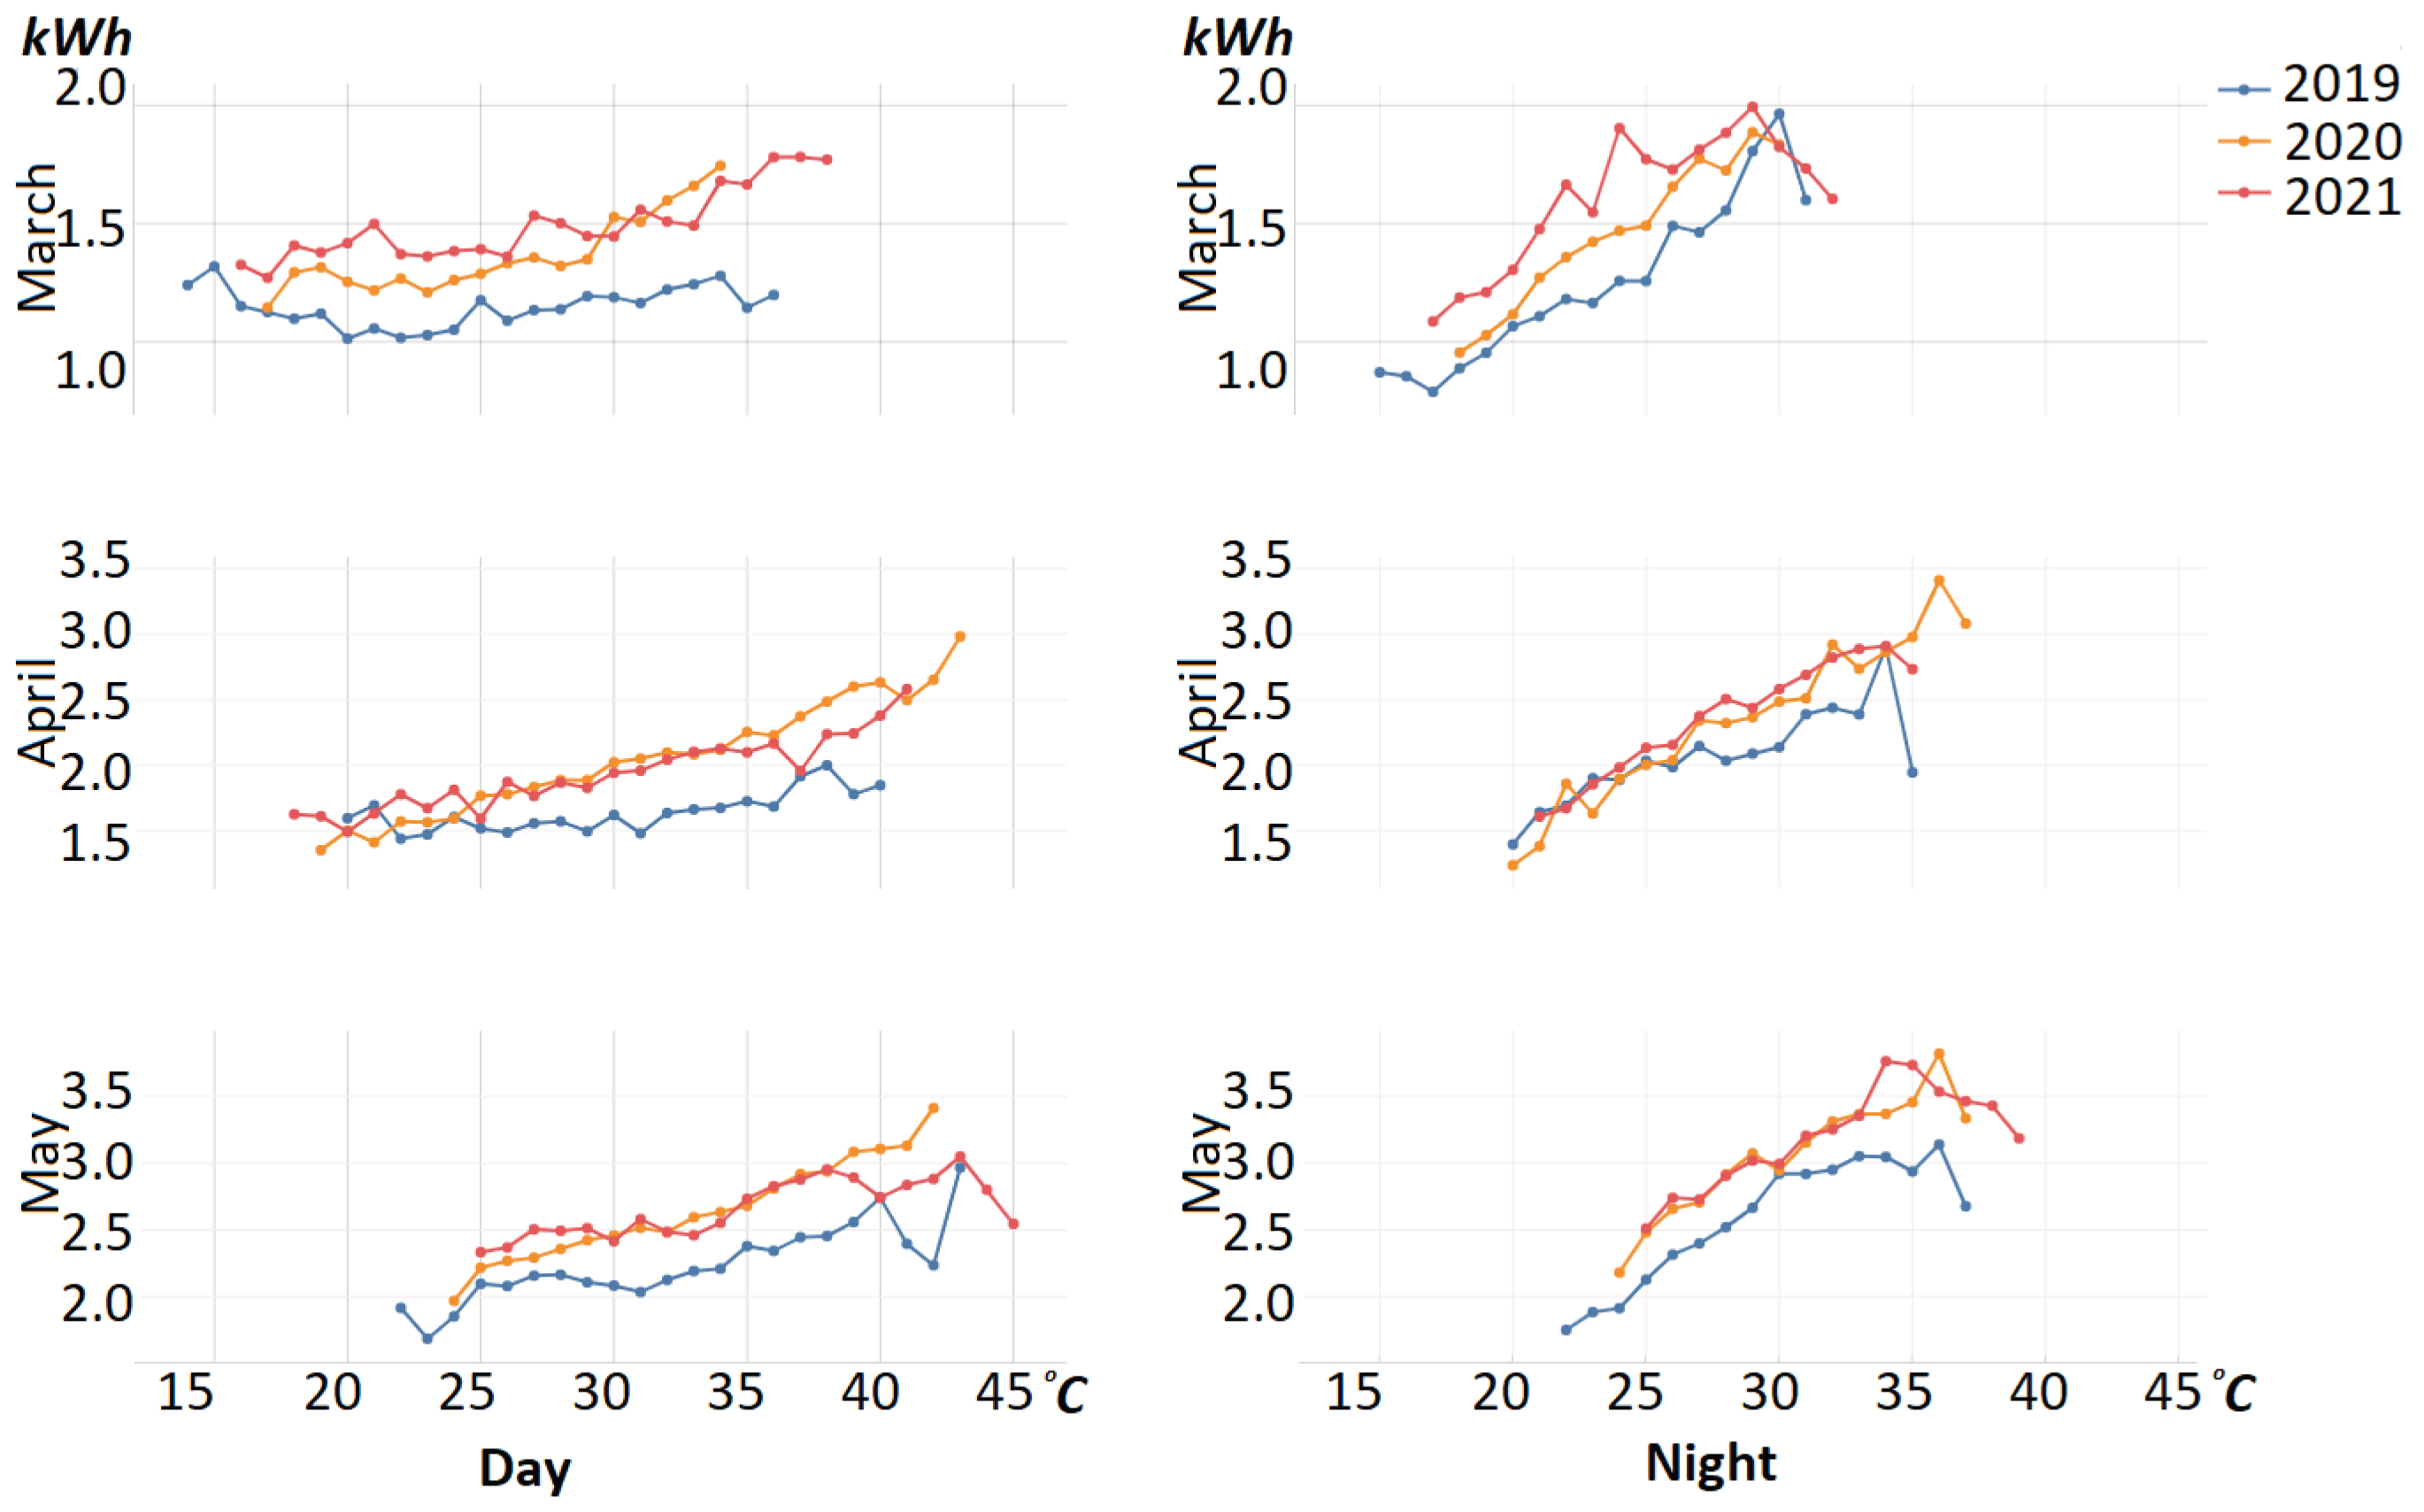
4.1.3. The Temperature Effect
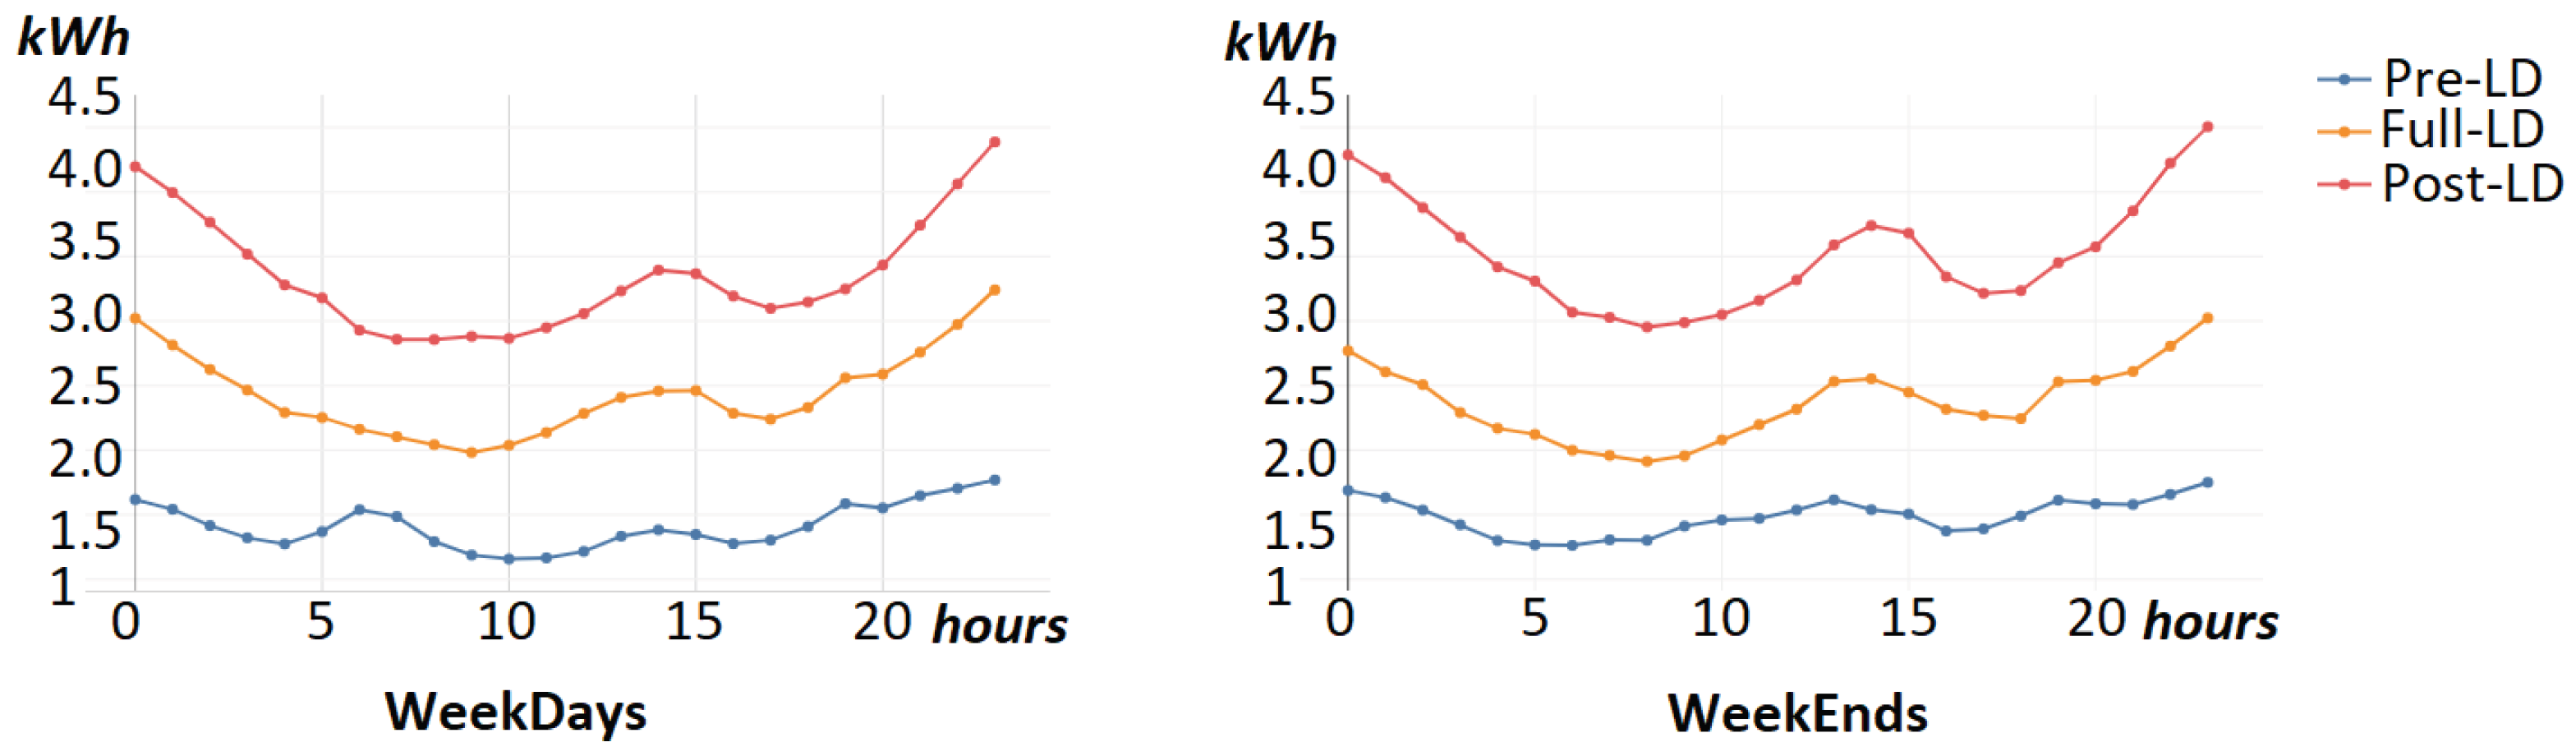
4.1.4. The Behavioral Traits during and after the Lockdown Period in 2020
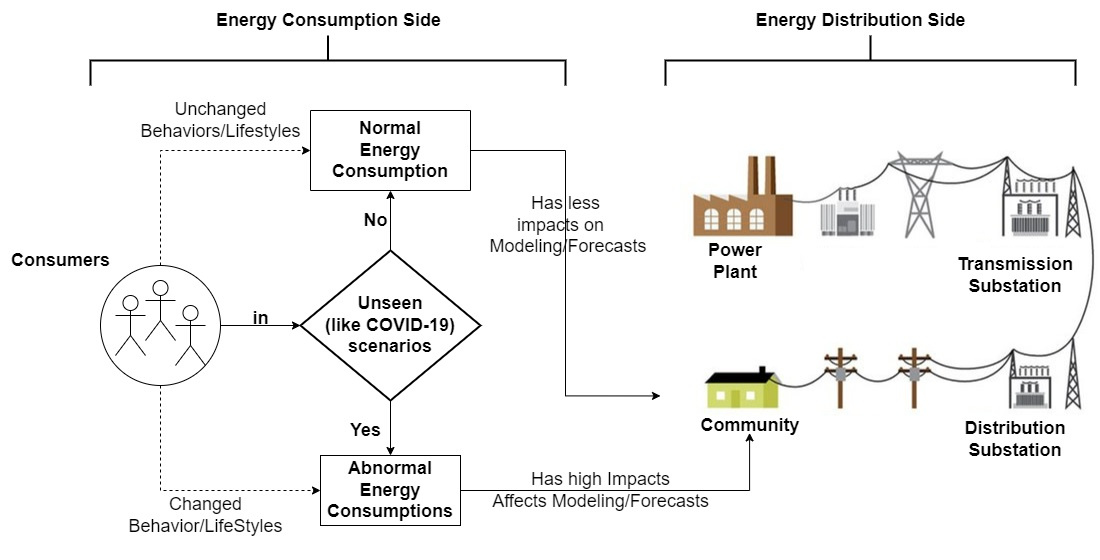
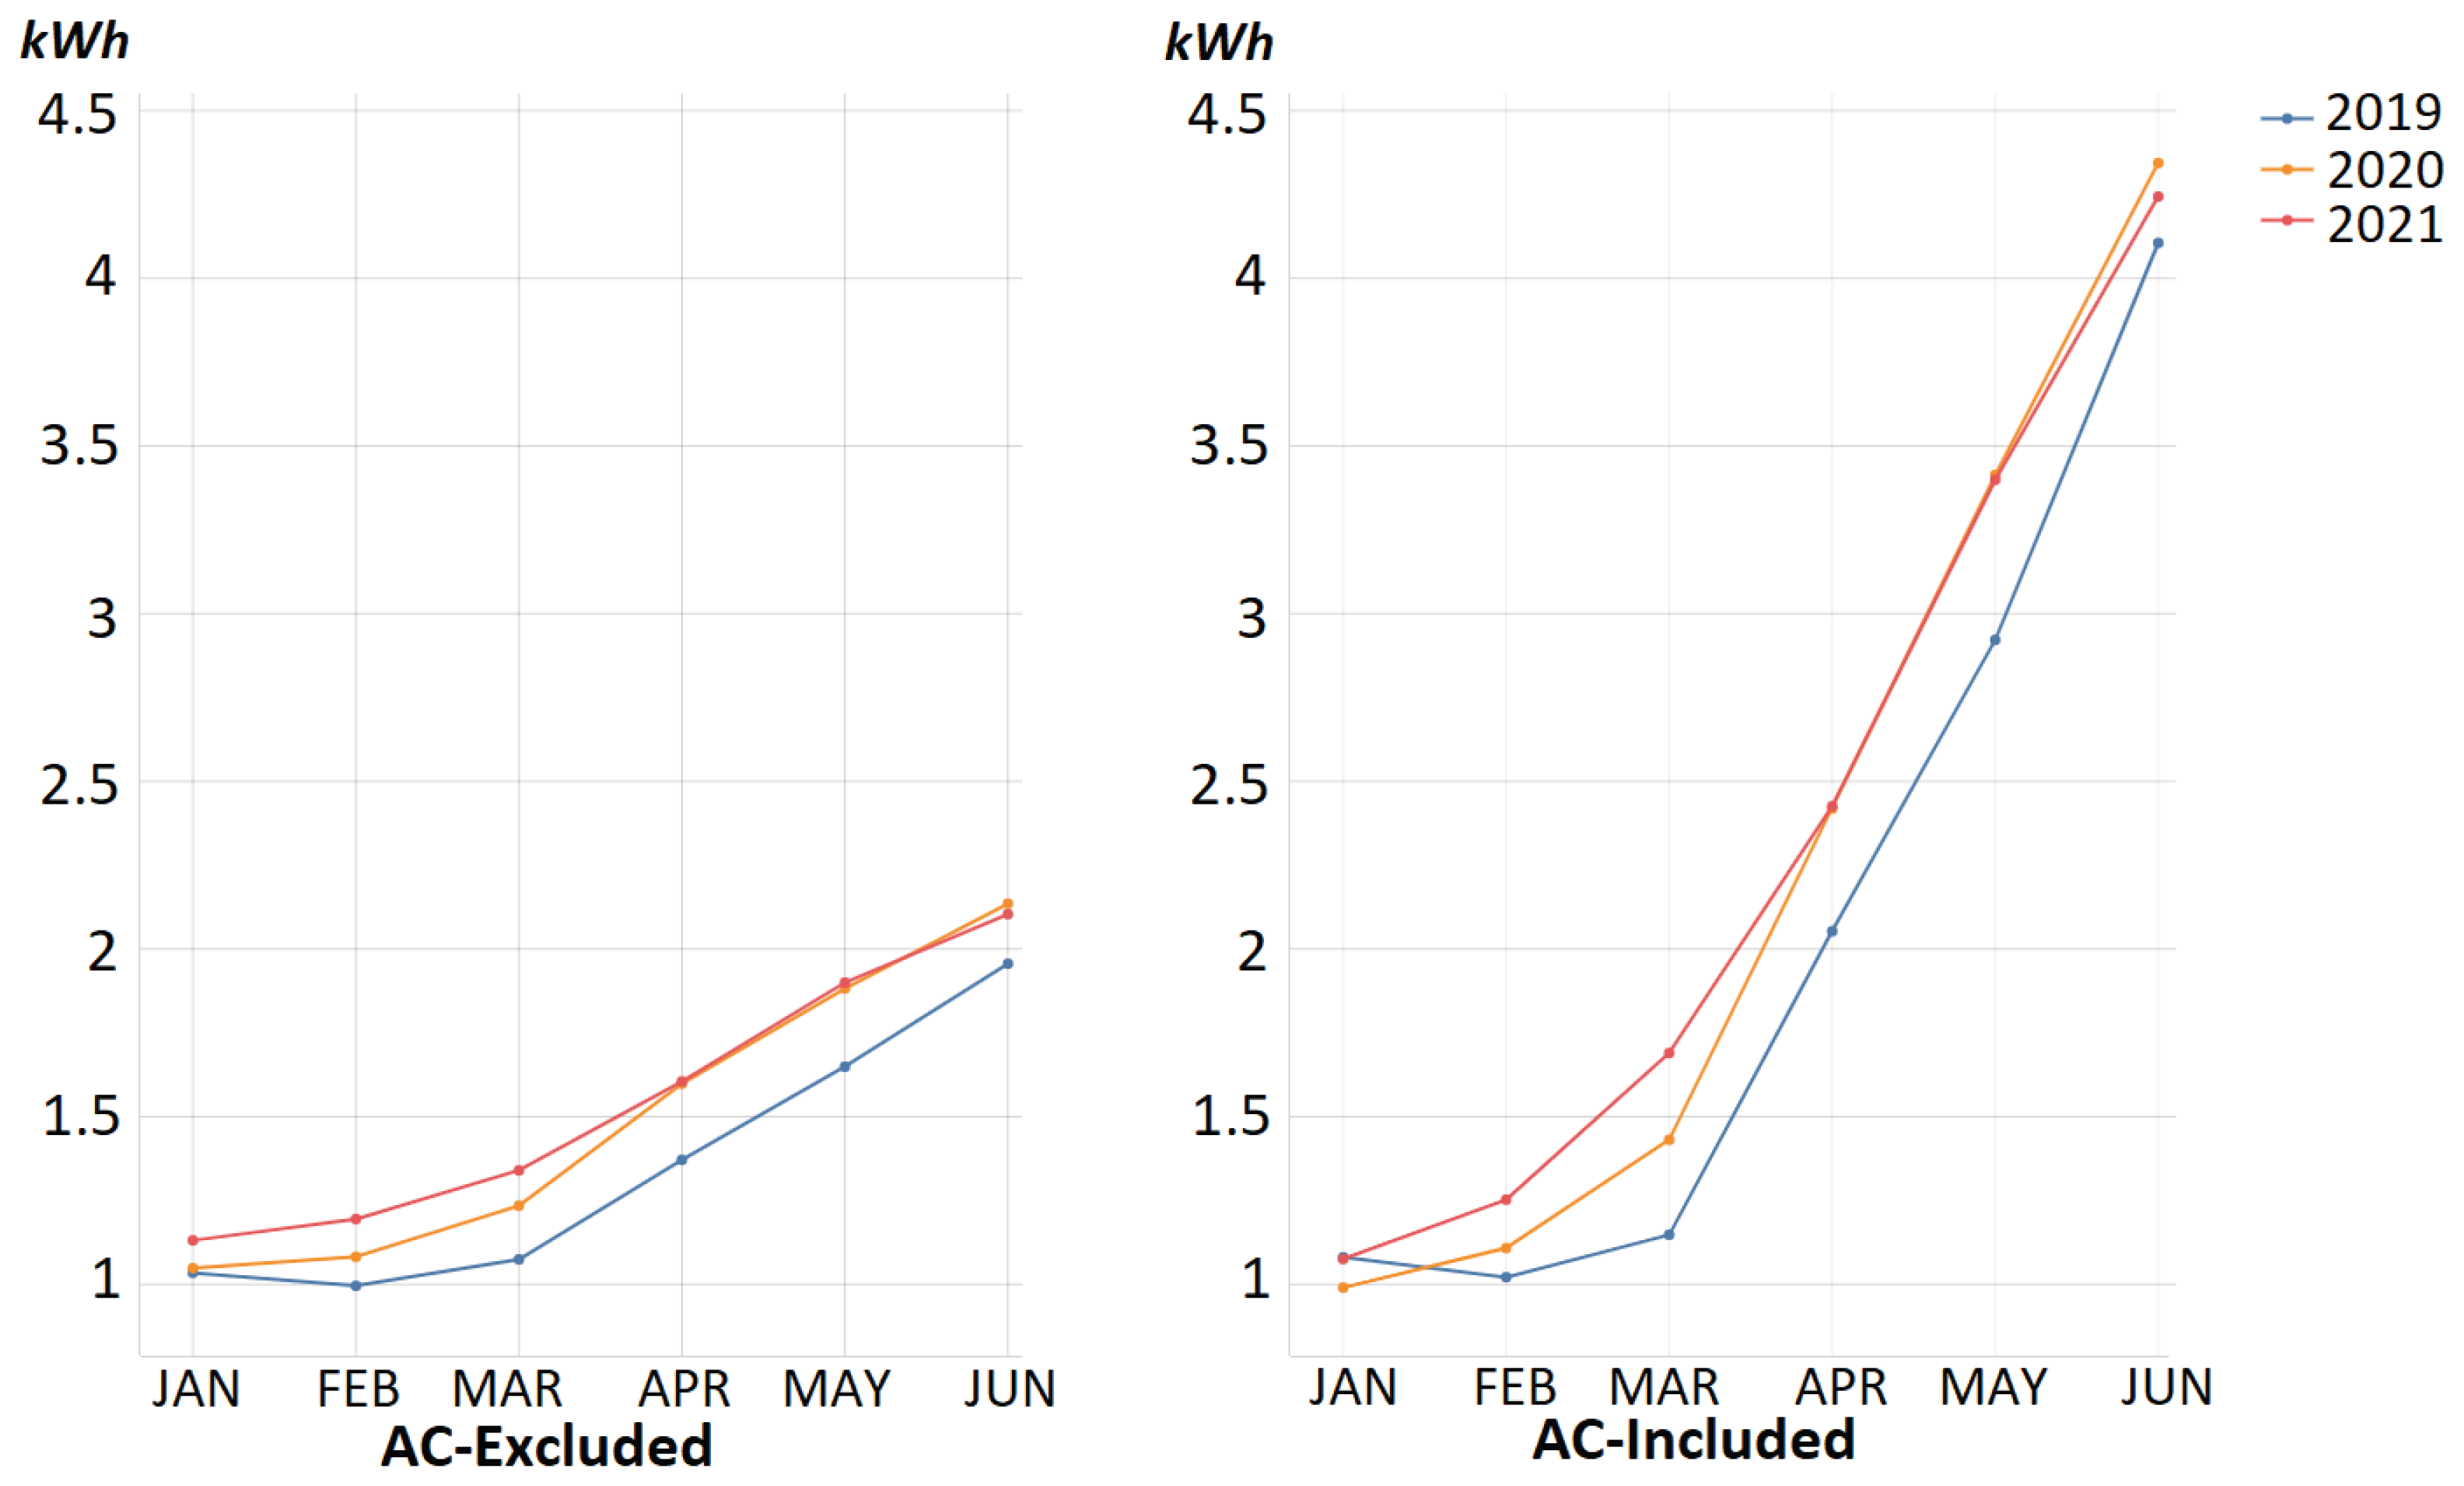
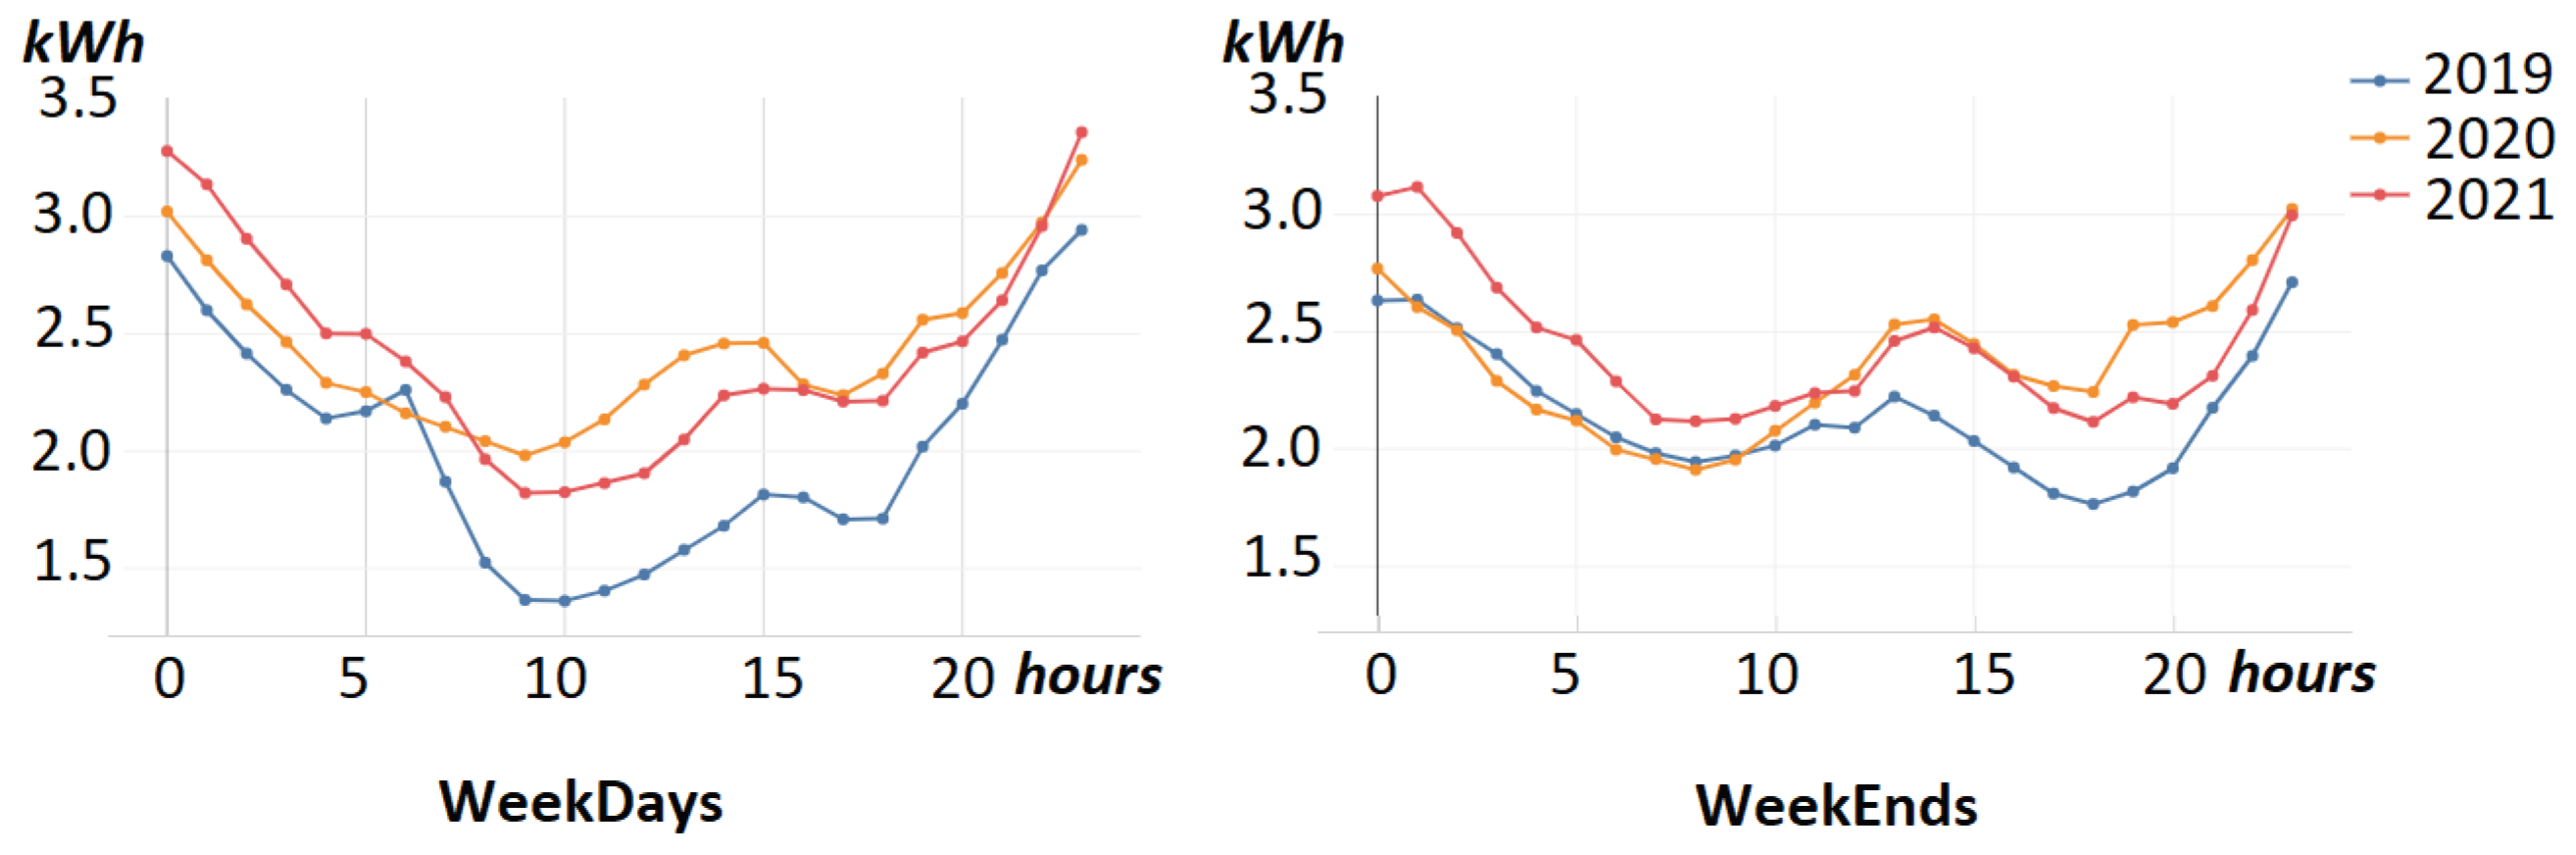
4.1.5. Comparison of the Consumption Profile across Analogous Periods
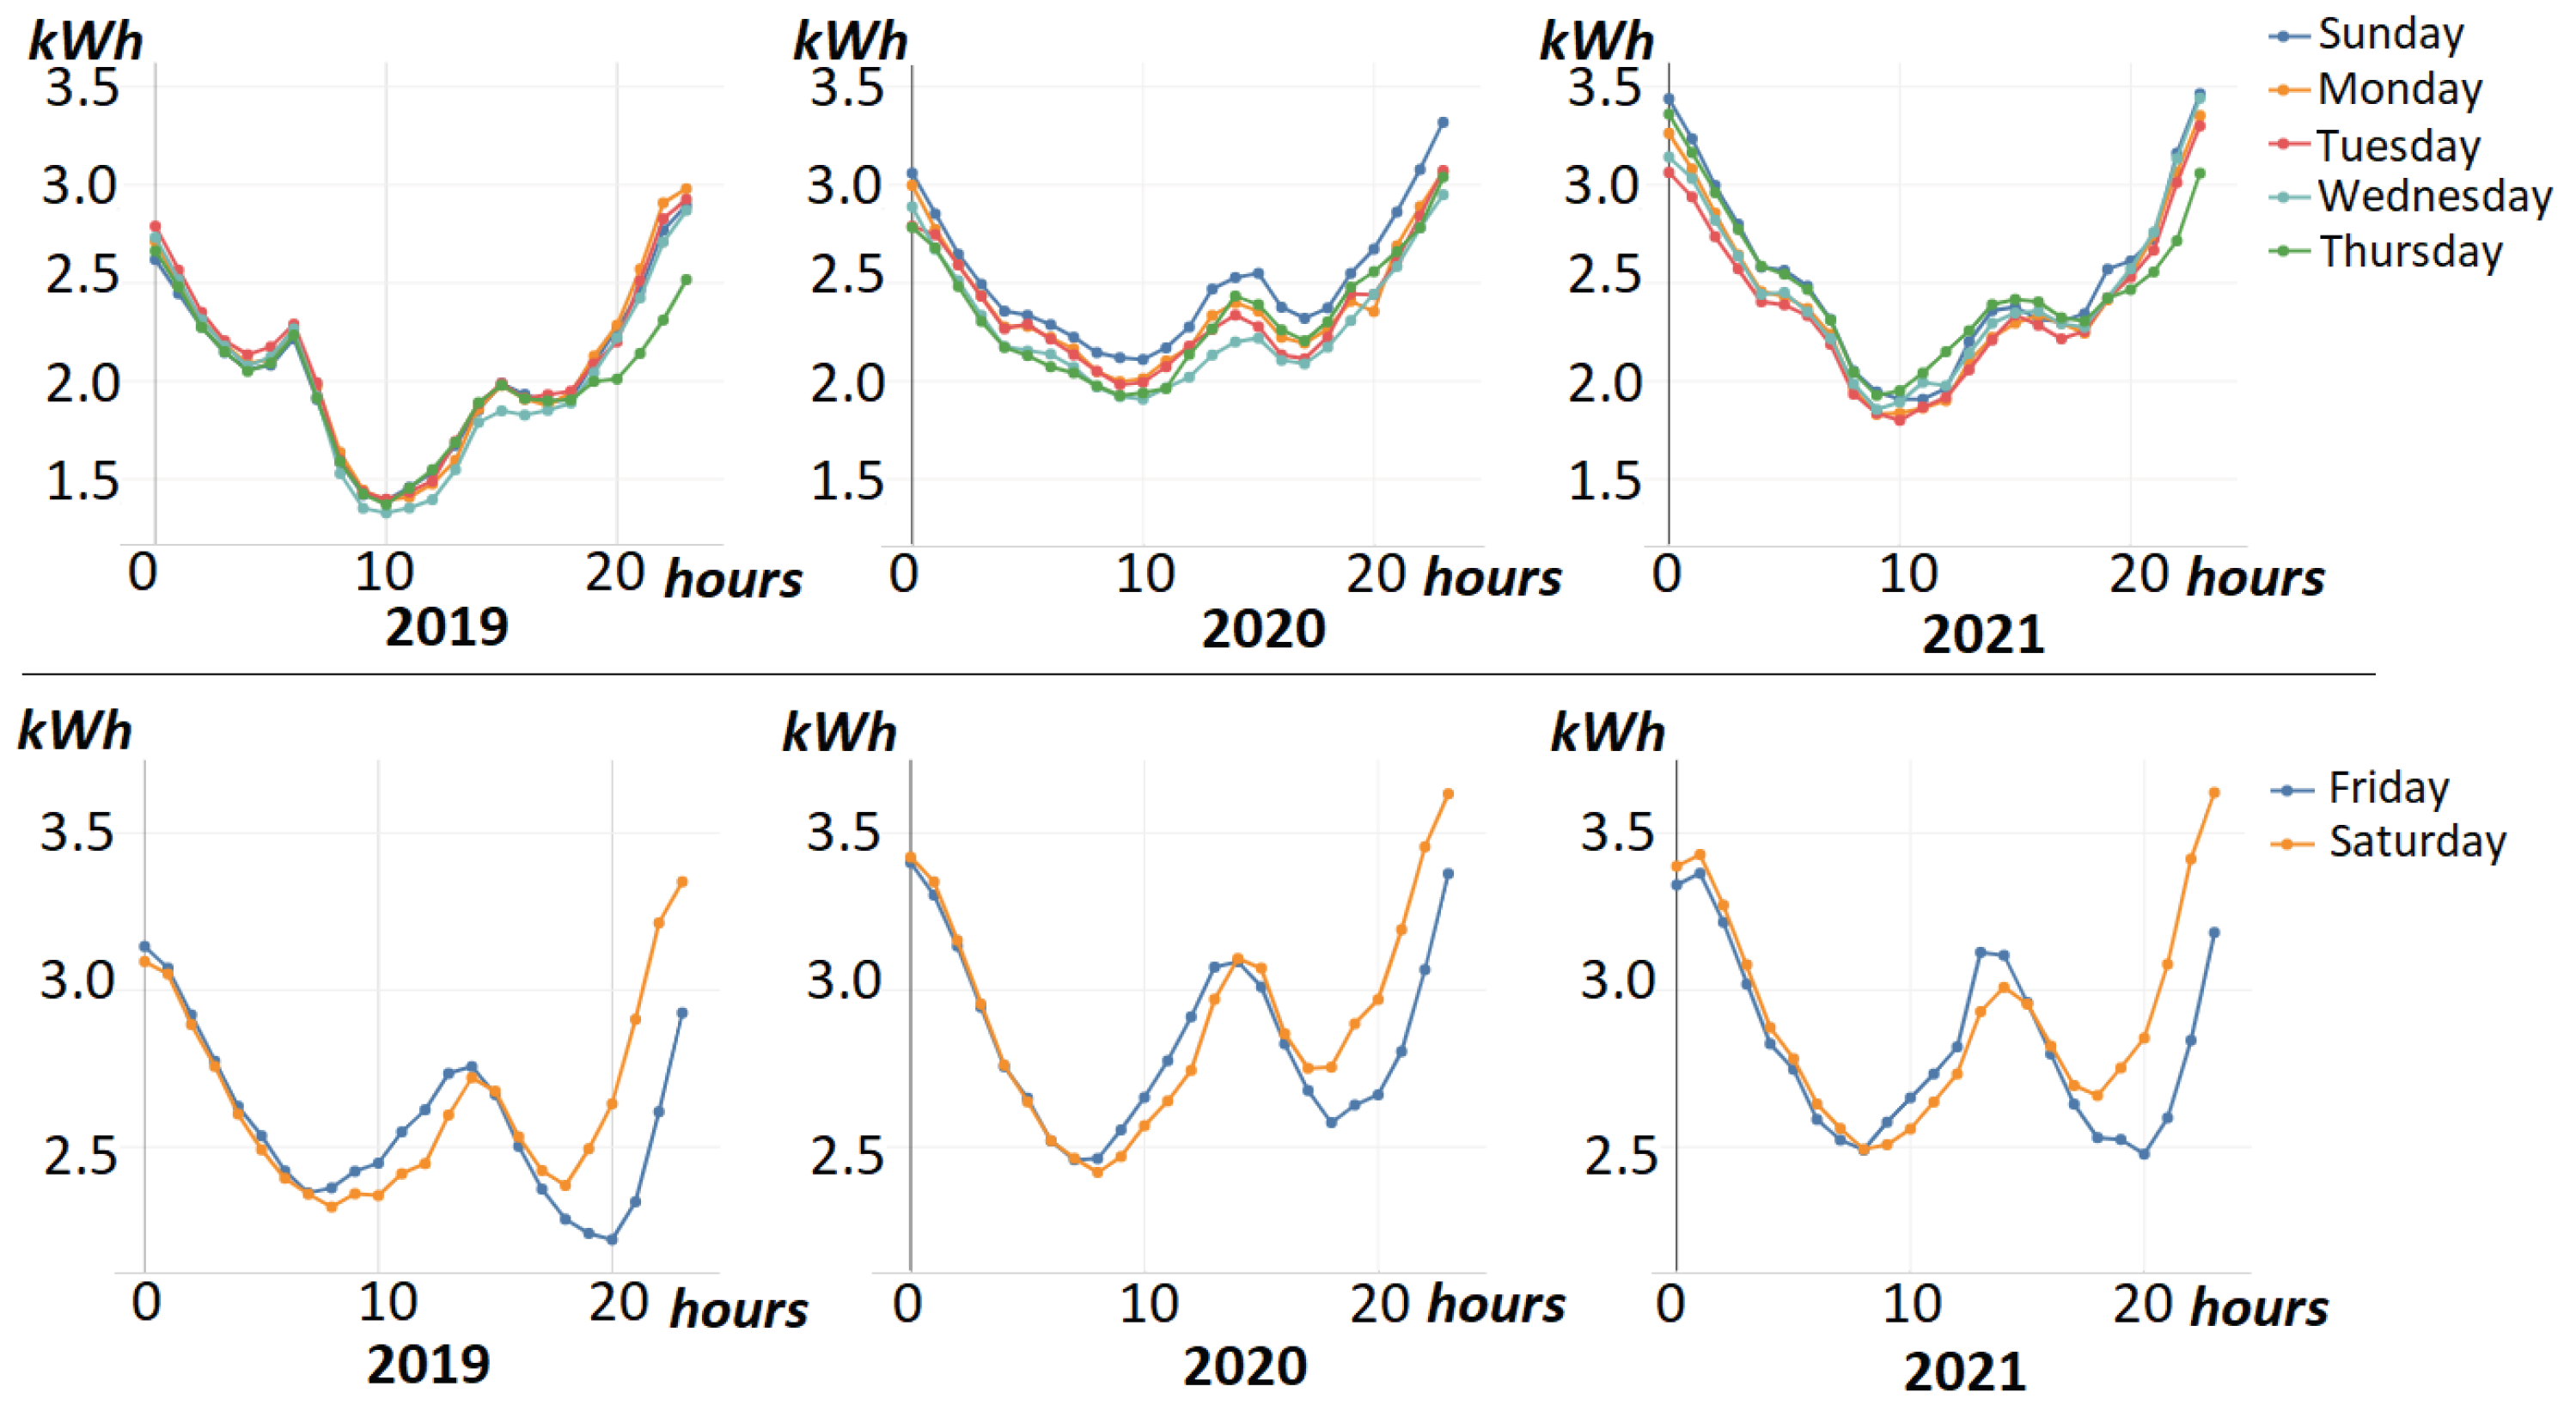
Comparison between Weekdays
Comparison between Weekends
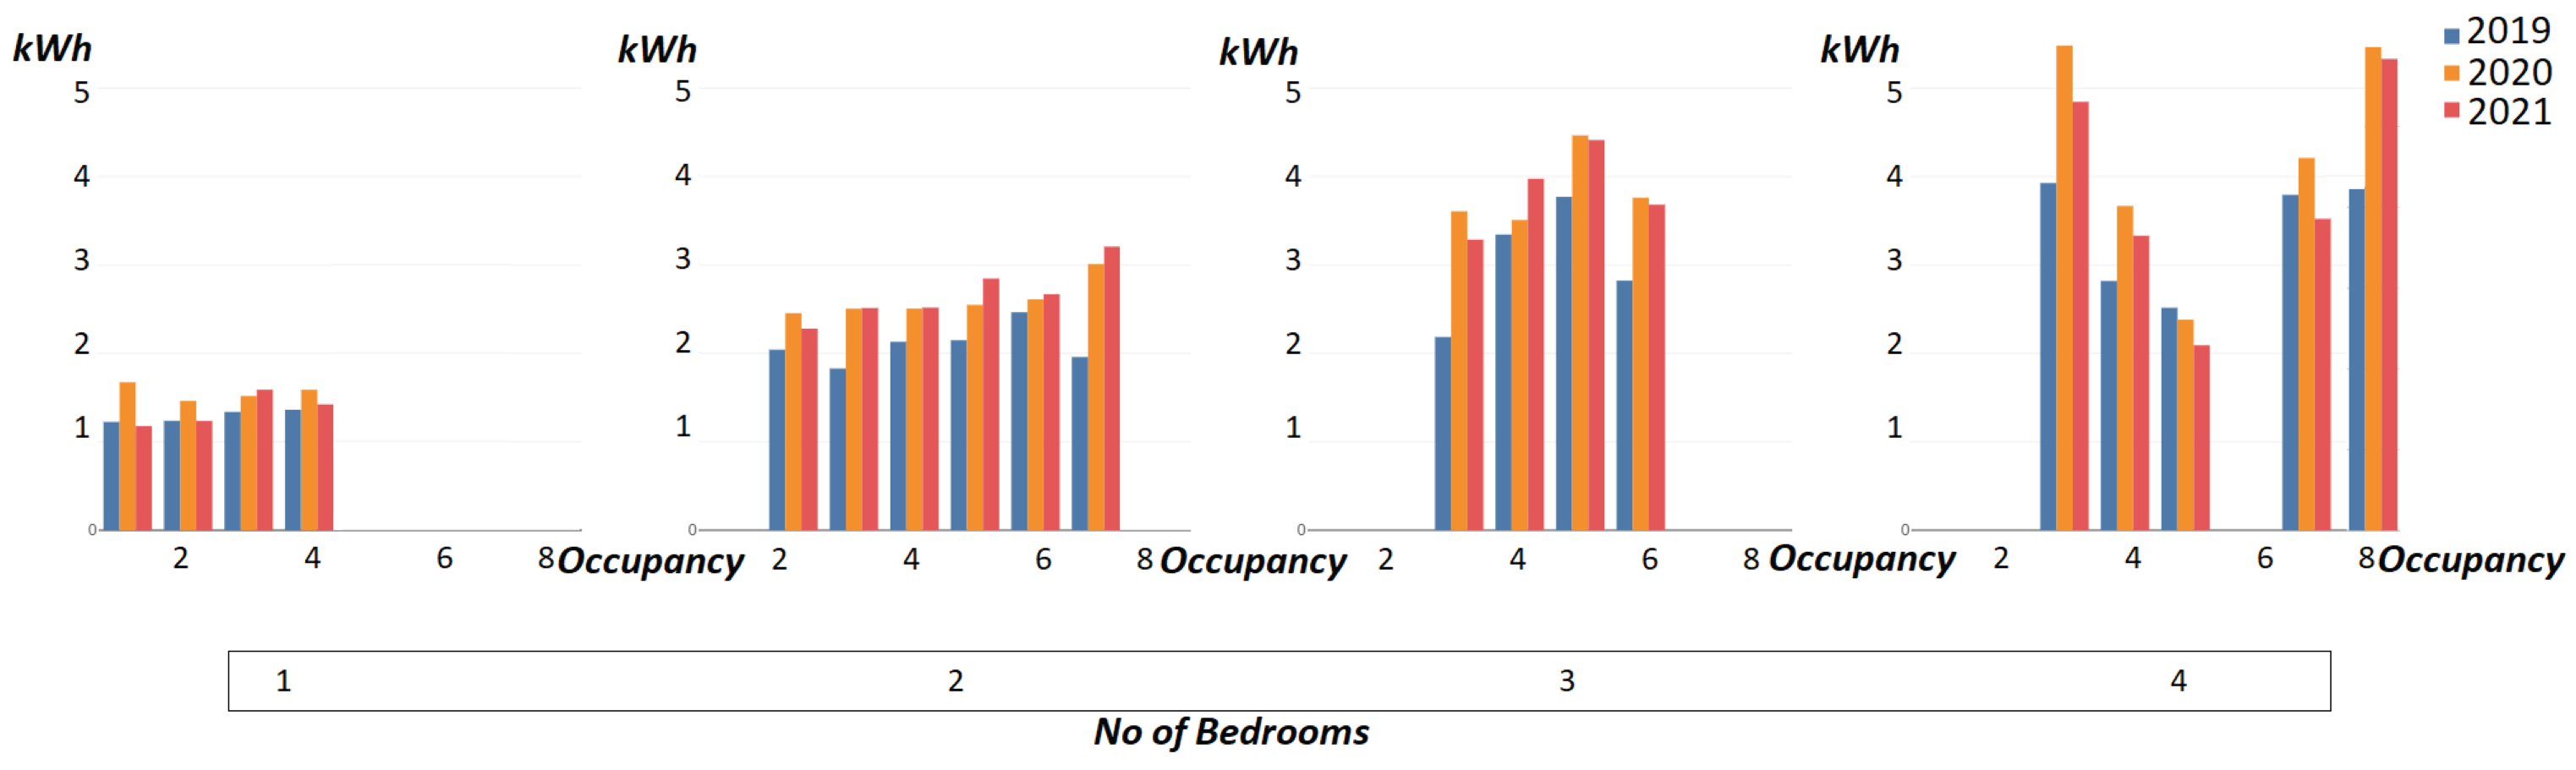
Consumption vs. Occupancy in Bedrooms
4.1.6. Discussion and Summary of the Analysis
- Residential energy consumption during and after 2020 has increased, especially during the day, compared to previous years (i.e., 2018 and 2019).
- There has been an up-shift in consumption by 12% since the COVID-19 era.
- Seasonality effects of temperature were observed in consumption data for AC-included consumers.
- The mean electricity consumption increased with the temperature increase as more cooling is required to maintain thermal comfort.
- The mean electricity consumption among Dubai residents/households increased despite the temperature effects and considering the full occupancy during the full lockdown period compared to the pre-lockdown period.
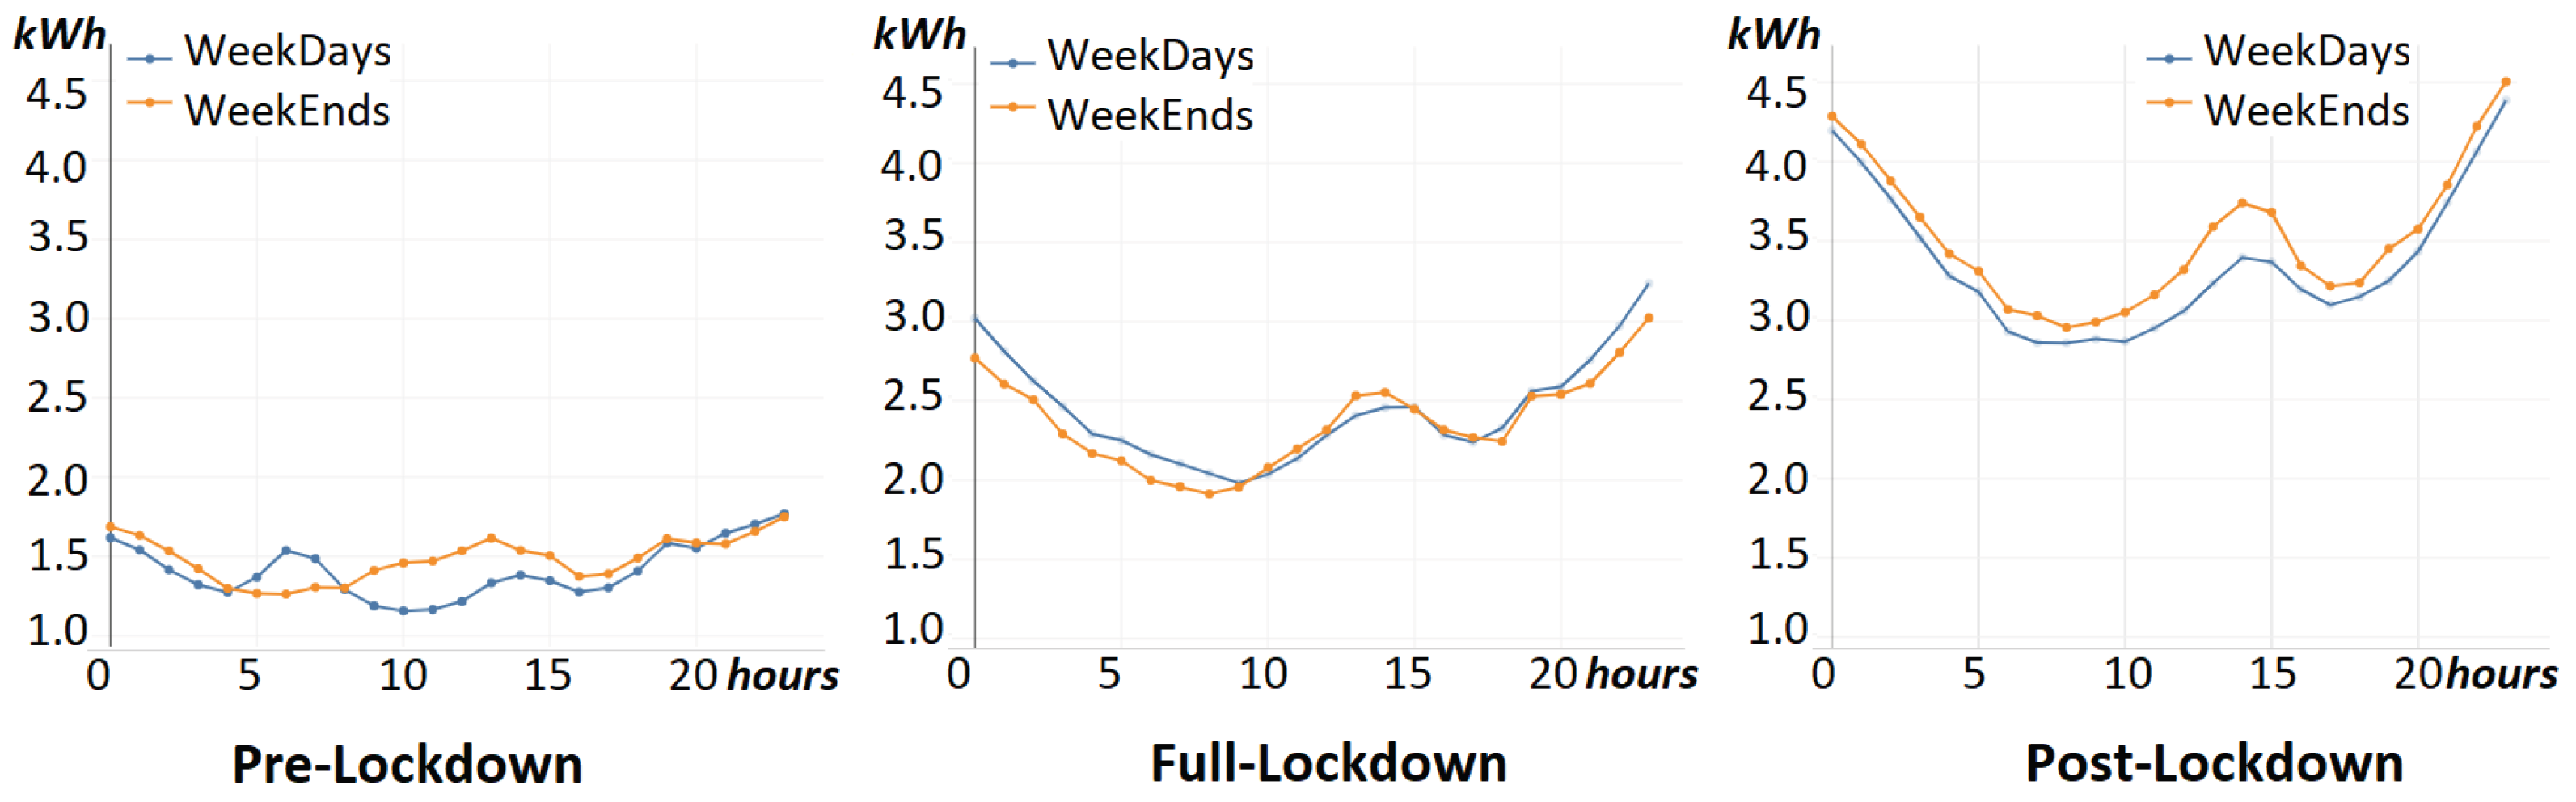
- The mean consumption profiles of consumers during Weekdays and Weekends were similar throughout the full lockdown period.
- The mean consumption profiles of consumers across all working days had similar profiles in the full lockdown period.
4.2. Electricity Demand Modeling
4.2.1. Feature Selection and Modeling
4.2.2. Feature Analysis
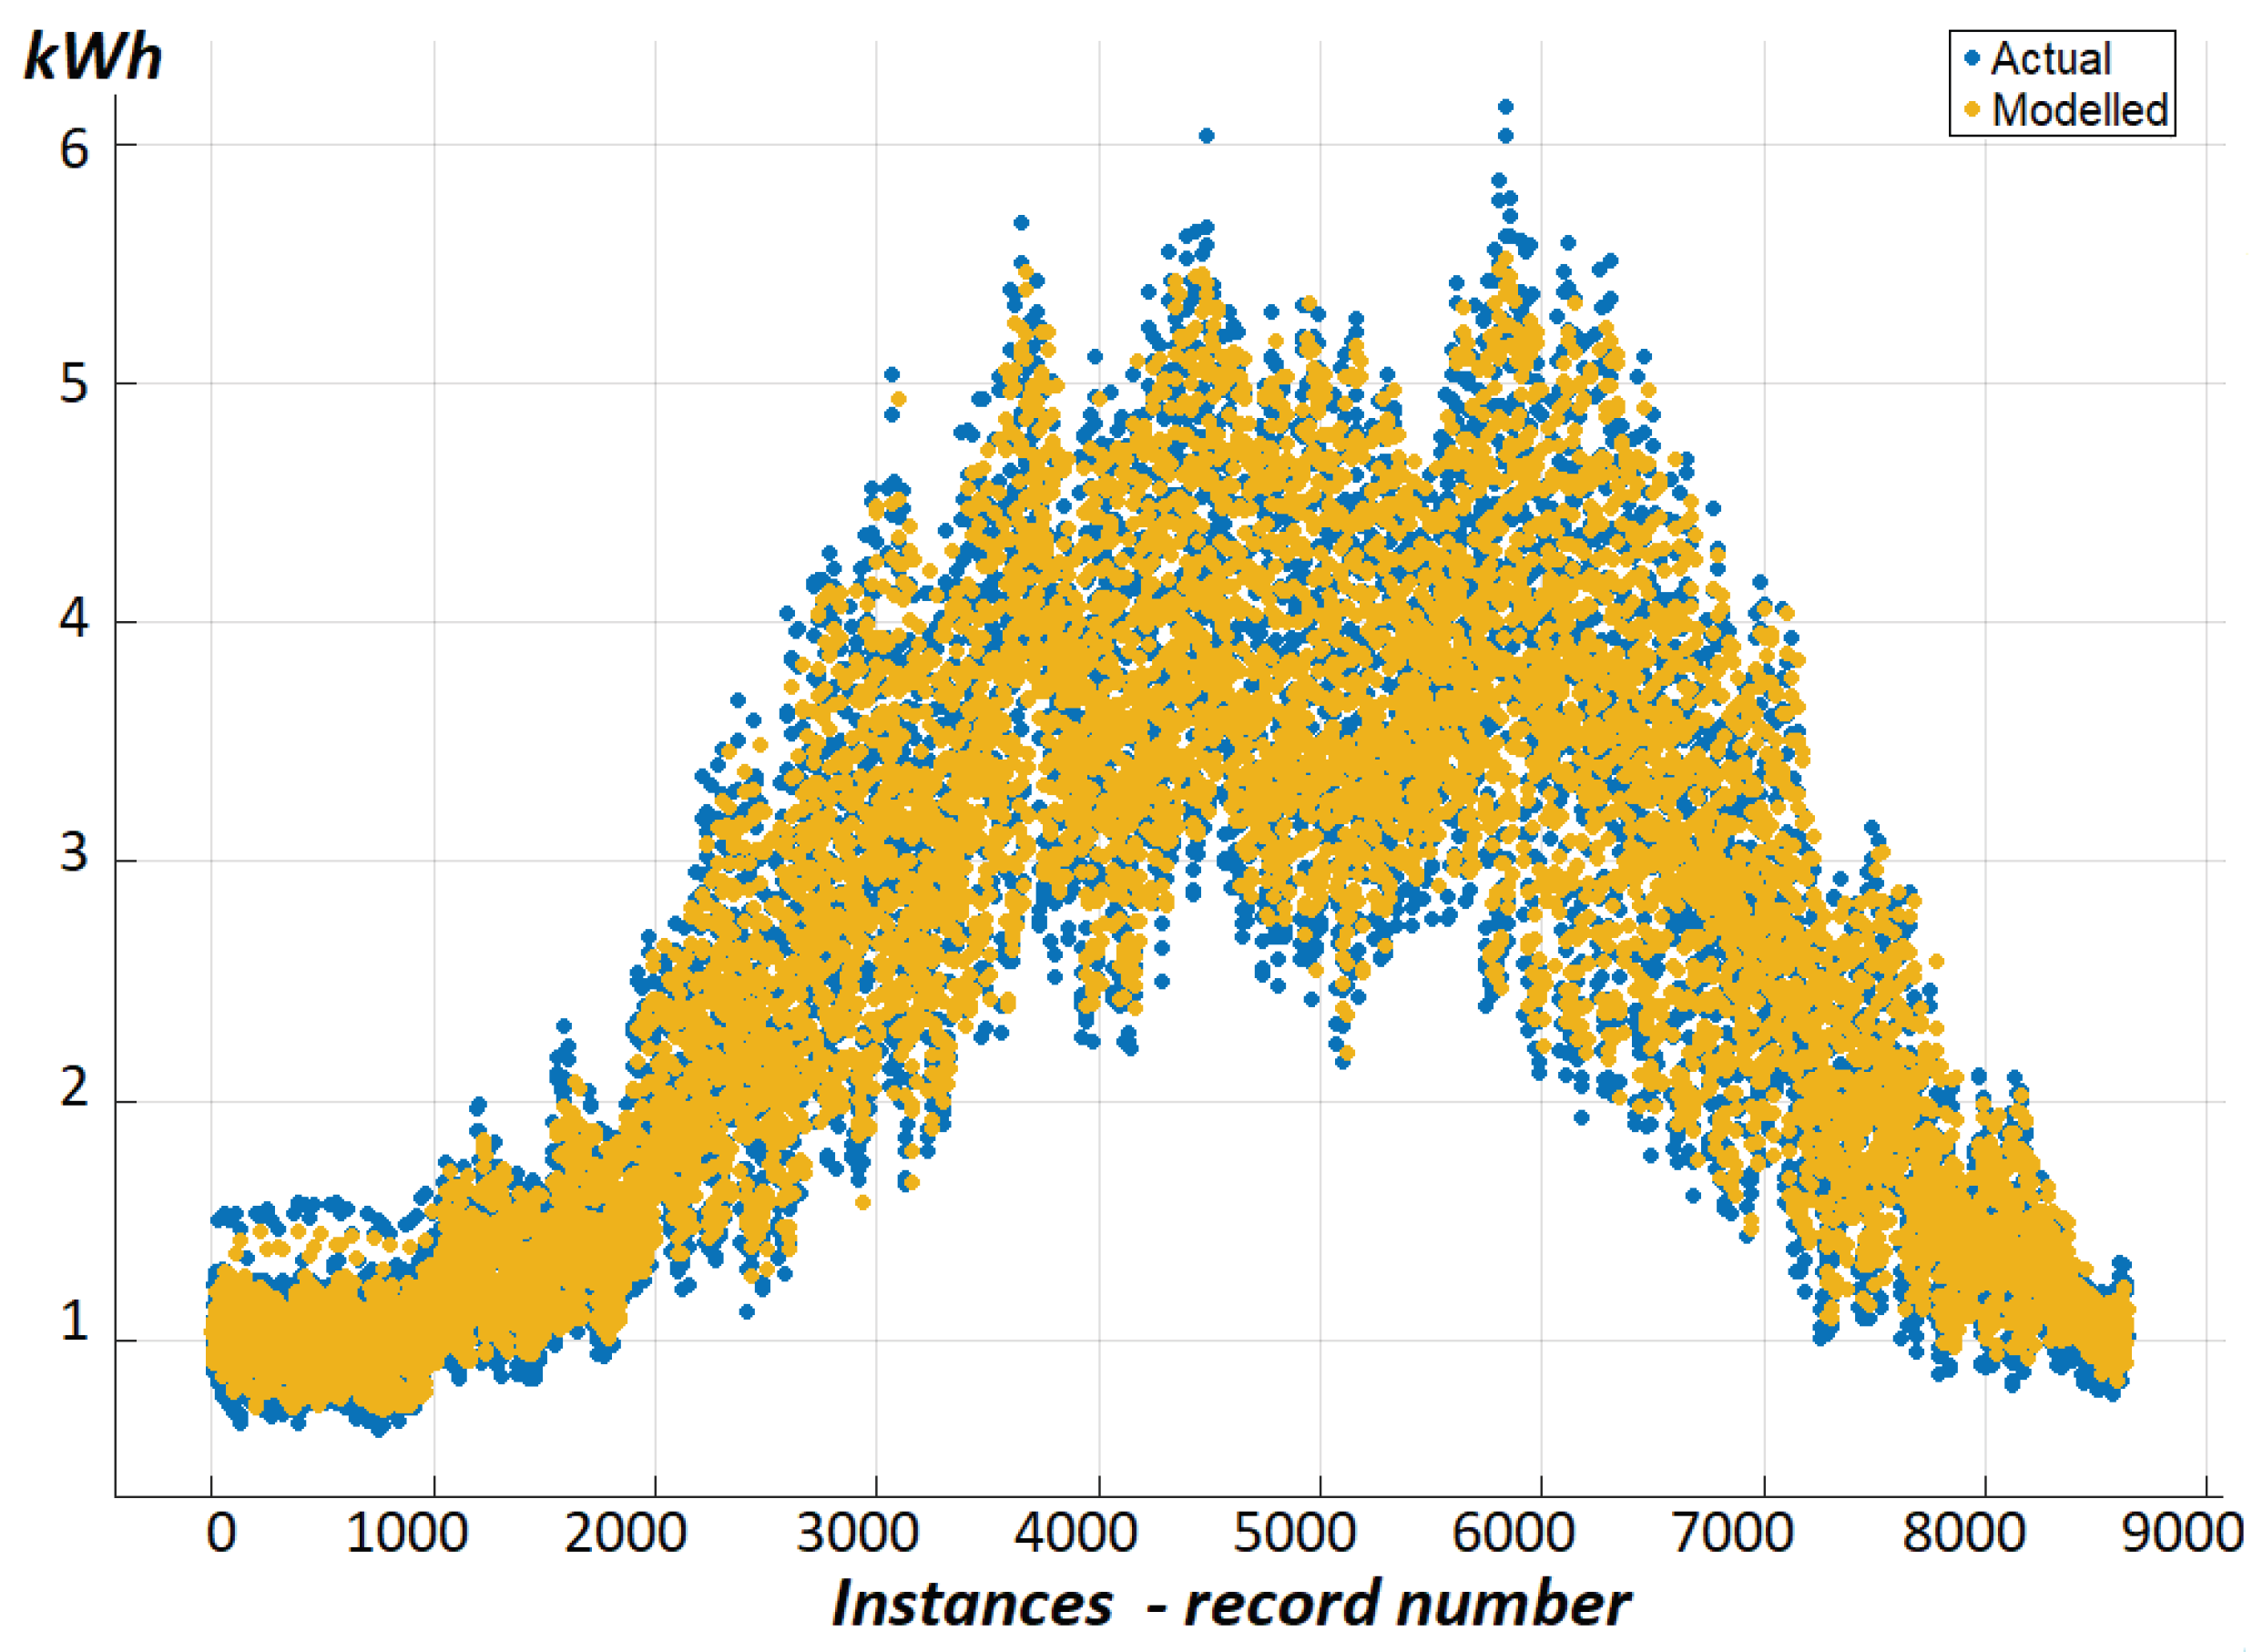
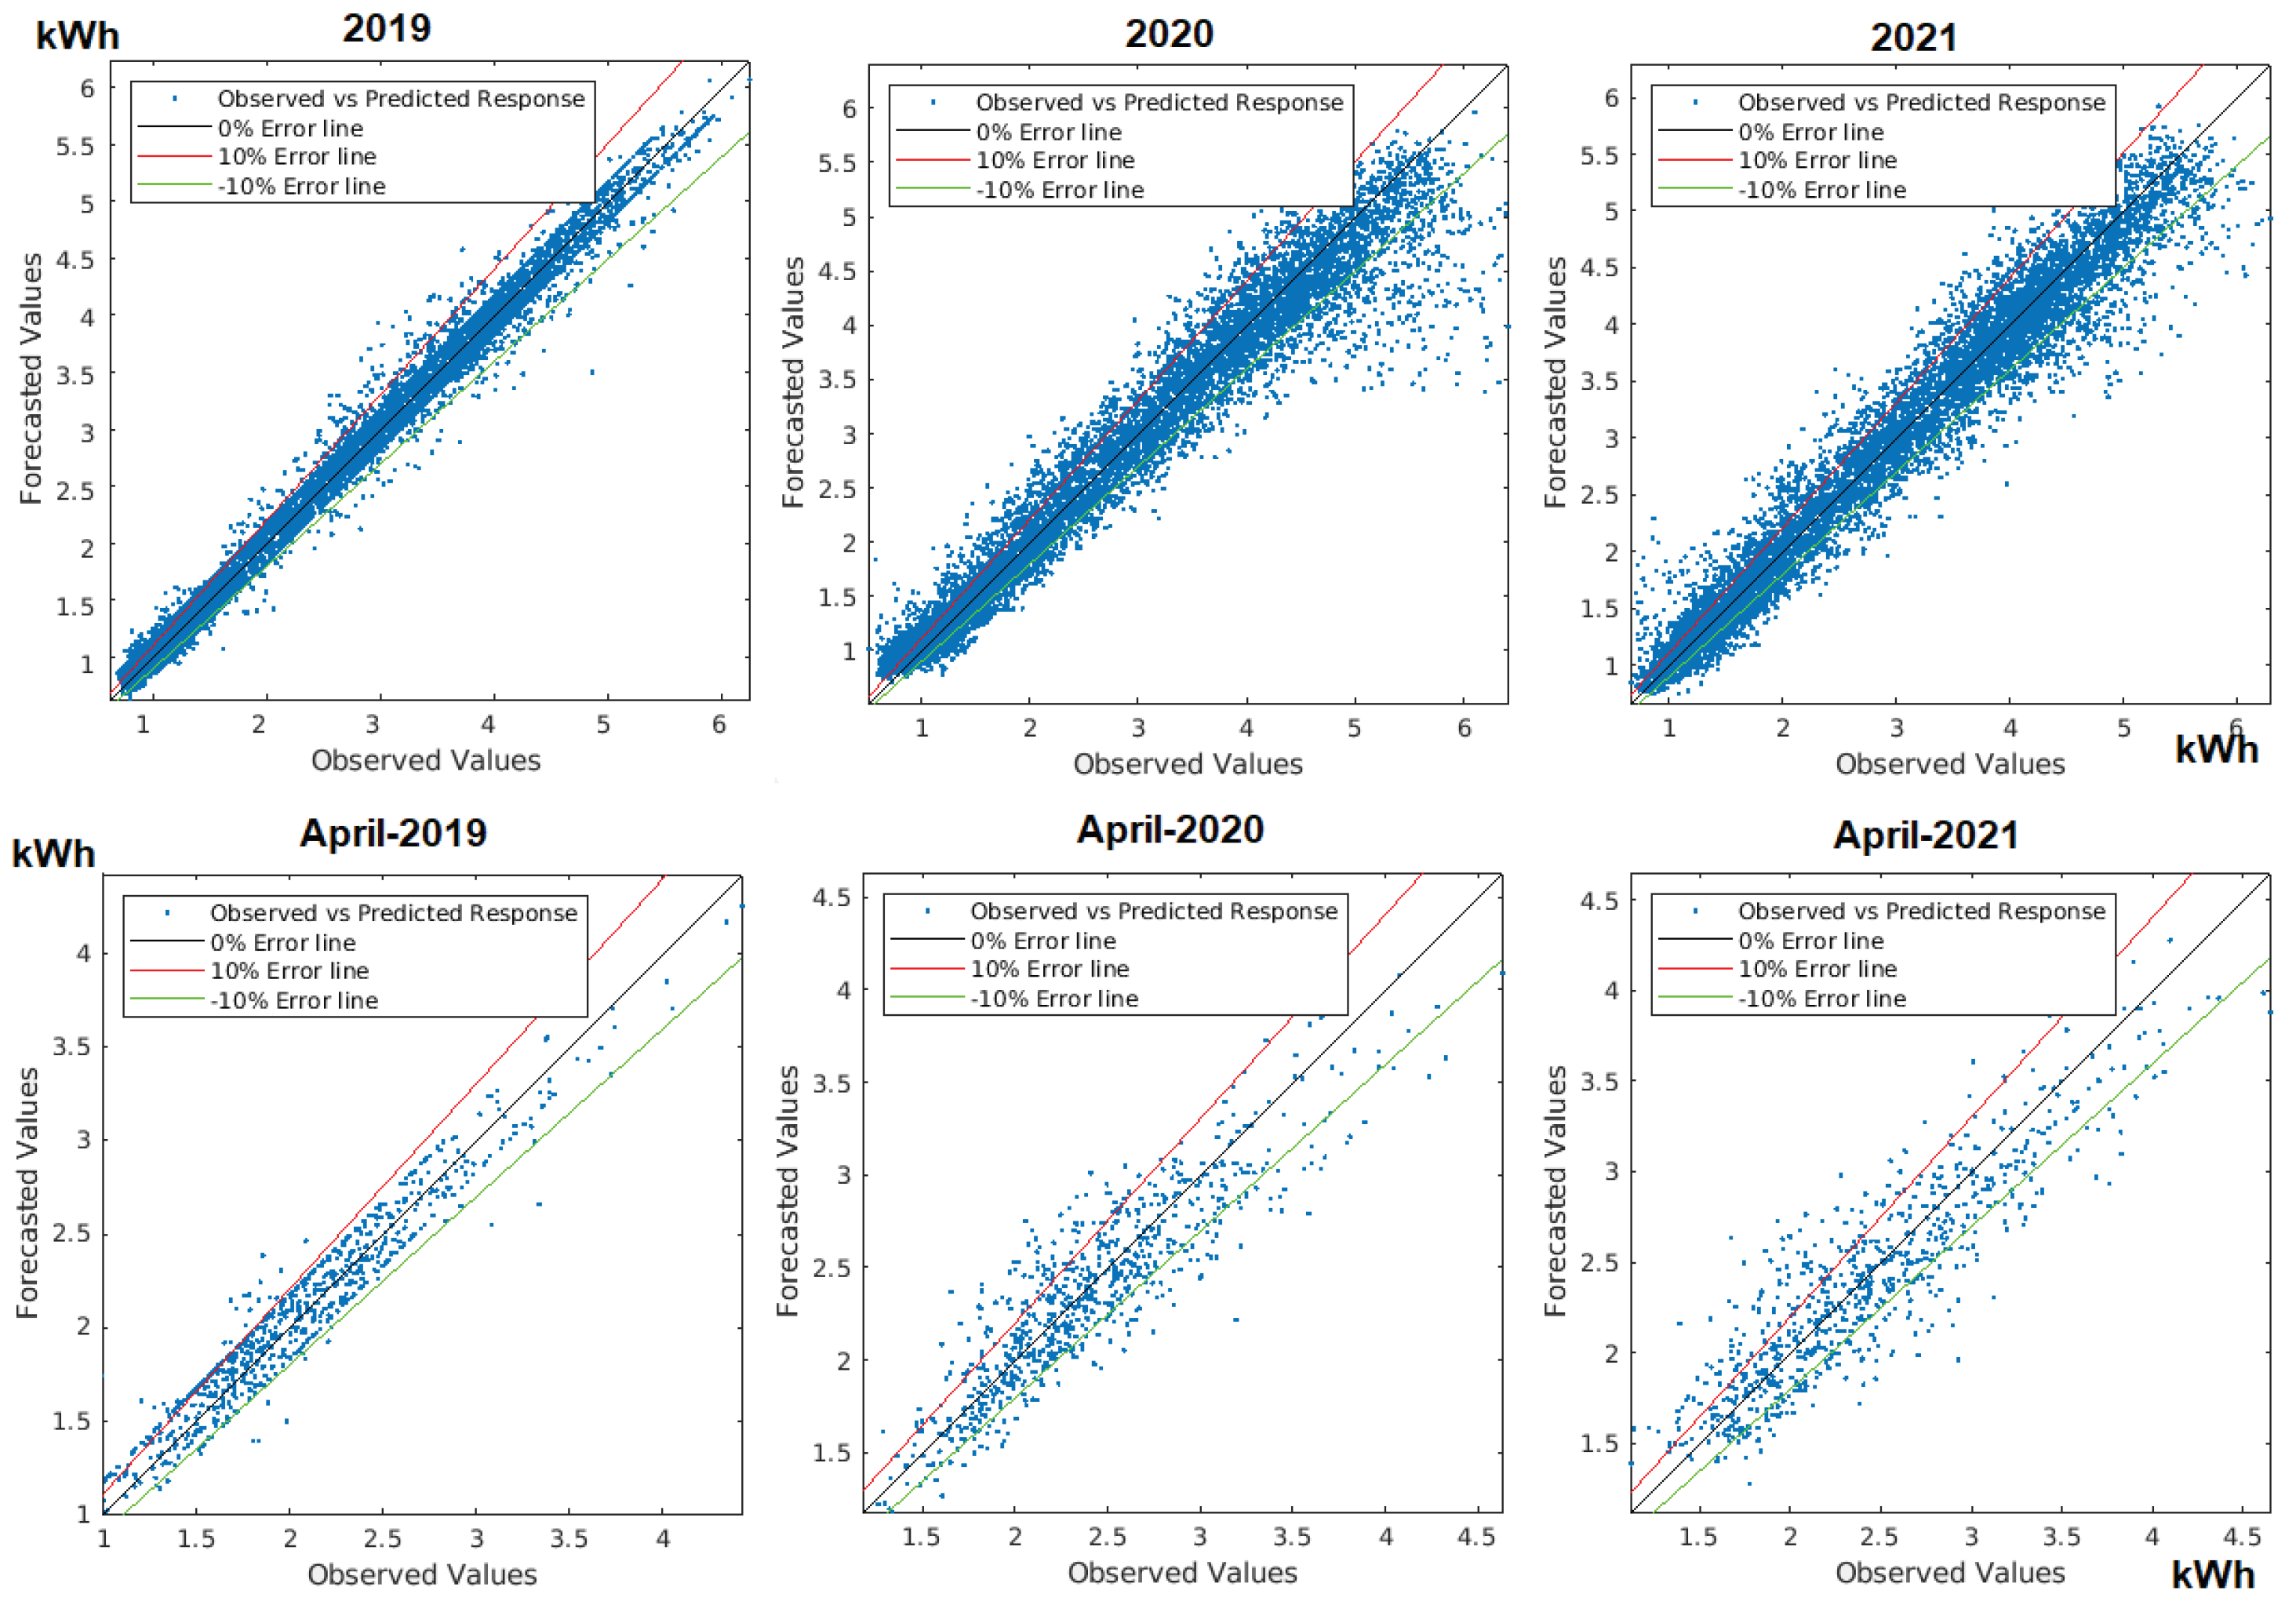
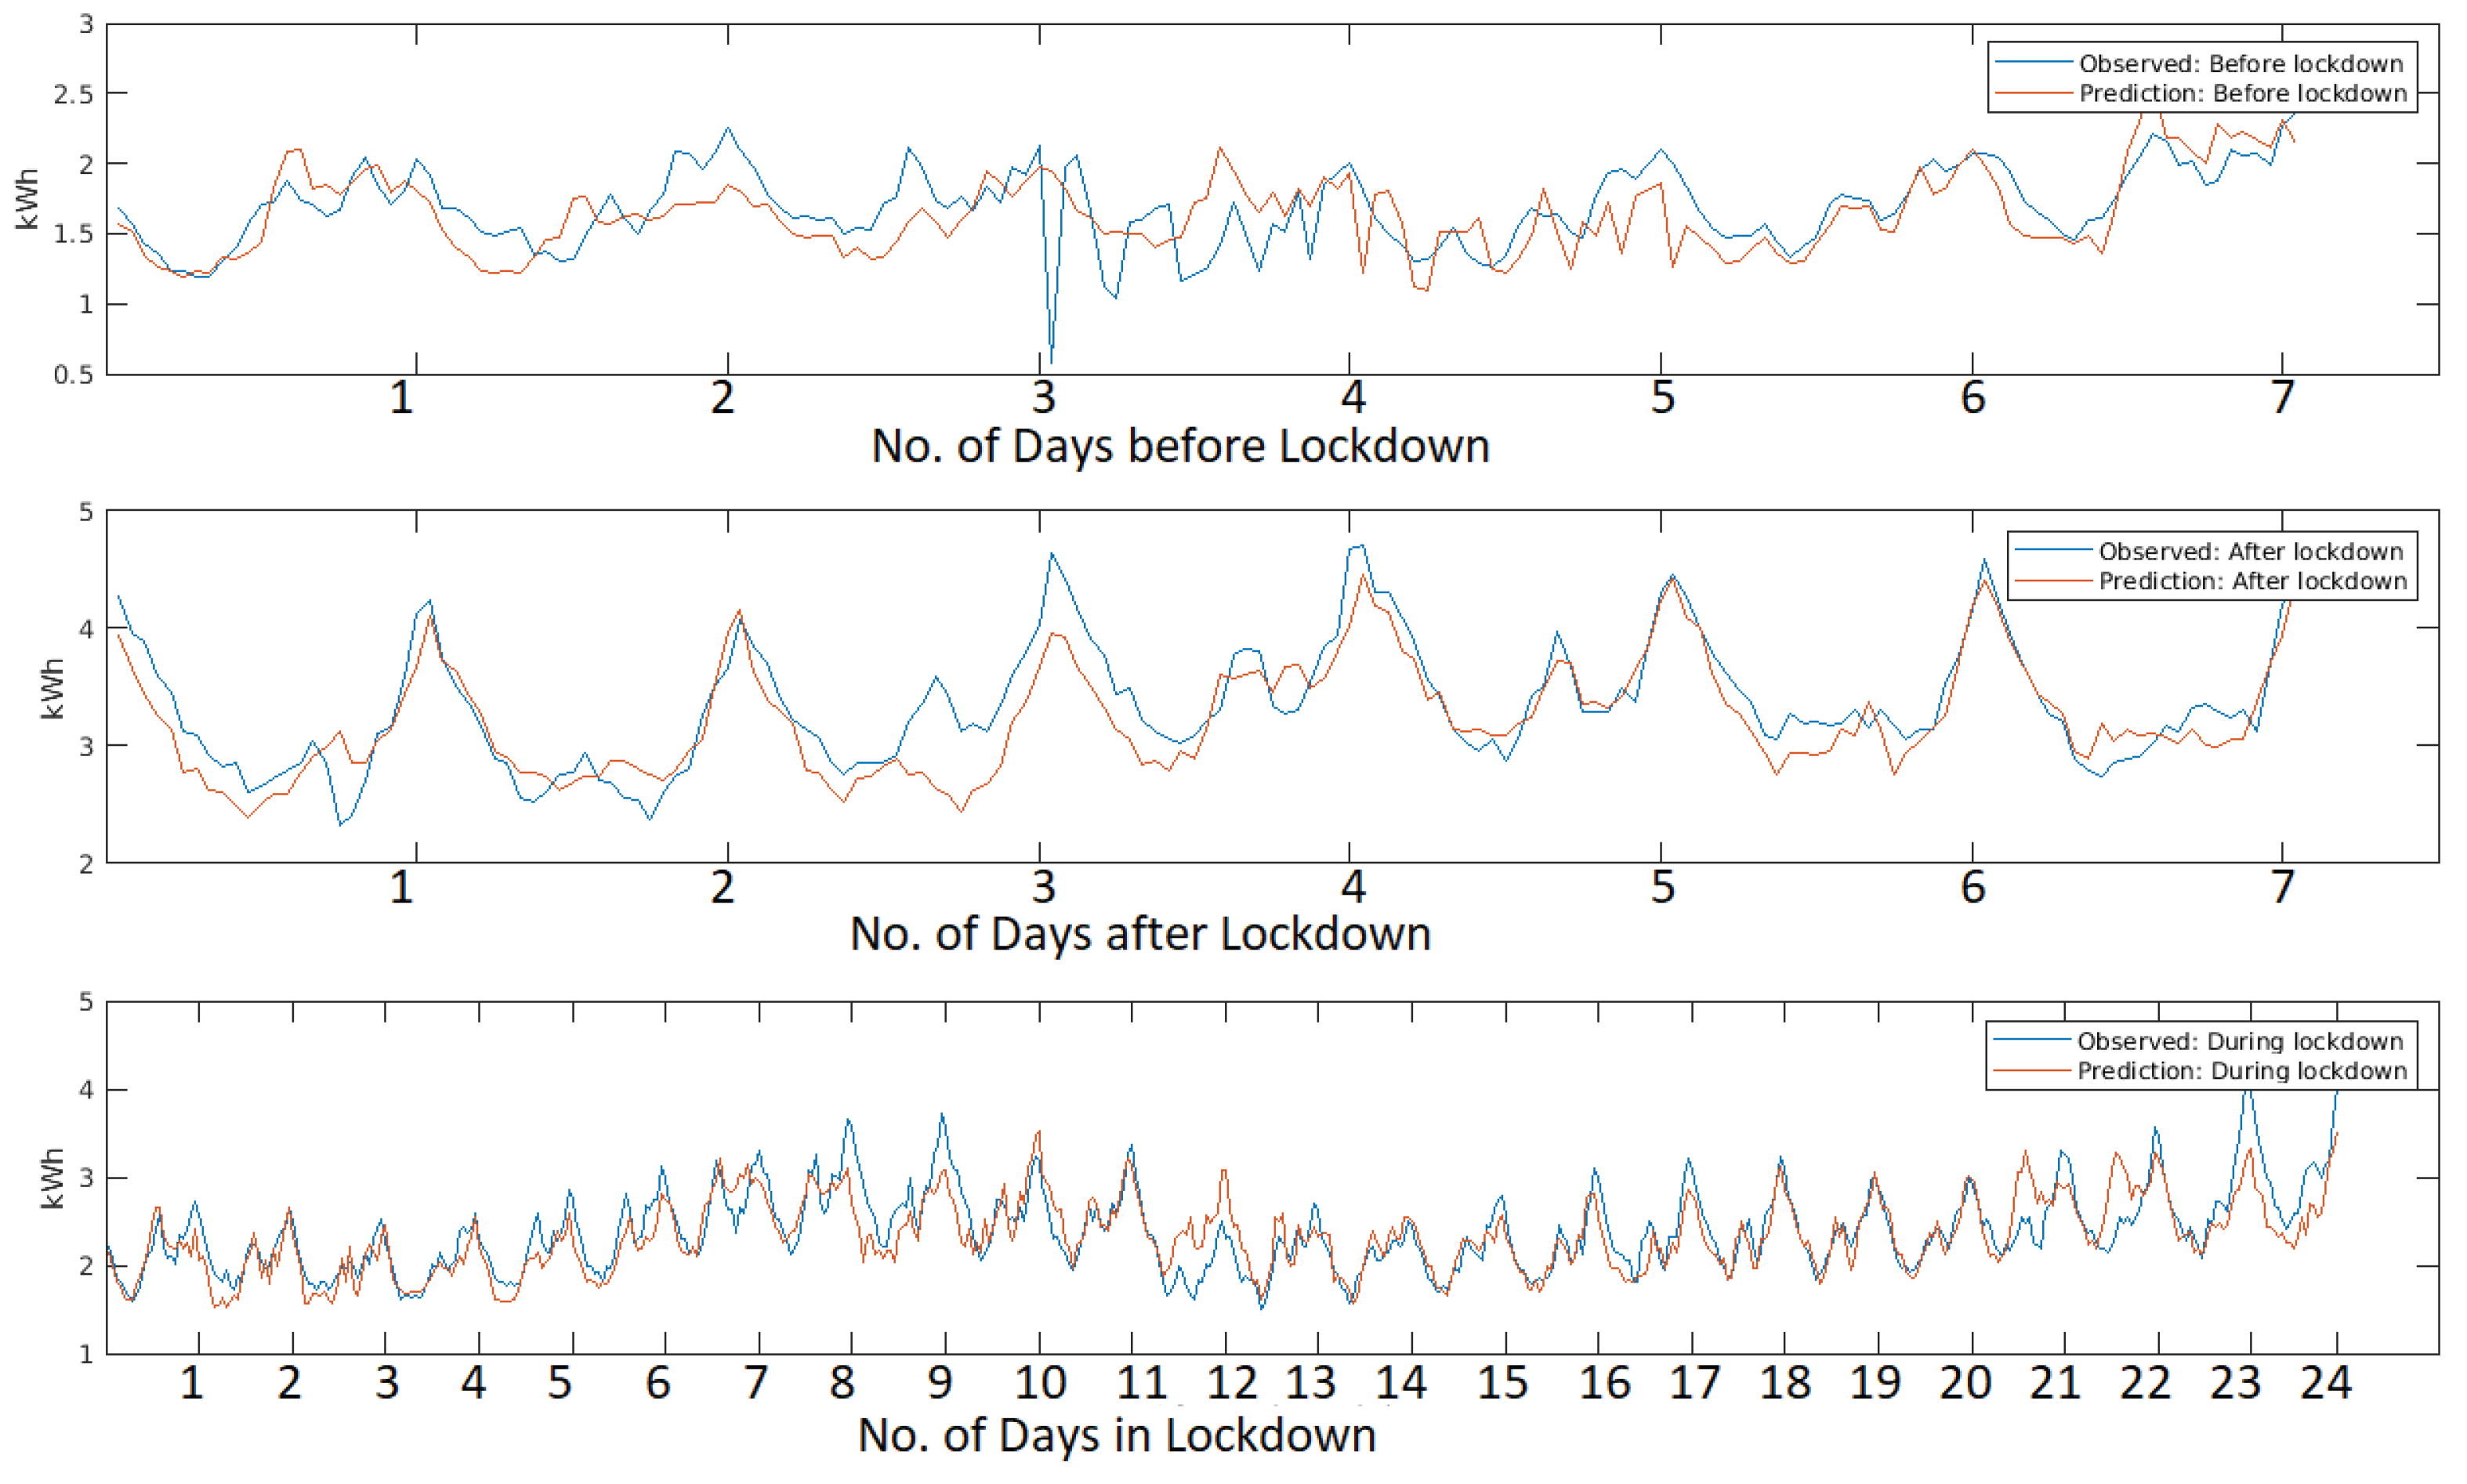
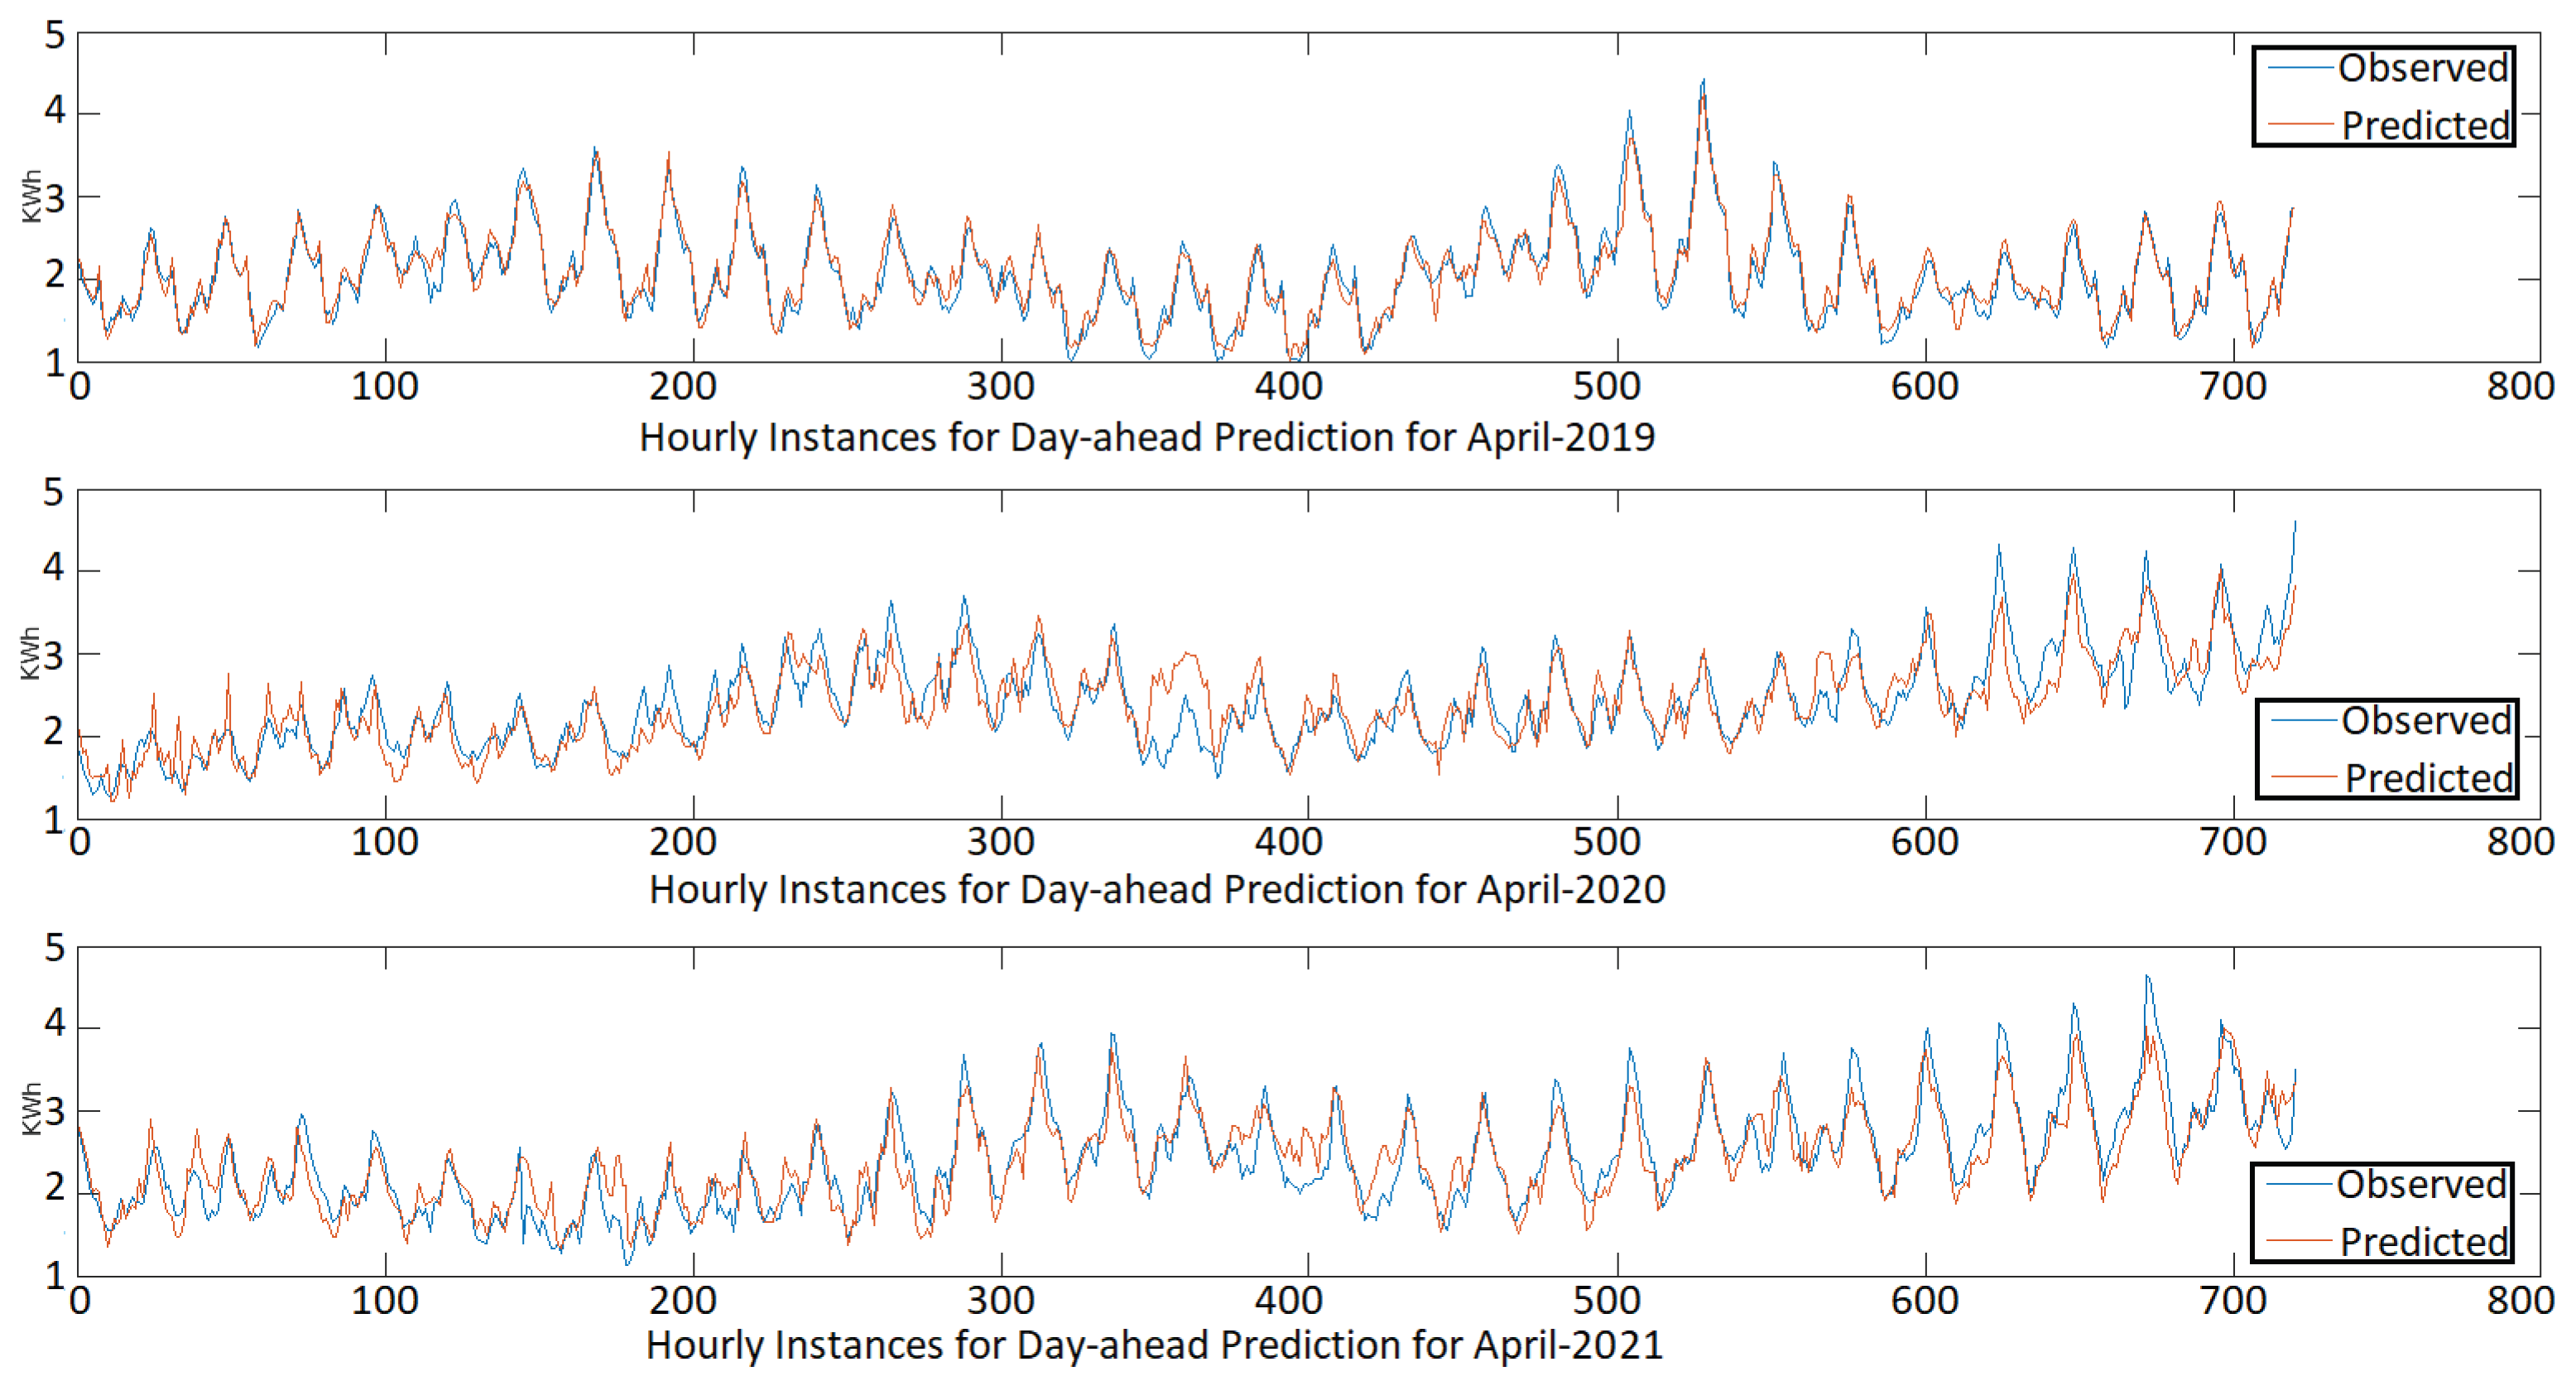
4.2.3. Results and Discussion
4.2.4. Comparison of Machine Learning vs. Deep Learning Results
4.2.5. Limitations
5. Conclusions and Future Works
Author Contributions
Funding
Data Availability Statement
Acknowledgments
Conflicts of Interest
References
- Worldometers. COVID-19 Coronavirus Pandemic. Available online: https://www.worldometers.info/coronavirus/ (accessed on 15 November 2022).
- Krarti, M.; Aldubyan, M. Review analysis of COVID-19 impact on electricity demand for residential buildings. Renew. Sustain. Energy Rev. 2021, 143, 110888. [Google Scholar] [CrossRef] [PubMed]
- Enerdata. Global Energy Statistical Yearbook 2021. Available online: https://yearbook.enerdata.net/total-energy/world-consumption-statistics.html (accessed on 15 November 2022).
- Bulut, M. Analysis of the COVID-19 impact on electricity consumption and production. Sak. Univ. J. Comput. Inf. Sci. 2020, 3, 283–295. [Google Scholar]
- Bahmanyar, A.; Estebsari, A.; Ernst, D. The impact of different COVID-19 containment measures on electricity consumption in Europe. Energy Res. Soc. Sci. 2020, 68, 101683. [Google Scholar] [CrossRef] [PubMed]
- Le Quéré, C.; Jackson, R.B.; Jones, M.W.; Smith, A.J.; Abernethy, S.; Andrew, R.M.; De-Gol, A.J.; Willis, D.R.; Shan, Y.; Canadell, J.G.; et al. Temporary reduction in daily global CO2 emissions during the COVID-19 forced confinement. Nat. Clim. Chang. 2020, 10, 647–653. [Google Scholar] [CrossRef]
- IEA. Global Energy Review; IEA: Paris, France, 2021; Available online: https://www.iea.org/reports/global-energy-review-2021 (accessed on 15 November 2022).
- Jiang, P.; Van Fan, Y.; Klemeš, J.J. Impacts of COVID-19 on energy demand and consumption: Challenges, lessons and emerging opportunities. Appl. Energy 2021, 285, 116441. [Google Scholar] [CrossRef]
- Fareed, Z.; Iqbal, N.; Shahzad, F.; Shah, S.G.M.; Zulfiqar, B.; Shahzad, K.; Hashmi, S.H.; Shahzad, U. Co-variance nexus between COVID-19 mortality, humidity, and air quality index in Wuhan, China: New insights from partial and multiple wavelet coherence. Air Qual. Atmos. Health 2020, 13, 673–682. [Google Scholar] [CrossRef]
- Norouzi, N.; de Rubens, G.Z.; Choupanpiesheh, S.; Enevoldsen, P. When pandemics impact economies and climate change: Exploring the impacts of COVID-19 on oil and electricity demand in China. Energy Res. Soc. Sci. 2020, 68, 101654. [Google Scholar] [CrossRef]
- Ghiani, E.; Galici, M.; Mureddu, M.; Pilo, F. Impact on electricity consumption and market pricing of energy and ancillary services during pandemic of COVID-19 in Italy. Energies 2020, 13, 3357. [Google Scholar] [CrossRef]
- Czosnyka, M.; Wnukowska, B.; Karbowa, K. Electrical energy consumption and the energy market in Poland during the COVID-19 pandemic. In Proceedings of the 2020 Progress in Applied Electrical Engineering (PAEE), Koscielisko, Poland, 21–26 June 2020; IEEE: Piscataway, NJ, USA, 2020; pp. 1–5. [Google Scholar]
- Snow, S.; Bean, R.; Glencross, M.; Horrocks, N. Drivers behind residential electricity demand fluctuations due to COVID-19 restrictions. Energies 2020, 13, 5738. [Google Scholar] [CrossRef]
- Bielecki, S.; Skoczkowski, T.; Sobczak, L.; Buchoski, J.; Maciąg, Ł.; Dukat, P. Impact of the lockdown during the COVID-19 pandemic on electricity use by residential users. Energies 2021, 14, 980. [Google Scholar] [CrossRef]
- Mofijur, M.; Fattah, I.R.; Alam, M.A.; Islam, A.S.; Ong, H.C.; Rahman, S.A.; Najafi, G.; Ahmed, S.F.; Uddin, M.A.; Mahlia, T.M.I. Impact of COVID-19 on the social, economic, environmental and energy domains: Lessons learnt from a global pandemic. Sustain. Prod. Consum. 2021, 26, 343–359. [Google Scholar] [CrossRef] [PubMed]
- Li, Z.; Ye, H.; Liao, N.; Wang, R.; Qiu, Y.; Wang, Y. Impact of COVID-19 on electricity energy consumption: A quantitative analysis on electricity. Int. J. Electr. Power Energy Syst. 2022, 140, 108084. [Google Scholar] [CrossRef]
- Samara, F.; Abu-Nabah, B.A.; El-Damaty, W.; Bardan, M.A. Assessment of the Impact of the Human Coronavirus (COVID-19) Lockdown on the Energy Sector: A Case Study of Sharjah, UAE. Energies 2022, 15, 1496. [Google Scholar] [CrossRef]
- IEA. Monthly Evolution of Global CO2 Emissions, 2020 Relative to 2019. Available online: https://www.iea.org/data-and-statistics/charts/monthly-evolution-of-global-co2-emissions-2020-relative-to-2019 (accessed on 15 November 2022).
- Boggs, S.P. COVID-19 Business Issues in the UAE. Available online: https://www.squirepattonboggs.com/-/media/files/insights/publications/2020/04/covid-19business-issues-in-the-uae/covid-19-business-issues-in-the-uae.pdf (accessed on 15 November 2022).
- Competitiveness, F.; Authority, S. The UAE Approach Towards Curbing the Spread of COVID-19 by Using Data and Technology. Available online: https://the-uae-and-covid-19-fcsa.hub.arcgis.com/ (accessed on 15 November 2022).
- Telecommunications; Digital Government Regulatory Authority. Primary Governmental Efforts to Contain COVID-19. Available online: https://tdra.gov.ae/en/media/tdra-statements (accessed on 15 November 2022).
- The National UAE. Coronavirus in the UAE: All of Your Questions Answered. Available online: https://www.thenationalnews.com/uae/health/coronavirus-in-the-uae-all-of-your-questions-answered-1.996124 (accessed on 15 November 2022).
- Competitiveness, F.; Centre, S. Initiatives to Combat COVID-19. Available online: https://fcsc.gov.ae/en-us/Pages/Covid19/Initiatives-to-combat-Covid-19.aspx (accessed on 15 November 2022).
- Barbosa, J.D.; Lin, M.; Rodriguez-Ubinas, E. Adjusted Energy Benchmarking System under COVID Conditions: Dubai as Case Study. WIT Trans. Ecol. Environ. 2021, 253, 539–550. [Google Scholar]
- Liu, Y.; Nair, N.K.; Renton, A.; Wilson, S. Impact of the Kaikōura earthquake on the electrical power system infrastructure. Bull. New Zealand Soc. Earthq. Eng. 2017, 50, 300–305. [Google Scholar] [CrossRef] [Green Version]
- Aloul, F.; Al-Ali, A.; Al-Dalky, R.; Al-Mardini, M.; El-Hajj, W. Smart grid security: Threats, vulnerabilities and solutions. Int. J. Smart Grid Clean Energy 2012, 1, 1–6. [Google Scholar] [CrossRef] [Green Version]
- Dubai Electricity and Water Authority. DEWA Annual Statistics 2021. Available online: https://www.dewa.gov.ae/~/media/Files/About%20DEWA/Annual%20Statistics/DEWA%20statistics_booklet_2021_EN_Web.ashx (accessed on 15 November 2022).
- Dubai Electricity and Water Authority. DEWA Annual Statistics 2019. Available online: https://www.dewa.gov.ae/~/media/Files/About%20DEWA/Annual%20Statistics/DEWA%20statistics_booklet_2019_EN.ashx (accessed on 15 November 2022).
- Asweto, C.O.; Onyango, P.O.; Alzain, M.A.; Wang, W. Effects of Increased Residential Mobility and Reduced Public Spaces Mobility in Containing COVID-19 in Africa. 2020. Available online: http://repository.embuni.ac.ke/handle/embuni/3636 (accessed on 25 December 2022).
- Sampi Bravo, J.R.E.; Jooste, C. Nowcasting economic activity in times of COVID-19: An approximation from the Google Community Mobility Report. In World Bank Policy Research Working Paper. 2020. Available online: https://papers.ssrn.com/sol3/papers.cfm?abstract_id=3601423 (accessed on 25 December 2022).
- Bucsky, P. Modal share changes due to COVID-19: The case of Budapest. Transp. Res. Interdiscip. Perspect. 2020, 8, 100141. [Google Scholar] [CrossRef]
- Wang, H.; Yamamoto, N. Using a partial differential equation with Google Mobility data to predict COVID-19 in Arizona. arXiv 2020, arXiv:2006.16928. [Google Scholar] [CrossRef]
- Chen, Y.; Yang, W.; Zhang, B. Using mobility for electrical load forecasting during the COVID-19 pandemic. arXiv 2020, arXiv:2006.08826. [Google Scholar]
- Fernández-Villaverde, J.; Jones, C.I. Macroeconomic Outcomes and COVID-19: A Progress Report; Technical Report; National Bureau of Economic Research: Cambridge, MA, USA, 2020. [Google Scholar]
- Monika, A.K. The utility of ‘COVID-19 mobility report’and ‘google trend’for analysing economic activities. Syntax Idea 2021, 3, 1256–1268. [Google Scholar] [CrossRef]
- Google LLC. COVID-19 Google Mobility Reports: United Arab Emirates. Available online: https://www.google.com/covid19/mobility/ (accessed on 15 November 2022).
- Manandhar, P.; Lin, M.; Ramirez, J.D.B.; Rodriguez-Ubinas, E. Using Occupant’s Data for Electricity Load Prediction based on Machine Learning. In Proceedings of the 2021 2nd International Conference on Electronics, Communications and Information Technology (CECIT), Sanya, China, 27–29 December 2021; pp. 1269–1274. [Google Scholar] [CrossRef]
- Wang, J.; Li, L.; Niu, D.; Tan, Z. An annual load forecasting model based on support vector regression with differential evolution algorithm. Appl. Energy 2012, 94, 65–70. [Google Scholar] [CrossRef]
- Moon, J.; Kim, Y.; Son, M.; Hwang, E. Hybrid short-term load forecasting scheme using random forest and multilayer perceptron. Energies 2018, 11, 3283. [Google Scholar] [CrossRef]
- Li, J.; Cheng, K.; Wang, S.; Morstatter, F.; Trevino, R.P.; Tang, J.; Liu, H. Feature selection: A data perspective. ACM Comput. Surv. (CSUR) 2017, 50, 1–45. [Google Scholar] [CrossRef]
- Hall, M.A. Correlation-Based Feature Selection of Discrete and Numeric Class Machine Learning; Department of Computer Science, University of Waikato: Hamilton, New Zealand, 2000. [Google Scholar]
- Fryer, D.; Strümke, I.; Nguyen, H. Shapley values for feature selection: The good, the bad, and the axioms. IEEE Access 2021, 9, 144352–144360. [Google Scholar] [CrossRef]
- Abulibdeh, A. Modeling electricity consumption patterns during the COVID-19 pandemic across six socioeconomic sectors in the State of Qatar. Energy Strategy Rev. 2021, 38, 100733. [Google Scholar] [CrossRef]


| Models | Random Forest | SVR |
|---|---|---|
| RMSE (kWh) | 0.17 | 0.15 |
| MAE | 0.18 | 0.16 |
| R-Squared | 0.95 | 0.95 |
| Model | RF | SVR | ||||
|---|---|---|---|---|---|---|
| Time Period | RMSE (kWh) | MAE | MAPE | RMSE (kWh) | MAE | MAPE |
| 2019 | 0.17 | 0.11 | 5.06 | 0.15 | 0.12 | 5.77 |
| 2020 | 0.24 | 0.17 | 6.92 | 0.36 | 0.23 | 9.00 |
| 2021 | 0.23 | 0.17 | 6.54 | 0.29 | 0.20 | 8.24 |
| April 2019 | 0.21 | 0.15 | 7.43 | 0.14 | 0.12 | 6.10 |
| April 2020 | 0.27 | 0.20 | 8.69 | 0.28 | 0.21 | 8.91 |
| April 2021 | 0.26 | 0.20 | 8.61 | 0.27 | 0.21 | 9.05 |
Disclaimer/Publisher’s Note: The statements, opinions and data contained in all publications are solely those of the individual author(s) and contributor(s) and not of MDPI and/or the editor(s). MDPI and/or the editor(s) disclaim responsibility for any injury to people or property resulting from any ideas, methods, instructions or products referred to in the content. |
© 2022 by the authors. Licensee MDPI, Basel, Switzerland. This article is an open access article distributed under the terms and conditions of the Creative Commons Attribution (CC BY) license (https://creativecommons.org/licenses/by/4.0/).
Share and Cite
Manandhar, P.; Rafiq, H.; Rodriguez-Ubinas, E.; Barbosa, J.D.; Qureshi, O.A.; Tarek, M.; Sgouridis, S. Understanding Energy Behavioral Changes Due to COVID-19 in the Residents of Dubai Using Electricity Consumption Data and Their Impacts. Energies 2023, 16, 285. https://0-doi-org.brum.beds.ac.uk/10.3390/en16010285
Manandhar P, Rafiq H, Rodriguez-Ubinas E, Barbosa JD, Qureshi OA, Tarek M, Sgouridis S. Understanding Energy Behavioral Changes Due to COVID-19 in the Residents of Dubai Using Electricity Consumption Data and Their Impacts. Energies. 2023; 16(1):285. https://0-doi-org.brum.beds.ac.uk/10.3390/en16010285
Chicago/Turabian StyleManandhar, Prajowal, Hasan Rafiq, Edwin Rodriguez-Ubinas, Juan David Barbosa, Omer Ahmed Qureshi, Mahmoud Tarek, and Sgouris Sgouridis. 2023. "Understanding Energy Behavioral Changes Due to COVID-19 in the Residents of Dubai Using Electricity Consumption Data and Their Impacts" Energies 16, no. 1: 285. https://0-doi-org.brum.beds.ac.uk/10.3390/en16010285