
The Effectiveness of Distributed Acoustic Sensing (DAS) for Broken Rail Detection †
by
 , , and
Adrian Wagner
1,*,
Andrew Nash
1,*,
Frank Michelberger
1,
Hirut Grossberger
1 and
Gavin Lancaster
2 1
Department of Rail Technology & Mobility, Carl Ritter von Ghega Institute for Integrated Mobility Research, St. Pölten—University of Applied Sciences, Campus Platz 1, 3100 St. Pölten, Austria
2
Sensonic GmbH, Bahnhofstraße 57a, 4780 Schärding, Austria
*
Authors to whom correspondence should be addressed.
†
This paper is an extended version of our paper published at the 7th International Conference on Road and Rail Infrastructure, Pula, Croatia, 11–13 May 2022.
Energies 2023, 16(1), 522; https://0-doi-org.brum.beds.ac.uk/10.3390/en16010522
Submission received: 15 November 2022
/
Revised: 27 December 2022
/
Accepted: 28 December 2022
/
Published: 3 January 2023
(This article belongs to the Special Issue Selected Papers from the 7th International Conference on Road and Rail Infrastructure CETRA 2022)
Abstract
:Broken rails remain one of the main causes of railway accidents despite improved rail quality and inspections. Today, signalling system with track circuits are often used to detect broken rails, however new signalling systems such as the European Train Control System (ETCS) with axle counters are replacing track circuits and therefore new methods are needed to detect broken rails. One promising technology is distributed acoustic sensing (DAS). The best DAS analytical techniques to show the position of the rail break are gradient analysis, convolution using the train consist and 2 D sinusoidal convolution. This paper describes field tests carried out on DAS to evaluate its ability to detect broken rails and the moment when rails break. The testing showed that DAS has good potential for detecting broken rails in both scenarios. Especially helpful is the ability of DAS to identify the moment of rail breakage and its potential for determining the break’s location on open lines. Recommendations for further research include testing these qualities in more detail and considering how DAS could be efficiently combined with new signalling systems.
1. Introduction
Broken rails can cause railway derailments and are therefore a significant safety hazard. Furthermore, broken rails severely impact railway operations by taking a track out of service until it can be repaired. Broken rails are caused by the build-up of surface cracks caused by rolling contact fatigue from passing trains. Given the importance of preventing broken rails, track inspection and maintenance practices have been the subject of much research (as outlined in the following section).
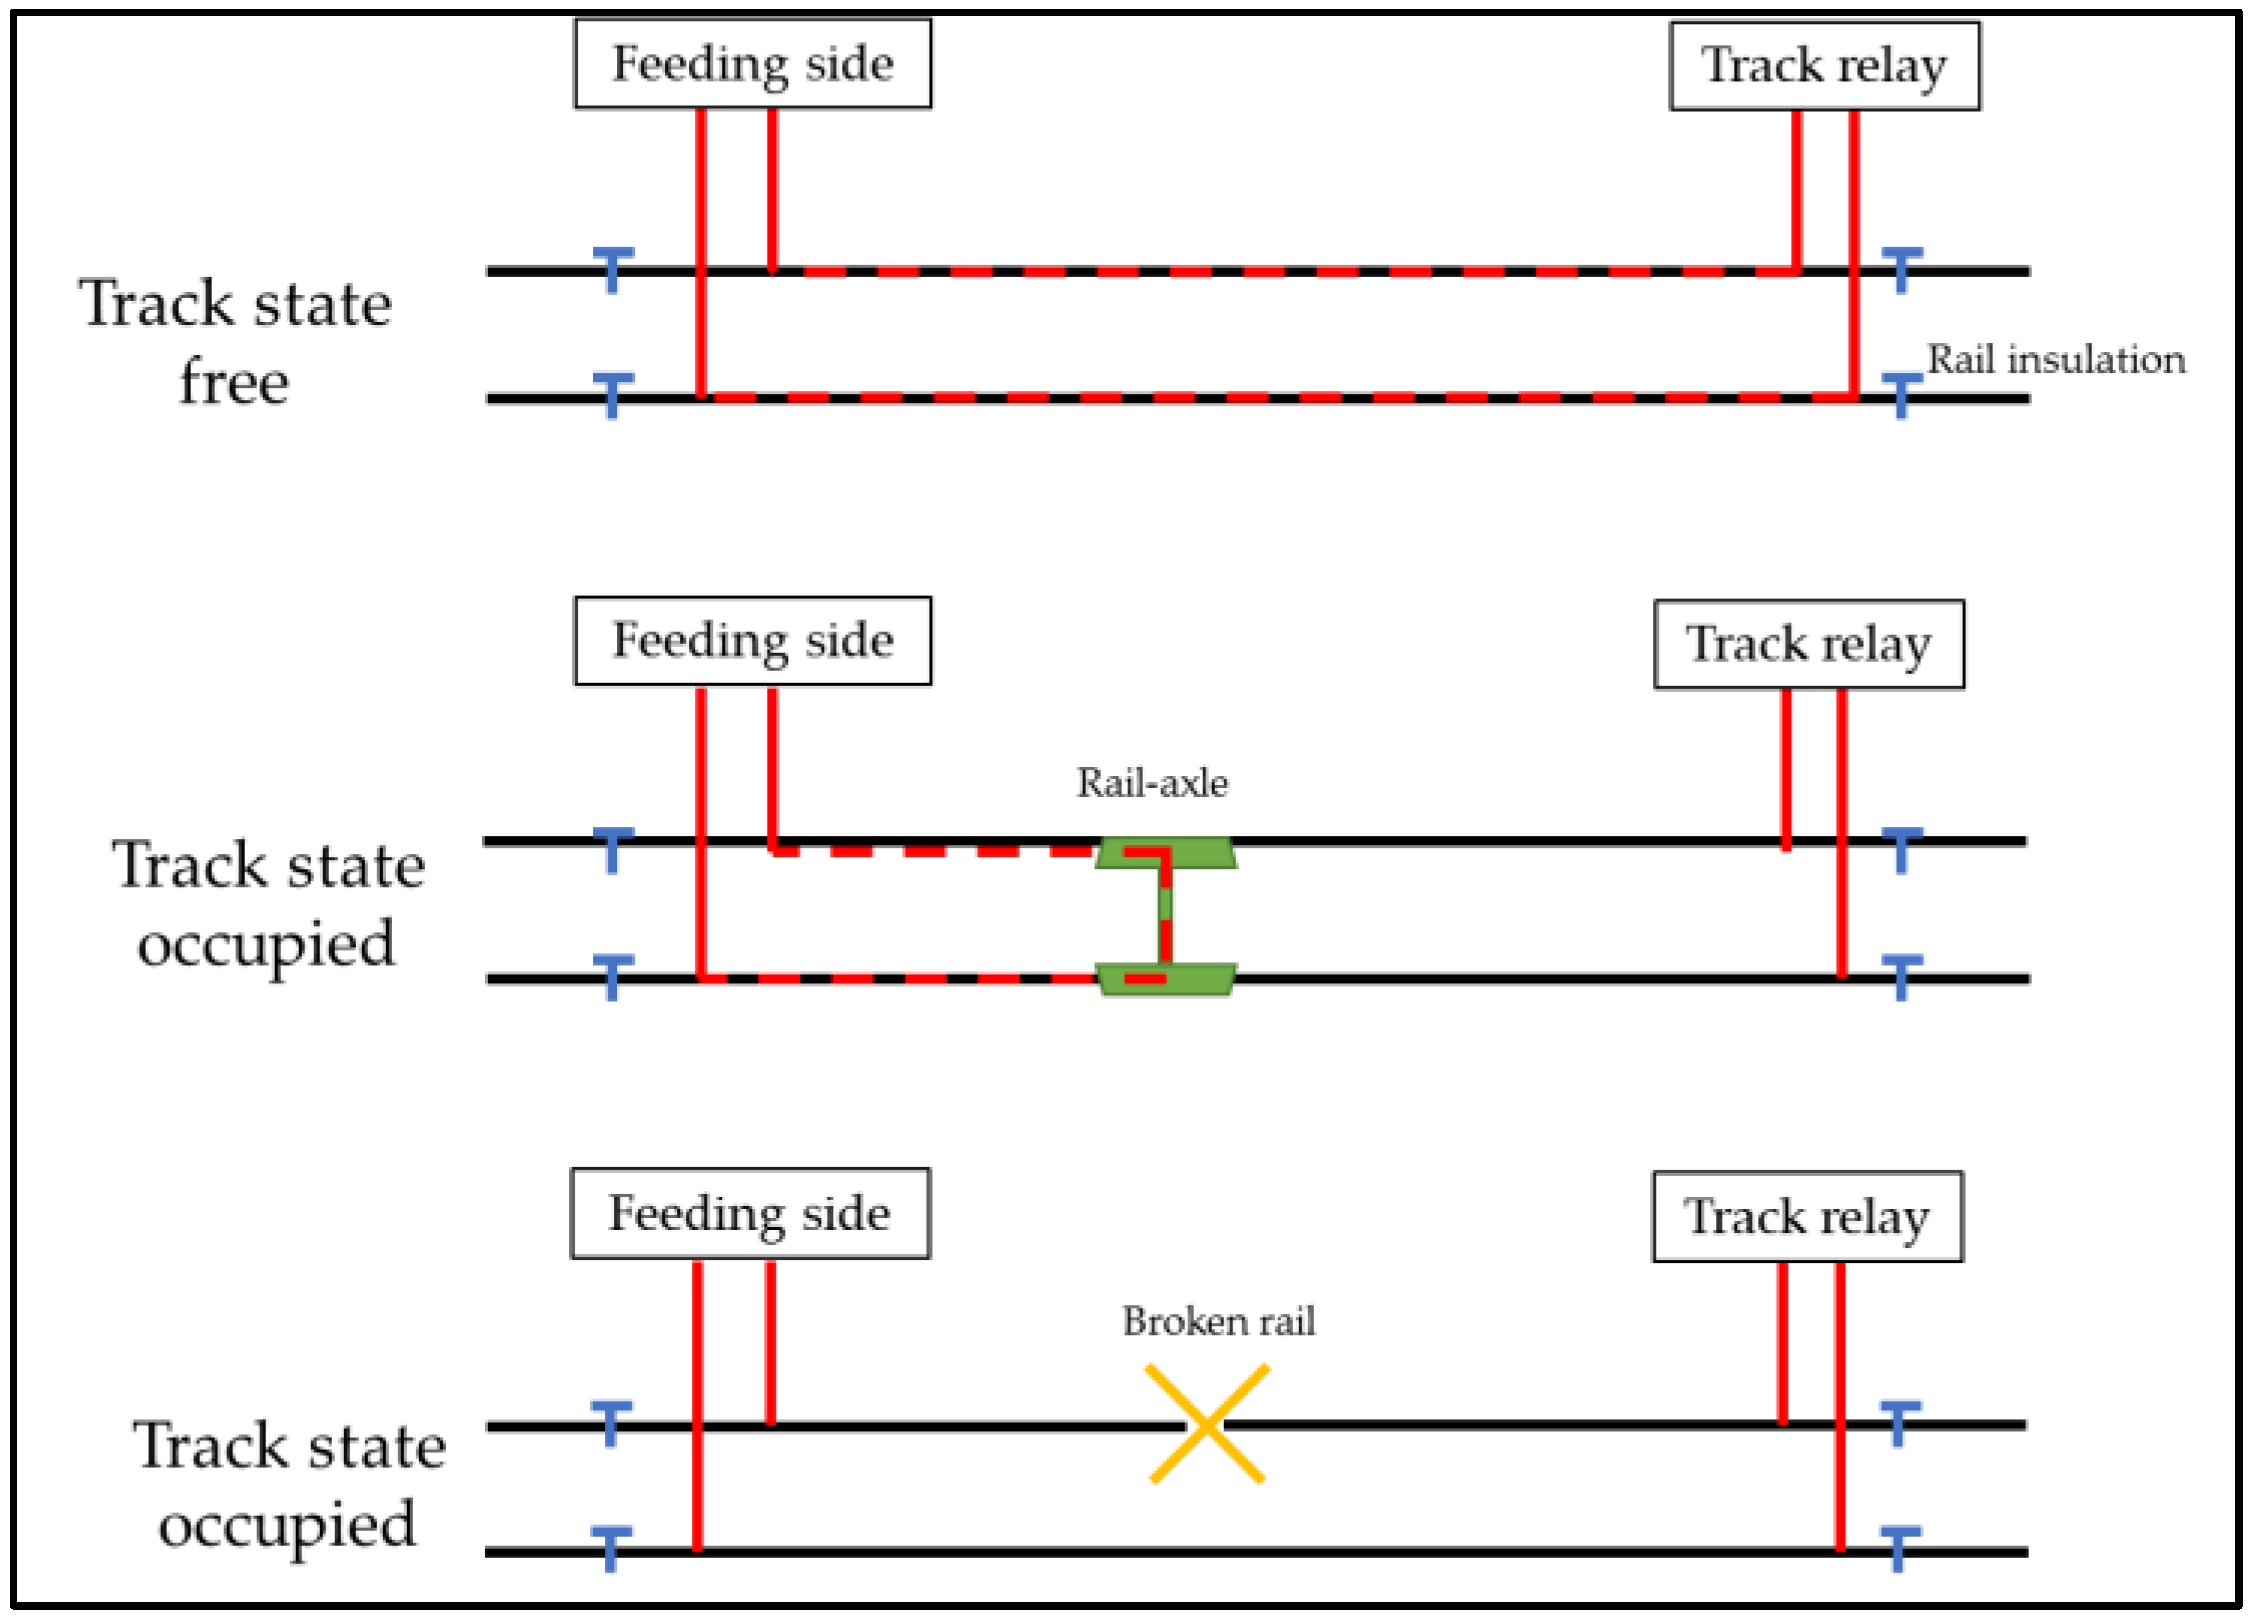
Today railways identify the presence of broken rails using manual and vehicle-based track inspection using a variety of sensor systems and information from track circuit-based signalling systems. Figure 1 illustrates how track circuit-based signalling systems identify broken rails. Essentially, the broken rail creates a short circuit in the track circuit which causes the track to be shown as occupied—the same as if a train were on the track section. Track circuit-based signalling systems are especially important for identifying broken rails because track inspection is expensive, time-consuming, and schedule-based—in contrast track circuit-based signalling systems identify broken rails in real time (i.e., between scheduled inspections) and are a supplemental benefit of track circuit-based signalling.
Unfortunately, at least from the perspective of identifying broken rails, track circuit-based signalling systems are being replaced by new digital signalling systems such as the European Traffic Control System (ETCS). These systems do not use track circuits and therefore cannot identify broken rails.
Many railways are installing new ETCS and other digital signalling systems to support interoperability, increased capacity, and improved operations. The European Commission is strongly encouraging member states to install ETCS and has a variety of funding programs to help them.
Given the safety and operational impacts of broken rails, the UIC (International Union of Railways) managed a research study called: Broken Rail Detection Project in 2017 to assess new methods for identifying broken rails. As outlined below, the researchers considered a wide variety of fixed and mobile sensor technologies.
One of the technologies considered in the UIC analysis, fibre optic distributed acoustic/vibration sensing was identified to be a highly promising low-cost technology for identifying broken rails. Distributed acoustic sensing (DAS) measures changes in the intensity of light reflections caused by sound or vibration waves radiating against a single mode fibre optic cable. Algorithms transform these data into valuable information.
As a part of the project a detailed evaluation of DAS was carried-out by a team from the University of Applied Sciences St. Pölten, the Austrian Federal Railways (ÖBB-Infrastruktur AG), and Sensonic GmbH, a developer of railway sensors. The research consisted of three parts:
- Literature review DAS and broken rail assessment
- Field testing of DAS under various test scenarios
- Evaluation of results
This paper is an extended article of the conference paper “The effectiveness of distributed acoustic sensing (DAS) for broken rail detection, presented at the CETRA 2022 in Pula [2].
2. Broken Rails and Distributed Acoustic Sensing
2.1. Broken Rails
Broken rail is a leading cause of mainline track derailments today [3]. A detailed analysis shows that broken rails accounted for over 15% of freight train derailments on mainline track, sidings, and yards between 2001 and 2010 [4]. This research also found that derailments caused by broken rails have a much higher degree of severity (measured in terms of the average number of cars derailed) than other derailment causes. An analysis of precursors to accidents in Europe (2010–2012) from the European Railway Agency (ERA) also shows that broken rails are precursors to by far the greatest number of accidents [5].
Broken rails are caused by the accumulation of small surface cracks on the rail surface created by rolling contact fatigue (RCF) from passing trains [6]. Overtime these cracks grow and create transverse defects. These defects can cause a rail to break if they are not detected and removed in time [7,8]. In addition to being a precursor to broken rail, rail cracks and other damage negatively impacts passenger comfort [9].
Kumar presents a detailed background on rail defects, the crack development process, a review of broken rail cause research, and recommendations for developing a risk-based maintenance strategy. According to Kumar, the “crack development process consists of three phases: crack initiation, crack propagation and fracture or rail break. Rail break is the final result of the crack development process.” [10].
An important technique for preventing broken rails is detecting cracks in their initiation phase (10 µm to 100 µm) before they start growing in number and size to a critical quantity where they cause a rail to break under a load of a passing train [11]. Early detection enables railways to remove cracks and reduce rail RCF stresses by grinding the rail before it reaches the critical phase.
A variety of techniques are used to detect rail defects and broken rails including visual inspection, ultrasonic analysis by a moving track inspection vehicle or hand-held device, all three of which are part of planned maintenance, and detection of a rail break using signalling track circuits. In an unpublished internal research report for Banverkert (Sweden), by Larsson, et. al., quoted by Kumar, 89.26% of defects are detected by inspection vehicles and hand-held devices, 6.03% from visual inspection, and 4.33% from signalling systems. The final 0.38% are detected through derailments [10].
In a traditional track circuit-based signalling system, railway wagon axles create a short circuit on the electrical circuit created between the rails [12]. This type of signalling system can also identify broken rails because they also break the electrical circuit. Although signalling systems do identify broken rails, they have several disadvantages including the fact that they are a “reactive sensor … in other words we do not know about the break until it has already happened” [13], that “the exact location of the break cannot be pinpointed, (or) … the break might shut due to longitudinal expansion.” [10].
Furthermore, the advent of new non-track circuit signalling systems such as the European Railway Signalling System (ETCS), or communications-based train control (CBTC) mean that new techniques are needed to detect broken rails, or preferably to proactively identify defects that will lead to broken rails. In short, the limitations of track-circuit-based broken rail identification support the development of better rail defect identification techniques [5].
Railways have long understood the disadvantages of using track circuits to identify broken rails and much research has been carried out to identify new techniques. Thurston (2014) summarises research on these techniques and ultimately proposes a risk-based approach using ultrasonic testing to replace track circuits. The alternative techniques described in the article were: attaching a fibre optic cable to the rail web, using accelerometers mounted on the unsprung portion of vehicle trucks to measure wheel impacts, attaching strain gauges to the rail at 200-foot intervals, using acoustic data from transducers mounted on the side of the rail, non-contact based ultrasonic testing, and a rail head defect classifier. The article evaluates each of these techniques and provides references [13].
The UIC Broken Rail Detection Project completed a state-of-the-art analysis in late 2017. The researchers considered both track-mounted and vehicle-mounted techniques. Their report provides a detailed description of these techniques and results of a railway industry survey confirming the importance of broken rail detection and providing industry input on detection techniques [14]. The analysis found that there had been many improvements to sensor technology since the research referenced by Thurston in 2014.
For example, the technologies for transmitting and measuring vibrations in fibre optic cable had improved sufficiently so that distributed acoustic sensor (DAS) systems were being used to detect seismic activities and for real-time monitoring of oil and gas pipelines [14]. The new DAS technology appeared to be a promising technique for identifying broken rails and rail defects. Therefore, the state-of-the-art analysis recommended that the ability of a DAS system to identify these rail defects be tested in more detailed research. This paper describes the research and main results.
2.2. Distributed Acoustic Sensors
A distributed acoustic sensors (DAS) system uses acoustic sensors to detect vibrations (therefore a DAS system is sometimes referred to as a distributed vibration sensors/DAS system). These vibrations differ depending on what caused them.
More specifically, DAS converts a standard telecommunications optical fibre into a distributed sensor that can detect acoustic vibrations by sending laser pulses along the fibre and measuring the light returning as a result of Rayleigh backscatter. The signals (reflections) received by this system can be pinpointed to a specific distance along the fibre using time-of-flight calculations. The data can then be filtered using various digital signal processing techniques to obtain more information about the source of the vibration (e.g., the vibration cause).
In this research vibrations occurring in the physical rail are observed as signals in a laser pulse passing through a fibre optic cable located adjacent to the track.
Previous research has shown that acoustic sensors can detect transient stress waves emitted from rail deformations, fractures, and cracks and convert them to electrical signals that can be recorded and analysed by data acquisition systems [15]. The key challenge in using DAS for identifying broken rails is determining the type and size of the defects generating the signal.
In this research, the defects that could cause rail breaks were detected by applying acoustic signal processing techniques to the real-time data obtained from the acoustic signal sensors. These data consist of changes to fibre strain that are generated by the wheel/rail interaction. The research tested (1) various fibre optic cable alternatives (type, location), (2) technologies to clean the signal data for analysis, and (3) pattern recognition algorithms.
The experiments tested several rail damage scenarios that can lead to rail breaks over time. In each scenario, the track was modified to create a physical gap in the track (break) and then the signals generated by trains rolling over the gap were compared to the base condition (no break). These signals were evaluated to assess whether they could be used to identify specific defects. As outlined in the following sections, the researchers tested several different magnitudes (e.g., gap size) and types of physical modifications. Note that a similar methodology could be used to assess the use of DAS for detecting other types of rail damage such as head check, RCF fracture, spalling, flaking, shelling, and corrugation failures.
2.3. Using and Analysing DAS Data
The process of using and analysing DAS data to identify broken rails consists of two main steps: preparing the acoustic signal data (acoustic emissions) collected from the track for more detailed analysis (rail signal detection) and using these data to identify rail defects including broken rails (rail defect detection). These steps and their sub-steps are illustrated in Figure 2.
In the first step the raw acoustic emissions data must be filtered because it includes noise resulting from wave reflections, mechanical rubbing, electromagnetic interferences, and environmental conditions such as rain, wind, wind-born debris, etc. Noise creates large amounts of data and reduces the effectiveness of results.
Therefore, during the rail signal detection step the raw input data is pre-processed to reduce noise using data cleaning, normalizing, filtering, and eliminating meaningless acoustic signatures. This requires setting a threshold for data acquisition that removes low amplitude signals to separate data from noise. The threshold values for filtering can be set using previous test results and experience.
There are several parameter-based filters that can be used in this process including duration filters, frequency filters, and signal strength filters. For example, a parameter-based noise filter for filtering signals with low amplitude and long duration can be developed by plotting amplitude versus logarithmic duration. Abdelrahman presents an excellent summary of the literature on noise filters [15].
The filtered acoustic emissions data and physical data about the track section (e.g., rolling stock types, axle loads, total traffic, weather conditions, and track geometry) are used as inputs for the rail defect detection algorithm. The success of this algorithm depends upon developing correlations between the acoustic emission data collected by DAS and the actual condition of the rail.
In the rail defect detection algorithm pattern recognition techniques are applied to categorize data into identifiable classes. Pattern recognition consists of three steps: data perception, feature extraction and classification. After the features have been extracted from the input signal data these data are categorized into identifiable classes of rail failure. There are two classification methods:
- (i)
- supervised pattern recognition—each unknown pattern is classified to an already known rail defect (this method is suitable if the types of the rail defects are known in advance). Learning processes such as Neural Networks (NN) can be used in this method.
- (ii)
- unsupervised pattern recognition—data are classified into groups based on their similarities.
The accuracy of signal classification algorithms depends on the computational time required by the algorithm to analyse and link a specific event to an acoustic emission source [16].
The following section outlines the experiments performed to test DAS and techniques for using the DAS data to identify rail defects such as broken rails.
3. Field Test Methodology
The research performed a series of experiments to test the ability of distributed acoustic sensors to detect broken rails. These experiments were carried out at an Austrian Federal Railways training facility in Wörth (Bildungszentrum Wörth) from 21 to 23 January 2019.
A total of 77 experiments were performed, all of which were carefully documented and recorded. Most of the experiments consisted of running a test train over different-sized rail gaps at varying speeds. An additional experiment consisted of using a pulling device to break a rail.
All the experiments assessed whether signals produced by the vibrations caused by driving over a broken rail (or breaking a rail) in a fibre optic cable could be used to detect broken rails. The data from these experiments were subsequently processed using the techniques outlined above and represented in MATLAB for analysis and interpretation.
If DAS is to be an effective technology for identifying broken rails, then the signal generated by the vibration must be clearly identifiable: both the fact that there was a vibration and what caused the vibration. More specifically it must be possible to distinguish between the following irregularities:
- Gap in rail (broken rail);
- Rail being broken;
- Gravel on rail (which was investigated because running over gravel is often misinterpreted as broken rail by train drivers).
The experiments were carried out on a 100-metre length of the test track. The test train consisted of a locomotive (ÖBB 2070-080) and two flat wagons (type 21 81 3310). The tests were carried out in January because the rails were expected to be more brittle in cold weather. Moreover, since metal contracts at low temperatures, the tracks move further apart in case of a break.
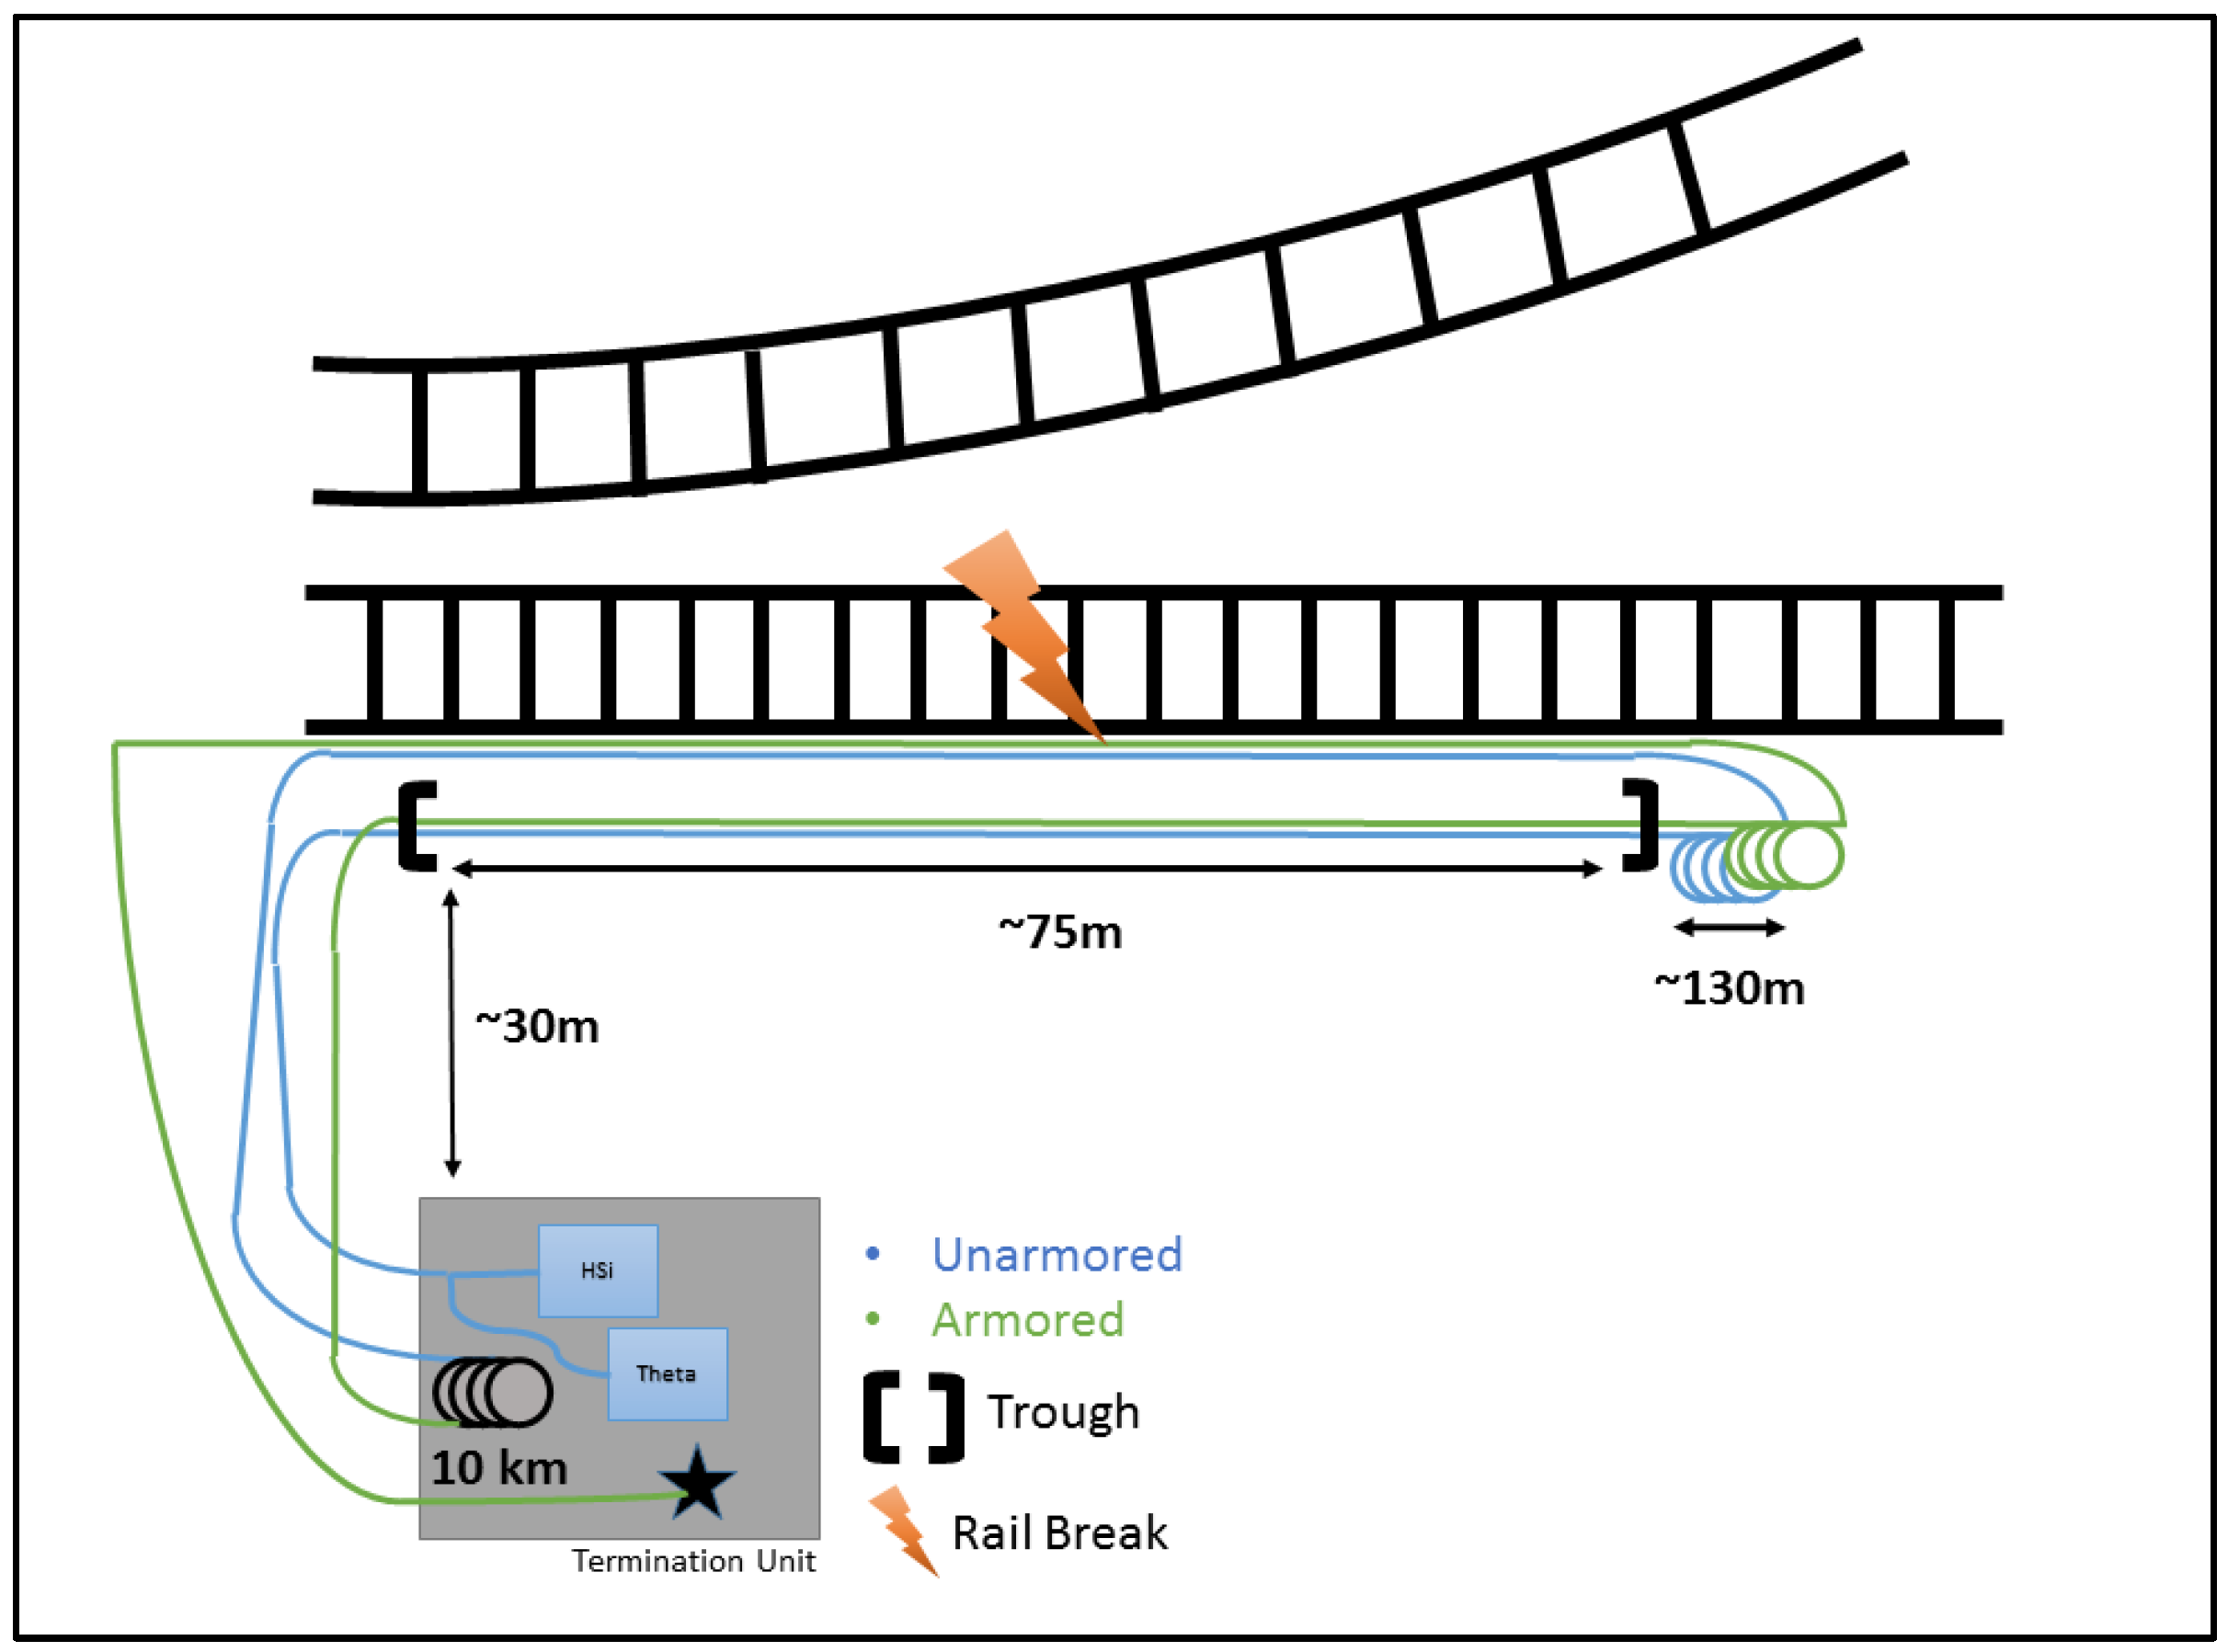
The acoustic sensor equipment used in the experiments consisted of fibre optic cable laid along the rail or in an adjacent trough, an interrogator device (which transmits the light signal in the cable), an optical time domain reflectometer (which collects and digitises the light signal as well as the returning light), and a processing unit (which digitizes the signal and saves, filters, and displays the data). An overview of the fibre installation is shown in Figure 3. Accelerometers were attached to the rail to measure track acceleration, and data were collected on train movement (e.g., speed), track temperature, and weather.
The tests were performed by operating the vehicles over the test track described above. During the test, the train speed was kept as constant as possible in the measuring area. The following section describes the tests and results.
4. Field Test Results
4.1. Gap in Rail (Broken Rail)
The main research topic was assessing the ability of DAS to identify broken rails and therefore most of the tests were designed to test this ability. In these experiments, the test train was operated over an unwelded track joint at speeds of 5, 10, 15, 20 and 25 km/h in both directions (oscillating over the measuring point). The low speeds in the test run were chosen, as the train is consciously running over a track joint or later a broken rail. In this test environment, a safe stop on the test track was guaranteed at all times at 25 km/h. Additionally, it is assumed that the effects are higher with increasing speed. Importantly, this means that if results can be seen at a speed of 25 km/h they will also appear at higher speeds. In these tests, the joint was adjusted to create gaps of varying width (3.5 mm/5 mm/9 mm/12 mm/18 mm/25 mm). The tests were carried out on 22 January 2019.
In all the field tests, acceleration sensors were used to confirm that the vibrations measured by the DAS were caused by the train running over the rail gap. The acceleration sensors were placed on the rail and on the floor of the trough containing the fibre optic cable. Figure 4 illustrates example of accelerometer data.
The upper portion of Figure 4 presents time series data clearly showing the impact of each wheel in both rail and trough. The lower portion presents power spectrum data and clearly shows the greater attenuation at high frequencies measured by the accelerometer sensor in the trough (as expected since the vibrations must first pass through the ground before being measured).
Figure 5 presents a plot of the vibrational signal amplitude in the trough for varying train velocities and gaps. It is interesting to note that train velocity has a significant effect on amplitude while the gap width does not.
The lower red line in Figure 5 represents the tests where the gap width was 3.5 mm. These results differ from the other lines (tests) because for the 3.5 mm gap the rail joint was supported by a fishplate, in all other tests the fishplate was absent.
The DAS sensors collected 60 sets of raw data from the experiments (the test train was operated in both directions over six gap widths and at five track speeds). However, only data from experiments where the train was travelling in the forwards direction were used in the analysis because it was observed that the difference between the nominal and actual velocities in the forward direction was significantly less than for trains travelling in the reverse direction. This was expected since in most cases the train was still accelerating when it travelled over the joint in the reverse direction due to the limited length of track on one side of the rail joint.
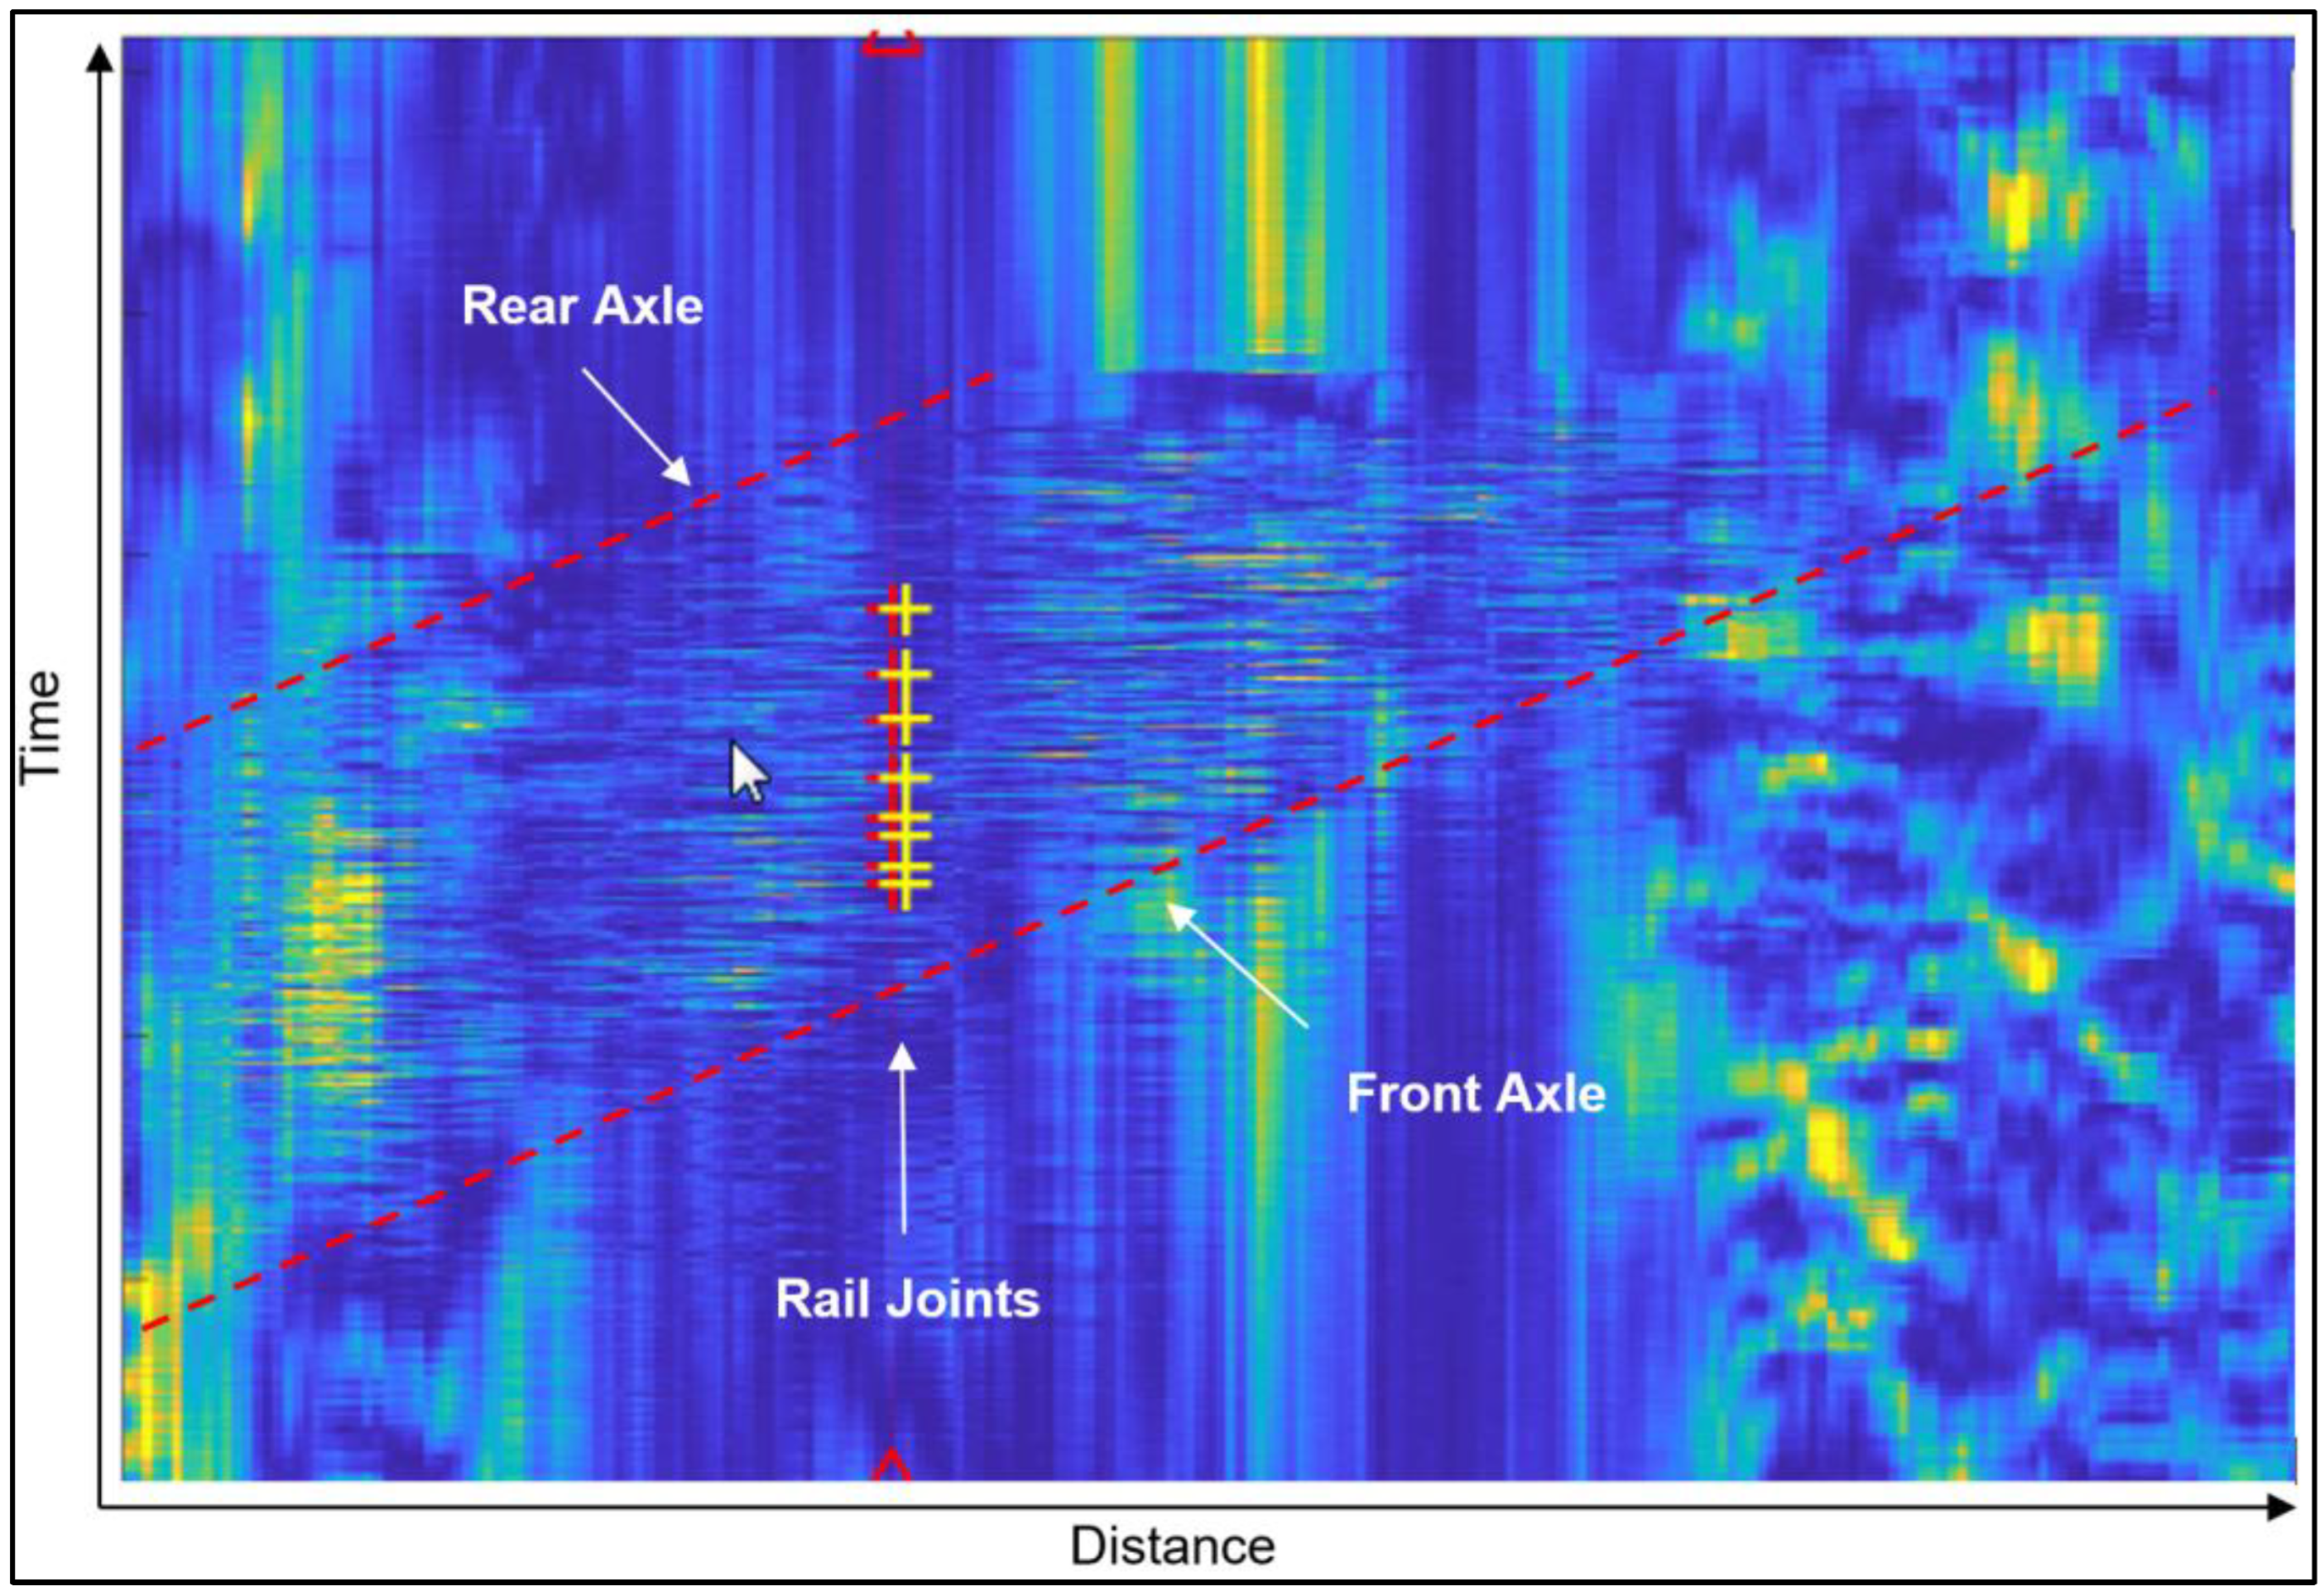
The first step in the data analysis was pre-processing the raw data to improve signal fidelity using low-pass filtering, decimation, and averaging techniques. Figure 6 illustrates the raw data before pre-processing.
After pre-processing several digital signal processing techniques were tested to evaluate their ability to use DAS data to detect the vibrations created by rail defects. As a part of the research, the following digital signal processing techniques were applied in both the time and frequency domain:
- Bandpass filtering techniques;
- Cross-correlation;
- Auto-correlation;
- Gradient calculation;
- Slew rate error rate;
- Power spectrum;
- Kernel convolution.
The three most promising techniques were found to be gradient analysis and train consist convolution, 2-D sinusoidal convolution (kernel convolutions). These results are summarised below.
4.1.1. Gradient Analysis
Figure 7 illustrates the data after processing with gradient analysis. The position and time at which each axle traverses the rail joint is indicated by red crosses. This feature can be seen to be more prominent at these positions.
4.1.2. Train Consist Convolution
This technique convolves a kernel based on the axle arrangement of the train with the time series of the DAS signal. Knowledge of the train consist is obtained from the accelerometer data. An example of the applied kernel is shown in Figure 8 and the convolution results are shown in Figure 8. In both figures, the locomotive with the four axles and the two flat wagons with their axles can be identified.
In Figure 9 the position and time at which each axle traverses the rail joint is indicated by red crosses. This feature can be seen to be more prominent at these positions.
4.1.3. 2-D Sinusoidal Convolution
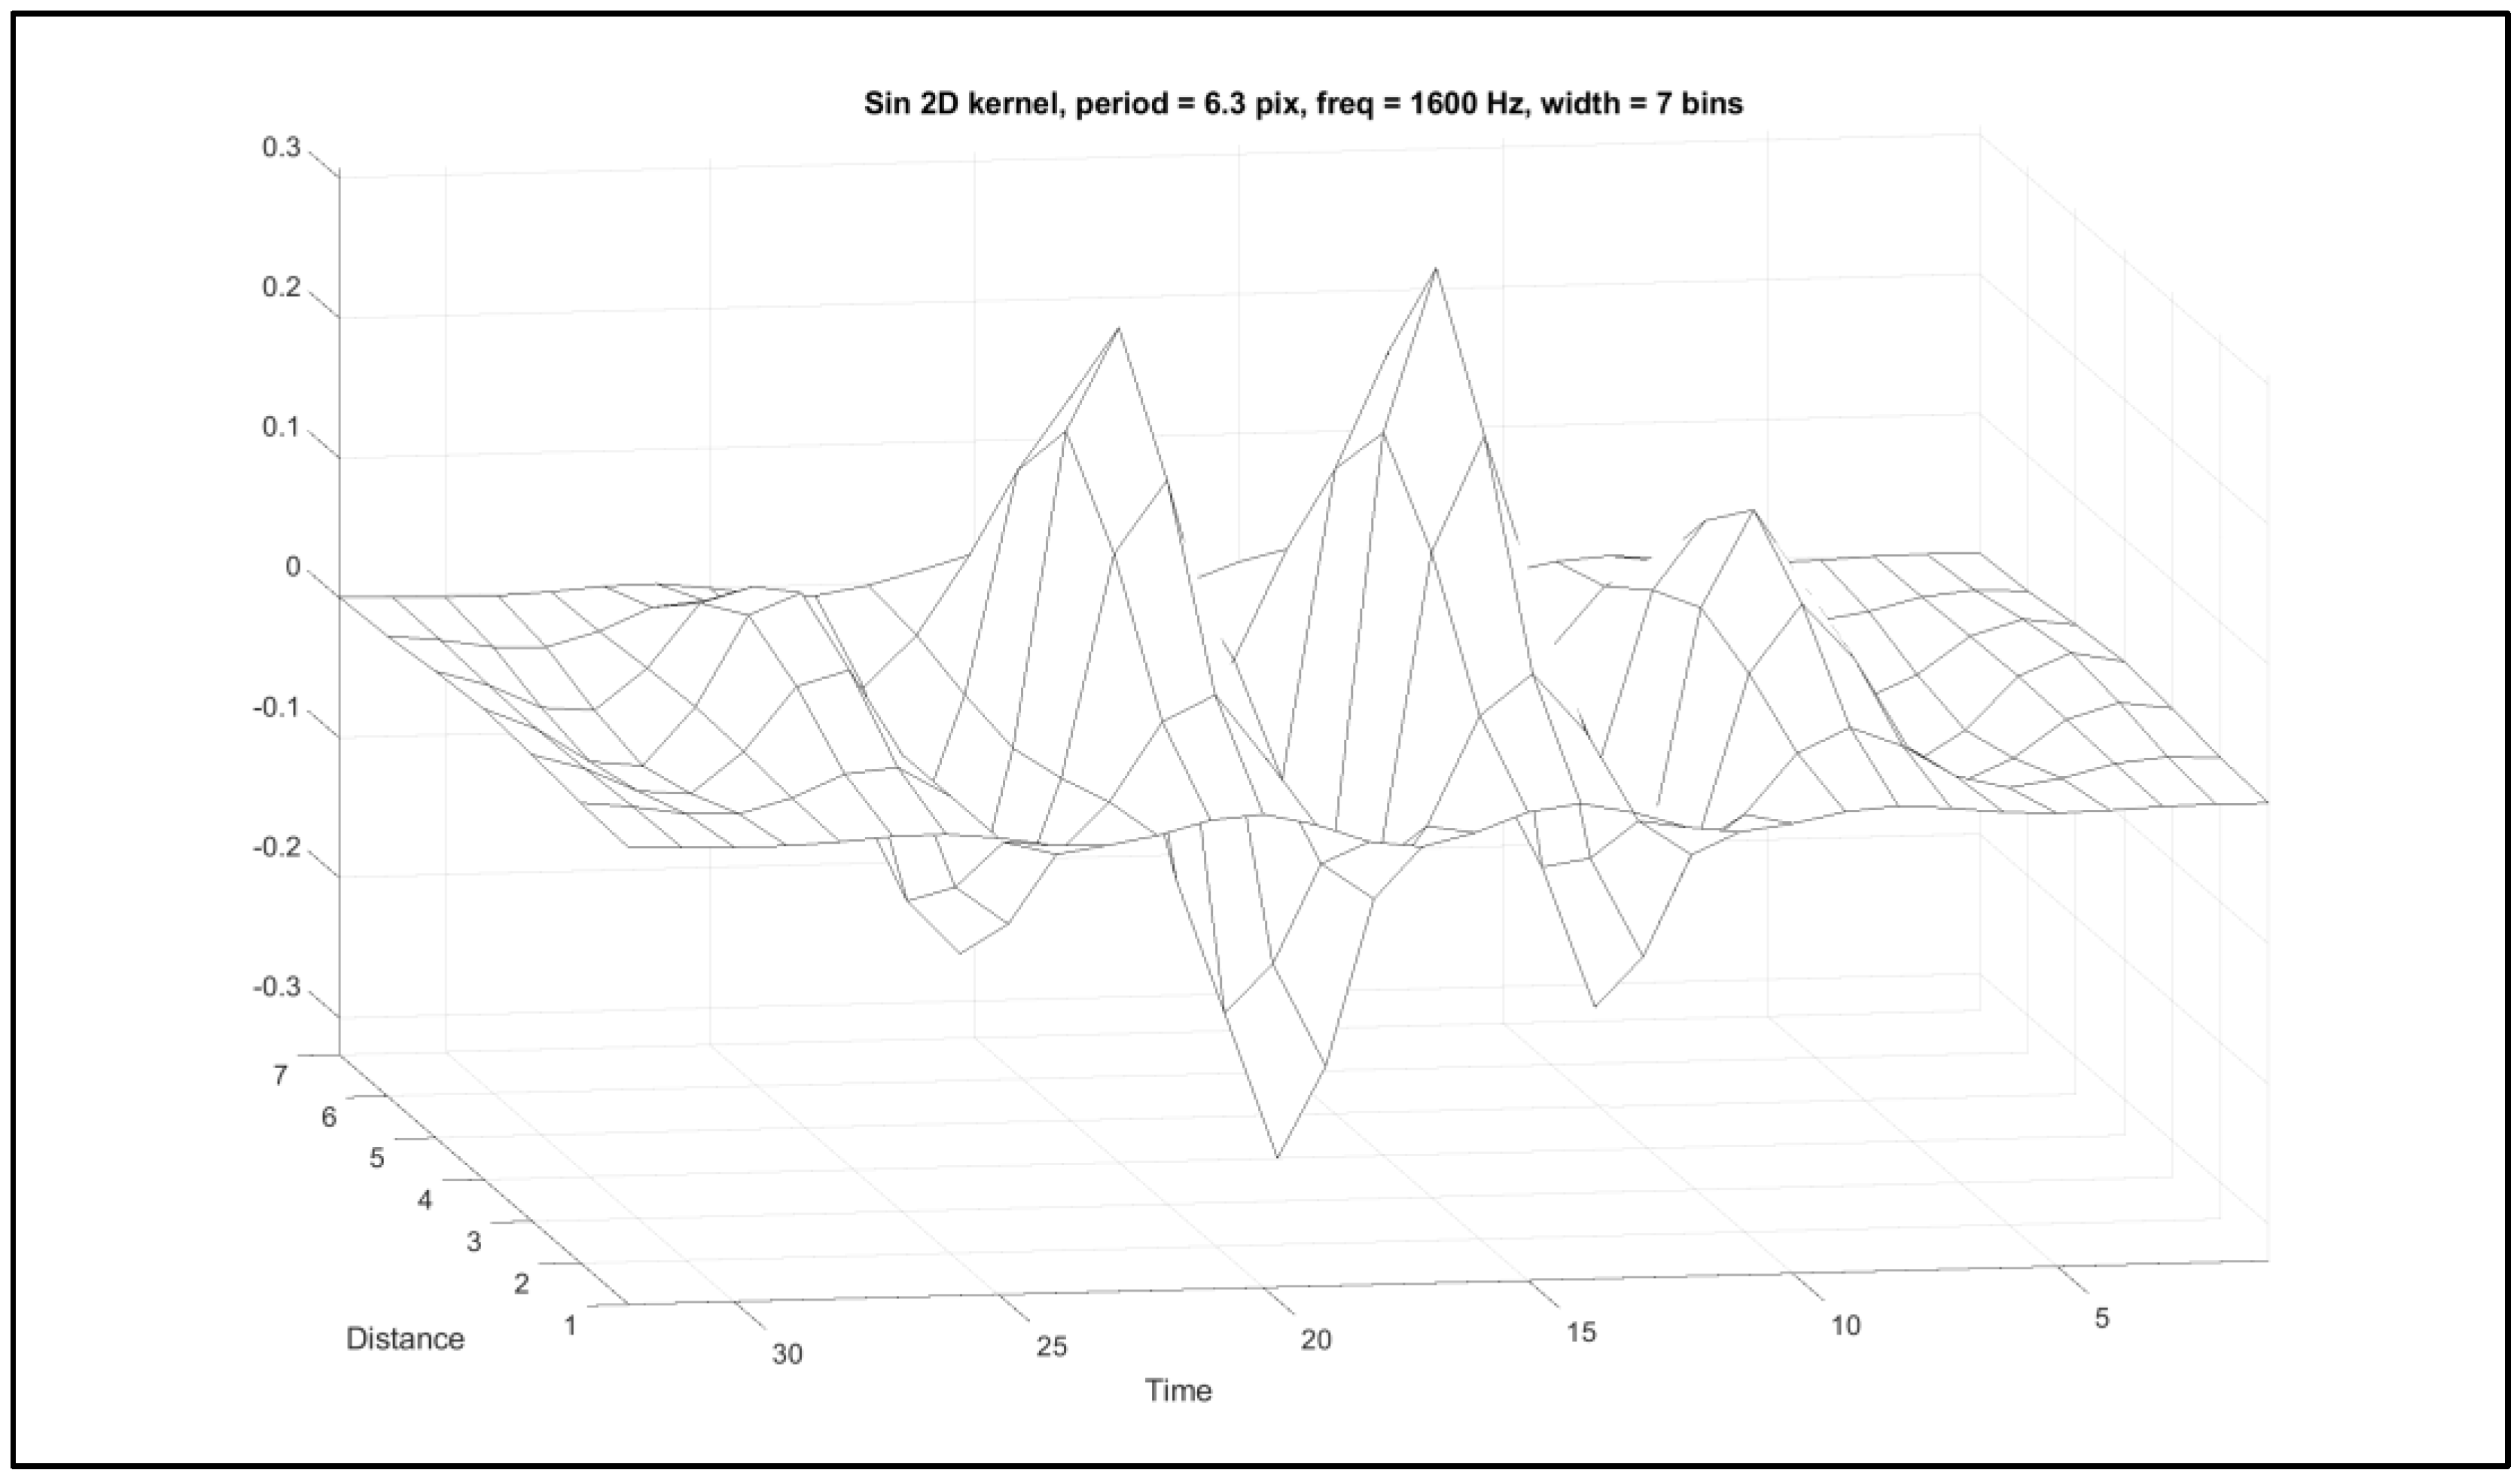
This technique convolves a 2-dimensional sinusoidal kernel with the time series data of the signal. An example of a typical kernel that has been applied is shown in Figure 10, and the results are shown in Figure 11.
Again, in Figure 11 the position and time at which each axle traverses the rail joint is indicated by red crosses. This feature can be seen to be more prominent at these positions.
4.1.4. Summary: Using DAS to Identify Rail Gaps
The test results showed clearly that the rail gaps (simulated rail breaks) can be detected in the DAS data with signal processing. The best signal clarity was observable at the higher speed of 25 km/h. At lower velocities, the signal processing methods were not as likely to represent the significant features of the rail break. This should not pose a problem for the practical use of DAS since most trains operating on open line, where rail breaks are most dangerous, will be traveling over 25 km/h.
4.2. Rail Being Broken
The second experiment tested the ability of DAS to identify breaking rails by analysing the data generated when a partially cut section of rail was mechanically pulled apart using a hydraulic press. The test train was operated over the resulting fracture (38 mm) at the same speed as on the earlier tests, also in both directions. The tests were carried out on 23 January 2019.
Again, the accelerometer data clearly showed vibrations at the moment when the rail breaks. The same pre-processing steps were applied to the DAS data and then frequency analysis was used to evaluate the data. The frequency analysis results are shown in Figure 12. This figure shows a peak in low-, mid and high frequency range when the rail is breaking:
As shown in Figure 12 the processed DAS data clearly shows when the rail break event occurred. A high amplitude, impulsive signal can be observed clearly in all frequency bands, as is expected for such a broadband event.
4.3. Gravel on Rail
The final experiment investigated if a train running over and pulverising stones or rocks placed on the top surface of the rail could, first, be detected, and, second, be distinguished from a train passing over a rail joint or broken rail. In this experiment, the test train was operated (25 km/h) over gravel stones that had been placed on the track. The tests were carried out on 23 January 2019. Raw DAS data for these experiments were analysed using the same procedures described above. One example result is shown in Figure 13.
In Figure 13 the individual impacts from each wheel on each stone can be observed. Additionally, it is noted that with each successive wheel traversal the signal reduces in amplitude, probably due to the pulverized stone being subsequently flattened by each pass of a wheel. This is not the case for a rail break where each axle should create a similar impact force. This difference may therefore potentially allow the distinction between stones on the rail and a rail break. As mentioned, driving over stones, sometimes placed on the rails (e.g., from children), feels like a broken rail for the train driver. In the experiment it could be seen, that gravel on the rail can also be detected with DAS.
5. Conclusions
The main research conclusion was that distributed acoustic sensing (DAS) has good potential for detecting broken rails. The processed DAS data were able to identify a rail gap (break) at all the widths tested, but the gaps were most obvious at velocities ≥ 25 km/h. The most promising analysis techniques for identifying gaps were gradient analysis, convolution using the train consist, and 2D sinusoidal convolution. The DAS data were also able to identify the moment a rail breaks and were able to distinguish between stones on the tracks and rail breaks.
These results show that DAS could be a suitable technology for detecting broken rails. Due to the widespread use of fibre optics beneath railway lines and the resulting cable troughs, it would be possible to implement this technology without drastic infrastructure measures. For example, if track circuits are replaced by axle counters, this could be a good opportunity to introduce DAS as an additional technology. Therefore, further research is needed to gather results and experience from the real environment. There is also an opportunity, to research how the results of DAS can be incorporated into the safety logic of railway operations. In a target state, for example, the information should be directly transmitted to the interlocking when a broken rail is detected. As a direct consequence, all signals would have to change to stop and train operation on the track should stop to avoid damage. At the same time, the detected position of the rail break could help maintenance staff respond quickly to the break. As the position can limit the area in which they have to search after a broken rail is reported.
The full research report and data have been documented in the UIC Broken Rail Detection Project Work Package 6 Report [17].
Author Contributions
Conceptualization, F.M. and H.G.; methodology, A.W.; software, G.L.; validation, G.L., F.M. and A.W.; formal analysis, G.L.; investigation, H.G., F.M., A.W. and A.N.; resources, F.M.; data curation, G.L.; writing—original draft preparation, A.N.; writing—review and editing, A.W.; visualization, G.L.; supervision, F.M.; project administration, F.M.; funding acquisition, F.M. All authors have read and agreed to the published version of the manuscript.
Funding
The project was initiated and funded by the UIC (International Union of Railways). The aim of the Broken Rail Detection project was to identify and test new technologies and methods for the cost-effective detection of broken rails. Project code: 2016/RSF/502.
Data Availability Statement
Not applicable.
Acknowledgments
The authors would like to take this opportunity to thank the participants from the ÖBB Education Centre Wörth, who helped during the practical field tests and prepared the track sections as required.
Conflicts of Interest
The funders had no role in the design of the study; in the collection, analyses, or interpretation of data; in the writing of the manuscript; or in the decision to publish the results.
References
- Maschek, U. Grundlagen und Planung der Leit- und Sicherungstechnik. In Sicherung des Schienenverkehrs, 3rd ed.; Springer: Berlin/Heidelberg, Germany, 2015; pp. 46–49. (In German) [Google Scholar]
- International Union of Railways (UIC); Broken Rail Detection Project. Available online: https://uic.org/projects/design-definition-and-localisation-of-a-trackcircuit-for-detection-of-broken-rails-without-detect-349#Project-description (accessed on 11 October 2022).
- Lester, D. Broken Rails: An Unexpected Pain. Breaks Are Declining but Problems Persist. Trains Magazine. 2017. Available online: https://www.trains.com/trn/train-basics/abcs-of-railroading/broken-rails-an-unexpected-pain/ (accessed on 11 October 2022).
- Liu, X.; Rapik, S.; Barkan, C.P.L. Analysis of Causes of Major Train Derailment and Their Effect on Accident Rates; Transportation Research Record. J. Transp. Res. Board Natl. Acad. 2012, 2289, 154–163. [Google Scholar] [CrossRef]
- Thales. White Paper: Do You Really Need A Fallback System with Communications-Based Train Control (CBTC)? Thales: Toronto, ON, Canada, 2020. [Google Scholar]
- Ekberg, A.; Kabo, E. Surface Fatigue Initiated Transverse Defects and Broken Rails—An International Review; Research Report, Chalmer University of Technology, Gothenburg, Sweden 2014. Available online: http://publications.lib.chalmers.se/records/fulltext/203928/203928.pdf (accessed on 29 December 2022).
- Schwartz, K. Development of an Acoustic Broken Rail Detection System; Final Report for High-Speed Rail IDEA Project; IDEA: Washington, DC, USA, 2004. [Google Scholar]
- Zhai, W.; Wang, K.; Cai, C. Fundamentals of vehicle–track coupled dynamics. Veh. Syst. Dyn. 2009, 47, 1349–1376. [Google Scholar] [CrossRef]
- Song, Y.; Wang, Z.; Liu, Z.; Wang, R. A spatial coupling model to study dynamic performance of pantograph-catenary with vehicle-track excitation. Mech. Syst. Signal Process. 2021, 151, 107336. [Google Scholar] [CrossRef]
- Kumar, S. Study of Rail Breaks: Associated Risks and Maintenance Strategies, Technical Report; Lulea Railway Research Center, Lulea University of Technology: Lulea, Sweden, 2006. [Google Scholar]
- Thakkar, N.A.; Steel John, A.; Reuben, R.L.; Knabe, G.; Dixon, D.; Shanks, R.L. Monitoring of Rail- Wheel Interaction Using Acoustic Emission (AE). Adv. Mater. Res. 2006, 13, 161–168. [Google Scholar] [CrossRef]
- Theeg, G.; Vlasenko, S. Railway Signalling & Interlocking. International Compendium; Eurail-press: Hamburg, Germany, 2009. [Google Scholar]
- Thurston, D.F. Broken Rail Detection, Practical Application of New Technology or Risk Mitigation Approaches. IEEE Vehicular Technology Magazine, 18 August 2014; 80–85. [Google Scholar]
- Grossberger, H.; Martin, K.; Frank, M. UIC Project: Broken Rail Detection Systems, WP1: State of the art analysis report; working paper. 23 October 2017. Available online: https://phaidra.fhstp.ac.at/o:5036 (accessed on 29 December 2022).
- Abdelrahman, M.A. Evaluation of Concrete Degradation Using Acoustic Emission: Data Filtering and Damage Detection. Doctoral Dissertation, University of South Carolina, Columbia, SC, USA, 2016. Available online: https://scholarcommons.sc.edu/etd/3990 (accessed on 29 December 2022).
- Facciottto, N.; Troiani, E.; Marcias, M. Source Identification and Classification of Accoustic Emission Signals by a SHAZAM Inspired Pattern Recognition Algorithm. In Proceedings of the International Workshop on Structural Health Monitoring (IWSHM 2017), Palo Alto, CA, USA, 12–14 September 2017. [Google Scholar] [CrossRef]
- Michelberger, F. Broken Rail Detection-WP6: Demonstrator Based on DAS (Distributed Acoustic Sensing); 26 June 2019. Research Projects: Carl Ritter von Ghega Institute for Integrated Mobility, University of Applied Sciences St. Pölten, Austria. Available online: https://research.fhstp.ac.at/en/projects/brd-broken-rail-detection (accessed on 29 December 2022).
Figure 1.
Functional principle of track circuits. Source based on: [1].
Figure 1.
Functional principle of track circuits. Source based on: [1].

Figure 2.
Broken rail detecting methodology flowchart.

Figure 3.
Schematic illustration of experiment test track section.

Figure 4.
Acceleration data from a sensor mounted on the rail (blue) and in the trough (red).

Figure 5.
Vibrational power reaching the trough as a function of train velocity and gap width.

Figure 6.
Raw DAS data with the train position shown in red dashed lines and positions of two rail joints (red and yellow crosses).
Figure 6.
Raw DAS data with the train position shown in red dashed lines and positions of two rail joints (red and yellow crosses).

Figure 7.
Gradient analysis with a gap of 25 mm and a speed of 25 km/h. Vertical axis is time, horizontal axis is distance.
Figure 7.
Gradient analysis with a gap of 25 mm and a speed of 25 km/h. Vertical axis is time, horizontal axis is distance.

Figure 8.
Example of a train consists kernel of the train composition.

Figure 9.
Train consist convolution with a gap of 25 mm and a speed of 25 km/h.

Figure 10.
An example of a typical 2-D sinusoidal kernel.

Figure 11.
2-D sinusoidal convolution with a 25 mm gap and a speed of 25 km/h, vertical axis is time, horizontal axis is distance.
Figure 11.
2-D sinusoidal convolution with a 25 mm gap and a speed of 25 km/h, vertical axis is time, horizontal axis is distance.

Figure 12.
Bandpass analysis of rail break event with a peak when the rail brakes in the overlapped bandpass powers (bottom right).
Figure 12.
Bandpass analysis of rail break event with a peak when the rail brakes in the overlapped bandpass powers (bottom right).

Figure 13.
2D sinusoidal convolution applied to DAS data of train running over two stones. Signal is observed at the position of the stones (red triangles).
Figure 13.
2D sinusoidal convolution applied to DAS data of train running over two stones. Signal is observed at the position of the stones (red triangles).

Disclaimer/Publisher’s Note: The statements, opinions and data contained in all publications are solely those of the individual author(s) and contributor(s) and not of MDPI and/or the editor(s). MDPI and/or the editor(s) disclaim responsibility for any injury to people or property resulting from any ideas, methods, instructions or products referred to in the content. |
© 2023 by the authors. Licensee MDPI, Basel, Switzerland. This article is an open access article distributed under the terms and conditions of the Creative Commons Attribution (CC BY) license (https://creativecommons.org/licenses/by/4.0/).
Share and Cite
MDPI and ACS Style
Wagner, A.; Nash, A.; Michelberger, F.; Grossberger, H.; Lancaster, G. The Effectiveness of Distributed Acoustic Sensing (DAS) for Broken Rail Detection. Energies 2023, 16, 522. https://0-doi-org.brum.beds.ac.uk/10.3390/en16010522
AMA Style
Wagner A, Nash A, Michelberger F, Grossberger H, Lancaster G. The Effectiveness of Distributed Acoustic Sensing (DAS) for Broken Rail Detection. Energies. 2023; 16(1):522. https://0-doi-org.brum.beds.ac.uk/10.3390/en16010522
Chicago/Turabian StyleWagner, Adrian, Andrew Nash, Frank Michelberger, Hirut Grossberger, and Gavin Lancaster. 2023. "The Effectiveness of Distributed Acoustic Sensing (DAS) for Broken Rail Detection" Energies 16, no. 1: 522. https://0-doi-org.brum.beds.ac.uk/10.3390/en16010522
Note that from the first issue of 2016, this journal uses article numbers instead of page numbers. See further details here.