
The La+3-, Nd+3-, Bi+3-Doped Ceria as Mixed Conductor Materials for Conventional and Single-Component Solid Oxide Fuel Cells

Abstract
:1. Introduction
2. Experimental Detail
2.1. Synthesis of A2Ce2O7−δ (A = La+3, Nd+3, Bi+3) Nanocomposite
2.2. Fabrication of Pellet
2.3. Characterization Techniques for Material and Fuel Cell Analysis
3. Results
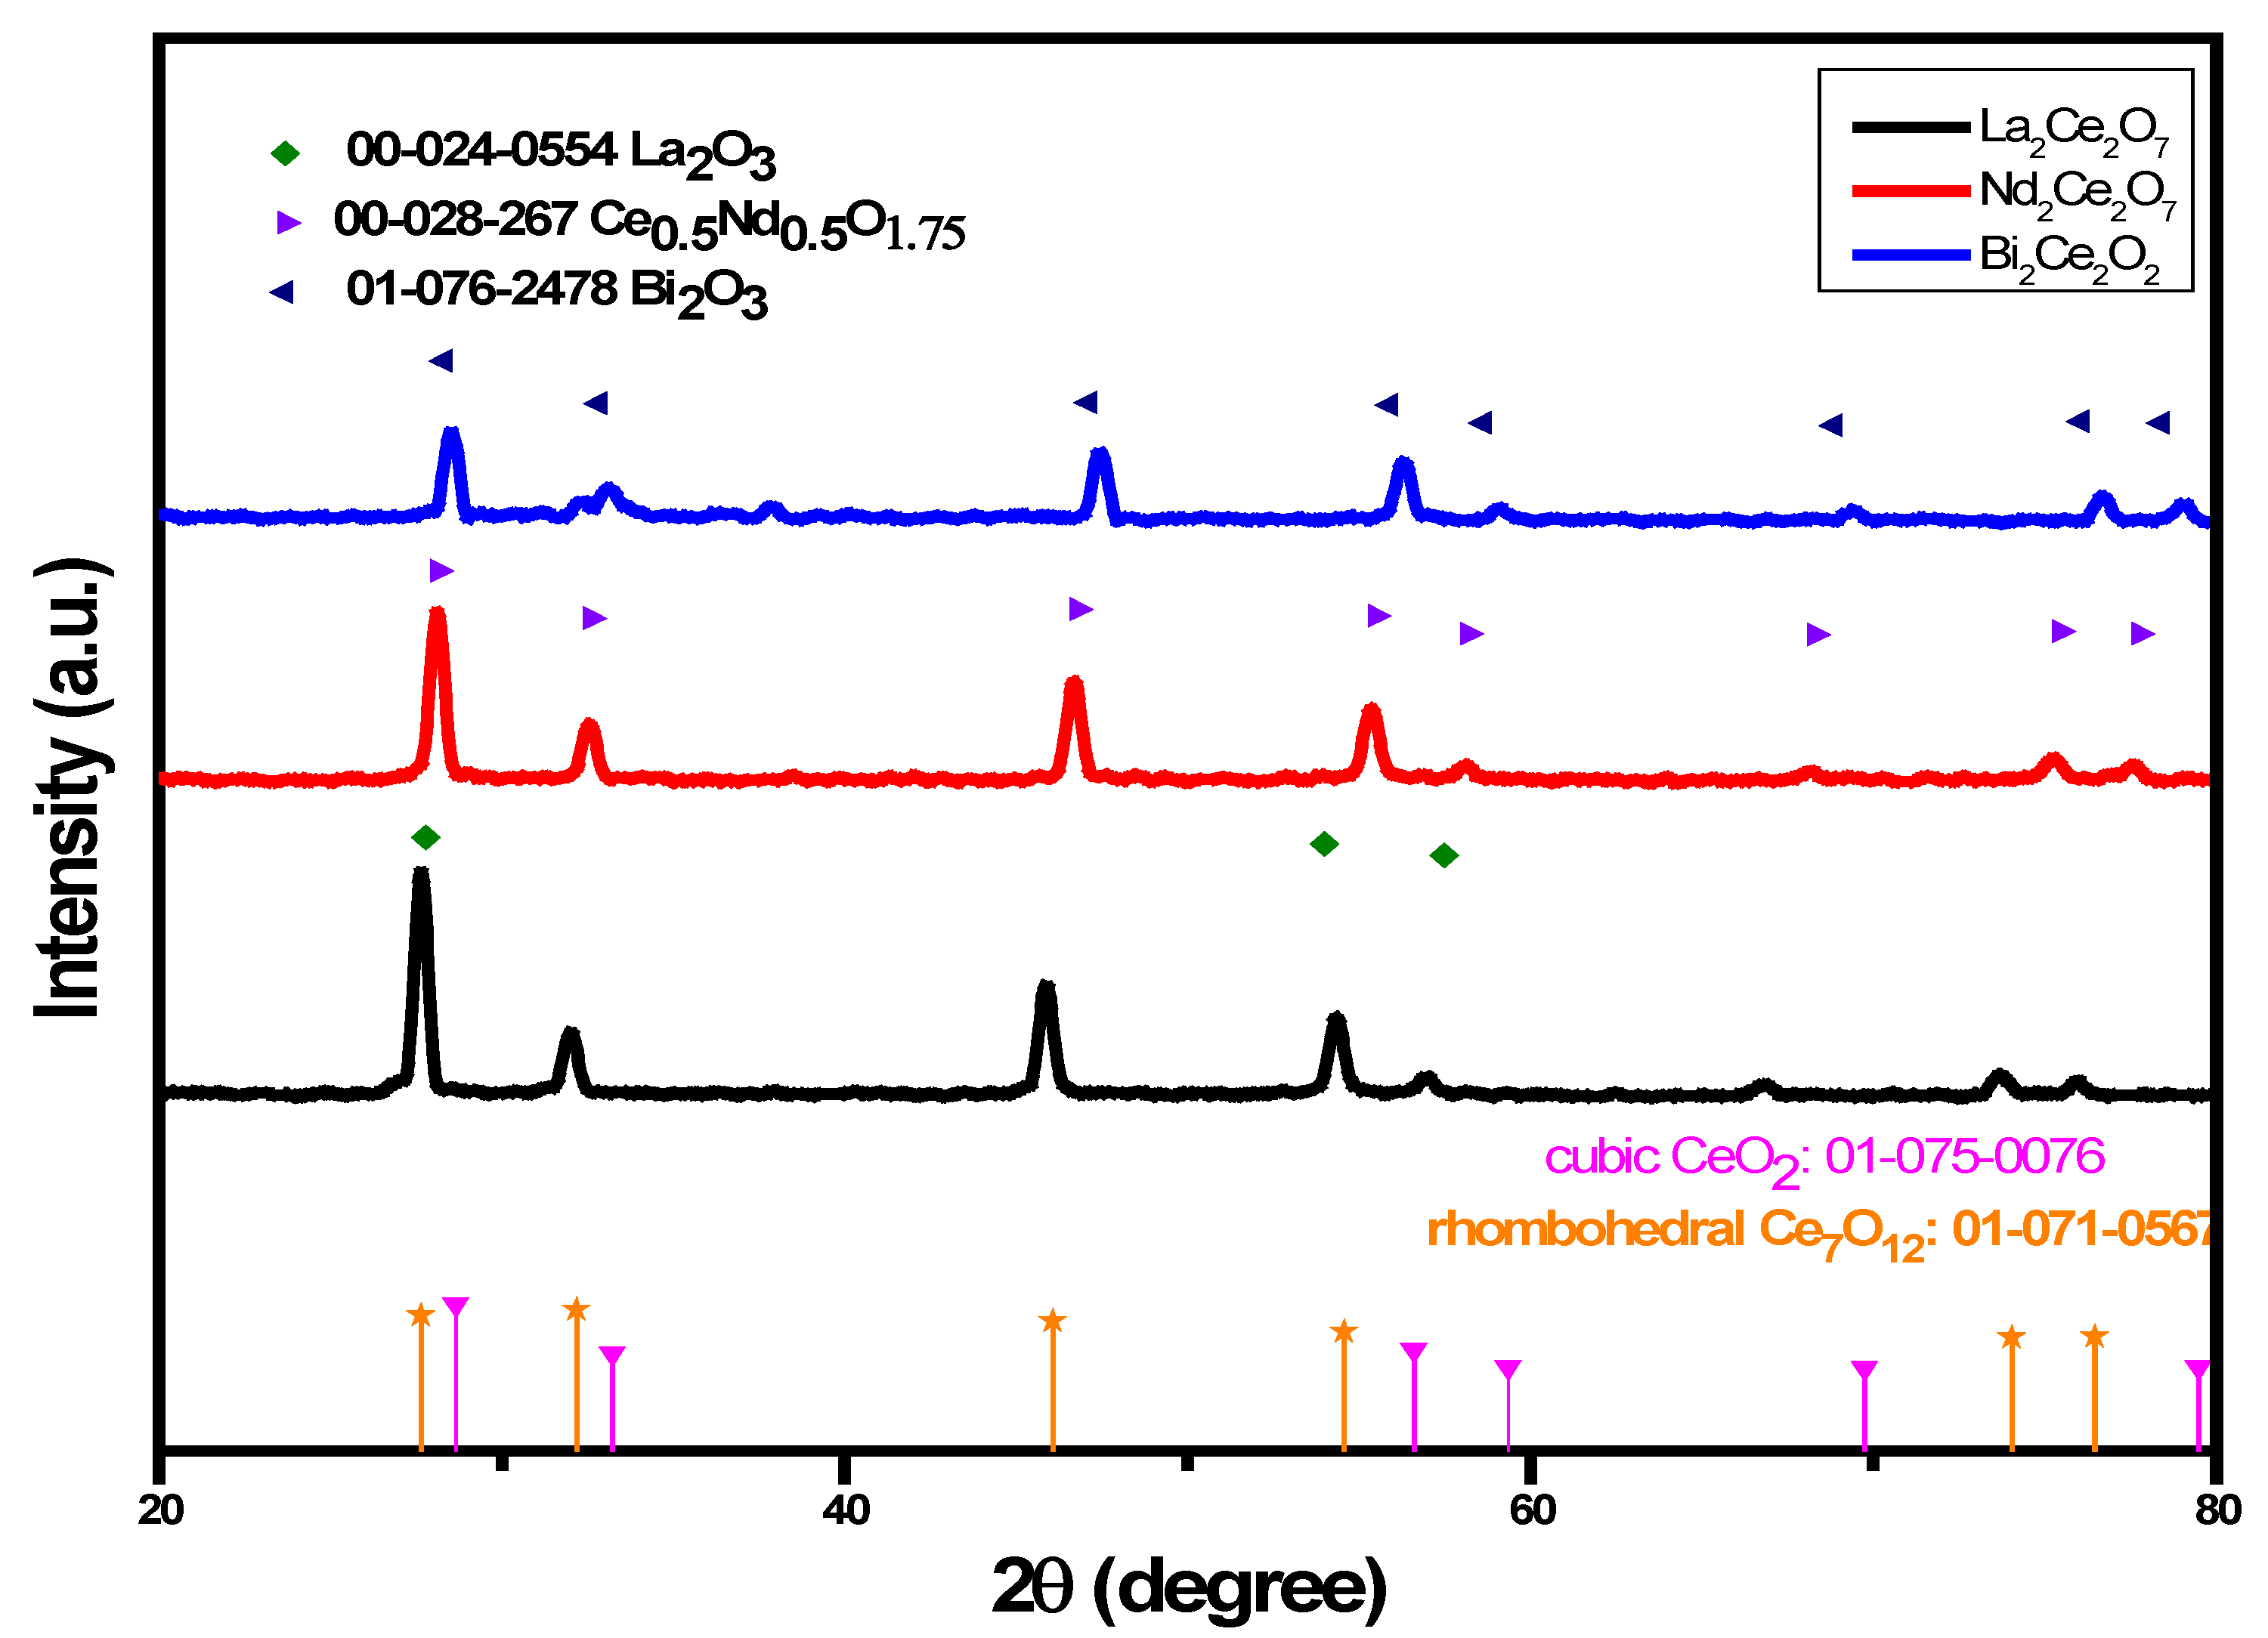
3.1. XRD Analysis for A2Ce2O7 (A = La+3, Nd+3, Bi+3) Nanocomposite
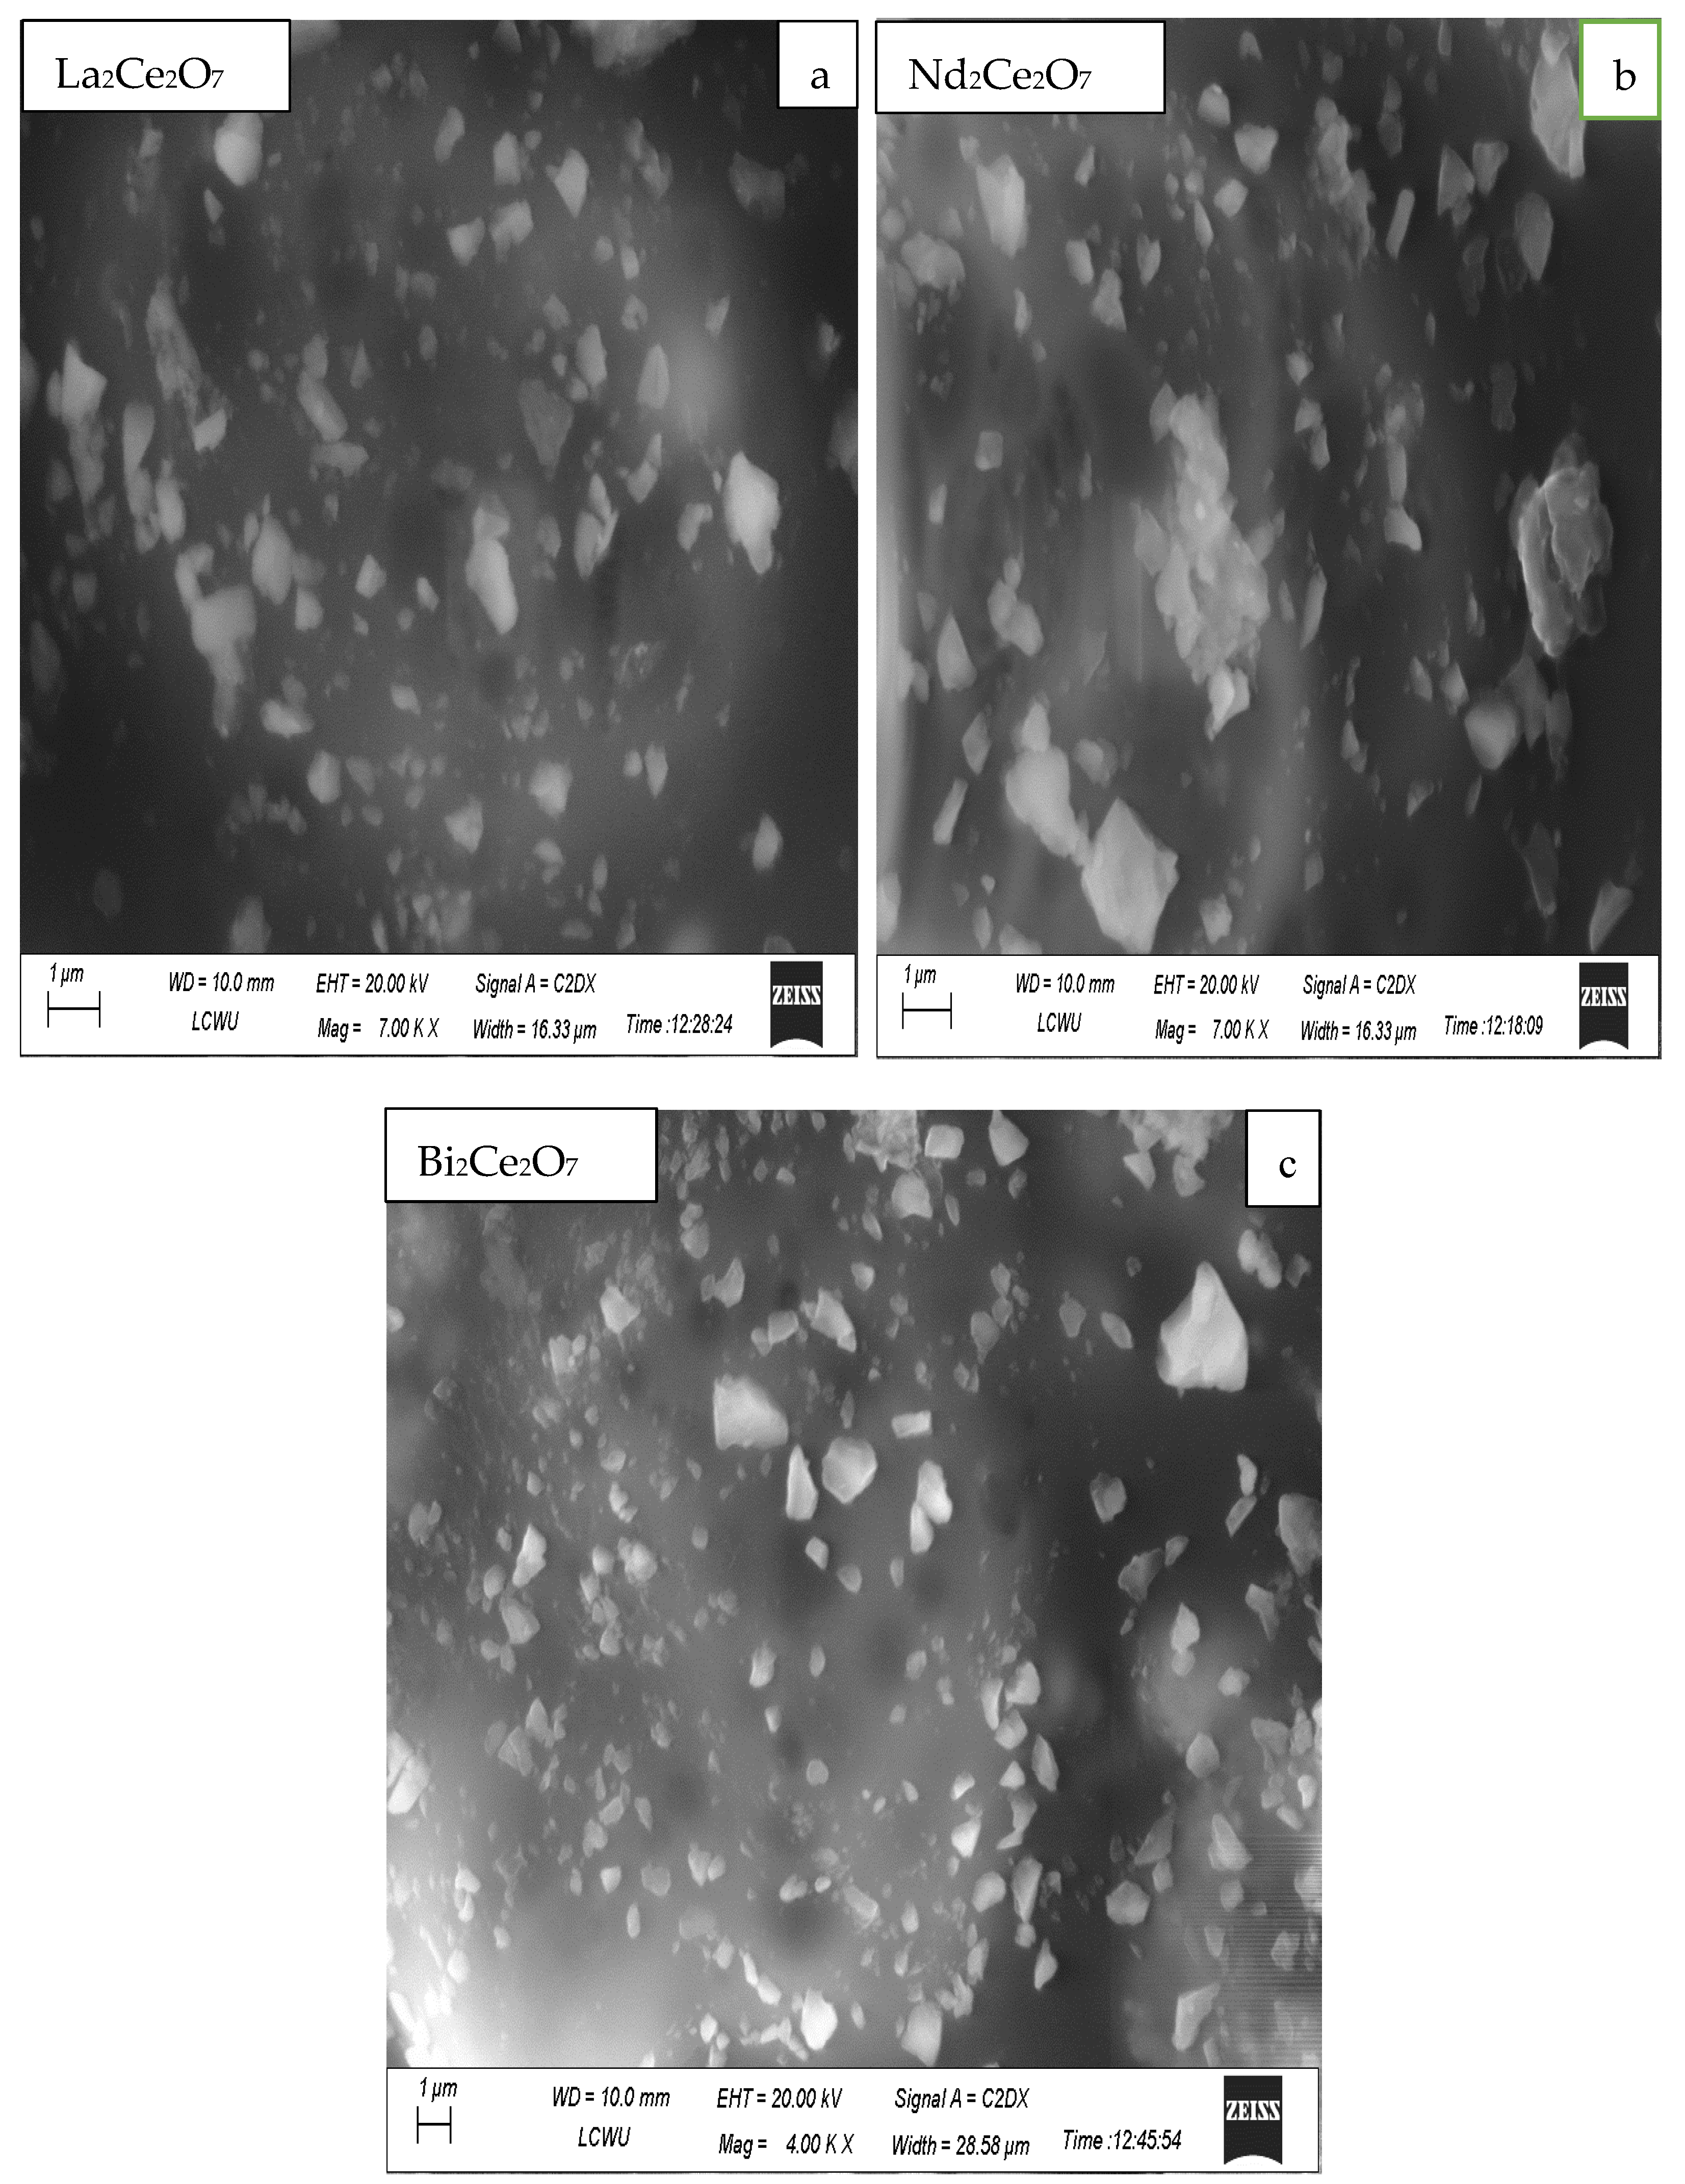
3.2. Microstructure Analysis
3.3. UV–Visible Analysis (200 to 800 Nanometers)
3.4. FTIR Spectra of A2Ce2O7−δ (A = La3+, Nd3+, Bi3+)
3.5. Analysis of Crystal Structure and Oxygen Vacancies by Raman Spectroscopy
3.6. Electrochemical Impedance Spectroscopy (EIS)
3.7. The Cell Performance with Hydrogen Fuel Using Conventional Fuel Cells
- (i)
- A2Ce2O7−δ (A = La3+, Nd3+, Bi3+) were used as an electrolyte in conventional SOFCs with LNCZ as an anode and LSCF as a cathode.
- (ii)
- For a single-component solid oxide fuel cell (SC-SOFC), a mixture of ionic- and semiconductors was used as a single layer. The performance was tested with the mixtures A2Ce2O7−δ/NCAL and then A2Ce2O7−δ/ZnO.
4. Conclusions
Supplementary Materials
Author Contributions
Funding
Data Availability Statement
Conflicts of Interest
References and Notes
- Singh, M.; Zappa, D.; Comini, E. Solid oxide fuel cell: Decade of progress, future perspectives and challenges. Int. J. Hydrogen Energy 2021, 46, 27643–27674. [Google Scholar] [CrossRef]
- Zakaria, Z.; Kamarudin, S.K. Advanced modification of Scandia-stabilized zirconia electrolytes for solid oxide fuel cells application—A review. Int. J. Energy Res. 2021, 45, 4871–4887. [Google Scholar] [CrossRef]
- Zhu, B.; Mi, Y.; Xia, C.; Wang, B.; Kim, J.-S.; Lund, P.; Li, T. A nanoscale perspective on solid oxide and semiconductor membrane fuel cells: Materials and technology. Energy Mater. 2022, 1, 100002. [Google Scholar] [CrossRef]
- Lu, Y.; Mi, Y.; Li, J.; Qi, F.; Yan, S.; Dong, W. Recent Progress in Semiconductor-Ionic Conductor Nanomaterial as a Membrane for Low-Temperature Solid Oxide Fuel Cells. Nanomaterials 2021, 11, 2290. [Google Scholar] [CrossRef]
- Mohebbi, H.; Mirkazemi, S.M. Controlling Yttria-stabilized zirconia/gadolinia-doped ceria interdiffusion layer in the solid oxide fuel cell electrolyte via flash sintering method. Ionics 2021, 27, 5219–5227. [Google Scholar] [CrossRef]
- Alipour, S.; Sagir, E.; Sadeghi, A. Multi-criteria decision-making approach assisting to select materials for low-temperature solid oxide fuel cell: Electrolyte, cathode& anode. Int. J. Hydrogen Energy 2022, 47, 19810–19820. [Google Scholar] [CrossRef]
- Chen, M.; Luo, J.-L.; Chuang, K.T.; Sanger, A.R. Fabrication and electrochemical properties of cathode-supported solid oxide fuel cells via slurry spin coating. Electrochim. Acta 2012, 63, 277–286. [Google Scholar] [CrossRef]
- Thajudheen, T. Spectroscopic Investigation of Oxygen Vacancies in CeO2; University of Nova Gorica: Rožna Dolina, Slovenia, 2021. [Google Scholar]
- Mamedov, D.; Karazhanov, S.Z. Doping-induced modulation of electronic, optical and wetting properties of CeO2. J. Phys. Chem. Solids 2022, 168, 110820. [Google Scholar] [CrossRef]
- Pesaran, A.; Jaiswal, A.; Ren, Y.; Wachsman, E.D. Development of a new ceria/yttria-ceria double-doped bismuth oxide bilayer electrolyte low-temperature SOFC with higher stability. Ionics 2019, 25, 3153–3164. [Google Scholar] [CrossRef]
- Kalland, L.-E.Q. Ab Initio Modelling and Experimental Studies of Order-Disorder, Hydration, and Ionic Conductivity of Fluorite Related Oxides. Ph.D. Thesis, University of Oslo, Oslo, Norway, 2021. [Google Scholar]
- Cheng, S. Defects and Transport in Fluorite Related Materials Nd2Ce2O7 and Gd2Ce2O7. Master’s Thesis, University of Oslo, Oslo, Norway, 2012. [Google Scholar]
- Jiang, Y.; Song, X.; Zhong, Z.; Lian, Z.; Peng, K. Sintering and electrochemical performance of Nd2Ce2O7 electrolyte with Bi7WO13.5 sintering aid for proton conductor solid oxide fuel cells. J. Alloys Compd. 2020, 836, 155539. [Google Scholar] [CrossRef]
- Cardenas-Terrazas, P.S.; Ayala-Ayala, M.T.; Muñoz-Saldaña, J.; Fuentes, A.F.; Leal-Chavez, D.A.; Ledezma-Sillas, J.E.; Carreño-Gallardo, C.; Herrera-Ramirez, J.M. High ionic conductivity dysprosium and tantalum Co-doped bismuth oxide electrolyte for low-temperature SOFCs. Ionics 2020, 26, 4579–4586. [Google Scholar] [CrossRef]
- Shri Prakash, B.; Pavitra, R.; Senthil Kumar, S.; Aruna, S.T. Electrolyte bi-layering strategy to improve the performance of an intermediate temperature solid oxide fuel cell: A review. J. Power Sources 2018, 381, 136–155. [Google Scholar] [CrossRef]
- Rout, S.K.; Pratihar, S. Tailoring of properties in the preparation level of nano crystalline Ce0.8Sm0.2O1.9-δ(SDC) for the use of SOFC electrolyte. Mater. Today Proc. 2021, 45, 5764–5768. [Google Scholar] [CrossRef]
- Malešević, A.; Radojković, A.; Žunić, M.; Dapčević, A.; Perać, S.; Branković, Z.; Branković, G.J.J.o.A.C. Evaluation of stability and functionality of BaCe1−x InxO3−δ electrolyte in a wider range of indium concentration. J. Adv. Ceram. 2022, 11, 443–453. [Google Scholar] [CrossRef]
- Davar, F.; Hassankhani, A.; Loghman-Estarki, M.R. Controllable synthesis of metastable tetragonal zirconia nanocrystals using citric acid assisted sol–gel method. Ceram. Int. 2013, 39, 2933–2941. [Google Scholar] [CrossRef]
- Tang, A.; Li, B.; Sang, W.; Hongsong, Z.; Chen, X.; Zhang, H.; Ren, B. Thermophysical performances of high-entropy (La0.2Nd0.2Yb0.2Y0.2Sm0.2)2Ce2O7 and (La0.2Nd0.2Yb0.2Y0.2Lu0.2)2Ce2O7 oxides. Ceram. Int. 2021, 48, 5574–5580. [Google Scholar] [CrossRef]
- Akbar, M.; Alvi, F.; Shakir, M.I.; Rehman, S.U.; Rafique, A.; Mushtaq, N.; Raza, R. Effect of sintering temperature on properties of LiNiCuZn-Oxide: A potential anode for solid oxide fuel cell. Mater. Res. Express 2019, 6, 105505. [Google Scholar] [CrossRef]
- Voloshin, B.; Koshevoi, E.; Ulihin, A.; Popov, M.; Nemudry, A.P. Modifying the La0.6Sr0.4Co0.2Fe0.8O3–δ cathodic material by ferroactive molybdenum cation. Russ. J. Electrochem. 2022, 58, 163–167. [Google Scholar] [CrossRef]
- Chen, G.; Sun, W.; Luo, Y.; Liu, H.; Geng, S.; Yu, K.; Liu, G. Investigation of layered Ni0.8Co0.15Al0.05LiO2 in electrode for low-temperature solid oxide fuel cells. Int. J. Hydrogen Energy 2018, 43, 417–425. [Google Scholar] [CrossRef]
- Hussain, S.; Li, Y.; Mustehsin, A.; Ali, A.; Thebo, K.H.; Ali, Z.; Hussain, S.J.I. Synthesis and characterization of ZnO/samarium-doped ceria nanocomposites for solid oxide fuel cell applications. Ionics 2021, 27, 4849–4857. [Google Scholar] [CrossRef]
- Yi, H.; Che, J.; Xu, Z.; Liang, G.; Liu, X.J.C.I. Sintering resistance of La2Ce2O7, La2Zr2O7, and yttria stabilized zirconia ceramics. Ceram. Int. 2021, 47, 4197–4205. [Google Scholar] [CrossRef]
- Kumar, D.; Kumar, A.; Prakash, R.; Singh, A.K. X-ray diffraction analysis of Cu2+ doped Zn1-xCuxFe2O4 spinel nanoparticles using Williamson-Hall plot method. AIP Conf. Proc. 2019, 2142, 070018. [Google Scholar] [CrossRef] [Green Version]
- Ali, U. Multi Doped Ceria based Electrolyte for Low Temperature Solid Oxide Fuel Cell. 2021. [Google Scholar]
- Zamudio-García, J.; dos Santos-Gómez, L.; Porras-Vázquez, J.M.; Losilla, E.R.; Marrero-López, D. Doping effects on the structure and electrical properties of La2Ce2O7 proton conductors. J. Alloys Compd. 2019, 816, 152600. [Google Scholar] [CrossRef]
- Hull, S.; Norberg, S.; Ahmed, I.; Eriksson, S.; Marrocchelli, D.; Madden, P. Oxygen vacancy ordering within anion-deficient Ceria. J. Solid State Chem. 2009, 182, 2815–2821. [Google Scholar] [CrossRef]
- Zhang, S.; Savaniu, C.; Irvine, J. Fluorite Materials for SOFC Electrolyte Applications. ECS Trans. 2019, 91, 1111–1119. [Google Scholar] [CrossRef]
- Bekheet, M.F.; Grünbacher, M.; Schlicker, L.; Gili, A.; Doran, A.; Epping, J.D.; Gurlo, A.; Klötzer, B.; Penner, S. On the structural stability of crystalline ceria phases in undoped and acceptor-doped ceria materials under in situ reduction conditions. Crystengcomm 2018, 21, 145–154. [Google Scholar] [CrossRef] [Green Version]
- Zou, D.; Yi, Y.; Song, Y.; Guan, D.; Xu, M.; Ran, R.; Wang, W.; Zhou, W.; Shao, Z. The BaCe0.16Y0.04Fe0.8O3−δ nanocomposite: A new high-performance cobalt-free triple-conducting cathode for protonic ceramic fuel cells operating at reduced temperatures. J. Mater. Chem. A 2022, 10, 5381–5390. [Google Scholar] [CrossRef]
- Komatsu, Y.; Sciazko, A.; Shikazono, N. Isostatic pressing of screen printed nickel-gadolinium doped ceria anodes on electrolyte-supported solid oxide fuel cells. J. Power Sources 2021, 485, 229317. [Google Scholar] [CrossRef]
- Ali, M.M.; Mahdi, H.S.; Parveen, A.; Azam, A. Optical properties of cerium oxide (CeO2) nanoparticles synthesized by hydroxide mediated method. AIP Conf. Proc. 2018, 1953, 030044. [Google Scholar] [CrossRef]
- Bakiro, M.; Ahmed, S.H.; Alzamly, A. Investigation of the band gap energy shift and photocatalytic properties of Bi3+-doped ceria. Inorg. Chem. Commun. 2020, 116, 107906. [Google Scholar] [CrossRef]
- Gandhi, S.; Nagalakshmi, N.; Baskaran, I.; Dhanalakshmi, V.; Nair, M.R.G.; Anbarasan, R. Synthesis and characterization of nano-sized NiO and its surface catalytic effect on poly(vinyl alcohol). J. Appl. Polym. Sci. 2010, 118, 1666–1674. [Google Scholar] [CrossRef]
- Klingenberg, B.; Vannice, M.A. Influence of Pretreatment on Lanthanum Nitrate, Carbonate, and Oxide Powders. Chem. Mater. 1996, 8, 2755–2768. [Google Scholar] [CrossRef]
- Singh, K.; Kumar, R.; Chowdhury, A. Synthesis of La-doped ceria nanoparticles: Impact of lanthanum depletion. J. Mater. Sci. 2016, 51, 4134–4141. [Google Scholar] [CrossRef]
- Misevicius, M.; Scit, O.; Grigoraviciute-Puroniene, I.; Degutis, G.; Bogdanoviciene, I.; Kareiva, A. Sol–gel synthesis and investigation of un-doped and Ce-doped strontium aluminates. Ceram. Int. 2012, 38, 5915–5924. [Google Scholar] [CrossRef]
- Méndez, M.; Carvajal, J.; Cesteros, Y.; Aguiló, M.; Díaz, F.; Giguère, A.; Drouin, D.; Martínez-Ferrero, E.; Salagre, P.; Formentín, P.J.O.M. Sol–gel Pechini synthesis and optical spectroscopy of nanocrystalline La2O3 doped with Eu3+. Opt. Mater. 2010, 32, 1686–1692. [Google Scholar] [CrossRef]
- Lembang, M.S.; Yulizar, Y.; Sudirman, S.; Apriandanu, D.O.B. A facile method for green synthesis of Nd2O3 nanoparticles using aqueous extract of Terminalia catappa leaf. AIP Conf. Proc. 2018, 2023. [Google Scholar] [CrossRef]
- Yuliani, H.; Mayasari, R.D.; Kalembang, E.; Deni, Y.; Santi, D.R.; Pangestika, P.W.; Purwanto, S.; Sugeng, B.; Suyanti, S.; Setyadji, M. ANALYSIS OF STRUCTURE AND ANTIMICROBIAL ACTIVITY OF CeO2 AND Nd2O3 NANOPARTICLES. Spektra J. Fis. dan Apl. 2019, 4, 105–112. [Google Scholar] [CrossRef]
- Bandyopadhyay, S.; Dutta, A. Optical and ionic transport mechanism γ-phase stabilized nanostructured Bi-Ce-O ionic conductors: A structure-property correlation study. Ionics 2019, 25, 2873–2886. [Google Scholar] [CrossRef]
- Syed, A.; Yadav, L.S.R.; Bahkali, A.H.; Elgorban, A.M.; Hakeem, D.A.; Ganganagappa, N. Effect of CeO2-ZnO Nanocomposite for Photocatalytic and Antibacterial Activities. Crystals 2020, 10, 817. [Google Scholar] [CrossRef]
- Schmitt, R.; Nenning, A.; Kraynis, O.; Korobko, R.; Frenkel, A.I.; Lubomirsky, I.; Haile, S.M.; Rupp, J.L.M. A review of defect structure and chemistry in ceria and its solid solutions. Chem. Soc. Rev. 2020, 49, 554–592. [Google Scholar] [CrossRef] [Green Version]
- Kainbayev, N.; Sriubas, M.; Virbukas, D.; Rutkuniene, Z.; Bockute, K.; Bolegenova, S.; Laukaitis, G. Raman Study of Nanocrystalline-Doped Ceria Oxide Thin Films. Coatings 2020, 10, 432. [Google Scholar] [CrossRef]
- Xu, J.; Zhang, Y.; Liu, Y.; Fang, X.; Xu, X.; Liu, W.; Zheng, R.; Wang, X.J.E.J.o.I.C. Optimizing the Reaction Performance of La2Ce2O7-Based Catalysts for Oxidative Coupling of Methane (OCM) at Lower Temperature by Lattice Doping with Ca Cations. Eur. J. Inorg. Chem. 2019, 2019, 183–194. [Google Scholar] [CrossRef]
- Sato, T.; Tateyama, S. Temperature dependence of the linewidth of the first-order Raman spectrum for crystalline CeO2. Phys. Rev. B 1982, 26, 2257–2260. [Google Scholar] [CrossRef]


| Samples | Angle | FWHM | Crystallite Size (nm) | Lattice Constant (A°) | Lattice Strain (ε) | Phase |
|---|---|---|---|---|---|---|
| La2Ce2O7 | 27.67 | 0.4260 | 20.07 | 5.5730 | −0.15423 | Cubic |
| Nd2Ce2O7 | 28.11 | 0.449 | 19.06 | 5.4890 | −0.6769 | Cubic |
| Bi2Ce2O7 | 28.52 | 0.49 | 17.48 | 5.4113 | 0.488572 | Cubic |
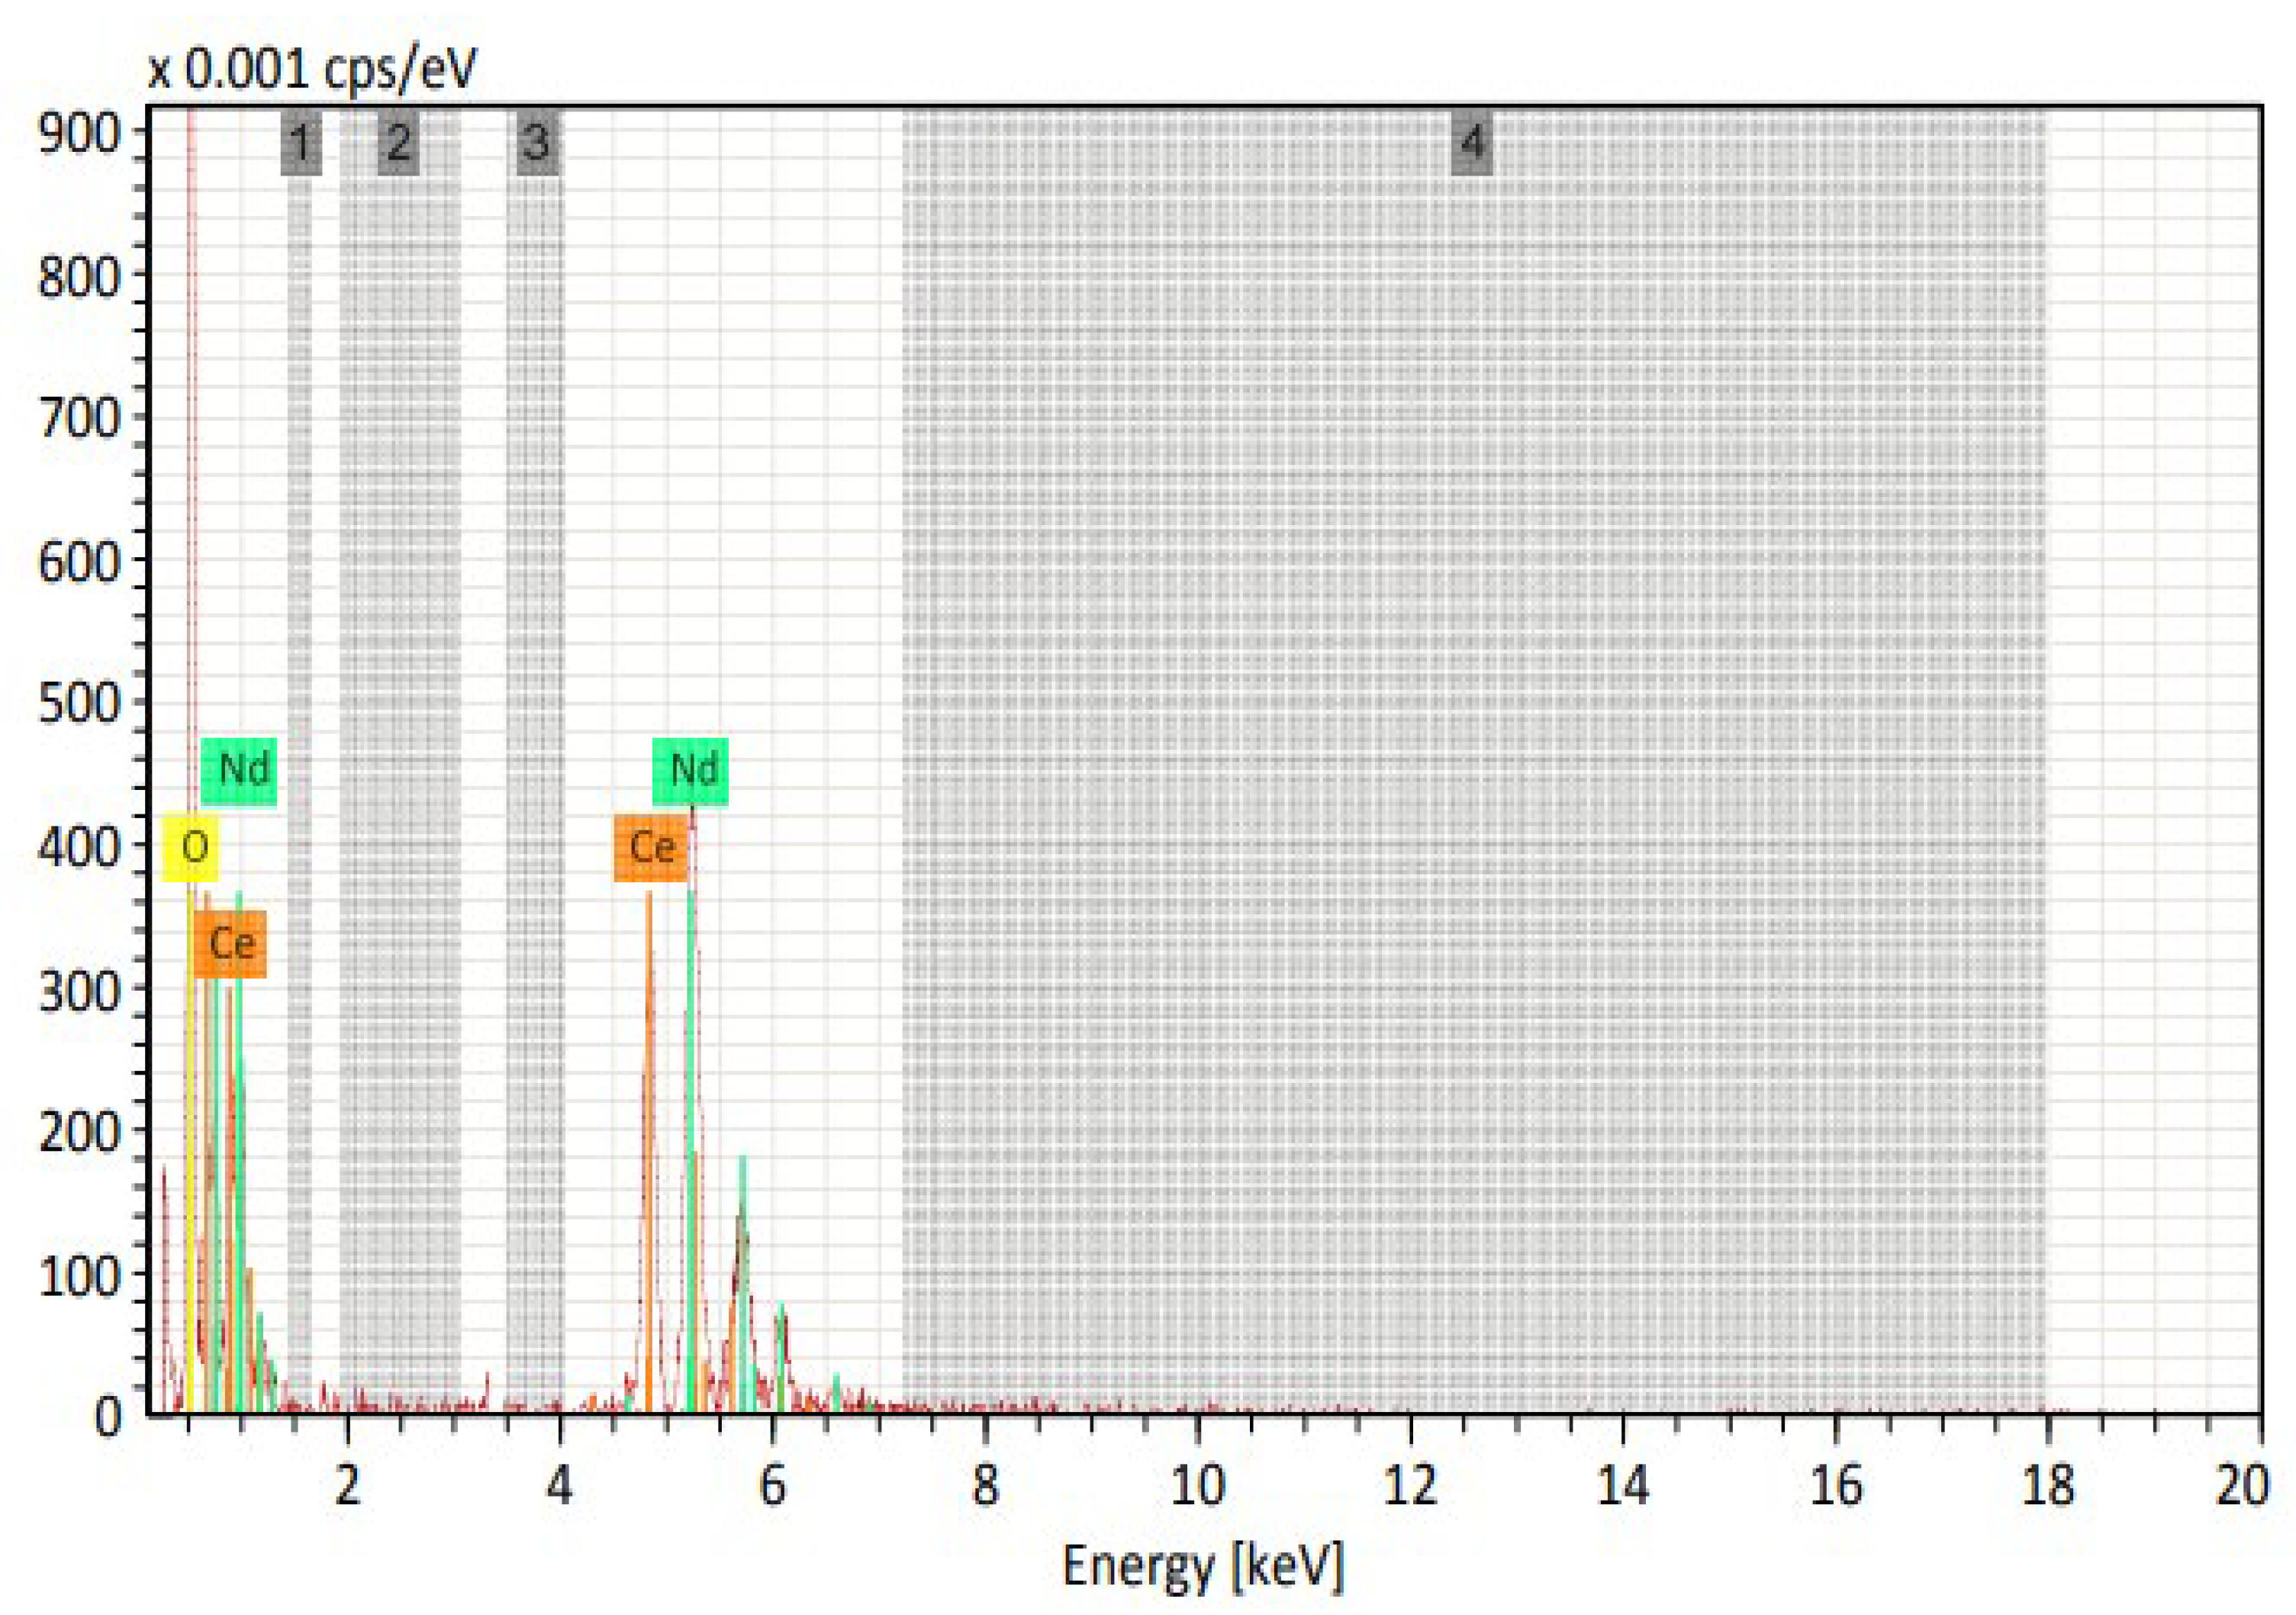
| Element | Weight% | Atomic% |
|---|---|---|
| O K | 32.14 | 80.80 |
| Ce L | 33.15 | 9.52 |
| Nd L | 34.71 | 9.68 |
| Total | 100 |
Disclaimer/Publisher’s Note: The statements, opinions and data contained in all publications are solely those of the individual author(s) and contributor(s) and not of MDPI and/or the editor(s). MDPI and/or the editor(s) disclaim responsibility for any injury to people or property resulting from any ideas, methods, instructions or products referred to in the content. |
© 2023 by the authors. Licensee MDPI, Basel, Switzerland. This article is an open access article distributed under the terms and conditions of the Creative Commons Attribution (CC BY) license (https://creativecommons.org/licenses/by/4.0/).
Share and Cite
Bukhari, M.; Mohsin, M.; Kayani, Z.N.; Rasool, S.; Raza, R. The La+3-, Nd+3-, Bi+3-Doped Ceria as Mixed Conductor Materials for Conventional and Single-Component Solid Oxide Fuel Cells. Energies 2023, 16, 5308. https://0-doi-org.brum.beds.ac.uk/10.3390/en16145308
Bukhari M, Mohsin M, Kayani ZN, Rasool S, Raza R. The La+3-, Nd+3-, Bi+3-Doped Ceria as Mixed Conductor Materials for Conventional and Single-Component Solid Oxide Fuel Cells. Energies. 2023; 16(14):5308. https://0-doi-org.brum.beds.ac.uk/10.3390/en16145308
Chicago/Turabian StyleBukhari, Mahrukh, Munazza Mohsin, Zohra Nazir Kayani, Shahzad Rasool, and Rizwan Raza. 2023. "The La+3-, Nd+3-, Bi+3-Doped Ceria as Mixed Conductor Materials for Conventional and Single-Component Solid Oxide Fuel Cells" Energies 16, no. 14: 5308. https://0-doi-org.brum.beds.ac.uk/10.3390/en16145308