1. Introduction
Large quantities of hydrogen could be produced through various sources and released into the containment atmosphere during an accident progression. Hydrogen is a highly flammable gas that could react with oxygen and generate thermo-mechanical loads higher than the design limits of the containment structure. Produced hydrogen gas mainly by zirconium oxidation mixes with air and steam and forms a gas mixture that could be flammable depending on the composition of the mixture, pressure, and temperature following a loss of coolant accident (LOCA). Since containment is the final barrier that prevents radioactive releases into the environment, hydrogen released into the containment should be investigated carefully by taking into account any explosion risk with an ignition source.
Previously, the core melted down to the lower plenum of the reactor pressure vessel at the Three Mile Island 2 nuclear power plant (NPP) in 1979. Approximately 350 kg of hydrogen was produced because of the zirconium-water reaction. Subsequent hydrogen combustion caused a pressure peak at around 2.8 bar, but the containment did not fail due to its design pressure limit being around 5 bar [
1]. In 2011, a colossal tsunami wave hit the reactor buildings of the Fukushima Nuclear Power Plant (NPP) after an earthquake. The damaged diesel generators stopped working and this led to a long-duration station blackout accident. The accident progressed and hydrogen explosions occurred in three units out of a total of six units, inflicting substantial damage to the facilities and primary and secondary containment structures [
2]. In light of these two accidents, it could be stated that hydrogen in NPPs poses a significant threat to the confinement of radioactivity within the reactor building and needs to be monitored and evaluated continuously.
After the TMI-2 accident in 1979, the nuclear safety community started to extensively investigate hydrogen combustion phenomena following a severe accident. In the 1980s, several research programmes commenced examining hydrogen behaviour and control under postulated accident conditions. During these years, the prevailing methods to deal with hydrogen risk in containment were the dilution of the containment atmosphere with an inert gas and igniters. In the 1990s, a new mitigation strategy based on the catalytic oxidation of hydrogen using oxygen from the containment atmosphere and a metal catalyst was proposed; the passive autocatalytic recombiner (PAR) [
3]. A PAR system comprises recombiners from 30 to 60 for a typical PWR, distributed in the containment to provide hydrogen removal in cases of various hydrogen release scenarios [
1].
Hydrogen distribution analysis within containment is conducted to investigate whether hydrogen reaches a flammability level for combustion. Hydrogen risk is then evaluated according to the hydrogen concentration of the gas mixture in the region concerned. To achieve this, various nuclear codes and software are employed which can be categorised based on the applied methodology: (i) lumped parameter (LP) nuclear codes such as MELCOR [
4] and CONTAIN [
5], (ii) CFD codes such as GASFLOW [
6], and ANSYS-CFX [
7] which can produce 3D contours. In one of the examples of past studies using the codes with LP methodology, Saghafi et al. conducted an analysis of determining the optimum PAR configuration in a Westinghouse-type pressurised water reactor (PWR) by using the MELCOR code. A large break loss of coolant accident (LB-LOCA) without emergency core cooling system (ECCS) actuation was selected as the bounding case for the study after the probabilistic safety assessment (PSA) results. 40 different PAR configurations were examined in a Westinghouse-type PWR to find the optimal configuration with a minimum number of PARs in the containment. The obtained configuration was equally effective for hydrogen risk mitigation with a 36% reduction in the number of PARs compared to the base case design [
8]. In addition, Noorikalkhoran et al. simulated VVER-1000/V446 containment response to an LB-LOCA scenario by using MELCOR and CONTAIN codes. They judged the effectiveness of the spray system to mitigate the consequences of the accident. Hydrogen distribution was also simulated by MELCOR and CONTAIN codes and implementation of PAR installation into the model and the assessment of the PAR performance on mitigation of hydrogen risk were made in the MELCOR code. They also provided validation for their results against FSAR [
9].
Utilising CFD codes, two different German PWR types were modelled in GASFLOW to analyse steam and hydrogen distributions considering mitigation of the hydrogen combustion risk by PARs. The accident scenario involved a postulated beyond design basis accident (BDBA) triggered by an LB-LOCA at a low release location from a rupture of the surge line from the hot leg of the primary loop to the pressuriser. The results were compared to the results of two LP codes and demonstrated the differences between the LP and CFD approaches to the same phenomena [
10]. In another study, GASFLOW was used to investigate hydrogen distribution in a station blackout scenario on Advanced Power Reactor 1400 (APR1400) containment. The source term data regarding hydrogen and steam were taken from a MAAP nuclear code calculation. The control of the hydrogen concentration is found difficult for the base design of APR1400. In addition, design modifications are proposed and evaluated with GASFLOW in terms of the hydrogen mitigation strategy [
11]. Qinshan-II nuclear power plant was examined in terms of hydrogen risk by utilising GASFLOW in a study carried out in 2009. The effect of the spray system on hydrogen distribution was investigated in three modes: without the spray system, direct, and both direct and recirculation spray. A new PAR model has also been developed in GASFLOW to simulate more realistically the phenomena behind the operation of the system. It was also noted that the spray modes did not have a significant effect on the efficiency of the PARs. The results were also validated against experimental data [
12]. Recently, the advanced parallel version of the GASFLOW sequential code, GASFLOW-MPI, was used for the first time to analyse the hydrogen explosion at Fukushima Unit 1 reactor. Gas dispersion in the containment, the formation of hydrogen-steam-air mixture by considering the stratification phenomenon, and the prediction of the pressure loads to the containment and internal structures were examined in the study [
13].
As an example of studies employing other CFD codes rather than GASFLOW, a CFD-based model was developed in ANSYS-FLUENT to simulate hydrogen distribution in the containment in severe accident progression in 2014. The model was validated against the experimental data obtained from three different facilities: THAI, PANDA, and TOSQAN [
14]. Recently, Park et al. investigated a 3D detailed simulation of hydrogen behaviour using FRAMATOME PAR and NIS PAR in the THAI project by employing ANSYS-FLUENT code as well. To reduce the calculational cost, PAR performance was simulated by applying the hydrogen removal rate correlation equation to the catalyst region. It was demonstrated that TH parameters, gas velocity entering the PAR, hydrogen distribution, and hydrogen removal rate were similar to the experimental data [
15].
GOTHIC [
16] is a general-purpose thermal-hydraulic analysis code that could be applied to nuclear power plant systems, containment, and confinement buildings by providing LP and 3D geometry options as a hybrid code. It employs a coarser mesh due to the inherent qualities of its subdividing process and porous approach. Therefore, GOTHIC does not have the problem of demanding computational time and cost unlike CFD codes yet while still provides three-dimensional results such as the other CFD codes. For this reason, GOTHIC has been used widely in hydrogen risk analysis recently. In 2015, the GOTHIC code was used to simulate hydrogen distribution in a spherical PWR containment in case of fast release of hydrogen-steam mixture from hot-leg creep rupture during a postulated total station blackout. The mitigation strategy included only the dilution resulting from the large free volume of the containment and the high value of the design pressure. The flammability limit was evaluated using the Shapiro Diagram [
17]. Two years later, Lopez-Alonso et al. analysed the location, size, and number of the PARs to minimise the hydrogen risk in a PWR-KWU containment type during a station blackout scenario. The PAR configuration decreased the likelihood of hydrogen combustion in all the containment compartments at the end of the simulation. The study demonstrated that the PAR configuration could lead to a reduction between 30–45% of the final hydrogen concentration in comparison to the unmitigated scenario [
18]. In the same year, a PWR-W GOTHIC model was created to simulate hydrogen distribution in the event of a station blackout accident. The venting and spraying strategy and their impact on hydrogen risk are assessed in a sensitivity analysis. Moreover, a new parameter Tau to estimate the hydrogen risk was introduced [
19]. The GOTHIC code was utilised to evaluate the effectiveness of the PARs installed in the Gösgen NPP in Switzerland during a station blackout scenario. The PAR modelling approach was validated by simulation of two experiments performed in the frame of the OECD/NEA and THAI project. The results show that PARs could not prevent the formation of a stratified cloud of hydrogen (10% molar concentration); however, they can mitigate the accumulated hydrogen once it is formed [
20]. In 2021, the analysis of a preventive venting strategy to limit hydrogen risk following a station blackout accident was made for a GOTHIC BWR-6 Mark III containment model. The analysis showed that an appropriately planned venting strategy could mitigate the hydrogen risk [
21].
In this study, the previously validated VVER-1000/V446 containment model in the investigation of its thermal-hydraulic response during an LB-LOCA [
22] was modified to a great extent to simulate hydrogen distribution following the accident by using the 3D capability of GOTHIC code. After assessing the hydrogen concentration throughout the containment, 80 PAR units were installed to evaluate the performance of the hydrogen removal system inside the containment on keeping the hydrogen concentration below the flammability limit during the postulated accident scenario which was assumed as a design basis accident (DBA). The results were validated against the results of the Final Safety Analysis Report (FSAR) and best simulation-based advice was made for more effective application of PARs as the main strategy of hydrogen mitigation in NPPs’ containment.
3. Hydrogen in NPPs’ Containment
Hydrogen could be produced from various sources including metal oxidation and radiolysis of water during a LOCA. The released hydrogen then mixes with steam and air to form a gas mixture that could be flammable depending on the concentration of the gases within the mixture. There are different strategies to cope with the threat of flammable hydrogen mixtures such as PARs, igniters, and venting.
3.1. Hydrogen Generation
During the accident progression following a LOCA, the core temperature rises to a degree where zirconium fuel cladding reacts with steam at around 1000 °C because of the insufficient amount of coolant that carries away the heat from the core. The reaction is strongly exothermic and rapid, it intensifies the process of core degradation by further increasing the temperature rise in the core [
23].
Apart from zirconium oxidation, steel, and boron carbide oxidation within the vessel (in-vessel hydrogen generation) also contribute to the hydrogen amount produced in a LOCA scenario.
If the reactor coolant system is depressurised and the reactor pressure vessel fails to contain the corium, gravitational corium drop is observed. If the reactor cavity where corium falls is dry, then molten core-concrete interaction (MCCI) happens. When corium contacts the basement of the containment, a violent gas release penetrates the corium.
and
(emerging from the thermal decomposition of the concrete basement) in this gas release react with Cr, Zr (rapidly), and Fe (slowly) contained within the corium and oxidise them [
23].
If the reactor coolant system is pressurised when the vessel is breached, corium may spread into the containment while it leaves the reactor vessel and leads to a pressure spike as the heat contained in the molten corium is transferred to the gases in the containment atmosphere rapidly. This phenomenon is called direct containment heating. Corium dispersion enables a very efficient heat exchange between the corium and the gases present, along with the oxidation of metallic components of corium, producing hydrogen consequently [
24].
Radiolysis of water occurs during both normal operations and accidents. Radiolysis is the decomposition of water molecules by radiation (, or n). Radiolysis of water can produce OH, H, , and but most importantly and . Afterward, these products can react with either themselves or other chemicals present in the water to yield a variety of other products. Radiolysis can occur in the core, in the primary system, or in the containment, such as in the fuel pool.
The rate of hydrogen and oxygen formation through water radiolysis is controlled by three factors:
- i.
the decay energy,
- ii.
the fraction of the decay energy, which is absorbed by the water,
- iii.
the effective rate of hydrogen and oxygen production per unit of energy absorbed by the water.
The G value, which could be defined as molecules of product formed per 100 eV of energy absorbed, provides information about the yield of a product species due to the radiolysis of water [
25].
3.2. Hydrogen Distribution
After releasing from the source in the reactor coolant system hydrogen gas could disperse over the containment through designed pathways of the containment. If there is no forced flow inside the containment, convective loops dictate the transport of hydrogen due to the hot gas/steam mixture released and steam condensation on cold walls. The important part here is how well the hydrogen is mixed within the containment atmosphere since the flammability of the hydrogen gas is directly related to the concentration of the hydrogen in the region considered. Stratification of the hydrogen gas could lead to concentrations above the flammability limits and cause problems.
Some safety systems could change the distribution of hydrogen gas in the containment atmosphere. Air coolers and spray systems for controlling pressure and temperature within the containment might promote the mixing of the hydrogen gas better inside the atmosphere. However, these safety systems might reduce the steam concentration substantially as well leading to a reduction in the inerting effect of the steam on the gas mixture [
2].
3.3. Hydrogen Combustion
Hydrogen is a burnable gas, in other words, it reacts chemically with oxygen to form water. The prerequisites of substantial hydrogen combustion are a flammable gas mixture and an ignition source. The initiation of the combustion might not sustain and eventually disappear. The dominant factor that shapes the conditions in a gas cloud for sustainable hydrogen combustion is its composition. The pressure and the temperature also affect flammability albeit their effect is secondary [
1]. The flammability limit is defined as the limiting concentration of a fuel in which a flame can be propagated indefinitely at a given temperature and pressure. These limits are set by combustion experiments. Shapiro diagram could be used in practical applications to understand whether a mixture is flammable or not [
25].
3.4. Hydrogen Mitigation
Mitigation of hydrogen risk deals with the prevention of severe thermal and pressure loads that could jeopardise the containment integrity or safety components. The aim is not the avoidance of hydrogen combustion, in fact, hydrogen might be burned deliberately in the early stages of the accident to prevent its accumulation to cause more threats later. To mitigate the hydrogen combustion risk in containment during a severe accident, the following techniques might be used [
1]:
- i.
make the containment atmosphere inert, that is, remove or dilute oxygen;
- ii.
mix the containment atmosphere to prevent stratification of hydrogen in local regions;
- iii.
consume hydrogen by recombining or deliberate ignition.
5. Simulation
5.1. GOTHIC Code
GOTHIC (Generation of Thermal-Hydraulic Information for Containments) is an integrated general-purpose thermal-hydraulic code that provides a solution of mass, energy, and momentum conservation equations for multi-component and multi-phase flow. It has been developed by Zachry Nuclear Engineering, Inc. (San Antonio, TX, USA). The code is used in licensing, design, safety, and operating analysis of nuclear power plant containments, confinement buildings, and system components. The GOTHIC code comprises a preprocessor for input generation to construct a GOTHIC model, a solver to give solutions for conservation equations, and a postprocessor to present calculation output as a data set or graph. Conservation equations are solved for three (or more) main fields, namely, steam/gas mixture, continuous liquid, and liquid droplets.
GOTHIC is a hybrid code hence it could act as either an LP code or a CFD code. A control volume, the computational unit in GOTHIC which is used to model the region within the system that fluid occupies, could be defined as lumped or one-, two- or three-dimensional volume by subdivision. The subdivision of a volume is based on orthogonal coordinates. Adjacent cells in a subdivided volume communicate through parameters defined by discretisation of the governing equations.
GOTHIC uses a porous media approach for cell volumes and cell faces. The porosity factor of a cell defines the portion of the cell volume that could be occupied by the fluid. The assigned values are between 0 and 1. If the porosity factor is 1 then it means the cell could be occupied completely by a fluid. The fluid could be steam, noncondensing gases (such as air, oxygen, and hydrogen), water, or any combination of these fluids. If the porosity is 0, then it means the cell is totally blocked. A blockage is defined as an object that displaces fluid. Whereas an opening could be regarded as an object that displaces the solid. Through the variations of those two elements, a user could build any geometrical shape with pre-defined geometric forms in GOTHIC. The code also allows the modelling of various equipment and engineered safety features such as pumps, valves, spray nozzles, igniters, and PARs. More complex systems could be built in the model by the combination of those components [
16].
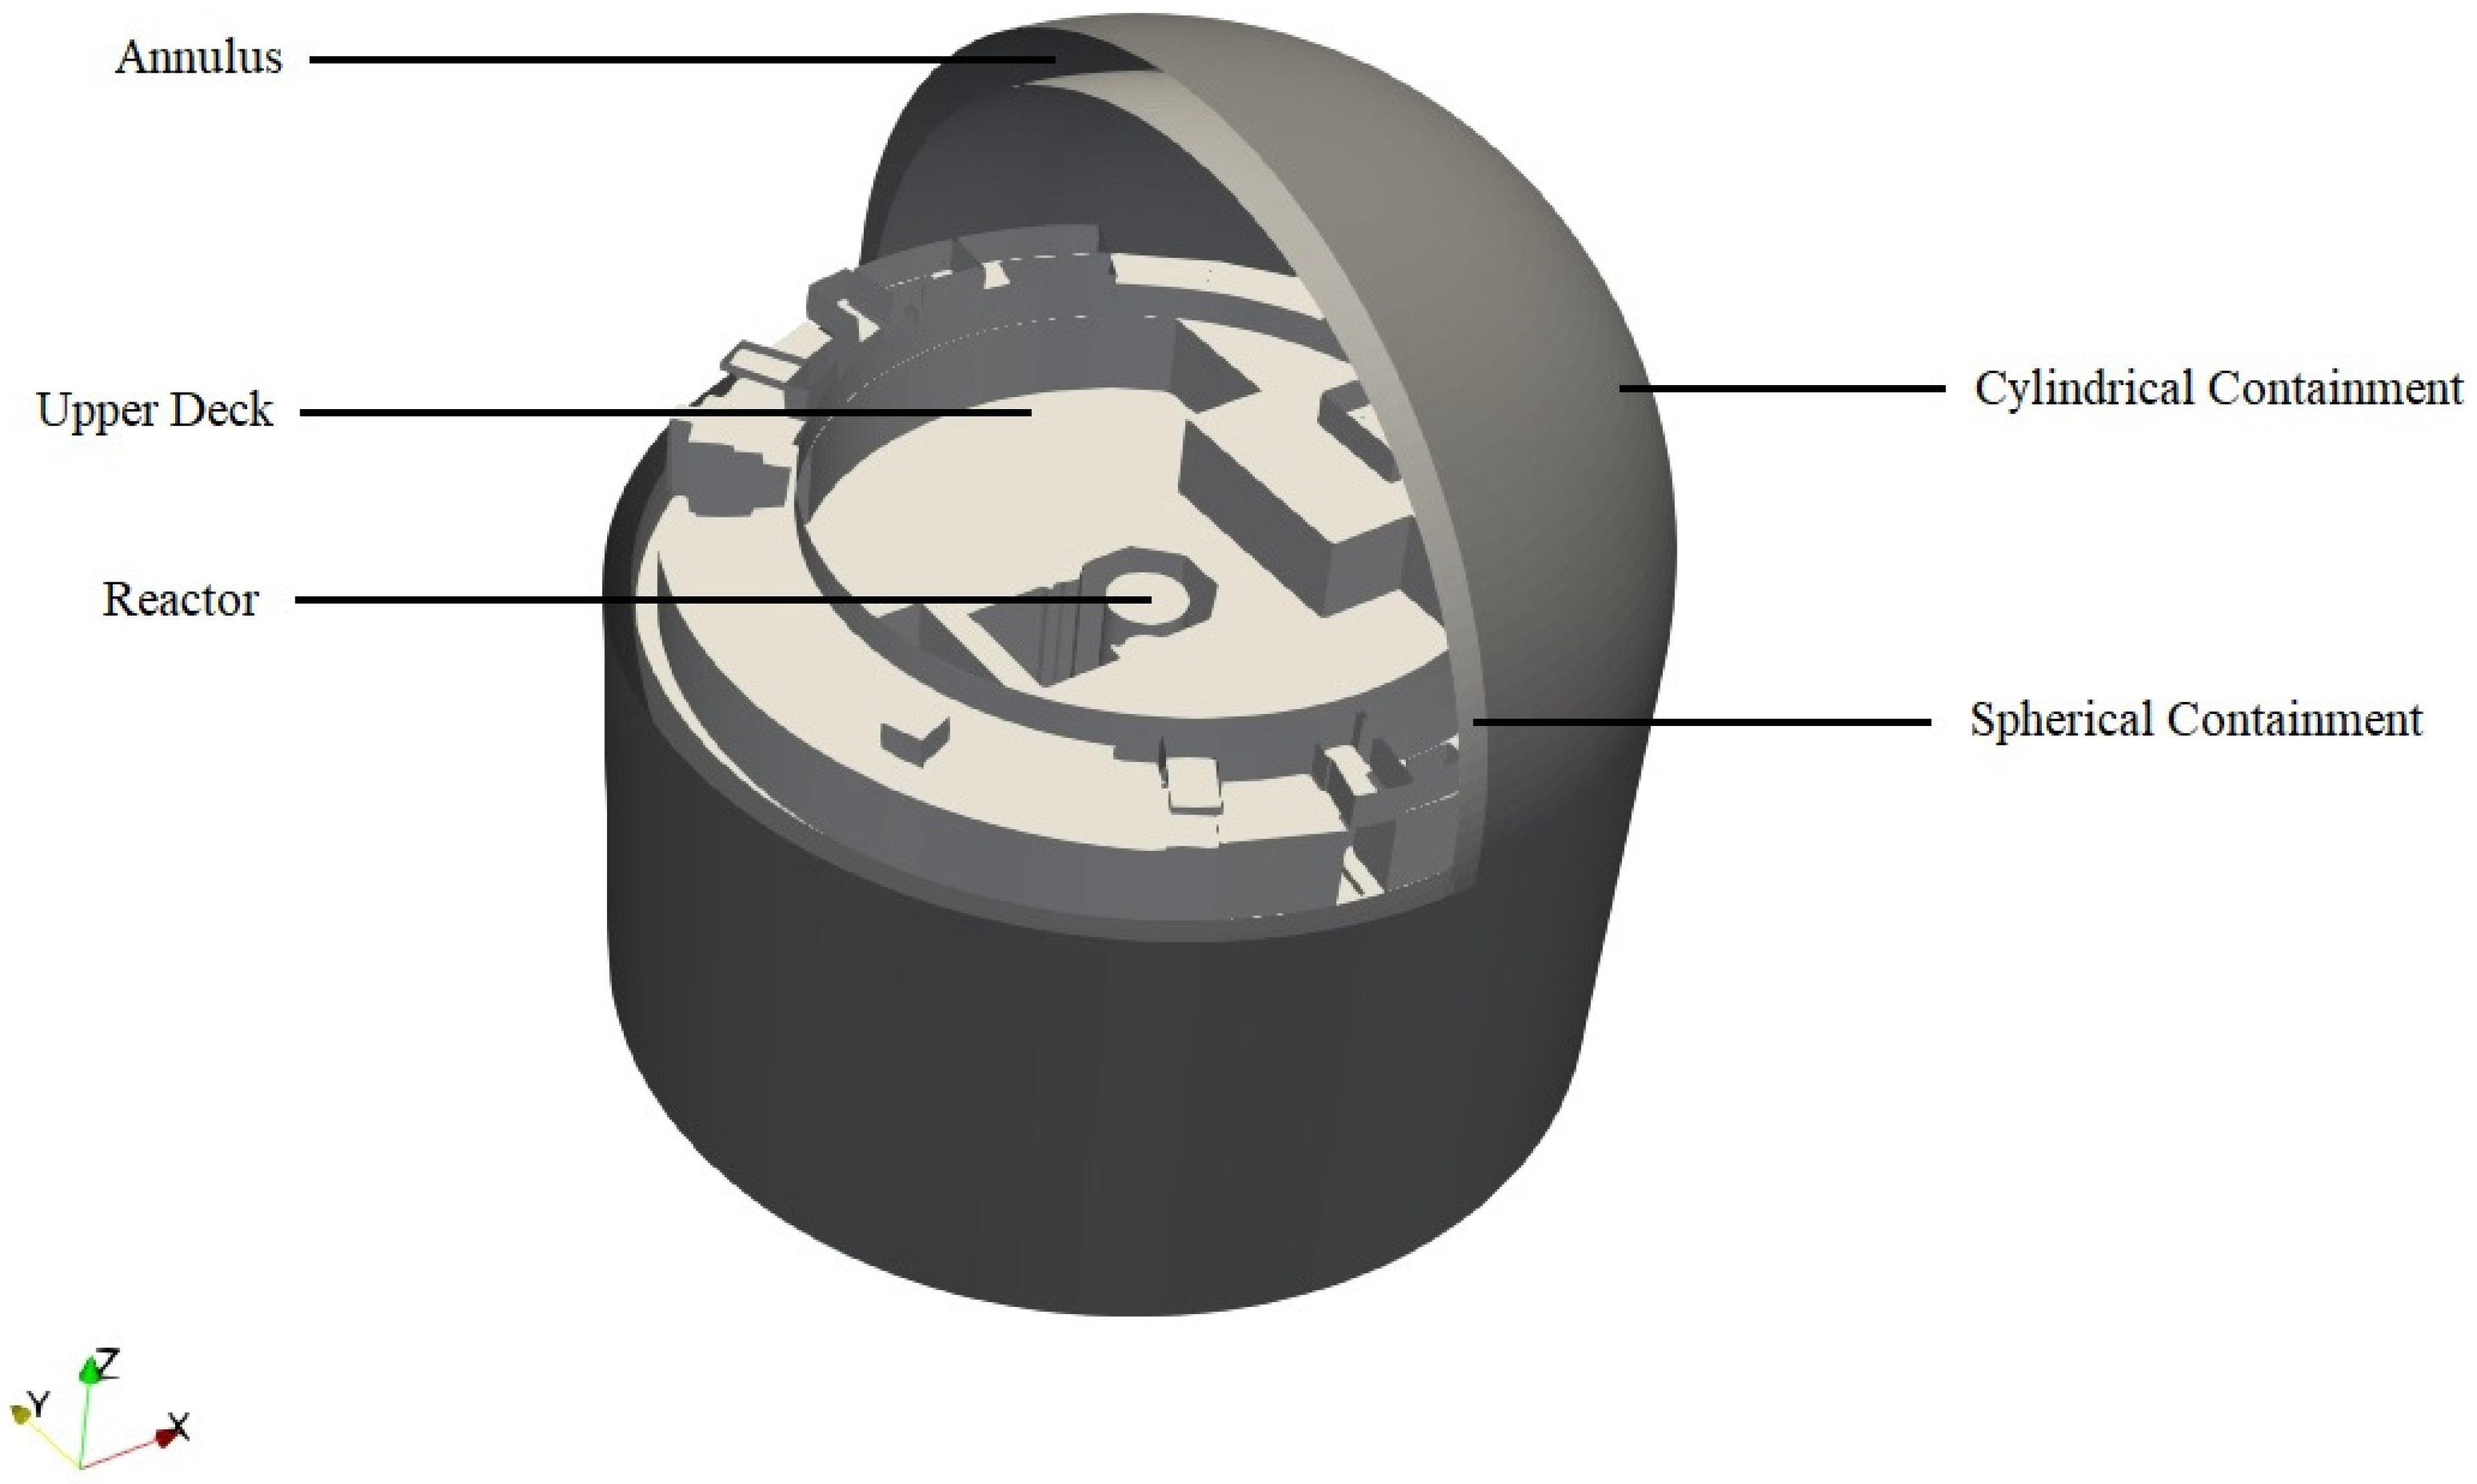
5.2. 3D Simulation of the VVER-1000 Containment (Base Model)
The 3D VVER-1000 containment model was constructed in AutoCAD instead of GOTHIC since the former provides a more user-friendly and easier-to-interact environment for 3D modelling. Initially, a 2D drawing of each containment stage was made in AutoCAD from the available 10 horisontal containment cross-section sketches on different elevations. Then, 2D drawings were extruded according to the height of each room to form 3D horizontal layers of the whole containment. An example of these layers can be seen in
Figure 4. Representative 3D volumes of each room were categorised according to their control volume and each control volume was assigned a unique colour. Afterward, all the layers were combined into the 3D detailed CAD model of the containment, presented in
Figure 5.
GOTHIC does not use body-fitted meshes like in standard CFD codes, the entire geometry was subdivided into a
mesh which means the dimensions of each computational cell in the grid are
m. The detailed CAD model of the VVER-1000 containment could not be transferred directly to the GOTHIC environment since GOTHIC allows only six types of blockage shapes to represent any geometry, namely, block, cylinder, wedge, cone, cap, and torus [
16]. Therefore, the whole 3D detailed CAD geometry was transformed into a simplified version using wedges as the geometrical form in the triangulation process. The coordinates of the three corners of the triangular plane and the height of each wedge (to define them in GOTHIC) are extracted from AutoCAD to transfer the simplified CAD model into the GOTHIC environment. The whole progression of the 3D VVER-1000 V446 containment modelling from AutoCAD to GOTHIC can be seen in
Figure 6.
Control volumes are regions inside the containment that could be occupied by a fluid. Mass and energy equations are solved for each cell in the control volume so that the three-dimensional distribution of mass and energy is obtained. Momentum equations are also solved at cell boundaries to obtain the flow pattern within the volume [
16]. The whole containment was divided into 29 control volumes, which are listed in
Table 2 and can be found in
Figure 7.
The hydraulic connections between control volumes are made by flow paths or 3D connectors in GOTHIC. The code solves momentum equations for the vapor/gas mixture, droplets, and liquid for each flow path with each phase having its own velocity. Mass and energy are not stored in flow paths or 3D connectors but in control volumes. 3D connectors could connect two subdivided control volumes having adjacent cells at a common boundary [
16]; 66 flow paths and 46 3D connectors are defined in the modelling of the VVER-1000 containment in GOTHIC.
Thermal conductors (walls, roofs, floors, etc.) are used for modelling the heat capacity of solid structures within the containment such as concrete walls. Conduction is modelled with one-dimensional heat transfer in thermal conductors. The direct heat transfer coefficient option (one of the heat transfer coefficient options in GOTHIC-like film and Tagami) is recommended by the code’s manual in general condensation and blowdown cases and hence it is selected.
The available condensation models in GOTHIC codes are UCHIDA, GIDO-KOESTEL, MAX, and four different variants of DLM in GOTHIC. The diffusion layer model (DLM) condensation option is based on well-established principles for heat and mass transfer analogy [
16]. An enhanced version of DLM with film roughening and mist formation in the boundary layer (DLM-FM) is used as the condensation option for thermal conductors. In total, 143 thermal conductors that represent structural heat sinks, are modelled inside the containment.
Fluid boundary conditions link the GOTHIC model with known conditions connected to the boundaries of the model. The known mass and energy data of a pipe break and hydrogen source (
Table 3) need to be defined in GOTHIC as a boundary condition [
16]. 4 boundary conditions are created in GOTHIC considering steam and water releases for each break source in addition to hydrogen generation sources defined in
Table 3 which complete the LOCA input simulation. The pipe rupture is on loop 4 of the primary coolant system which is located in control volume 2. Fluid boundary conditions could also supply water to the spray headers through flow paths if conditions such as mass flow rate or temperature of the water are known. Trips are created to activate the spray system as soon as the pressure inside the containment reaches 130 kPa. Moreover, 24 valves are defined on flow paths which are open when the pressure difference between connected control volumes reaches 10 kPa.
5.3. 3D Simulation of the Hydrogen Distribution
5.3.1. Hydrogen Sources
The LB-LOCA considered in the FSAR for hydrogen risk calculations is a postulated DBA and it leads to the greatest release of hydrogen into the containment compartments among the other variants. The main processes contributing to the formation of hydrogen during a design-basis LOCA are as follows:
- i.
Interactions of the zirconium claddings of the fuel elements with steam;
- ii.
Radiolytic decomposition of the coolant solutions during the accident and in the post-accident period;
- iii.
Corrosion of metals and metal coatings due to exposure to coolant and spray solutions.
Two assumptions were made during the calculation of the amount of hydrogen released due to the zirconium oxidation. First, the amount of zirconium that has reacted with the steam amounts to 1% of the total mass of the zirconium claddings of fuel elements during the design-basis LOCA (which is in consonance with the requirement of the NRC according to 10 CFR 50.46 [
27]). Second, the formation of hydrogen due to the interaction of zirconium claddings with steam takes place instantaneously [
26].
Hydrogen generation could occur at rates from 0.1 to 5 kg/s for a typical PWR following a severe accident [
1]. However, hydrogen generation is estimated to occur at rates 1 to 50 g/s in a DBA [
28], in which there is a limitation that is set at 1204 °C for the maximum fuel cladding temperature at any point in the core [
29]. In severe accident scenarios, the contribution of water radiolysis and corrosion of metals might be regarded as negligible. However, for DBA analysis of hydrogen risk, they could be considered due to the two orders of magnitude difference in the hydrogen production rate. Yet, the amount of hydrogen formed due to corrosion of the metal and metallised protective coatings is negligibly small in this postulated accident since most of the galvanised surfaces are coated with protective varnish-paint enamels that prevent the spray solution from contacting with the metallised coating surface. Furthermore, the design does not employ aluminium; instead, it uses stainless steel for various locations such as protective sheaths of pipelines and vent ducts [
26].
The other assumptions during the calculation of the hydrogen sources following the LOCA in FSAR are listed here [
26]:
The main dose-forming fission products in the containment atmosphere are radioactive noble gases (RNG);
The energy of gamma-radiation and beta-radiation of RNG is completely absorbed by the steam in the containment atmosphere;
In the calculations of the radiolytic formation of hydrogen in the primary system and in the fuel pool, only the energy of gamma-radiation of the fission products is considered;
The intensity of gamma-radiation in the primary system and the fuel pool comprises 50% of the power of the heat released from the core and the spent fuel;
The portion of the energy of gamma-radiation absorbed by the coolant in the primary system and in the fuel pool amounts to 10%;
100% of the energy of gamma-radiation and beta-radiation of the fission products is absorbed by the coolant which accumulates in the sump;
The radiation-chemical yield of hydrogen and oxygen resulting from the radiolytic formation of hydrogen in the primary circuit and fuel pool is G(H2) = 2G(O2) = 0.45 molecules/100 eV and G(H2) = 2G(O2) = 1 molecule/100 eV in the sump;
Radiolytic formation of oxygen was not considered;
The contribution of the radiation energy of transuranium isotopes was not considered.
Under these assumptions, the hydrogen sources and the calculated amount of hydrogen released from each source versus time are listed in
Table 3. Four boundary conditions were created to represent hydrogen sources in various locations within the containment, namely, in the fuel pool, in the sump, at the pipe rupture, and under the dome.
5.3.2. Passive Autocatalytic Recombiners (PARs)
Passive auto-catalytic recombiners are devices to reduce the amount of hydrogen concentration by using catalytic reactions. The device is designed as plates of catalytic materials such as platinum or palladium inside a metal casing as in
Figure 8. When air in the containment atmosphere flows through the plates, the oxygen and hydrogen within the gas undergo a catalytic reaction and produce steam [
24]. They act as passive instruments, so they are actuated on themselves. The main problem about PARs is their dependency on the limitation of mass transfer rate, which means they have a pace limit to convert hydrogen molecules in the atmosphere under accident conditions. Another limitation comes from the surface temperature of the catalysts. The temperature on the surface could be hot enough to initiate combustion in conditions in which hydrogen concentration is above 8% [
23].
The hydrogen removal system of VVER-1000 containment employs RVK-500 recombiners to dispose of hydrogen through flameless catalytic burning. It is manufactured by CJSC INPK RET, Russia. The catalyst unit of the RVK-500 recombiner includes 696 catalytic cylindrical rods. The height of each rod is 64 mm, and the diameter is 5 mm [
30]. Mechanically, a PAR includes a unit of catalysts, comprising a set of catalytically active components, a convection section, a protective housing, and a cantilever to fasten it to the embedded part. The platinum group metals are used as the catalyst. Characteristics of an RVK-500 unit are listed in
Table 4.
GOTHIC implements the black-box approach to model the PARs within the containment. The black-box model is a type of numerical modelling of PARs that is based on hydrogen recombination rate or efficiency calculated by using empirical correlations and implemented through volumetric sinks and sources of mass, energy, and momentum. Large-scale experiments were conducted to investigate the PAR behaviour under realistic conditions to obtain the PAR recombination rate. The characteristics of the PAR instrument are not modelled, the effects of the PAR on the containment atmosphere while being active are introduced as mass, energy, and momentum sources in the downstream cell. For example, the buoyancy force is calculated by GOTHIC using the density difference between the inlet and outlet of the PAR and defined as a momentum source for the gas mixture [
20].
A PAR utilised in the containment could be defined on a flow path in GOTHIC to simulate the hydrogen depletion through the flow path by converting a specific amount of the incoming hydrogen inside the gas mixture to steam. In other words, for each PAR component defined in GOTHIC, there needs to be a flow path that represents the inside of the metallic box where the gas mixture moves from below to above due to the chimney effect. Oxygen inside the incoming flow is depleted according to the stoichiometric ratio as well.
In FSAR, the set design parameters for the hydrogen removal system are such that during the LOCA (first 24 h), the volumetric concentration of hydrogen should not exceed 2% and in the post-accident period (for 30 days), the volumetric hydrogen concentration should be kept below 0.5%. It should be noted that the lower flammability limit for hydrogen in air saturated with water vapor at room temperature and atmosphere pressure is assumed to be 4.1% in FSAR. The number of PARs installed within the containment in total equals 80 in design. The distribution of PARs is based on the possible hydrogen pathways and the volumes of the control volumes.
Table 5 shows the control volumes and the number of PAR units installed within it [
26]. To match the same conditions within the containment during the accident to compare hydrogen distribution results with FSAR, the design number of PAR units and the locations are implemented in the GOTHIC model as well. The location of PAR units is described as how many PARs are installed in which control volume without any specification on the exact position of them within the control volume in
Table 5 because of the LP code limitations. In a 3D model, each control volume consists of several cells that allow the user to place a PAR wherever it performs more appropriately in depleting the hydrogen amount. Therefore, a preliminary hydrogen distribution simulation was performed to investigate hydrogen stratification within each control volume to spot cells with higher hydrogen concentrations for the determination of the exact location of PAR units. All the cells within the GOTHIC containment model are checked and considered in the PAR installation process.
Hydrogen recombination efficiency is required as an input in GOTHIC to model a PAR, which is a fraction of the flowing hydrogen through the PAR that will be converted to steam if a sufficient amount of oxygen is available, this value is between 0 and 1 [
16]. In other words, it could be defined as the recombination rate of hydrogen gas (the fraction of hydrogen that is converted per unit time) divided by the hydrogen mass flow rate within the incoming gas mixture (the total amount of hydrogen that passes through the recombiner per unit time). The recombination rate of the PAR could be derived from empirical correlations and with the known mass flow rate of incoming hydrogen, the efficiency could be calculated. The recombination rate formula for RVK-500 recombiners that are used in VVER-1000/V446 containment is based on the experiments performed at the All-Russia Research Institute for Thermal Engineering (VTI) and is as follows:
where
is the mass (g) of the hydrogen reacting in 1 s and x is the hydrogen molar fraction, %, at the inlet into the recombiner.
is the temperature of the gas at the inlet, °C, p is the pressure,
Pa and n is a constant equal to 7.7 for the RVK-500 recombiner. The coefficients
,
, and
are equal to
The above-shown recombination rate formula is valid for the condition,
. For the condition
, the following linear interpolation is used:
The relations above were obtained for pressure
Pa for hydrogen molar fraction up to 10%, providing that there is a sufficient amount of oxygen nearby [
31].
The implementation of the formula to each PAR individually could be made through control variables in GOTHIC. The GOTHIC variables that are used for defining a control variable could only be selected at a specific cell or a flow path which means the variables should be defined for each PAR separately since the location of individual units is different. For example, if a PAR is defined on a flow path, to define the mass flow rate of the gas through that particular unit, that flow path should be selected as the location for that variable. In the case of another PAR, the flow path of that PAR will be different. Therefore, a set of control variables that defines the recombination efficiency (22 control variables) was iterated for each PAR unit. Consequently, 1760 control variables were created to model 80 PARs within the containment.
The hydrogen distribution simulation runs for 10
6 s (~275 h). The solution method that is used to solve the pressure matrix equation at each time step during the run is ‘Direct’ which is the recommended method in the code manual [
16]. The differencing scheme selected is mostly the first-order upwind scheme (FOUP), but due to the instabilities in the code, for some short periods, the bounded second-order upwind scheme (BSOUP) was also applied.
6. Results and Discussions
Simulation results are presented as 2D profiles and 3D contours with and without PAR actuation and were validated against FSAR.
Figure 9,
Figure 10,
Figure 11,
Figure 12 and
Figure 13 provide information on variations in average hydrogen concentration versus time in typically selected control volumes from different regions inside the containment. These figures can depict an overall picture of the hydrogen distribution during the LB-LOCA. The selected compartments are namely, control volumes 8, 9, 23, 25, and 28 in these figures (the same as in our previous TH evaluation study [
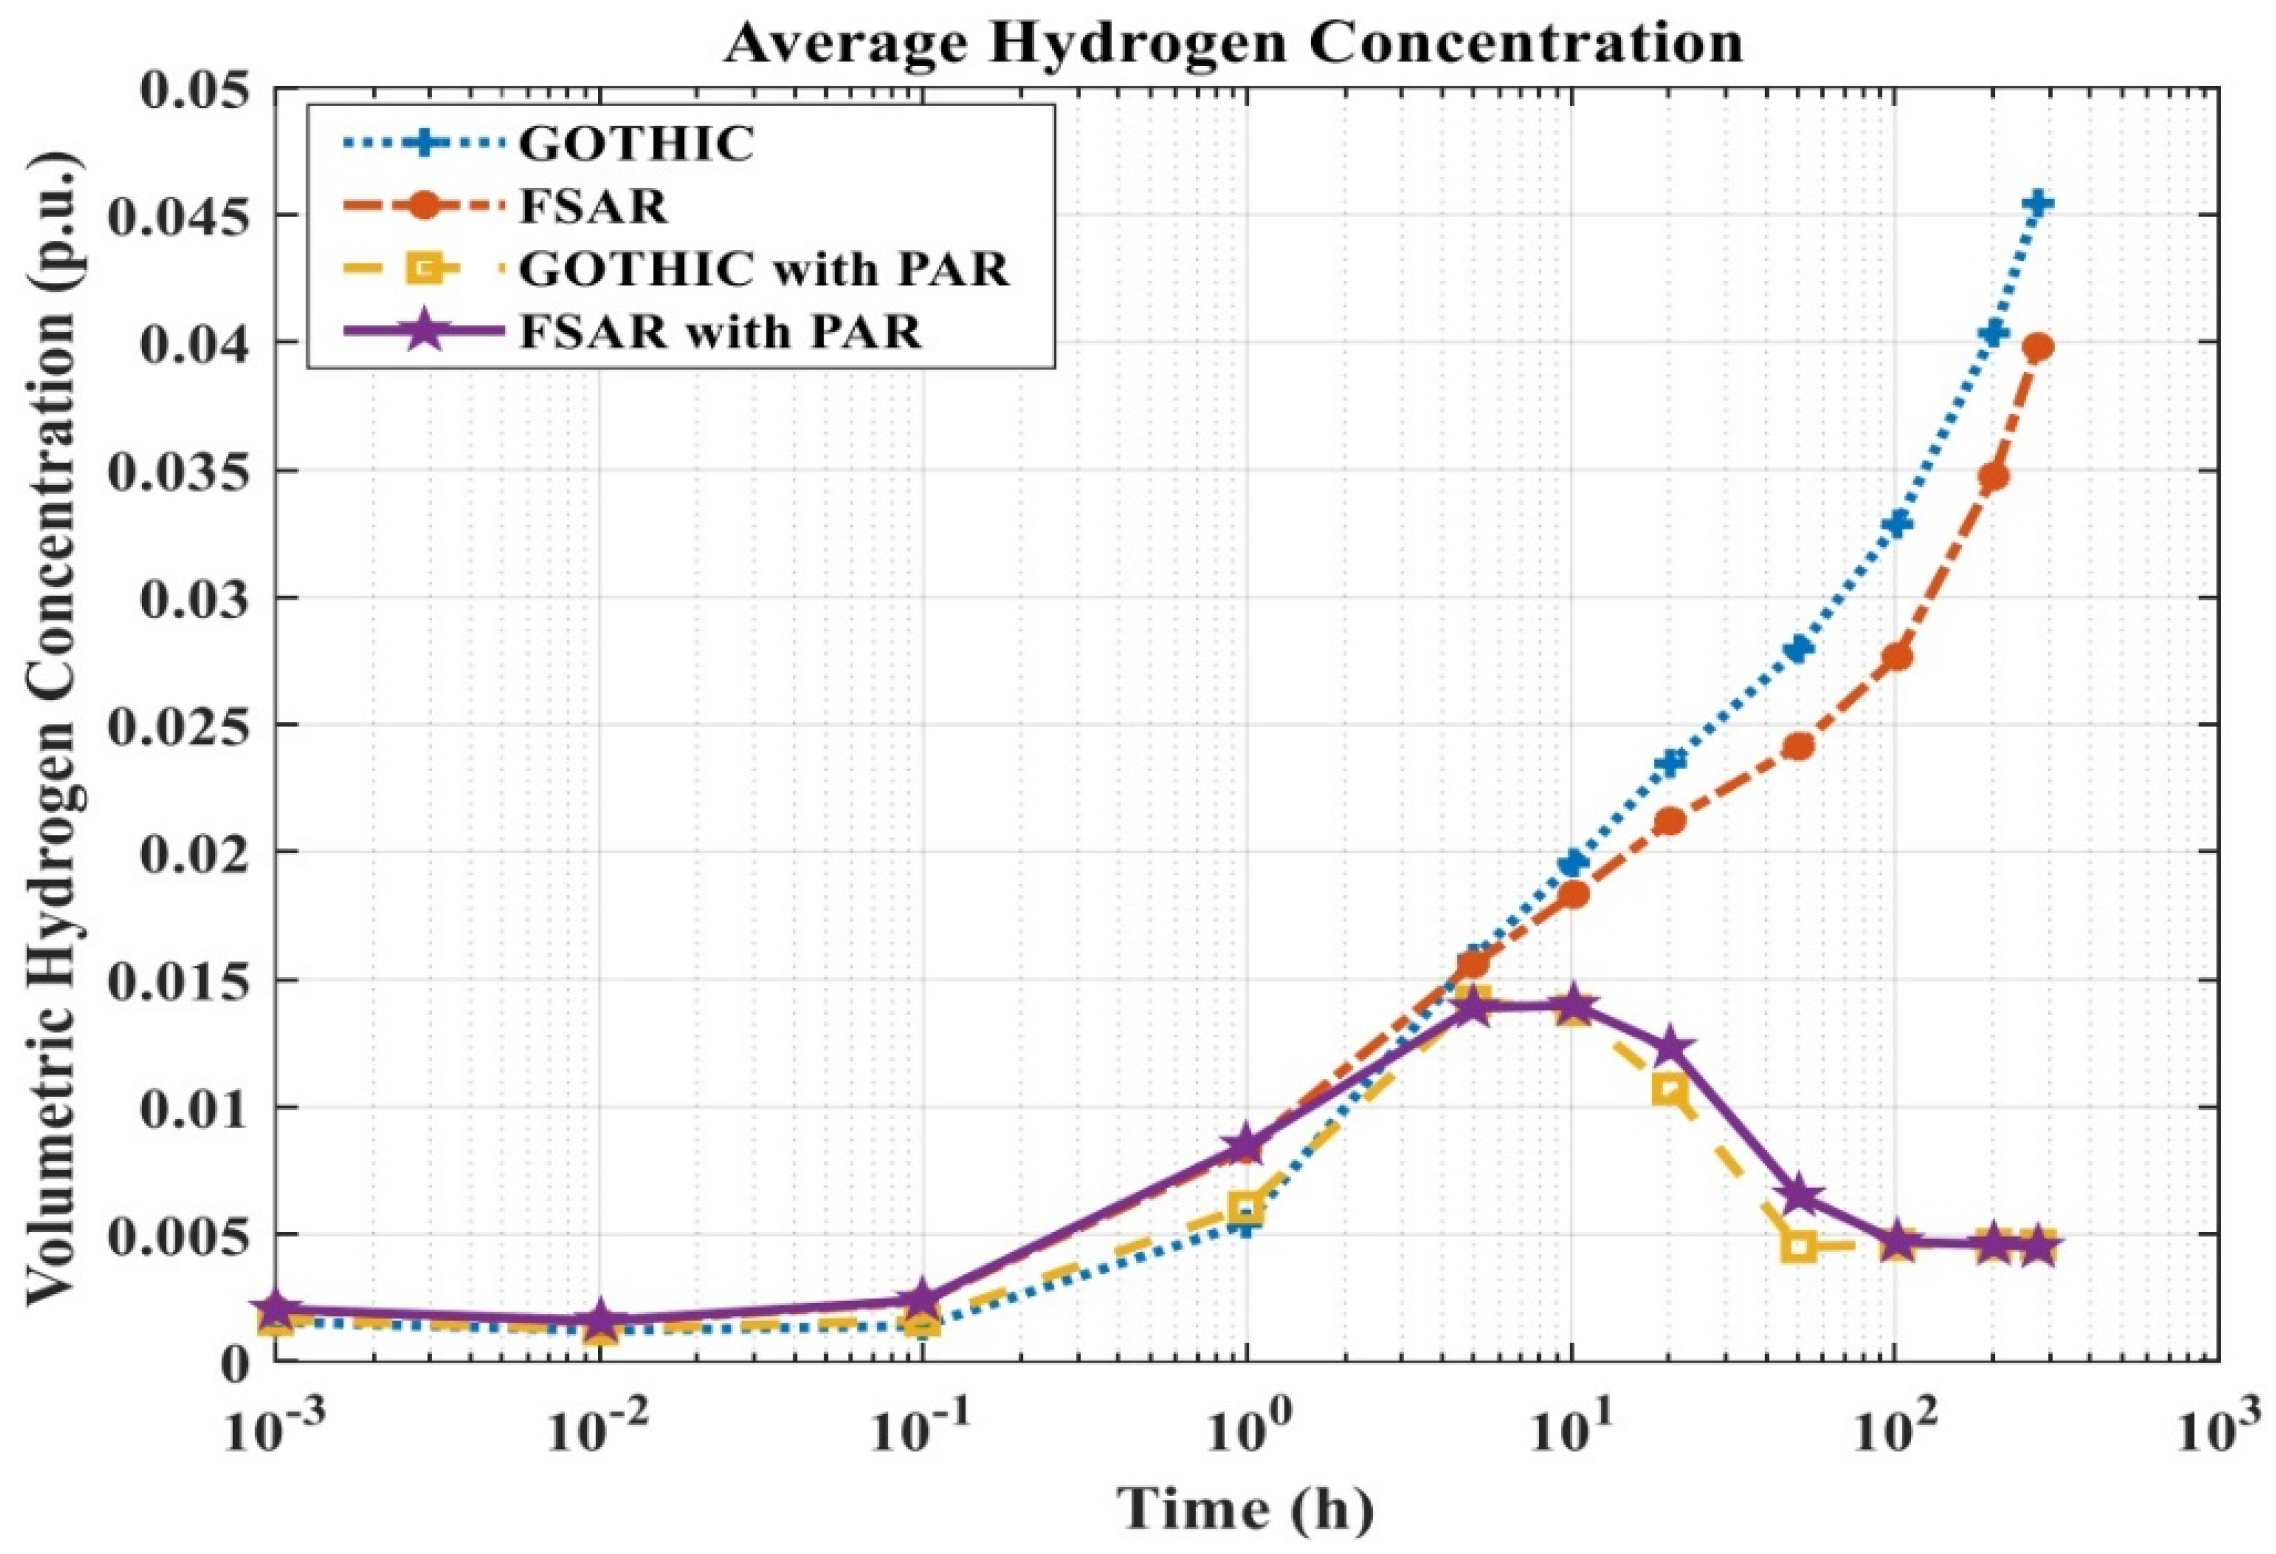
22]). The figures include four data sets of simulation outputs, namely, the GOTHIC model without PAR installation, FSAR without PAR installation, and GOTHIC and FSAR models with PARs installed. The volumetric hydrogen concentration of all selected control volumes follows an ascending trend inside the containment with the progression of accident up to around 1.5% (~5 h), while PARs start to action at 0.45% concentration. From this point (1.5%) onward, the actuation of the PAR system changes the concentration profiles to the descending one and finally reaches the hydrogen concentration to almost steady-state value (as can be seen, profiles without PARs actuation keep their ascending trend even after concentration of 1.5%) The profiles of FSAR and GOTHIC results without PARs are quite in agreement with each other. Although the trends of the two graphs are similar, the GOTHIC simulation provides slightly higher hydrogen concentration within all the selected control volumes after 5 h. Since ANGAR code as an LP code was used in FSAR [
26], the difference between code structures might explain this slight dissimilarity, moreover, considering the broken source also provides steam into the system and different approaches of the two codes on various heat transfer phenomena. The hydrogen flammability limit was assumed as 4.1% in FSAR, and it could be seen in the figures that GOTHIC results exceed this limit just passing 200 h after the onset of the accident. The FSAR results reach this value at around 300 h. Since the simulation ends at about 275 h, the surpassing of the lower hydrogen flammability limit could not be seen in the FSAR profiles. Therefore, a hydrogen removal method needs to be implemented to reduce the hydrogen concentration inside containment and avoid flammability and explosion. To mitigate Hydrogen concentration 80 PARs were installed within the model, and the results of both FSAR and GOTHIC simulation with the PAR units could also be observed through these figures. As it has been mentioned above, two GOTHIC simulations (with/without PARs) have nearly the same results for the first 5 h following the LB-LOCA, since RVK-500 recombiners actuate when the volumetric hydrogen concentration reaches 0.45%. The recombiners continue to reduce the amount of hydrogen by converting it to steam until the volumetric hydrogen concentration at the inlet of the PAR drops to 0.45%. At this stage, the hydrogen concentration within the containment reaches an equilibrium at this value. It should be noted that the lower hydrogen flammability limit after PAR installation is set to 2% for the first 24 h and during the post-accident period, it is set as 0.5% conservatively by taking into account non-uniform mixing that might emerge inside any control volume due to the limitations of LP codes, in FSAR. The average hydrogen concentration in all the control volumes is lower than 1.5% through all the periods during the accident with the activity of installed PARs. Moreover, after 50 h passed following the LB-LOCA, the GOTHIC model with PARs reaches a stable state at 0.45% in the post-accident period.
Figure 14 demonstrates the evolution of average volumetric hydrogen concentration inside the containment atmosphere during the accident. It follows the same trend discussed above regarding individual control volumes.
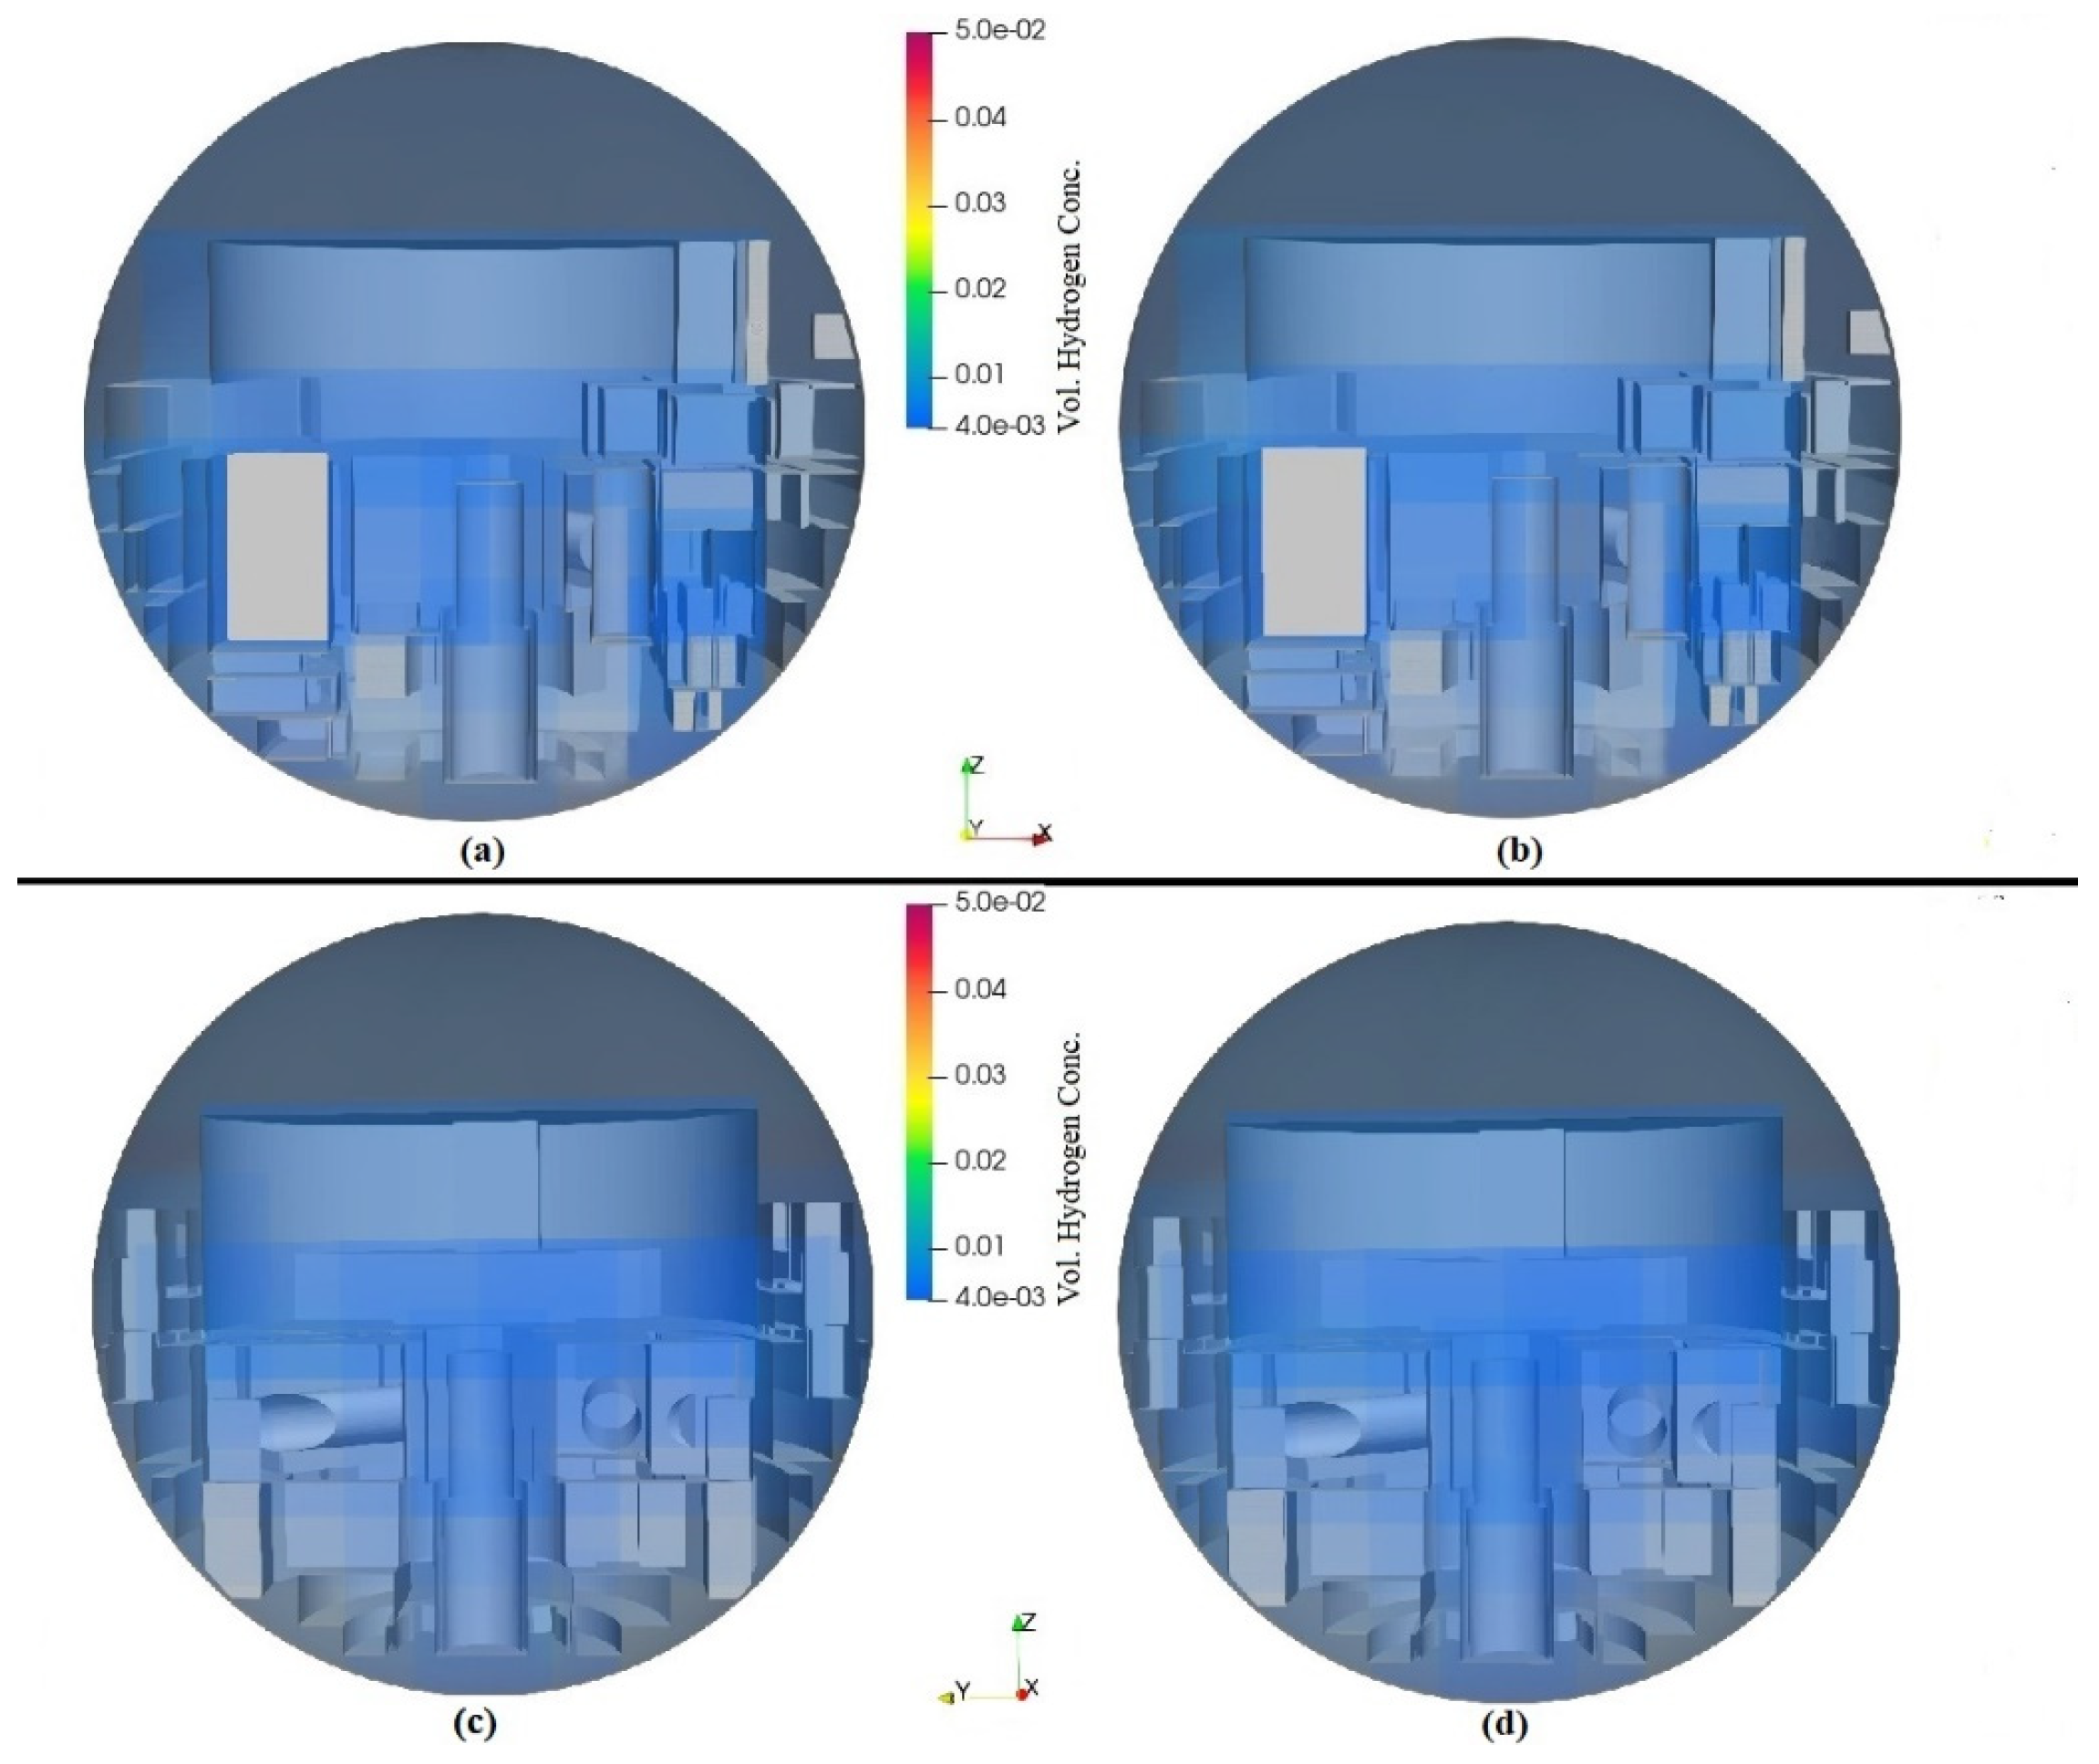
Apart from the investigation of average hydrogen concentration in each control volume, there should be a detailed assessment within control volumes to check whether there is a hydrogen stratification/spot within any control volume that contains hydrogen concentration more than the lower flammability limit. Unlike LP codes which FSAR utilised, the codes with 3D capabilities just like GOTHIC could give the necessary resolution to carry out such an investigation on its mesh system. The 3D contours of volumetric hydrogen concentration within the containment with and without the PAR influence are provided (produced in the post-processing stage of the study in ParaView [
32] as a data visualisation tool) in
Figure 15,
Figure 16,
Figure 17,
Figure 18,
Figure 19,
Figure 20 and
Figure 21. The time steps chosen for these figures are 1, 5, 10, 20, 50, and 100 h (and 200 h just on the onset of entering into the flammability region without PARs model) to represent different periods during the accident in terms of hydrogen distribution. At 1 h, there were no discrepancies between the two models due to the inactive PARs (as PARs actuate at 0.45% hydrogen concentration) but starting from 5 h, when the hydrogen concentration exceeded the 0.45% threshold, the divergence between the two models became more apparent with the effect of the recombiners. After 50 h following the LB-LOCA, the containment reached a stable state, as can be seen in
Figure 19 and
Figure 20, although the hydrogen concentration continued to rise inside the containment without PARs, and eventually, reached the lower flammability limit at around 200 h (
Figure 21). As can be seen in these figures, either with or without the PAR effect, the distribution of the hydrogen through the containment was almost homogenous. The main reason for this homogeneity is based on the fact that in a severe accident, the hydrogen release is quite intense, and the fast ejection of hot hydrogen gas into the system is observed through the break source (due to the significant amount of zirconium reacting with steam) which make it to be dispersed quickly (the same behaviour can be seen in pressure distribution inside containment in LOCA). It needs to be considered, in DBAs, the amount of zirconium to react with steam is limited to 1% which allows the consideration of other hydrogen sources such as water radiolysis since the amount of hydrogen released due to the zirconium oxidation is in the order of other sources, which is normally neglected in a severe accident case. The slow rate of hydrogen ingress into the containment (in comparison to severe accidents) provides better conditions for mixing inside the containment which leads to a more homogenous distribution. It could be realised that the 2% hydrogen concentration limit set by FSAR considering the possibility of non-uniform mixing is a conservative margin. Evaluating the 3D hydrogen contours stratification is not formed within the containment with PARs during the transient in the 3D code results which proves the effectiveness of PARs as ESFs to respect the safety margins and supporting containment integrity.


