
A CFD Study of Vortex-Induced Motions of a Semi-Submersible Floating Offshore Wind Turbine

1
College of Engineering, Ocean University of China, Qingdao 266400, China
2
School of Naval Architecture and Maritime, Zhejiang Ocean University, Zhoushan 316022, China
3
Shandong Key Laboratory of Ocean Engineering, Ocean University of China, Qingdao 266400, China
*
Author to whom correspondence should be addressed.
Energies 2023, 16(2), 698; https://0-doi-org.brum.beds.ac.uk/10.3390/en16020698
Submission received: 30 November 2022
/
Revised: 23 December 2022
/
Accepted: 27 December 2022
/
Published: 6 January 2023
(This article belongs to the Special Issue Recent Advances in Offshore Wind Turbines)
Abstract
:Vortex-induced motion (VIM) is a critical issue for floating structures made of one or more columns, due to its significant impacts on their operational stability. Supported by column-type floating platforms, floating offshore wind turbines (FOWTs) may also experience large-amplitude VIM responses in current flow. Existing research on FOWTs has mostly focused on their wind/wave induced responses, yet less attention has been paid to their responses in current flow. In this paper, the VIM of the OC4 semi-submersible FOWT platform is studied numerically over a wide range of flow velocity. Three incidence angles, i.e., 0°, 90°, and 180°, are considered and the effect of current incidence on platform VIM is analysed. Results show that the so-called lock-in phenomenon is present and that a large transverse response amplitude of more than 0.3D persists until Vr = 30, with its maximum reaching over 0.8D at Vr = 8. Meanwhile, the transverse response amplitude for cases with the incidence angle of 180° is generally smaller, with a narrower lock-in regime, than those under the other two incidence scenarios. Flow field visualisation reveals that upstream vortices continuously interact with the downstream side column when the incidence angle turns to 180°, impacting the vortex shedding process and consequently fluid forces of the downstream column.
1. Introduction
Over the past few years, various attempts have been made, with success, by the offshore wind industry to install wind turbines far offshore, where the wind resource is more abundant and consistent than onshore or nearshore. When the water depth of installation sites increases to over 50 m, it will become economically infeasible to install a wind turbine on fixed-bottom foundations such as monopiles and tripods. A viable and proven alternative is to support the wind turbine with a floating platform instead. Compared to its fixed-bottom counterparts, the so-called floating offshore wind turbine (FOWT) faces more engineering challenges. Most notably, environmental loads from wind, wave, and current will excite the floating platform to move in both translational and rotational degrees of freedom, which in turn greatly affects the aerodynamic performance of the supported wind turbine, e.g., thrust and torque, and consequently the power generated [1,2]. Extensive research has been conducted on the response characteristics of FOWTs over the past decade. The majority of these studies have focused on the analysis of the coupling effects between the wind turbine and the floating platform, under various wind and wave conditions, either experimentally [3,4] or numerically [5,6]. However, there have been relatively scarce studies on the motion responses of FOWTs subjected to current flow, despite the fact that sea current is present in real-world ocean environments, in addition to wind and waves. Meanwhile, floating platforms of FOWTs mostly inherit the mono- or multi-column design from the offshore oil and gas industry. Research on floating oil and gas platforms has already shown that these column-type structures experience large-amplitude motions in the inline and transverse directions, when they are placed in current flow [7,8]. This phenomenon is attributed to periodic vortex shedding and is thus commonly referred to as vortex-induced motion (VIM). Considering their similarities in structure design, it is reasonable to expect that VIM can also occur for FOWTs in current and that the large-amplitude motions can bring about adverse impacts on wind turbine operations. It is thus of both scientific and engineering significance to investigate the VIM of FOWT platforms.
Many efforts have been made to study the VIM of floating oil and gas platforms under free stream conditions. A number of experimental tests were performed for scaled platform models, in towing tanks. Waals et al. [7] studied the VIM of a four-column floater and found that the response range with large motion amplitude expanded as the mass ratio of the floater decreased. They also argued that the floater experienced the largest motions when it was rotated by 45 degrees with respect to the towing direction. Gonçalves et al. [9] discovered from their experiment that the hull appendages on the square columns of a semi-submersible platform greatly influenced its VIM responses. Gonçalves et al. [10] further pointed out that the transverse motion amplitude of the platform was considerably reduced when surface waves were generated along with the current flow, and that VIM was not observed in regular wave conditions. Liu et al. [11] carried out a VIM experiment for a semi-submersible platform with four square columns and concluded that a decrease in the aspect ratio of the columns resulted in a smaller peak transverse amplitude. Tian et al. [8] compared the responses of a tension leg platform (TLP) with and without appendages and stated that the transverse response amplitude of the TLP decreased significantly by 82%, when appendages were added to the platform surface.
In recent years, numerical investigations of the VIM of floating platforms have also been carried out using Computational Fluid Dynamics (CFD) methods, which are able to provide detailed information of flow field, and thus help improve the understanding of interactions between fluid flow and floating platforms. Kim et al. [12] numerically studied the VIM of a four-column TLP and results from their CFD simulations agreed well with the model test data. Chen and Chen [13] compared the VIM responses of a semi-submersible platform with three corner geometries. VIM was found to be rather sensitive to corner rounding, and the response amplitude increased sharply as large rounding was applied to the platform columns. Liang and Tao [14] examined the vortex shedding and formation of a deep-draft semi-submersible platform in current flow and observed complex interactions between vortices and the platform. Zhao et al. [15] analysed the VIM of a paired-column semi-submersible platform and pointed out that the pontoons connecting the platform columns had damping effects on its VIM responses. Huang and Chen [16] simulated the coupled responses of a four-column platform with its mooring system in current flow and argued that the mooring system also played an important role in mitigating VIM, by providing additional mooring damping.
It can then be summarised from the above literature review that the VIM responses of a floating platform are affected by many factors, including the presence of appendages, current incidence angle, as well as geometrical properties (e.g., column shape, corner rounding, and aspect ratio). In the present study, the VIM of the DeepCwind semi-submersible platform (see Figure 1), designed to support the OC4 FOWT [17], is investigated under various current incidence conditions. The platform is characterised by a middle column and three surrounding side columns, which is a novel formation compared to the typical 2 × 2 array configuration in existing works. Under different incidence conditions, the relative positions of the columns change and their vortex shedding process can be influenced, which can greatly affect the VIM responses of the FOWT platform, but still remains relatively unexplored. Meanwhile, a concentric base is attached to the bottom of each side column. Our previous research on the VIM of a single column has shown that the presence of the base could affect its responses [18]. How the FOWT platform with bases responds to current flow with different incidence angles has also been rarely analysed. It is thus expected that this work will contribute to the understanding of motion responses of FOWTs subjected to environmental loads from current.
The rest of this paper is organised as follows. The geometry of the FOWT platform and test conditions are firstly described in Section 2, followed by an introduction in Section 3 to the numerical methods employed in this work. Section 4 then presents the computational model established for the FOWT platform. Subsequently, in Section 5 the numerical results obtained for the platform under various test conditions are presented and discussed. Finally, conclusions are drawn in Section 6.
2. Problem Description
2.1. Geometry Definition
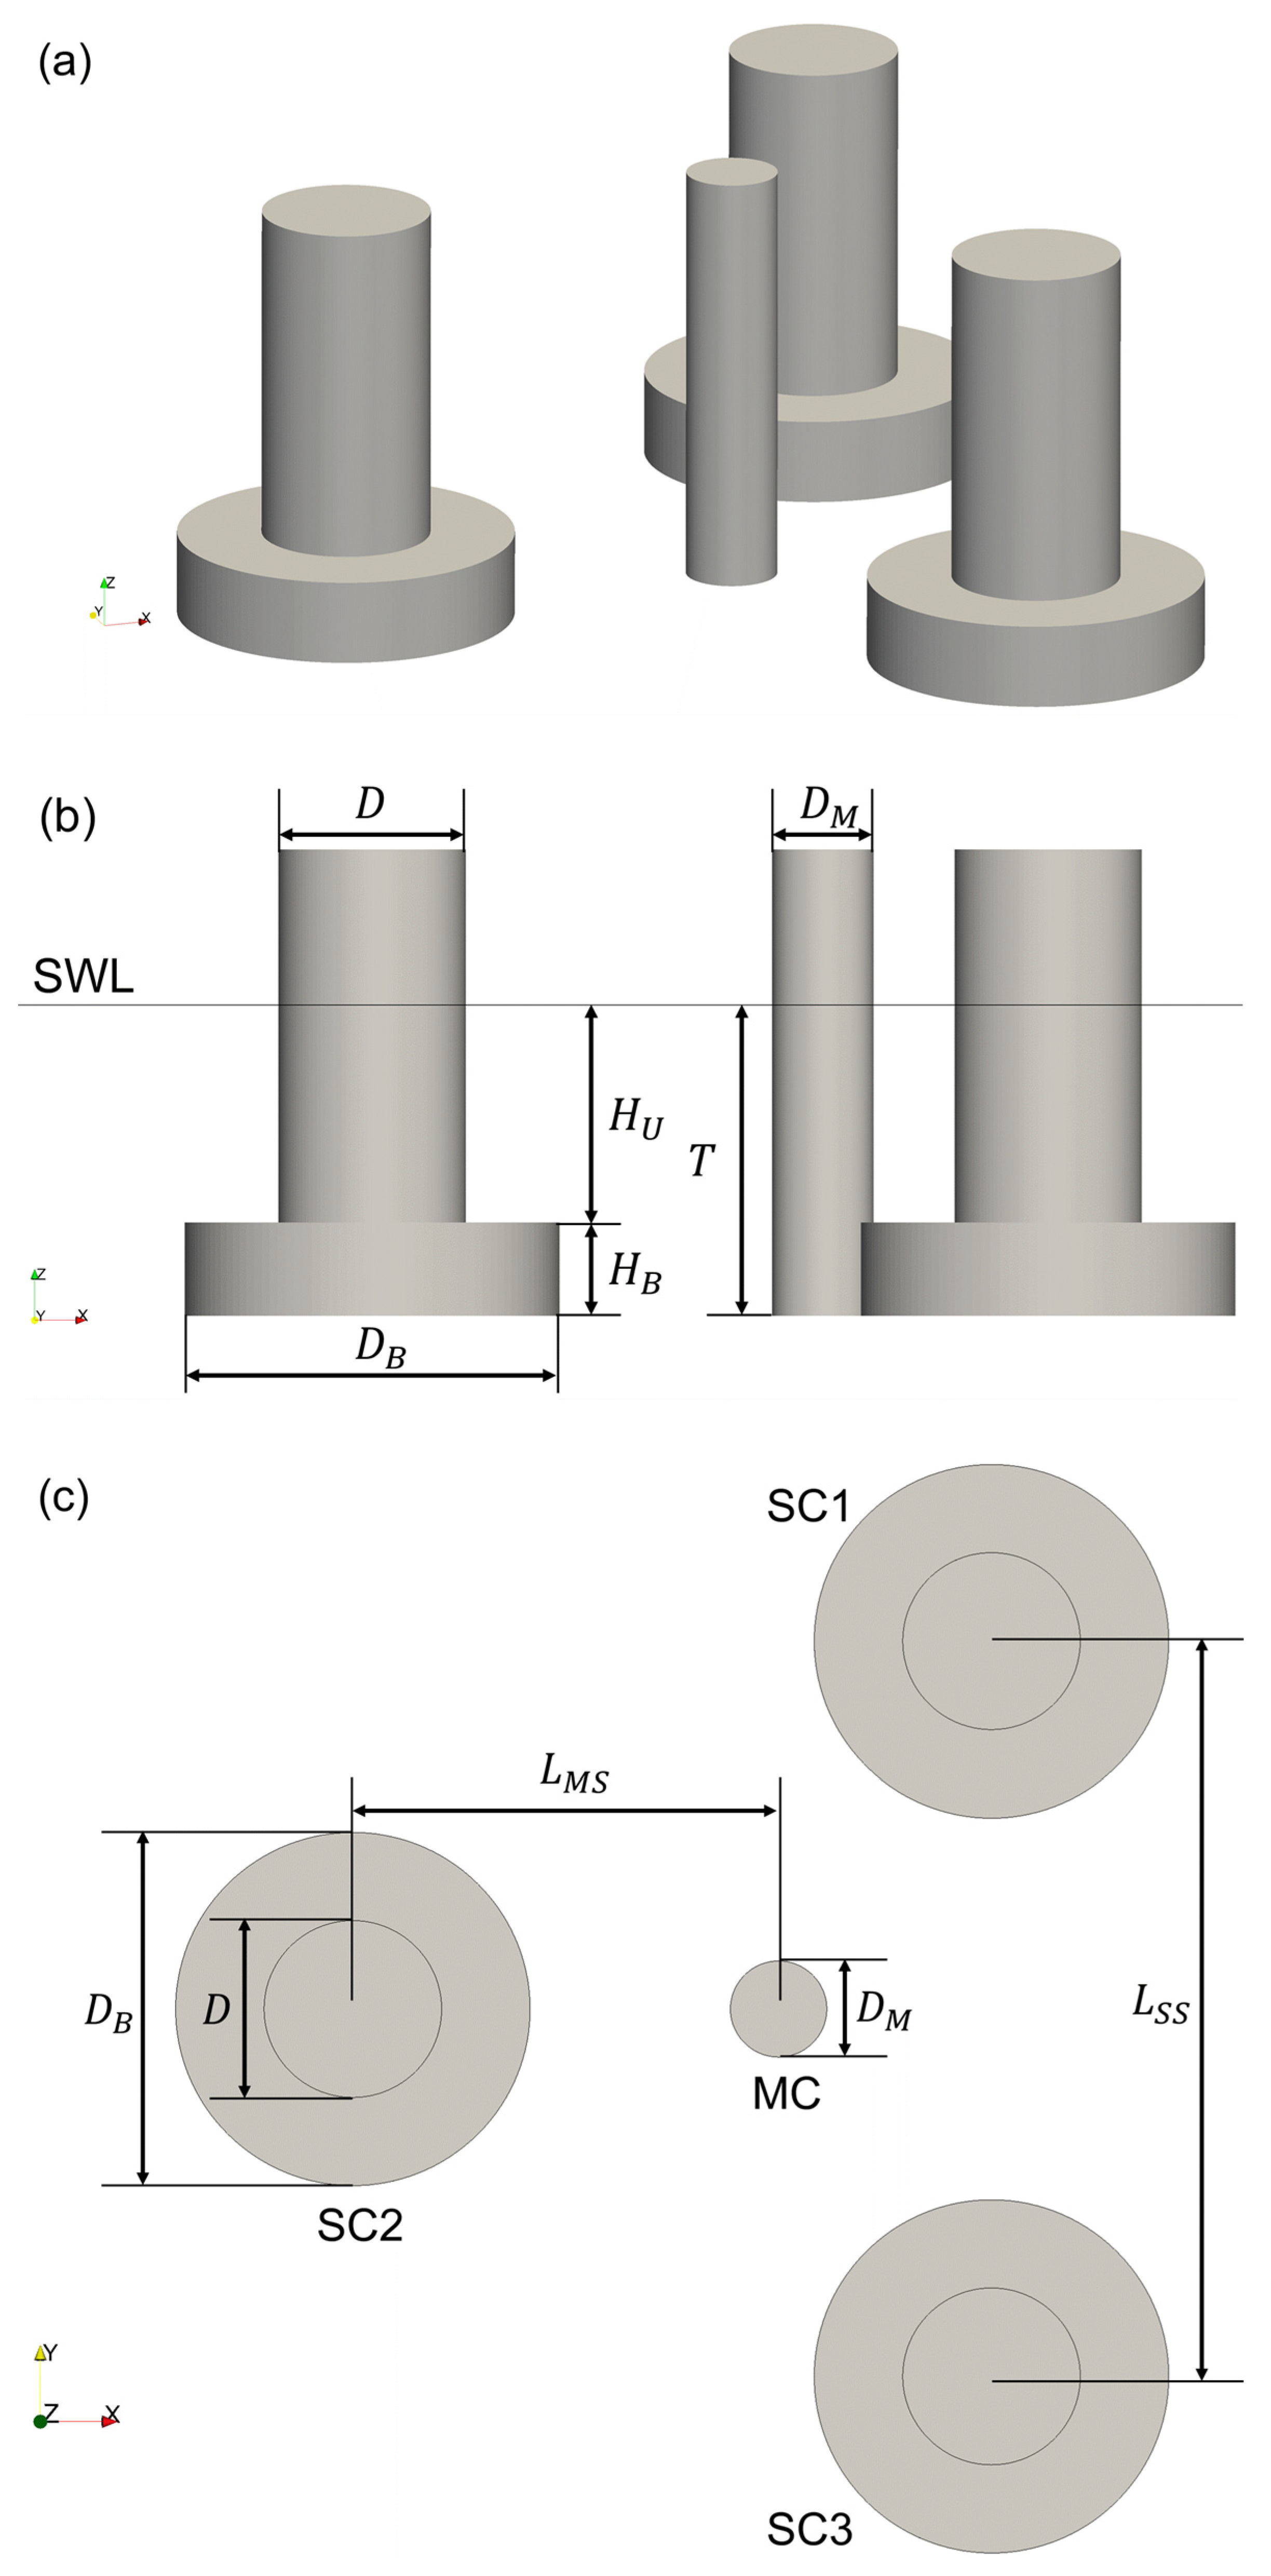
The geometry of the DeepCwind semi-submersible platform for the OC4 FOWT studied in the present work is illustrated in Figure 1. The FOWT platform is mainly composed of three side columns (SC) and a middle column (MC). A wind turbine tower is connected to the middle column and the base of the side columns is designed to provide additional hydrodynamic damping in heave and rotational motions of the platform. The side columns are axisymmetric about the axis of the middle column, with an angle of 120°.
Principal parameters of the FOWT platform are summarised in Table 1, which are extracted from a 1/50th-scale model test previously conducted by Coulling et al. [19]. In their experiment, Coulling et al. [19] primarily investigated the responses of the FOWT under various wind and wave conditions, yet its motions subjected to current flow were not tested. It is worth mentioning that the mass of the FOWT platform includes contributions from the wind turbine and tower, although they are not directly modelled in this study. Meanwhile, Only the underwater parts of the FOWT platform are modelled, while free surface effects are not considered. Additionally, equivalent spring stiffness in inline and transverse directions is applied to represent the mooring system consisting of three catenary lines in the experiment, which is common practice in VIM studies. It should be noted that the additional stiffness provided by cable bundles for data transmission in the experiment by Coulling et al. [19] is also included in this study, leading to the larger spring stiffness in the inline direction than that in the transverse direction.
2.2. Test Conditions
In this study, the FOWT platform is subjected to free stream of uniform flow velocity and is allowed to move in the (inline) and (transverse) directions. The VIM of the FOWT platform is investigated for a series of incident flow velocity or reduced velocity , which is defined as , with being the natural frequency of the FOWT platform in the transverse direction in calm water and the diameter of the upper part of the side columns.
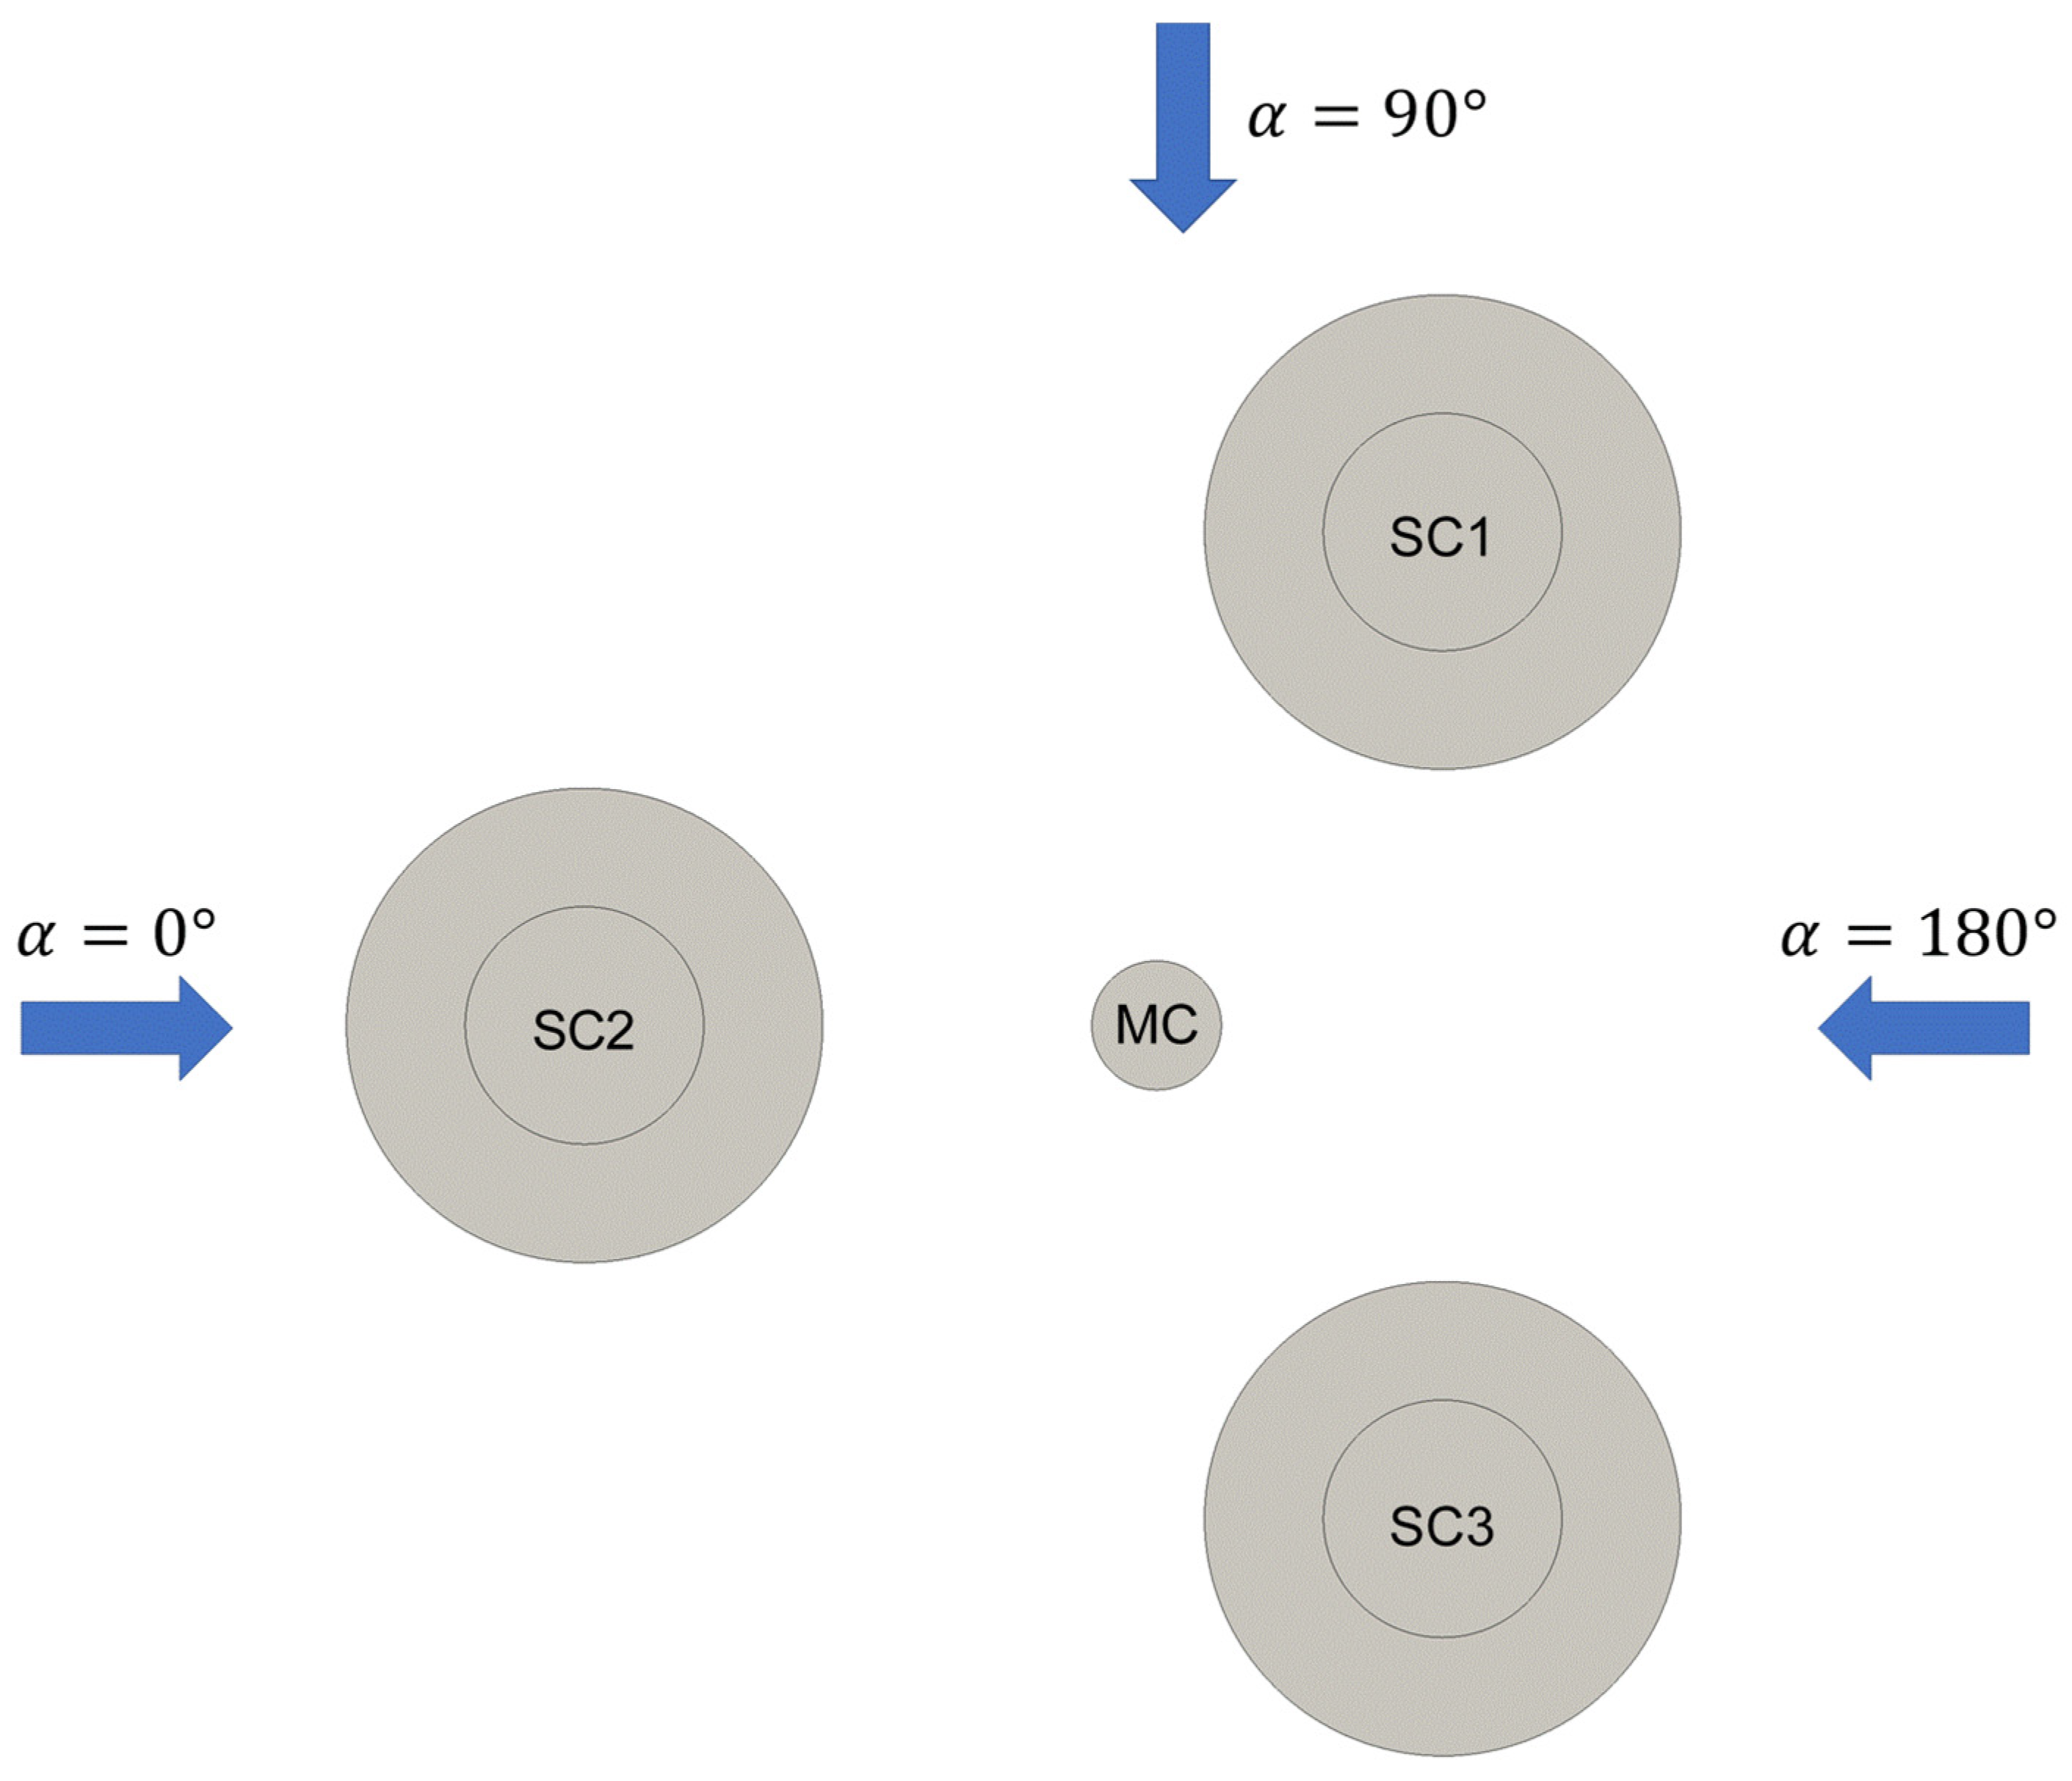
The flow conditions investigated in this study are summarised in Table 2. The reduced velocity varies from 6 to 30, covering a wide range of flow conditions. The corresponding incident flow velocity and Reynolds number are also listed in Table 2. Meanwhile, in order to analyse the effect of the current incidence on the VIM responses of the FOWT platform, three incidence angles defined in Figure 2, i.e., , 90°, and 180°, are considered. As the FOWT platform is axisymmetric about the centre line of the middle column, these angles are also representative of other test conditions, e.g., , 60°, 120°, and 150°. For every incidence angle, all seven flow velocity conditions are studied, totaling 21 test cases.
2.3. Data Analysis
The VIM of the FOWT platform is primarily characterised by the responses in the inline and transverse directions. Due to the intrinsic nature of turbulent flow at high , the motions of the FOWT platform can be irregular. Following Waals et al. [7], inline and transverse response amplitudes, i.e., and , are normalised by and computed as:
where denotes the standard deviation of the response time series and .
The fluid forces exerted upon the FOWT platform are essential to the excitation of its VIM responses and are also analysed. Here, the inline and transverse force coefficients, i.e., and , are defined as follows:
in which and are the overall fluid forces of the FOWT platform in the inline and transverse directions, respectively; is fluid density; is the projected area of the FOWT platform on the plane normal to the incident flow and is defined as (refer to Figure 1).
3. Numerical Methods
3.1. Flow Model
The fluid flow past the FOWT platform is assumed to be single-phase, incompressible and turbulent, and is governed by the following unsteady Navier-Stokes equations formulated in an Arbitrary Lagrangian-Eulerian (ALE) framework:
where and represent the flow velocity field and computational grid velocity, respectively; is time; stands for the flow pressure field; is fluid density; and denotes the effective kinematic viscosity of fluid, in which is its molecular viscosity and is an eddy viscosity field associated with flow turbulence.
In the present study, a Detached-Eddy Simulation (DES) method is adopted to simulate turbulent flows, which is a hybrid RANS/LES approach and models boundary layer flow via RANS models while simulating detached eddies in separated regions using LES [20]. By combining the advantages of the two approaches, DES achieves balance between computational cost and simulation accuracy, and has thus been applied to massively separated flow simulations, such as flow past a cylinder [21,22] and VIM [15,23] at high . In this work, DES is formulated based on the following two-equation - shear stress transport (SST) turbulence model [24]:
where and represent the effective diffusivity of the turbulent kinetic energy and the specific dissipation rate , respectively. and are the turbulence production terms while and denote the turbulence dissipation terms. is the cross-diffusion term introduced by blending the standard - and - models. Details of these terms can be found in the paper of Menter et al. [24]. To transform the SST model into a DES formulation, the turbulence dissipation term is substituted by , with . Here, is set to the blending function in the SST model; is the turbulent length scale with , a constant defined in the SST model; is a calibration constant; and is the cubic root of local grid cell volume.
The flow field is solved using the built-in pimpleDyMFoam solver within an open source CFD framework, OpenFOAM version 4.1, which adopts a finite volume approach to discretise the governing equations and employs a PIMPLE (merged PISO-SIMPLE) algorithm to deal with the coupling of flow velocity and pressure. For all simulations in this study, a backward scheme with second-order accuracy is used for temporal discretisation. A second-order LUST (linear-upwind stabilised transport) scheme, which blends a second-order upwind scheme with a linear scheme for balanced accuracy and stability, is adopted for convective terms. Gradient and diffusion terms are handled via a second-order linear scheme.
3.2. Structural Model
The two-degree-of-freedom (2DoF) responses of the FOWT platform, subjected to vortex-induced fluid forces, can be described via the following equations of motion:
where and denote the inline and transverse responses of the FOWT platform, separately; , , , and represent the platform mass, structural damping coefficient, and spring stiffness in the two directions provided by the mooring system, respectively; and stand for the inline and transverse fluid forces exerted upon the FOWT platform.
The second-order Newmark-beta method [25] with integration parameters of and is adopted to solve Equations (8) and (9) for the 2DoF responses of the FOWT platform. It should be mentioned that structural damping is not considered in this study, and thus the damping coefficient is set to zero.
3.3. Fluid-Structure Interaction
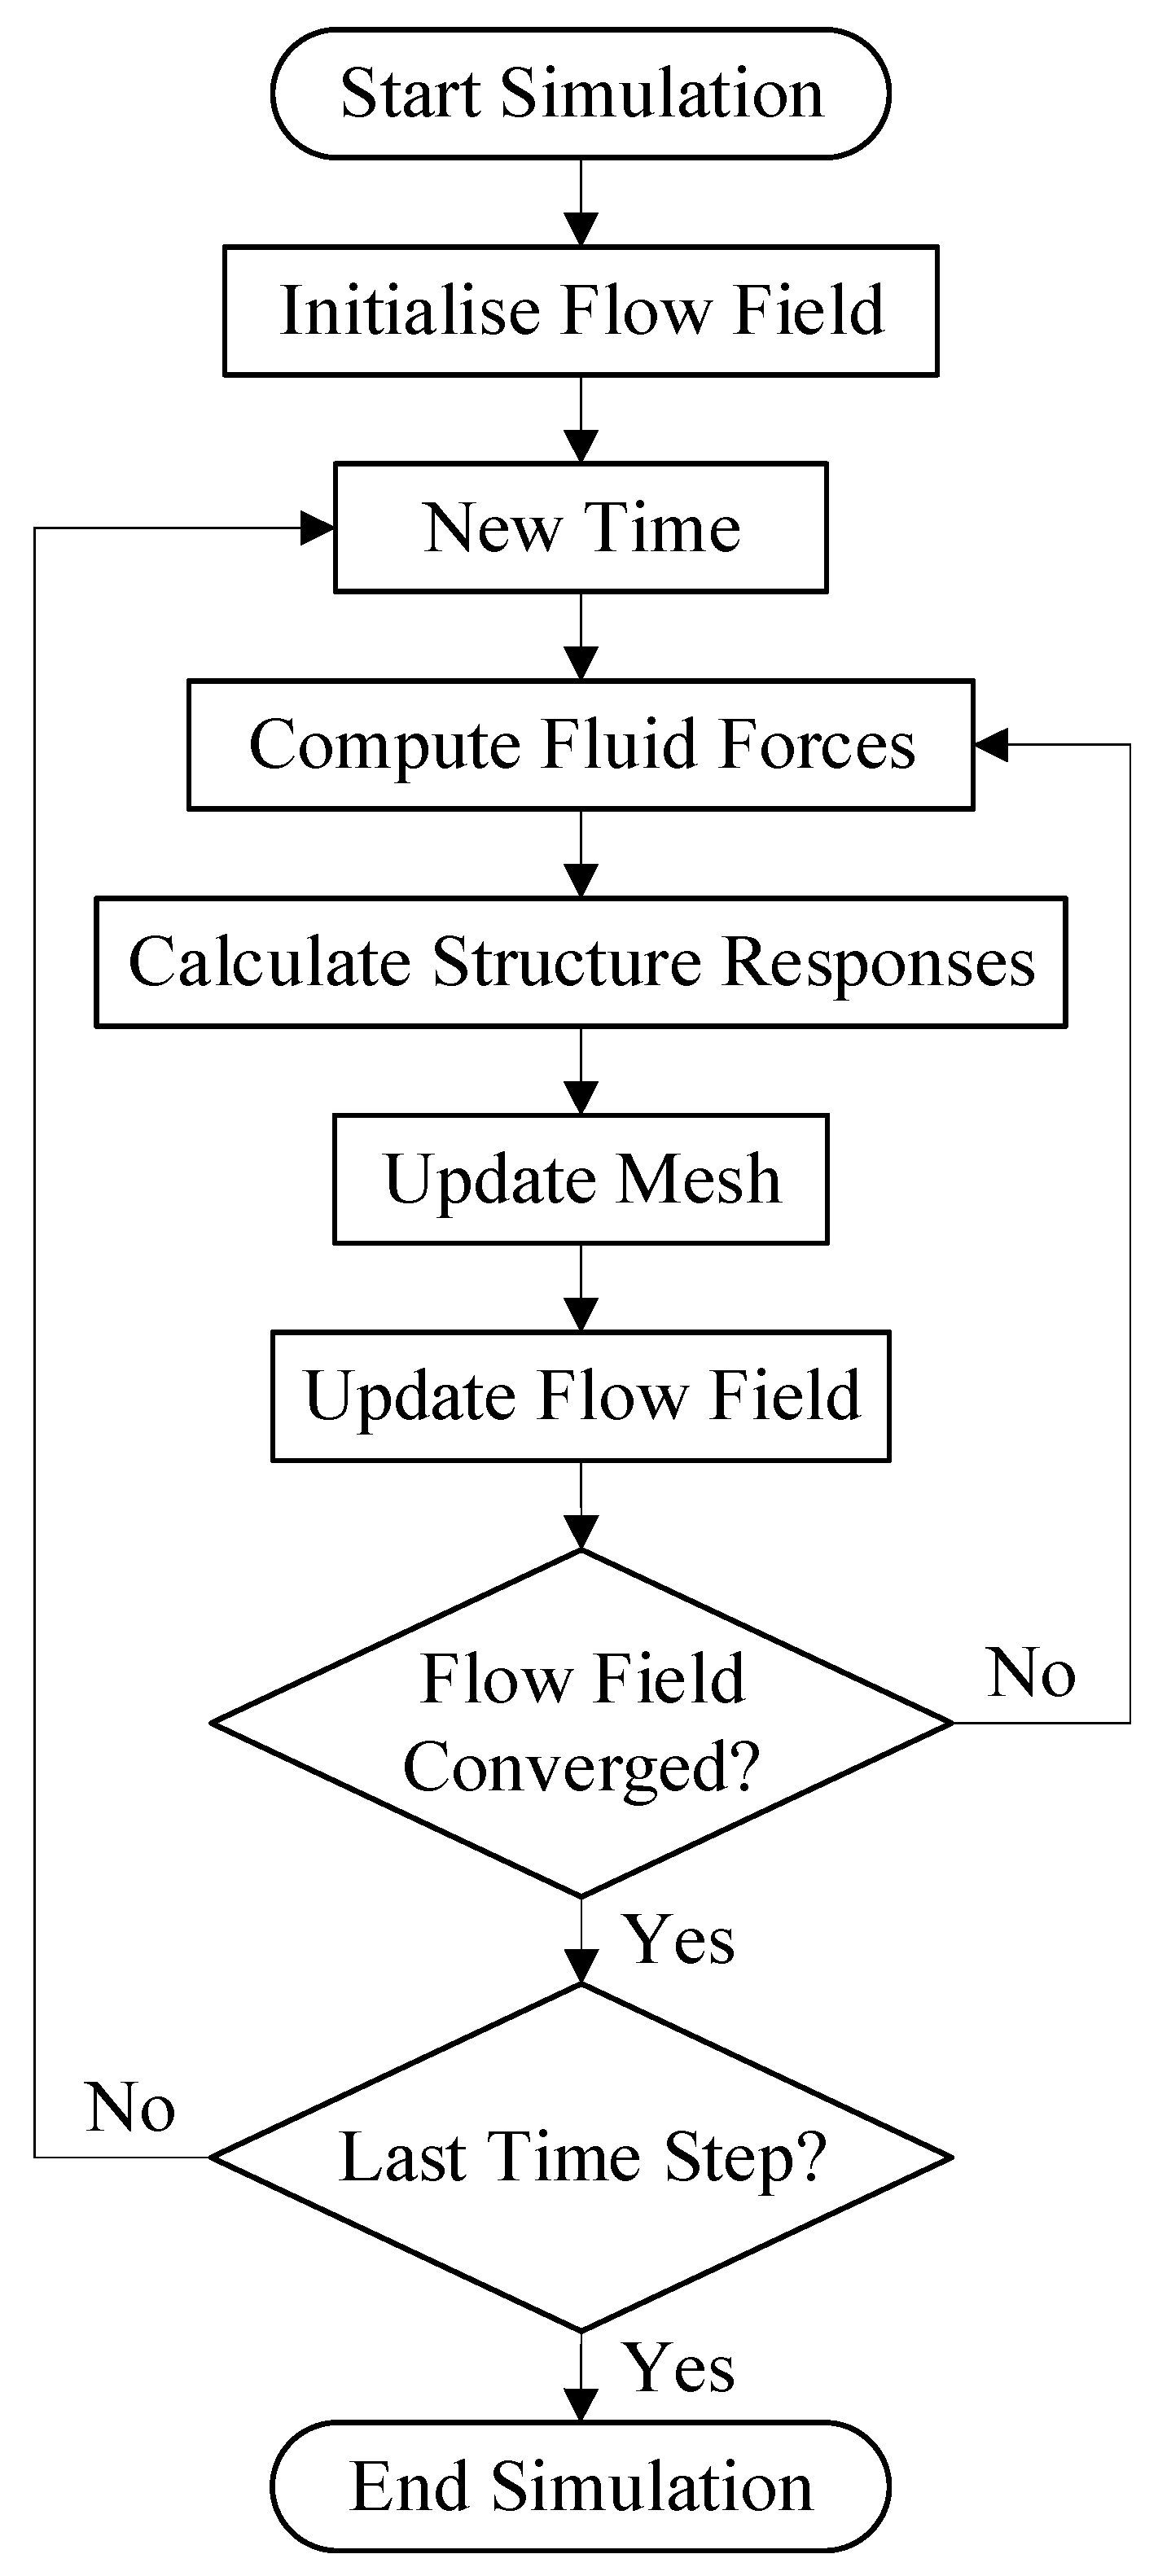
The interaction between fluid and the FOWT platform is handled in a tightly coupled manner, as illustrated in Figure 3. When a simulation starts, the flow field surrounding the FOWT platform, i.e., fluid velocity and pressure, is initialised. At the beginning of each time step, the fluid forces acting on the FOWT platform are firstly computed by integrating pressure and shear stress over its surface. The responses of the FOWT platform are then calculated by solving Equations (8) and (9). Subsequently, the computational mesh is updated to accommodate the movement of the FOWT platform utilising a solid body motion approach, where the overall mesh region moves along with the platform to avoid the deterioration of grid quality present in the typical mesh morphing method. The Navier-Stokes equations and turbulence equations, i.e., Equations (4)–(7), are solved afterwards, to update the flow field. Within each time step, a number of iterations are performed to improve numerical stability. At the end of every iteration, residuals of all flow field variables are checked against their initial values to assess whether the flow field converges. If the residuals drop by three orders of magnitude, it is then determined that flow field convergence is achieved and computation advances to the next time step; otherwise, a new iteration begins, until the convergence criteria are satisfied. The calculation procedure is then repeated for every time step until the end of the simulation.
3.4. Validation Test
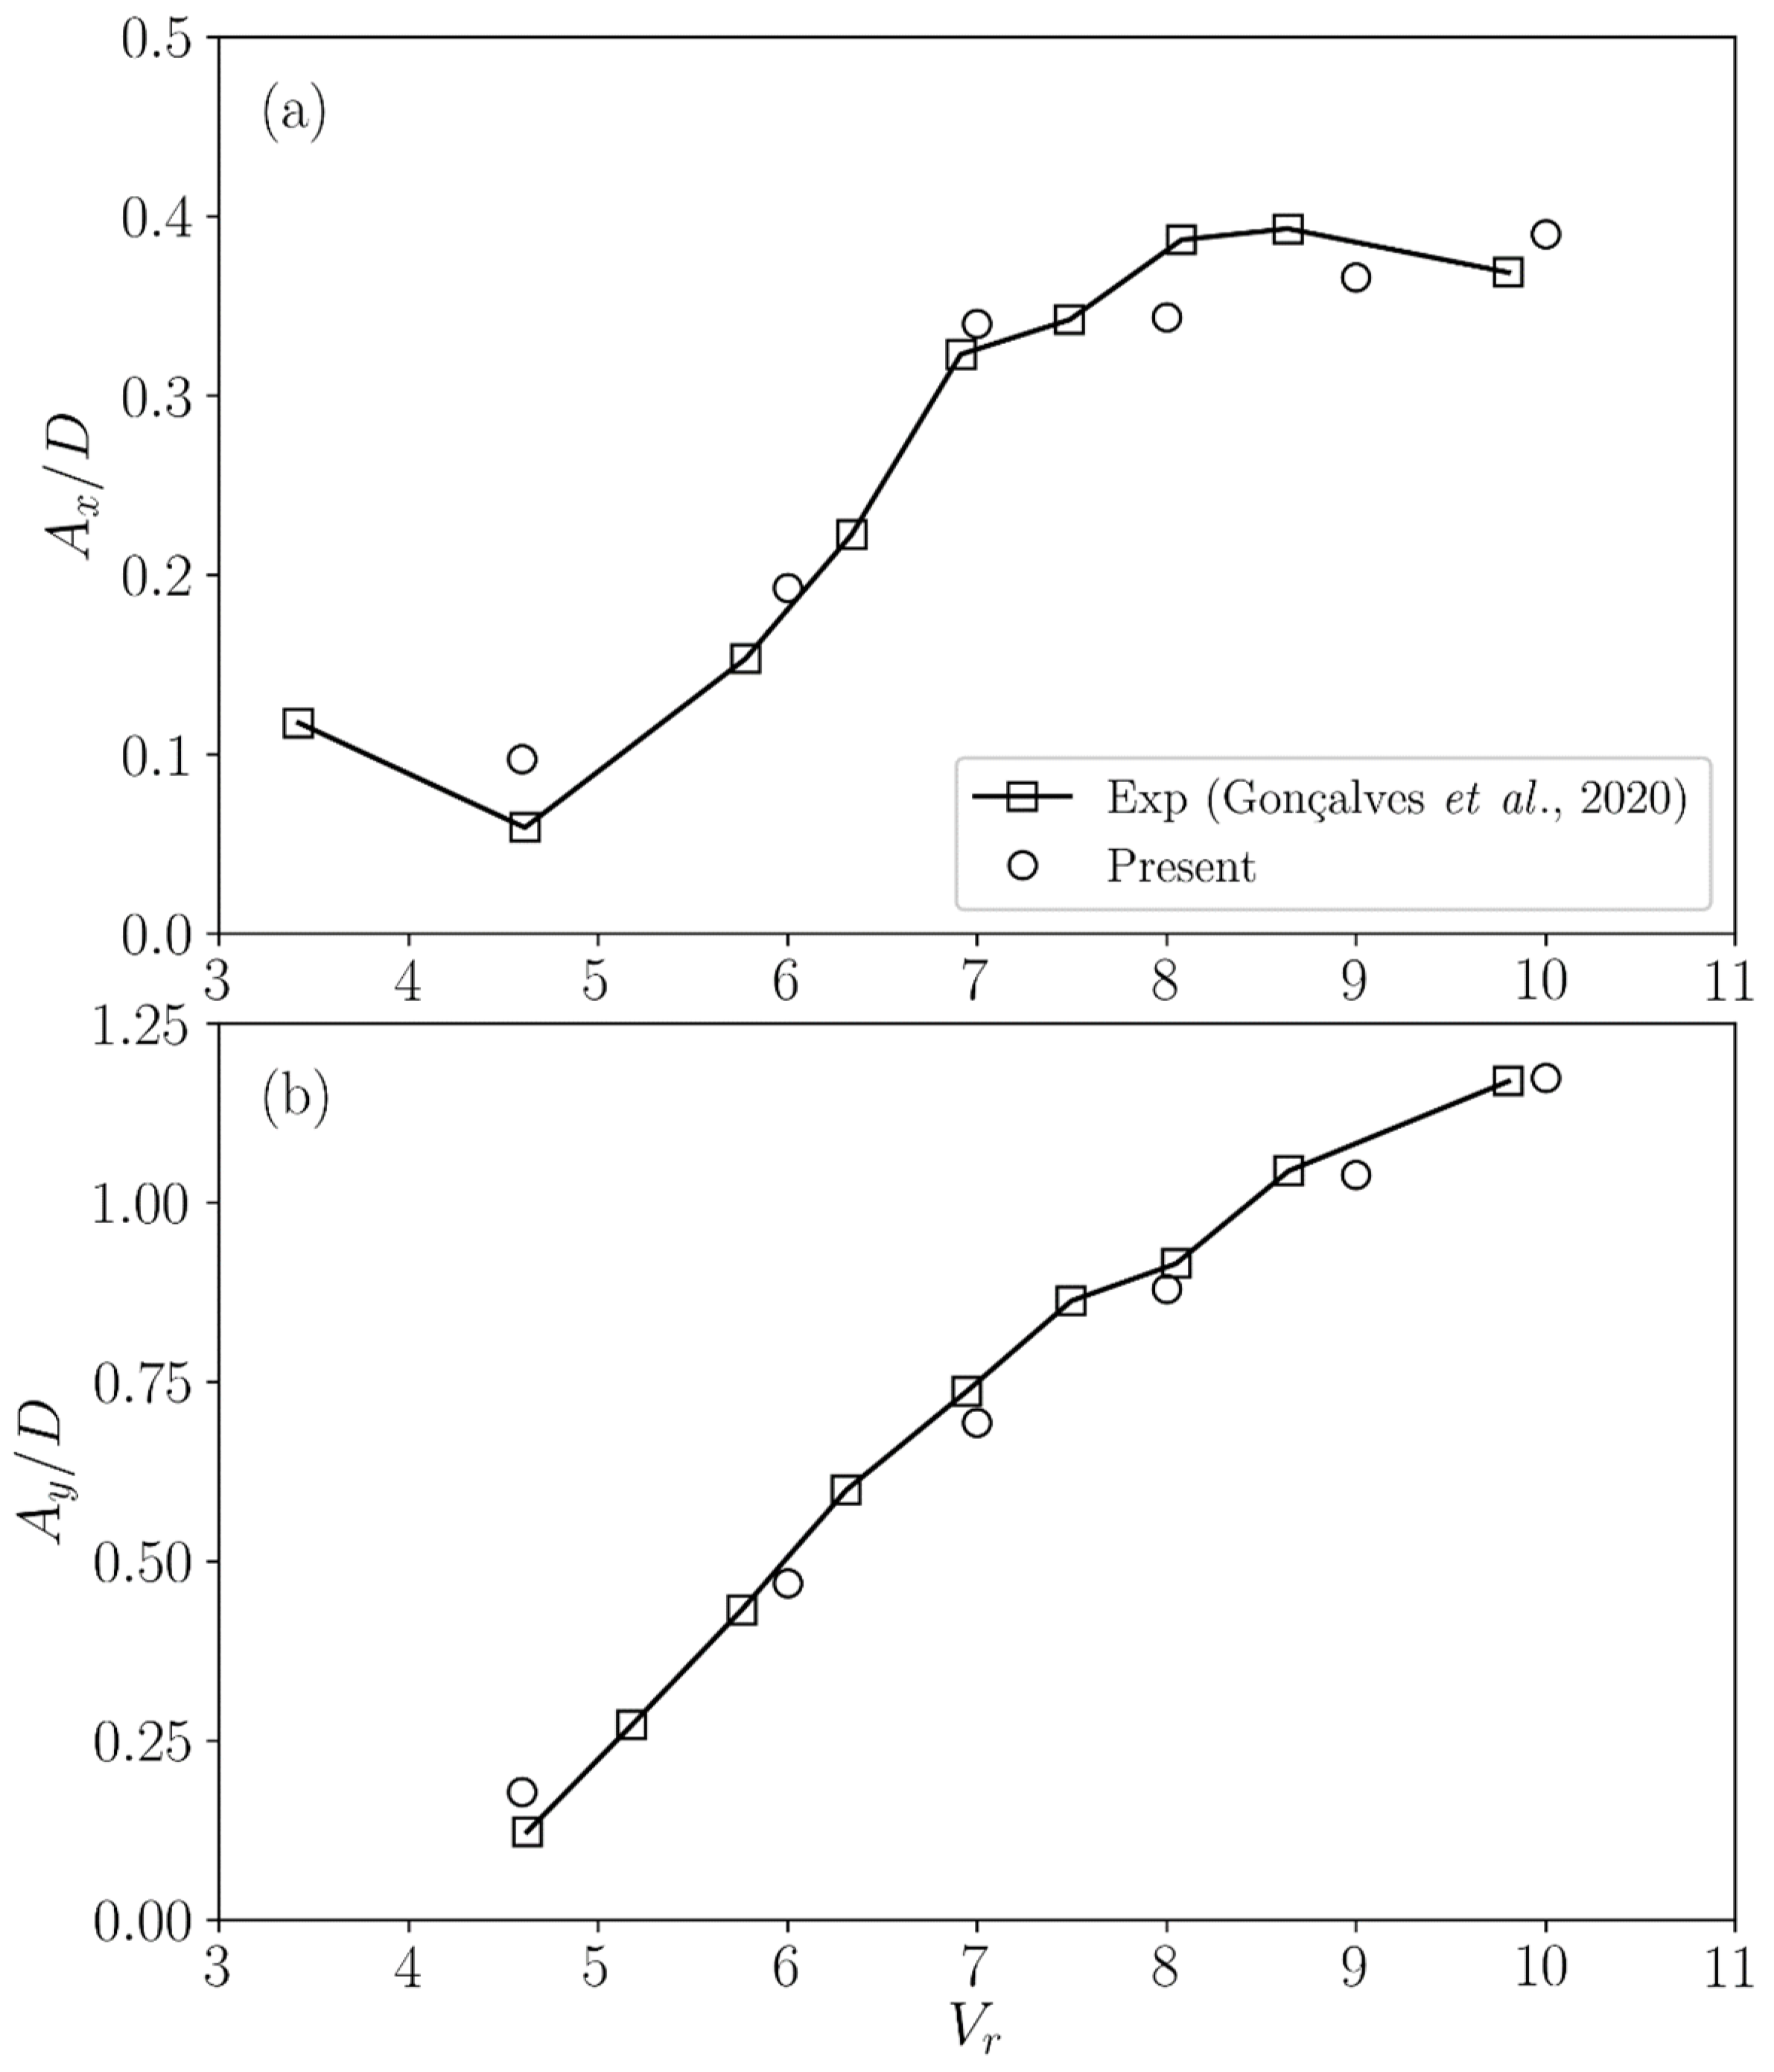
The numerical tool adopted for the present study is validated against the VIM experiment of a four-column floating platform, conducted by Gonçalves et al. [26]. The floating platform consists of four circular cylinders of equal size, which are arranged in a 2 × 2 array with a spacing of 4 times the cylinder diameter in both directions. Principal parameters of the floating platform can be found in the work of Gonçalves et al. [26]. The platform in the experiment was restrained by a simplified mooring system comprised of four springs, and was installed on a towing carriage moving at a constant speed in a towing tank. In numerical simulations, equivalent spring stiffness in both inline and transverse directions is applied to the platform, which is subjected to an incident current with constant velocity, and is only allowed to translate in the two directions.
Figure 4 compares the predictions of the non-dimensional platform VIM amplitude in both directions from the numerical tool, with the experimental data provided by Gonçalves et al. [26] at various reduced velocities . It is found that the results from the numerical simulations agree rather well with experimental measurements. As is shown in Figure 4a, the non-dimensional inline response of the platform increases notably before , and then stays between 0.3 and 0.4, until . Meanwhile, Figure 4b demonstrates that the non-dimensional transverse response of the platform rises sharply as increases, reaching a maximum of about 1.2 at , i.e., the largest tested reduced velocity. The good agreement between the data obtained from the numerical and experimental studies indicates that the numerical tool presented in this work is able to predict the VIM of multi-column platforms with good accuracy.
4. Computational Model
4.1. Computational Domain and Boundary Conditions
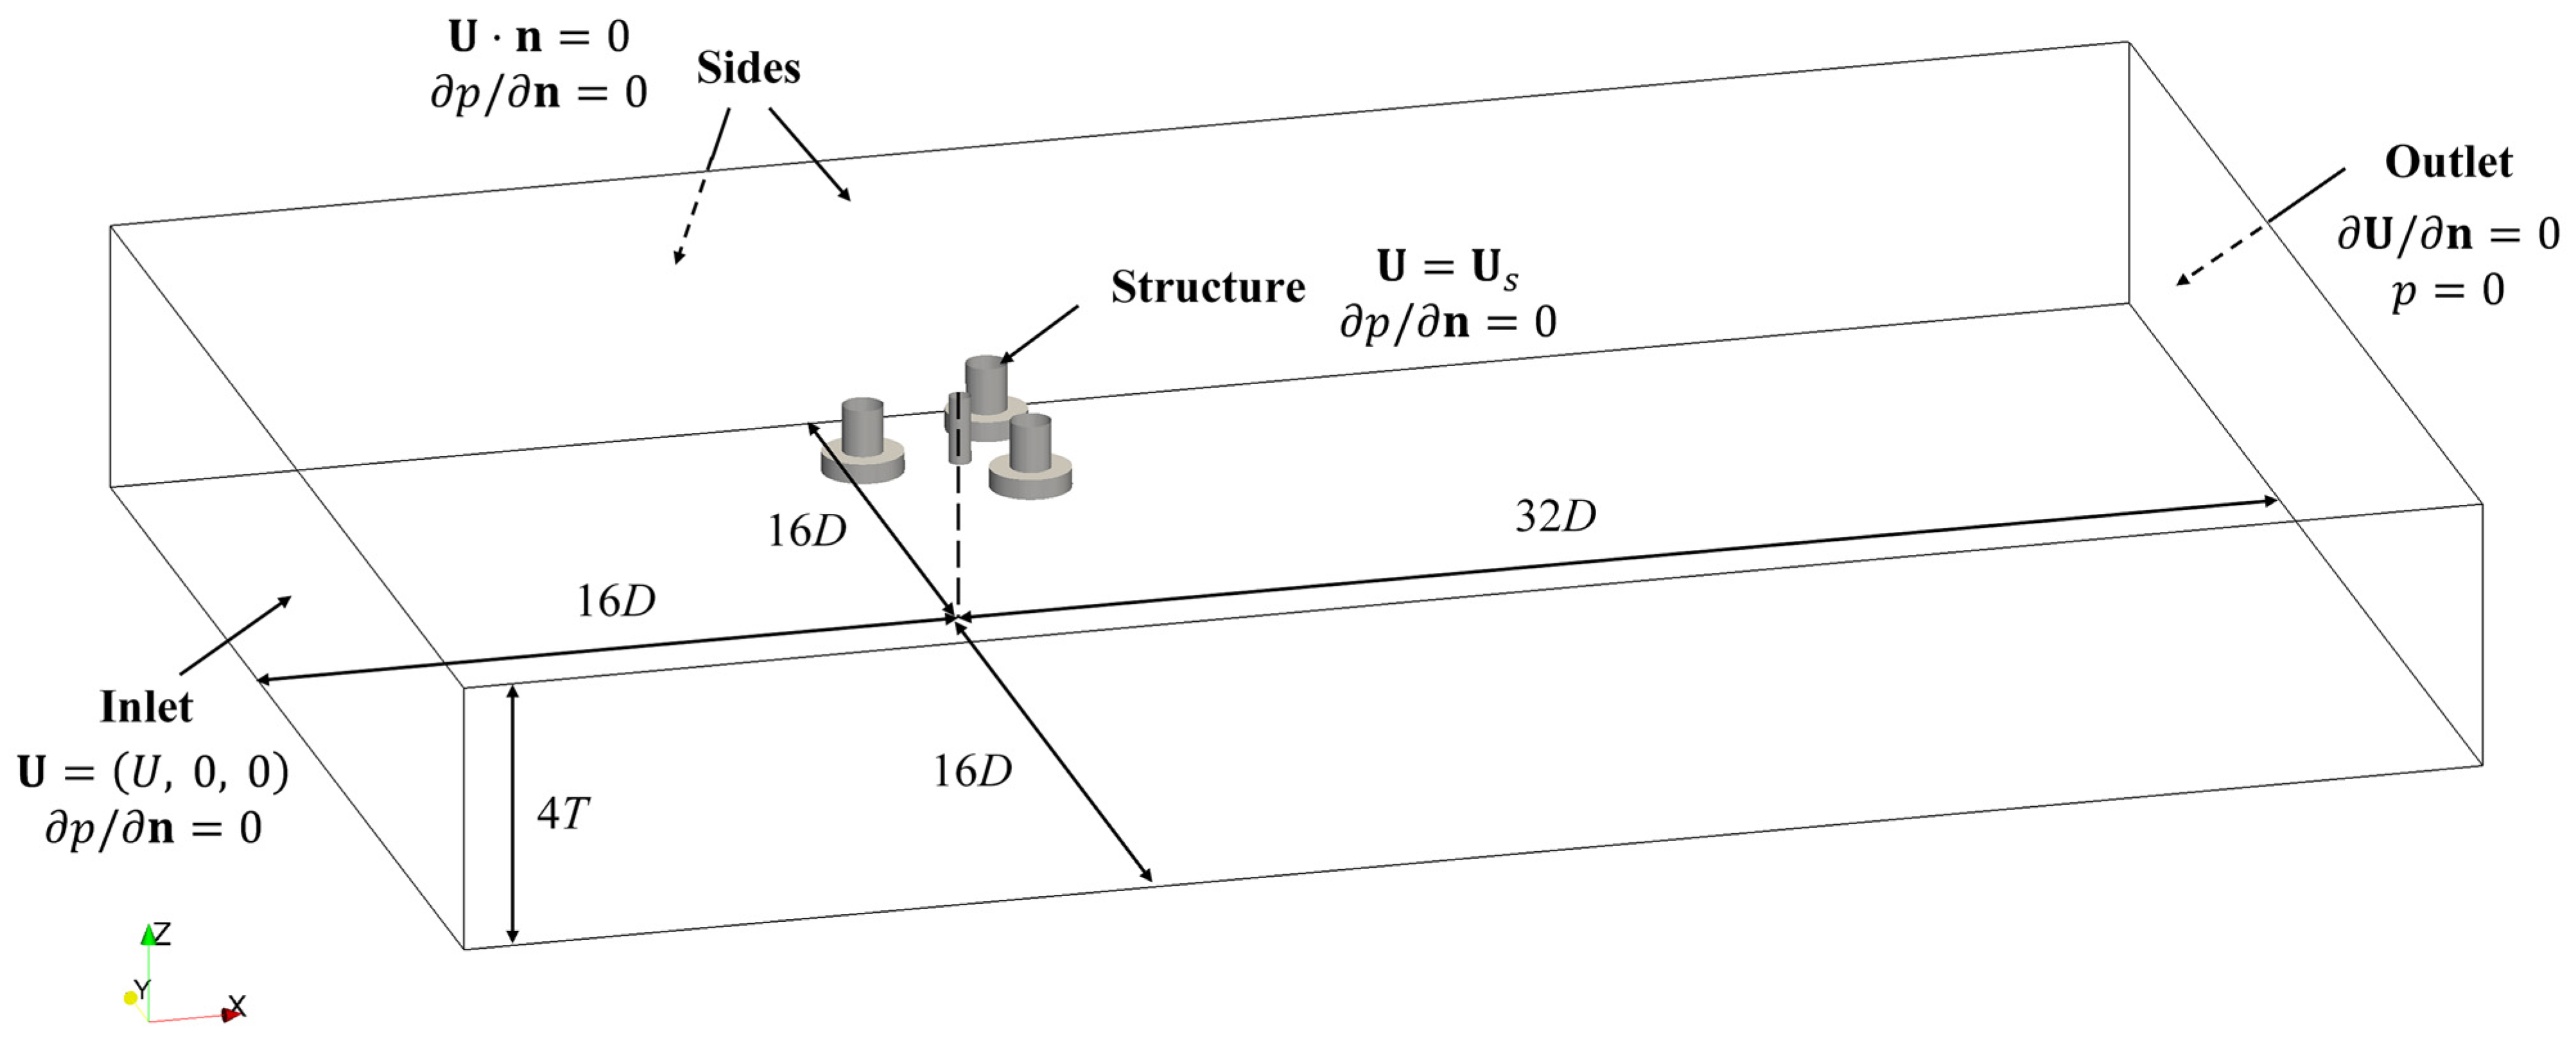
The computational domain established for VIM simulations of the FOWT platform is shown in Figure 5, where the scenario with the incidence angle of is demonstrated as an example. The distance measured from the top to the bottom boundary of the domain is , where denotes the draft of the FOWT platform. The centreline of the middle column is away from the two sides as well as the Inlet boundary, and from the Outlet boundary, in order to minimise the impact of domain boundaries on the fluid flow around the FOWT platform. For other cases with a different incidence angle, the FOWT platform is rotated about the centreline of the middle column, while all other boundaries remain unchanged.
The boundary conditions employed for the computational model are also annotated in Figure 5. A constant free stream velocity is specified for the fluid velocity , in the positive direction at the Inlet boundary, while the fluid pressure at the Outlet boundary is set to zero. A symmetry condition is applied at the four Sides boundaries, where the velocity component normal to these boundaries is always zero. A no-slip condition is imposed to the Structure boundary so that the fluid velocity on the structure surface is equal to the calculated structure velocity .
4.2. Mesh and Time-Step Size Sensitivity Tests
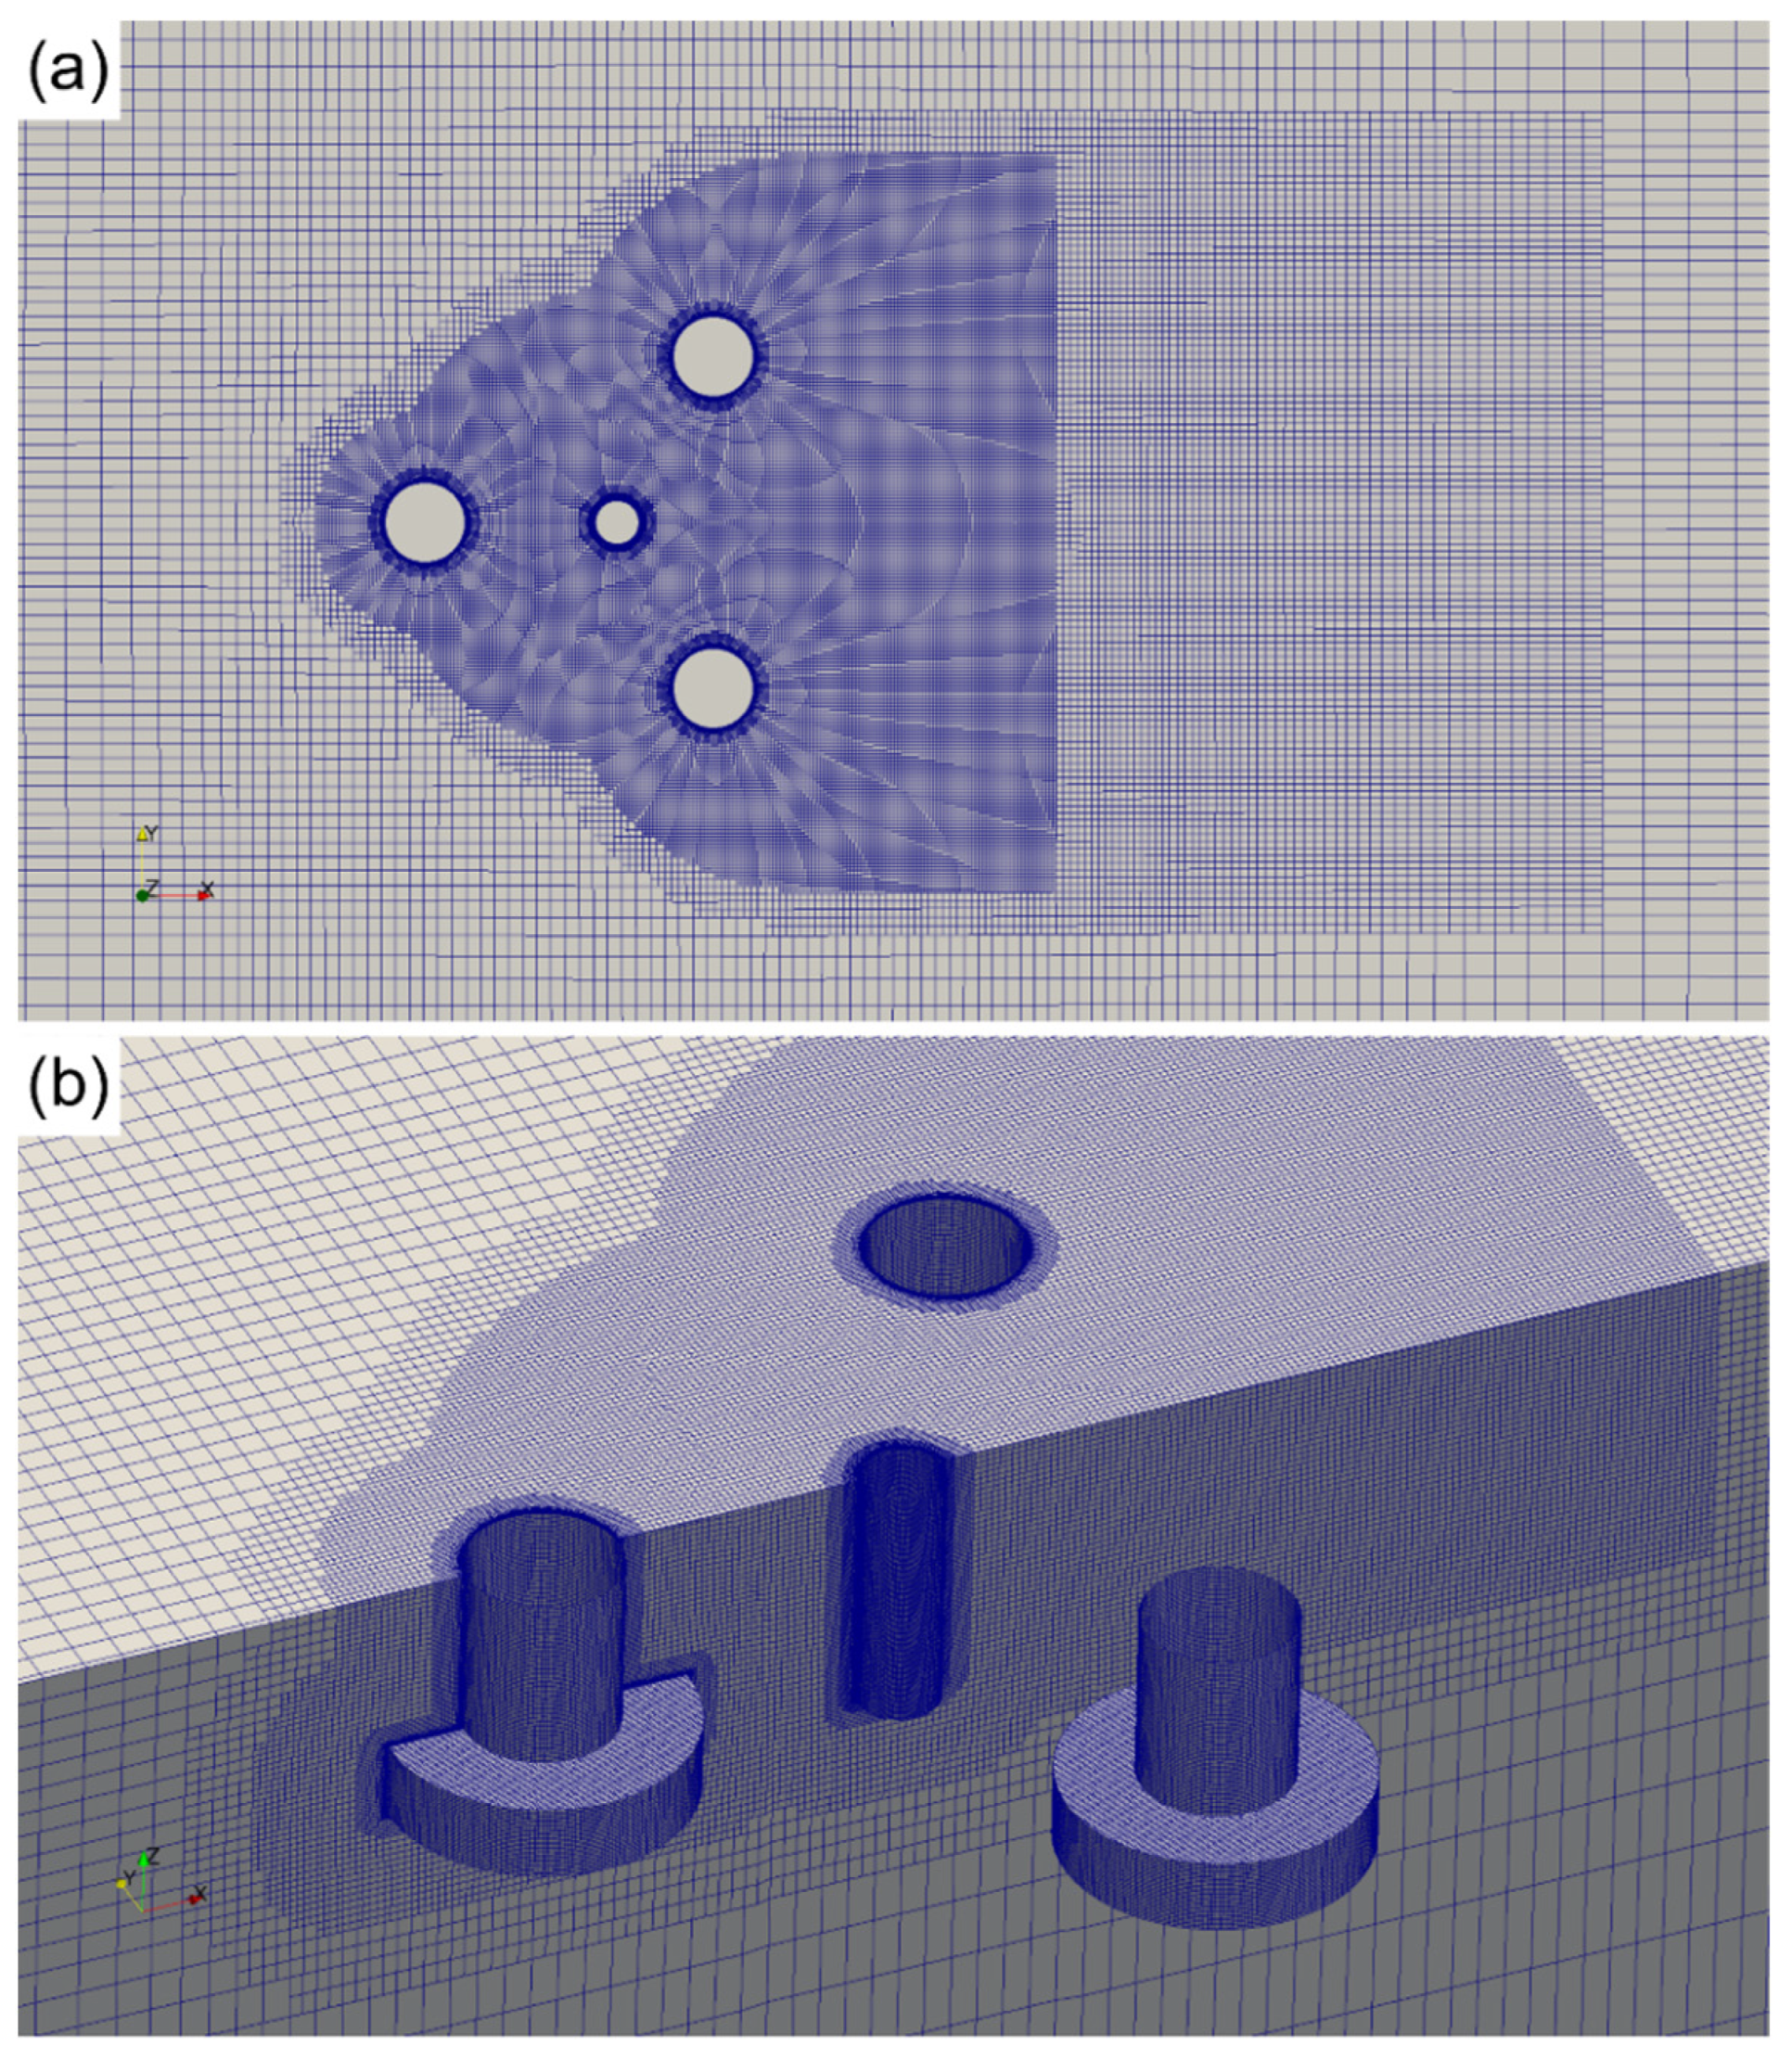
A mesh sensitivity test is carried out to ensure that the numerical results obtained in the present study are independent of the computational mesh. Three cases with different mesh densities are set up, which are named Coarse, Medium, and Fine, as listed in Table 3. The computational mesh for the Medium grid with an incidence angle of is presented in Figure 6, where Figure 6a depicts the mesh on the top side of the computational domain, and Figure 6b shows the mesh on the platform surface. The built-in grid generation utility snappyHexMesh in OpenFOAM is used to generate a hexahedra-dominant unstructured grid with good quality. The grid is refined with increased levels of cell-splitting near the FOWT platform and in the downstream wake region, in order to better capture vortex shedding from the structure surface, as well as the interaction between the vortex flow and the platform. A total of 20 layers of cells are extruded from the structure surface with a growth ratio of 1.2, and the height of the first cell away from the structure surface is set to 0.0001 m to satisfy , which ensures that the boundary layer is fully resolved, and thus no wall functions are employed for the turbulence equations.
Table 3 compares the non-dimensional mean inline response , inline response amplitude , transverse response amplitude , and transverse response frequency ratio among the three cases at and . The difference between the Medium and Fine cases is found to be smaller compared to that between the Medium and Coarse cases, indicating that the mesh density adopted for the Medium grid is adequate for the present study. Therefore, the Medium grid is employed for subsequent simulations.
Similarly, a sensitivity test is conducted for the time-step size . A nondimensional time-step size is defined by normalising with the flow velocity and the diameter of the upper part of the side columns . Three simulations with the Medium grid are performed at and , with set to 0.05, 0.025, and 0.0125, respectively. Table 3 shows that the results obtained for the two cases with and agree well. The nondimensional time-step size of is thus adopted in the present study.
4.3. Mooring Stiffness Tests
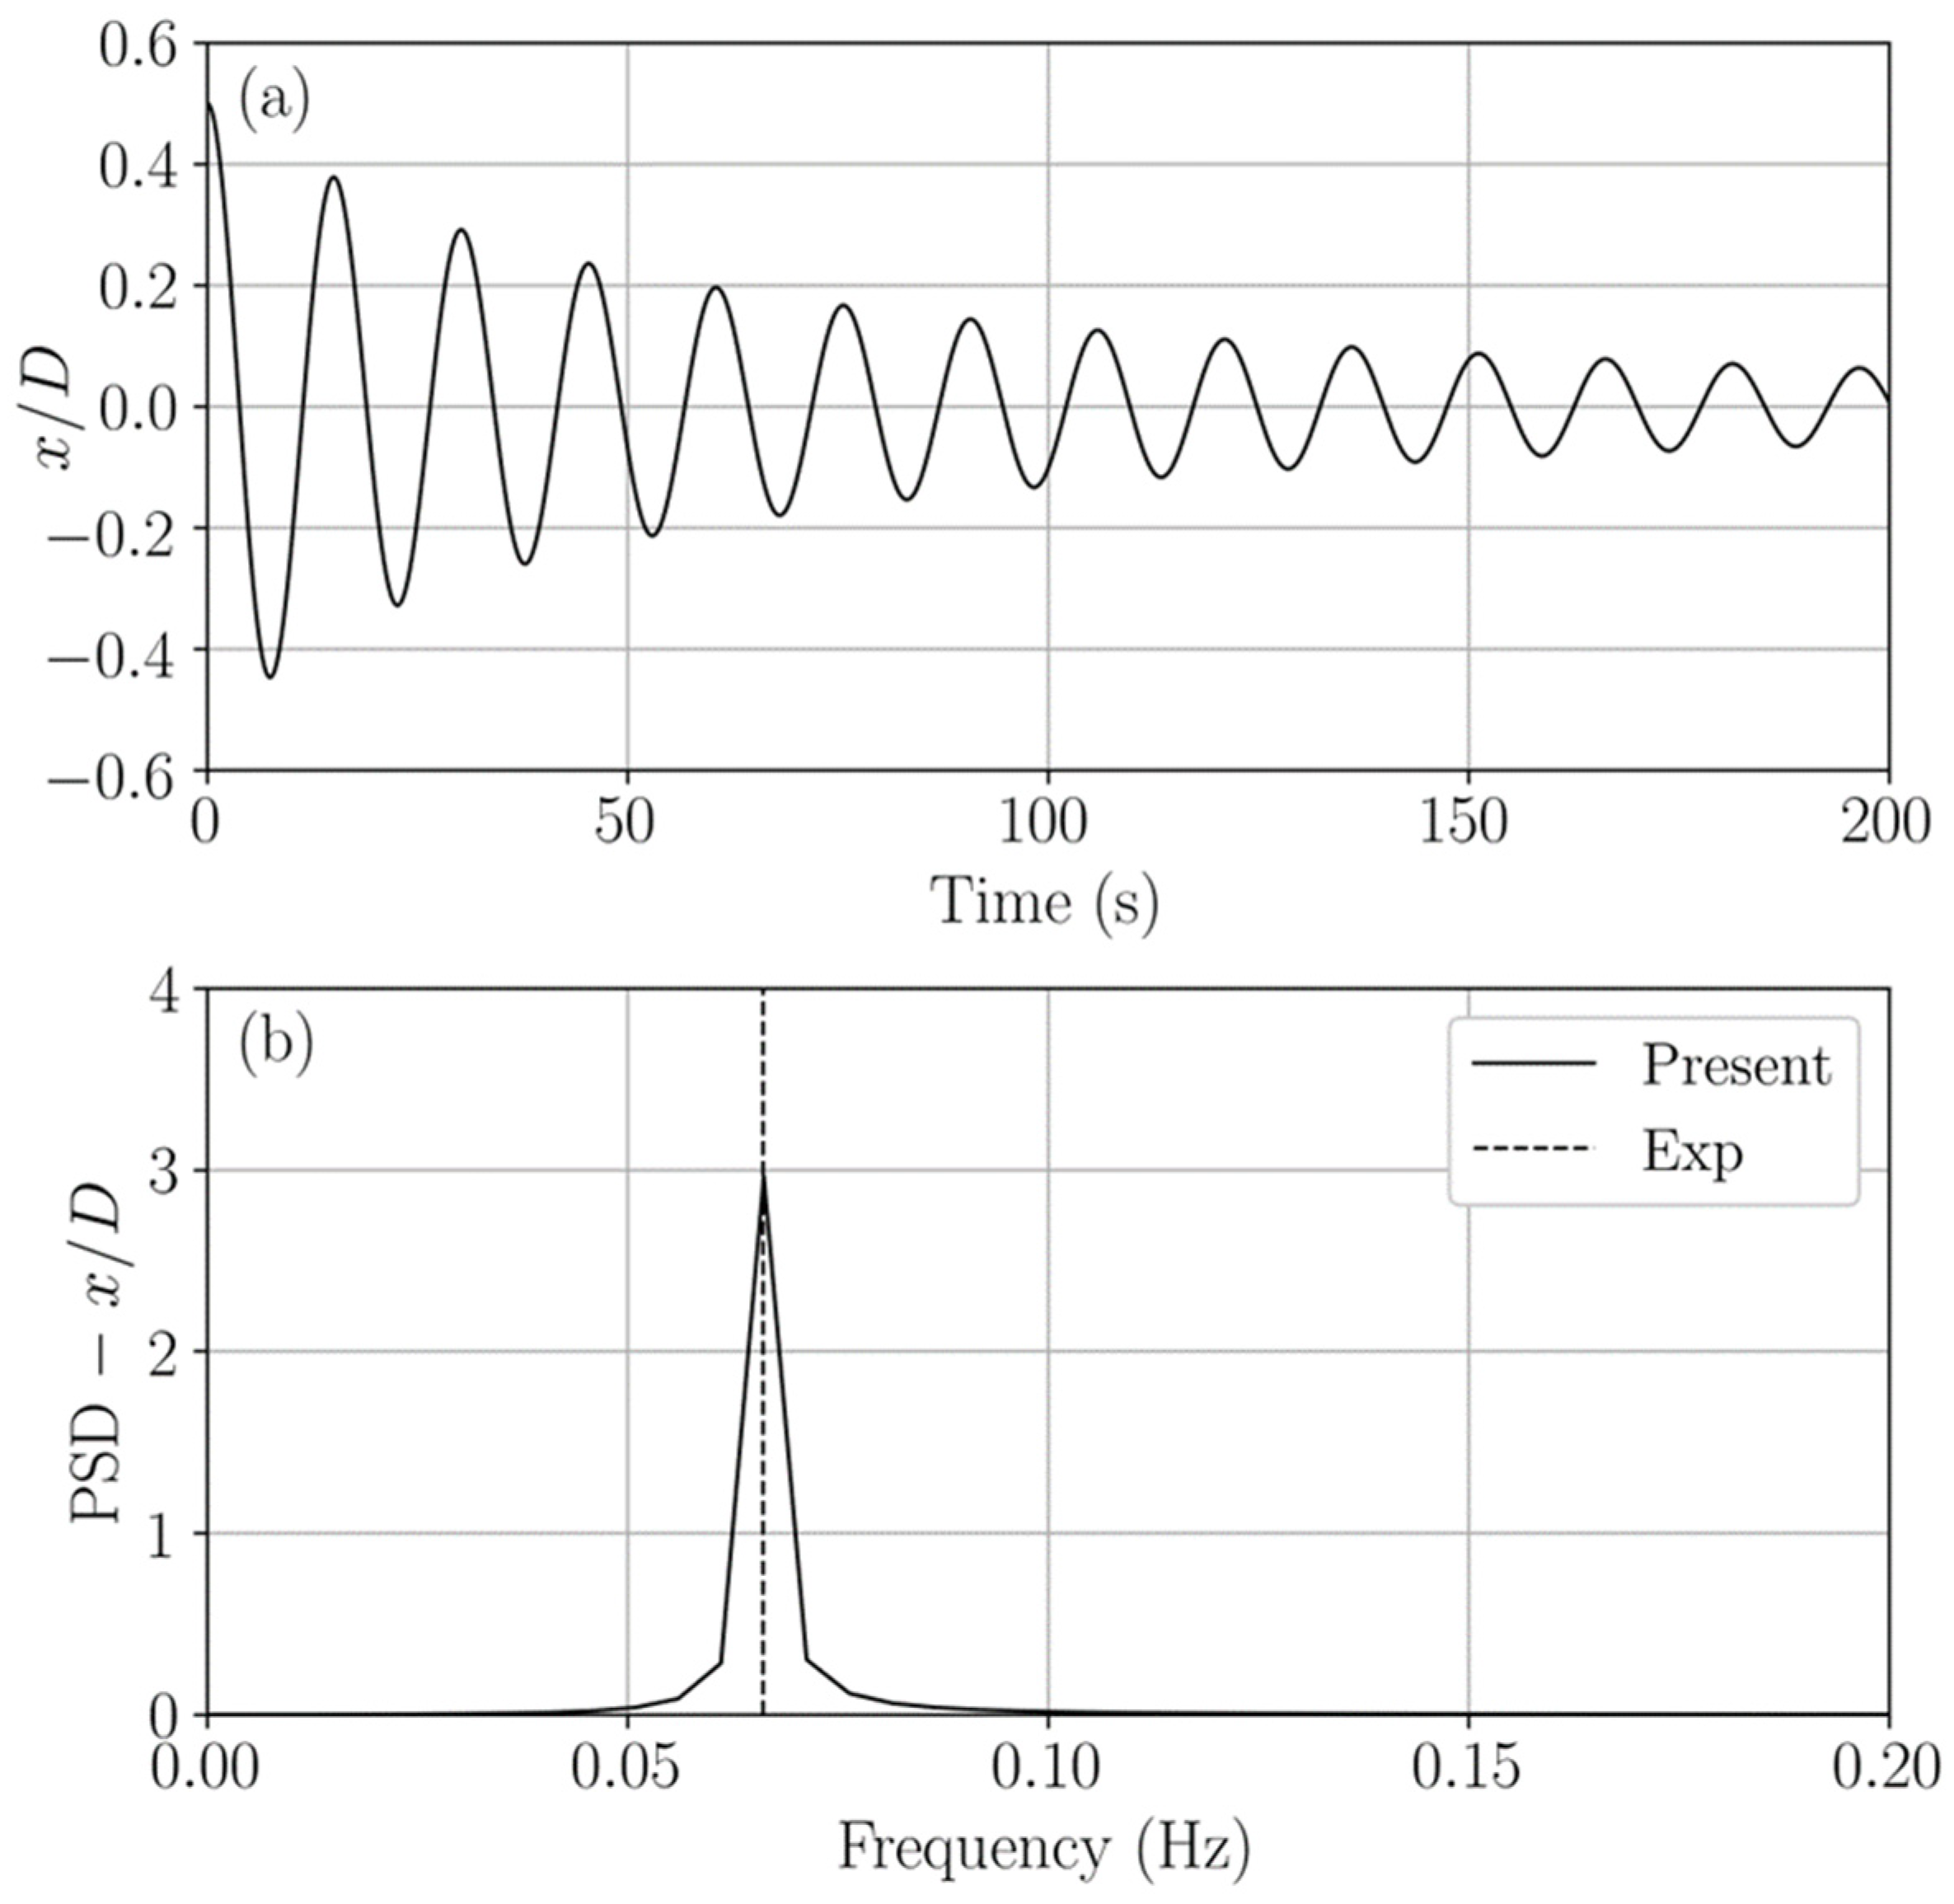
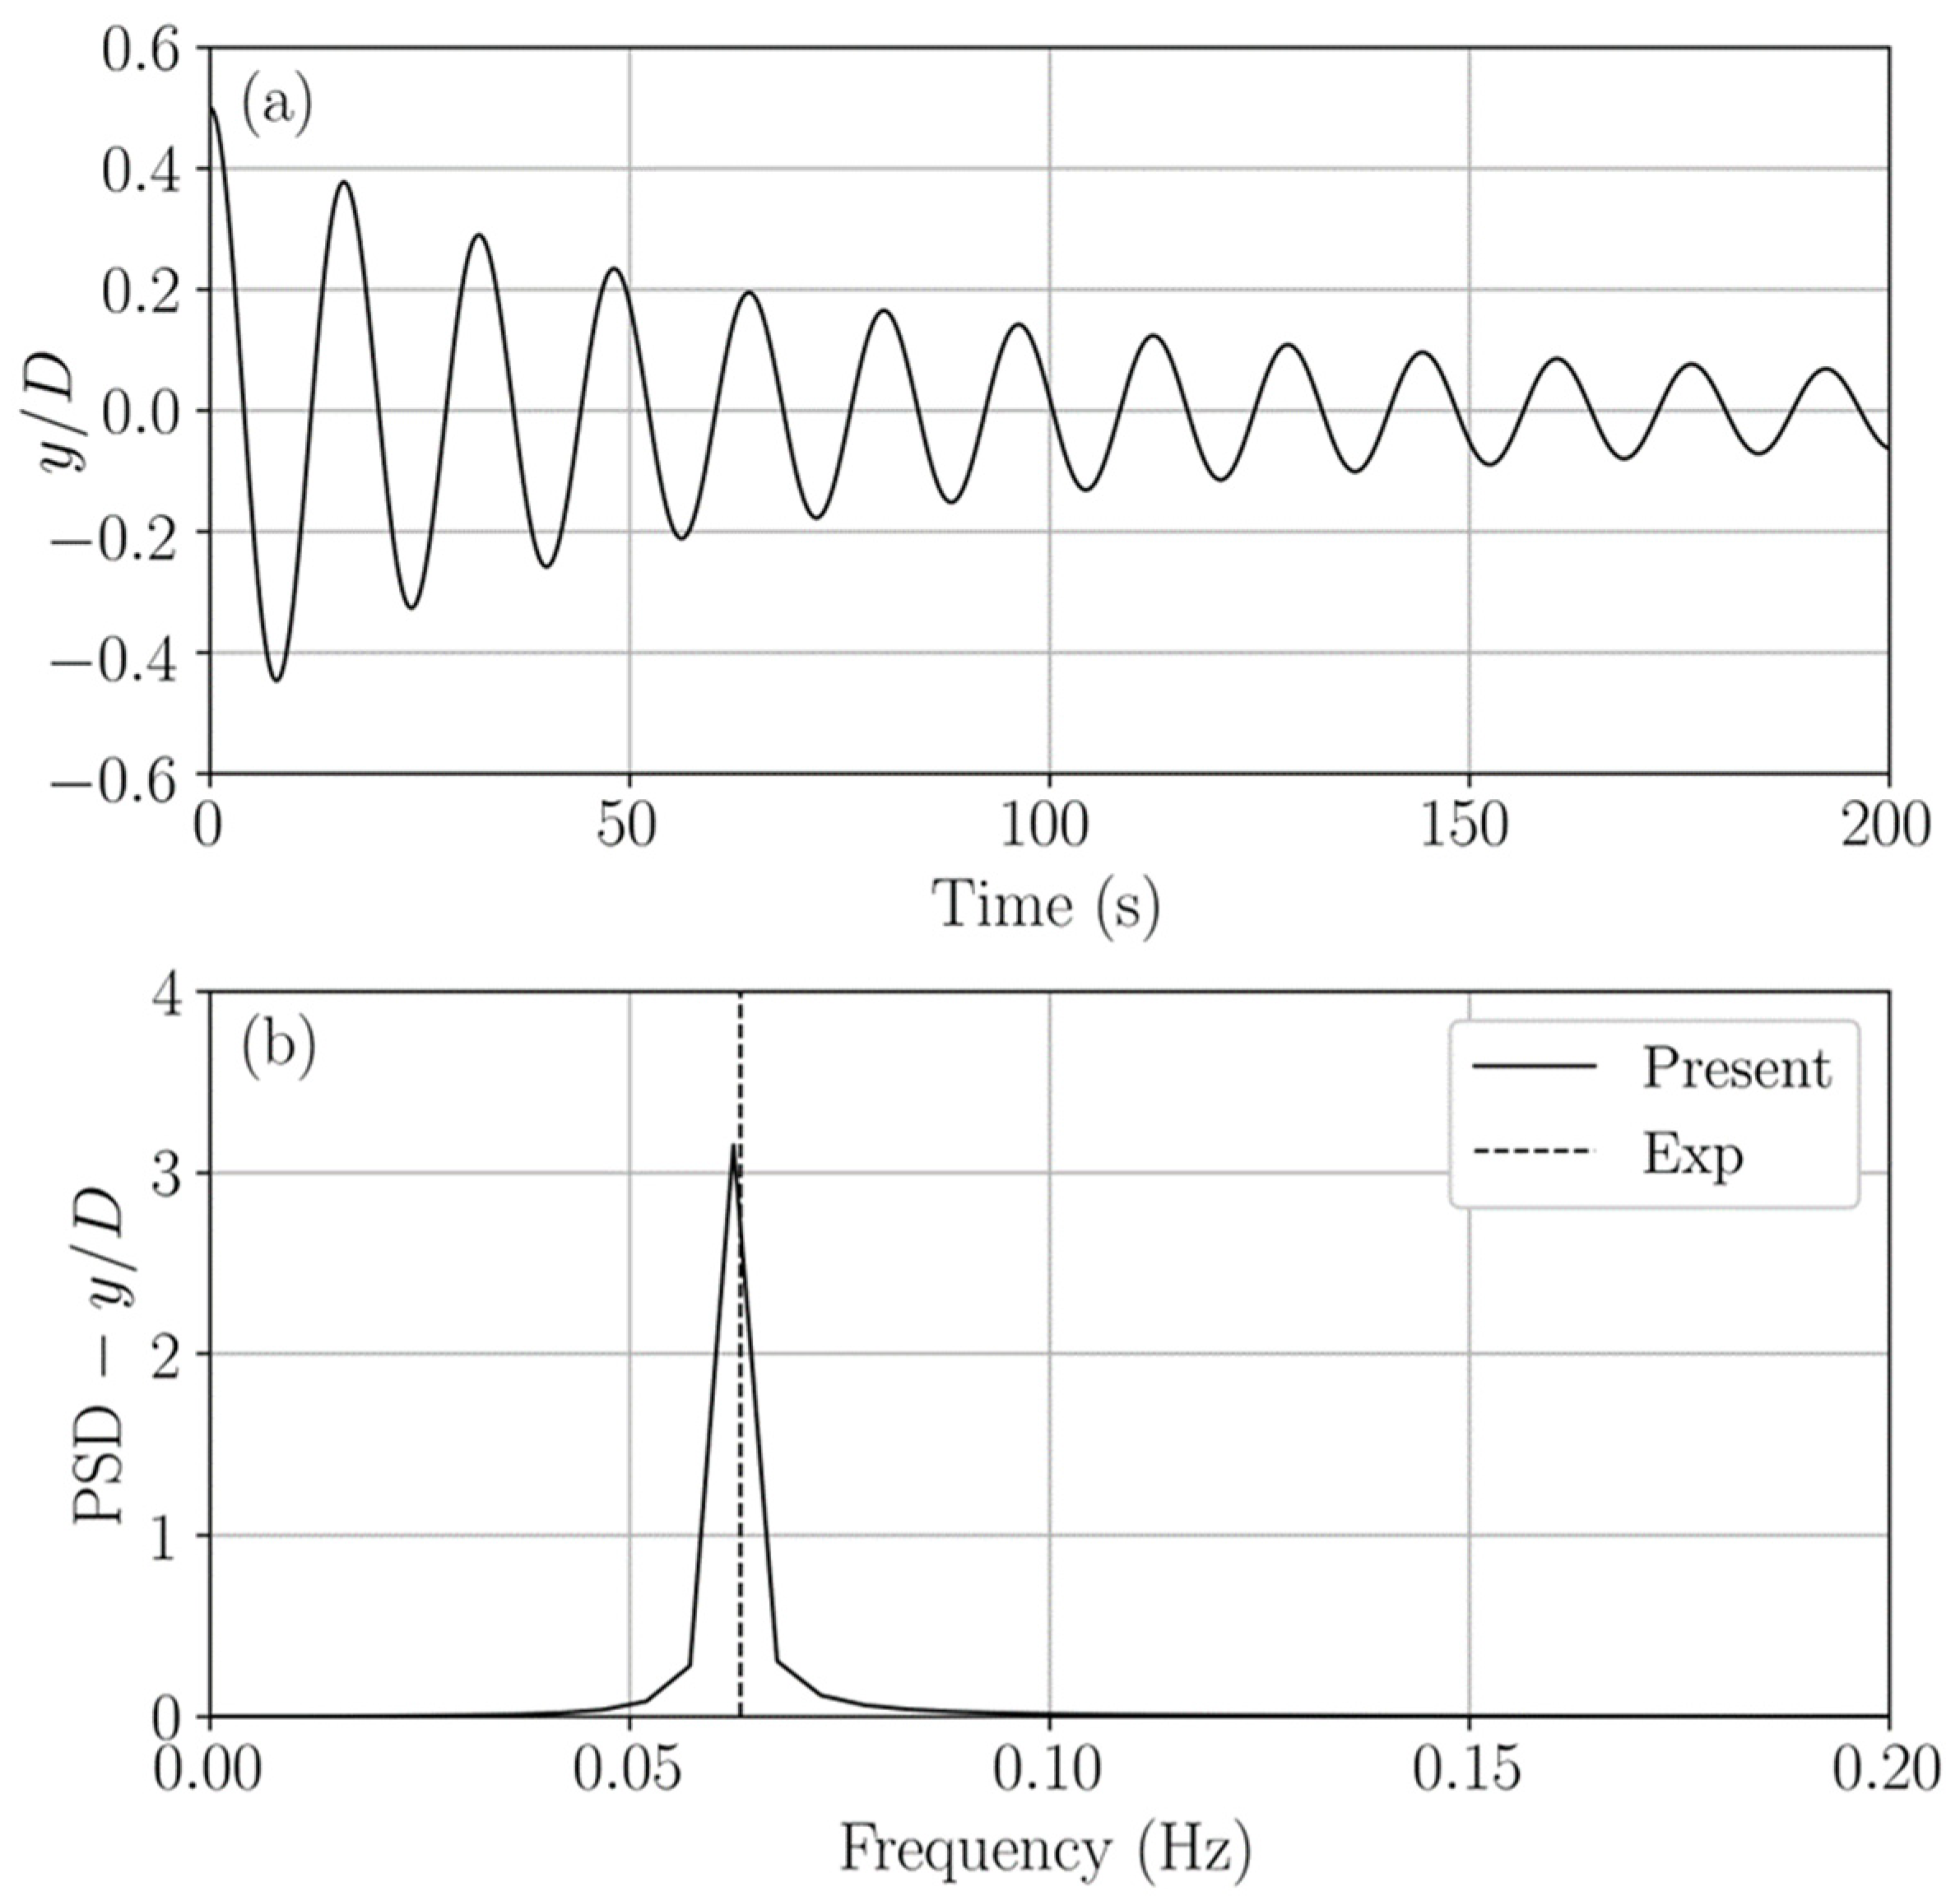
The VIM responses of the FOWT platform are closely related to its natural frequency in both inline and transverse directions, which is determined by the restoring stiffness provided by its mooring system. In order to ensure that the equivalent spring stiffness employed in the present study well represents the original three-line mooring system, free decay tests are carried out for the FOWT platform in both directions. The platform is subjected to an initial displacement of in either direction and is allowed to move freely. Figure 7 and Figure 8 show the time series and Power Spectral Density (PSD) curves of the platform motions in inline and transverse directions, respectively. The natural frequency of the FOWT platform is then computed and compared with the experimental results in Coulling et al. [19]. It is found that the differences between the present predictions and experimental data in the natural frequency in both directions are rather small, i.e., 0.15% and −1.11%, separately. As a result, the equivalent spring stiffness set in this work can be deemed reasonable.
5. Results and Discussion
This section presents the results obtained with the numerical tool for the VIM of the FOWT platform. The effect of current incidence on the platform is analysed in terms of platform motion responses and fluid forces, as well as flow field.
5.1. Transverse Response
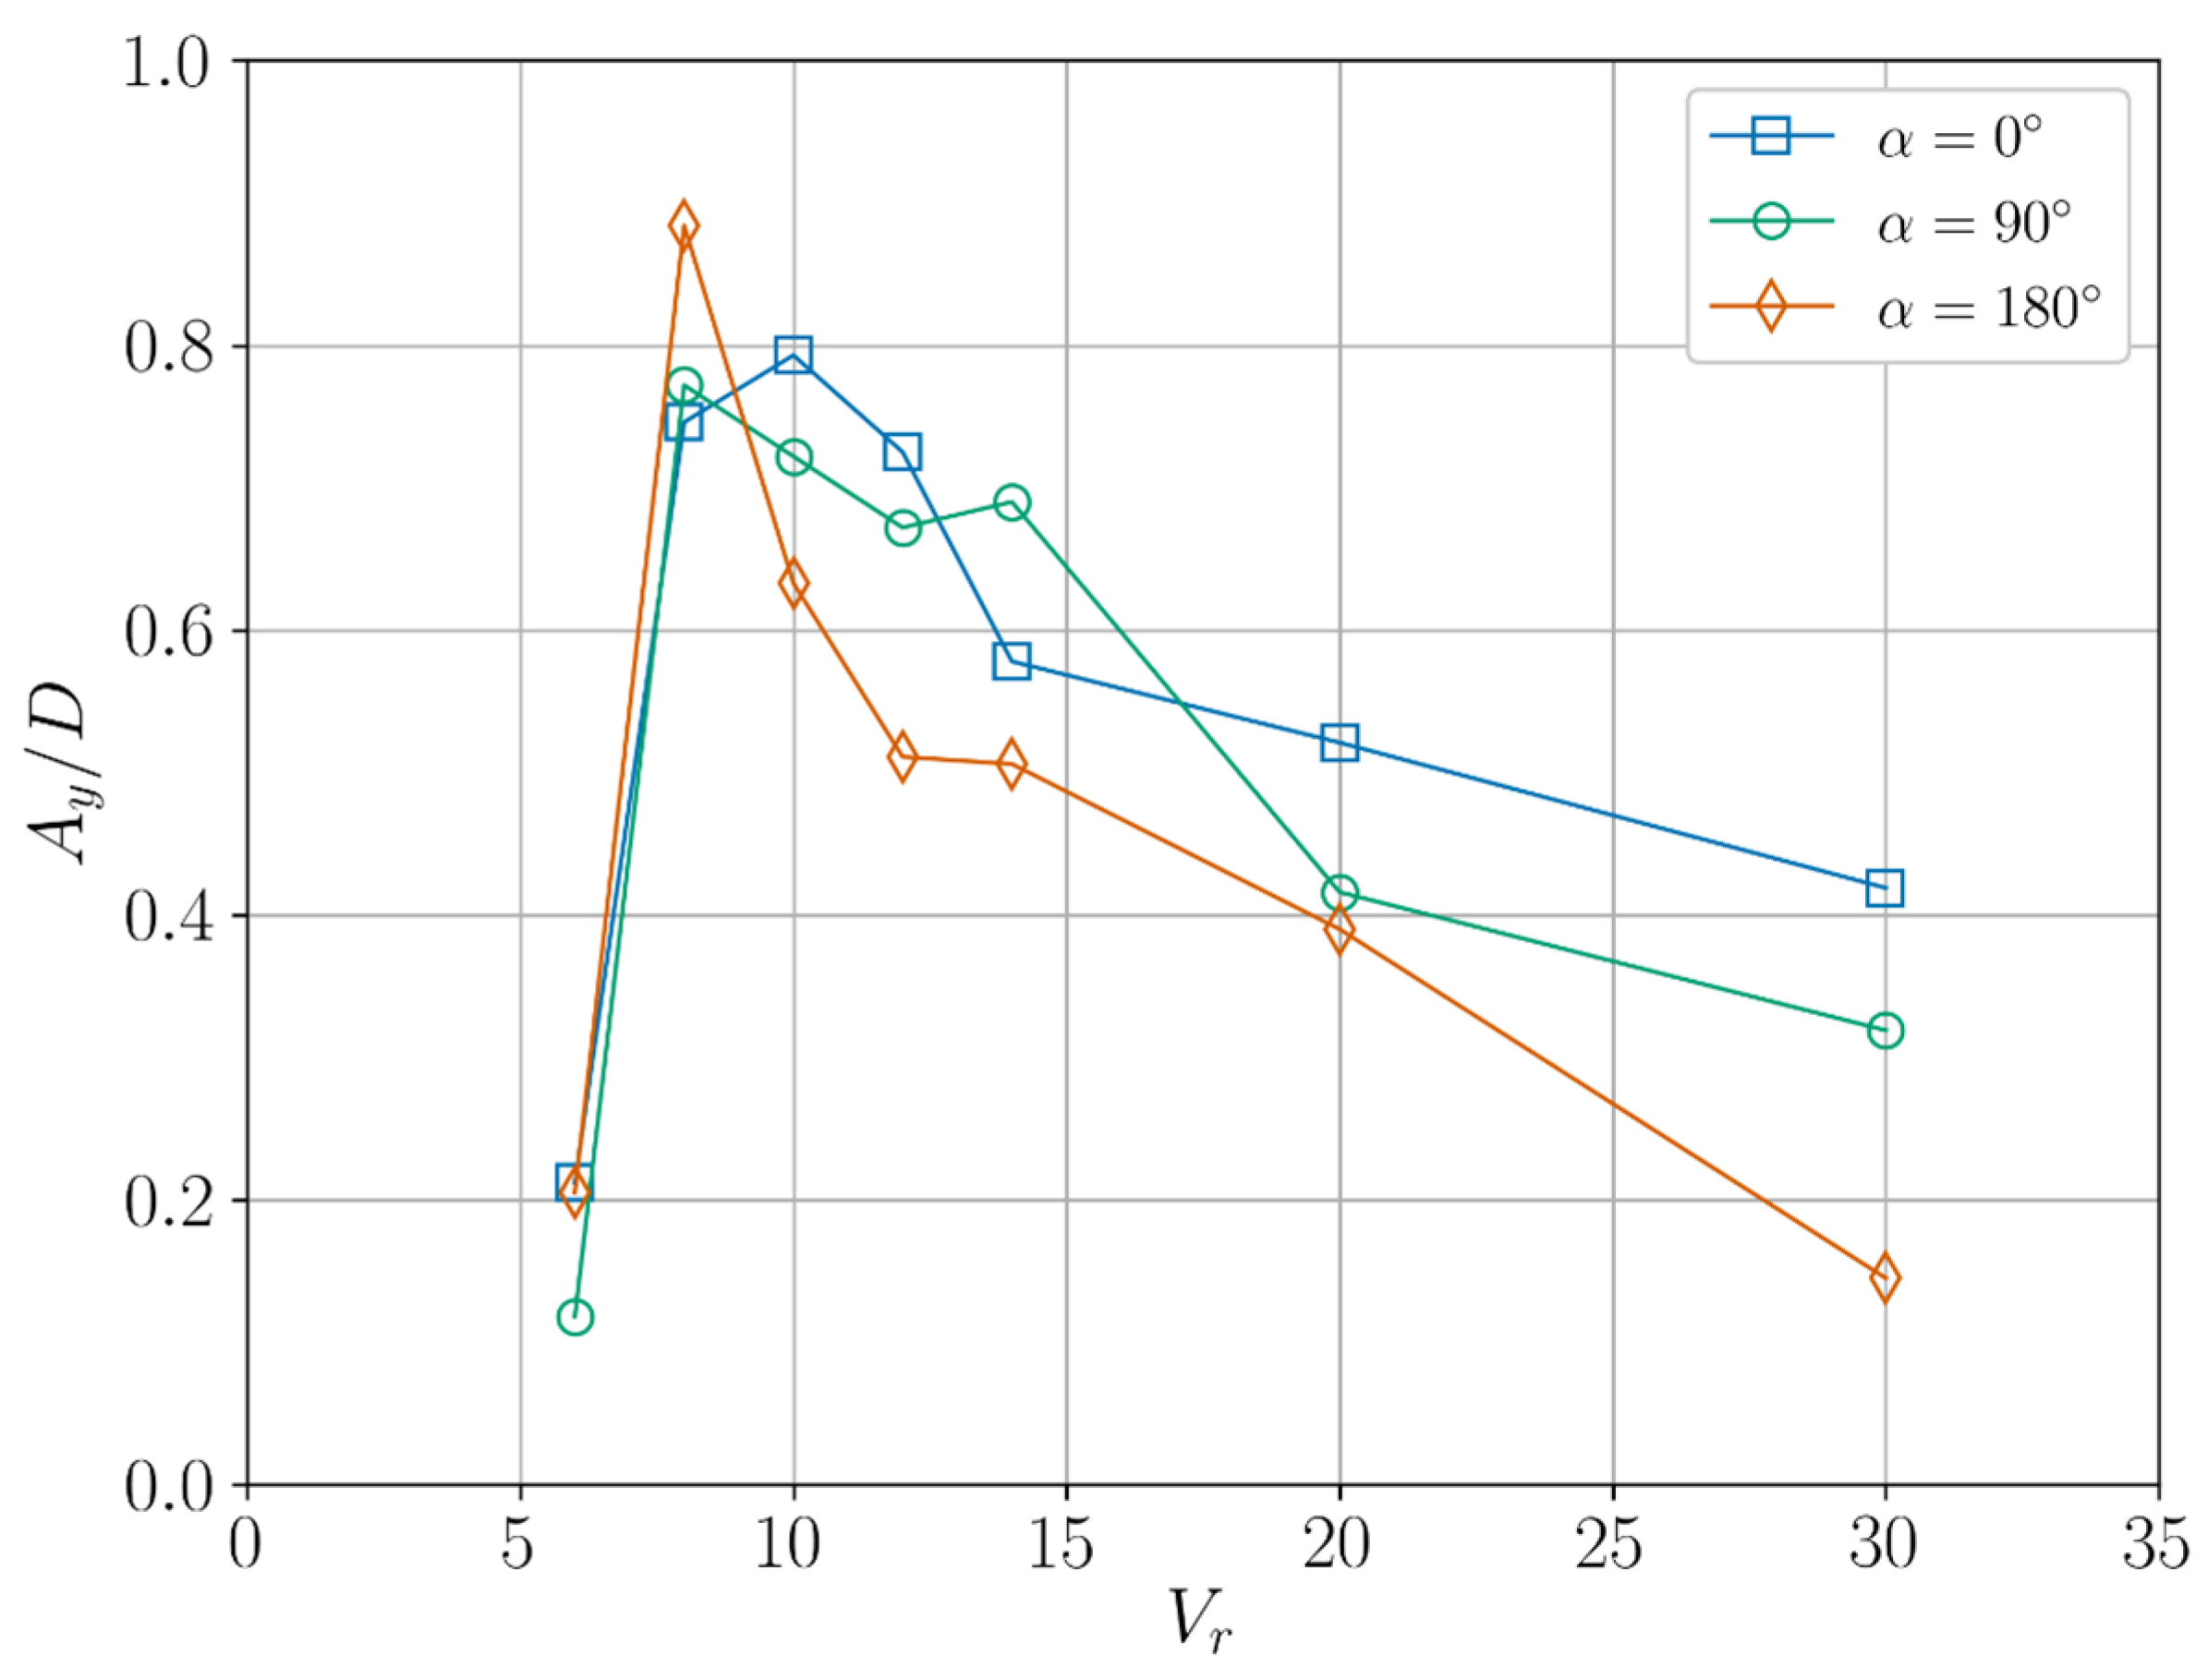
Figure 9 compares the variation of the transverse response amplitude of the FOWT platform with respect to the reduced velocity among cases with different incidence angles. It immediately becomes apparent that significant VIM responses are excited in the transverse direction. For the cases with , rises sharply from about 0.2 at to about 0.75 at , and reaches its maximum of around 0.8 at , followed by a gradual decrease to a still notable value of 0.4, even at . Results for the cases with are similar to those with , except that peaks at . Meanwhile, the responses with are generally smaller and the discrepancies are even more profound at and . When the incidence angle turns to 180°, although at is the largest of all simulated cases, the overall transverse response amplitude further decreases rapidly within the wide range of , compared to the other two scenarios. In particular, the response amplitude for the case with at falls below 0.2. These differences in clearly demonstrates that the transverse response amplitude of the FOWT platform is affected by the incidence angle , which will be further analysed in Section 5.4, from the viewpoint of flow field.
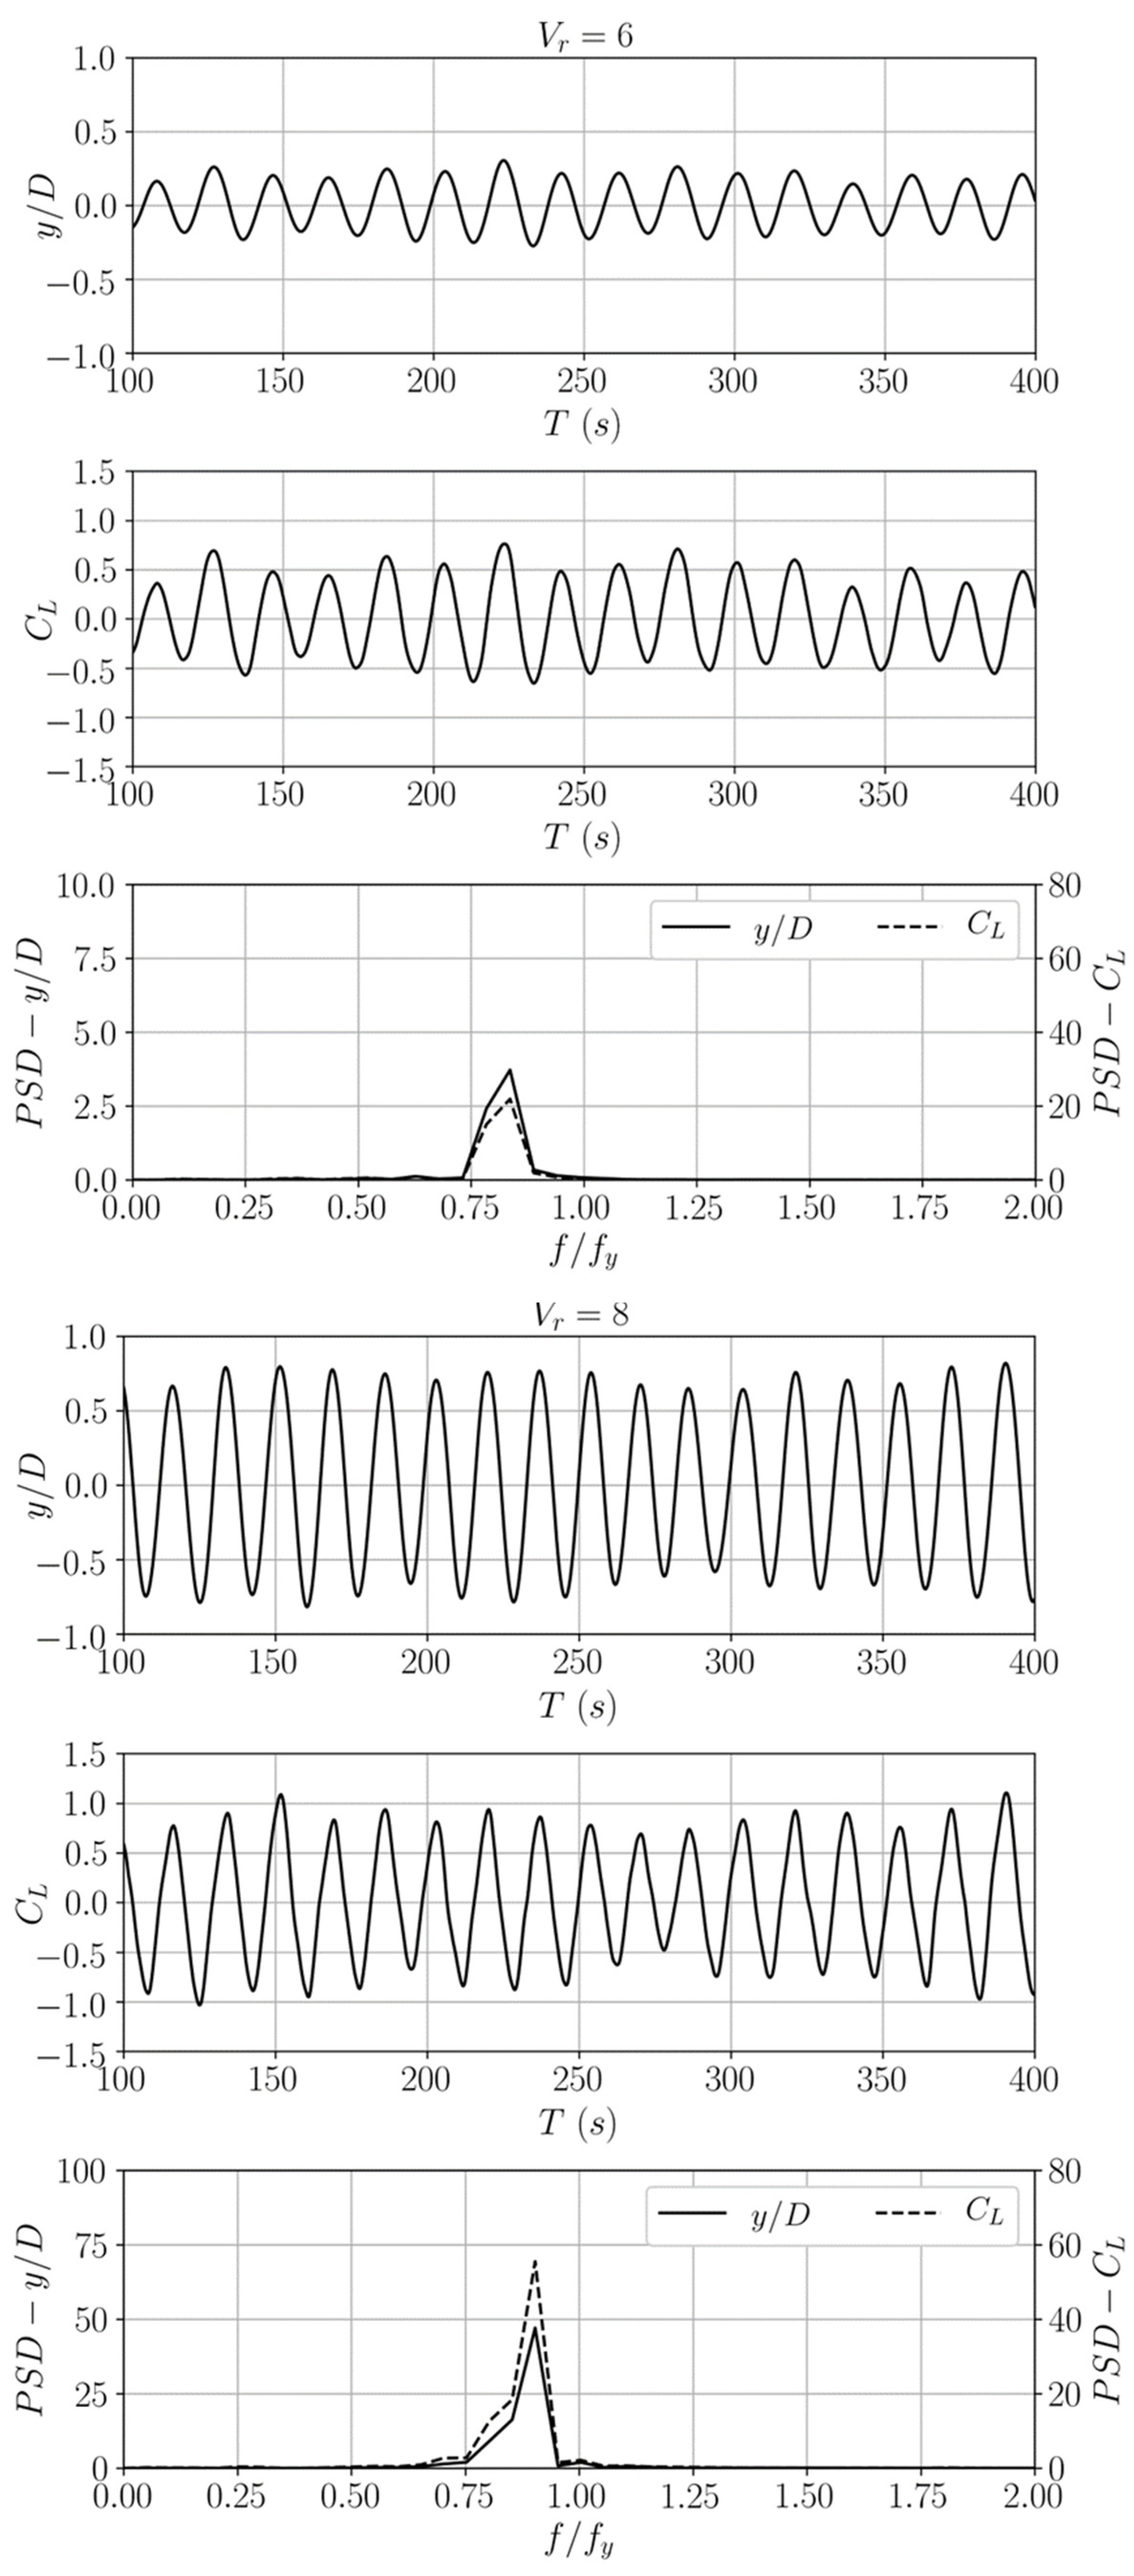
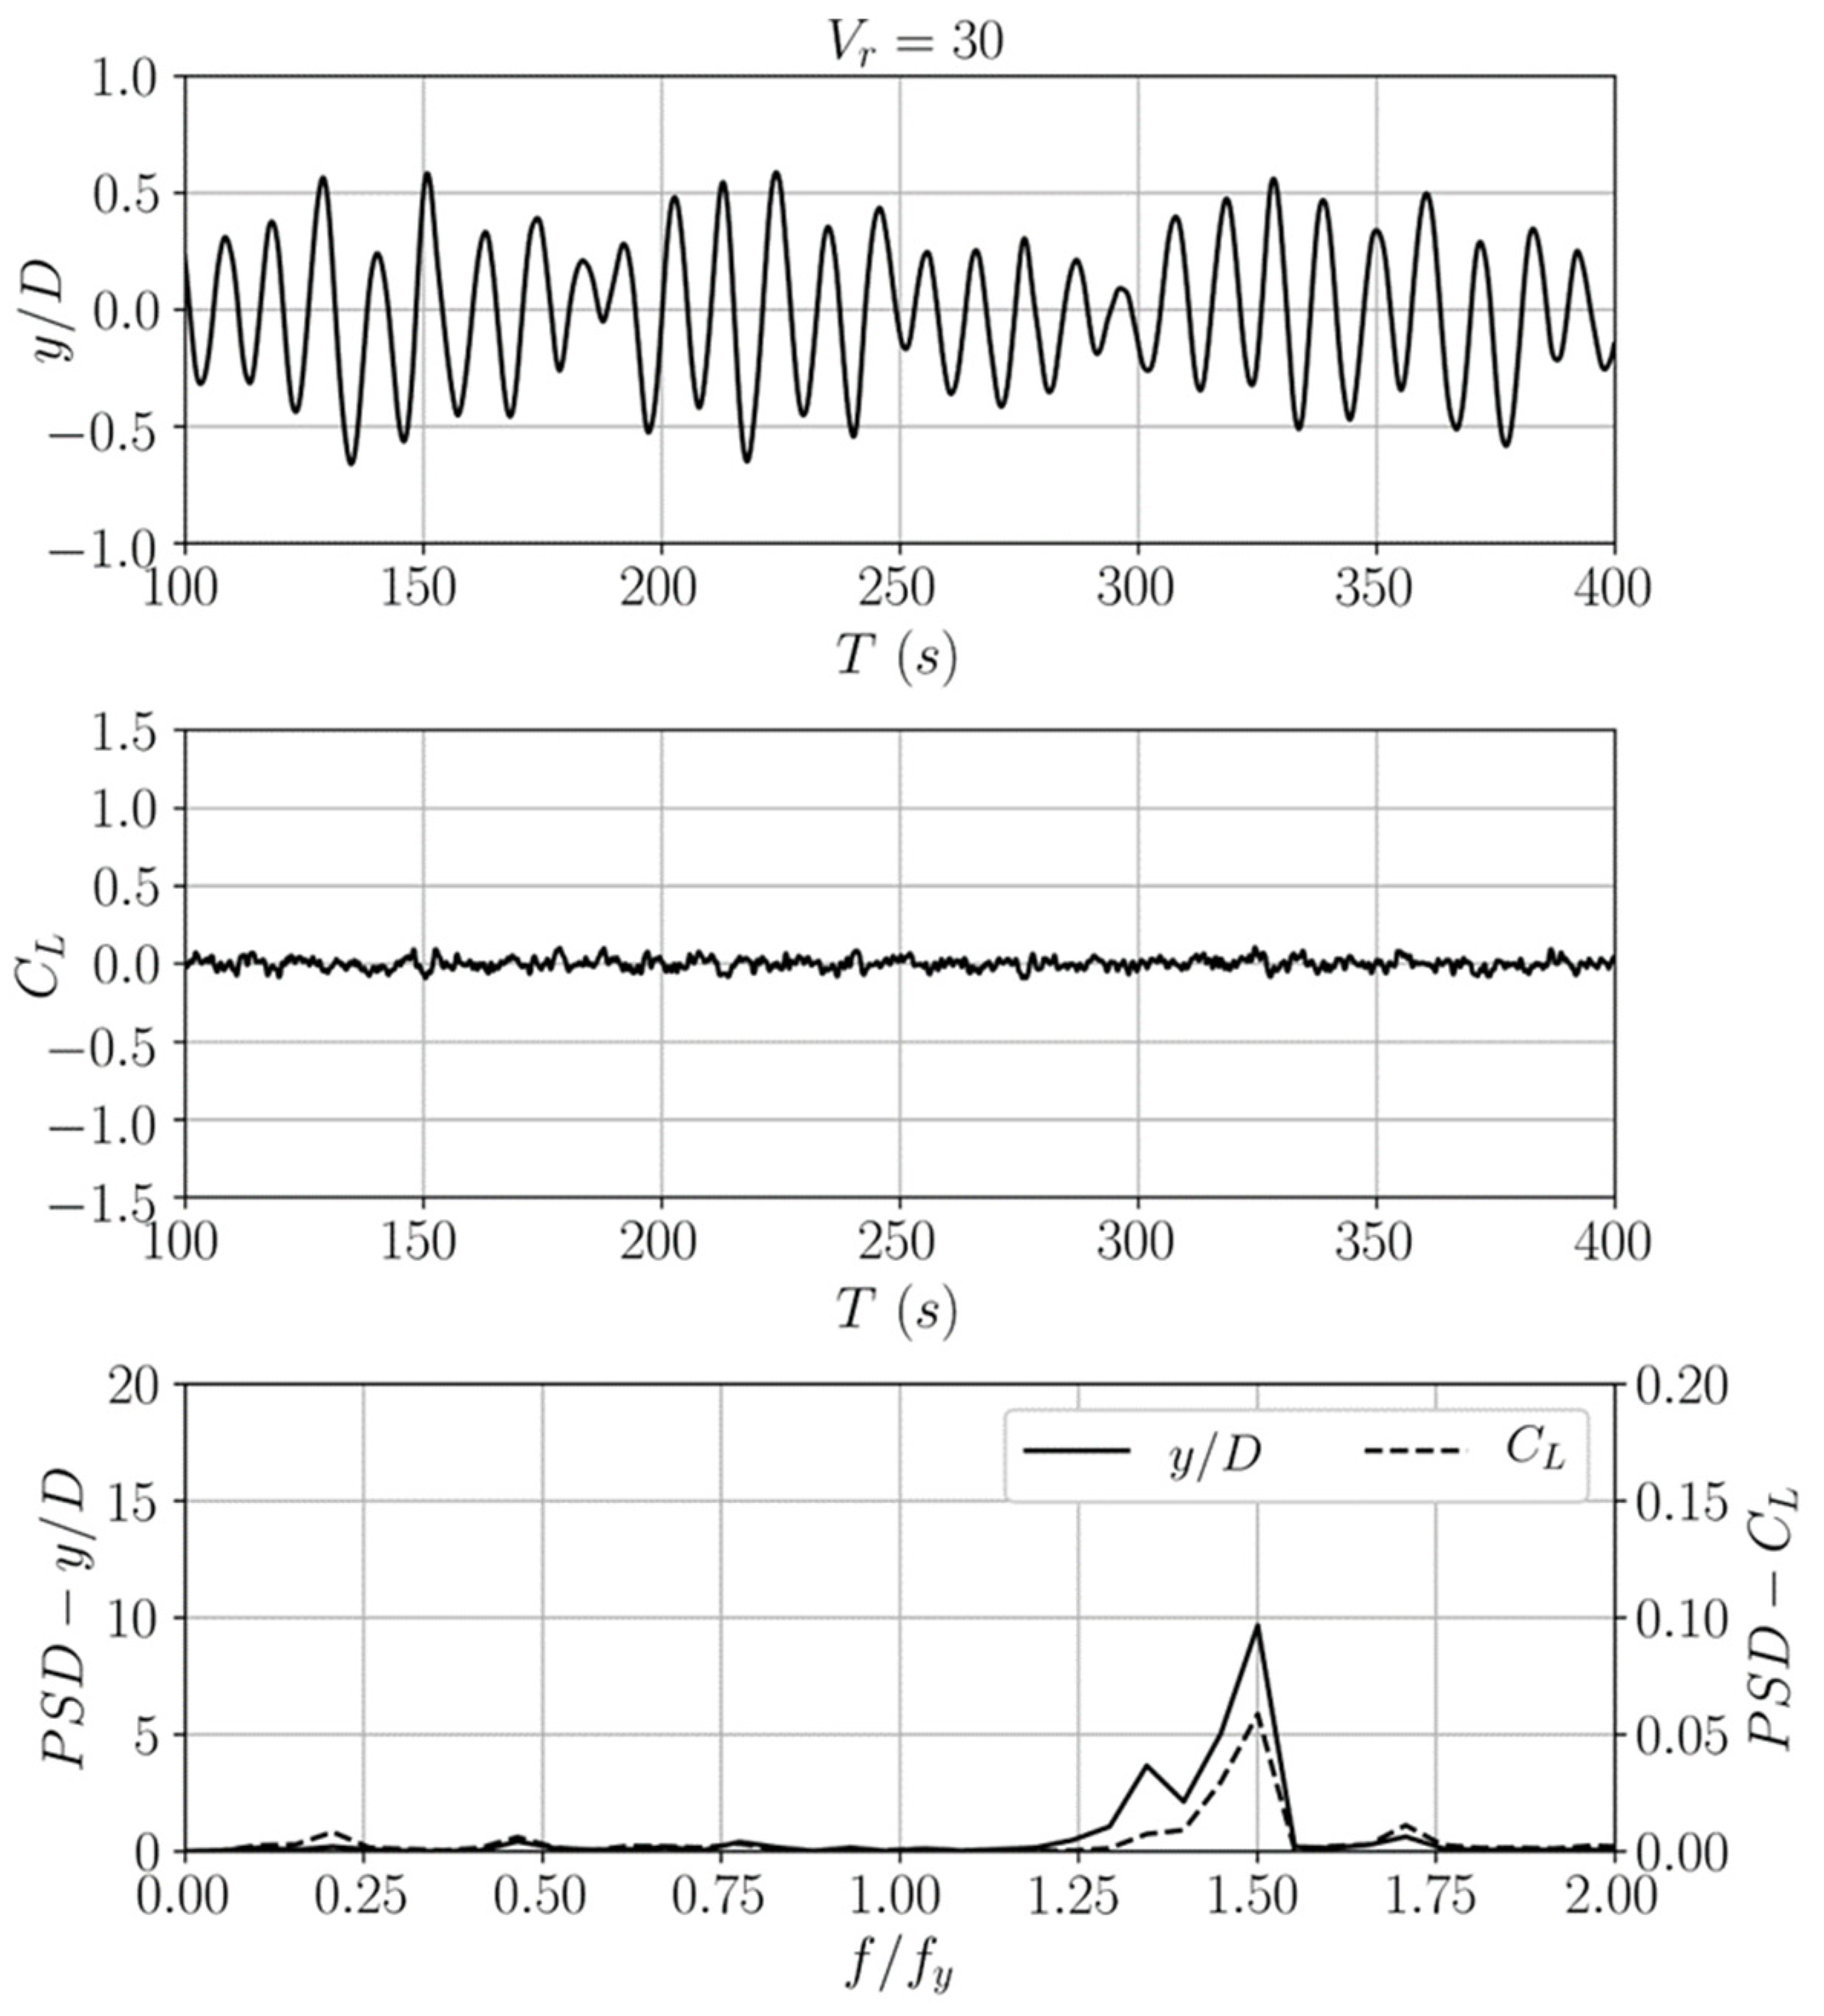
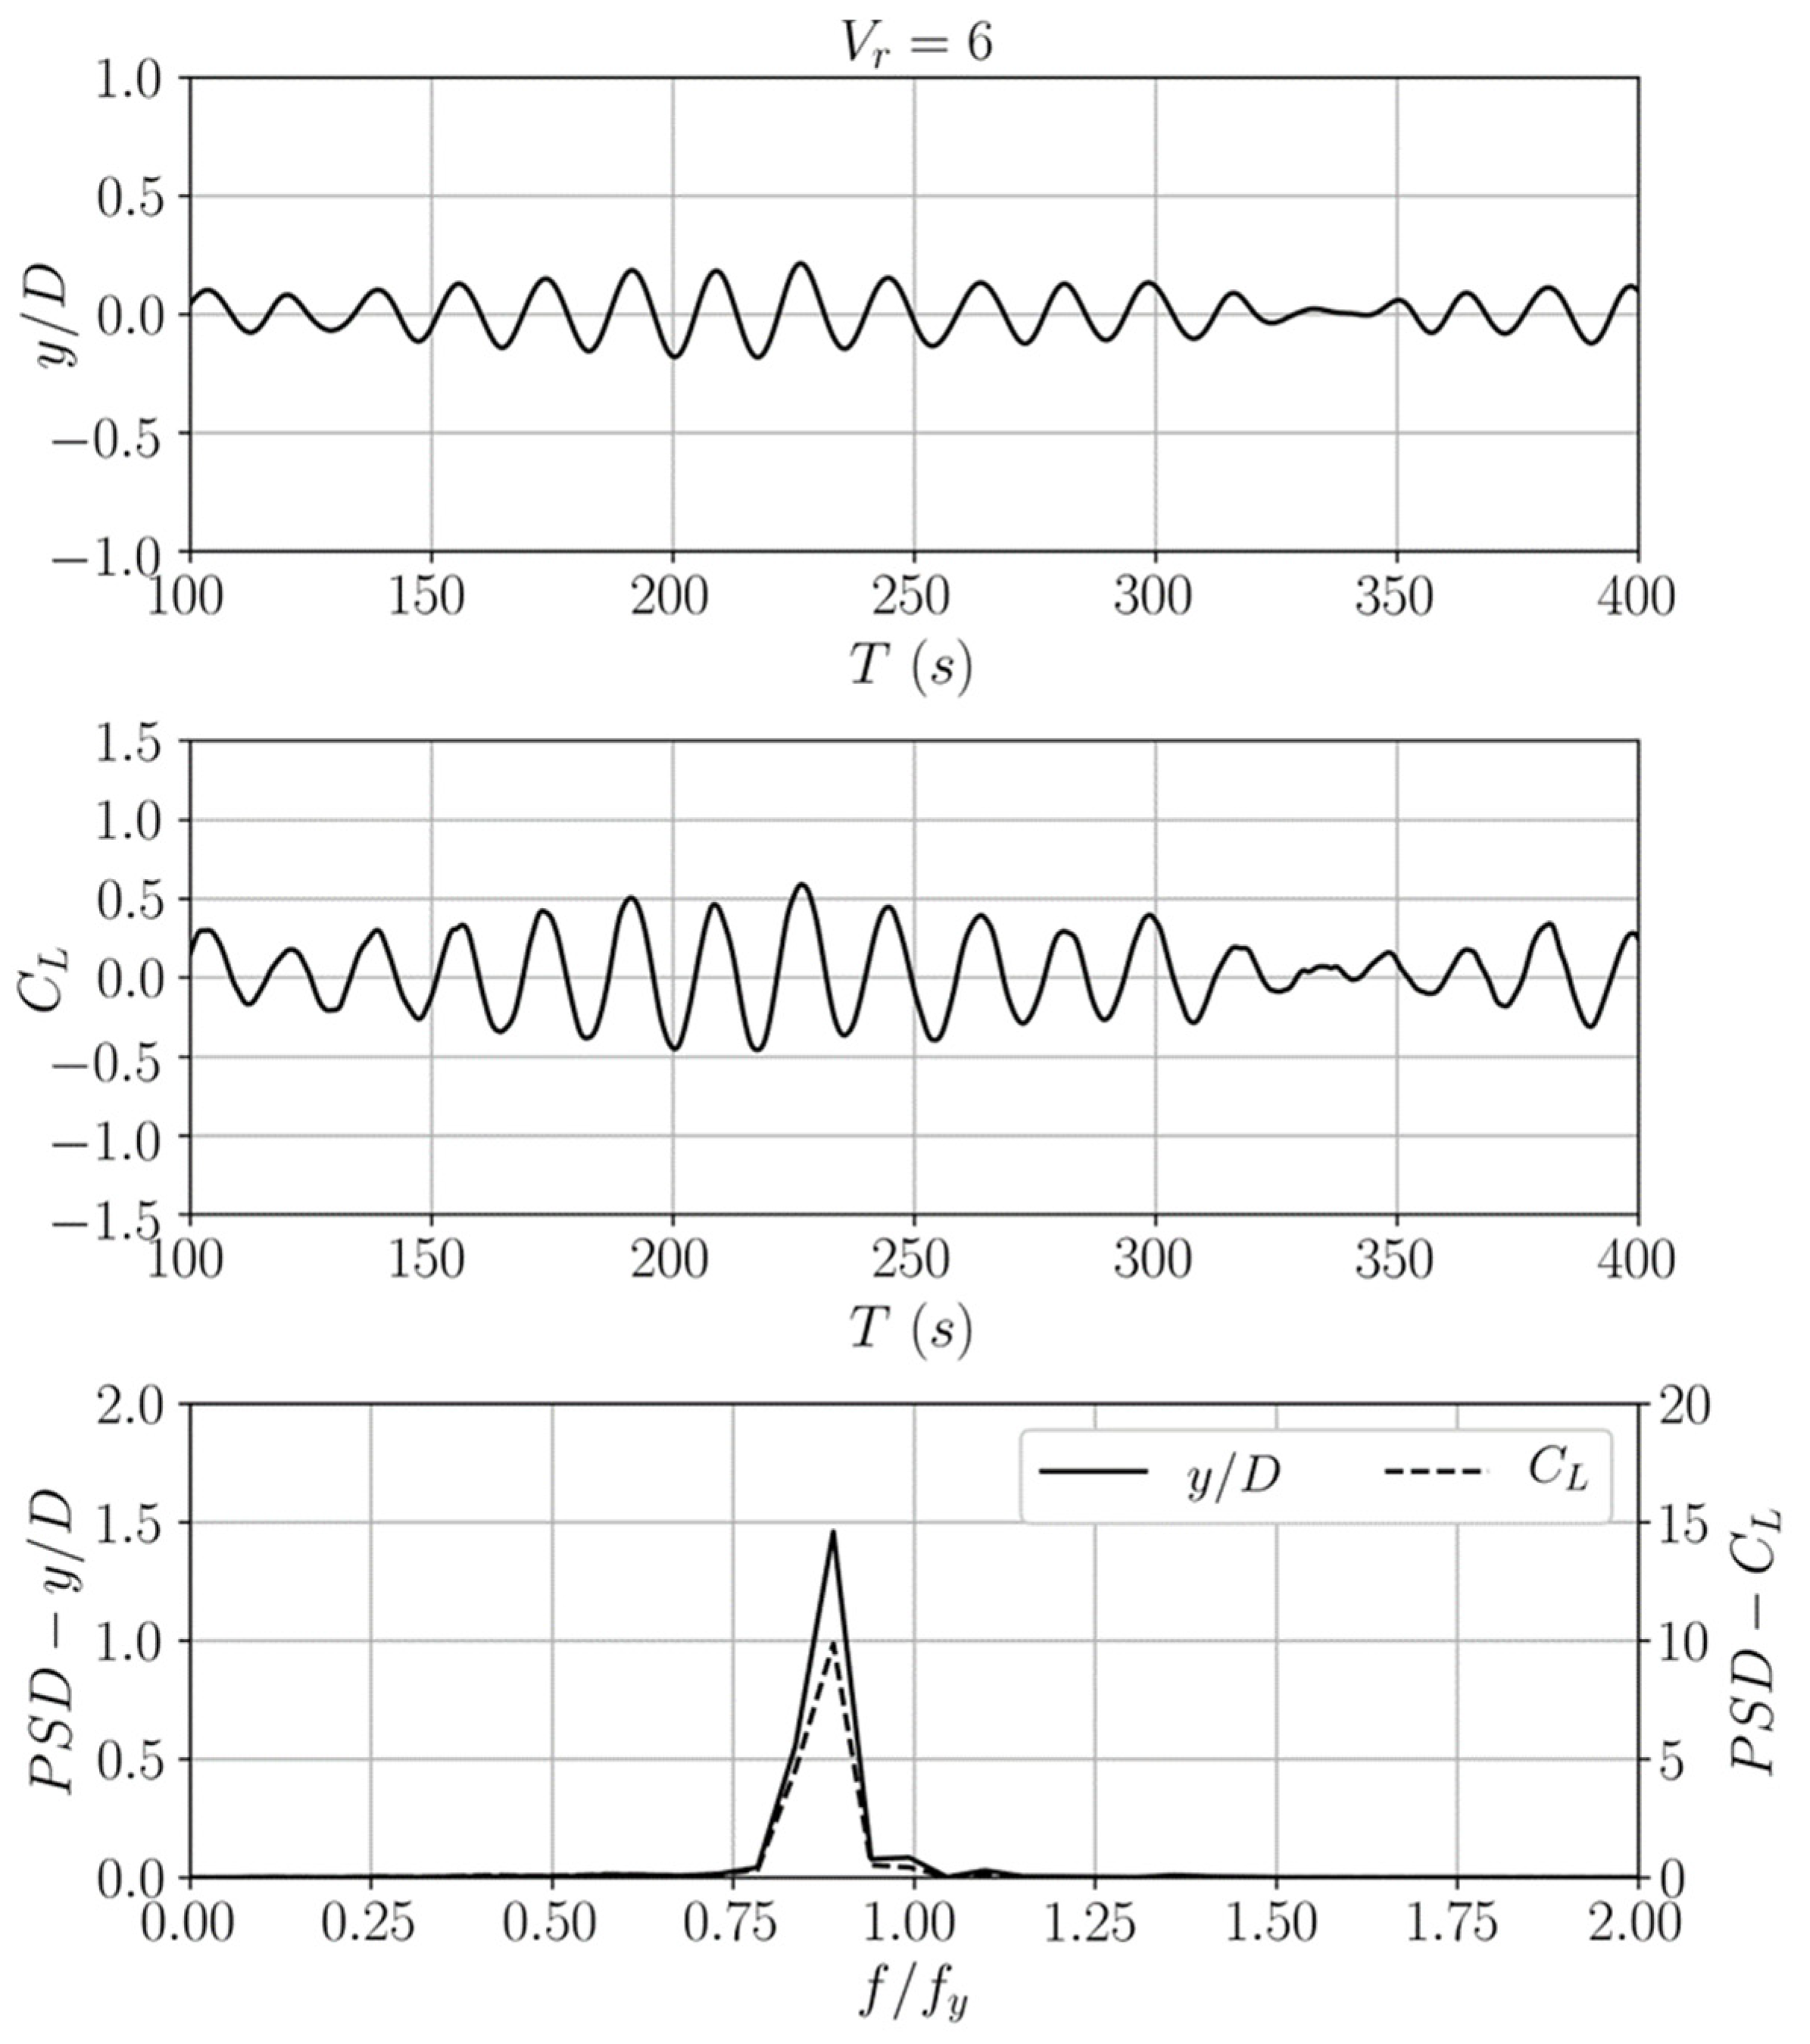
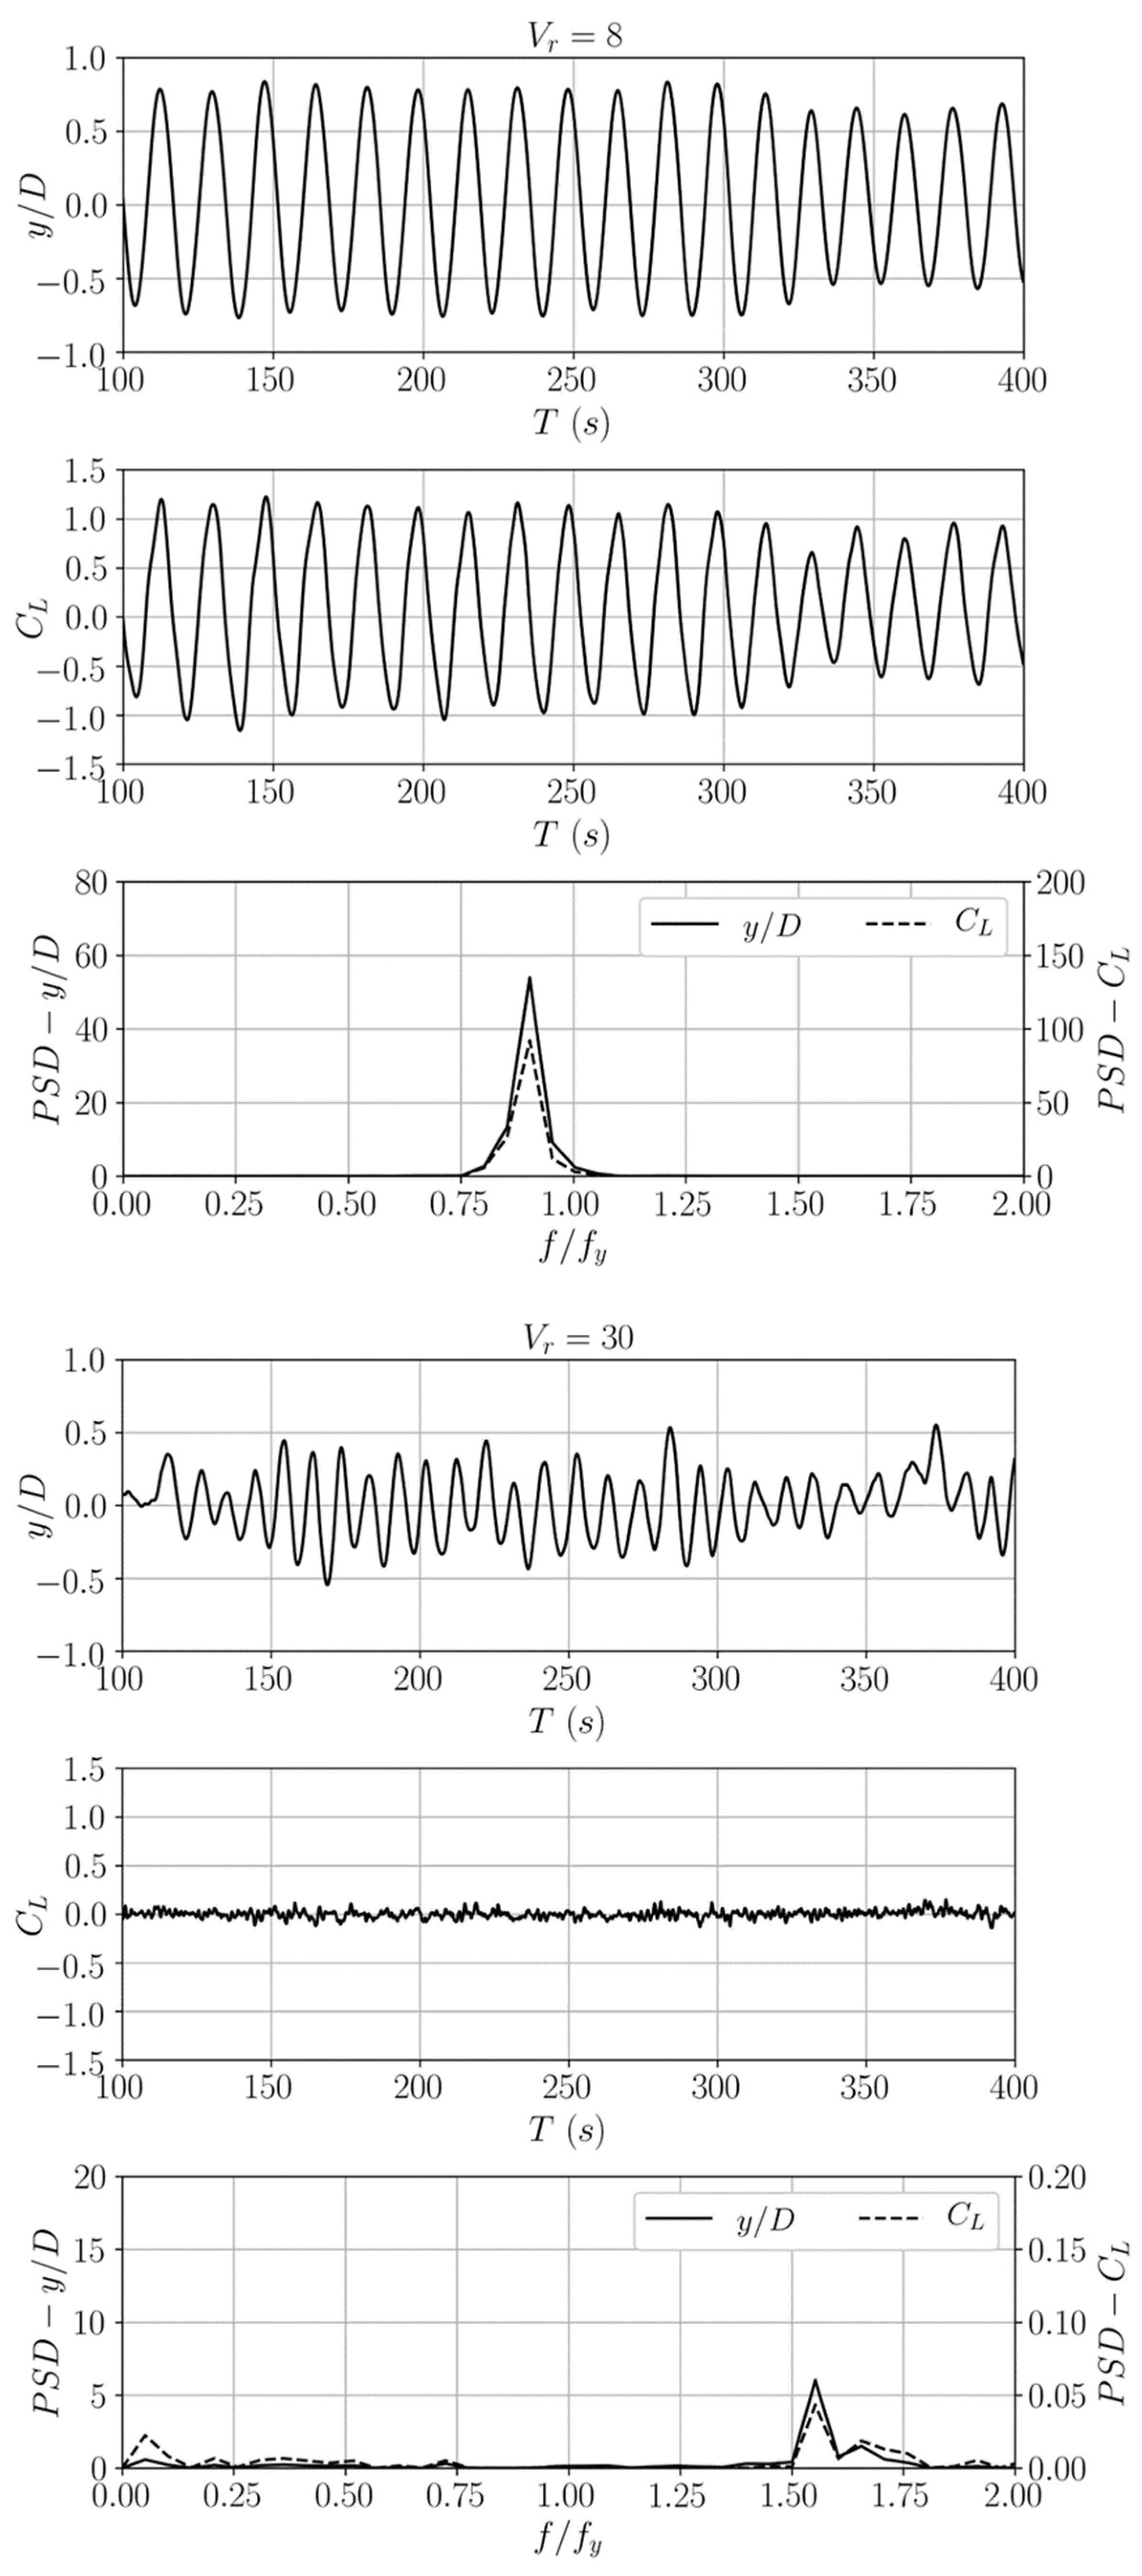
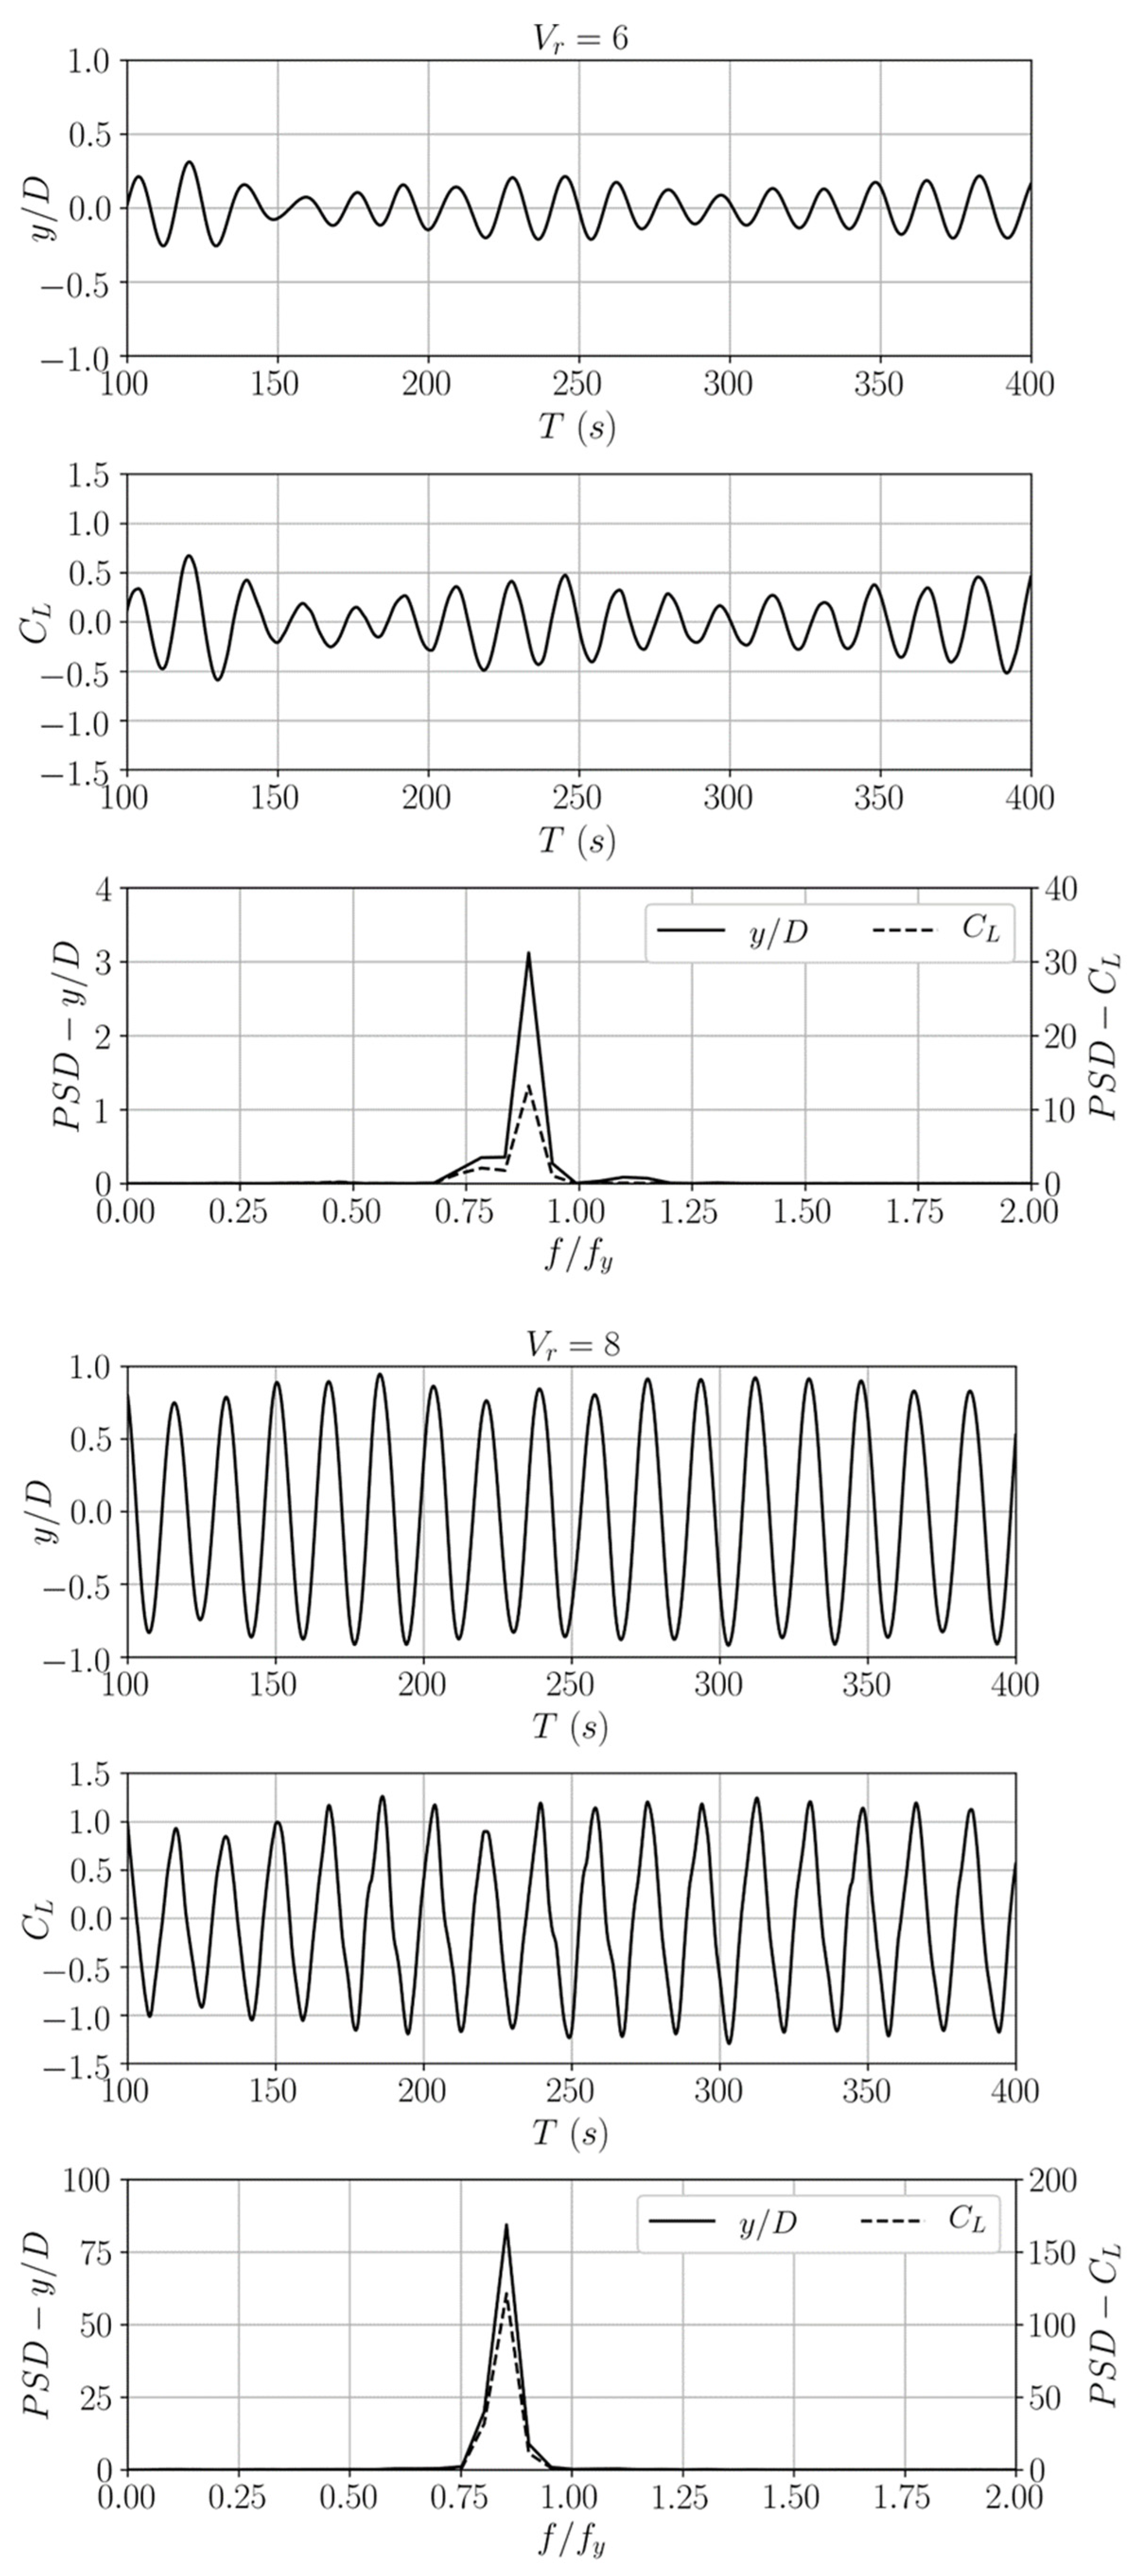
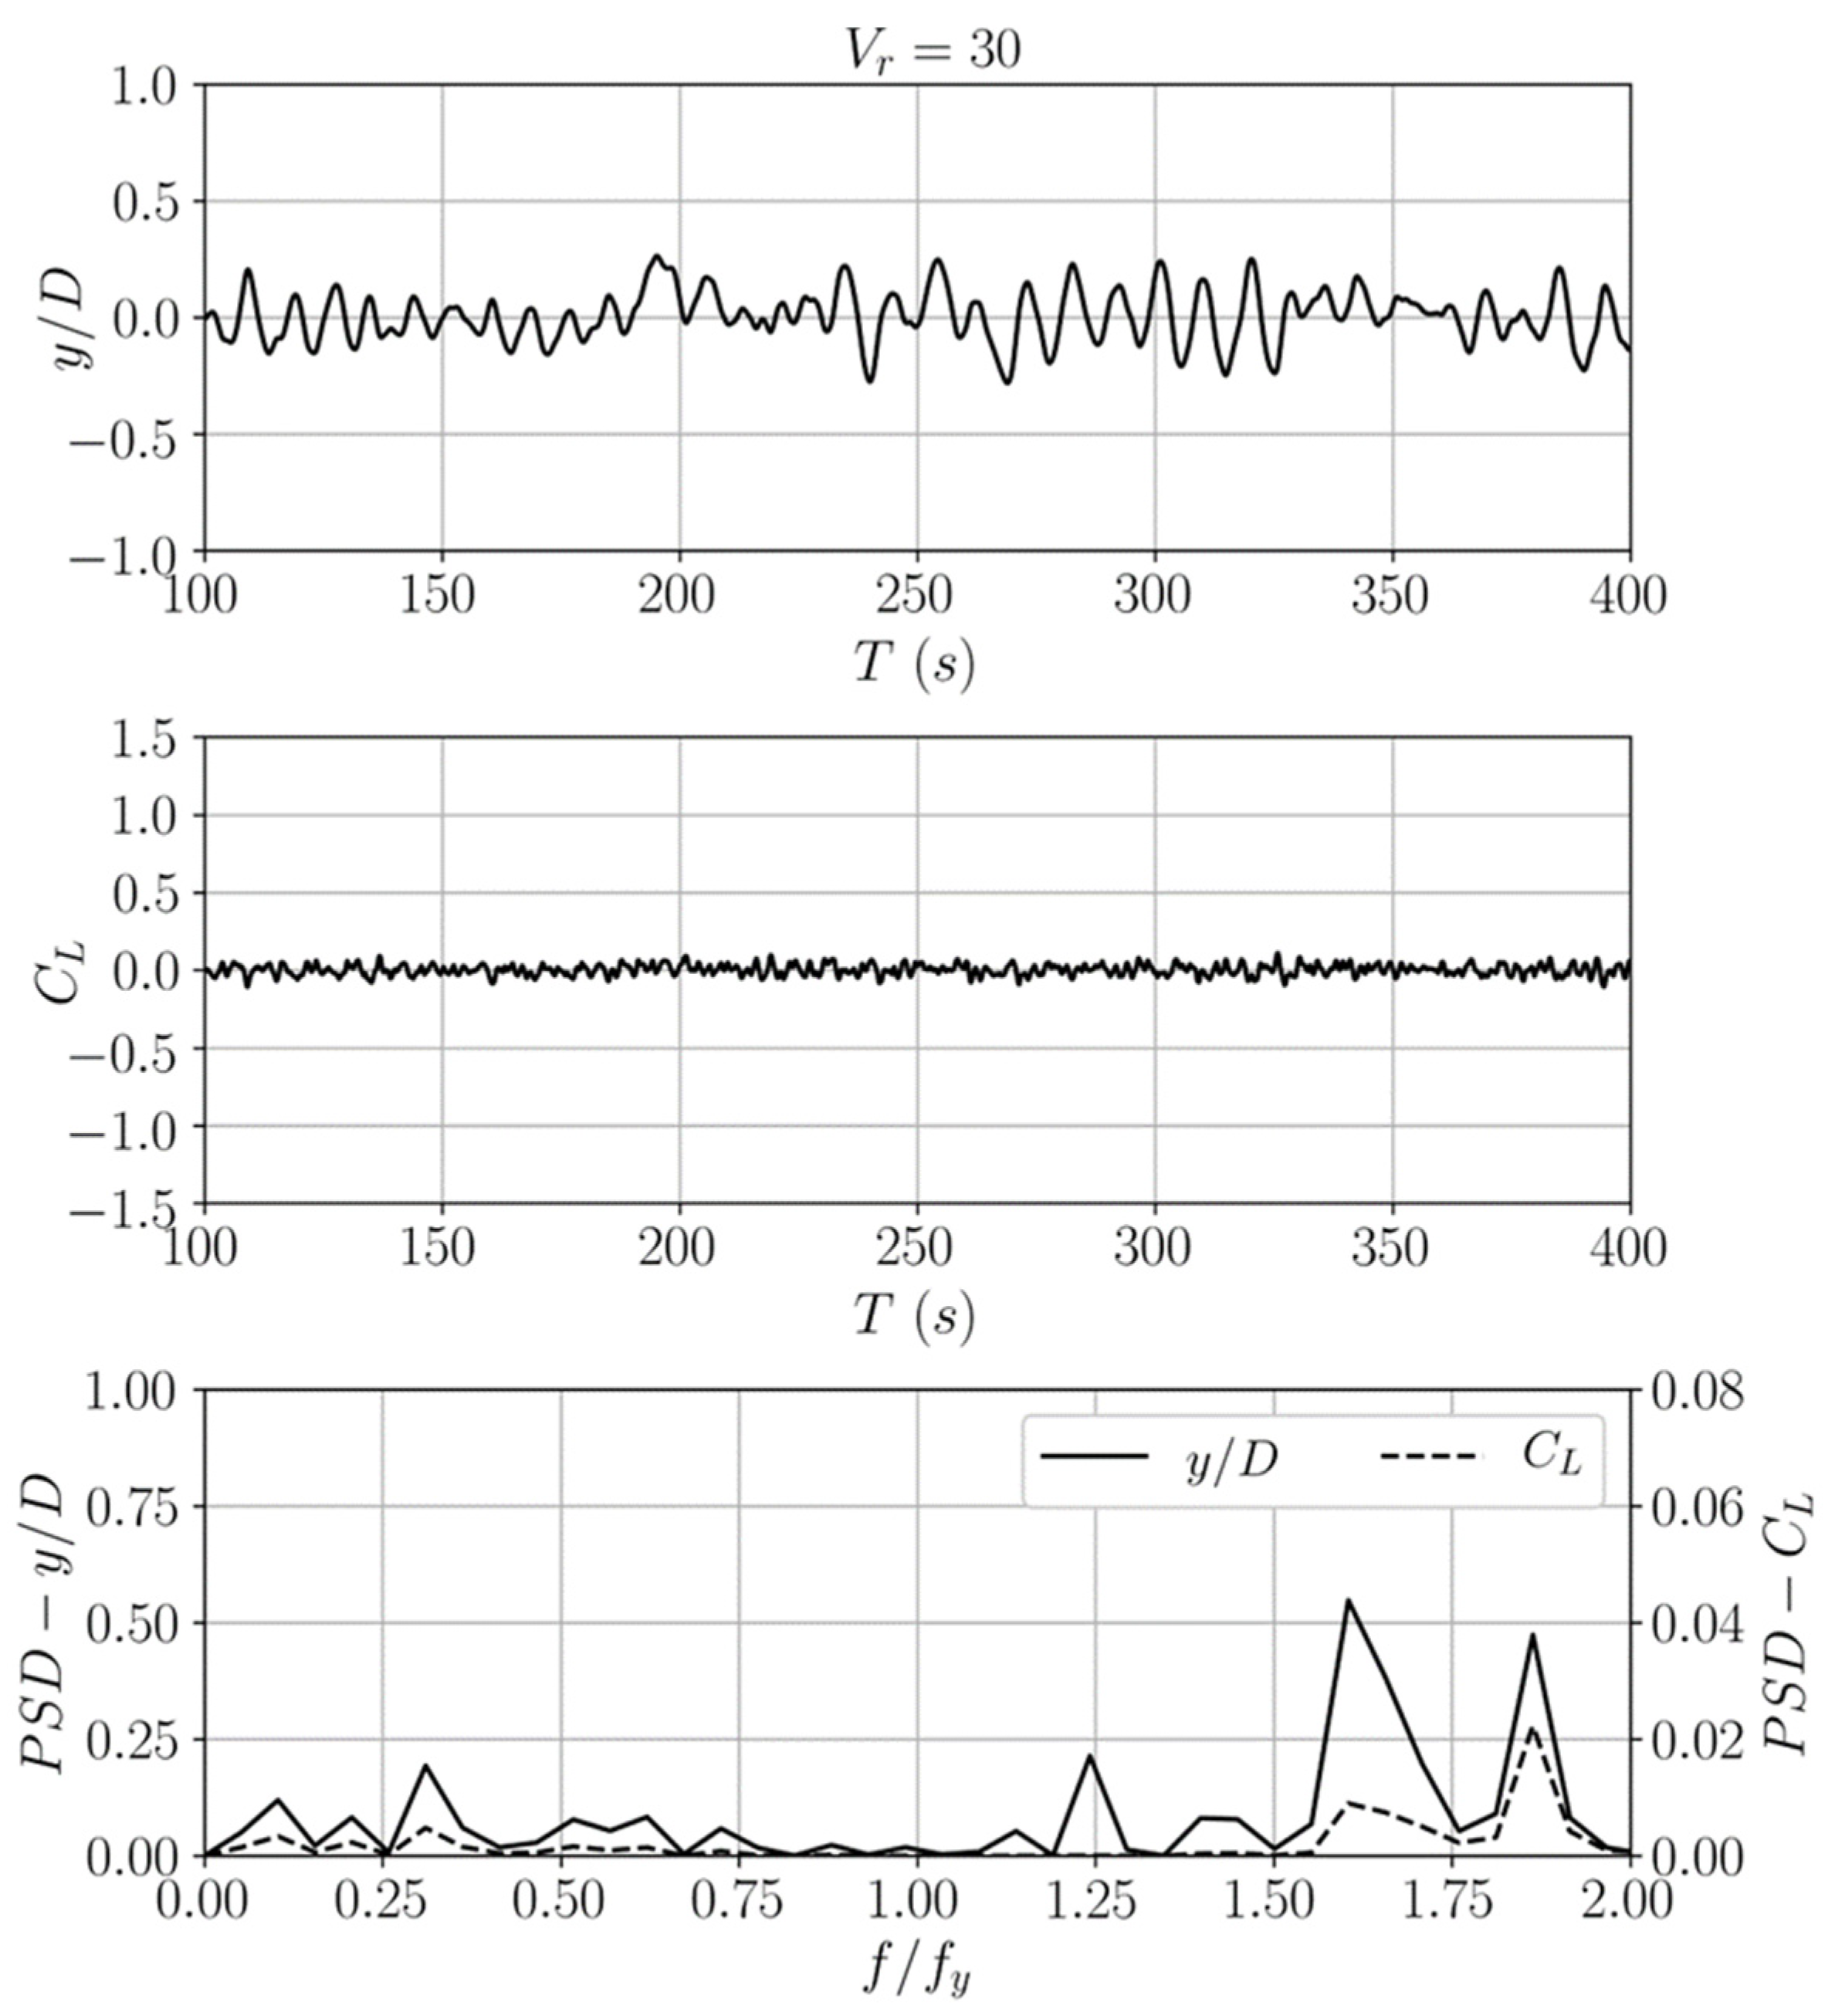
The significant response amplitude of the FOWT platform in the transverse direction signals that the so-called lock-in phenomenon characterised by considerable VIM responses is present. The range in which lock-in occurs is of great importance for structure safety design. To determine the lock-in regime of the FOWT platform under different current incidence, the definition of lock-in proposed by Williamson and Govardhan [27] is adopted in this study, which states that the frequency of structure response matches that of the fluid force exerted on it. As a result, the frequencies of the platform responses and fluid forces are firstly computed by conducting Fast Fourier Transform (FFT) analysis on the time series data obtained from CFD simulations. The time series of the non-dimensional transverse response and fluid force coefficient of the FOWT platform at various , as well as their PSD results, are plotted in Figure 10, Figure 11 and Figure 12 for different current incidence scenarios. Results for three representative flow conditions with , 8, and 30 are presented as examples. It can be easily seen that for all the three scenarios, the time series for both response and force of the platform at are nearly periodic, while their frequencies coincide with each other, clearly demonstrating the presence of lock-in. For the cases at , although their responses are relatively small, the matching of the dominant frequencies in the response and force still indicates that also lies within the lock-in regime, and likely denotes the onset of lock-in under all current incidence conditions. It is surprising to notice that lock-in still occurs for cases with and , even when reaches up to 30, as shown in Figure 10 and Figure 11. Gonçalves et al. [26] also pointed out in their VIM experiment of four-column platforms that lock-in for the platform made of four square columns could be present at , which was the highest velocity condition tested due to the limitations in their experimental facility, and that large response amplitude could persist for even higher . Nevertheless, for the case with , Figure 12 reveals that the transverse response of the FOWT platform at is highly chaotic, with multiple noticeable peaks present in its PSD plot. More importantly, the dominant frequency of the platform response deviates from that of the fluid force, which signifies that lies outside the lock-in regime for the FOWT platform with . It can then be summarised that the range of lock-in for the FOWT platform is rather wide, meaning that the platform can be subjected to periodic transverse responses with large oscillation amplitudes over a wide range of flow velocity conditions.
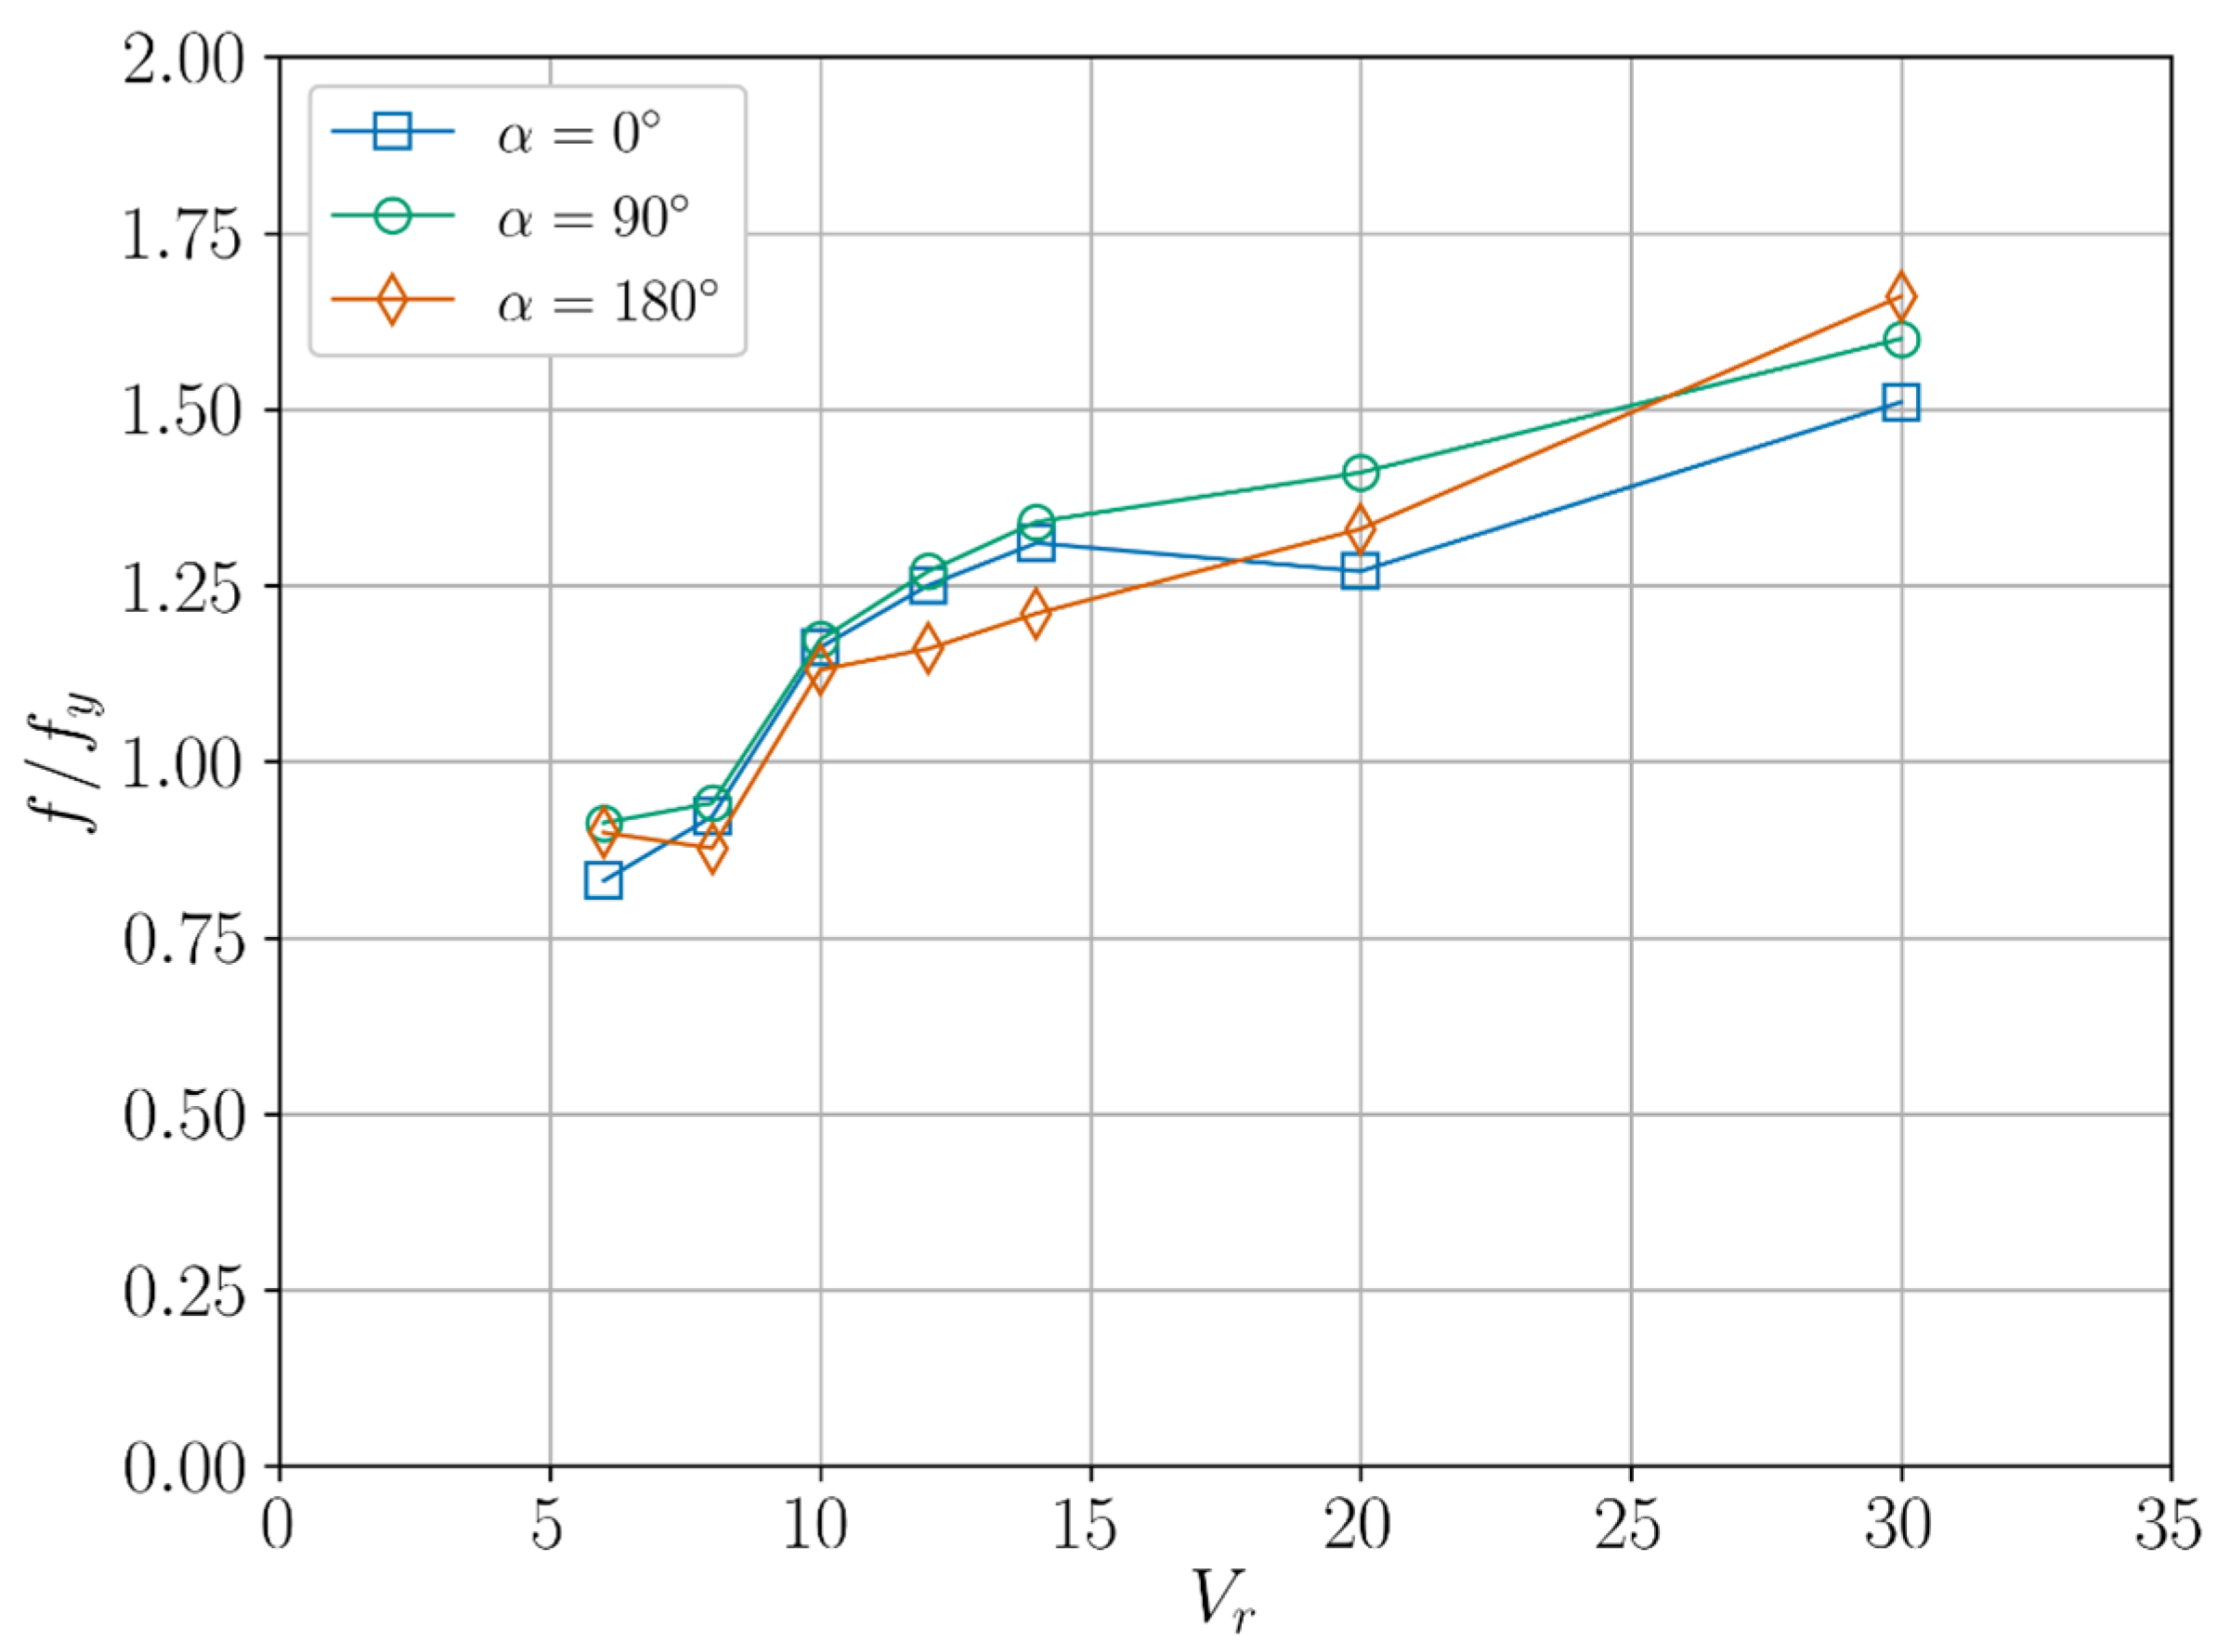
Figure 13 presents the transverse response frequency ratio of the FOWT platform under different current incidence conditions. For all three scenarios, exhibits a similar trend and increases as becomes larger. Specifically, passes through the line between and , and then stays close to the line . In their 2DoF vortex-induced vibration study of an elastically mounted rigid cylinder, Williamson and Govardhan [27] argued that two distinct response branches with significant transverse response amplitude, including a super-upper branch and a lower branch, were present. They also pointed out that the transition from the super-upper branch to the lower branch occurred as passed through unity, and that stayed almost constant throughout the lower branch. Due to the relatively higher and more complex geometry involving multiple columns in this study, the two distinct branches cannot be clearly identified. However, the variation of with respect to generally follows what was discussed by Williamson and Govardhan [27].
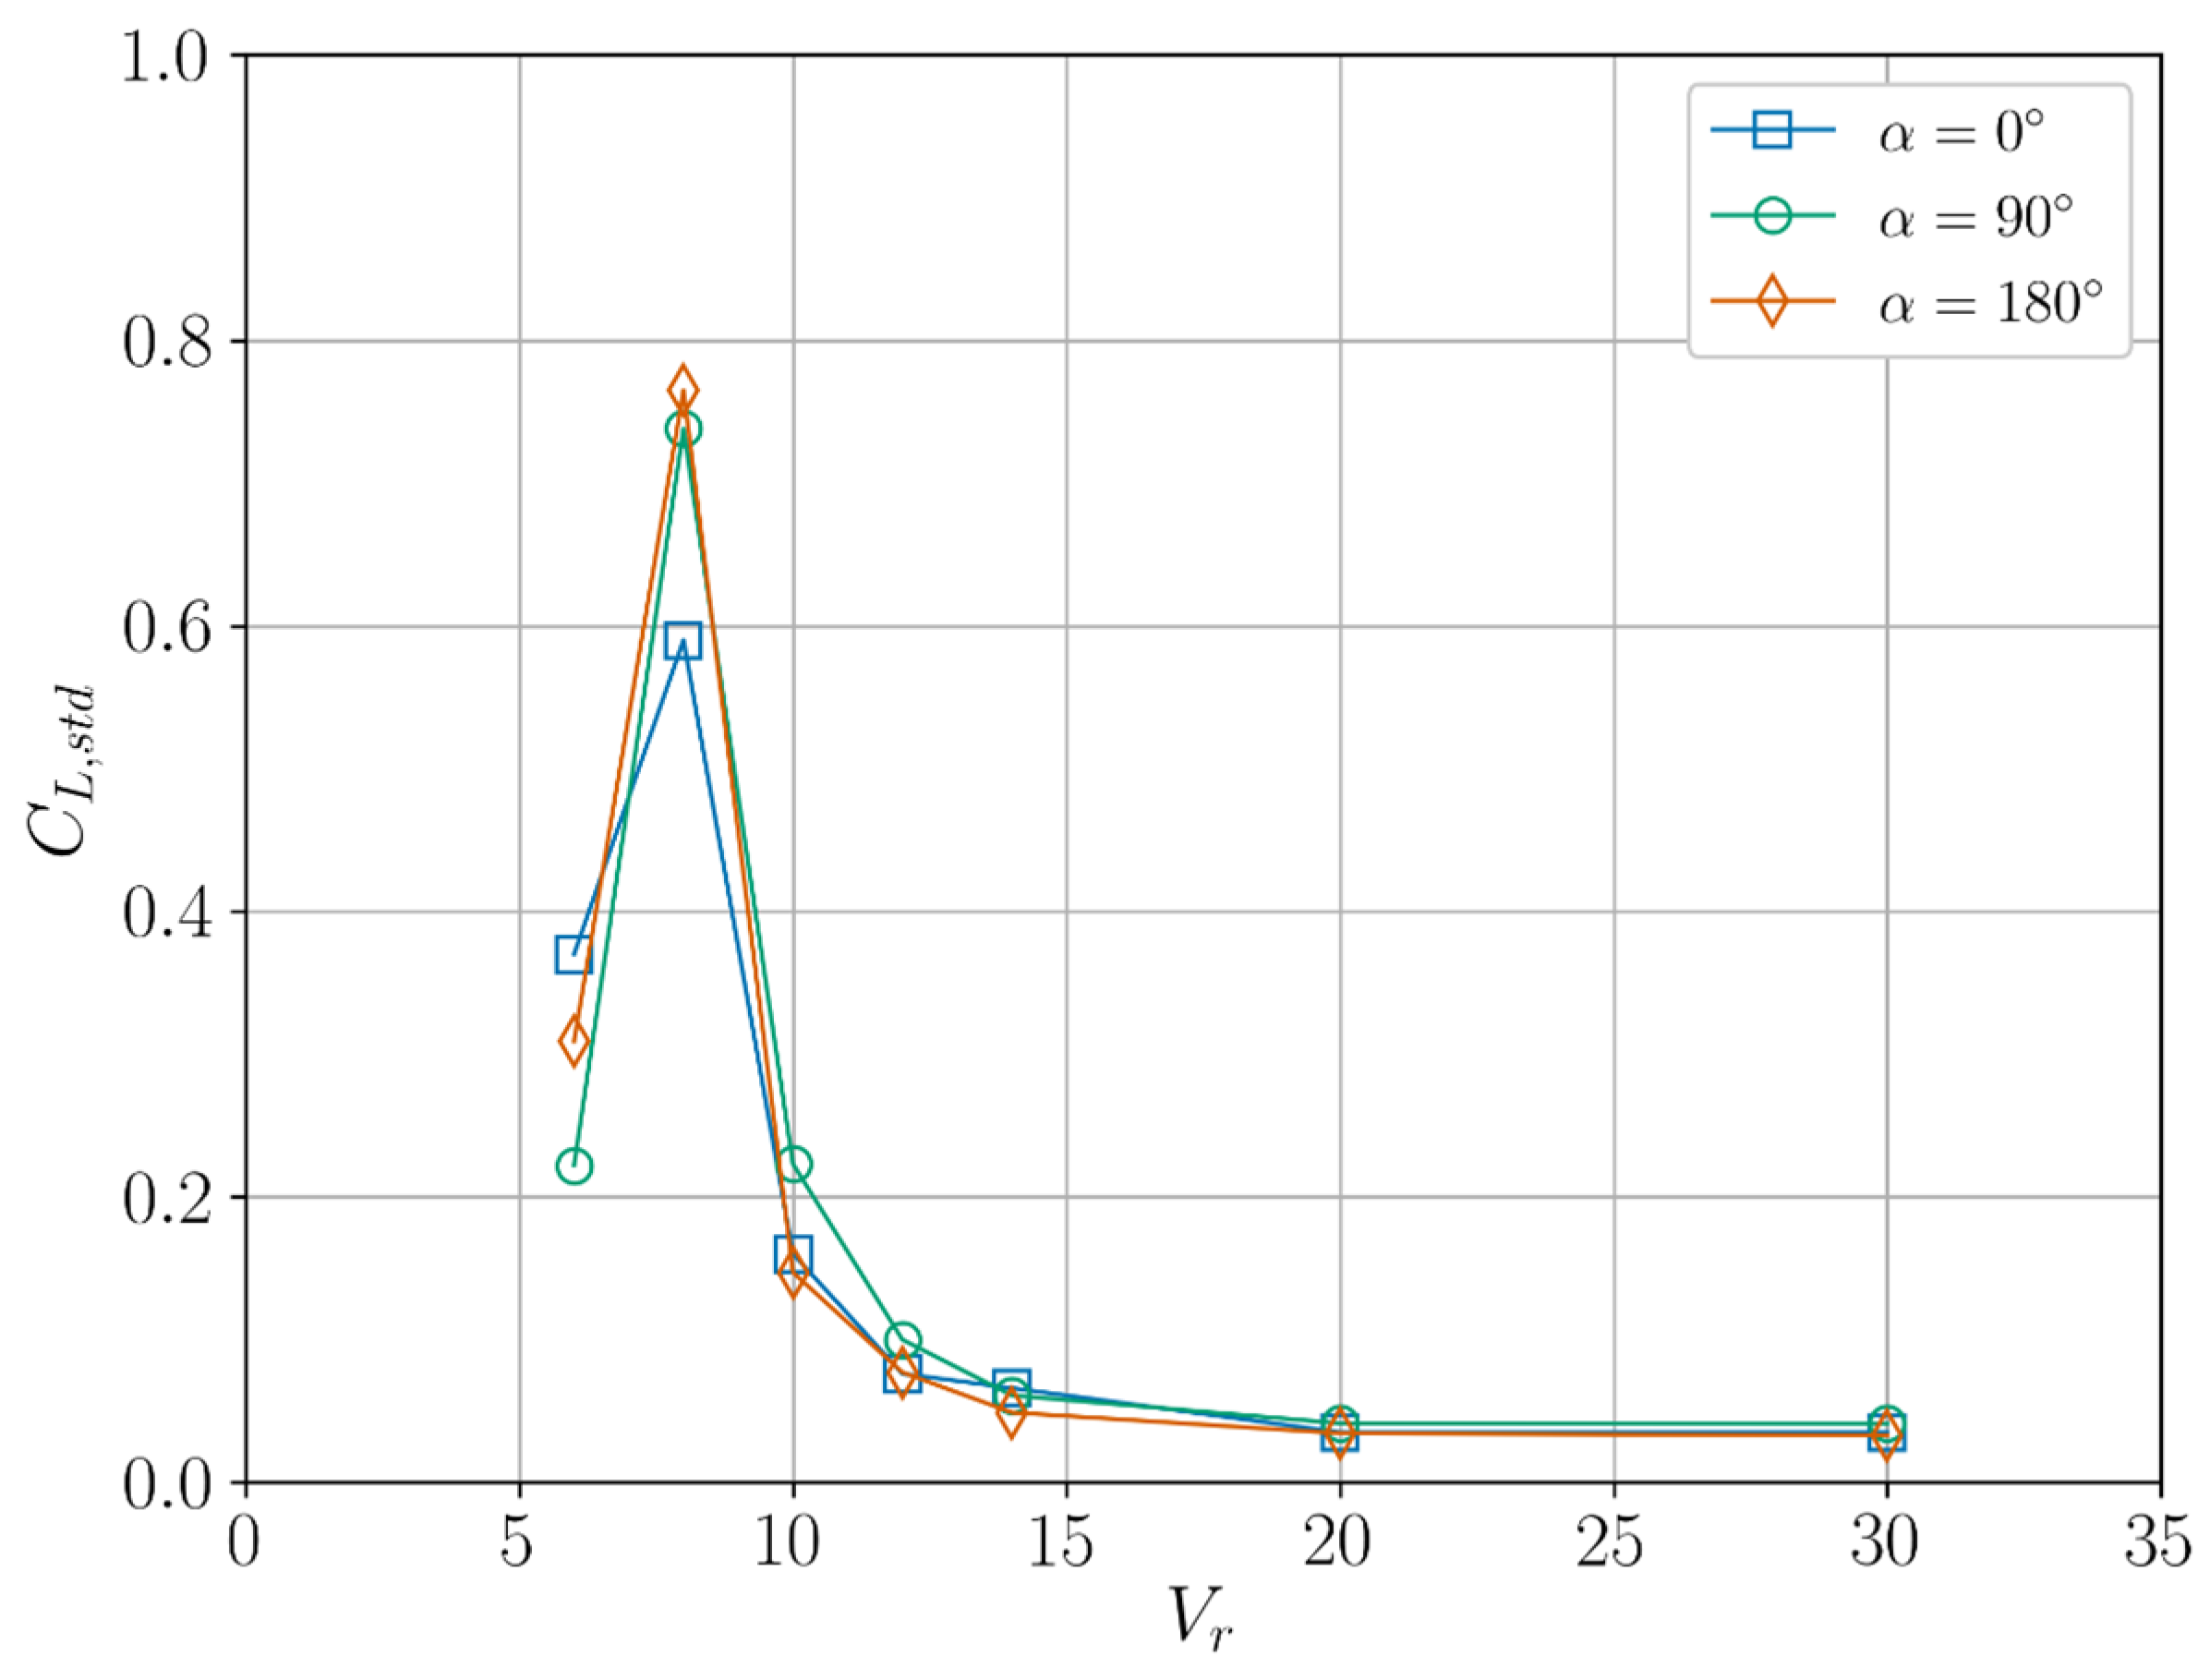
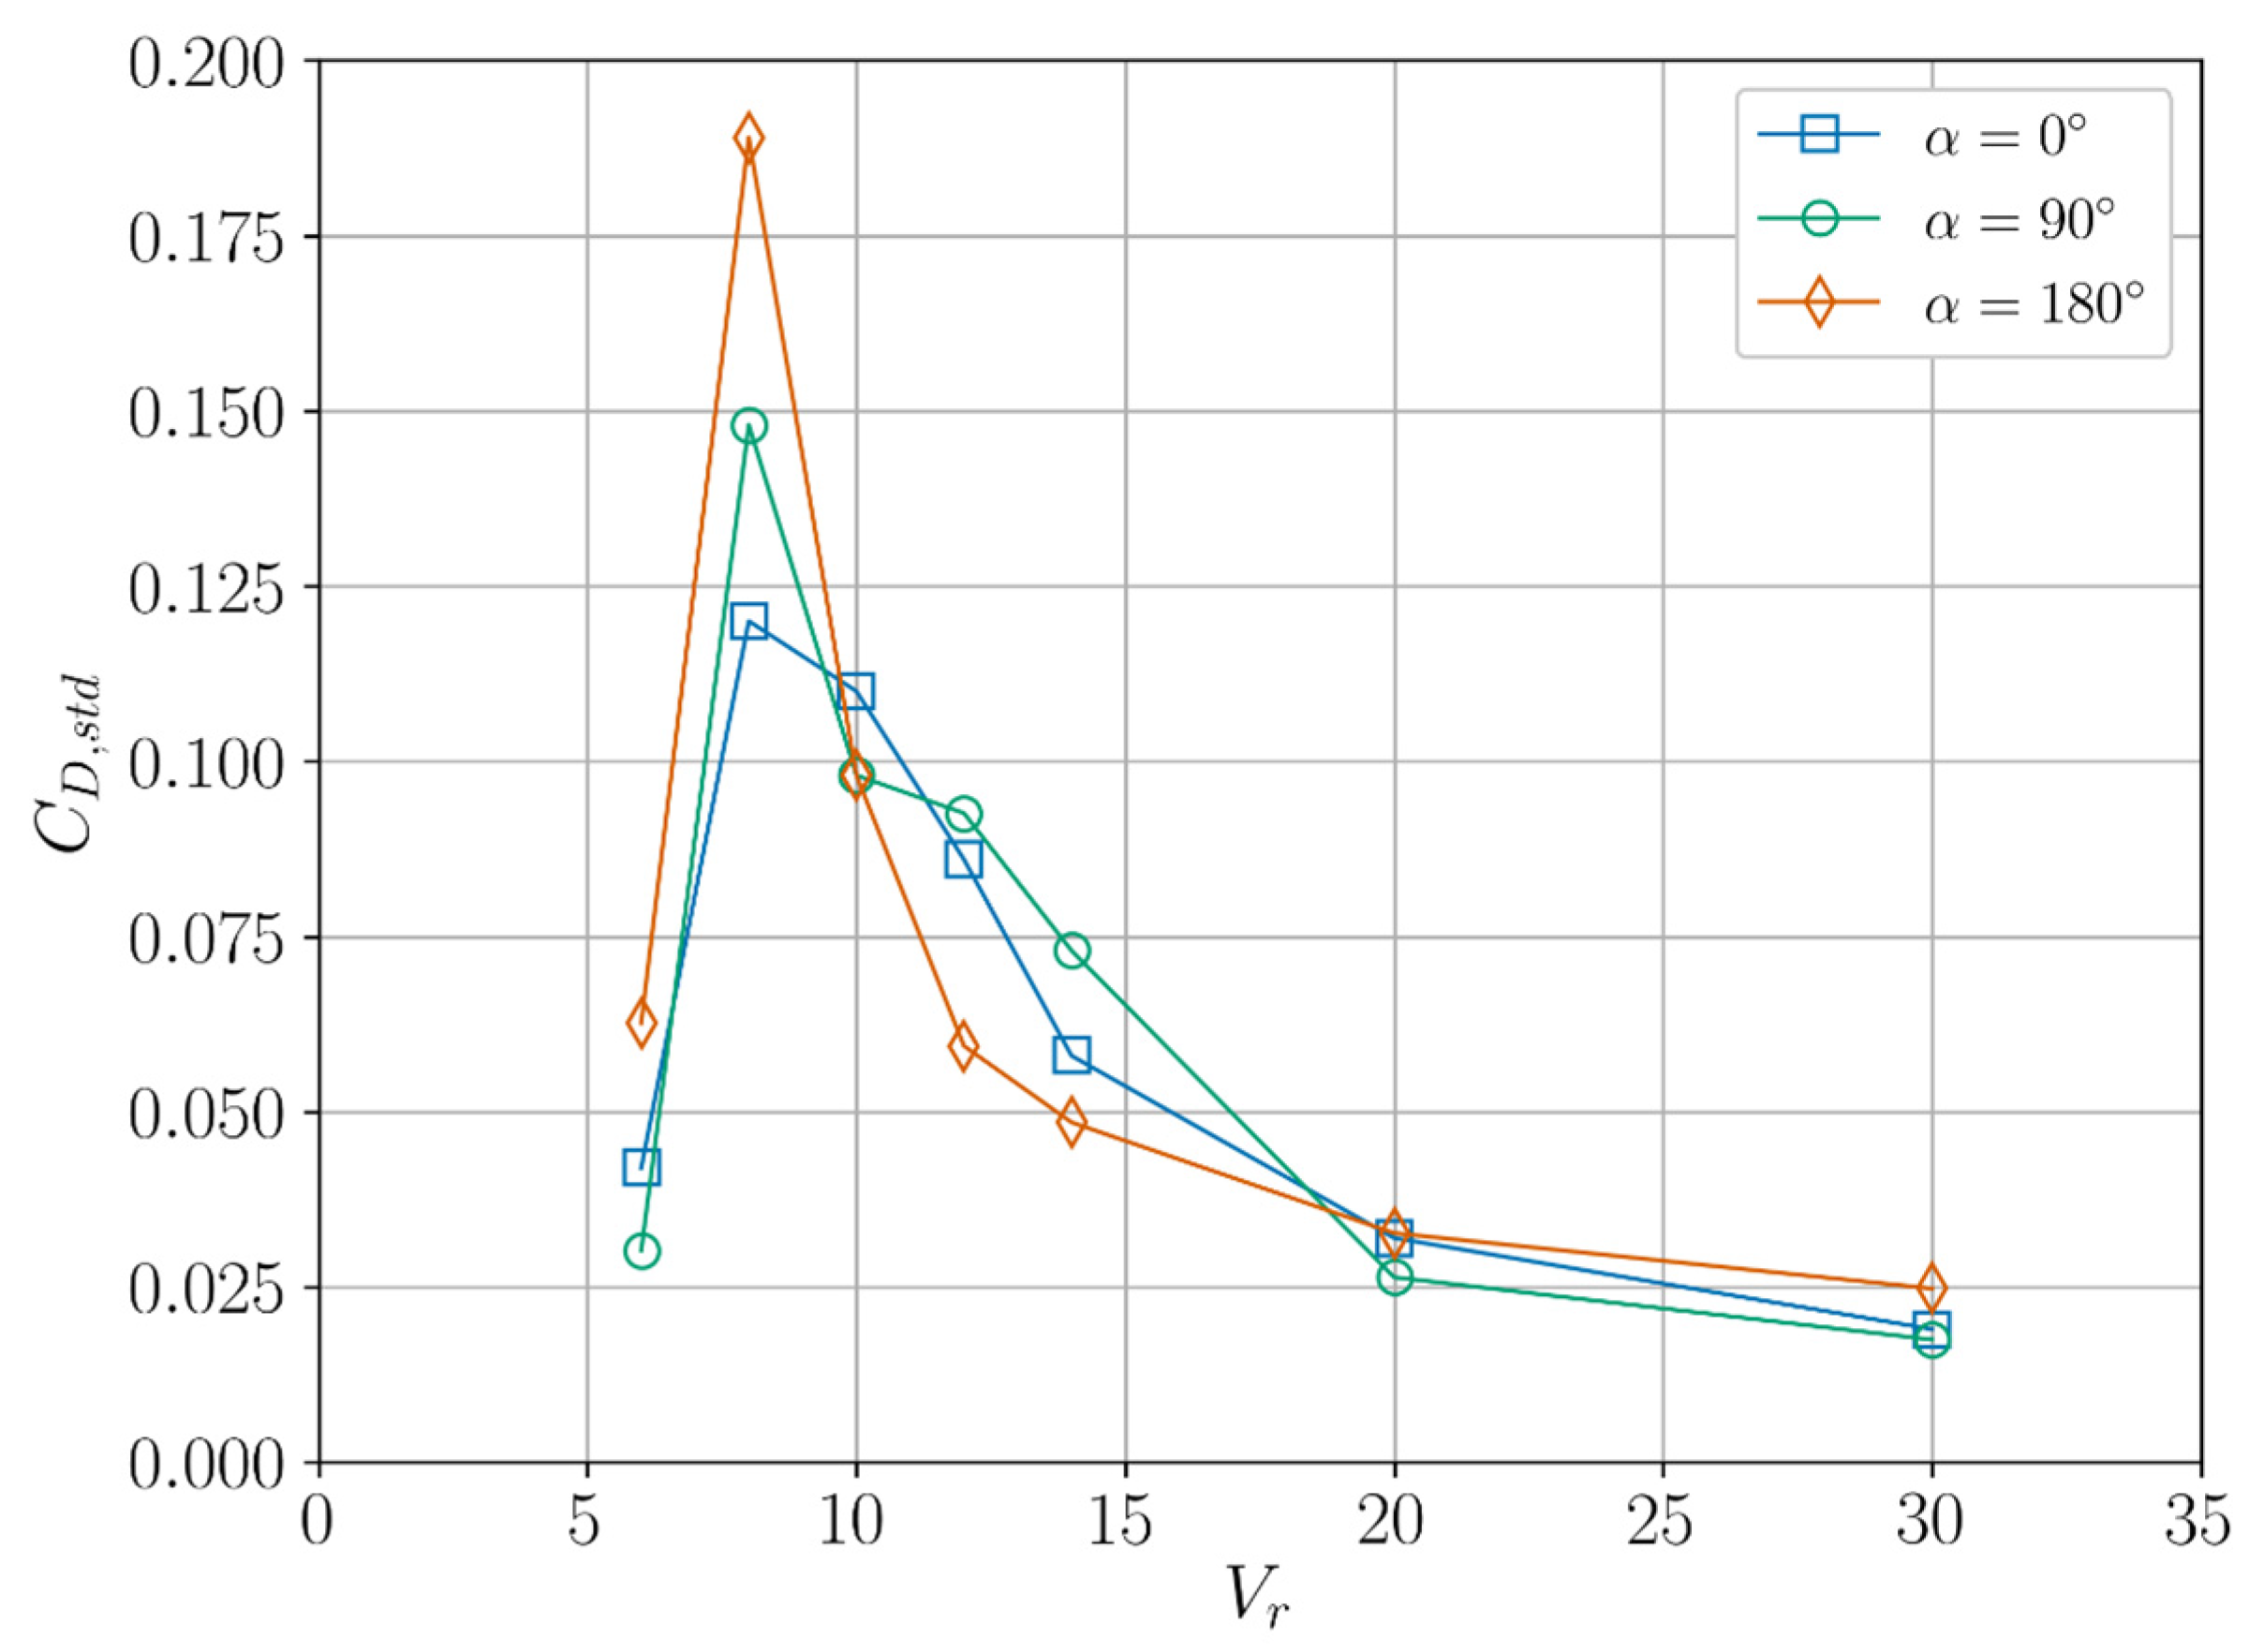
Figure 14 shows the standard deviation of the transverse force coefficient , which represents the oscillation amplitude of the fluid force, of the FOWT platform under different current incidence conditions. For all three scenarios, quickly rises to its maximum at then decreases sharply to less than 0.1 at , and remains close to zero until . This is in contrast to the relatively large transverse response amplitude within , but agrees well with the variation of the fluid force in our previous VIM study of a single side column [18,28]. Govardhan and Williamson [29] also spotted this phenomenon in their experiment of a freely vibrating cylinder and explained it by decomposing the total fluid force exerted upon a structure into two components, i.e., the vortex force related to vortex shedding and the potential force associated with added mass. According to their formulation, as increases, the two force components become out of phase by about 180°, thus cancelling out each other and leading to a small total force.
5.2. Inline Response
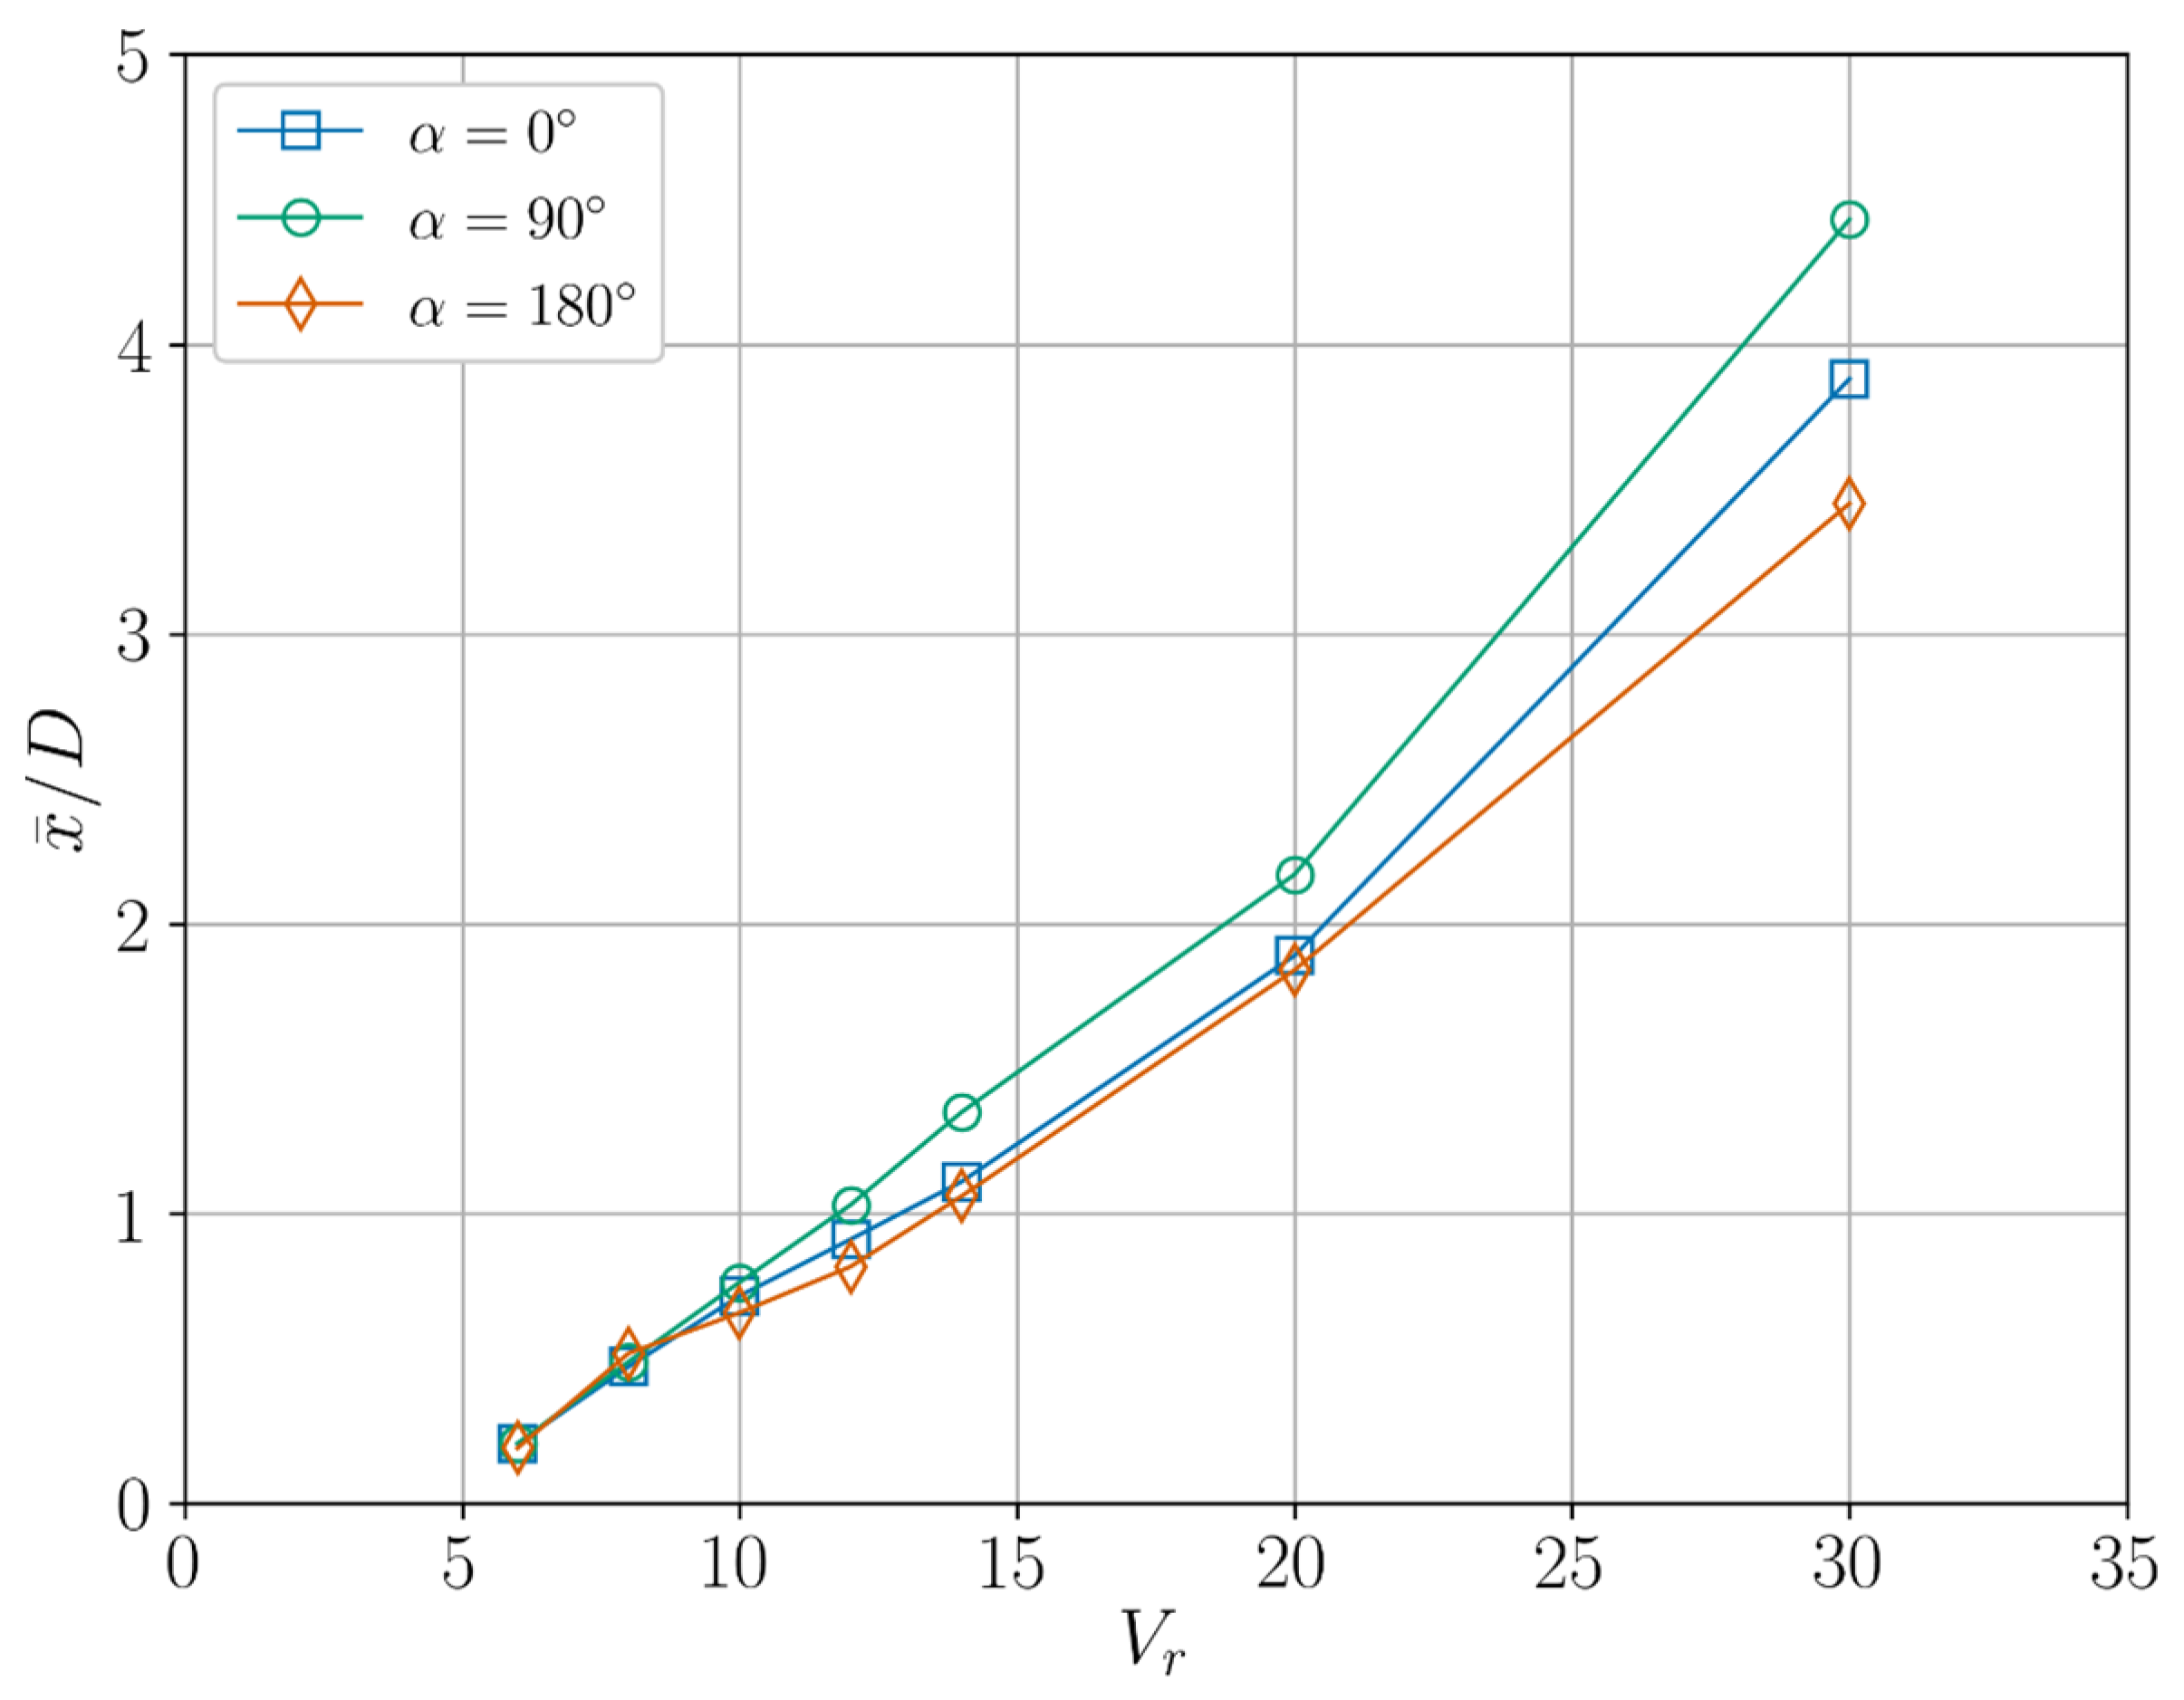
The mean inline response of the FOWT platform under different current incidence conditions is plotted in Figure 15. It is noted that for all incidence angles, increases almost linearly with within the whole velocity range, which is caused by the increasingly larger mean fluid force in the inline direction as the incident flow velocity grows. The results for the cases with are rather close to those with within the range of . However, they are mostly smaller than the predictions with , which likely relates to the smaller spring stiffness, as shown in Table 1 for cases with , when the spring restraints also rotate with the platform for 90° and the original smaller transverse spring stiffness is applied in the inline direction instead. Meanwhile, the differences among the three scenarios broaden at with the result for being the smallest, indicating that large discrepancies are present in the mean inline force at such high incident flow velocity.
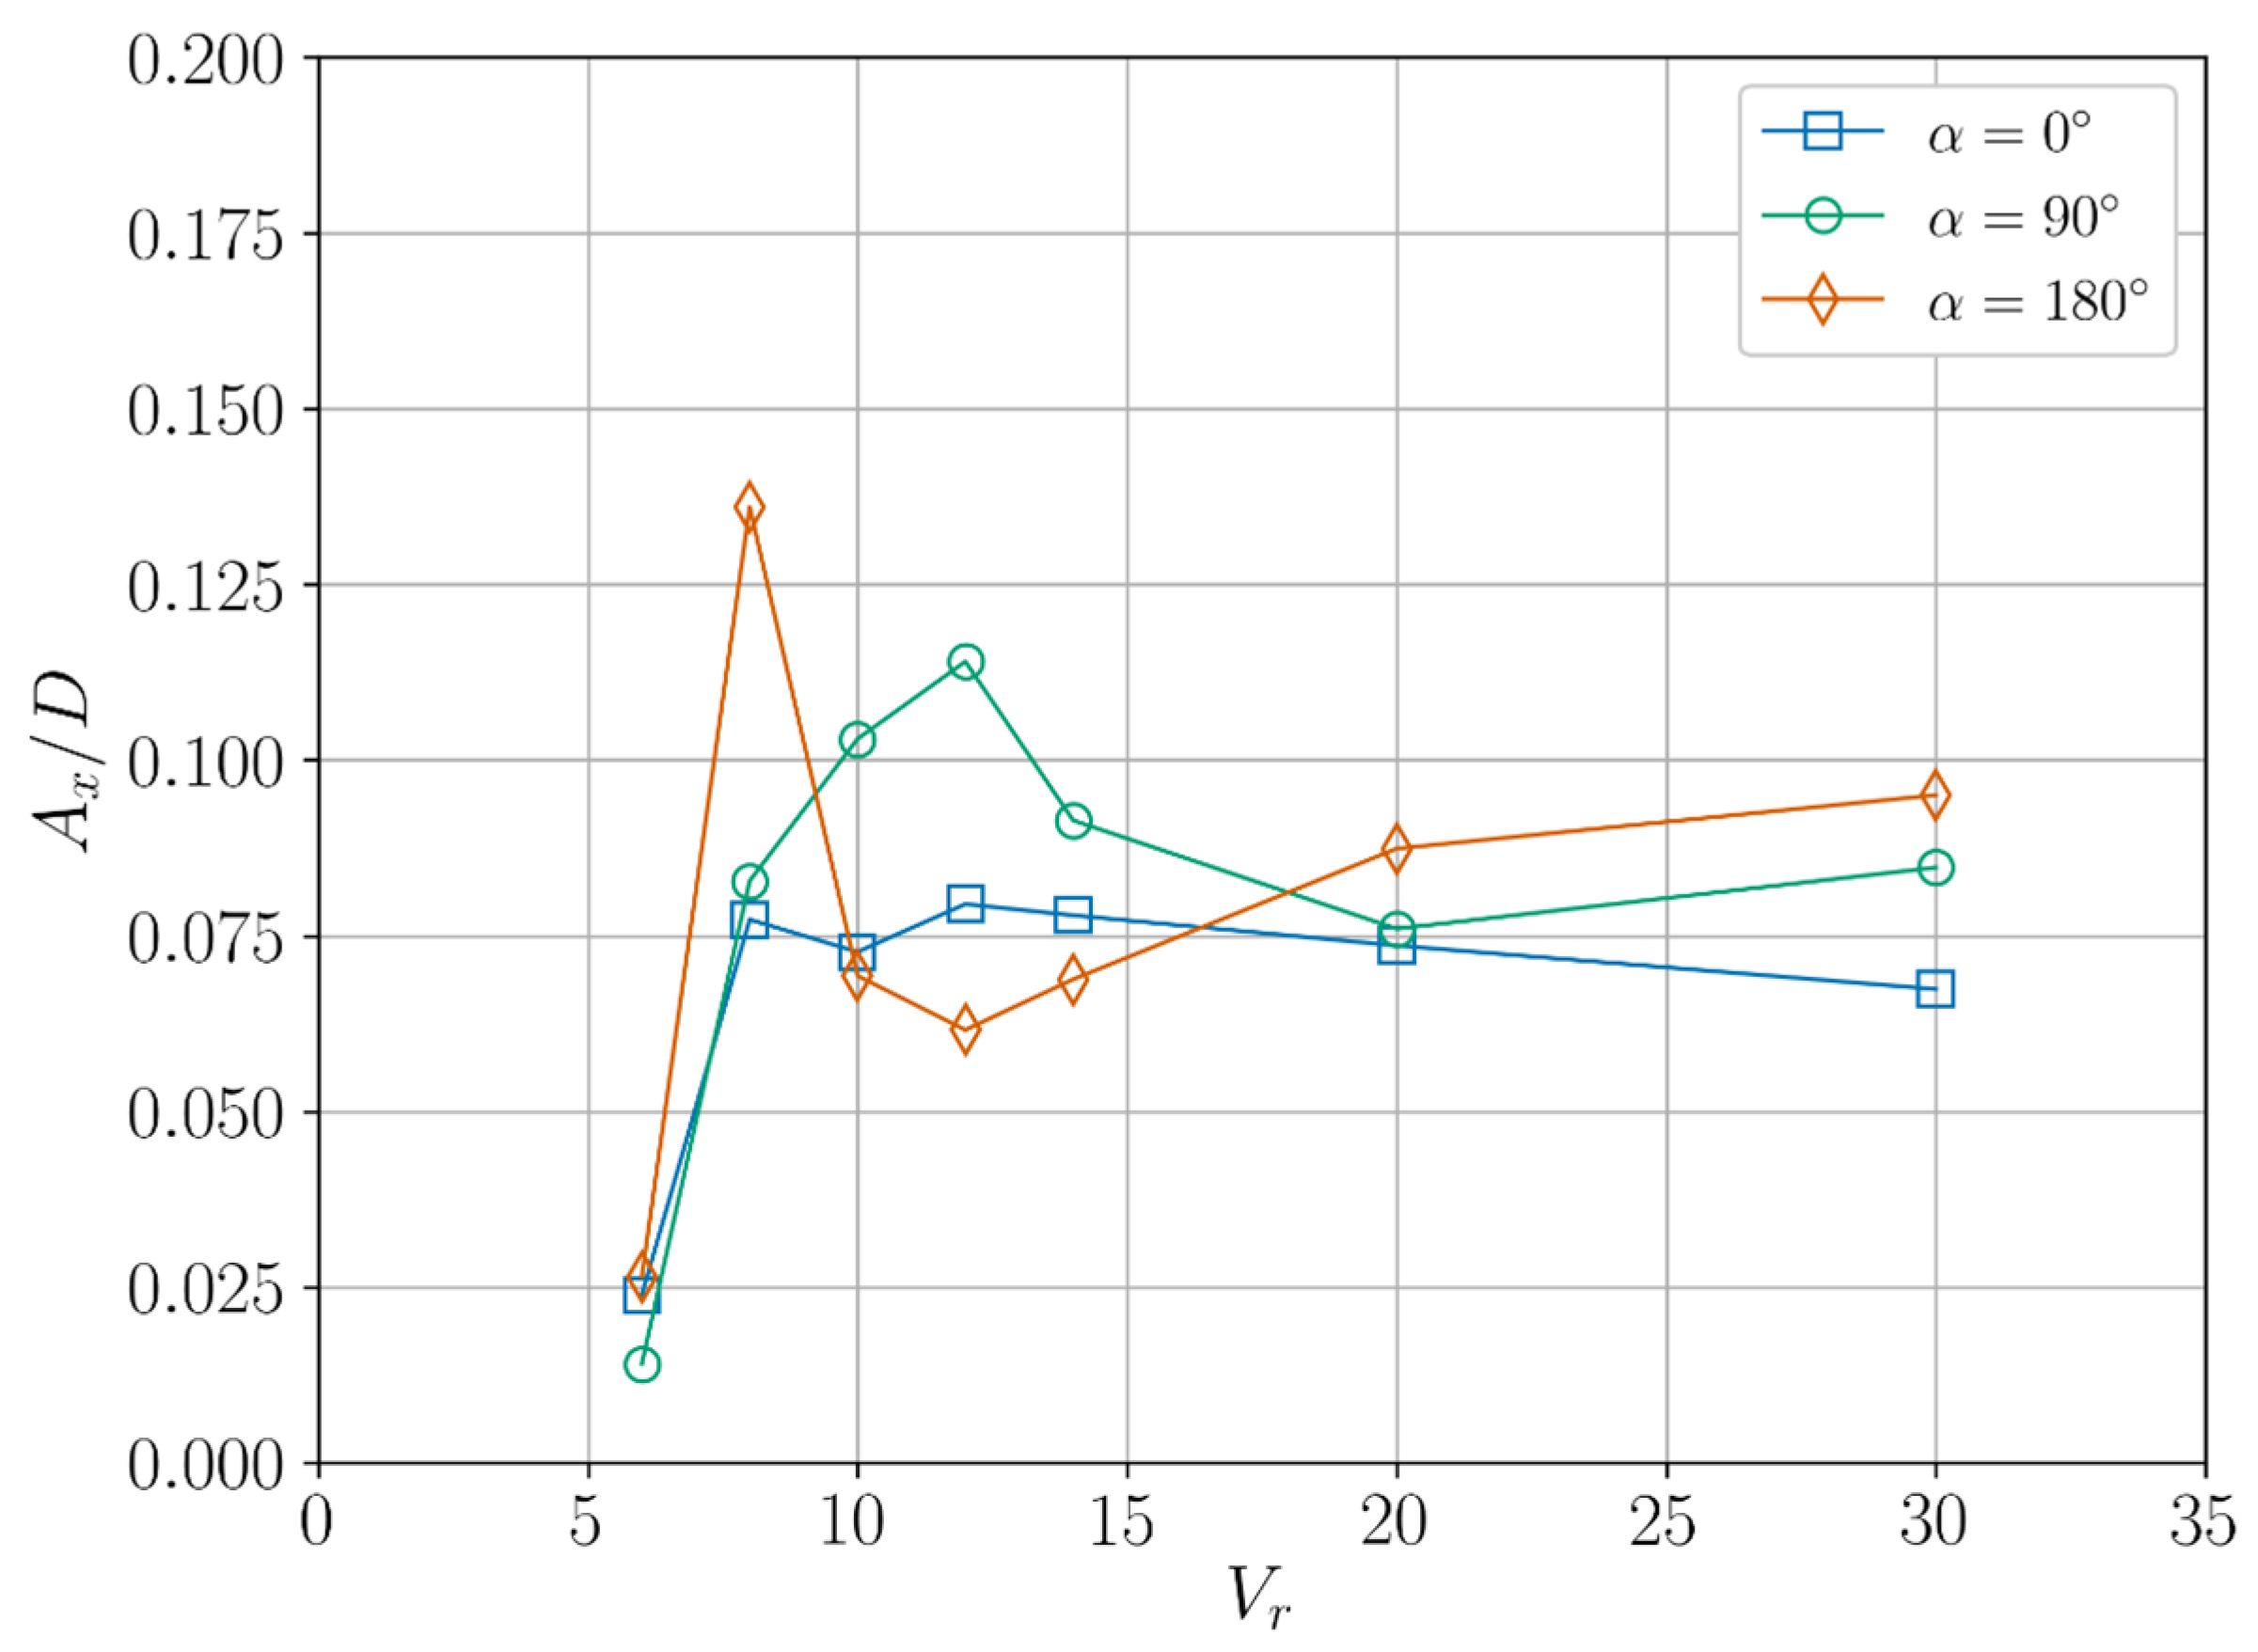
Figure 16 shows the inline response amplitude of the FOWT platform under different current incidence conditions. Compared to the transverse results presented above, the VIM response in the inline direction is relatively small within the whole range. In particular, is nearly zero at for cases with and rises to around 0.075 at , while remaining so afterwards, as increases. Meanwhile, the impact of current incidence on is present but rather limited due to the relatively small response magnitude. For cases with , reaches its maximum of about 0.135 at before falling sharply to 0.075 at ; while for those with , keeps increasing to around 0.12 at and then also drops to 0.075.
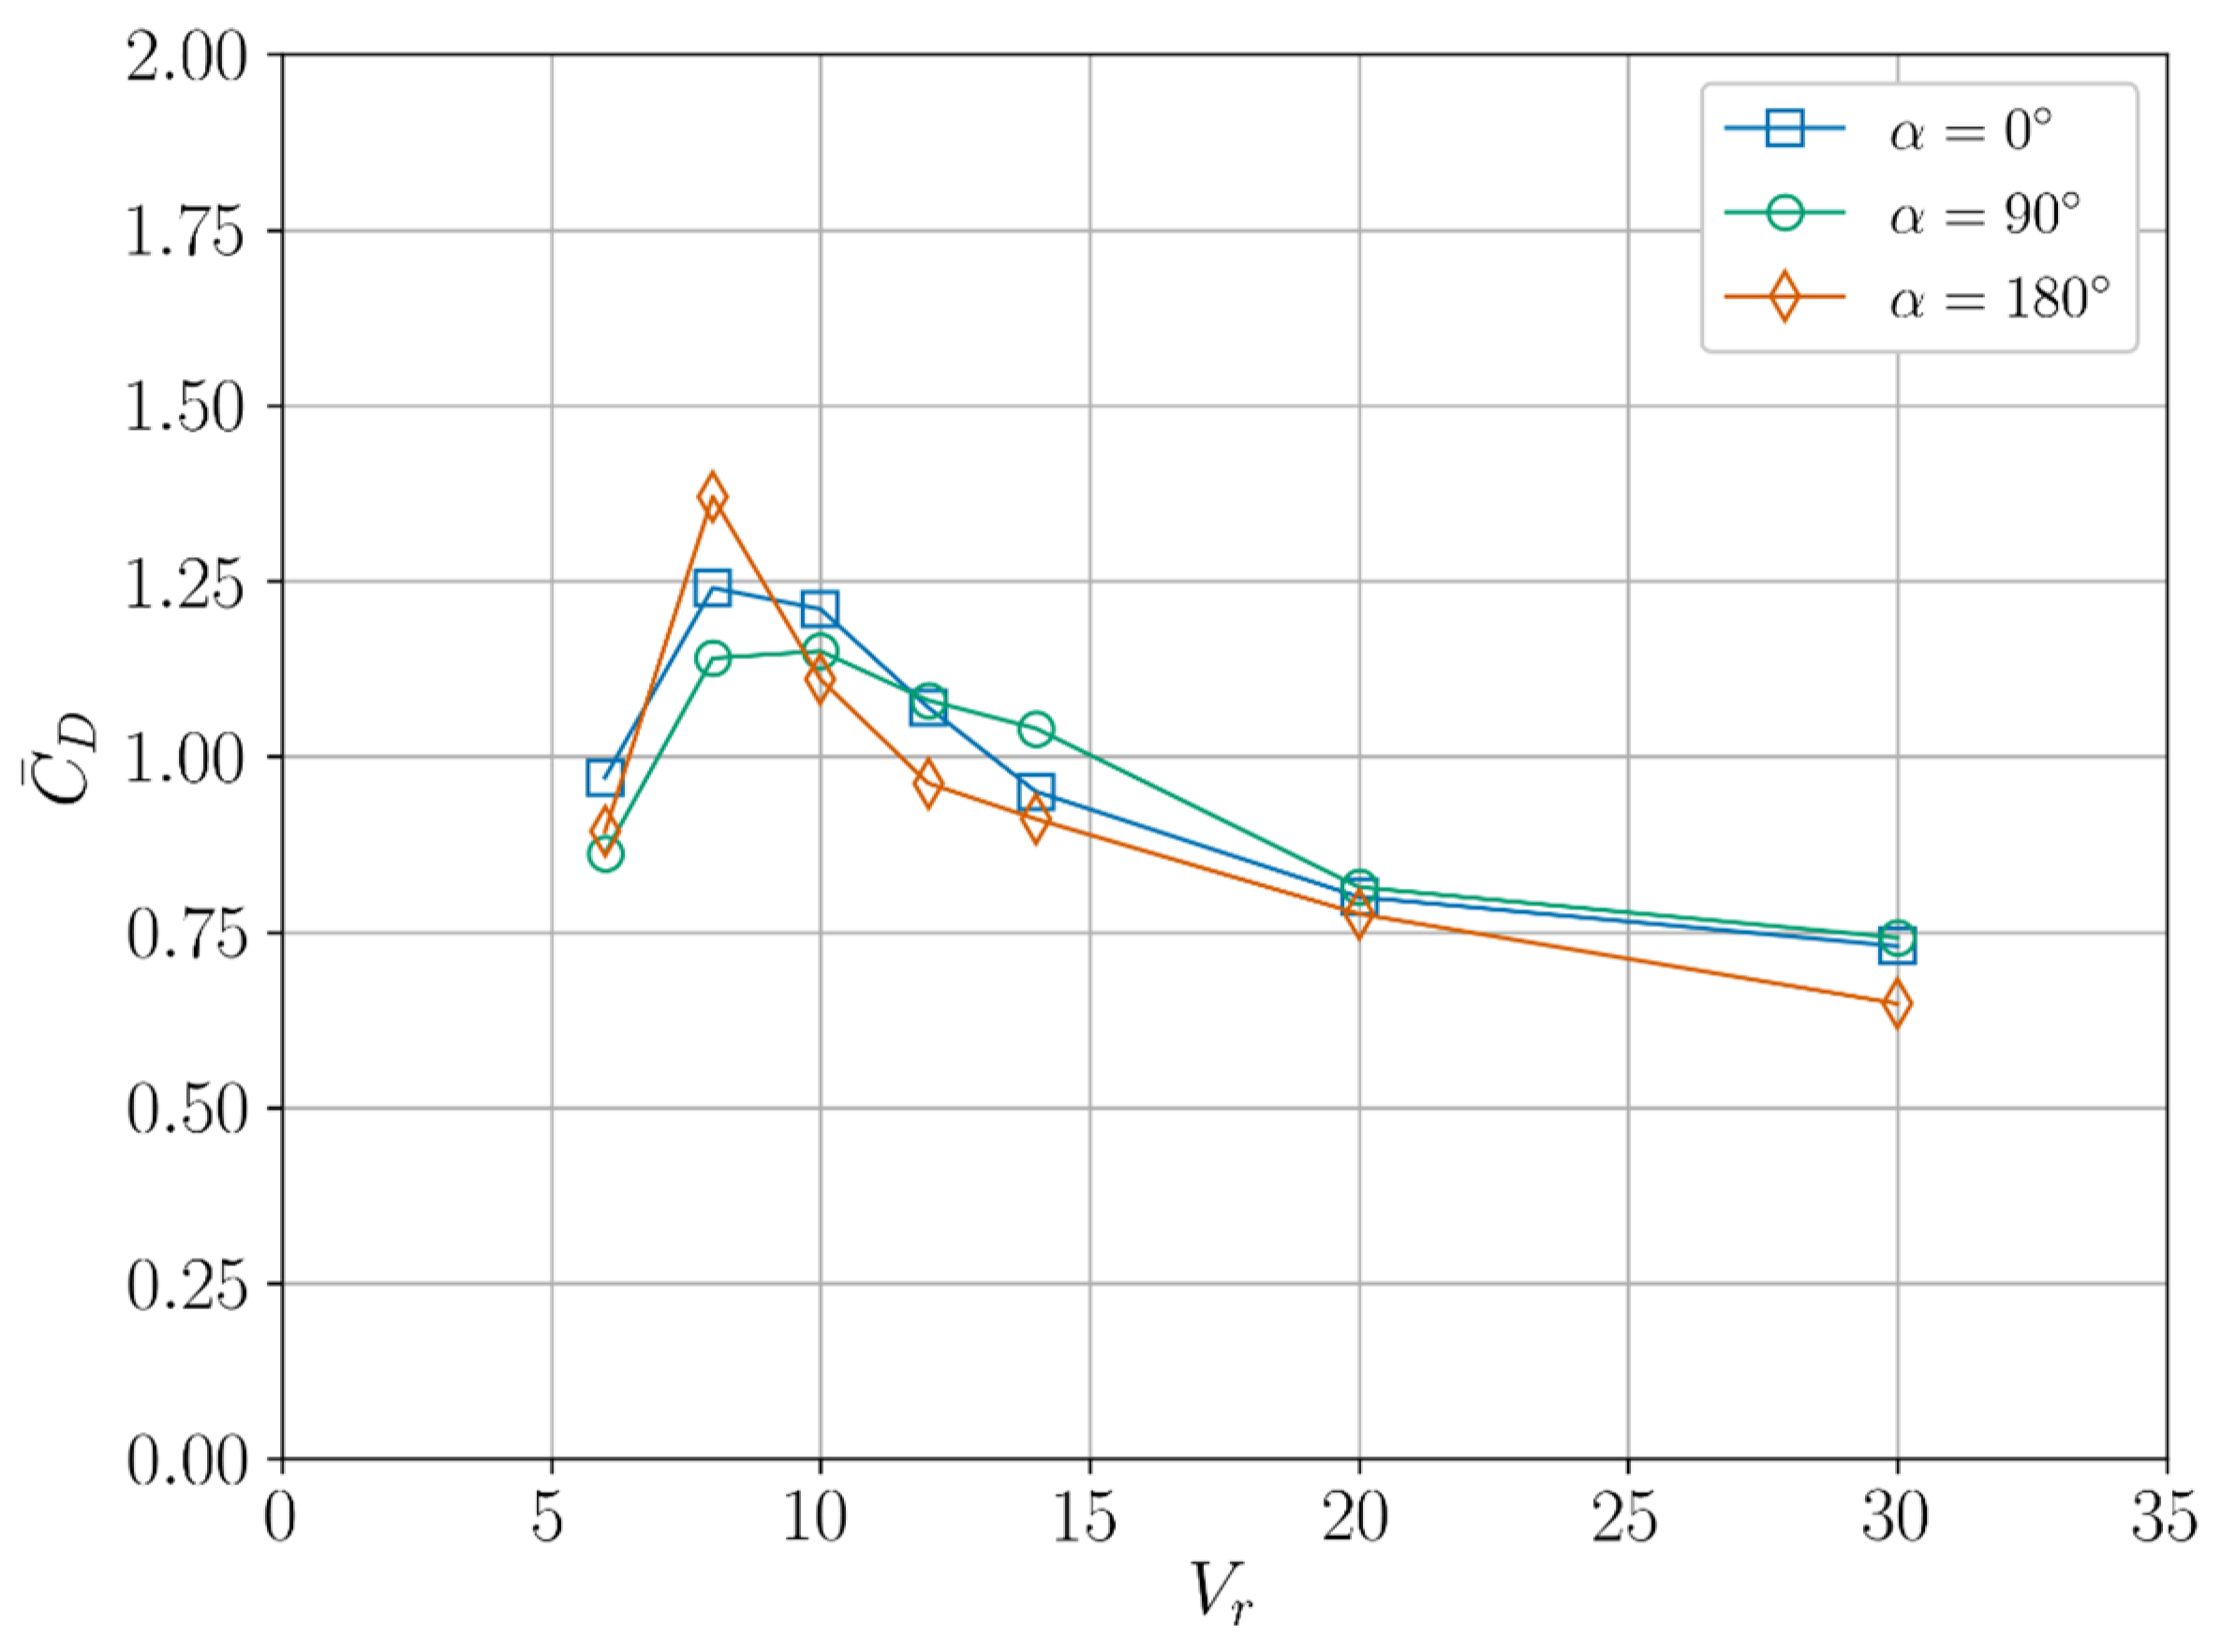
Figure 17 and Figure 18 depict the mean and standard deviation of the inline force coefficient, i.e., and , of the FOWT platform under different current incidence conditions, respectively. For all three scenarios, and exhibit a bell-shaped curve similar to , as shown in Figure 9, and both peak at followed by a gradual decrease. Specifically, the inline force exerted upon the FOWT platform seems to be magnified where the transverse response amplitude is pronounced. This correlation between and reflects the coupling of the inline and transverse responses, as was also pointed out by Tian et al. [30], in their numerical study on flow-induced motions of a three-column floating platform.
5.3. Motion Trajectory
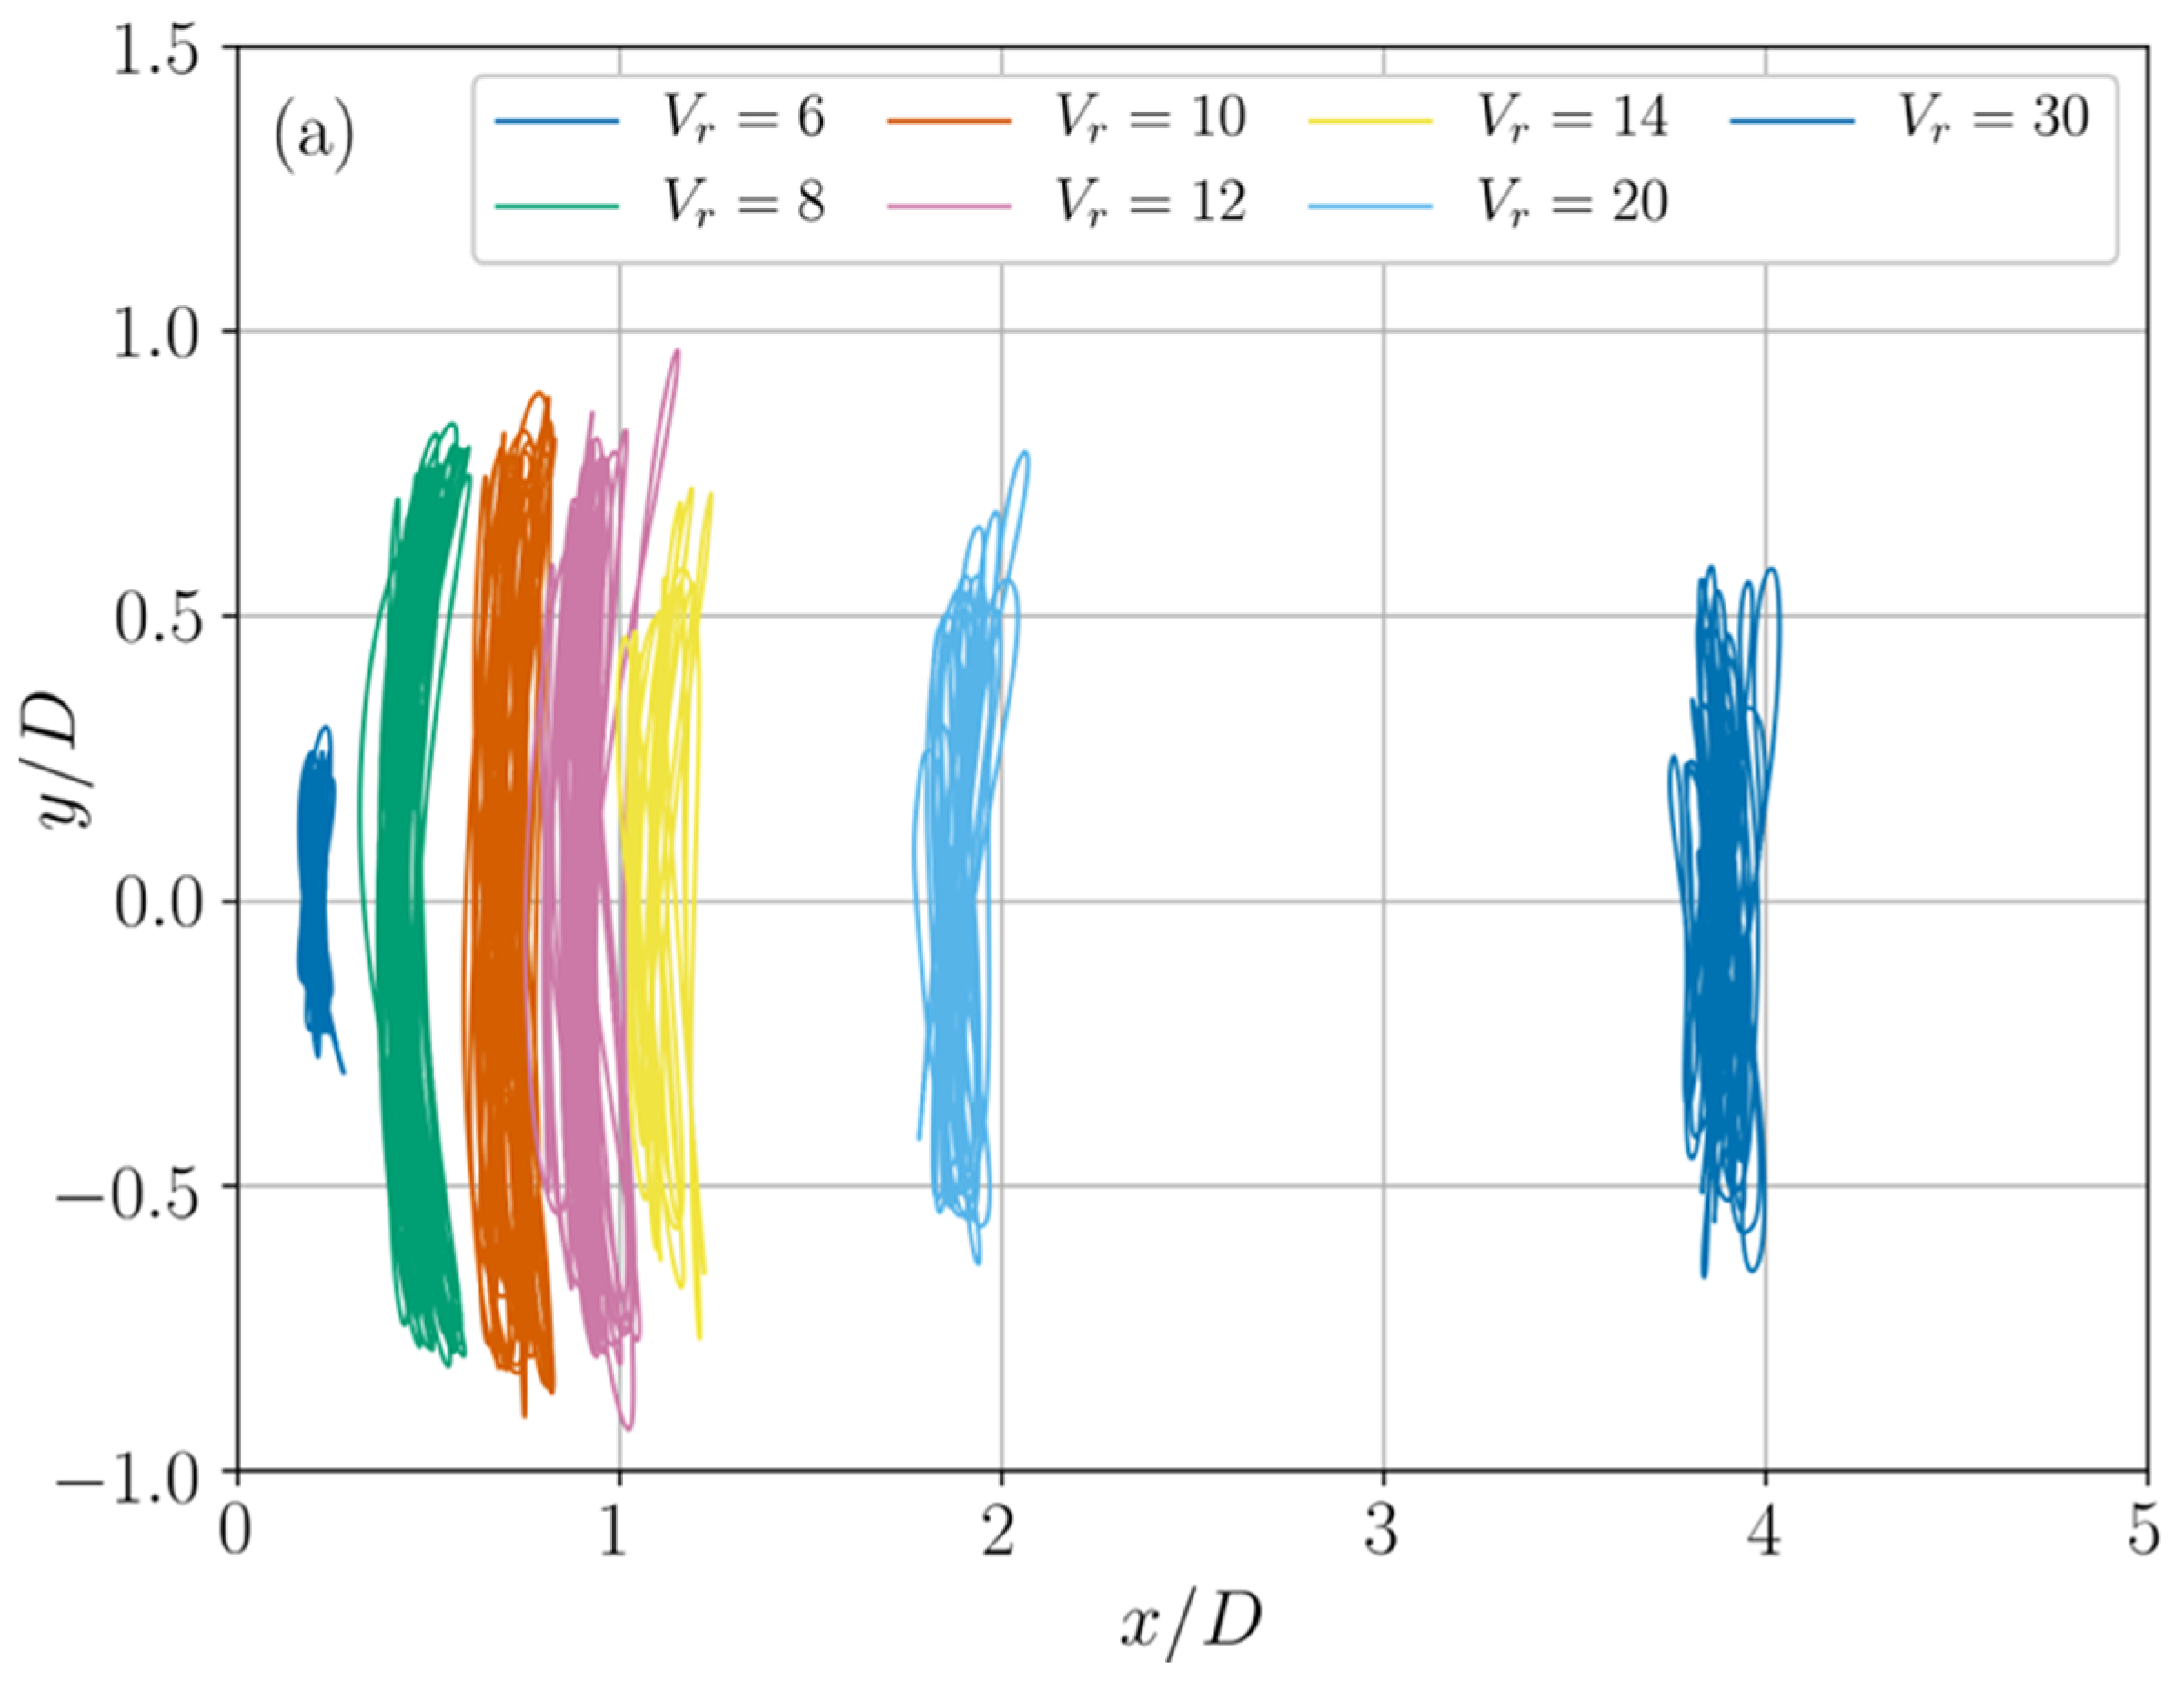
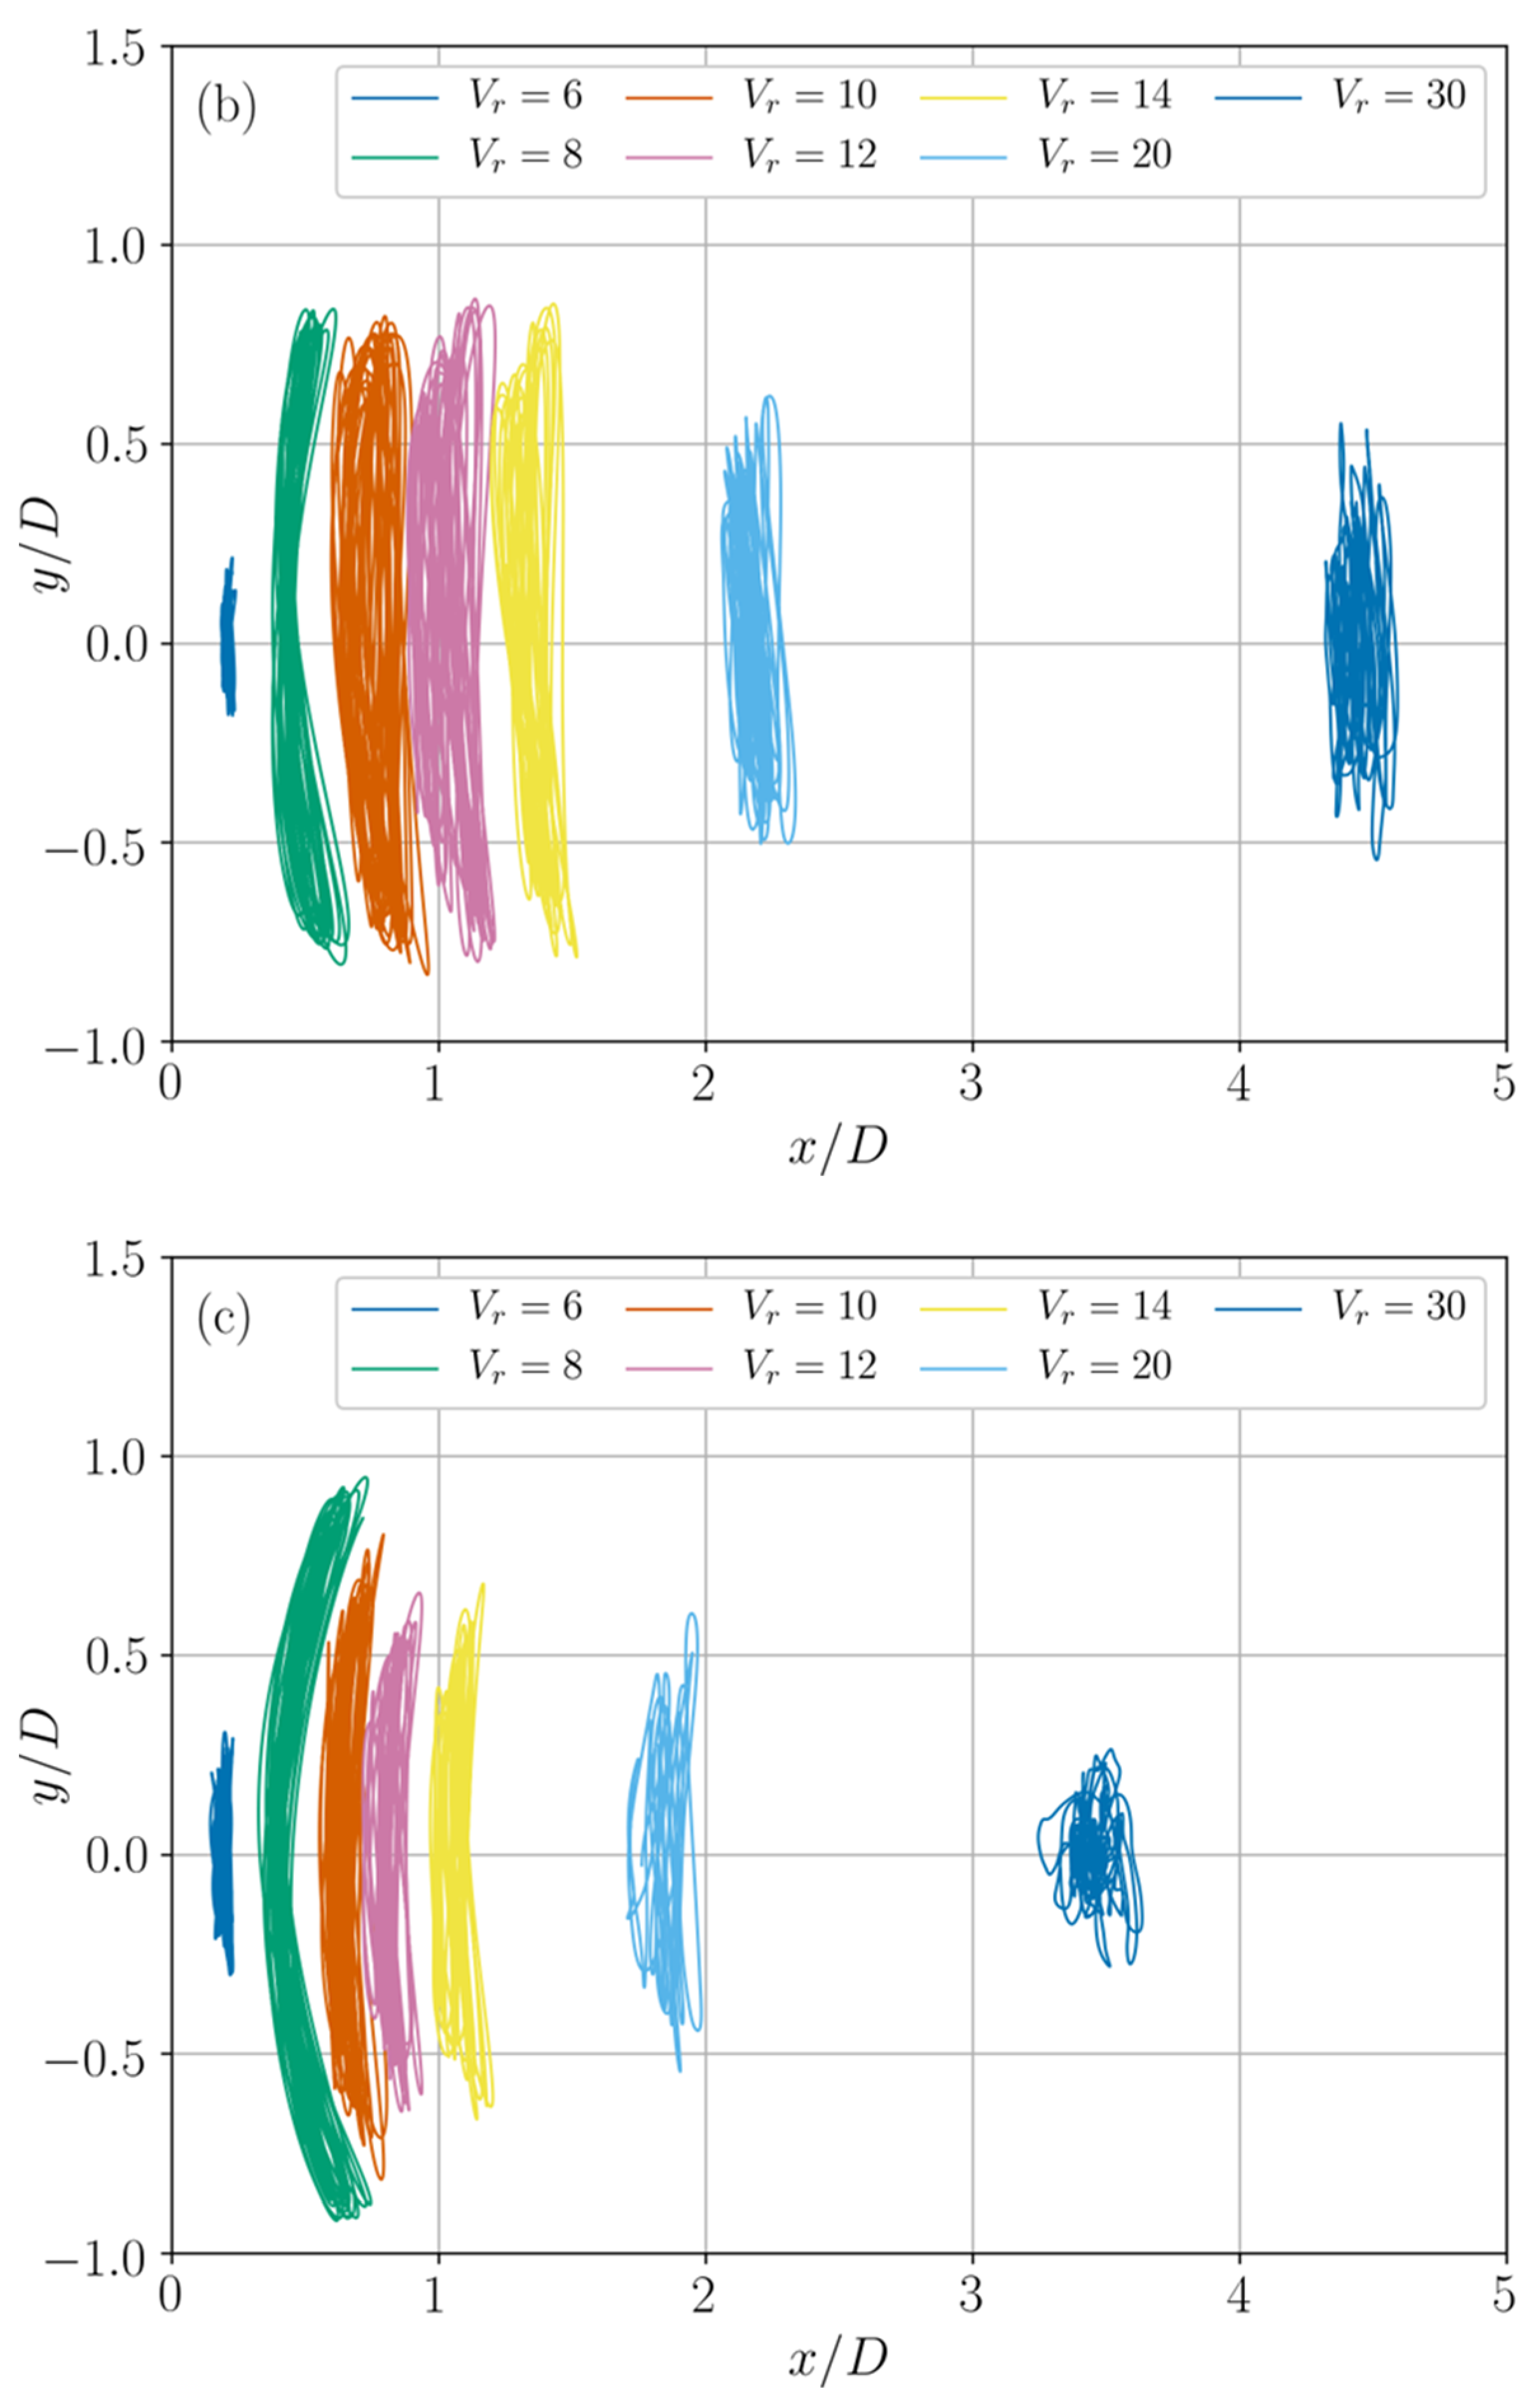
The motion trajectories of the FOWT platform at various when viewed from the XOY plane are illustrated in Figure 19 for all three current incidence conditions. One of the notable features present in these figures is that a crescent-shaped trajectory is observed at . Williamson and Govardhan [27] pointed out that this specific trajectory only appeared for cases with high transverse response amplitude and that the phase difference between the inline and transverse responses under this condition was 270°. Meanwhile, for other cases within the lock-in regime, the motion trajectory mostly exhibits the shape of “1”, rather than the widely known figure-of-eight in VIV/VIM of mono-column cylinders, as was also reported by Zhao et al. [15] and Tian et al. [30], as a linear type of trajectory. This is likely related to the multi-column configuration where forces exerted upon individual columns are affected by the presence of adjacent columns. Additionally, compared to other cases, the motion trajectory for the case with at is rather erratic, further demonstrating that the responses of the FOWT platform lie outside the lock-in regime.
5.4. Flow Field
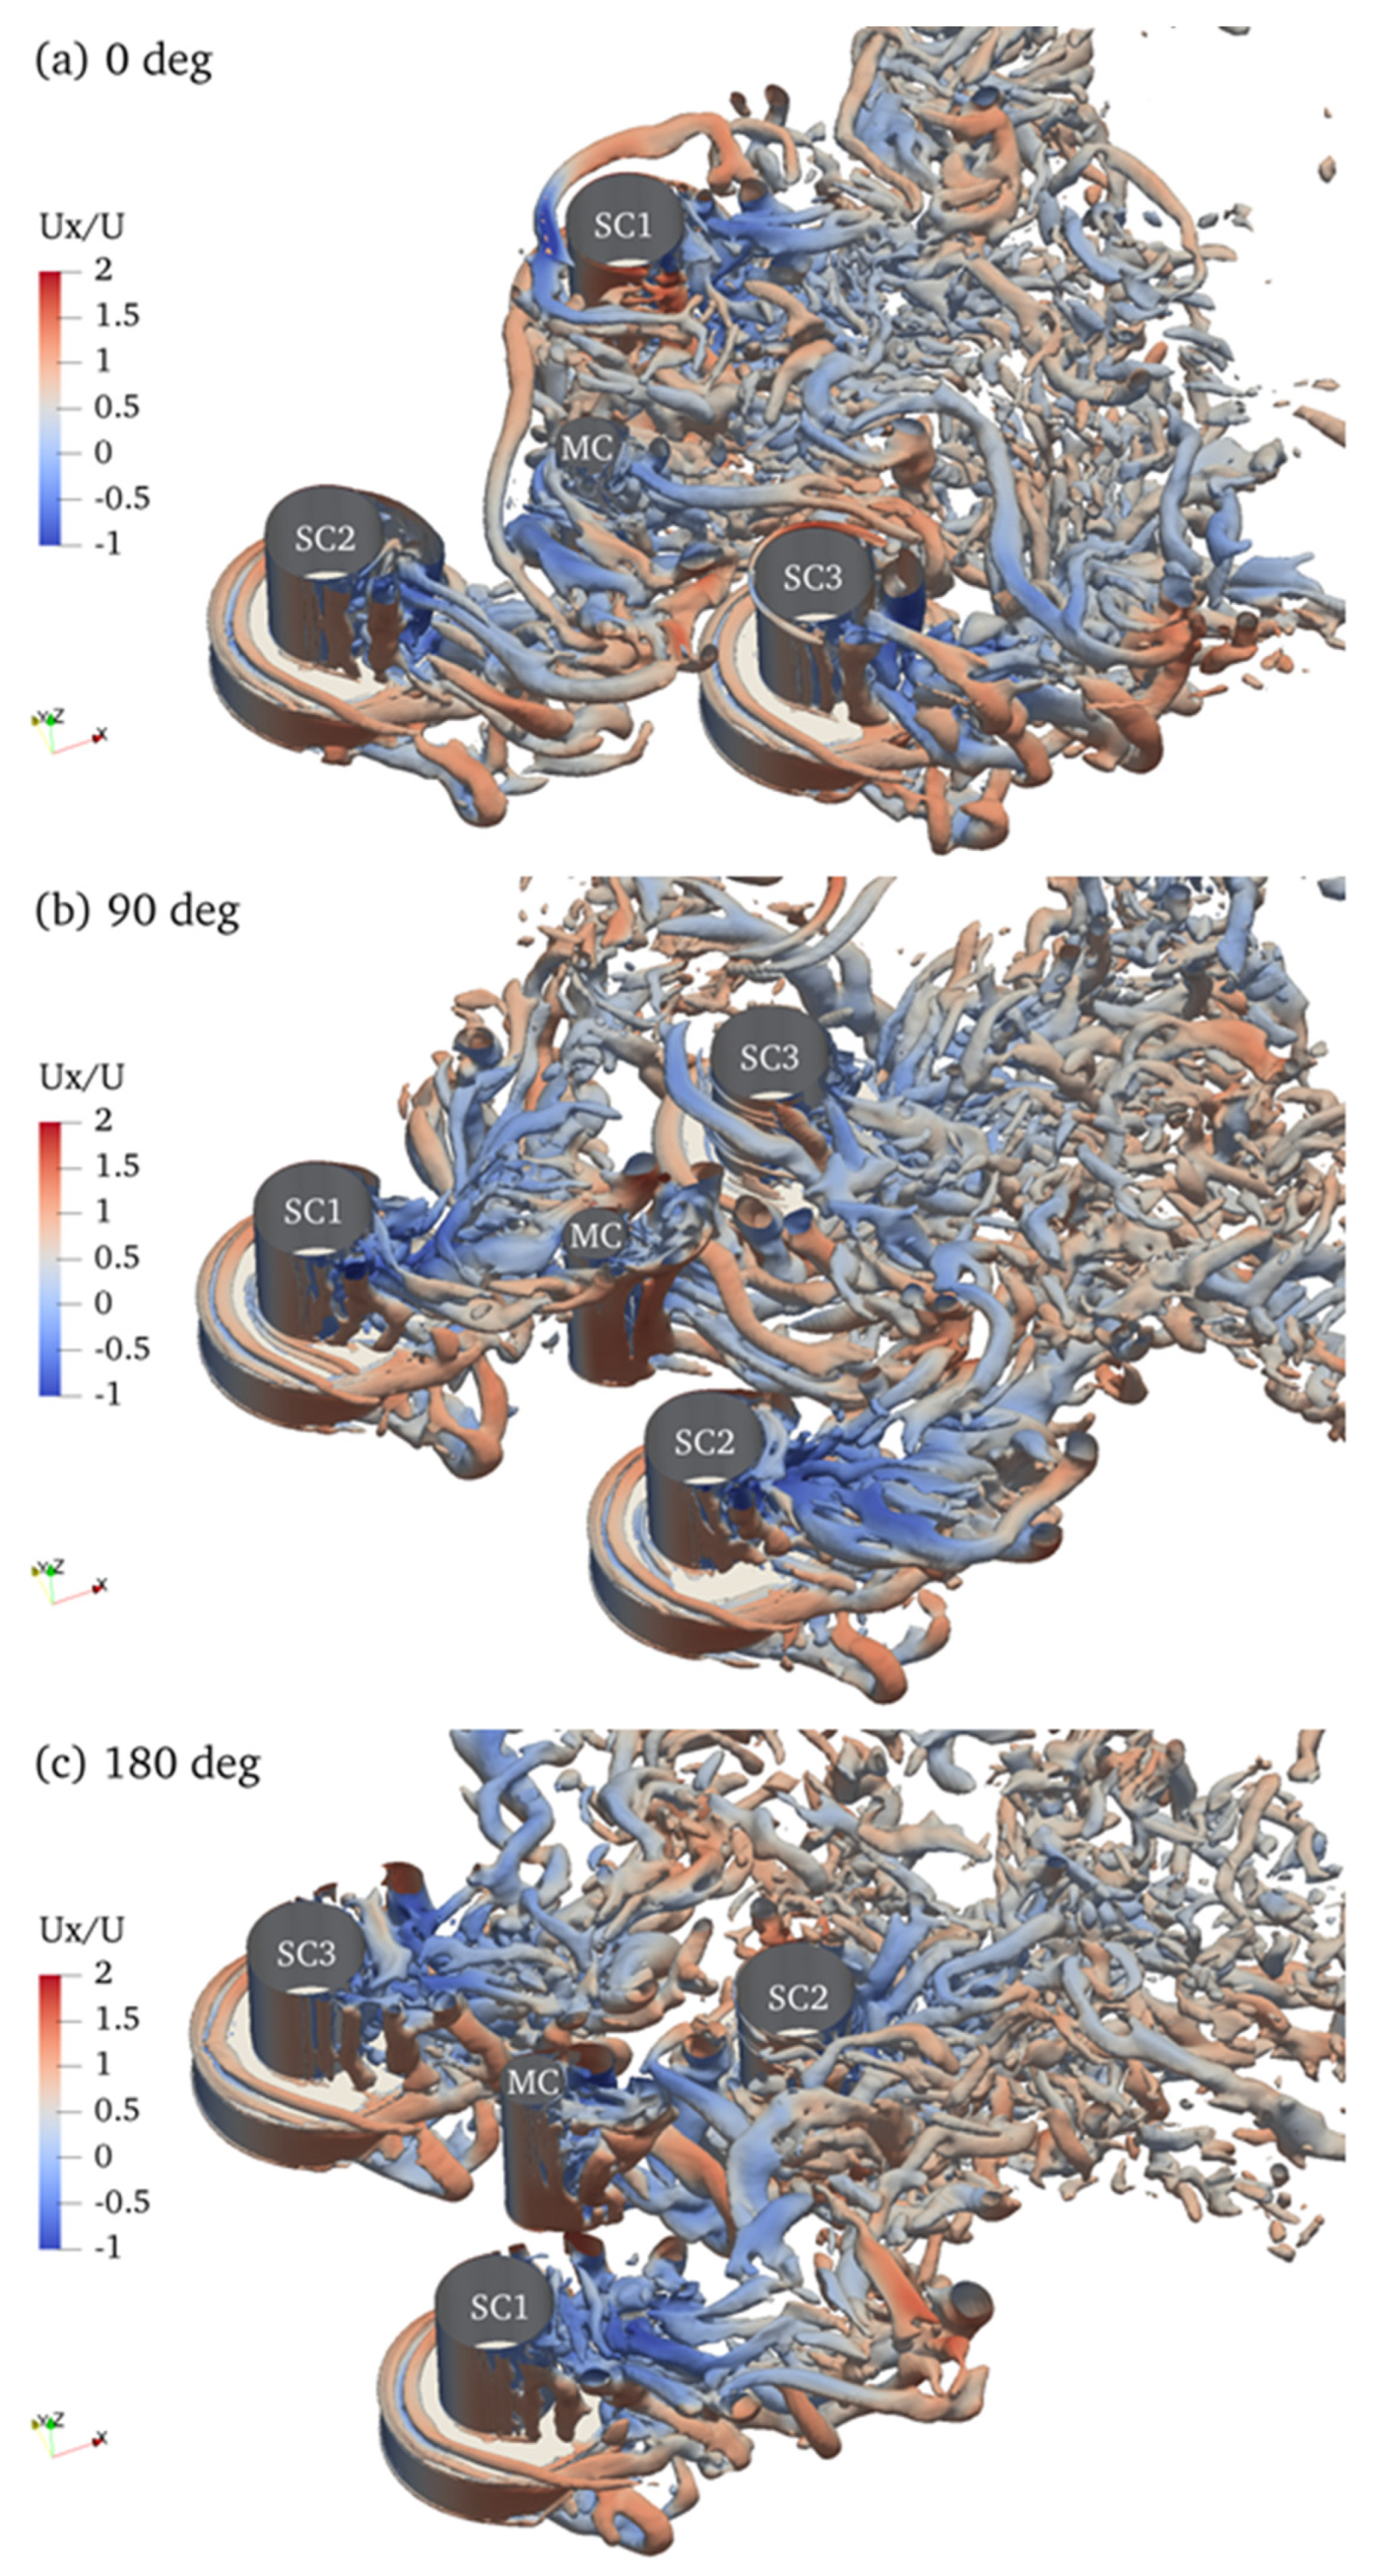
Figure 20 visualises the three-dimensional vortex structure induced by the VIM responses of the FOWT platform at , under different current incidence conditions. The vortices are represented by the iso-surface of and coloured by the non-dimensional inline velocity component , normalised with the incident flow velocity . It can be observed from Figure 20 that fully turbulent small-scale vortices are generated around the FOWT platform, clearly demonstrating the complex flow field for a multi-column structure at high . In particular, vortices are shed from the surfaces of the upper part of the side columns. Meanwhile, vortices are also generated from the edges of their bases, which is a unique feature for circular columns with a base, as has been pointed out in our previous study [18]. Additionally, the vortices shed from the upstream column are convected and impinge on downstream columns. These vortices then interact with those associated with the downstream columns, which has significant impacts on the fluid forces acting on them.
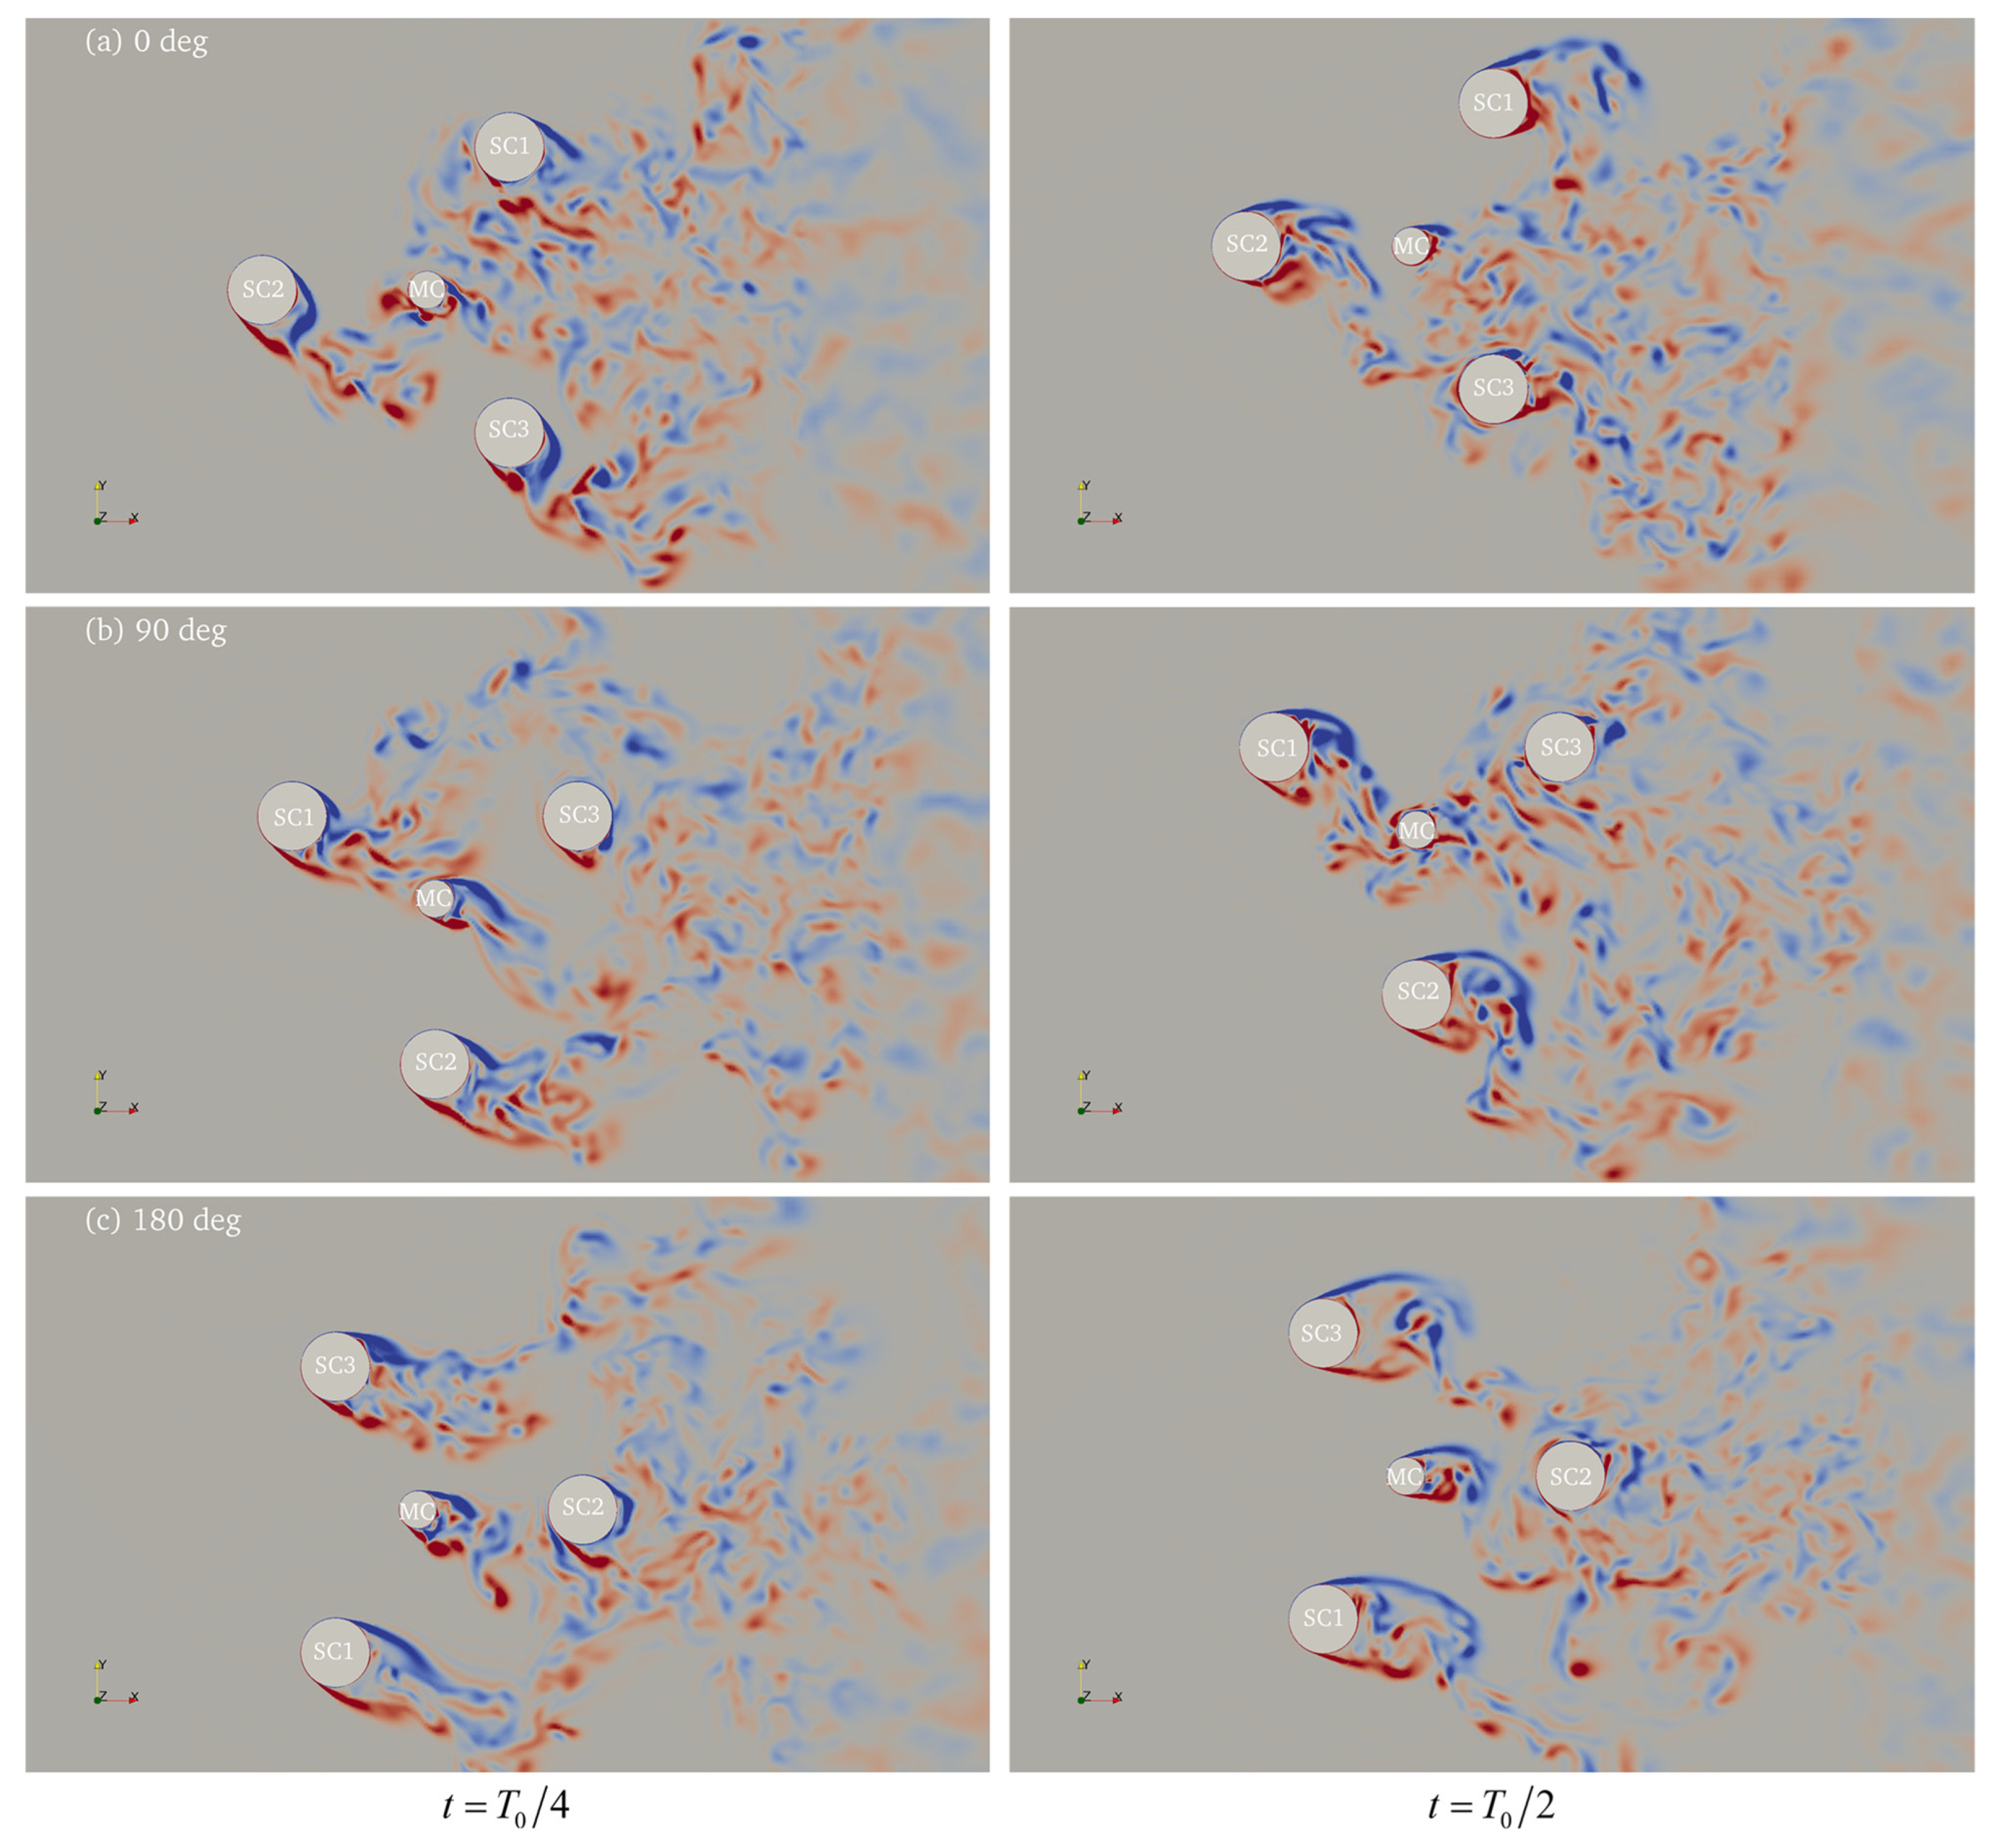
To better understand the differences in vortex interactions among the three current incidence conditions, Figure 21 further illustrates the contours of the axial vorticity component on the sectional plane of , i.e., at a depth of half draft, for the FOWT platform at . Column names are also annotated in Figure 21 for reference purposes. Results at two distinct instants within one motion cycle are presented. At , the platform just passes its initial equilibrium position and is moving upwards with the largest transverse motion velocity; while at , it has moved to its maximum transverse position with nearly zero motion velocity. A synchronised vortex shedding pattern is observed for all columns as lock-in occurs for the platform at . By comparing the results among the three incidence scenarios, it is noted that for the case with the downstream side column labelled as SC2 is continuously subjected to upstream vortices shed from either MC or SC3 (SC1 at ) over the whole motion cycle, greatly affecting the vortex shedding process for SC2 and consequently the fluid forces. This is in contrast to the other two scenarios where upstream vortices only impinge upon downstream columns for a limited time range, which partially explains why for the current incidence scenario with is in general the smallest among all three incidence conditions, as previously shown in Figure 9.
6. Conclusions
In this paper, the VIM responses of the OC4 semi-submersible FOWT platform made of three side columns with a base and one middle column are investigated numerically over a wide range of flow velocity. A high-fidelity fluid-structure interaction tool based on the open source CFD framework OpenFOAM is presented and validated against published experimental data. A DES model is employed to simulate the fully turbulent and massively separated flows at high . Three current incidence angles, i.e., , 90°, and 180°, are considered and results are compared and analysed to assess the effects of current incidence on the VIM of the FOWT platform. Conclusions are summarised as follows.
The inline response of the FOWT platform is relatively small, with a response amplitude of about , and the impact of current incidence is limited. Meanwhile, for the transverse response, the lock-in phenomenon, characterised by large-amplitude motions and the matching of dominant response and force frequencies, occurs for the FOWT platform across a wide range of reduced velocity , varying from up to for cases with and . The transverse response amplitude reaches its maximum of about at and still stays above at . When the incidence angle turns to , the range of the lock-in regime reduces, and chaotic responses appear at . The transverse response amplitude for the cases with is generally smaller compared to the other two scenarios, which is explained via flow field visualisation by the persistent interaction between the upstream vortices and the downstream side column. Furthermore, the motion trajectory of the FOWT platform mostly exhibits the shape of “1”, rather than a figure-of-eight, and a crescent shape is observed at .
Results from the present study suggest that the FOWT platform can be subjected to considerable VIM responses over a wide range of current flow conditions, and thus should be taken into consideration during the design phase. At this stage, only the platform columns are modelled and the small-scale pontoons connecting them are not considered. Although previous research on platforms with large-scale pontoons has demonstrated their damping effects on VIM, how the small-scale pontoons affect the VIM of the FOWT platform still remains unclear. Additionally, the aerodynamic loads experienced by the wind turbine are ignored in this work but may also influence the platform VIM responses, as the loads from wind and current are coupled via structure responses and the wind-induced inclination angle, can also play an important role. Furthermore, in a real-world ocean environment, current flow can be of a shear shape rather than uniform, it is also interesting to compare the FOWT responses under the two different flow conditions. The effects of small-scale pontoons, turbine loads, and shear flow on the VIM of the FOWT will be analysed in future studies.
Author Contributions
Conceptualization, Y.L. and L.L.; methodology, Y.L. and X.B.; software, D.G.; validation, Y.L. and D.G.; formal analysis, Y.L.; investigation, X.B. and L.L.; resources, Y.L.; data curation, X.B.; writing—original draft preparation, Y.L. and D.G.; writing—review and editing, X.B. and L.L.; visualization, D.G.; supervision, L.L.; project administration, X.B.; funding acquisition, Y.L. and X.B. All authors have read and agreed to the published version of the manuscript.
Funding
This research was funded by the National Natural Science Foundation of China (Grant No. 51909255) and the Key Project of the Natural Science Foundation of Zhejiang Province (Grant No. LHZ21E090003).
Data Availability Statement
The data that support the findings of this study are available upon request.
Acknowledgments
The authors would like to acknowledge the Center for High Performance Computing and System Simulation, Pilot National Laboratory for Marine Science and Technology (Qingdao), for kindly providing access to its HPC facility.
Conflicts of Interest
The authors declare no conflict of interest.
References
- Liu, Y.; Xiao, Q.; Incecik, A.; Peyrard, C. Aeroelastic analysis of a floating offshore wind turbine in platform-induced surge motion using a fully coupled CFD-MBD method. Wind Energy 2019, 22, 1–20. [Google Scholar] [CrossRef] [Green Version]
- Liu, Y.; Xiao, Q.; Incecik, A.; Peyrard, C.; Wan, D. Establishing a fully coupled CFD analysis tool for floating offshore wind turbines. Renew. Energy 2017, 112, 280–301. [Google Scholar] [CrossRef] [Green Version]
- Yang, J.; He, Y.-P.; Zhao, Y.-S.; Shao, Y.-L.; Han, Z.-L. Experimental and numerical studies on the low-frequency responses of a spar-type floating offshore wind turbine. Ocean Eng. 2021, 222, 108571. [Google Scholar] [CrossRef]
- Ward, J.C.; Goupee, A.J.; Viselli, A.M.; Dagher, H.J. Experimental investigation into the dynamic behavior of a floating offshore wind turbine stabilized via a suspended counterweight. Ocean Eng. 2021, 228, 108906. [Google Scholar] [CrossRef]
- Johlas, H.M.; Martínez-Tossas, L.A.; Churchfield, M.J.; Lackner, M.A.; Schmidt, D.P. Floating platform effects on power generation in spar and semisubmersible wind turbines. Wind Energy 2021, 24, 901–916. [Google Scholar] [CrossRef]
- Chen, Z.; Wang, X.; Guo, Y.; Kang, S. Numerical analysis of unsteady aerodynamic performance of floating offshore wind turbine under platform surge and pitch motions. Renew. Energy 2021, 163, 1849–1870. [Google Scholar] [CrossRef]
- Waals, O.J.; Phadke, A.C.; Bultema, S. Flow Induced Motions on Multi Column Floaters. In Proceedings of the ASME 2007 26th International Conference on Offshore Mechanics and Arctic Engineering, San Diego, CA, USA, 10–15 June 2007; pp. 669–678. [Google Scholar]
- Tian, C.; Liu, M.; Xiao, L.; Wang, S.; Lu, H. Experimental study on flow-induced motions of TLP focusing on effects of appendages and mass ratio. Ocean Eng. 2020, 196, 106749. [Google Scholar] [CrossRef]
- Gonçalves, R.T.; Rosetti, G.F.; Fujarra, A.L.C.; Oliveira, A.C. Experimental study on vortex-induced motions of a semi-submersible platform with four square columns, Part I: Effects of current incidence angle and hull appendages. Ocean Eng. 2012, 54, 150–169. [Google Scholar] [CrossRef]
- Gonçalves, R.T.; Rosetti, G.F.; Fujarra, A.L.C.; Oliveira, A.C. Experimental study on vortex-induced motions of a semi-submersible platform with four square columns, Part II: Effects of surface waves, external damping and draft condition. Ocean Eng. 2013, 62, 10–24. [Google Scholar] [CrossRef]
- Liu, M.; Xiao, L.; Lu, H.; Xiao, X. Experimental study on vortex-induced motions of a semi-submersible with square columns and pontoons at different draft conditions and current incidences. Int. J. Nav. Archit. Ocean Eng. 2017, 9, 326–338. [Google Scholar] [CrossRef]
- Kim, J.-W.; Magee, A.; Guan, K.Y.H. CFD Simulation of Flow-Induced Motions of a Multi-Column Floating Platform. In Proceedings of the ASME 2011 30th International Conference on Ocean, Offshore and Arctic Engineering, Rotterdam, The Netherlands, 19–24 June 2011; pp. 319–326. [Google Scholar]
- Chen, C.-R.; Chen, H.-C. Simulation of vortex-induced motions of a deep draft semi-submersible in current. Ocean Eng. 2016, 118, 107–116. [Google Scholar] [CrossRef]
- Liang, Y.; Tao, L. Interaction of vortex shedding processes on flow over a deep-draft semi-submersible. Ocean Eng. 2017, 141, 427–449. [Google Scholar] [CrossRef] [Green Version]
- Zhao, W.; Zou, L.; Wan, D.; Hu, Z. Numerical investigation of vortex-induced motions of a paired-column semi-submersible in currents. Ocean Eng. 2018, 164, 272–283. [Google Scholar] [CrossRef] [Green Version]
- Huang, H.; Chen, H.-C. Investigation of mooring damping effects on vortex-induced motion of a deep draft semi-submersible by coupled CFD-FEM analysis. Ocean Eng. 2020, 210, 107418. [Google Scholar] [CrossRef]
- Robertson, A.; Jonkman, J.; Masciola, M.; Song, H.; Goupee, A.; Coulling, A.; Luan, C. Definition of the Semisubmersible Floating System for Phase II of OC4; National Renewable Energy Laboratory: Golden, CO, USA, 2014.
- Liu, Y.; Liu, F.; Wang, E.; Xiao, Q.; Li, L. The effect of base column on vortex-induced vibration of a circular cylinder with low aspect ratio. Ocean Eng. 2020, 196, 106822. [Google Scholar] [CrossRef]
- Coulling, A.J.; Goupee, A.J.; Robertson, A.N.; Jonkman, J.M.; Dagher, H.J. Validation of a FAST semi-submersible floating wind turbine numerical model with DeepCwind test data. J. Renew. Sustain. Energy 2013, 5, 023116. [Google Scholar] [CrossRef]
- Strelets, M. Detached eddy simulation of massively separated flows. In Proceedings of the 39th Aerospace Sciences Meeting and Exhibit, Reno, NV, USA, 8–11 January 2001. [Google Scholar]
- Gritskevich, M.S.; Garbaruk, A.V.; Menter, F.R. A Comprehensive Study of Improved Delayed Detached Eddy Simulation with Wall Functions. Flow Turbul. Combust. 2017, 98, 461–479. [Google Scholar] [CrossRef]
- Wu, X.; Jafari, M.; Sarkar, P.; Sharma, A. Verification of DES for flow over rigidly and elastically-mounted circular cylinders in normal and yawed flow. J. Fluids Struct. 2020, 94, 102895. [Google Scholar] [CrossRef]
- Zhang, X.; Hu, X.; Song, X.; You, Y. Numerical studies on vortex-induced motions of a multi-column deep-draft oil and gas exploration platform. Ocean Eng. 2017, 145, 77–94. [Google Scholar] [CrossRef]
- Menter, F.R.; Kuntz, M.; Langtry, R. Ten years of industrial experience with the SST turbulence model. In Proceedings of the 4th International Symposium on Turbulence Heat and Mass Transfer, Antalya, Turkey, 12–17 October 2003; pp. 625–632. [Google Scholar]
- Newmark, N.M. A method of computation for structural dynamics. J. Eng. Mech. Div. 1959, 85, 67–94. [Google Scholar] [CrossRef]
- Gonçalves, R.T.; Hannes, N.H.; Chame, M.E.F.; Lopes, P.P.S.P.; Hirabayashi, S.; Suzuki, H. FIM—flow-induced motions of four-column platforms. Appl. Ocean Res. 2020, 95, 102019. [Google Scholar] [CrossRef]
- Williamson, C.H.K.; Govardhan, R. VORTEX-INDUCED VIBRATIONS. Annu. Rev. Fluid Mech. 2004, 36, 413–455. [Google Scholar] [CrossRef] [Green Version]
- Liu, Y.; Liu, F.; Xiao, Q.; Zhou, L. The effect of inclination on vortex-induced vibration of a circular cylinder with a base column. Ocean Eng. 2020, 206, 107332. [Google Scholar] [CrossRef]
- Govardhan, R.; Williamson, C.H.K. Modes of vortex formation and frequency response of a freely vibrating cylinder. J. Fluid Mech. 2000, 420, 85–130. [Google Scholar] [CrossRef]
- Tian, C.; Liu, M.; Xiao, L.; Lu, H.; Wang, J. Numerical studies on flow-induced motions of a semi-submersible with three circular columns. Int. J. Nav. Archit. Ocean Eng. 2021, 13, 599–616. [Google Scholar] [CrossRef]
Figure 1.
Geometry definition of FOWT platform: (a) 3D view; (b) side view; and (c) top view.

Figure 2.
Definition of current incidence for FOWT platform.

Figure 3.
Flow chart of fluid-structure interaction.

Figure 4.
Non-dimensional vortex-induced motion amplitude of the four-column floating platform in validation test: (a) inline direction; (b) transverse direction.
Figure 4.
Non-dimensional vortex-induced motion amplitude of the four-column floating platform in validation test: (a) inline direction; (b) transverse direction.

Figure 5.
Dimensions and boundary conditions for VIM simulations of FOWT platform at .

Figure 6.
Computational mesh for VIM simulations of FOWT platform at : (a) top side; (b) structure surface.
Figure 6.
Computational mesh for VIM simulations of FOWT platform at : (a) top side; (b) structure surface.

Figure 7.
Free decay test of FOWT platform in inline direction: (a) time series; (b) PSD.

Figure 8.
Free decay test of FOWT platform in transverse direction: (a) time series; (b) PSD.

Figure 9.
Transverse response amplitude of FOWT platform under different current incidence.

Figure 10.
Time series and PSD of transverse response and force coefficient of FOWT platform with , at various .
Figure 10.
Time series and PSD of transverse response and force coefficient of FOWT platform with , at various .


Figure 11.
Time series and PSD of transverse response and force coefficient of FOWT platform with , at various .
Figure 11.
Time series and PSD of transverse response and force coefficient of FOWT platform with , at various .


Figure 12.
Time series and PSD of transverse response and force coefficient of FOWT platform with , at various .
Figure 12.
Time series and PSD of transverse response and force coefficient of FOWT platform with , at various .


Figure 13.
Transverse response frequency ratio of FOWT platform under different current incidence conditions.
Figure 13.
Transverse response frequency ratio of FOWT platform under different current incidence conditions.

Figure 14.
Standard deviation of transverse force coefficient of FOWT platform under different current incidence conditions.
Figure 14.
Standard deviation of transverse force coefficient of FOWT platform under different current incidence conditions.

Figure 15.
Mean inline response of FOWT platform under different current incidence.

Figure 16.
Inline response amplitude of FOWT platform under different current incidence.

Figure 17.
Mean inline force coefficient of FOWT platform under different current incidence conditions.
Figure 17.
Mean inline force coefficient of FOWT platform under different current incidence conditions.

Figure 18.
Standard deviation of inline force coefficient of FOWT platform under different current incidence conditions.
Figure 18.
Standard deviation of inline force coefficient of FOWT platform under different current incidence conditions.

Figure 19.
Motion trajectories of FOWT platform on XOY plane at various : (a) ; (b) ; and (c) .


Figure 20.
Vortex structure represented by iso-surface of and coloured by non-dimensional inline flow velocity for FOWT platform at , under different current incidence conditions.
Figure 20.
Vortex structure represented by iso-surface of and coloured by non-dimensional inline flow velocity for FOWT platform at , under different current incidence conditions.

Figure 21.
Contours of axial vorticity on plane of at two instants for FOWT platform at under different current incidence conditions.
Figure 21.
Contours of axial vorticity on plane of at two instants for FOWT platform at under different current incidence conditions.


Table 1.
Principal parameters of FOWT platform.
| Principal Parameters | Value |
|---|---|
| Diameter of upper part of side columns | 0.24 m |
| Diameter of base of side columns | 0.48 m |
| Diameter of middle column | 0.13 m |
| Distance between side columns | 1 m |
| Distance between middle column and side columns | 0.577 m |
| Draft | 0.4 m |
| Height of upper part of side column below still water level (SWL) | 0.28 m |
| Height of base of side column | 0.12 m |
| Mass (including wind turbine and tower) | 113.15 kg |
| Inline spring stiffness | 32.24 N/m |
| Transverse spring stiffness | 28.64 N/m |
| Inline natural period | 15.13 s |
| Transverse natural period | 15.84 s |
Table 2.
Flow conditions for VIM of FOWT platform.
| (m/s) | ||
|---|---|---|
| 6 | 0.091 | 2.19 × 10⁴ |
| 8 | 0.122 | 2.92 × 10⁴ |
| 10 | 0.152 | 3.65 × 10⁴ |
| 12 | 0.182 | 4.37 × 10⁴ |
| 14 | 0.213 | 5.10 × 10⁴ |
| 20 | 0.304 | 7.29 × 10⁴ |
| 30 | 0.456 | 1.09 × 10⁵ |
Table 3.
Results of mesh and time-step size sensitivity tests for VIM of FOWT platform at and .
| Mesh | Cell Count | |||||
|---|---|---|---|---|---|---|
| Coarse | 1.91 × 10⁶ | 0.025 | 0.668 | 0.0675 | 0.646 | 1.229 |
| Medium | 4.54 × 10⁶ | 0.05 | 0.711 | 0.0796 | 0.825 | 1.135 |
| 0.025 | 0.716 | 0.0727 | 0.793 | 1.162 | ||
| 0.0125 | 0.706 | 0.0719 | 0.776 | 1.162 | ||
| Fine | 9.31 × 10⁶ | 0.025 | 0.705 | 0.0712 | 0.798 | 1.162 |
Disclaimer/Publisher’s Note: The statements, opinions and data contained in all publications are solely those of the individual author(s) and contributor(s) and not of MDPI and/or the editor(s). MDPI and/or the editor(s) disclaim responsibility for any injury to people or property resulting from any ideas, methods, instructions or products referred to in the content. |
© 2023 by the authors. Licensee MDPI, Basel, Switzerland. This article is an open access article distributed under the terms and conditions of the Creative Commons Attribution (CC BY) license (https://creativecommons.org/licenses/by/4.0/).
Share and Cite
MDPI and ACS Style
Liu, Y.; Ge, D.; Bai, X.; Li, L. A CFD Study of Vortex-Induced Motions of a Semi-Submersible Floating Offshore Wind Turbine. Energies 2023, 16, 698. https://0-doi-org.brum.beds.ac.uk/10.3390/en16020698
AMA Style
Liu Y, Ge D, Bai X, Li L. A CFD Study of Vortex-Induced Motions of a Semi-Submersible Floating Offshore Wind Turbine. Energies. 2023; 16(2):698. https://0-doi-org.brum.beds.ac.uk/10.3390/en16020698
Chicago/Turabian StyleLiu, Yuanchuan, Dunjie Ge, Xinglan Bai, and Liang Li. 2023. "A CFD Study of Vortex-Induced Motions of a Semi-Submersible Floating Offshore Wind Turbine" Energies 16, no. 2: 698. https://0-doi-org.brum.beds.ac.uk/10.3390/en16020698
Note that from the first issue of 2016, this journal uses article numbers instead of page numbers. See further details here.