
Foam EOR as an Optimization Technique for Gas EOR: A Comprehensive Review of Laboratory and Field Implementations


Center for Petroleum Science and Engineering, Skolkovo Institute of Science and Technology, Moscow 121205, Russia
*
Author to whom correspondence should be addressed.
†
These authors contributed equally to this work.
Energies 2023, 16(2), 972; https://0-doi-org.brum.beds.ac.uk/10.3390/en16020972
Submission received: 21 December 2022
/
Revised: 5 January 2023
/
Accepted: 9 January 2023
/
Published: 15 January 2023
(This article belongs to the Special Issue Enhanced Hydrocarbon Recovery)
Abstract
:Foam-enhanced oil recovery (EOR) is poised to become one of the most promising tertiary recovery techniques to keep up with the continuously increasing global energy demands. Due to their low sensitivity to gravity and permeability heterogeneities that improve sweep efficiency, foams are the preferred injection fluids over water or gas. Although foam injection has been used in the field to improve oil recovery and control gas mobility, its success is still hindered by several conceptual and operational challenges with regard to its stability and foamability under reservoir conditions. This can be attributed to the insufficient attention given to the mechanisms underlying foam generation and stability at the microscopic level in many studies. For a deeper understanding, this study reviews the most pertinent published works on foam-EOR. The major objective is to provide a broad basis for subsequent laboratory and field applications of foam-EOR. In this work, we highlighted foam classification and characterization, as well as the crucial factors impacting foam formation, stability, and oil recovery. Additionally, the principal mechanisms of foam generation are thoroughly explained. Finally, the most recent developments in foam generation and stability improvement are discussed. Foam-EOR is comprehensively reviewed in this work, with an emphasis on both theoretical and practical applications.
1. Introduction
Historically, the main (and most important) source of annual energy consumption has been petroleum. Petroleum-based products are used to heat buildings and power vehicles, such as cars and planes that carry passengers and cargo. Plastics, polyurethane, solvents, and thousands of other intermediate and finished goods for the industrial sector are all produced by the petrochemical industry using petroleum as the raw material [1,2]. To put this into perspective, the global average oil consumption in 2020—including biofuels—was about 91 million barrels per day [3].
While a decrease in global oil demand is predicted to have a negative impact on energy exports, domestic oil consumption is anticipated to rise in the next decades despite increased interest in and investments in renewable energy. According to the Organization of the Petroleum Exporting Countries (OPEC), global oil demand and consumption will, in fact, recover from the COVID-19 pandemic by 2036 and rise steadily to roughly 109 million barrels per day by 2045 [4]. From this, it can be deduced that the petroleum sector will be prompted to develop new techniques and improve existing ones which are capable of increasing oil production rates from conventional and unconventional deposits to fulfill the rising energy demand.
Oil production is divided into three stages: primary, secondary, and tertiary. The first process in recovering oil from deposits is called primary production, and it comprises oil extraction from a reservoir by using its natural driving forces. These driving forces can be gravity drainage, gas drive, and water drive, among others [5]. During primary recovery, only about 5–10% of the original oil in place (OOIP) may be recovered [6,7]. The second stage of oil recovery is known as secondary production. At this stage, oil is displaced and driven toward the producing wells by injecting water or gas to replace generated fluids. This stage aims to maintain or raise reservoir pressure while displacing oil toward the wellbore. The third and last stage of recovery is known as tertiary production. Additionally, it is frequently known as enhanced oil recovery (EOR). In order to extract oil from formations, primary and secondary recovery methods rely on the pressure difference between the surface and underground wells. However, in order to facilitate production, tertiary production entails modifying the reservoir rock properties and also the composition, and physical and chemical characteristics of oil, such as viscosity, specific gravity, and interfacial tension. Tertiary production can be divided into three major groups: chemical EOR, gas EOR and thermal EOR [5].
Chemical EOR involves injecting chemical solutions into reservoirs, such as surfactant, polymer, and alkali solutions, to enhance waterflooding performance generally and help with the release of trapped oil. Gas EOR involves injecting gases—such as natural gas, nitrogen, carbon dioxide, methane, or other hydrocarbon gases—into oil reservoirs to dissolve oil and improve its flow to production wells. Thermal EOR is used in deposits with high-viscosity oils (API gravity under 20) [8]. The reservoir is typically heated with steam or hot water injections to reduce oil viscosity and increase its mobility to the surface for production. Figure 1 provides a summary of the various techniques.
Enhanced oil recovery generally aims to boost sweep efficiency both on a macroscopic scale and a microscopic scale. The overall displacement efficiency, E, % can be used to describe its effectiveness:
where = macroscopic sweep efficiency (volumetric sweep), %; = microscopic sweep efficiency (displacement sweep), %.
Macroscopic displacement refers to the region of the reservoir that the injected fluid has been able to contact, whereas microscopic displacement specifies the volume of the oil that has been displaced from the reservoir by the injected fluid [5]. The volume of oil left behind in the swept zone and the remaining oil in the unswept zone make up the trapped oil in the reservoir. Therefore, EOR techniques are used to increase the efficiency of microscopic and macroscopic sweeps to enhance oil recovery.
Typically, large capillary numbers are aimed to enhance with EOR techniques. The capillary number shows the relationship between viscous and interfacial forces:
where = viscosity of injected fluid, mPa · s; = interfacial tension (IFT), mN/m; V = velocity of injected fluid, m/s; = contact angle (wettability), degrees.
From Equation (2), it can be inferred that, an increase in the injected fluid viscosity and/or a decrease in IFT is required to produce a high capillary number. Surfactants are used for these purposes because they are known to increase viscosity and decrease IFT by up to four orders of magnitude [9]. According to Hirasaki et al. [10], it is also possible to inject gases as solvents to reduce the IFT and improve microscopic displacement efficiency.
In order to improve , polymer flooding can better serve as a mobility control agent by increasing viscosity but not IFT. To obtain favorable mobility control, must be improved. The following formula describes the mobility, M of a phase:
where k = permeability, mD; = viscosity of injected fluid, mPa·s.
The mobility ratio of the displacing and displaced fluids is one of the most crucial elements determining the effectiveness of EOR techniques. The mobility ratio should be below 1 for an effective flooding process [11]. However, it is typically greater than 1 during gas EOR since the reservoir fluid has a higher viscosity than gas. Therefore, gravity override and viscous fingering frequently result in poor volumetric (macroscopic) sweep efficiency in gas field operations and subsequently gas breakthrough, which would ultimately reduce the efficiency of the EOR process [12]. Hence, foam-EOR is suggested as an effective method of mitigating this. This stems from the formation of foam lamella that can restrict gas mobility for a more efficient sweep. To displace reservoir oil, the formation of a strong foam can result in a uniform propagation front and, thus, directing gas and liquid phases to the previously unswept zones [9].
Foam-EOR is currently a developing technique in the petroleum industry and, thus, just a few review papers are published on it. The majority of them are concentrated on the use of foam-EOR only in unconventional formations, such as hydraulic fracturing fluids, surfactant reviews for foam-EOR, CO foam reviews, or nano-stabilized foams. Wang et al. [13] provides an in-depth analysis of the development of technologies for increased oil recovery. This review, however, only considered how well foam can be applied to shale and tight reservoirs. Although it covered every other EOR approach in detail, foam received little attention. The foam was categorized by the authors as a gas mobility control agent that can aid in the improvement of the viscosity of the injected gas. The authors went on to explain that although CO miscible flooding is a proven and promising EOR technique, it is still unable to achieve a perfect sweep efficiency because macroscale reservoir heterogeneity can lead to fingering and channeling, which can cause the less viscous phase (gas) to only flow toward the high permeability zones.
Moortgat et al. [14] provide additional evidence in favor of this. In order to investigate how heterogeneity affects miscible gas flooding, the authors developed a three-phase compositional model through numerical simulation experiments. The authors discovered that a significant volume of reservoir fluids would be left behind once the miscible phase propagates across a high permeability zone.
By concentrating on foam-EOR, Wanniarachchi et al. [15] moved a bit further away from Wang et al. [13]; yet, the state-of-the-art assessment focuses on the use of foam for shale gas extraction. The effectiveness of foam-based fracturing fluids for recovering shale gas was explicitly reviewed by the authors. The capacity to reuse foam was cited as a major benefit since, following the flooding process, the injected foam may simply be collected through a well because it is compressed under reservoir conditions. The little foam bubbles will become larger, degenerate, and eventually escape through the wellbore as a result of the pressure being released following the flooding process. The authors asserted that foam-EOR is more efficient than most injection fluids, including water, although requiring larger capital investments due to the equipment and technology needed.
The work of Pal et al. [16] concentrates on the mechanisms of surfactant recovery and related processes such as wettability alteration, surfactant adsorption, and IFT reduction. The use of foam as an alternative to the surfactant flooding technique in carbonate reservoirs was discussed. According to the authors, when polymers, gas, or water-alternating-gas injection methods are impractical because of unfavorable conditions, such as low permeability, high temperature, or high salinity, among others, foams can be used for mobility control. Additionally, they emphasized that while gas has a very high microscopic sweep efficiency, its viscosity is substantially lower than that of water and the majority of reservoir oils, which affects conformance and mobility on the displacement front. In order to lower the mobility ratio, foams can be generated by dispersing gas in a continuous liquid solution.
As it is evident, none of the aforementioned studies was able to clarify the arguments around certain findings relating to the key interaction processes of foam-EOR. In addition, there are important findings from fresh articles published in recent years that were left out of earlier review papers. The recent findings, notably the laboratory results, have further highlighted several research gaps that accounted for some failed field and pilot tests. As a result, this study provides a thorough and in-depth description of foam and its wide applicability at laboratory and field scales. By highlighting the results, difficulties, and potential outcomes, this study provides information on the current status and development of foam-EOR. The fundamental research gaps are given the most attention. The outcomes of several field pilot tests, lab-scale flooding experiments, and insights from modeling and simulation studies were examined, along with recommendations for enhancing oil recovery in future foam-EOR experiments.
The goal of this review paper is to present an all-inclusive opinion about the feasibility of foam to recover oil in various reservoirs, as well as an academic viewpoint on the practice and analysis of the problems and counterarguments surrounding its recovery processes.
2. From Gas EOR to Foam-EOR: Problems and Motivations
Gas EOR involves injecting gases into existing and depleted oil deposits, as was discussed in Section 1. Injected gases, which may include mixtures of light hydrocarbons (C–C) or non-hydrocarbons (nitrogen, CO, flue, or even hydrogen sulfide), are usually vapors at atmospheric pressure and temperature. At reservoir pressures and temperatures, these gases could, however, transform into supercritical fluids and start to behave similar to liquids [5]. As a result, a key component of the oil recovery mechanism is the mass interchange of components between the injected gas and oil phase [17]. If miscibility is attained, the interchange rate increases and oil recovery improves. By decreasing oil viscosity when some gas components condense into the oil, gas EOR can achieve high oil recovery [17]. The oil trapped by capillary forces is expected to be miscible with the gases that are injected. Following that, the resulting phase forces the oil components to the surface for production.
In the majority of oil production operations at the secondary or tertiary stages, the gas injection has been frequently used for several reasons. Among the gases previously described, CO and nitrogen injections have been considered the most successful and promising [18,19,20,21]. It is interesting to point out that nitrogen may be preferred due to its cheaper price and availability compared to CO [19,22]. However, according to Abdelaal et al. [23], CO has an advantage over nitrogen since it is easily miscible with oil, causing oil to swell and have less viscosity and interfacial tension under specific reservoir conditions. As a result, CO is the gas of choice for injection into light and medium oil reservoirs [18].
Zhang et al. [24] further stated that CO is used for significant field activities since it is readily available in natural resources and may be generated through a variety of industrial processes. This is a beneficial topic for environmentalists because injecting CO into formations to improve oil recovery can also aid in CO storage in the reservoir, having a positive effect on the environment. Therefore, CO injection can be seen as a carbon storage technique that is crucial for reducing CO emissions, which are the main contributors to global warming. However, in other formations, nitrogen is preferred because, when injected under high pressure, it may result in a miscible slug that helps release trapped oil from the reservoir rock [25].
Laboratory tests on improved oil recovery using nitrogen were carried out in the work of Siregar et al. [26]. Nitrogen was injected at different rates into core samples containing crude oil with an API gravity of 38.5. The results showed that increasing the injection rate results in higher oil recovery. Additionally, gas analysis tests before and after injection were carried out, and a change in oil composition was found. After injection, it was found that the components of the oil were carbon and oxygen. The fraction of gas that was free of oxygen decreased with increasing injection rates as a result of the oxidation process. The authors asserted that the oxidation process aided the recovery process.
Gas has many promising advantages as a displacement agent, but its application is subject to several limitations. The majority of EOR methods aim to recover the most oil by having the injected fluid make as much contact as possible with the reservoir. In other words, it is important to improve both the sweep efficiency and the pore-scale displacement efficiency [27]. Since gases are often less dense and viscous than formation water and reservoir oil, they eventually separate and break through. This is usually referred to as gravity override. It not only leads to an early breakthrough of the injected gas but also causes gas wastage and reduces sweep efficiency [28].
Additionally, oil recovery is particularly effective when contact between gas and reservoir fluids is formed and miscibility is attained since the mobility ratio will be lower than 1 [29,30]. Gravity, on the other hand, causes the propagation front to become unstable, which leads to the formation of finger-like structures made of the oil and gas mixtures and the massive accumulation of oil that follows. The fingers are more obvious as the mobility ratio exceeds 1 [30]. This is called viscous fingering and it strongly affects oil recovery by increasing pore-scale displacement efficiency while decreasing sweep efficiency. The illustration of this phenomenon is shown in Figure 2 below:
To improve the poor volumetric (macroscopic) sweep efficiency of gas injection, different gas flooding optimization techniques have been tried. For instance, it is possible to optimize gas in a water-alternating gas system (WAG). In this process, gas and water injections are alternated (i.e., gas is injected first, followed by water, gas is injected again, etc.) [31]. Water has a higher viscosity than gas, thus as the gas and water mix, the gas mobility ratio decreases, improving sweep efficiency.
The implementation of WAG to increase sweep efficiency has been proven to be an efficient means of controlling gas mobility, which leads to a higher oil recovery [31,32]. However, as seen in Figure 3 below, gas still tends to move to the higher portion of the formation during the WAG injection cycle [32]. According to Gauglitz et al. [33], segregation happens as a result of gravity when there is a significant permeability and density difference between the injected gas and formation fluids. As rock heterogeneities increase, water and gas will flow through the high permeability layers, and segregation will become more visible [32]. Therefore, in order to achieve optimal oil recovery, it is crucial to take into account the volume of water and gas that must be injected throughout a WAG operation.
Another mobility control technique is foam-assisted WAG (FAWAG), also known as foam injection [34]. Foam is a mixture of liquid and gaseous phases in which the liquid phase continuously wets the rock formation while the gaseous phase, which is preserved as bubbles, is discontinued by thin liquid coatings [33]. The oil recovery process can be considerably enhanced by increasing sweep efficiency and pore-scale displacement by injecting foams. The presence of foam lamella, which decreases gas mobility, enables this. By making the gas more viscous, foams can stabilize the oil displacement process.
Additionally, as seen in Figure 4, gas flooding alone cannot effectively recover oil; the WAG method is superior but still leaves some unswept zones. Foam, on the other hand, has the best sweep efficiency because it can redirect gas flow from high to low permeability zones and minimize gas mobility there [9,35]. Furthermore, the surfactant which is present in the liquid phase of the foam is capable of reducing interfacial tension and capillary forces. In Ferno et al. [36], CO foam was found to have a higher recovery efficiency when compared to the injection of CO gas in fractured core samples. The authors attributed this to an improved viscosity of the propagation front.
3. Overview of Foam
3.1. Foam Structure
Foam has been given a variety of definitions and descriptions by various authors. However, they all agreed on one thing—“the result of a gaseous phase dispersing into a liquid phase”. In essence, the foam will be formed if a gas and a liquid are mixed. Usually, a foaming agent such as surfactant is used to prepare the liquid phase. Due to their broad use in everyday life and industrial importance, foams have long been of significant interest. A few examples are included in Table 1 below:
The foam may be applied in the petroleum industry at several stages, including well drilling, reservoir injection, and oil production. Foam as an oil recovery agent is the main emphasis of this work. Bond and Holbrook [51] first proposed the idea of using foam as an oil recovery technique, when the authors showed how to generate foam in an oil reservoir by sequentially injecting gas and an aqueous surfactant solution to improve sweep efficiency.
Foam bubbles are linked by very thin liquid layers, known as lamellae [52]. The plateau boundaries resemble liquid tubes at the junctions of the lamellae. Each lamella is in contact with the liquid phase and its neighboring lamella [53]. The lamellae result in continuous liquid phases since lamellae are connected throughout the foam channels and make up the primary components of foam generation and stability. An illustration of the foam structure is shown in Figure 5 below:
3.2. Classification of Foams
3.2.1. Based on the Structure and Phase Arrangements—Wet and Dry Foams
When gas bubbles are injected into a liquid more quickly than they can evaporate, a foam structure will always form. A brief dispersion can still develop even though the bubbles will coalesce as soon as the liquid between them drains away. Wet foam is made up of sphere-shaped bubbles that are spaced apart [54,55]. The spherical bubbles in foam change into foam cells with polyhedral forms and are separated by almost flat liquid layers. This results in dry foam [56]. The surface tensions along the liquid films cause the arrangements of films to align at equal angles. The bubbles organize themselves into a polyhedral structure so that along the lamella border, three lamellae always align at an angle of (Figure 6). The point where they meet is referred to as the plateau border [57].
3.2.2. Based on the Formation Volume—Bulk Foam and Foam in Porous Media
Bulk foam is defined as a volume of foam that is significantly larger than the size of the individual bubbles. Because the bubble size is very small compared to the size of flow channels, bulk foam is typically considered a homogeneous phase in which the liquid and gas phases have similar velocities [58]. Bulk foam is usually used in characterizing foamability, which is the ability of a foaming solution to form a foam. Bulk foam can be generated to carry out static tests that can be used for screening different parameters, such as the type of surfactant, concentration, salinity, temperature, and the effect of crude oil composition.
Foam in porous media, on the other hand, refers to the generation of foam for evaluating its conformity and performance in porous media. Usually, glass bead pack, core samples or microfluidic chips are used to represent the porous media [59]. In the porous media, foam can be produced in three different modes [9]:
- In situ: direct injection of the liquid and gas phases into the porous medium simultaneously;
- Pre-generated: injection of pre-generated foam using a foam generator or another mechanical device;
- Surfactant-alternating gas (gas): alternate injections of gas and liquid phases into the porous media.
3.2.3. Based on Gas Quantity—Low Quality and High Quality
Foam quality refers to the ratio of gas volume to foam volume at a particular pressure and temperature [60].
where = foam quality, %; = volume of gas, mL; = volume of liquid, mL.
Low-quality foam is typically described as having a quality of up to 52%. In this instance, the gas bubbles are spherical and rarely come into contact with one another. Since there is a lot of free fluid in this system, foam viscosity is low and will affect the capacity of the system for fluid loss. High-quality foam, on the other hand, has a quality between 52% and 96% [61]. Because the gas bubbles are coming into contact with each other more frequently, the viscosity will increase the foam of high-quality polygonal bubbles, and is known as Polyederschaum; a foam of low quality produces bubbles that are roughly spherical and are separated by a thick layer known as kugelschaum [62,63].
3.2.4. Based on The Lamella Numbers
The lamella number (L), a measure proposed by Schramm et al. [64], is used to determine the extent of oil imbibition into foam lamella. Different types of crude oil cause foam to behave differently, and oils are normally considered to have a negative impact on foam stability. The following three metrics, spreading coefficient (S), entering coefficient (E), and bridging coefficient (B), can be used to conduct a qualitative investigation of the phenomena. Below is a definition of the formulas:
where = interfacial tension, mN/m; = oil, water, and gas indices, respectively.
Thus, Schramm et al. [64] suggested the relationship below:
Foams were divided into A, B, and C (based on the values), representing L < 1, 1 < L > 7, and L > 7, respectively. The most stable foams, those that do not react with oil, are Type A foams. Both E and S have negative values for them. Type B foams are relatively stable and have negative S and positive E values. In this case, foam lamellae interact with oil, yet they do not collapse. Type C foams have positive values for S and E and are unstable. These foams frequently absorb oil, which causes the foam lamellae to separate.
4. Role of Surfactants in Foams Generation
Surfactants arrange themselves at the gas–liquid interface when they are dispersed in water, with the hydrophilic heads staying in the liquid phase and the hydrophobic tails extending out of the liquid phase (Figure 7). The surfactant monolayer then acts as an additional mass to oppose the diffusion of a substance across it, which helps to reduce foam coarsening [65].
Due to their ability to change the wettability of rocks, surfactants have a significant impact on foam generation. Wettability is a crucial factor that significantly influences oil recovery in reservoirs that fully or partially use chemical EOR techniques [66,67]. The propensity of a fluid to spread preferentially onto a solid phase when additional fluids are present is known as wettability.
Typically, the contact angle is used to describe the wetting properties. The rock is considered water-wet if the contact angle is between 0 and 75; intermediate-wet if it is between 75 and 115; and oil-wet if it is between 115 and 180 [68]. In foam-EOR, wettability alteration is crucial, especially when the foam is intended to recover oil after primary and secondary EOR procedures, which typically fail to mobilize trapped oil due to high capillary forces. Furthermore, since the viscous forces in the porous media are ineffective at displacing oil, the majority of unswept oil is retained in the low permeability zone of the rock, leaving an imbibition process as the only effective method of oil recovery. Surfactants can considerably alter the wettability of rock surfaces depending on their hydrophilic head charges.
Two processes of surfactant-induced wettability modification in carbonate reservoirs were presented in the works of Standnes et al. [66,69]. They include removing the oil-wet layers to reveal the original water-wet layers beneath, and adding a water-wet layer on top of the oil-wet ones. The first is better suited for cationic surfactants and the second for anionic.
Reduction of the interfacial tension is another function of surfactants in foam-EOR. In oil reservoirs, the capillary, viscous, and gravitational forces interact to some extent to control the rate of oil recovery [70]. The following equations describe the relationship between these three types of forces:
A decrease in capillary forces results in a desirable value for the bond and capillary numbers in each of these equations. The following equation describes the capillary force as a function of the IFT between oil and water:
where = interfacial tension between oil and water, mN/m; = contact angle, degrees; r = pore radius, mm.
Morrow et al. [71] assert that the bond number is crucial and that lowering IFT may have either a good or negative impact on imbibition. Although a drop in capillary imbibition may result from a reduction of IFT, imbibition can still happen as a result of gravitational forces. This demonstrates the strong correlation between capillary and gravitational forces and the IFT value. Surfactants decrease IFT, which weakens the capillary adhesive forces that hold trapped oil in the porous media. As a result, oil droplets pass through pore throats more easily and move in the direction of the displacement front [19].
A recent test on spontaneous imbibition by Mohammed et al. [68] involved a cationic surfactant and limestone core samples. The findings showed that when the core samples were subjected to distilled water, the oil-wet nature of the core samples and the negative capillary forces resisted the gravitational forces. When the core was subjected to a cationic surfactant solution, the same outcomes were attained, and oil recovery was not noticed until 10 days had passed. This is a result of the wettability alteration, which improved capillary imbibition.
5. Governing Mechanisms of Foam-EOR
5.1. Mobility Control Mechanisms of Foam-EOR
Foam exists as a gas–liquid mixture in the porous media, where the liquid continuously wets the rock and the lamella causes the gas to become discontinuous. The foam is introduced to develop a system that would enable uniform gas mobility for oil recovery in porous media. Its mechanisms are discussed below.
Gas mobility can be controlled with foam by stabilizing the displacement front. As previously discussed, viscous, capillary, and gravity forces are difficult to manage in gas EOR, therefore, surfactants are introduced as chemicals to minimize viscous instability. Foam stabilizes the displacement front by bubble movement and rearrangement of the bubble interfacial area [72]. A bubble requires more pressure to move at a constant rate than an equivalent volume of liquid. This, therefore, increases the actual velocity of the gas. Similar to how surfactant movement at the gas–liquid interface causes a surface tension gradient to delay bubble motion, viscosity is also increased by surfactant mobility [73]. At the pore scale, the wetting phase takes up the smallest pore channels while foam continues to flow through the high permeability and porosity zones. There is a significant amount of gas trapped in the averagely-sized pores. As a result, the pore space that is expected to be filled up with gas will be blocked, which lowers the relative gas permeability [74].
Foam can also be used to control gas mobility by reducing capillary forces. In Zhang et al. [75], the authors injected CO into a micromodel. The methodology employed in this work consists of a core flooding setup where cores packed with cleaned sand at a back pressure of 3.5 MPa and temperature of 27 C was used to evaluate the performance of foam injection. Their findings, however, indicated that the residual oil trapped in the model could not be displaced by CO since oil and gas had a high mobility ratio. This result underlined the necessity to first emulsify the oil in order to separate it from the porous media, which can be done by introducing a chemical phase that can reduce interfacial tension and result in the development of oil-water emulsions at the displacement front. More oil and water are solubilized to form emulsions when the chemical phase moves through the porous media, which leads to the mobilization of oil.
There are other parameters involved besides IFT reduction to achieve a considerable change in the capillary number. The parameter, known as the contact angle in Equation (9), can be used to characterize wettability. The interactions between surfactants and the solid surface of the porous medium cause wettability to change during a foaming operation. The adsorbed surfactant on the surface lowers surface tension and changes the ability of the rock for wetting with water or oil. Although surfactant adsorption on the rock is important, it is not necessarily sufficient to change wettability. The degree to which this is necessary depends on several parameters, including the original wettability of the rock, the structure, the type and the concentration of the surfactant, residual oil properties, and brine salinity.
In [76], visualization of the oil-wet micro-cell and core flood tests were performed. It was revealed that when the porous media was oil-wet, much fewer bubbles were produced due to lamellae detachment and collapse. Similarly, investigations by Sanchez et al. [77] in oil-wet porous media showed that foam formation is a result of the wettability alteration from oil-wet to water-wet. These arguments suggest that a water-wet system is the best wettability condition for foam generation. However, the results of Lescure et al. [78] contradict this. The experiments involved a foam flood and a comparison of wettability measurements. The findings revealed that as a result of significant surfactant adsorption in a water-wet medium, foam is more effective in an oil-wet medium than in a water-wet one. However, in order to develop a valid theory, a wide range of concentrations must be thoroughly investigated. Future research should also take into account a foaming agent that performs well in both water- and oil-wet environments.
The last mobility control mechanism with foam is improvement in interfacial mass transfer. It is known that foam increases the possibility of gas interactions with oil since it can control gas mobility in a porous medium. This is a beneficial mechanism for gases, particularly CO, because mass component interchange greatly boosts miscibility and, consequently, oil recovery. Furthermore, foam might result in large flow resistance and a longer retention period for gas in the porous media. This means foam can prevent or completely stop gas fingering, mobilizing oil by reducing its viscosity and swelling. This is consistent with the findings of Farajzadeh et al. [79], where the authors stated that the addition of surfactant at a high pressure significantly improved the mass transfer of CO into water and oil.
5.2. Mechanism of Foam Generation in the Porous Media
The size and distribution of the pore throats have a significant impact on foam generation in the porous media, because foam bubbles can be filled into one or more of the pores. In the porous media, foam exists as a discontinuous phase. To visualize and pinpoint the primary mechanism of foam generation in the porous medium, Ransohoh et al. [80] conducted glass bead tests at the pore scale level. These mechanisms were further verified by Almajid et al. [81] in their study using silicon micromodels.
The first of these mechanisms is Snap-off (Figure 8). It is the dominant mechanism for generating foam bubbles in porous media and the most probable foam generation mechanism during the co-injection of liquid and gas phases. It is a mechanical process that takes place repeatedly during a multiphase flow in porous media [82]. It is referred to as a mechanical process because it involves the formation of foam bubbles in the pore throat by the wetting phase due to the flow of gas bubbles through the pore throat [80].
When the gas phase reaches the liquid phase-filled throat, it is blocked at the upstream side by the pore throat. When the capillary entry pressure is surpassed, it causes the interface to become curved and increases the capillary pressure, allowing the generated foam bubble to flow through the pore throat. The pressure inside the foam bubble lowers as expansion occurs at the interface, and a wedging layer is created as a result of a negative capillary pressure gradient [83,84]. Thus, a foam bubble is snapped off and the liquid is forced into the pore throat from the pore body. An important criterion for snap-off to occur is that capillary pressure at the throat must be higher than capillary pressure at the front of the interface. Notable, the ratio of pore body to pore throat needs to be approximately higher than 2 for this to happen [80].
The second mechanism is lamella division (Figure 9). Large bubbles split into smaller ones during lamella division. This happens when the interface stretches around the branching point as illustrated in Figure 9, and the flow of foam bubbles branches in different directions as a result of this [80]. Foam generation with the lamella division mechanism requires a pre-generated foam with a large bubble size to pore body ratio to be injected into the porous medium. Moreover, there must be a significant pressure gradient for the lamella to divide [85].
As seen in Figure 10, the leave-behind occurs when two gas menisci enter the adjacent branching pore bodies that are filled with liquid.
In the snap-off and lamella division mechanisms, the formed lamellae are relatively perpendicular to the direction of flow [84]. The lamellae from leave-behind, on the other hand, are parallel and are frequently related to a continuous gas phase that is present at the start of a foam flooding operation [80]. The invasion of two or more gas fronts from different directions into a liquid-saturated medium causes the leave-behind mechanism, unlike the snap-off and lamella mechanisms, to produce less stable and weaker foams. This causes the generation of continuous gas bubbles, which build up to create parallel rows of many lamellae and obstruct the passageways, creating dead-end paths. Generally, foam generation by the leave-behind mechanism is not recommended because it results in the generation of weak and unstable foam [82].
Pinch-off is another mechanism for foam generation that was found in microfluidic channels by Liontas et al. [86]. While neighbor-neighbor pinch-off is caused by two neighboring bubbles, neighbor-wall pinch-off happens when a bubble is pinched off by the adjoining bubble and the walls of the channels [86]. These mechanisms occur at a high capillary number.
5.3. Mechanism of Foam Instability
All foams have significant surface tension, which makes them thermodynamically unstable. Foam requires more effort to be generated and becomes less stable when surface tension increases [87]. Gas diffusion (Ostwald ripening, bubble disproportionation) is the most crucial mechanism since it underlies all the other mechanisms (drainage and coalescence), making it the cause of foam instability. The stages that foam can go through before being completely destroyed are depicted in Figure 11. While some foams undergo the whole stages, others collapse as a result of an external disturbance [88].
In order to explain gas diffusion, let us consider Figure 12 below:
Points P1, P2, P3 represent arbitrary points within a foam bubble, outside of a foam bubble, and in the foam film respectively. Thus, the differential pressure between points in and outside of a foam bubble can be represented by the Laplace equation presented below:
where and represent pressure in and outside the foam bubble respectively, MPa; is the surface tension, N/m and R is the bubble radius, m.
The theory of surface tension postulates that the pressure inside the bubble is higher than the pressure outside due to surface tension, which tries to reduce the surface area and needs to be counterbalanced so that the bubble does not collapse. Thus, since there is no pressure difference over a flat contact, the pressure in the film must be higher than the pressure outside the bubble [89].
The repulsive interaction between the two surfaces, which may have an electrostatic origin as a result of the ionization of the surfactant head groups, is solely responsible for the pressure increase in the film [87,90]. As a result, the plateau border experiences lower pressure, which acts to drain liquid from films between bubbles and increase the risk of collapse.
Additionally, for smaller bubbles, the pressure and solubility of the dispersed gas phase are higher. Diffusion from small gas bubbles to bigger ones or the bulk liquid phase is, therefore, driven by a force [88]. The solubility of the dispersed gas phase in the continuous liquid phase affects the rate of diffusion. For instance, foam in carbonated drinks exhibits this behavior, where more bubbles quickly arise after the first foam generation occurs when the drink is poured into a cup.
Note that a bubble has a higher pressure than the gas around it and that this pressure increases as the bubble becomes smaller. A wider bubble size distribution results from gas diffusion from small to large bubbles over time. This can be quantified using Henry’s law to assess gas solubility in the liquid [91].
6. Factors Affecting Foam Stability
Several changes start to occur as soon as foam is generated. Through gas diffusion in the continuous phase, the smaller bubbles continue to enlarge and may eventually dissolve to result in disproportionation and Ostwald ripening. The bubbles emulsify quickly and separate to form a foam layer on top of a bulk liquid. The liquid then drains from the foam into the bulk liquid and the lamella between foam bubbles breaks, which causes the bubbles themselves to distort one another and form a polyhedral foam, leading to bubble coalescence.
6.1. Gibbs–Marangoni Effect
As was noted in earlier sections, pure liquids cannot produce stable foam in the absence of a surfactant. When gas is put into a liquid phase (just water), as soon as all the water has been drained away, it coalesces almost instantly. Contrarily, the liquid–gas interface expands in the presence of surfactant solutions, upsetting the equilibrium at the surface, and a restoring force known as the Gibbs–Marangoni effect emerges to restore the equilibrium [92,93]. A dilatational elasticity is created because of a surface tension gradient that is present, due to the surfactant. This is known as Gibbs elasticity [94]. The flow of surfactant molecules from the bulk liquid to the interface is then caused by the surface tension gradient. This phenomenon is referred to as the Marangoni effect [92]. Thus, the Gibbs–Marangoni effect stabilizes the foam by preventing the thinning and disturbance of the liquid film between the gas bubbles.
At various surfactant concentrations, the maximum foaming behavior is perfectly explained by the Gibbs–Marangoni effect. Surfactant molecules near the interface cause the surface area of the foam bubble to increase, which in turn creates an inward strain. Because the gradient moves the surfactant to the areas with thinner layers, the concentration of surfactant at the interface decreases proportionally as the surface area increases [95]. Foamability will, therefore, be quite low. This is why the surfactant concentration reduces in a foaming system when a stable film expands.
Due to the substantial supply of surfactant that diffuses to the surface at high surfactant concentrations, the differential surface tension relaxes too quickly. It also creates a very thin coating with low foamability, giving the restoring force enough time to balance out the conflicting forces. The maximum foaming ability is produced at the intermediate surfactant concentration range [95,96]. Gibbs–Marangoni effect can therefore affect foam stability due to the surface tension phenomenon.
6.2. Interfacial Tension
The gas–liquid interface, which separates the dispersed and continuous phases, is a tiny intermediate boundary, as was previously mentioned. Due to the large surface area of the gas bubbles, they have high surface energy [94]. However, relatively low interfacial energy is required to produce stable foams. Surfactants or any other additive that can reduce interfacial tension is added to achieve this. Another method to achieve this is to supply enough mechanical energy by mixing or agitation.
Due to the synergy between surface energy and foam stability, interfacial tension is crucial to foam-EOR. Hosseini-Nasab et al. [97] describe a foam technique for mobilizing residual oil following water flooding. This was accomplished by combining two anionic surfactant formulations, the first of which was used to achieve a low IFT and the second was used to create a stable foam by co-injecting CO and N gases. According to their findings, a lower IFT resulted in significantly higher oil recovery with a smaller mobility reduction factor. In reality, the authors claimed in their conclusion that the ultralow IFT reduction was the main mechanism for one of the generated foam variants. This proves how crucial IFT reduction is during foam-EOR.
Similar findings were made by Yekeen et al. [98], where it was discovered that a significant decrease in decane-liquid IFT improved foam stability. This improvement was attributed to adsorption and tighter packing of the adsorbed surfactant molecules at the gas–liquid interface, foam lamella, and plateau borders. The strength of the film is necessary for a foam system to be stable. Indeed, IFT needs to be decreased to an ideal amount in order to improve oil displacement via foam injection. By increasing the concentration of the surfactant, IFT reduces and a more stable foam can be generated.
6.3. Gravitational Drainage
Gravitational drainage is a crucial process in foam stability because it involves the interaction of viscous gas flow, surfactant molecule diffusion and convection, and their adsorption at the film interface [99]. Gravitational effects are very important in the generation of stable foams because they control how much liquid is drained from the foam. When the foam is sufficiently stable, it dries out and a vertical pressure gradient in the liquid balances the gravitational force, resulting in a vertical profile of the liquid component. Liquid drainage causes the liquid layers to thin out, which causes the foam bubbles to coalesce. Additionally, the gravitational impact of liquid moving from top to bottom due to gas diffusion through the liquid layers causes the foam to dry up and become unstable [100].
6.4. Wettability
Surfactants can change the rock wettability from being oil-wet to more water-wet. On oil-wet rock surfaces, foam formation via a snap-off mechanism is typically restricted. This is because the film on the surface needs to be continuously wetted, which is necessary for the passage of liquid from the pore body to the pore throat, and a prerequisite for the snap-off [80]. If the surfactant adsorption is insufficient, the lamella may still become unstable on the oil-wet surface following foam generation. Since the film is continuously wetted, the lamella is initially stable across the water-wet surface. The surfactant monomers can, however, adsorb at both the gas–water and water-oil interfaces as the lamella moves toward and over the oil droplet or a wet surface. This leads to a larger disjoining pressure and a more continuous film on the surface [101]. Alternately, the oil droplet may enter the gas–liquid interface if the film that separated the gas bubbles from the oil droplet is unstable, which would result in the lamella pinching off.
The effect of wettability on foam stability and generation has been investigated experimentally by several authors. Flooding tests were performed by Kanda et al. [102] using glass bead packs that were either oil- or water-wet. The results showed that the foam in the oil-wet system was unstable. They asserted that the oil-wet surface had caused the foam films at the pore throats to become unstable.
Similar to this, Kuhlman et al. [103] and Kristiansen et al. [104] reported poor foam stability in oil-wet pores. In oil-wet porous media, foam generation and stability can be limited, but it is also feasible that foam can be produced and stabilized. This may occur if the surfactant adheres to the surface and changes the wettability toward more water-wet. This argument is supported in the work of Sanchez et al. [77] where it was revealed that wettability modification toward water-wet is a crucial condition for generating stable foams. According to the findings, the residual oil prevented the oil-wet system from changing its wettability since the surfactant components were less effective at doing so because they were concurrently adsorbing at the oil-solid and water-solid interfaces. Similar findings were made by Mannhardt et al. [105] where it was illustrated that weak and unstable foams were generated when the cores were intermediate-wet with residual oil.
6.5. Oil Presence
The ability of foams to remain stable for as much time as possible in the reservoir when coming into contact with oil is one of the difficulties of foam-EOR. This is important for achieving favorable mobility control as well as a favorable oil recovery rate. Experimental studies have demonstrated that some of the components in the oil phase cause foam to become more unstable in the reservoir. Low molecular weight oil dispersed in the surfactant solution, according to Aveyard et al. [88], shortens the half-life of the foam. However, experiments by Mannhardt et al. [105] demonstrated that stability in the presence of oil can be increased if the foaming agents are properly selected and screened. The authors noted that the tolerance of foam to oil increased with the addition of fluorinated surfactants to various types of hydrocarbon surfactants. Additionally, a group of foam flow studies was carried out by Pu et al. [106] in which foam was generated in the porous media and showed greater stability when oil with a larger molecular weight was present. The spreading of oil droplets is a common mechanism by which oil droplets affect foam stability. According to the proposed theory, oil droplets squeeze between the film surfaces during foam generation spread over one of the film surfaces, breaking the lamella. Nikolov et al. [107] provided evidence for this. The authors reported that the process of oil solubilization from the oil phase into the micelles contained in the liquid phase might play an important role in foam stability.
Farzaneh et al. [65] explained that the pseudo-emulsion film influences how much oil affects foam stability. This is the aqueous film that forms between the gas and oil phases in the foam system. While an unstable pseudo-emulsion film will have a detrimental stabilizing effect on foam, a stable pseudo-emulsion film can stabilize foam and even increase stability as oil saturation increases. The authors explained that the oil droplets will drain more slowly in the plateau borders than in the surrounding aqueous phase due to the buoyant force of the oil droplets and the obstacle to their movement within the plateau borders. Therefore, the plateau borders are rather thick and can delay liquid drainage when a stable pseudo-emulsion film is present. If the films are unstable, however, the oil droplets agglomerate on the plateau edges and grow larger as a result of more foam drainage.
6.6. Thermobaric Conditions
The two key reservoir parameters that determine the stability of foam are pressure and temperature. An increase in pressure is advantageous to foam stability, according to many studies. This is because there will be more resistance to liquid drainage and Ostwald ripening as pressure rises since the liquid layers grow larger and stronger [9,58]. Additionally, as pressure rises, less gas will diffuse between the lamellae, thus increasing foam stability. Wang et al. [108] demonstrate this (Figure 13) phenomenon.
In this study, the performance of foam under high pressure and temperature conditions was investigated using a visualizing foam meter. The setup mainly consists of a high-pressure cell, a fluid injection system, and observation windows for measuring foams generated in the visual chamber. Under pressure varying from 6 to 14 MPa, six surfactants were examined, and their half-lives were used to assess the stability of the foam. CO and N were co-injected to generate foam.
According to the authors, increasing pressure will generally increase the density of gas and make it more hydrophobic, which can aid in the embedding of the surfactant hydrocarbon tails into the oil phase.
Oppositely, temperature increase generally causes a decrease in foam stability because the half-life is reduced. This is due to the fact that when the temperature rises, the liquid phase has a greater tendency to evaporate, which causes the bubbles to quickly collapse and release the gas they contain [60,92]. Furthermore, when the temperature rises, the gas phase becomes more soluble and the interfacial strength between the gas and liquid phases decreases. This causes the foam to become more unstable by increasing liquid drainage [60]. The viscosity and elasticity of the foam lamella will decrease at higher temperatures, which will have a significant impact on the performance of the foam although the extent of the deterioration of foam stability may depend on the chemical composition or hydrocarbon chain length of the foaming agent used (Figure 14).
The work of Wang et al. [109] also demonstrates how temperature affects foam stability. Experiments were carried out to investigate the influence of temperature on the stability of foams generated from different types of surfactants. Although the authors highlighted that anionic surfactants are less impacted by temperature compared to cationic and non-ionic surfactants, foam stability decreased with increasing temperature in all cases. They attributed this to decreased surface viscosity, which led to quicker liquid drainage at higher temperatures. The results of Liu et al. [110] further support this. The authors of this study demonstrated that at higher temperatures, bubble size increased uncontrollably, which caused a rapid collapse.
6.7. Salinity
The percentage of salt ions in the liquid phase is another parameter that has a deciding impact on the stability of foams. At high salinity, the presence of salt ions in the bulk fluid reduces the surface potential at the gas–liquid interfaces, hence reducing the repulsion between the two layers [60,111]. Increased salinity, in this case, causes a decrease in double-layer repulsion, which promotes liquid to drain from the foam lamella. As a result, foam stability decreases as salinity increases.
The ionic interactions between the foaming agent (surfactant) and salt can determine how foam behaves. Consequently, depending on the strength of the interactions, foam stability can be improved or worsened [112]. To illustrate the effects of salt on foam stability, both positive and negative effects are discussed below.
In the work of Bello et al. [60], the foam was generated using 0.3 wt.% of AOS surfactant with salinity ranging from 0 wt.% to 15 wt.% MgCl. Figure 15 below demonstrates that foam stability is only improved at low salinity, and stability degrades when a salt content goes above 2%. The authors attributed this to the forceful deposition of additional ions on the surface of the foam film, which led to a partial neutralization of the electric charges. This decreased the electrostatic repulsion and hence made the foam films unstable.
The findings of the study by Le et al. [113] appear contrary. The authors investigated the stability of foam under dynamic conditions for salinity ranging from 5 to 25 wt.% NaCl. Ethomeen C was employed as the foaming agent. According to their findings, the foam was noticeably more stable at higher salinity (Figure 16).
According to the authors, the success of this interaction at higher salinity was due to the compression of the electrical double layer and an increase in the maximum disjoining pressure at higher salinity. Bello et al. [60] asserted that bubble coalescence typically begins early in many surfactants at high salinity conditions, which worsens the foam stability. However, in the work of Le et al. [113] where Ethomeen was used, the ionic interactions between the protonated amine headgroups with the Cl counter ion strengthened the molecular density of the surfactant.
7. Laboratory Studies of Foam-EOR
The harsh conditions of reservoirs, as was covered in earlier sections of this work, have the biggest negative impact on the stability of foam and its use as an oil recovery agent. This has piqued the curiosity of researchers, who are stepping up attempts to find solutions for foam instability. This section only focuses on the investigations of foam-EOR in the laboratory and thus, advances in improving foam stability will be discussed in a section below.
In order to assess the potential of foam as an EOR agent, Haugen et al. [114] described tests including the application of foam in low permeability, oil-wet core samples. According to the findings, less than 10% of the oil was recovered with water, surfactant, or gas injection. On the other hand, pre-generated foam injection was able to recover up to 78% of the original oil in the core. The authors attributed this to poor gas mobility in the fractured rock, which led to an increase in differential pressure and a diversion of flow toward the oil-saturated matrix.
To study the impact of injection mode on foam-EOR, John et al. [115] presented investigations comprising laboratory experiments and numerical modeling. Pre-generated foam was injected into the core sample at 34 MPa and 55 C. The findings indicated that CO foam, as opposed to pure CO and WAG, can recover more oil after flooding with water. The results of their numerical simulation were also similar. The calculated mobilities demonstrated the improved efficiency of CO foam as a blocking agent, reducing CO mobility while increasing its effective viscosity.
An ultra-low interfacial tension foaming agent was used by Kang et al. [116] for the dual purpose of reducing oil-water IFT and enhancing foam stability in core samples containing heavy oil. In order to lower IFT and increase foam stability, the authors employed commercially available surfactants, modified natural carboxylates, and partially hydrolyzed polyacrylamides. The gas phase used was nitrogen. Their results showed that foam flooding can also be applied in heavy oil as ultimate oil recovery was improved to approximately 23% initial oil in place over waterflooding recovery. The authors attributed this to the ultra-low interfacial tension between oil and water as well as an effective mobility control.
The foam was used as a thermal EOR technique by Chen et al. [117]. The paper focuses on an investigation of the viability of a foam-assisted SAGD (FASAGD) through numerical simulation. Their simulation results demonstrated that a significant volume of stable foam was generated and accumulated in the area between the wells. Additionally, the inclusion of steamed foam helped in limiting steam breakthrough and produced superior recovery results than the traditional SAGD. Cumulative oil recovery was increased by roughly 30% with FASAGD compared to the cases without foam (Figure 17).
A comprehensive summary of laboratory foam-EOR experiments is given in Table 2 below:
8. Field Applications of Foam-EOR
Many pilot studies have been carried out on foam flooding as a promising EOR method for depleted oil fields. According to Yang et al. [155], three categories of factors mainly influence the performance of foam injection during pilot tests. These include characteristics of the target formation, the chemical composition of the foam and, lastly, the injection scheme and foam quality.
Blaker et al. [156] and Skage et al. [157] reported the Snorre foam injection, which is regarded as the largest foam application in the petroleum industry. The Snorre oil field is located in the Norwegian part of the North Sea. The formation’s permeability ranges between 400 and 3500 mD, and the oil viscosity is 0.789 cP. The reservoir temperature was reported as 90 C. Waterflooding was first implemented in this field; however, after two years, a WAG pilot project with two injection wells and three production wells was launched. The injection gas used was a mixture of hydrocarbon gas with a high mole fraction of intermediate components. After some time, one of the producing wells had an early gas breakthrough, prompting foam injection. C alpha-olefin sulfonate was used as a surfactant to generate foam. A packer was used to mechanically segregate the foam in the intended high permeability layer. The injection rate was regulated to ensure that the fracture pressure was not exceeded. Skauge et al. [157] stated that there were no major operational issues during the injection of foam chemicals and gas and that the oil rate increased. Foam injection was estimated to have produced around 250,000 sm of oil.
In the Huan-Xi-Ling oil field, nitrogen foam flooding was implemented. The subsea depth of this formation is 1080 m. The average porosity and permeability are 1065 mD and 29.7%, respectively. It is a heavy oil field with oil viscosity ranging from 110–129 cP. Skauge et al. [157] reported that steam flooding was initially utilized in this reservoir, and pilot foam injection was only started after the cumulative recovery factor reached 33%. The pilot injection was allowed to run for 33 months. During that time, there was a recovery of 5.5% of OOIP. The pilot area was then enlarged to a 9-well pattern for a total of 54 months. During this time, the total oil recovery was estimated to be 9.75% of OOIP. Compared to water injection wells, foam injection wells had higher injectivity and a higher oil production rate. This shows that foam injection is not just for enhancing sweep efficiency in gas flooding; it can also increase oil production following steam and water flooding cycles.
Foam flooding in Russian oil fields has only been mentioned in a few publications. In an oil field in Western Siberia, foam treatments using viscoelastic surfactants, crosslinked polymer, and nitrogen foam were described in Oussoltsev et al. [158]. Even though it was used as a hydraulic fracturing fluid, where the generated foam gave promising results. Longer effective lengths of fractures and higher fracture conductivity were achieved due to the improved rheological properties of the foams and high conductivity due to the high gas phase.
Saifullin et al. [159] provided the closest reference to non-hydraulic fracturing foam operation. The field studied was the Messoyakhskoye oil field, operated by Gazprom Neft. Gas channeling from the gas caps in the producing wells has been causing problems for the operators. The authors explored how foam may be employed as a gas-blocking agent in both production and injection wells. Their findings showed that foam injection might be used to mitigate early gas breakthroughs in production wells.
Table 3 summarizes some of the foam injection pilot tests that have been conducted.
9. Advances in Foam-EOR
The biggest challenge with the implementation of foam-EOR is foam stability, and in order to solve this instability, various researchers have proposed and investigated different methods to advance foam-EOR.
Nanoparticles have been introduced into the liquid phase in various experiments because of their ability to improve foam stability. This is because nanoparticles can be irreversibly adsorbed into the fluid due to their high adsorption energy as well as high chemical and thermal stability [183]. Thus, they serve as stabilizing agents which can provide optimal conditions with respect to temperature, pressure, and salinity. Surface-coated silica nanoparticles have been found to stabilize emulsions, thereby improving phase mobility [184,185]. Binshan et al. [186] found that hydrophilic silica nanoparticles may change the wettability of rocks and lower interfacial tension, suggesting that they can be employed as EOR agents. In the experiments conducted by Hendraningrat et al. [187], their optimum nanoparticle concentration was 0.05 wt.%. The authors further stated that the smaller the nanoparticle size, the higher the oil recovery, although this does not apply to all cases. Furthermore, nanoparticles have been shown to create adsorption layers on the rock surface, considerably altering the wettability and interfacial tension of the formation [188,189].
Several studies have suggested several mechanisms to explain the enhanced oil recovery of nanoparticles. Al-Anazi et al. [25] claimed that an increase in recovery factor was possible because of the tiny size of nanoparticles, which allows them to absorb and de-adsorb easily while being transported through the reservoir. When the attraction force is greater than the repulsive force, adsorption occurs. Diffusion and convection also play a role in nanoparticle transfer in the pores. The authors further stated that pore throat clogging is caused when the size of the nanoparticle is bigger than the pore throat of the porous medium.
The mechanism of wettability change in surfactants is similar to that of nanoparticles [190]. Wettability is a key factor that affects oil displacement. It refers to the capacity of a fluid to adhere to a solid surface in the presence of immiscible fluids. Changing the wettability of the rock from strongly oil-wet to water-wet is highly important for most EOR operations. In the case of nanoparticles, they change rock wettability by replacing carboxylic particles on the rock surface and forming a wedge layer that pushes out residual oil due to disjoining pressure. Furthermore, as nanoparticles adhere to the rock surface, they create textured surfaces that act as a buffer, separating and releasing oil droplets from the porous medium, and this results in increased oil production.
In [191], the adsorption of nanoparticles on the porous medium resulted in forming a composite nanostructure surface with improved water-wetting properties. Furthermore, Jun et al. [17] studied the influence of hydrophilic and lipophilic polysilicon nanoparticles on the wettability of a polished synthetic-silica surface at various concentrations. The findings are consistent with those of Hendraningrat et al. [187], which assert that increasing the concentration of nanoparticles reduces the contact angle of crude oil and changes the wettability to a more water-wet state. The authors believe that smaller nanoparticles tend to lower the contact angle more than larger nanoparticles due to stronger electrostatic repulsion on smaller sizes.
The disjoining pressure is another interaction mechanism between nanoparticles and the porous medium that improves oil recovery [192,193]. This refers to the attraction and repulsive force between thin layers at the surfaces of two fluids [194]. Figure 18 below shows that nanoparticles form microstructures in enclosed areas, such as foams, gels, and emulsions. This adds a third interface to the two that already exist. By increasing the entropy of the total dispersion, nanoparticles distributed in the liquid tend to form wedge-shaped structures to facilitate a push toward the oil-rock interface, thereby allowing greater freedom for the nanoparticles in the bulk liquid [195].
A recent work carried out by Bello et al. [60] describes a comprehensive set of CO and N foam stability experiments in the presence of silica nanoparticles. The experiments were conducted at ambient and elevated temperatures and with a wide range of salinity. As it can be seen in Figure 19, their results showed that indeed, nanoparticles can increase foam stability by reinforcing the thin liquid film between foam bubbles, thereby reducing liquid drainage rate and forming a stronger and more stable foam.
Ionic liquids are a new group of chemical blends that can be used to improve foam stability. According to Khan et al. [196], the key benefit of an ionic liquid is its stability in high temperature and high salinity reservoir conditions. Ionic liquids can also significantly lower IFT and change wettability. Nandwani et al. [197] studied the potential application of ionic liquids for IFT reduction and enhanced oil recovery. Ionic liquids of 1-alkyl-3-methyl imidazolium bromide was used and compared with a typical cationic surfactant, CTAB. Their findings demonstrated that ionic liquid lowered IFT more effectively than CTAB, even at low concentrations. Additionally, the residual oil that was trapped in the core after waterflooding, the ionic liquid showed the maximum oil recovery. Further evidence for the promising effect of ionic liquids can be found in Pillai et al. [198]. Ionic liquids demonstrated an ability to lower contact angle by altering an oil-wet rock surface to water-wet, as seen in Figure 20.
The authors attributed this to the formation of an ion pair between the positive head groups of ionic liquids and the adsorbed negatively charged carboxylic groups of crude oil on the rock surface.
Stable active chemicals are required to improve foam-EOR, and research has demonstrated that ionic liquids can meet the needs of the oil industry for foam-EOR approaches.
10. Conclusions
This work provided information on the current status and development of foam-EOR applications by emphasizing the results, current potential, and technical challenges being faced in the lab and the field. The ability to demonstrate how foam can enhance oil recovery in reservoirs with heterogeneous formations has advanced. Although there existed some issues with its use in the field, foam is a significant agent for diverse applications in EOR procedures. The following points can be drawn from this review paper:
- The processes underlying the foam-EOR process continue to be the subject of discussion among different researchers, because diverse distinct mechanisms are responsible for various foam applications, injection modes, and foam formulations.
- A wide knowledge gap still exists in foam generation and stability at high temperatures, pressures, and salinity, despite decades of research on foam-EOR. One of the biggest challenges of advancing foam-EOR to the field is the fact that several earlier research studies were carried out under ambient conditions. Thus, a thorough understanding of foam properties under reservoir conditions is required to obtain optimum results.
- In porous media, the injection mode of foam plays a great role in oil recovery. Foam can be generated outside the porous medium before entering the pay zone with the aid of a foam generator or just downward flow through the tubing (pre-generated foam). Foam can also be generated in situ by co-injection of surfactant solution and gas. Lastly is the SAG foam where foam is generated by alternate injection of surfactant solution and gas. There is a considerable difference between these three methods and should be optimized before foam-EOR operation.
- Pressure has an increasing effect on foam stability as foam bubbles at high pressures are smaller than those formed at low pressures, reducing the propensity to liquid drainage. The temperature on the other hand has a reverse effect as high temperature increases gas diffusion and propensity to liquid drainage and hence reduces foam stability.
- The success of foam-EOR in the field is governed by several criteria, according to the reported field pilot experiments. Thus, thorough laboratory research should serve as a prerequisite for choosing the surfactant. The injection technique should be validated by studies that use a precise reservoir description and foam model.
- To improve the interaction of foam with crude oil in the reservoir, it is crucial to identify the ideal wetting conditions and type of oil.
- Foam bubbles are challenging to maintain due to Ostwald ripening. Thus, it is difficult to generate stable foam for long periods. However, this review paper suggests several approaches, which include the addition of nanoparticles, polymers, ionic liquids, and binary surfactants.
Author Contributions
All authors contributed equally to this work. All authors have read and agreed to the published version of the manuscript.
Funding
This work was supported by the Ministry of Science and Higher Education of the Russian Federation under agreement no. 075-10-2022-011 within the framework of the development program for a world-class research center.
Data Availability Statement
Not applicable.
Conflicts of Interest
The authors declare no conflict of interest.
References
- Johnston, R.J.; Blakemore, R.; Randolph, B. The Role of Oil and Gas Companies in the Energy Transition; Atlantic Council Global Energy Center: Washington, DC, USA, 2020; p. 78. [Google Scholar]
- Oil and Petroleum Products Explained Oil and the Environment; U.S. Energy Information Administration: Washington, DC, USA, 2021; Volume 3, pp. 103–111.
- Sonnichsen, N. Daily Demand for Crude Oil Worldwide. Statista. 2022. Available online: https://0-www-statista-com.brum.beds.ac.uk/statistics/271823/daily-global-crude-oil-demand-since-2006/ (accessed on 20 December 2022).
- U.S. Energy Information Administration. April 2021 Monthly Energy Review; U.S. Energy Information Administration: Washington, DC, USA, 2021; Volume 26, pp. 4–5.
- Martin, F.D.; Colpitts, R.M. Reservoir Engineering; Vol. Sigma: Houston, TX, USA, 1993; Available online: https://0-www-sciencedirect-com.brum.beds.ac.uk/science/article/pii/B9780884156437500091 (accessed on 20 December 2022).
- Gbadamosi, A.O.; Kiwalabye, J.; Junin, R.; Augustine, A. A review of gas enhanced oil recovery schemes used in the North Sea. J. Pet. Explor. Prod. Technol. 2018, 8, 1373–1387. [Google Scholar] [CrossRef] [Green Version]
- Bello, A.; Ozoani, J.; Kuriashov, D. Proppant transport in hydraulic fractures by creating a capillary suspension. J. Pet. Sci. Eng. 2022, 208, 109508. [Google Scholar] [CrossRef]
- Mokheimer, E.M.A.; Hamdy, M.; Abubakar, Z.; Shakeel, M.R.; Habib, M.A.; Mahmoud, M. A comprehensive review of thermal enhanced oil recovery: Techniques evaluation. J. Energy Resour. Technol. 2019, 141, 030801. [Google Scholar] [CrossRef]
- Farajzadeh, R.; Andrianov, A.; Krastev, R.; Rossen, W.R.; Hirasaki, G.J. Foam-oil interaction in porous media-Implications for foam-assisted enhanced oil recovery (SPE 154197). In Proceedings of the 74th European Association of Geoscientists and Engineers Conference and Exhibition 2012 Incorporating SPE EUROPEC 2012: Responsibly Securing Natural Resources, Copenhagen, Denmark, 4–7 June 2012; pp. 4996–5016. [Google Scholar]
- Hirasaki, G.J. Application of the theory of multicomponent, multiphase displacement to three-component, two-phase surfactant flooding. Soc. Pet. Eng. J. 1981, 21, 191–204. [Google Scholar] [CrossRef]
- Somasundaran, P.; Zhang, L. Adsorption of surfactants on minerals for wettability control in improved oil recovery processes. J. Pet. Sci. Eng. 2006, 52, 198–212. [Google Scholar] [CrossRef]
- Emadi, A.; Sohrabi, M.; Jami, M.; Ireland, S.; Robertson, G. Visual investigation of extra-heavy oil recovery by CO2/N2 foam injection. In Proceedings of the 16th European Symposium on Improved Oil Recovery 2011, Cambridge, UK, 12–14 April 2012; pp. 236–255. [Google Scholar] [CrossRef]
- Wang, L.; Tian, Y.; Yu, X.; Wang, C.; Yao, B.; Wang, S.; Winterfeld, P.H.; Wang, X.; Yang, Z.; Wang, Y.; et al. Advances in improved/enhanced oil recovery technologies for tight and shale reservoirs. Fuel 2017, 210, 425–445. [Google Scholar] [CrossRef]
- Moortgat, J.; Li, Z.; Firoozabadi, A. Three-Phase Compositional Modeling of CO2 Injection by Higher-Order Finite Element Methods with CPA Equation of State. In Proceedings of the Reservoir Simulation Symposium, SPE, The Woodlands, TX, USA, 21–23 February 2011. [Google Scholar] [CrossRef] [Green Version]
- Wanniarachchi, W.A.M.; Ranjith, P.G.; Perera, M.S.A. Shale gas fracturing using foam-based fracturing fluid: A review. Environ. Earth Sci. 2017, 76. [Google Scholar] [CrossRef]
- Pal, S.; Mushtaq, M.; Banat, F.; Sumaiti, A.M.A. Review of surfactant-assisted chemical enhanced oil recovery for carbonate reservoirs: Challenges and future perspectives. Pet. Sci. 2017, 15, 77–102. [Google Scholar] [CrossRef]
- Yao, J.; Sun, H.; Fan, D.; Wang, C.; Sun, Z. Numerical Simulation of gas transport mechanisms in tight shale gas reservoirs. Pet. Sci. 2013, 10, 528–537. [Google Scholar] [CrossRef] [Green Version]
- Arshad, A.; Al-Majed, A.A.; Maneouar, H.; Muhammadain, A.; Mtawaa, B. Carbon dioxide (CO2) miscible flooding in tight oil reservoirs: A case study. In Society of Petroleum Engineers—Kuwait International Petroleum Conference and Exhibition, Proceedings of the KIPCE 2009: Meeting Energy Demand for Long Term Economic Growth, Kuwait City, Kuwait, 14–16 December 2009; OnePetro: Richardson, TX, USA, 2009; pp. 524–535. [Google Scholar] [CrossRef]
- Sheng, J.J. Enhanced oil recovery in shale reservoirs by gas injection. J. Nat. Gas Sci. Eng. 2015, 22, 252–259. [Google Scholar] [CrossRef] [Green Version]
- Rao, D. Gas injection EOR—A new meaning in the new millennium. J. Can. Pet. Technol. 2001, 40, 11–19. [Google Scholar] [CrossRef]
- Nobakht, M.; Moghadam, S.; Gu, Y. Mutual interactions between crude oil and CO2 under different pressures. Fluid Phase Equilibria 2008, 265, 94–103. [Google Scholar] [CrossRef]
- Hussen, C.; Amin, R.; Madden, G.; Evans, B. Reservoir simulation for enhanced gas recovery: An economic evaluation. J. Nat. Gas Sci. Eng. 2012, 5, 42–50. [Google Scholar] [CrossRef]
- Abdelaal, A.; Gajbhiye, R.; Al-Shehri, D. Mixed CO2/N2 Foam for EOR as a Novel Solution for Supercritical CO2 Foam Challenges in Sandstone Reservoirs. ACS Omega 2020, 5, 33140–33150. [Google Scholar] [CrossRef]
- Zhang, L.; Ren, S.; Ren, B.; Zhang, W.; Guo, Q.; Zhang, L. Assessment of CO2 storage capacity in oil reservoirs associated with large lateral/underlying aquifers: Case studies from China. Int. J. Greenh. Gas Control 2011, 5, 1016–1021. [Google Scholar] [CrossRef]
- Al-Anazi, B.; Al-Jabra, M. Enhanced oil recovery techniques and CO2 flooding. Nafta 2010, 61, 391–395. [Google Scholar]
- Siregar, S.; Hidayaturobbi, A.D.; Wijaya, B.A.; Listiani, S.N.; Adiningrum, T.; Irwan, I.; Pratomo, A.I. Laboratory Experiments on Enhanced Oil Recovery with Nitrogen Injection. ITB J. Eng. Sci. 2007, 39, 20–27. [Google Scholar] [CrossRef] [Green Version]
- Sahimi, M.; Reza Rasaei, M.; Haghighi, M. Gas injection and fingering in porous media. In Gas Transport in Porous Media; Springer: Amsterdam, The Netherlands, 2006; pp. 133–168. [Google Scholar]
- Hudgins, D.A.; Llave, F.M.; Chung, F.T. Nitrogen miscible displacement of light crude oil. A laboratory study. SPE Reserv. Eng. Soc. Pet. Eng. 1990, 5, 100–106. [Google Scholar] [CrossRef]
- Faisal, A.; Bisdom, K.; Zhumabek, B.; Mojaddam Zadeh, A.; Rossen, W.R. Injectivity and gravity segregation in WAG and SWAG enhanced oil recovery. SPE Annu. Tech. Conf. Exhib. 2009, 2, 1286–1308. [Google Scholar] [CrossRef] [Green Version]
- Clancy, J.P.; Gilchrist, R.E.; Cheng, L.H.; Bywater, D.R. Analysis of Nitrogen-Injection Projects To Develop Screening Guides and Offshore Design Criteria. JPT J. Pet. Technol. 1985, 37, 1097–1104. [Google Scholar] [CrossRef]
- Christensen, J.R.; Stenby, E.H.; Skauge, A. Review of WAG field experience. SPE Reserv. Eval. Eng. 2001, 4, 97–106. [Google Scholar] [CrossRef]
- Afzali, S.; Rezaei, N.; Zendehboudi, S. A comprehensive review on Enhanced Oil Recovery by Water Alternating Gas (WAG) injection. Fuel 2018, 227, 218–246. [Google Scholar] [CrossRef]
- Gauglitz, P.A.; Friedmann, F.; Kam, S.I.; Rossen, W.R. Foam generation in homogeneous porous media. Chem. Eng. Sci. 2002, 57, 4037–4052. [Google Scholar] [CrossRef]
- Shabib-asl, A.; Ayoub, M.A.; Alta’ee, A.F.; Saaid, I.B.M.; Valentim, P.P.J. Comprehensive review of foam application during foam assisted water alternating gas (FAWAG) method. Res. J. Appl. Sci. Eng. Technol. 2014, 8, 1896–1904. [Google Scholar] [CrossRef]
- Ma, K.; Liontas, R.; Conn, C.A.; Hirasaki, G.J.; Biswal, S.L. Visualization of improved sweep with foam in heterogeneous porous media using microfluidics. Soft Matter 2012, 8, 10669–10675. [Google Scholar] [CrossRef]
- Ferno, M.A.; Eide, O.; Steinsbø, M.; Langlo, S.A.; tophersen, A.; Skibenes, A.; Ydstebø, T.; Graue, A. Mobility control during CO2 EOR in fractured carbonates using foam: Laboratory evaluation and numerical simulations. J. Pet. Sci. Eng. 2015, 135, 442–451. [Google Scholar] [CrossRef]
- Dickinson, E. Stabilising emulsion-based colloidal structures with mixed food ingredients. J. Sci. Food Agric. 2013, 93, 710–721. [Google Scholar] [CrossRef] [PubMed]
- Rodríguez Patino, J.M.; Carrera Sánchez, C.; Rodríguez Niño, M.R. Implications of interfacial characteristics of food foaming agents in foam formulations. Adv. Colloid Interface Sci. 2008, 140, 95–113. [Google Scholar] [CrossRef]
- Kralova, I.; Sjöblom, J. Surfactants used in food industry: A review. J. Dispers. Sci. Technol. 2009, 30, 1363–1383. [Google Scholar] [CrossRef]
- Stevenson, D.G. The role of foam in detergent action. J. Soc. Dye. Colour. 1952, 68, 57–59. [Google Scholar] [CrossRef]
- Dacewicz, E.; Grzybowska-Pietras, J. Polyurethane foams for domestic sewage treatment. Materials 2021, 14, 933. [Google Scholar] [CrossRef] [PubMed]
- Rodríguez González, C.A.; Caparrós-Mancera, J.J.; Hernández-Torres, J.A.; Rodríguez-Pérez, Á.M. Nonlinear analysis of rotational springs to model semi-rigid frames. Entropy 2022, 24, 953. [Google Scholar] [CrossRef] [PubMed]
- White, D.; Gurung, S.; Zhao, D.; Tabler, T.; McDaniel, C.; Styles, D.; McKenzie, S.; Farnell, Y.; Farnell, M. Foam or spray application of agricultural chemicals to clean and disinfect layer cages. J. Appl. Poult. Res. 2018, 27, 416–423. [Google Scholar] [CrossRef]
- Robinson, W. Insecticidal Foams Require Knowledge and Precision; Pest Control Technology: Valleyview, OH, USA, 2012. [Google Scholar]
- Arzhavitina, A.; Steckel, H. Foams for pharmaceutical and cosmetic application. Int. J. Pharm. 2010, 394, 1–17. [Google Scholar] [CrossRef]
- Zhao, Y.; Brown, M.B.; Jones, S.A. Pharmaceutical foams: Are they the answer to the dilemma of topical nanoparticles? Nanomedicine 2010, 6, 227–236. [Google Scholar] [CrossRef]
- Purdon, C.H.; Haigh, J.M.; Surber, C.; Smith, E.W. Foam drug delivery in dermatology. Am. J. Drug Deliv. 2003, 1, 71–75. [Google Scholar] [CrossRef]
- Raj Singh, T.R.; Woolfson, A.D.; Donnelly, R.F. Investigation of solute permeation across hydrogels composed of poly(methyl vinyl ether-co-maleic acid) and poly(ethylene glycol). J. Pharm. Pharmacol. 2010, 62, 829–837. [Google Scholar] [CrossRef]
- Zhao, Y.; Brown, M.B.; Jones, S.A. The topical delivery of benzoyl peroxide using elegant dynamic hydrofluoroalkane foams. J. Pharm. Sci. 2010, 99, 1384–1398. [Google Scholar] [CrossRef]
- Aguzzi, C.; Rossi, S.; Bagnasco, M.; Lanata, L.; Sandri, G.; Bona, F.; Ferrari, F.; Bonferoni, M.C.; Caramella, C. Penetration and distribution of thiocolchicoside through human skin: Comparison between a commercial foam (Miotens) and a drug solution. AAPS PharmSciTech 2008, 9, 1185–1190. [Google Scholar] [CrossRef] [Green Version]
- Bond, D.C.; Holbrook, O.C.; Lake, C. Gas Drive Oil Recovery Process. U.S. Patent No. 2,866,507, 30 December 1958. [Google Scholar]
- Hirasaki, G.J. The Steam-Foam Process. J. Pet. Technol. 1989, 41, 449–456. [Google Scholar] [CrossRef]
- Breward, C.J.; Howell, P.D. The drainage of a foam lamella. J. Fluid Mech. 2002, 458, 379–406. [Google Scholar] [CrossRef] [Green Version]
- Drenckhan, W.; Hutzler, S. Structure and energy of liquid foams. Adv. Colloid Interface Sci. 2015, 224, 1–16. [Google Scholar] [CrossRef] [Green Version]
- Axelos, M.A.V.; Boué, F. Foams As Viewed by Small-Angle Neutron Scattering. Langmuir 2003, 19, 6598–6604. [Google Scholar] [CrossRef]
- Furuta, Y.; Oikawa, N.; Kurita, R. Close relationship between a dry-wet transition and a bubble rearrangement in two-dimensional foam. Sci. Rep. 2016, 6, 37506. [Google Scholar] [CrossRef] [PubMed]
- Magrabi, S.A.; Dlugogorski, B.Z.; Jameson, G.J. Bubble size distribution and coarsening of aqueous foam. Chem. Eng. Sci. 1991, 54, 4007–4022. [Google Scholar] [CrossRef]
- Osei-Bonsu, K.; Grassia, P.; Shokri, N. Investigation of foam flow in a 3D printed porous medium in the presence of oil. J. Colloid Interface Sci. 2017, 490, 850–858. [Google Scholar] [CrossRef]
- Korneva, K.G.; Neimarkb3, A.V.; Rozhkov, A.N. Foam in porous media: Thermodynamic and hydro dynamic peculiarities. Adv. Colloid Interface Sci. 1999, 82, 127–187. [Google Scholar] [CrossRef]
- Bello, A.; Ivanova, A.; Cheremisin, A. Enhancing N2 and CO2 foam stability by surfactants and nanoparticles at high temperature and various salinity. J. Pet. Sci. Eng. 2022, 215, 110720. [Google Scholar] [CrossRef]
- Belyadi, H.; Fathi, E.; Belyadi, F. Chapter Seven—Unconventional reservoir development footprints. In Hydraulic Fracturing in Unconventional Reservoirs, 2nd ed.; Belyadi, H., Fathi, E., Belyadi, F., Eds.; Gulf Professional Publishing: Houston, TX, USA, 2019; pp. 97–106. [Google Scholar] [CrossRef]
- Thitakamol, B.; Veawab, A. Foaming behavior in CO2 absorption process using aqueous solutions of single and blended alkanolamines. Ind. Eng. Chem. Res. 2008, 47, 216–225. [Google Scholar] [CrossRef]
- Pugh, R.J. Experimental techniques for studying the structure of foams and froths. Adv. Colloid Interface Sci. 2005, 114–115, 239–251. [Google Scholar] [CrossRef]
- Schramm, L.L.; Novosad, J.J. Micro-visualization of foam interactions with a crude oil. Colloids Surf. 1990, 46, 21–43. [Google Scholar] [CrossRef]
- Farzaneh, S.A.; Sohrabi, M. Experimental investigation of CO2-foam stability improvement by alkaline in the presence of crude oil. Chem. Eng. Res. Des. 2015, 94, 375–389. [Google Scholar] [CrossRef]
- Standnes, D.C.; Austad, T. Wettability alteration in chalk 1. Preparation of core material and oil properties. J. Pet. Sci. Eng. 2000, 28, 111–121. [Google Scholar] [CrossRef]
- Ivanova, A.; Orekhov, A.; Markovic, S.; Iglauer, S.; Grishin, P.; Cheremisin, A. Live imaging of micro and macro wettability variations of carbonate oil reservoirs for enhanced oil recovery and CO2 trapping/storage. Sci. Rep. 2022, 12, 1262. [Google Scholar] [CrossRef] [PubMed]
- Mohammed, M.A.; Babadagli, T. SPE-170034-MS Alteration of matrix wettability during alternate injection of hot-water/solvent into heavy-oil containing fractured reservoirs. In Proceedings of the SPE Heavy Oil Conference, Calgary, AB, Canada, 10–12 June 2014; pp. 10–12. [Google Scholar]
- Standnes, D.C.; Austad, T. Wettability alteration in chalk 2. Mechanism for wettability alteration from oil-wet to water-wet using surfactants. J. Pet. Sci. Eng. 2000, 28, 123–143. [Google Scholar] [CrossRef]
- Wu, Y.; Shuler, P.J.; Blanco, M.; Tang, Y.; III, W.A.G. An Experimental Study of Wetting Behavior and Surfactant EOR in Carbonates With Model Compounds. In Proceedings of the SPE/DOE Symposium on Improved Oil Recoverym, Tulsa, OK, USA, 22–26 April 2008. [Google Scholar]
- Morrow, N.R.; Mason, G. Recovery of oil by spontaneous imbibition. Curr. Opin. Interface Sci. 2001, 6, 321–337. [Google Scholar] [CrossRef]
- Worthen, A.J.; Bryant, S.L.; Huh, C.; Johnston, K.P. Carbon dioxide-in-water foams stabilized with nanoparticles and surfactant acting in synergy. AIChE J. 2013, 59, 3490–3501. [Google Scholar] [CrossRef]
- Liu, S.; Li, R.F.; Miller, C.A.; Hirasaki, G.J. Alkaline/Surfactant/Polymer Processes: Wide Range of Conditions for Good Recovery. SPE J. 2010, 15, 282–293. [Google Scholar] [CrossRef] [Green Version]
- Schramm, L.L. Foam Sensitivity to Crude Oil in Porous Media. In Advances in Chemistry; American Chemical Society: Washington, DC, USA, 1994; pp. 165–197. [Google Scholar] [CrossRef]
- Zhang, Y.P.; Luo, P.; Huang, S. SPE 131368 Improved Heavy Oil Recovery by CO2 Injection Augmented with Chemicals. In Proceedings of the International Oil and Gas Conference and Exhibition in China, Beijing, China, 8–10 June 2010. [Google Scholar] [CrossRef]
- Schramm, L.L.; Mannhardt, K. The effect of wettability on foam sensitivity to crude oil in porous media. J. Pet. Sci. Eng. 1996, 15, 101–113. [Google Scholar] [CrossRef]
- Sanchez, I.; Hazlett, A. Foam Flow Through an Oil-Wet Porous Medium: A Laboratory Study. SPE Reserv. Eng. 1992, 7, 91–97. [Google Scholar] [CrossRef]
- Lescure, B.; Claridge, E.; Houston SPE Member. SPE 15445 CO2 Foam Flooding Performance vs. Rock Nettability. In Proceedings of the SPE Annual Technical Conference and Exhibition, New Orleans, LA, USA, 5 October1986. [Google Scholar] [CrossRef]
- Farajzadeh, R.; Salimi, H.; Zitha, P.L.; Bruining, H. Numerical simulation of density-driven natural convection in porous media with application for CO2 injection projects. Int. J. Heat Mass Transf. 2007, 50, 5054–5064. [Google Scholar] [CrossRef]
- Ransohoh, T.C. Mechanisms of Foam Generation in Glass-Bead Packs. Soc. Pet. Eng. 1988, 3, 573–585. [Google Scholar] [CrossRef] [Green Version]
- Almajid, M.M.; Kovscek, A.R. Pore-level mechanics of foam generation and coalescence in the presence of oil. Adv. Colloid Interface Sci. 2016, 233, 65–82. [Google Scholar] [CrossRef] [PubMed]
- Osterloh, W.T.; Jante, M.J. Effects of Gas and Liquid Velocity on Steady-State Foam Flow at High Temperature. In Proceedings of the SPE/DOE Enhanced Oil Recovery Symposium, Tulsa, OK, USA, 13–17 April 1992. [Google Scholar] [CrossRef]
- Lau, H.C.; Development, S.; O’brien, C.S.M. Effects of Spreading and Nonspreading Oils on Foam Propagation Through Porous Media. Soc. Pet. Eng. 1988, 3, 893–896. [Google Scholar] [CrossRef]
- Khatib, Z.; Hlrasaki, S.G.D.C.; Falls, S.A.D.C.; Co, S.D. Effects of Capillary Pressure on Coalescence and Phase Mobilities in Foams Flowing Through Porous Media. SPE Res. Eng. 1988, 3, 919–926. [Google Scholar] [CrossRef]
- Friedmann, F.; Chen, W.H.; Gaugntz, P.A. Experimental and Simulation Study of High-Temperature Foam Displacement in Porous Media Media. SPE Res. Eng. 1991, 6, 37–45. [Google Scholar] [CrossRef]
- Liontas, R.; Ma, K.; Hirasaki, G.J.; Biswal, S.L. Neighbor-induced bubble pinch-off: Novel mechanisms of in situ foam generation in microfluidic channels. Soft Matter 2013, 9, 10971–10984. [Google Scholar] [CrossRef]
- Yu, W.; Kanj, M.Y. Review of foam stability in porous media: The effect of coarsening. J. Pet. Sci. Eng. 2022, 208, 109698. [Google Scholar] [CrossRef]
- Aveyard, R.; Clint, J.H. Foam and thin film breakdown processes. Curr. Opin. Colloid Interface Sci. 1996, 1, 764–770. [Google Scholar] [CrossRef]
- Langevin, D. Influence of interfacial rheology on foam and emulsion properties. Adv. Colloid Interface Sci. 2000, 88, 209–222. [Google Scholar] [CrossRef]
- Denkov, N.D. Mechanisms of foam destruction by oil-based antifoams. Langmuir 2004, 20, 9463–9505. [Google Scholar] [CrossRef] [PubMed]
- Tittlemier, S.A.; Halldorson, T.; Stern, G.A.; Tomy, G.T. Vapor pressures, aqueous solubilities, and Henry’s law constants of some brominated flame retardants. Environ. Toxicol. Chem. 2002, 21, 1804–1810. [Google Scholar] [CrossRef] [PubMed]
- Amani, P.; Karakashev, S.I.; Grozev, N.A.; Simeonova, S.S.; Miller, R.; Rudolph, V.; Firouzi, M. Effect of selected monovalent salts on surfactant stabilized foams. Adv. Colloid Interface Sci. 2021, 295, 102490. [Google Scholar] [CrossRef]
- Tan, S.N.; Fornasiero, D.; Sedev, R.; Ralston, J. Marangoni effects in aqueous polypropylene glycol foams. J. Colloid Interface Sci. 2005, 286, 719–729. [Google Scholar] [CrossRef] [PubMed]
- Zhu, J.; Da, C.; Chen, J.; Johnston, K.P. Ultrastable N2/water foams stabilized by dilute nanoparticles and a surfactant at high salinity and high pressure. Langmuir 2022, 38, 5392–5403. [Google Scholar] [CrossRef]
- He, G.; Li, H.; Guo, C.; Liao, J.; Deng, J.; Liu, S.; Dong, H. Stable foam systems for improving oil recovery under high-temperature and high-salt reservoir conditions. J. Pet. Sci. Eng. 2022, 211, 110145. [Google Scholar] [CrossRef]
- Emami, H.; Ayatizadeh Tanha, A.; Khaksar Manshad, A.; Mohammadi, A.H. Experimental investigation of foam flooding using anionic and non-ionic surfactants: A screening scenario to assess the effects of salinity and pH on foam stability and foam height. ACS Omega 2022, 7, 14832–14847. [Google Scholar] [CrossRef]
- Hosseini-Nasab, S.M.; Zitha, P.L. Investigation of Chemical-Foam Design as a Novel Approach toward Immiscible Foam Flooding for Enhanced Oil Recovery. Energy Fuels 2017, 31, 10525–10534. [Google Scholar] [CrossRef] [Green Version]
- Yekeen, N.; Padmanabhan, E.; Idris, A.K. Synergistic effects of nanoparticles and surfactants on n-decane-water interfacial tension and bulk foam stability at high temperature. J. Pet. Sci. Eng. 2019, 179, 814–830. [Google Scholar] [CrossRef]
- Sett, S.; Sinha-Ray, S.; Yarin, A.L. Gravitational drainage of foam films. Langmuir 2013, 29, 4934–4947. [Google Scholar] [CrossRef]
- Koursari, N.; Arjmandi-Tash, O.; Trybala, A.; Starov, V.M. Drying of Foam under Microgravity Conditions Microgravity Science and Technology; Springer: Berlin/Heidelberg, Germany, 2019. [Google Scholar] [CrossRef] [Green Version]
- Wu, Q.; Ding, L.; Ge, J.; Guérillot, D. Probing the effect of wettability on transport behavior of foam for enhanced oil recovery in a carbonate reservoir. Energy Fuels 2021, 35, 14725–14733. [Google Scholar] [CrossRef]
- Kanda, B.M.; Schechter, R.S.; Spe-aime, M. On the Mechanism of in Porous Foam Media Formation. In Proceedings of the SPE Annual Fall Technical Conference and Exhibition, New Orleans, LA, USA, 3–6 October 1976. [Google Scholar]
- Kuhlman, M.I.; Co, S.D. Visualizing the Effect of Light Oil on CO2 Foams. In Proceedings of the SPE Annual Fall Technical Conference and Exhibition, New Orleans, LA, USA, 23–26 September 1990. [Google Scholar] [CrossRef]
- Kristiansen, T.S.; Holt, T.; Members, I.S. Properties of Flowing Foam in Porous Media Containing Oil. In Proceedings of the SPE/DOE Enhanced Oil Recovery Symposium, Tulsa, OK, USA, 21–24 April 1992. [Google Scholar] [CrossRef]
- Mannhardt, K. Core flood evaluation of solvent compositional and wettability effects on hydrocarbon solvent foam performance. J. Can. Pet. Technol. 1999, 38. [Google Scholar] [CrossRef]
- Pu, W.; Jiang, R.; Pang, S.; Qiu, T.; Sun, Z.; Shen, C.; Wei, P. Experimental investigation of surfactant-stabilized foam stability in the presence of light oil. J. Dispers. Sci. Technol. 2019, 41, 1596–1606. [Google Scholar] [CrossRef]
- Nikolov, A.D.; Wasan, D.T.; Huang, D.W.; Edwards, D.A. The effect of oil on foam stability: Mechanisms and implications for oil displacement by foam in porous media. In Proceedings of the SPE Annual Technical Conference and Exhibition, New Orleans, LA, USA, 5–8 October 1986. [Google Scholar] [CrossRef]
- Wang, Y.; Zhang, Y.; Liu, Y.; Zhang, L.; Ren, S.; Lu, J.; Wang, X.; Fan, N. The stability study of CO2 foams at high pressure and high temperature. J. Pet. Sci. Eng. 2017, 154, 234–243. [Google Scholar] [CrossRef]
- Wang, H.; Guo, W.; Zheng, C.; Wang, D.; Zhan, H. Effect of Temperature on Foaming Ability and Foam Stability of Typical Surfactants Used for Foaming Agent. J. Surfactants Deterg. 2017, 20, 615–622. [Google Scholar] [CrossRef]
- Liu, Y.; Grigg, R.B.; Svec, R.K. CO2 Foam Behavior: Influence of Temperature, Pressure, and Concentration of Surfactant. In Proceedings of the SPE Production Operations Symposium, Oklahoma City, OK, USA, 16–19 April 2005. [Google Scholar] [CrossRef]
- Obisesan, O.; Ahmed, R.; Amani, M. The effect of salt on stability of aqueous foams. Energies 2021, 14, 279. [Google Scholar] [CrossRef]
- Pandey, A.; Sinha, A.S.K.; Chaturvedi, K.R.; Sharma, T. Experimental investigation on effect of reservoir conditions on stability and rheology of carbon dioxide foams of non-ionic surfactant and polymer: Implications of carbon geo-storage. Energy 2021, 235, 121445. [Google Scholar] [CrossRef]
- Le, L.; Ramanathan, R.; Nasr-El-Din, H. Evaluation of an ethoxylated Amine surfactant for CO2-foam stability at high salinity conditions. In Proceedings of the Abu Dhabi International Petroleum Exhibition and Conference, Abu Dhabi, United Arab Emirates, 11 November 2019. [Google Scholar]
- Haugen, Å.; Fernø, M.A.; Graue, A.; Bertin, H.J. Experimental study of foam flow in fractured oil-wet limestone for enhanced oil recovery. SPE Reserv. Eval. Eng. 2012, 15, 218–228. [Google Scholar] [CrossRef]
- John, Z.; Ingebret, F.; Roman, B. Experimental and simulation of CO2-foam flooding in fractured chalk rock at reservoir conditions: Effect of mode of injection on oil recovery. In Proceedings of the SPE Enhanced Oil Recovery Conference, Kuala Lumpur, Malaysia, 19–21 July 2011. [Google Scholar] [CrossRef]
- Kang, W.; Liu, S.; Meng, L.; Cao, D.; Fan, H. A novel ultra-low interfacial tension foam flooding agent to enhance heavy oil recovery. In Proceedings of the SPE Improved Oil Recovery Symposium, Tulsa, OK, USA, 24 April 2010. [Google Scholar] [CrossRef]
- Chen, Q.; Gerritsen, M.G.; Kovscek, A.R. Improving steam-assisted gravity drainage using mobility control foams: Foam assisted-SAGD (FA-SAGD). In Proceedings of the SPE Improved Oil Recovery Symposium, Tulsa, OK, USA, 24 April 2010. [Google Scholar] [CrossRef]
- Emadi, A.; Sohrabi, M.; Jamiolahmady, M.; Ireland, S.; Robertson, G. Mechanistic study of improved heavy oil recovery by CO2-foam injection. In Proceedings of the SPE Enhanced Oil Recovery Conference, Kuala Lumpur, Malaysia, 19 July 2011; Volume 1, pp. 67–85. [Google Scholar] [CrossRef]
- Hassan, A.M.; Ayoub, M.; Eissa, M.; Bruining, H.; Al-Mansour, A.; Al-Quraishi, A. A New Hybrid Improved and Enhanced Oil Recovery IOR/EOR Process Using Smart Water Assisted Foam SWAF Flooding in Carbonate Rocks; A Laboratory Study Approach. In Proceedings of the SPE, International Petroleum Technology Conference, Virtual, 16 March 2021; Volume 3500. [Google Scholar] [CrossRef]
- Pang, Z.; Liu, H.; Zhu, L. A laboratory study of enhancing heavy oil recovery with steam flooding by adding nitrogen foams. J. Pet. Sci. Eng. 2015, 128, 184–193. [Google Scholar] [CrossRef]
- Cao, R.; Yang, H.; Sun, W.; Zee Ma, Y. A new laboratory study on alternate injection of high strength foam and ultra-low interfacial tension foam to enhance oil recovery. J. Pet. Sci. Eng. 2015, 125, 75–89. [Google Scholar] [CrossRef]
- Guo, H.; Faber, R.; Buijse, M.; Zitha, P.L. A novel alkaline-surfactant-foam EOR process. In Proceedings of the SPE Enhanced Oil Recovery Conference, Kuala Lumpur, Malaysia, 19 July 2011; Volume 2, pp. 1475–1491. [Google Scholar] [CrossRef]
- Simjoo, M.; Dong, Y.; Andrianov, A.; Talanana, M.; Zitha, P.L. A CT scan study of immiscible foam flow in porous media for EOR. In Proceedings of the SPE EOR Conference at Oil and Gas West Asia, Muscat, Oman, 16 April 2012; Volume 2, pp. 859–877. [Google Scholar] [CrossRef]
- Chevallier, E.; Chabert, M.; Gautier, S.; Ghafram, H.; Khaburi, S.; Alkindi, A. Design of a Combined Foam EOR Process for a Naturally Fractured Reservoir. In Proceedings of the SPE EOR Conference at Oil and Gas West Asia, Muscat, Oman, 26 March 2018; Volume 2, p. 190363. [Google Scholar] [CrossRef]
- Lang, L.; Li, H.; Wang, X.; Liu, N. Experimental study and field demonstration of air-foam flooding for heavy oil EOR. J. Pet. Sci. Eng. 2020, 185, 106659. [Google Scholar] [CrossRef]
- Wu, Z.; Liu, H.; Pang, Z.; Wu, C.; Gao, M. Pore-Scale Experiment on Blocking Characteristics and EOR Mechanisms of Nitrogen Foam for Heavy Oil: A 2D Visualized Study. Energy Fuels 2016, 30, 9106–9113. [Google Scholar] [CrossRef]
- Alsumaiti, A.M.; Hashmet, M.R.; Alameri, W.S.; Anto-Darkwah, E. Laboratory Study of CO2 Foam Flooding in High Temperature, High Salinity Carbonate Reservoirs Using Co-injection Technique. Energy Fuels 2018, 32, 1416–1422. [Google Scholar] [CrossRef]
- Qingfeng, H.; Youyi, Z.; Yousong, L.; Rui, W. Studies On Foam Flooding EOR Technique For Daqing Reservoirs After Polymer Flooding. In Proceedings of the SPE Improved Oil Recovery Symposium, Tulsa, OK, USA, 14 April 2012; pp. 14–18. [Google Scholar]
- Mukherjee, B.; Patil, P.D.; Gao, M.; Miao, W.; Potisek, S.; Rozowski, P.; Dow, T. Laboratory Evaluation of Novel Surfactant for Foam Assisted Steam EOR Method to Improve Conformance Control for Field Applications. In Proceedings of the SPE Improved Oil Recovery Conference, Tulsa, OK, USA, 14 April 2018; pp. 14–18. [Google Scholar] [CrossRef]
- Sdman, M.; Kostarelos, K.; Sharma, P.; Lee, J.H. Application of Miscible Ethane Foam for Gas EOR Conformance in Low-Permeability Heterogeneous Harsh Environments. Soc. Pet. Eng. (SPE) 2020, 25, 1871–1883. [Google Scholar] [CrossRef]
- Ahmed, S.; Hashmet, M.R. Siti Rohaida Bt Mohd Shafian, PETRONAS Research Sdn Bhd the SPE Kingdom of Saudi Arabia Annual Technical Symposium and Exhibition society of Petroleum Engineers; Universiti Teknologi PETRONAS: Dammam, Saudi Arabia, 2018; pp. 23–26. [Google Scholar]
- Haugen, Å.; Mani, N.; Svenningsen, S.; Brattekås, B.; Graue, A.; Ersland, G.; Fernø, M.A. Miscible and Immiscible Foam Injection for Mobility Control and EOR in Fractured Oil-Wet Carbonate Rocks. Transp. Porous Media 2014, 104, 109–131. [Google Scholar] [CrossRef]
- Al-Attar, H.H. Evaluation of oil foam as a displacing phase to improve oil recovery: A laboratory study. J. Pet. Sci. Eng. 2011, 79, 101–112. [Google Scholar] [CrossRef]
- Ocampo, A.; Restrepo, A.; Limited, E.; Lopera, S.H.; Mejia, J.M. Creation of Insitu EOR Foams by the Injection of Surfactant in Gas Dispersions-Lab Confirmation and Field Application. In Proceedings of the SPE Improved Oil Recovery Conference, Tulsa, OK, USA, 14 April 2018; Volume 2, p. 190219. [Google Scholar] [CrossRef]
- Tang, J.; Vincent-Bonnieu, S.; Rossen, W.R. CT coreflood study of foam flow for enhanced oil recovery: The effect of oil type and saturation. Energy 2019, 188, 116022. [Google Scholar] [CrossRef]
- Das, A.; Nguyen, N.; Farajzadeh, A.R.; Southwick, J.G.; Vicent-Bonnieu, S.; Global, S.; International, S.; Khaburi, S.; Kindi, A.A.; Nguyen, Q.P. Laboratory Study of Injection Strategy for Low-Tension-Gas Flooding in High Salinity, Tight Carbonate Reservoirs. In Proceedings of the SPE EOR Conference at Oil and Gas West Asia, Muscat, Oman, 26 March 2018; pp. 26–28. [Google Scholar] [CrossRef]
- Jin, Z.; Wende, Y.; Guangming, Y.; Taotao, L.; Wenbiao, D.; Wei, F. Study on the EOR Experiment and Field Test of Air Foam Flooding in Wuliwan Oilfield. IOP Conf. Ser. Earth Environ. Sci. 2018, 186, 012015. [Google Scholar] [CrossRef] [Green Version]
- Telmadarreie, A. Evaluating the Performance of CO2 Foam and CO2 Polymer Enhanced Foam for Heavy Oil Recovery: Laboratory Experiments in Unconsolidated and Consolidated Porous Media. In Proceedings of the SPE International Heavy Oil Conference and Exhibition, Kuwait City, Kuwait, 10 December 2018; Volume 2, p. 193785. [Google Scholar]
- Bageri, A.S.; Sultan, A.S.; Kandil, M.E. Evaluation of Novel Surfactant for Nitrogen-Foam-Assisted EOR in High Salinity Carbonate Reservoirs. In Proceedings of the SPE EOR Conference at Oil and Gas West Asia, Muscat, Oman, 31 March 2014. [Google Scholar] [CrossRef]
- Hou, Q.; Zhu, Y.; Luo, Y.; Weng, R.; Guoqing, J. Studies on nitrogen foam flooding for conglomerate reservoir. In Proceedings of the SPE EOR Conference at Oil and Gas West Asia, Muscat, Oman, 16 April 2012. [Google Scholar] [CrossRef]
- Jin, F.; Liu, Z.; Pu, W.; Zhong, D.; Yuan, C.D.; Wei, B. Experimental Study of in situ CO2 Foam Technique and Application in Yangsanmu Oilfield. J. Surfactants Deterg. 2016, 19, 1231–1240. [Google Scholar] [CrossRef]
- Ren, G.; Nguyen, Q.P.; Lau, H.C. Laboratory investigation of oil recovery by CO2 foam in a fractured carbonate reservoir using CO2-Soluble surfactants. J. Pet. Sci. Eng. 2018, 169, 277–296. [Google Scholar] [CrossRef]
- Zhang, K.; Li, S.; Liu, L. Optimized foam-assisted CO2 enhanced oil recovery technology in tight oil reservoirs. Fuel 2020, 267, 117099. [Google Scholar] [CrossRef]
- Solbakken, J.S.; Aarra, M.G. CO2 mobility control improvement using N2-foam at high pressure and high temperature conditions. Int. J. Greenh. Gas Control 2021, 109, 103392. [Google Scholar] [CrossRef]
- Sie, C.Y.; Nguyen, Q.P. A non-aqueous foam concept for improving hydrocarbon miscible flooding in low permeability oil formations. Fuel 2021, 288, 119732. [Google Scholar] [CrossRef]
- Xiong, D.; Ahmed, S.; Alameri, W.; Al-Shalabi, E.W. Experimental Investigation of Foam Flooding Performance in Bulk and Porous Media for Carbonates Under Harsh Conditions. In Proceedings of the SPE Western Regional Meeting, Bakersfield, CA, USA, 26–28 April 2022. [Google Scholar] [CrossRef]
- Bahrim, R.Z.K.; Zeng, Y.; Bonnieu, S.V.; International, S.G.S.; Groenenboom, J.; Malaysia, S.; Shafian, S.R.M.; Manap, A.A.A.; Tewari, R.D.; Biswal, S.L. A Study of Methane Foam in Reservoir Rocks for Mobility Control at High Temperature with Varied Permeabilities: Experiment and Simulation. In Proceedings of the SPE/IATMI Asia Pacific Oil and Gas Conference and Exhibition, Jakarta, Indonesia, 17 October 2017; Volume 2, p. 186967. [Google Scholar] [CrossRef]
- Simjoo, M. Effects of Oil on Foam Generation and Propagation in Porous Media. In Proceedings of the SPE Enhanced Oil Recovery Conference, Kuala Lumpur, Malaysia, 2 July 2013; pp. 2–4. [Google Scholar] [CrossRef]
- Andrianov, A.; Farajzadeh, R.; Nick, M.M.; Talanana, M.; Zitha, P.L. Immiscible foam for enhancing oil recovery: Bulk and porous media experiments. Ind. Eng. Chem. Res. 2012, 51, 2214–2226. [Google Scholar] [CrossRef]
- Bernard, G.G.; Jacobs, W.L. Effect of foam on trapped gas saturation and on permeability of porous media to water. Soc. Pet. Eng. J. 1965, 5, 295–300. [Google Scholar] [CrossRef]
- Gauteplass, J.; Chaudhary, K.; Kovscek, A.R.; Fernø, M.A. Pore-level foam generation and flow for mobility control in fractured systems. Colloids Surf. A Physicochem. Eng. Asp. 2015, 468, 184–192. [Google Scholar] [CrossRef] [Green Version]
- Farzaneh, S.A.; Sohrabi, M. Visual Investigation of Improvement in Extra-Heavy Oil Recovery by Borate-Assisted CO2 -Foam Injection. Transp. Porous Media 2018, 122, 487–513. [Google Scholar] [CrossRef] [Green Version]
- Norouzi, H.; Madhi, M.; Seyyedi, M.; Rezaee, M. Foam propagation and oil recovery potential at large distances from an injection well. Chem. Eng. Res. Des. 2018, 135, 67–77. [Google Scholar] [CrossRef]
- Fathollahi, A.; Rostami, B.; Khosravi, M. Fluid displacement mechanisms by foam injection within a microfluidic matrix-fracture system. J. Pet. Sci. Eng. 2019, 176, 612–620. [Google Scholar] [CrossRef]
- Yang, W.; Wang, T.; Fan, Z.; Miao, Q.; Deng, Z.; Zhu, Y. Foams Stabilized by in Situ-Modified Nanoparticles and Anionic Surfactants for Enhanced Oil Recovery. Energy Fuels 2017, 31, 4721–4730. [Google Scholar] [CrossRef]
- Blaker, T.; Aarra, M.G.; Skauge, A.; Rasmussen, L.; Celius, H.K.; Martinsen, H.A.; Vassenden, F. Foam for gas mobility control in the Snorre field: The FAWAG project. SPE Reserv. Eval. Eng. 2002, 5, 317–323. [Google Scholar] [CrossRef]
- Skauge, A.; Aarra, M.G.; Surguchev, L.; Martinsen, H.A.; Rasmussen, L. Foam-Assisted WAG: Experience from the Snorre Field. In Proceedings of the SPE Symposium on Improved Oil Recovery Recovery, Tulsa, Oklahoma, 13 April 2002; pp. 315–325. [Google Scholar] [CrossRef]
- Oussoltsev, D.; Fomin, I.; Butula, K.K.; Mullen, K.; Gaifullin, A.; Ivshin, A.; Senchenko, D.; Faizullin, I. Foam fracturing: New stimulation edge in Western Siberia. In Proceedings of the Society of Petroleum Engineers—SPE Russian Oil and Gas Technical Conference and Exhibition, Moscow, Russia, 28 October 2008; Volume 1, pp. 636–648. [Google Scholar] [CrossRef]
- Saifullin, E.R.; Yuan, C.; Zvada, M.V.; Varfolomeev, M.A.; Shanbosinova, S.K.; Zharkov, D.A.; Nazarychev, S.A.; Malakhov, A.O.; Sagirov, R.N. Laboratory Studies For Design of a Foam Pilot For Reducing Gas Channeling From Gas Cap in Production Well in Messoyakhskoye Field. In Proceedings of the SPE Russian Petroleum Technology Conference, Virtual, 11 August 2021. [Google Scholar] [CrossRef]
- Jonas, T.M.; Chou, S.I.; Vasicek, S.L. Evaluation of a CO2 foam field trial: Rangely Weber Sand Unit. In Proceedings of the SPE Annual Technical Conference and Exhibition, New Orleans, LA, USA, 23 September 1990. [Google Scholar]
- Chou, S.I.; Vasicek, S.L.; Pisio, D.L.; Jasek, D.E.; Goodgame, J.A. CO2 foam field trial at North Ward-Estes. In Proceedings of the SPE Annual Technical Conference and Exhibition, Washington, DC, USA, 4 October 1992. [Google Scholar]
- Stephenson, D.J.; Graham, A.G.; Luhning, R.W. Mobility Control Experience in the Joffre Viking Miscible CO2 Flood. In Proceedings of the International Petroleum Conference and Exhibition of Mexico, Villahermosa, Mexico, 3 March 1993. [Google Scholar]
- Heller, J.P.; Boone, D.A.; Watts, R.J. Testing CO2-foam for mobility control at Rock Creek. In Proceedings of the SPE Eastern Regional Meeting, Society of Petroleum Engineers, Morgantown, WV, USA, 6 November 1985. [Google Scholar]
- Alcorn, Z.P. 2 SPE-200450-MS. In Proceedings of the SPE Improved Oil Recovery Conference, Virtual, 18–22 April 2020. [Google Scholar]
- Harpole, K.J.; Siemers, W.T.; Gerard, M.G.; Petroleum, P. CO2 Foam Field Verification Pilot Test at EVGSAU: Phase IIIC-Reservoir Characterization and Response to Foam Injection. In Proceedings of the SPE/DOE Improved Oil Recovery Symposium, Tulsa, OK, USA, 17–20 April 1994; pp. 17–20. [Google Scholar]
- Sanders, A.W. The Dow Chemical Company, Mark Linroth; Kinder Morgan: Houston, TX, USA, 2012. [Google Scholar]
- Ocampo, A.; Restrepo, A.; Cifuentes, H.; Hester, J.; Orozco, N.; Gil, C.; Castro, E. Successful Foam EOR Pilot in a Mature Volatile Oil Reservoir Under Miscible Gas Injection. In Proceedings of the International Petroleum Technology Conference, Beijing, China, 26 March 2013; pp. 26–28. [Google Scholar]
- Aarra, M.G.; Skauge, A.; Martinsen, H.A. FAWAG: A breakthrough for EOR in the North Sea. In Proceedings of the SPE Annual Technical Conference and Exhibition, San Antonio, TX, USA, 29 September 2002. [Google Scholar] [CrossRef]
- Ma, K.; Jia, X.; Yang, J.; Liu, Y.; Liu, Z. Nitrogen Foam Flooding Test for Controlling Water Cut and Enhance Oil Recovery in Conventional Oil Reservoirs of China Offshore Oilfield. In Proceedings of the SPE Asia Pacific Oil and Gas Conference and Exhibition, Jakarta, Indonesia, 22 October 2013; pp. 22–24. [Google Scholar] [CrossRef]
- Lin, Y.; Yang, G. A successful pilot application for N2 foam flooding in Liaohe oilfield. In Proceedings of the SPE Asia Pacific Oil & Gas Conference and Exhibition, Adelaide, Australia, 11–13 September 2006. [Google Scholar]
- Ocampo, A.; Restrepo, A.; Technologies, G.; Clavijo, J.; Cifuentes, H. Use of Foams EOR in Piedemonte Fields—A Successful Mechanism to Improve Gas Sweep Efficiency in Low Porosity and Naturally Fractured Reservoirs. In Proceedings of the SPE Latin American and Caribbean Petroleum Engineering Conference, Virtual, 20 July 2020. [Google Scholar]
- Patzek, T.; Co, S.D.; Kolnls, M. Kern River Steam·Foam Pilots. J. Pet. Technol. 1990, 42, 490–503. [Google Scholar] [CrossRef]
- Friedmann, F.; Smith, M.E.; Guice, W.R.; Petroleum, C.; Co, T.; Gump, J.M.; Nelson, D.G. Steam-Foam Mechanistic Field Trial in the Midway-Sunset Field. SPE Res. Eng. 1994, 9, 297–304. [Google Scholar] [CrossRef]
- Djabbarah, N.; Weber, S.; Freeman, D.; Corp, D.; Muscatello, J.; Ashbaugh, J.; Covington, T. Laboratory Design and Field Demonstration of Steam Diversion With Foam. In Proceedings of the SPE California Regional Meeting, Ventura, CA, USA, 4 April 1990. [Google Scholar] [CrossRef]
- Kemelix, S.E.I.; Aldea, W.C.E.H.; Calarasu, D.; Teisanu, F.L.; Gaze, M.J.I.D.C.S.P.P.P.S.; Petroliera, R.G.S.D.P. Field trial results obtained wlth a foam block during a steam drive experiment in the romanian levantine-moreni reservoir. In Proceedings of the IOR 1991—6th European Symposium on Improved Oil Recovery, Stavanger, Norway, 5 September 1991. [Google Scholar]
- Holm, L.W. Foam injection test in the siggins field, Illinois. J. Pet. Technol. 1970, 22, 1499–1506. [Google Scholar] [CrossRef]
- Holm, L.; Garrison, W.H. CO2 Diversion With Foam in an Immiscible CO2 Field Project. In Proceedings of the SPE Annual Technical Conference and Exhibition, Amsterdam, The Netherlands, 27 October 1988. [Google Scholar]
- Kuehne, D.L. Design and Evaluation of a Nitrogen-Foam Field Trial. J. Pet. Technol. 1990, 42, 504–512. [Google Scholar] [CrossRef]
- Hoefner, M.L.; Evans, E.M. CO2 Foam: Results From Four Developmental Field Trials. In Proceedings of the SPE International Oil and Gas Conference and Exhibition in China, Beijing, China, 2 November 1995. [Google Scholar]
- Liu, P.C.; Besserer, G.J. Application of Foam Injection in Triassic Pool, Canada: Laboratory and Field Test Results. In Proceedings of the SPE Annual Technical Conference and Exhibition, Houston, TX, USA, 2 October 1988. [Google Scholar] [CrossRef]
- Katiyar, A.; Patil, P.D.; Rohilla, N.; Rozowski, P.; Evans, J.; Bozeman, T.; Nguyen, Q. Industry-first hydrocarbon-foam EOR pilot in an unconventional reservoir: Design, implementation and performance analysis. In Proceedings of the SPE/AAPG/SEG Unconventional Resources Technology Conference, Denver, CO, USA, 22 July 2020. [Google Scholar] [CrossRef]
- Ocampo, A.; Restrepo, A.; Rendón, N.; Coronado, J.; Correa, J.; Ramirez, D.; Torres, M.; Sanabria, R. Foams Prove Effectiveness for Gas Injection Conformance and Sweep Efficiency Improvement in a Low porosity Fractured Reservoir-Field Pilots. In Proceedings of the International Petroleum Technology Conference, Kuala Lumpur, Malaysia, 10 December 2014; pp. 10–12. [Google Scholar] [CrossRef]
- Bello, A.; Ozoani, J.; Adebayo, A.; Kuriashov, D. Rheological study of nanoparticle-based cationic surfactant solutions. Petroleum 2022, 8, 522–528. [Google Scholar] [CrossRef]
- Zhang, T.; Roberts, M.R.; Bryant, S.L.; Huh, C. Foams and emulsions stabilized with nanoparticles for potential conformance control applications. SPE Int. Symp. Oilfield Chem. 2009, 2, 1024–1040. [Google Scholar] [CrossRef]
- Espinosa, D.; Caldelas, F.; Johnston, K.; Bryant, S.L.; Huh, C. Nanoparticle-stabilized supercritical CO2 foams for potential mobility control applications. SPE-DOE Improv. Oil Recovery Symp. Proc. 2010, 2, 1242–1254. [Google Scholar] [CrossRef]
- Binshan, J.; Shugao, D.; Zhian, L.; Tiangao, Z.; Xiantao, S.; Xiaofeng, Q. A Study of Wettability and Permeability Change Caused by Adsorption of Nanometer Structured Polysilicon on the Surface of Porous Media. In Proceedings of the SPE Asia Pacific Oil and Gas Conference and Exhibition, Melbourne, Australia, 8 October 2002; pp. 915–926. [Google Scholar] [CrossRef]
- Hendraningrat, L.; Li, S.; Torsæter, O. A coreflood investigation of nanofluid enhanced oil recovery. J. Pet. Sci. Eng. 2013, 111, 128–138. [Google Scholar] [CrossRef]
- Scerbacova, A.; Ivanova, A.; Grishin, P.; Cheremisin, A.; Tokareva, E.; Tkachev, I.; Sansiev, G.; Fedorchenko, G.; Afanasiev, I. Application of alkalis, polyelectrolytes, and nanoparticles for reducing adsorption loss of novel anionic surfactant in carbonate rocks at high salinity and temperature conditions. Colloids Surf. A Physicochem. Eng. Asp. 2022, 653, 129996. [Google Scholar] [CrossRef]
- Ivanova, A.A.; Phan, C.; Barifcani, A.; Iglauer, S.; Cheremisin, A.N. Effect of Nanoparticles on Viscosity and Interfacial Tension of Aqueous Surfactant Solutions at High Salinity and High Temperature. J. Surfactants Deterg. 2019, 23, 327–338. [Google Scholar] [CrossRef]
- Giraldo, J.; Benjumea, P.; Lopera, S.; Cortés, F.B.; Ruiz, M.A. Wettability alteration of sandstone cores by alumina-based nanofluids. Energy Fuels 2013, 27, 3659–3665. [Google Scholar] [CrossRef]
- Karimi, A.; Fakhroueian, Z.; Bahramian, A.; Pour Khiabani, N.; Darabad, J.B.; Azin, R.; Arya, S. Wettability alteration in carbonates using zirconium oxide nanofluids: EOR implications. Energy Fuels 2012, 26, 1028–1036. [Google Scholar] [CrossRef]
- Derjaguin, B.V.; Churaev, N.V. Structural component of disjoining pressure. J. Colloid Interface Sci. 1974, 49, 249–255. [Google Scholar] [CrossRef]
- Bello, A.; Ivanova, A.; Cheremisin, A. Application of Nanoparticles in Foam Flooding for Enhanced Oil Recovery and Foam Stability in Carbonate Reservoirs. In Proceedings of the 83rd EAGE Annual Conference and Exhibition. European Association of Geoscientists & Engineers, Madrid, Spain, 13 June 2022. [Google Scholar] [CrossRef]
- Bergeron, V. Forces and structure in thin liquid soap films. J. Phys. Condens. Matter 1999, 11, R215. [Google Scholar] [CrossRef]
- Wasan, D.; Nikolov, A.; Kondiparty, K. The wetting and spreading of nanofluids on solids: Role of the structural disjoining pressure. Curr. Opin. Colloid Interface Sci. 2011, 16, 344–349. [Google Scholar] [CrossRef]
- Khan, M.S.; Lal, B.; Shariff, A.M.; Mukhtar, H. Ammonium hydroxide ILs as dual-functional gas hydrate inhibitors for binary mixed gas (carbon dioxide and methane) hydrates. J. Mol. Liq. 2019, 274, 33–44. [Google Scholar] [CrossRef]
- Nandwani, S.K.; Malek, N.I.; Lad, V.N.; Chakraborty, M.; Gupta, S. Study on interfacial properties of Imidazolium ionic liquids as surfactant and their application in enhanced oil recovery. Colloids Surf. A Physicochem. Eng. Asp. 2017, 516, 383–393. [Google Scholar] [CrossRef]
- Pillai, P.; Mandal, A. Wettability modification and adsorption characteristics of imidazole-based ionic liquid on carbonate rock: Implications for enhanced oil recovery. Energy Fuels 2019, 33, 727–738. [Google Scholar] [CrossRef]
Figure 1.
Stages of oil recovery.

Figure 2.
Viscous fingering during gas EOR.

Figure 3.
Gas and water injection cycles during WAG.

Figure 4.
Comparison of gas, water-alternating gas (WAG), and foam injections.

Figure 5.
Foam structure.

Figure 6.
Polyhedral structure of the foam.

Figure 7.
Arrangement of surfactant molecules at the foam lamella.

Figure 8.
Snap-off mechanism process of foam generation in the porous media (adapted from Ransohoh et al. [80]).
Figure 8.
Snap-off mechanism process of foam generation in the porous media (adapted from Ransohoh et al. [80]).

Figure 9.
Lamella division mechanism of foam generation in the porous media (Adapted from Ransohoh et al. [80]).
Figure 9.
Lamella division mechanism of foam generation in the porous media (Adapted from Ransohoh et al. [80]).

Figure 10.
Leave-behind mechanism of foam generation in the porous media (Adapted from Ransohoh et al. [80]).
Figure 10.
Leave-behind mechanism of foam generation in the porous media (Adapted from Ransohoh et al. [80]).

Figure 11.
Progression of foam stability from generation to coalescence.

Figure 12.
The pressure difference between foam bubbles (Adapted from Langevin et al. [89]).
Figure 12.
The pressure difference between foam bubbles (Adapted from Langevin et al. [89]).

Figure 13.
Effect of pressure on and foams stability. (Adapted from Wang et al. [108]).
Figure 13.
Effect of pressure on and foams stability. (Adapted from Wang et al. [108]).

Figure 14.
Effect of temperature on foam stability (Adapted from Wang et al. [108]).
Figure 14.
Effect of temperature on foam stability (Adapted from Wang et al. [108]).

Figure 15.
Effect of salinity on foam stability (Adapted from Wang et al. [108]).
Figure 15.
Effect of salinity on foam stability (Adapted from Wang et al. [108]).

Figure 16.
The positive influence of salinity on foam stability (Adapted from Le et al. [113]).
Figure 16.
The positive influence of salinity on foam stability (Adapted from Le et al. [113]).

Figure 17.
Comparison of the recovery efficiency between SAGD and FA-SAGD (Adapted from Chen et al. [117]).
Figure 17.
Comparison of the recovery efficiency between SAGD and FA-SAGD (Adapted from Chen et al. [117]).

Figure 18.
Disjoining pressure mechanism of nanoparticles.

Figure 19.
Influence of nanoparticles on foam half-life (Adapted from Bello et al. [60]).
Figure 19.
Influence of nanoparticles on foam half-life (Adapted from Bello et al. [60]).

Figure 20.
Wettability alteration ability of ionic liquids (Adapted from Pillai et al. [198]).
Figure 20.
Wettability alteration ability of ionic liquids (Adapted from Pillai et al. [198]).


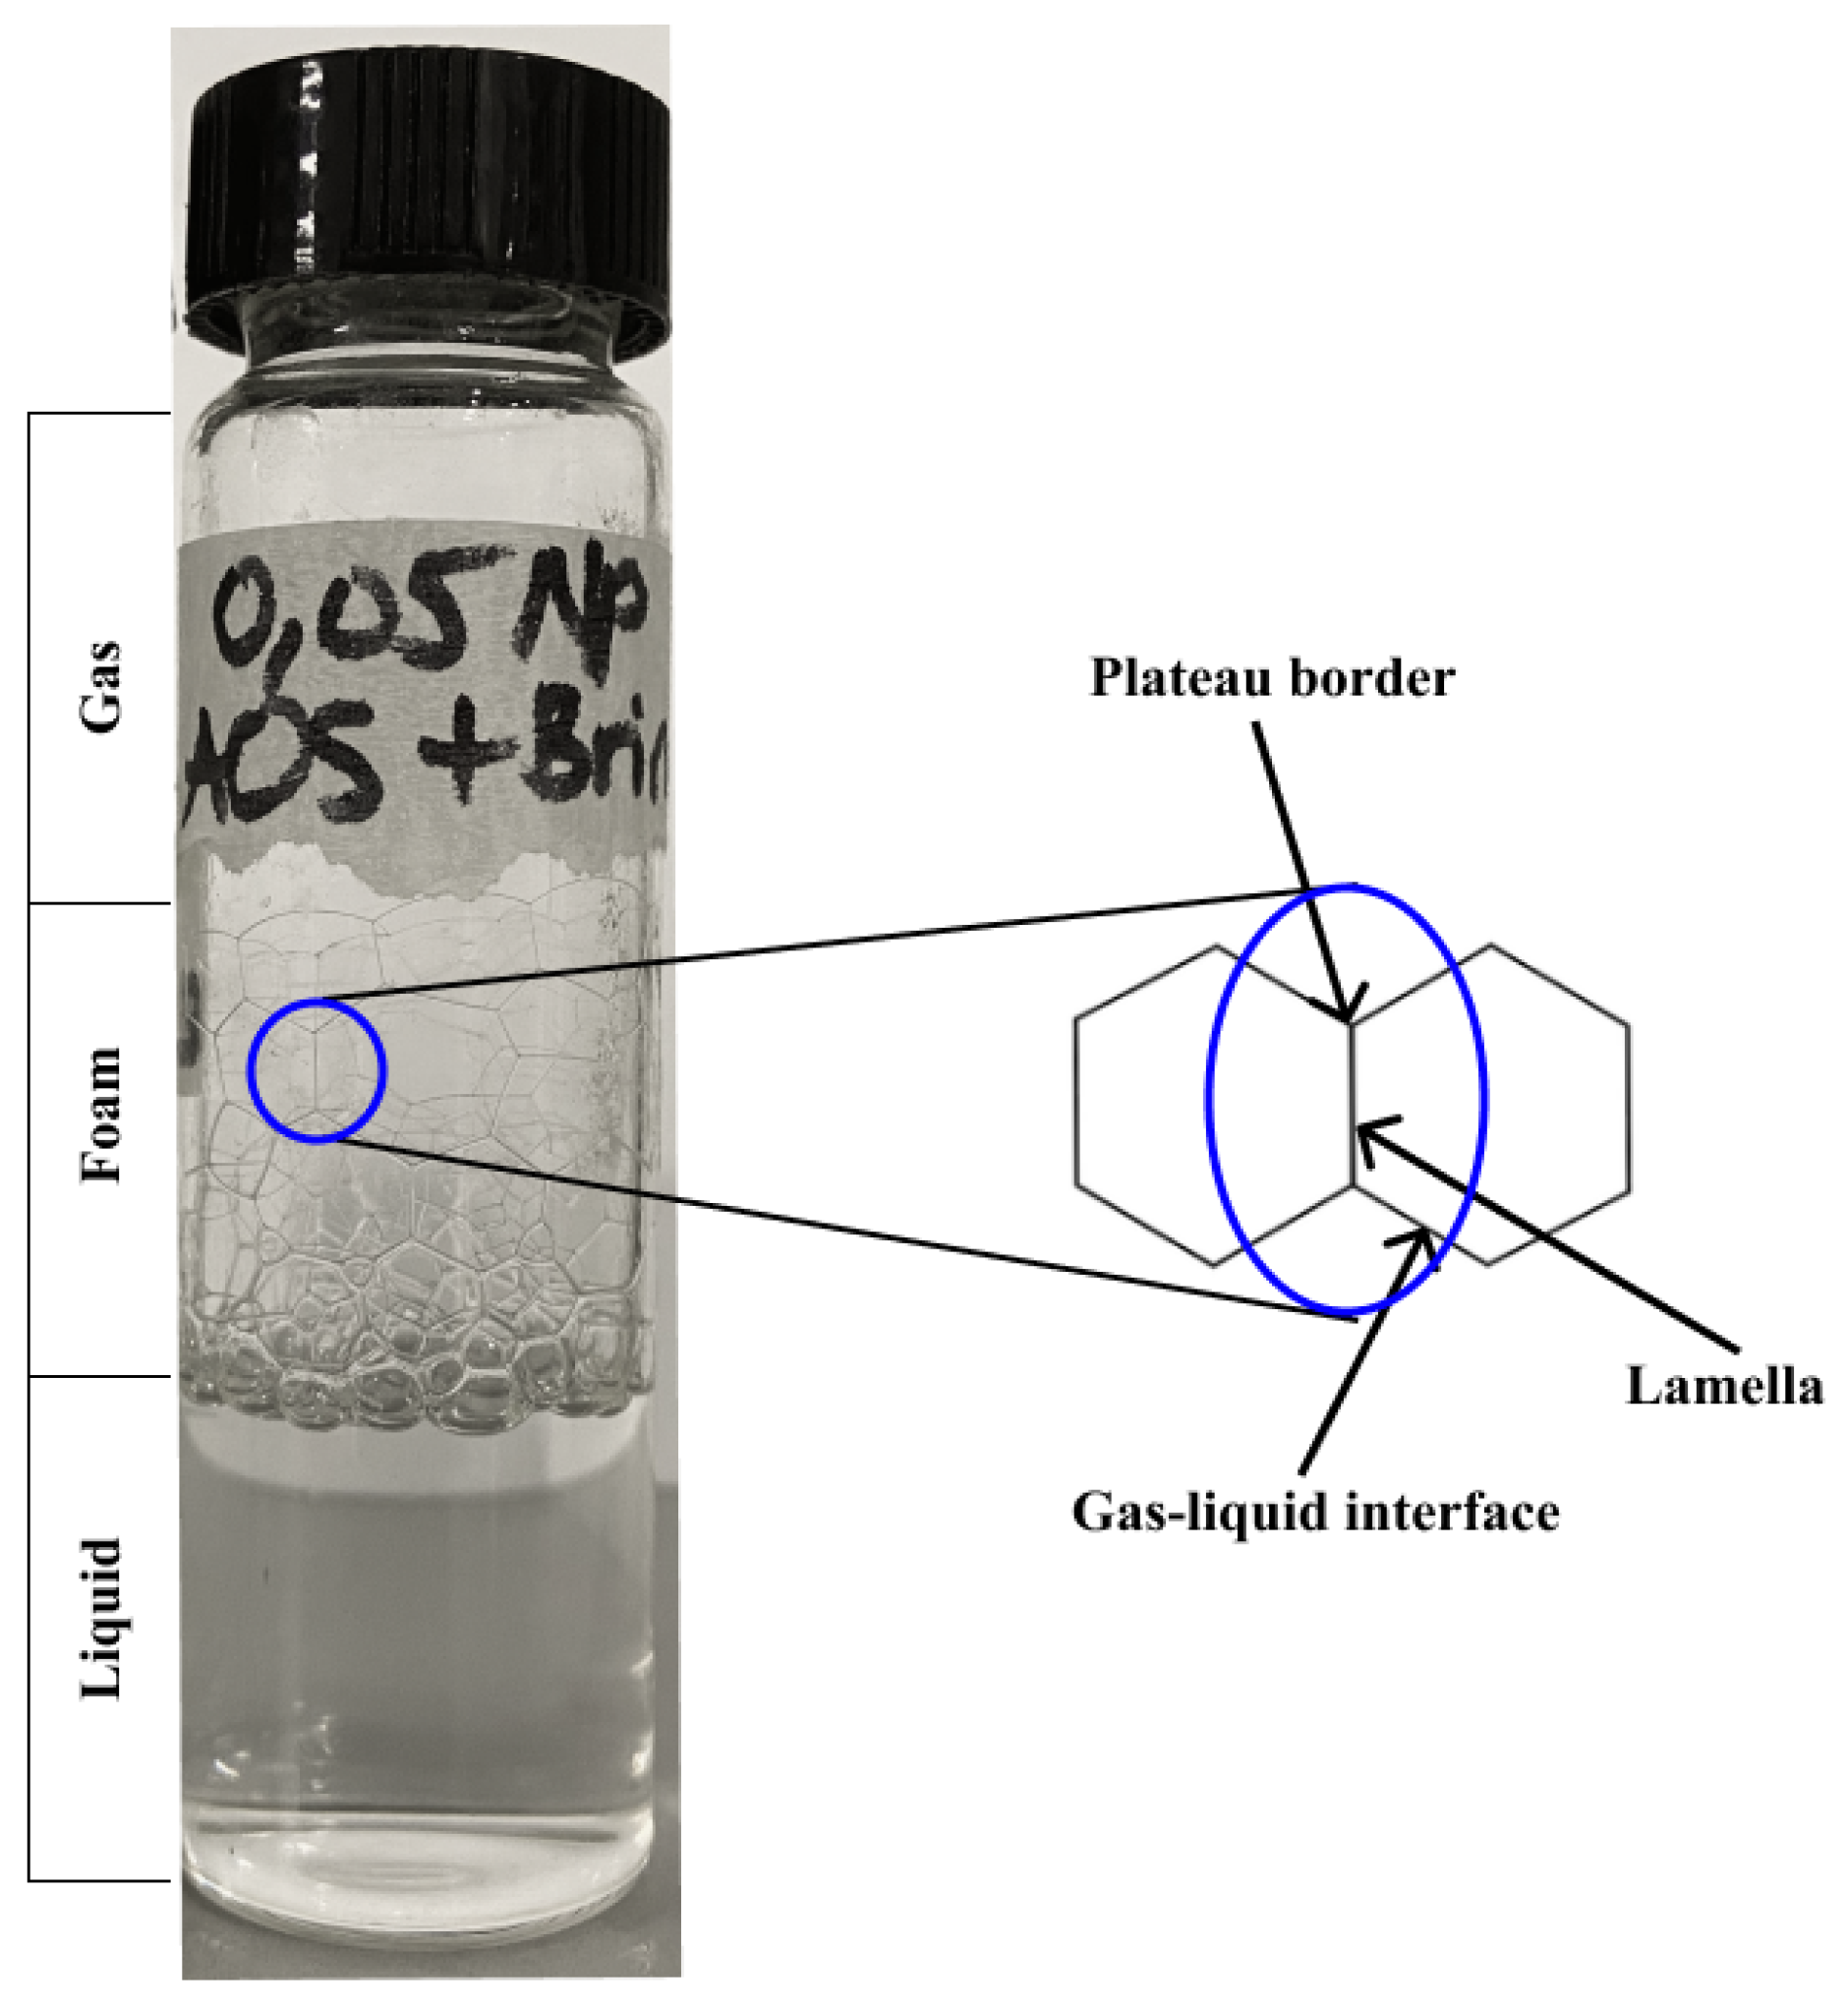
Table 1.
Applications of foam in everyday life.
| Group | Uses |
|---|---|
| Food and beverages | Beer, ice cream, coffee, champagne [37,38,39] |
| Detergent | Dishwashing soaps, bottle cleaning process [40] |
| Waste treatment | Sewage treatment, foam fractionation [41,42] |
| Agriculture | Fumigant, insecticides, disinfectants [43,44] |
| Cosmetics | Shaving cream, bubble bath foams, hair shampoo [45] |
| Pharmaceutical and medical application | treatment of psoriasis, sunburn, eczema, seborrheic, acne [46,47,48]; drug delivery [49,50] |
Table 2.
Laboratory studies of foam-EOR.
| Reference | Foam Injection Mode | Liquid Phase Component(s) | Gas Phase Component(s) | Oil Specifications | Thermobaric Conditions | Salinity | Porous Medium | Permeability (mD) | Porosity (%) | Main Mechanism | Results |
|---|---|---|---|---|---|---|---|---|---|---|---|
| [12] | Pre-generated | 0.3 wt.% Neodol | CO and N | Extra heavy crude oil API 11.5 | 4.1 MPa; 44 C | N/A | Microfluidic model | N/A | N/A | Increased viscosity | Improved CO foam recovery performance; N foam was more stable than CO foam. |
| [35] | Pre-generated | 0.2 wt.% Coco betaine surfactant | Air | N/A | Ambient | N/A | PDMS microfluidic chip | N/A | 45 | Sweep profile improvement | Foam tends to become drier when diverted into the low permeable region especially in the case of wet foam; Foam effectively improved the gas sweep efficiency. |
| [36] | Pre-generated | 1 wt.% AOS surfactant | CO | n-Decane with viscosity 1.01 cp | 9 MPa; 20 C | 4 wt% NaCl, 3.4 wt% CaCl, 0.5 wt% MgCl | Edwards limestone | 11–60 | 18–25 | Increased viscosity | Foam significantly increased oil recovery compared to pure CO injection by adding a viscous component to the oil recovery process. |
| [58] | Pre-generated | 1:1 blend of cocamidopropyl betaine and sodium dodecyl sulfate (SDS) surfactants | N | Isopar G (0.843 cp)and Isopar V (10.840 cp) | Ambient | 0.25 M NaCl | Microfluidic chip | 5200 | 57.5 | N/A | There was formation of a less stable front as the foam quality increased, leading to less oil recovery. |
| [118] | Pre-generated | 0.3 wt.% Neodol | CO | Medium-heavy crude oil with API 19.1 | 4.1 MPa; 44 C | 30,000 ppm NaCl | Microfluidic chip | N/A | N/A | Gas breakthrough reduction | Significant improvement in oil recovery of up to 90%; Reduction of injected CO. |
| [119] | Pre-generated | CTAB, DTAB, AOS, AES | CO and N | Crude oil | 80 C | 3500–179,863 mg/L | Indiana limestone | 50–100 | 15–20 | Increased viscosity | N foam exhibited better foamability and stability than CO foam; CTAB showed excellent oil recovery of 92% cumulative recovery factor. |
| [120] | Pre-generated | 0.5% Surfactant solution | N | Crude oil with viscosity 11,310 cp | 5 MPa; 50–300 C | N/A | Sand pack | 1124 and 5735 | 33 | Uniform propagation front | Foam displacement efficiency was 81.24%, which was 37.94% higher than steam flooding; Foam increased the flow resistance of steam and improved micro-sweep efficiency; Thermal foams can significantly enhance the injection profile by propagating hot water and steam evenly across the reservoir. |
| [121] | Pre-generated | GINF-1 and LINF-2 surfactants | Air | Crude oil with viscosity of 23 cp | 25 C | 6150 mg/L | Sand pack | 1208 | 31 | Diversion of gas flow | HSF foam generates large, stable bubbles in presence of oil, beneficial to block high permeability areas |
| [122] | Pre-generated | IOS surfactant | N | Crude oil with API 37.82 | 5 MPa; 60 C | 1.6 wt.% NaCl | Bentheimer sandstone cores | 1300 | 20 | IFT reduction | AS formulation was found to have a well-defined optimum salinity for which the IFT drops by at least four orders of magnitude |
| [123] | Pre-generated | AOS surfactant | N | Hexadecane with viscosity 3.06 cp | 2 MPa; 20 C | 0.5 M NaCl | Bentheimer sandstone cores | 2500 | 21 | N/A | Foam strength increased with surfactant concentration; Surfactant pre-flushing is a better foam injection strategy. |
| [124] | Pre-generated | Anionic surfactant | N | Crude oil API 28 | 5 MPa; 65 C | 106.75 g/L | Core samples from sultanate of Oman | 0.5 | N/A | IFT reduction | Foam formulation shows an enhanced oil recovery ability in low permeability carbonate core |
| [125] | SAG | Industrial surfactant | Air | Heavy crude oil with viscosity 500 cp | 3.5 MPa; Ambient temperature | 160,599 mg/L | Sand pack | 165.71–1696.51 | 32.75–41.64 | Increased flow resistance | Air-foam generated in the porous medium could improve the resistance to the flow of the injected fluid; Improvement of sweep efficiency and oil recovery. |
| [126] | Pre-generated | 0.5 wt.% SDS, ABS, AAS surfactants | N | Crude oil with viscosity 3170 cp | Ambient | 3712 ppm NaHCO | 2D quartz glass plates model | 4320 | 37.5 | Sweep efficiency improvement | Sweep efficiency was increased from 46.18% to 77.93% after foam injection; Oil displacement efficiency increased from 72.76% to 84.01%. |
| [23] | Pre-generated | 0.5 wt% surfactant | CO + N | Crude oil | 12.4 MPa; 90 C | 253.88 g/L | Berea sandstone cores | 71.83 | 19.79 | Increased viscosity | The mixed CO/N foam system enables the increase of oil recovery by 62.5% over the pure CO foam system |
| [127] | in situ | 1 wt.% Ethomeen C12 surfactant | CO | reservoir oil with viscosity of 8 cP | 24.1 MPa; 120 C | 220,000 ppm NaCl | Carbonate outcrops | 50–240 | 15.9–40 | Gas flow diversion | Foam strength decreases in the presence of oil; Foam has a greater effect on gas relative permeability in higher permeable zones. |
| [128] | in situ, SAG, Pre-generated | AOS 0.4 wt.% surfactant | N | Crude oil with viscosity 9.6 cp | 12.9 MPa; 45 C | 3722 mg/L | Artificial 3-layer sand pack core | 1300 | N/A | N/A | in situ injection is the most effective mode and the alternate injection is the poorest. |
| [129] | Pre-generated | 500 ppm HSF-X surfactant solution | N | Crude oil with viscosity 40000 cp | 100 C–200 C | N/A | Sand pack | 2280 | N/A | Gas mobility reduction | Foam reduced steam mobility by more than 40%; Foam increased oil recovery by 20%. |
| [130] | Pre-generated | IOS, ethoxylated carboxylate, decyl glucoside surfactants | Ethane | Wolfcamp dead crude oil viscosity 5.2 cp | 10.3 MPa; 75 C | 22.7 wt% NaCl | Carbonate outcrop cores | <15 | 28.6 | Sweep profile improvement | Improvement of microscopic displacement was attributed to the attainment of miscibility between the injectant and crude oil |
| [131] | Pre-generated | AOS + betaine surfactants | CO | Malaysian crude oil with API 43 | 10.3 MPa; 80 C | N/A | Berea sandstone | 314 | 18.69 | IFT reduction | Foam successfully improved the cumulative oil recovery from 57.58% to 74.08%. |
| [132] | Pre-generated | 0.5% AOS surfactant | CO, N | n-decane viscosity 0.92 cP | 8.2 MPa; 48 C for CO and 4 MPa; 20 C for N | 5 wt.% NaCl; 3.8 wt.% CaCl | Edwards limestone | 5–20 | 18–26 | Sweep profile improvement | Oil recovery was higher in oil-wet cores than in water-wet cores; Miscible conditions that generated CO foam were significantly more efficient than immiscible conditions, which generated N foam. |
| [133] | Pre-generated | Kerosene and FC-432 surfactant | N | Crude oil | 5.7 MPa | N/A | Berea sandstone core | 139.6 | 23.1 | N/A | Oil foams behave as non-Newtonian fluids and their behavior closely fit the Bingham-plastic model. |
| [134] | SAG | 2000 ppm AOS surfactant | HC | Piedemonte crude oil | 10.3 MPa; 100 C | N/A | Piedemonte core samples | N/A | N/A | Diversion of gas flow | Gas blocking capacity of foams can be correlated with the gas rate in the quality and strength of the foam |
| [135] | in situ, Pre-generated | 0.5% AOS surfactant | N | Hexadecane | 5 MPa; 21 C | 3 wt.% NaCl | Bentheimer sandstone | 2820 | 22 | N/A | Foam generation and propagation is subject to the destabilizing effects of oil on foam and depends partly on the injection strategy. |
| [136] | Pre-generated | IOS + Carboxylate + APG surfactants | N | Crude oil viscosity 1.2 cp | 6.9 MPa; 69 C | 214,000 ppm | Limestone outcrop cores | 10 | 20 | Increased viscosity | Oil recovery of over 60% was achieved after water flooding, even after reducing the surfactant concentration by 75%. |
| [137] | Pre-generated | 0.5% AES surfactant | Air | Crude oil | 12.2 MPa; 56 C | 2910 mg/L | Sand pack model | 320 | 58.5 | Sweep profile improvement | Oil recovery factor was enhanced by 7.4% through air foam flooding and 4.9% after water flooding |
| [138] | Pre-generated | Na-DDBS surfactant | CO | Heavy oil with viscosity 670 cp | 10.3 MPa; 22 C | 1000 ppm | Sandstone and carbonate outcrop core samples | N/A | N/A | IFT reduction | Foam injection improved heavy oil recovery after water flooding in homogenous core sample and could produce more than 10% of the residual oil after water flooding. |
| [139] | Pre-generated | Fluorosurfactant and Triton X surfactant | N | crude oil | 7.2 MPa; 60 C | 21,600 ppm | Limestone samples | 1.65–202.38 | 11.93–19.36 | N/A | Maximum recovery of 47.7% of residual oil in low permeability was observed compared to 43% in high permeability core. |
| [140] | in situ, Pre-generated | 0.4% AOS surfactant | N | Keshang crude oil with viscosity 8 cp | 9.5 MPa; 28.7 C | 9038 mg/L | Keshang core samples | 159 | N/A | Increased viscosity | Oil recovery for in situ injection was 4.98% higher than that of pre-generated injection. |
| [141] | in situ | AOS, Dodecyl betaine surfactants | CO | Yangsanmu crude oil with viscosity 557.5 cp | 12.3 MPa; 63 C | 4500 mg/L | Sand pack | N/A | N/A | IFT reduction | in situ foam injection mode can effectively reduce oil viscosity and oil–water IFT. |
| [142] | Pre-generated | Anionic and non-ionic CO soluble surfactants | CO | West Texas Wasson crude oil with viscosity 7.1 cp | 10.3 MPa; 35 C | NaCl | Silurian dolomite outcrop | 150 | N/A | Improvement of sweep profile | Recovery factor of CO flooding was only 24% due to the heterogeneous nature of the fractured core. Co-injection of CO and water increased the RF to 35%, which was further increased to 54% when a water-soluble surfactant was added. |
| [143] | Pre-generated | Anionic and non-ionic surfactants | CO | Crude oil with viscosity 7.5 cp | 9 MPa | N/A | Tight sandstone core samples | 5–15 | 11.64–20.64 | Reduction of gas breakthrough | A higher injection rate and/or permeability ratio result in an earlier gas breakthrough and causes less oil to be produced before the gas breakthrough |
| [144] | Pre-generated | 0.5% AOS surfactant | CO, N | North Sea oil with viscosity 2.1 cp | 22 MPa; 100 C | 36,340 ppm | Berea sandstone core sample | 349 and 436 | 21.8 and 21.9 | N/A | An easy way to improve the CO foam properties at reservoir conditions is suggested as introducing nitrogen into the gas phase. |
| [145] | Pre-generated, SAG | Industrial surfactant Masurf FS-3020 | Mixture of natural gas liquids | Crude oil with viscosity 3 cp | 5.51 MPa; 32 C | N/A | Indiana limestone core sample | 9.7 | 18.6 | Increased viscosity | Propagation of foam was strongly influenced by the injection strategy |
| [146] | Pre-generated, SAG | Surfactant | N | Crude oil with viscosity 1.1 cp | 6.9 MPa; 80 C | 20 wt% NaCl | Limestone outcrop core samples | 46.3 | N/A | Increased viscosity | A cumulative oil recovery of 67% was achieved after foam injection, in which foam was able to produce 25% incremental oil recovery. |
| [147] | Pre-generated | Mixed surfactant | Methane | Crude oil with viscosity 5 cp | 20 MPa; 94 C | 10700 mg/ L Na | Sandstone core samples | 493 | 25 | Increased viscosity | Foam exhibited higher apparent viscosity in cores with higher permeability. |
| [148] | in situ | AOS surfactant | N | Crude oil with viscosity 3.28 cp | 2 MPa; 21 C | 0.5 M of NaCl | Bentheimer sandstone cores | 2500 | 21 | Sweep profile improvement | By increasing the surfactant concentration from 0.1% to 1%, foam exhibited a better front-like displacement |
| [149] | Pre-generated | Mixture of surfactants AOS, SDS, FS | CO, N | Oil with API 20.18 | Ambient | 3 wt.% NaCl | Bentheimer sandstone cores | 1200 | 22 | Reduction of gas breakthrough | With nitrogen foam, most oil production was achieved within the first PV of foam injection. CO was after the 1.5 PV foam injection. |
| [150] | in situ | Surfactant | N and Air | Crude oil | Ambient | 1 wt.% NaCl | sandstone cores | 32 and 1000 | 20 | N/A | The presence of oil decreases the ability of foam to decrease the permeability of a porous medium to water. |
| [138] | SAG | Non-ionic Surfonic N85 (Huntsman) surfactant | CO | Heavy crude dead oil 1320 cp | Ambient | N/A | Sand pack | 38,000 | 37 | Increased viscosity | The addition of polymer to the N85 foaming solution accelerates the foam generation and increases its stability in heavy-oil-saturated porous media. |
| [151] | Pre-generated | 1 wt.% Bio-Terge AS40 surfactant | N | n-decane | Ambient | N/A | Water-wet silicon micromodels | 700 | 52 | Sweep profile improvement | Foam injection significantly enhanced sweep efficiency in fractured systems in terms of greater pore occupancy by gas and larger contact area with displaced fluid compared to continuous gas injection. |
| [152] | in situ | 0.3 wt.% AOS surfactant | CO | Heavy crude oil with viscosity of 8670 cp | 4.1 MPa; 50 C | 8000 ppm NaCl and 2000 ppm CaCl | Micromodel | 10,000 | 61 | IFT reduction | CO foam significantly increased the contact area between the oil and gas and thus, the efficiency of the recovery process. |
| [153] | in situ | SDS, AOS surfactants | N | Crude oil viscosity 38 cp | 13.8 MPa; 65 C | 1 wt.% synthetic seawater | Core sample | 7530 | 36.49 | N/A | Pressure has a positive impact on the foam stability, although the extent of this depends on surfactant type; A stable foam has a better oil recovery performance than gas injection. |
| [154] | Pre-generated | 0.5 wt.% AOS surfactant | N | n-decane | 13.79 MPa; 80 C | 1 wt.% NaCl | Microfluidic chip | 29,130 | 25 | Increased viscosity | Unlike gas injection, the oil recovery from the matrix in foam injection is improved by the viscous cross-flow mechanism. |
Table 3.
Field studies of foam-EOR.
| Reference | Field | Geological Characteristics | Problem/Aim | Liquid Phase | Gas Phase | Injection Parameters | Main Mechanism | Results |
|---|---|---|---|---|---|---|---|---|
| [160] | Rangely Weber Sand Unit, Colorado | Average porosity = 12% Average permeability = 8 mD Reservoir temperature = 71 C Oil viscosity = 1.7 cp Initial res. pressure = 18.9 MPa | CO breakthrough Poor sweep efficiency High gas production | Chevron chaser CD1040 with average surfactant concentration 0.46% | CO | Pre-treatment of 12000 bbl surfactant slug followed by 55000 bbl of 79% foam quality | Sweep profile improvement | CO production was much lower; Oil production was slightly higher; Foam reduced CO injectivity for as long as 2 months. |
| [161] | North Ward-Estes Field, Texas | Average porosity = 18% Average permeability = 15 mD Reservoir temperature = 28 C Oil viscosity = 1.4 cp Initial res. pressure = 7.6 MPa | Poor sweep efficiency Early CO breakthrough Low tertiary oil production | Chevron chaser CD1040 0.1–0.5% | CO | Average foam quality between 50% and 80% was maintained | Reduction of gas breakthrough | Foam was generated without delay; Foam reduced CO injectivity by 40%; Foam lasted up to 6 months. |
| [162] | Joffre Viking Field, Alberta, Canada | Average porosity = 13% Average permeability = 506.6 mD Reservoir temperature = 56 C Oil viscosity = 1 cp Initial res. pressure = 7.8 MPa | Viscous fingering Gravity segregation Poor mobility of CO | 0.2 wt% of the surfactant | CO | N/A | N/A | Foam did not propagate a significant distance into the reservoir; modest increase in oil production. |
| [163] | Rock Creek, West Virginia | Average porosity = 21.7% Average permeability = 21.5 mD Reservoir temperature = 22.8 C Oil viscosity = 3.2 cp | Low oil production High gas mobility | Alipal CD-128 | CO | N/A | N/A | Absence of any sign of oil bank; Possibility of CO foam breaking down (thermal/chemical degradation); Inability to lower the mobility under reservoir conditions. |
| [164] | East Seminole field, Permian Basin, USA | Average porosity = 12% Average permeability = 13 mD Reservoir temperature = 40 C Oil API gravity = 31 Initial res. pressure = 17.2 MPa Brine salinity = 70,000 ppm | Poor areal sweep efficiency Unfavorable mobility | Huntsman surfactant 0.5 wt.% | CO | 70% foam quality in an inverted 40-acre five-spot well pattern | Sweep profile improvement | CO injectivity was reduced by 70% |
| [165] | East Vacuum Grayburg San Andres Unit, New Mexico | Average porosity = 11.7% Average permeability = 11 mD Reservoir temperature = 40.5 C Oil API gravity = 38 Initial res. pressure = 11 MPa | Early CO breakthrough Gas channeling | 2500 ppm chevron Chaser CD-1045 | CO | 80% foam quality | Diversion of gas flow | Foam achieved some diversion of injected fluid away from high permeability zone into lower permeability zones; Positive performance of foam injection was seen in a reduction in CO production and increase in oil rate performance |
| [166] | Scurry Area Canyon Reef Operational Committee field, Permian basin, USA | Average porosity = 7.6% Average permeability = 19.4 mD Reservoir temperature = 57.8 C Oil API gravity = 42 Initial res. pressure = 24 MPa | Poor mobility control Poor vertical conformance | ELEVATE | CO | N/A | Sweep profile improvement | CO injectivity decreased by more than 50% compared to CO injection alone; Foam improved vertical conformance at the injector. |
| [167] | Cusiana field, Colombia | Average porosity = 9% Oil API gravity = 34 | Poor tertiary oil recovery | AOS C/C | CH | High injection rate of >100 MMSCF/d to promote foam generation, after which, the well was returned to 35 MMSCF/d | Diversion of gas flow | Foam gas blocking effect and divergence at near-wellbore level was achieved; improvements in sweep efficiency |
| [168] | Snorre field, North Sea | Reservoir temperature = 90 C
Permeability = 400–3500 mD Oil viscosity = 0.789 cp | Poor mobility control Gas breakthrough | AOS | Hydrocarbon gas | A total of 2000 tons of AOS surfactant was injected | Gas breakthrough reduction | Reduction in production GOR; Foam injection was estimated to have produced around 250,000 sm of oil. |
| [169] | SZ oil field, Bohai Bay, China | Oil viscosity = 24–452 cp Average porosity = 25% Average permeability = 745 mD Reservoir temperature = 65 C | Early breakthrough of injected water; High water cut | Surfactant | N | N and fluid are injected as small daily slugs for 10–15 days with a cumulative gas injection of 2,592,000–3,888,000 m, for 3–6 months. | Increased viscosity | Oil production increased and the water cut decreased in the pilot of the SZ oil field; Cumulative oil production increased to 30,283 m per year. |
| [170] | Liaohe oilfield, China | Average porosity = 29.7% Oil viscosity = 110–129 cp Average permeability = 1079 mD Initial reservoir pressure = 10.7 MPa Reservoir temperature = 49.7 C. | Pressure depletion after 9 years of steam huff-n-puff; Poor sweep efficiency | Surfactant | N | Average injection rate was 142.1 m/d, and average foam quality was 60%. | Diversion of gas flow | The recovery rate of foam flooding was over 1.5%, higher than that of water drive; During foam flooding, average injection pressure was increased to 8 Pa. It proves that the flow resistance of foam liquid increases due to gas blockage effect in foam flooding. |
| [134,171] | Piedemonte field, Colombia | Initial reservoir pressure = 10.3 MPa Reservoir temperature = 100 C | Poor sweep efficiency; Low recovery of residual oil | AOS Surfactant | Hydrocarbon gas | About 600 bbls of foaming solution was injected and the gas injection rate was 20–30 MMSCF/d. | Sweep profile improvement | Reduction of injectivity in the gas injector; Positive impacts on GOR and the oil rate of the producers. |
| [172] | Kern river field | Average porosity = 30% API gravity = 13 | Poor sweep efficiency | 0.5 wt.% AOS surfactant | N | Steam foam was generated by continuous injection of 39.7 m/d | Increased viscosity | Improved vertical sweep |
| [173] | Midway Sunset field | Extremely heterogeneous sand rich reservoir Average porosity = 25% Average permeability = 1000 mD | Understand mechanisms of steam diversion caused by foam | Surfactant chaser SD1000 | N | 35 gal/hr of Chaser SD1020 mixed with 30 SCF/min of nitrogen was injected. | Sweep profile improvement | bottom-hole injection pressure increased from 0.7 to 2 MPa, indicating good foam generation; improvements in both vertical and areal sweep efficiency |
| [174] | South Belridge Field, Kern County | Average porosity = 35%, Average permeability = 1500–3500 mD Reservoir temperature = 204.4 C Initial res. pressure = 2 MPa | Initiation of a foam steam diversion pilot | AOS surfactant | N | About 178,000 lbs of surfactant and 15 MMSCF of nitrogen were injected | Sweep profile improvement | Foam injection resulted into 183,000 barrels of incremental oil production; Foam diverted steam and improved vertical and areal sweep efficiency |
| [175] | Levantine–Moreni reservoir, Romania | Average porosity = 29% Average permeability = 1000 mD Initial res. pressure = 2 MPa Oil viscosity = 800 cp Reservoir temperature = 17 C | Low oil production rate due to heavy and viscous oil | CAPTOR 4020X | N | CAPTOR 4020X was diluted in industrial water to a concentration of 1–2% active matter. 20–30 m slugs of foaming solutions were injected. N injection pressure varied from 40–70 bar | Increased viscosity | Significant decrease in water cut; Supplementary oil production relative to steam drive was estimated at 1060 tonnes. |
| [176] | Siggins field, Illinois | Average porosity = 19% Average permeability = 75 mD Oil viscosity = 8 cp Average temperature = 18.3 C Initial res. pressure = 0.7 MPa | Determine effect of foam on gas and water injectivity; Effect of foam on water injection profile. | Neutral blend of anionic surf with a small amount of non-ionic surfactant | Air | 400 bbl of foaming agent solution was injected at a constant bottom-hole pressure of 3 MPa; 100 bbl of the chemical tracer solution was injected at 3 MPa; Approximately 850,000 SCF of air was injected at 3 MPa. | Gas mobility reduction | Foam injection caused a more uniform water injection profile in the injection well; Water mobility reduced to about 70%; Air mobility was reduced by more than 50% and the severe channeling of air to the production well stopped. |
| [177] | Wilmington field | Reservoir temperature = 130 F Reservoir pressure = 6.2–7.6 MPa Permeability = 100–1000 mD Porosity = 24–26% Oil gravity API = 13–14 | Poor distribution and sweep efficiency of injected CO | Alipal CD-128 | CO/N | About 21,000 bbl of 1% Alipal CD-128 solution was used with a volume of gas designed to generate a foam quality of 90%. | Diversion of gas flow | Foam successfully diverted gas to a previously unswept interval; Increase in oil production but excessive gas production in some wells. |
| [178] | Painter reservoir, Wyoming | Reservoir temperature = 78.8 C Initial res. pressure = 31 MPa Average permeability = 7 mD Oil gravity = 44 API | Nitrogen breakthrough; Gas channeling; High N mobility causing gas coning and shuts off production | Surfactant 0.5% | N | During foam injection, the wellhead pressure ranged from 28.9 to 30.3 MPa | N/A | Foam injection temporarily reduced injectivity but was not effective in controlling gas channeling. |
| [179] | East Mallet Unit Well 31, Hockley county, Texas Slaughter field | Average porosity = 8.2% Average permeability = 2.15 mD Oil viscosity = 1.078 cp Average res. pressure = 17.2–18.6 MPa | Evaluate SAG foam generation technique for reduction of CO production and improvement of oil production | CD-128 surfactant | CO | CO injection rate was 1000 MMSCF/day. A total of 20,200 active lbm of CD-128 surfactant | Gas breakthrough reduction | Foam reduced gas injectivity; Foam reduced gas production; Foam increased overall oil production by 22% and 31%. |
| [179] | McElmo Creek Unit Well P-19, San Juan County Greater Aneth field | Average porosity = 12% Average permeability = 10 mD API gravity = 41.4 Initial res. pressure = 14.7 MPa | Severe gas production; breakthrough | CD-128 and CD-1045 | CO | A total of 80,500 lbm active surfactant was injected. The average wellhead injection pressure increased from 5.5 to 14.5 MPa during foam injection | Gas breakthrough reduction | With foam, gas production was reduced by 50% relative to the rate of CO injected, while oil production was maintained at a higher level. |
| [180] | Kaybob South Triassic Unit, Alberta, Canada | Average porosity = 11.5% Average permeability = 92 mD Oil viscosity = 0.414 cp Reservoir temperature = 88 C Initial res. pressure = 17.6 MPa | Gas breakthrough; Gas gravity override; Poor sweep efficiency. | Dowfax surfactant | N | A 10 m slug of surfactant solution was injected at the beginning of each week of the water injection cycle. Alternate two-week cycle of gas and two-week cycle of water followed. | Sweep profile improvement | Successful reduction of gas injectivity was observed after foam injection; Slight reduction in GOR. |
| [181] | Madisonville West, Woodbine, Texas | Average permeability = 15 mD Reservoir temperature = 120 C Initial res. pressure = 26.2 MPa Oil API gravity = 39 Porosity = 13% | To lower the mobility of injected gas and increase its residence time | Surfactant | N | Gas and water injection rates were around 3000 MCF/d and 1200 MCF/d respectively | Sweep profile improvement | Improved volumetric sweep efficiency; Oil production rates were more than doubled; Gas utilization was improved; Low GOR was confirmed. |
| [182] | Cupiagua, Recetor field, Colombia | Permeability = 0.01–10 mD Porosity less than 6% Initial res. pressure = 41.4 MPa Average temperature = 126.7 C | To temporarily block high conductivity layers; To improve injection conformance; To improve sweep efficiency. | Petrostep C1 | N | N/A | Diversion of gas flow | Strong gas injection blockage was observed; Incremental oil production of 30% and 12% in 2 pilots; Decreasing trend of GOR. |
Disclaimer/Publisher’s Note: The statements, opinions and data contained in all publications are solely those of the individual author(s) and contributor(s) and not of MDPI and/or the editor(s). MDPI and/or the editor(s) disclaim responsibility for any injury to people or property resulting from any ideas, methods, instructions or products referred to in the content. |
© 2023 by the authors. Licensee MDPI, Basel, Switzerland. This article is an open access article distributed under the terms and conditions of the Creative Commons Attribution (CC BY) license (https://creativecommons.org/licenses/by/4.0/).
Share and Cite
MDPI and ACS Style
Bello, A.; Ivanova, A.; Cheremisin, A. Foam EOR as an Optimization Technique for Gas EOR: A Comprehensive Review of Laboratory and Field Implementations. Energies 2023, 16, 972. https://0-doi-org.brum.beds.ac.uk/10.3390/en16020972
AMA Style
Bello A, Ivanova A, Cheremisin A. Foam EOR as an Optimization Technique for Gas EOR: A Comprehensive Review of Laboratory and Field Implementations. Energies. 2023; 16(2):972. https://0-doi-org.brum.beds.ac.uk/10.3390/en16020972
Chicago/Turabian StyleBello, Ayomikun, Anastasia Ivanova, and Alexey Cheremisin. 2023. "Foam EOR as an Optimization Technique for Gas EOR: A Comprehensive Review of Laboratory and Field Implementations" Energies 16, no. 2: 972. https://0-doi-org.brum.beds.ac.uk/10.3390/en16020972
Note that from the first issue of 2016, this journal uses article numbers instead of page numbers. See further details here.