1. Introduction
Nuclear power plants, when compared with coal-fired power plants, do not emit carbon dioxide, sulfur dioxide, nitrogen oxides, and other environmentally damaging emissions. They can be considered as one of the alternatives to traditional fossil fuel power plants in terms of environmental protection. There has been little growth in fossil fuel power plants in the past ten years. On the contrary, the development of nuclear power is gaining importance all over the world [
1]. Therefore, research on nuclear power has become a popular research project in many countries. In this study, the PWR’s primary moisture separator is the target of this investigation. The primary moisture separator, located in the upper part of the steam generator, plays a key role in the system [
2]. The mixture flow into the moisture separator becomes the swirl flow after the swirl vane. The swirl flow is generated by a swirling motion that imparts a swirl velocity component to the flow, by using an axial-plus-tangent entry into the vortex generator, or by tangential entry into the chamber [
3]. This swirl flow makes the droplets migrate towards the wall of the riser and forms a thin water film on the wall. Due to the density differences between the water droplet and the vapor, the water droplets are separated from the mixture. More than 80% of the droplets generated in the steam generator should be separated by the primary moisture separator [
4].
Numerous researchers have studied the characteristics of the primary moisture separator. Several scholars have focused on the theoretical study of the separator. Qu et al. [
5], Najafi et al. [
6], and Saqr et al. [
7] mainly investigated the importance of the swirl intensity in the process of separating. Liu et al. [
8] developed a mechanistic model for the prediction of swirling annular flow pattern transitions. Based on their investigation, they concluded that the annular flow property was related to the critical film thickness and critical gas/liquid velocity. These scholars’ results illustrated that the newly developed correlation yielded a more accurate transition flow pattern prediction for swirl flows. Additionally, Liu et al. [
9] mathematically investigated separators and proposed a scaling law that enabled a comparison between the reduced and full-scale model. Based on the scaling theory, several scholars investigated the separator through the experimental method. Matsubayashi et al. [
10], Kataoka et al. [
4], and Funahashi et al. [
11,
12] studied the boiling water reactor’s (BWR) separator by changing the geometry, including the bending angle and the vane quantity, and by adding pick-off rings. The pressure drop or separation was related to these parameter designs. Furthermore, Nishida et al. [
13] developed a new design with a swirl vane hub with a small diameter and horizontal slits at the riser barrel. This design could also strongly prevent vane damage. Nevertheless, Xiong et al. [
14], Kataoka et al. [
15], and Funahashi et al. [
16] experimentally investigated the separator by changing the mixture velocity or single phase flux. Their experimental studies were mostly focused on the geometry design or the changing inlet conditions.
In comparison to the experimental approach, which always needs to consider the scaling law, the numerical approach can easily overcome this scaling problem. Due to the development of computer technology in the past few decades, the numerical analysis has sufficient robustness for determining the characteristics of the moisture separator, as long as the appropriate model is selected [
17]. Tamrina et al. [
18] concluded that the higher-order discretization scheme yielded a better result compared to the first-order scheme. Zhang et al. [
19,
20] numerically studied both primary and secondary separators of the AP1000 geometry. Their results illustrated the primary stage separation efficiency with different inlet humidity values. Tian et al. [
21] numerical studied a new structure of separators. They concluded that reducing the cylinder diameter could increase the separation effect. Kataoka et al. [
22] used numerical methods to investigate the pressure drop and film thickness in a moisture separator. After changing the gas and liquid volume fluxes, the results illustrated that the pressure drop with a swirling flow was about five times that with a nonswirling flow. Huang et al. [
20] and Song et al. [
23] numerically studied the separation process of the moisture separator. They verified the feasibility of the numerical analysis and concluded that the data matched the experiment. Fang et al. [
2,
24] studied a full-scale numerical model regarding the process from the moisture separator to the dryer and then compared the difference between the moisture separator and the dryer. Their conclusions showed that the separator simulation should consider the cold leg and hot leg in the steam generator. Saito et al. [
25] numerically analyzed the droplet behavior of the BWR’s moisture separator. They concluded that the deposition coefficient would increase by adding the swirl intensity. Katono et al. [
26] numerically and experimentally studied the down-scale moisture separator characteristics by moving the swirl vane section. The results showed that a modified separator could reduce the pressure drop by more than 50%. Xiong et al. [
27] developed an experiment and simulation on a 1:3.5 scale swirl vane separator and investigated both the separation efficiency and pressure drop. The conclusions illustrated that the pressure was mainly affected by the airflow rate and water droplet size. Rocha et al. [
28] developed an axially induced swirling pipe flow through numerical and experimental studies. They concluded that smaller gap widths and larger deflection angles could provide more swirls. This result can be beneficial for applications that require swirling over a longer pipeline distance.
Based on the above literature review, we found that most numerical investigations on moisture separators used the volume of fluid (VOF) method. However, we know that the approach to dealing with numerically capturing interfaces is an established field in CFD communities [
29]. Logically, this kind of multiphase flow problem can be classified as a continuity phase and a dispersed phase, which are solved through Eulerian and Lagrangian approaches, respectively [
30,
31]. Zhang et al. [
19,
21,
27] used the VOF method. However, the particle tracking multiphase model mentioned in Fang et al. [
29,
32,
33] was used for a bubble flow. The target in this study focused on capturing droplet particles in moisture separators. Judging from the property of moisture flow, the droplets are transported by the steam. In order to classify the process of capturing particles during the moisture flow through the moisture separator, a suitable approach should be considered. The particle tracking method is suitable for this study, even though it is simple. The particle tracking model based on the Lagrangian–Eulerian methodology is used here to study the characteristics of the primary moisture separator. Since the droplet particles follow the steam flow during the flow process, the effect of the droplet particles on the steam flow is ignored, and a one-way coupling is applied in the simulation process.
Although previous researchers have made many research contributions in this field, the research on moisture separators is still insufficient. Here, we focus on the moisture separator’s droplet-capturing process by using the particle tracking method. In addition, we investigate the effects of different moisture separator models aiming to increase the separator’s outlet steam quality and decrease the pressure drop. We also aim to improve the separation efficiency of the moisture separators. This study can act as a relevant reference for future designs and research. In this numerical study, the particle tracking method in the Eulerian–Lagrangian methodology is used to investigate the characteristics of the primary moisture separator. Different swirl vane bending angles, different quantities of swirl vanes, and different swirl vane locations are chosen to investigate the characteristics of the primary moisture separator. Moreover, various water droplet sizes—from 0.01 to 50 m—are also considered in this study.
2. Numerical Analysis
The moisture separator model comes from the general model of the steam generator of the pressurized water reactor in a nuclear power plant [
34].
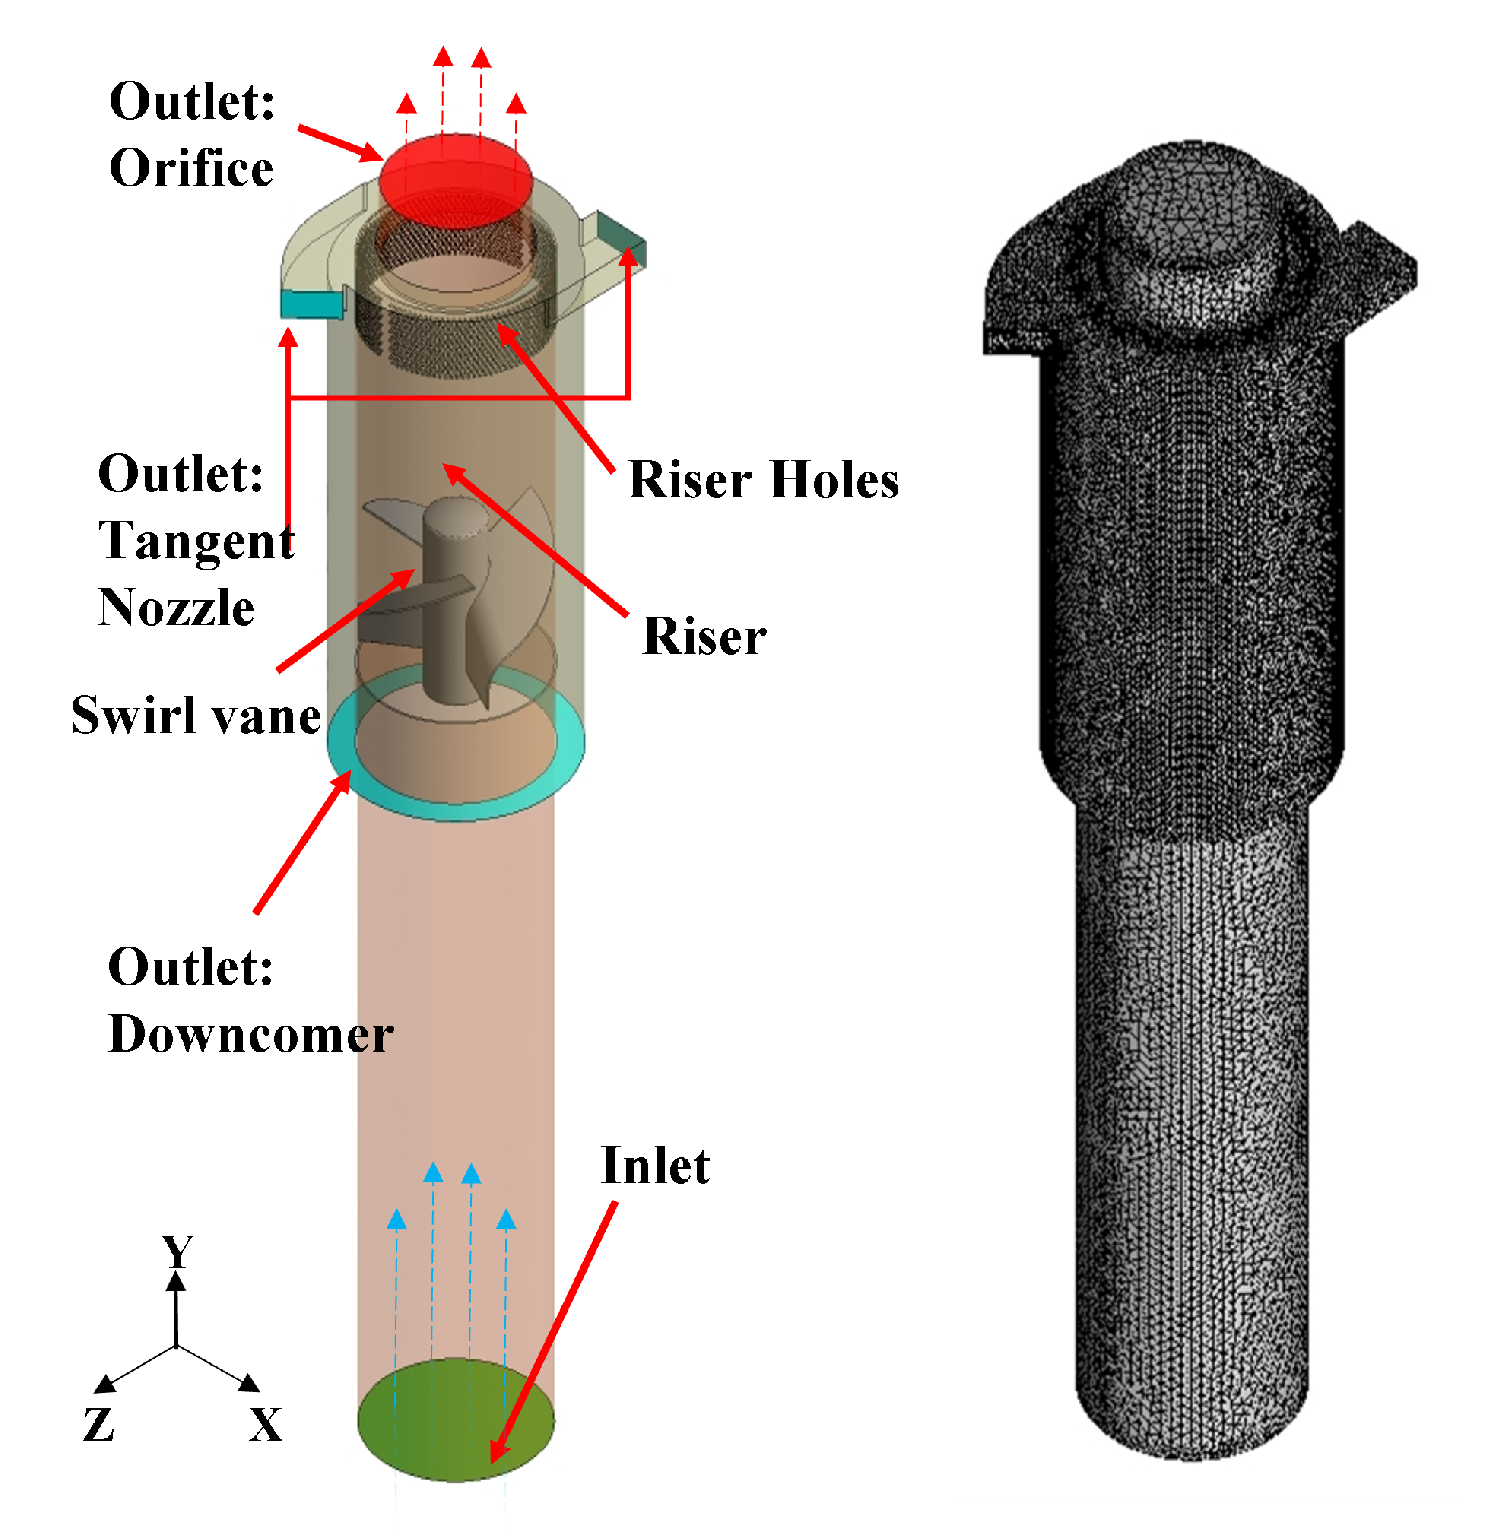
Figure 1 shows the schematic of the computational domain used and the mesh generation in this study. It includes a tangent nozzle outlet, an orifice outlet, a downcomer outlet, a riser, swirl vanes, and an inlet.
2.1. Governing Equations
2.1.1. Continuous and Dispersed Fluid
The process of moisture flow in the separator was considered adiabatic so that we only needed to calculate the continuity and momentum equation. The moisture flow was classified into a continuous fluid-steam and dispersed fluid–water particle. The governing equations that describe the flow of the continuous fluid are given below [
30,
35,
36].
where
, and
are the density, velocity, pressure, viscosity, and the sum of body force, respectively. For turbulence models, the
model, the baseline (BSL)
model, and the shear stress transport (SST)
model were compared. The simulation results showed that the BSL model was not suitable for the particle tracking model when compared to the results of the
model and the SST
model. Previous researchers compared the model simulations, and the results showed that the SST
model had stronger adaptability to the swirl flow compared to the
model [
17,
21]. The BSL model failed to predict the onset and the amount of flow separation from the smooth surfaces, despite combining the Wilcox and the
model. This is why these models do not account for the transport of the turbulent shear stress and overpredict the eddy viscosity [
30]. For these reasons, the SST
model was applied in this study. The SST
model solves the two transport equations, namely, one for the turbulent kinetic energy and the other for the turbulent frequency. The stress tensor is computed from the eddy viscosity equation [
30]. The SST
model assumes that the turbulence viscosity is linked to the turbulence kinetic energy
k and the turbulent frequency
through the equations.
where
and
are the turbulence viscosity, kinetic energy, and turbulence frequency, respectively.
and
P are the constant coefficients for the turbulence model. Their specific expression can be found in [
30].
2.1.2. Particle Tracking Methodology
In the process of Lagrange particle implementation, a specified portion of particles represents all of the particles in the flow through the continuum fluid during particle transport. The discrete particle moves in the continuous fluid medium. Such a particle’s motion is driven by the force exchange between the continuum and discrete media. The process equations are derived from Basset, Boussinesq, and Oseen [
30]. The equations are as follows:
where
, and
are the particle displacement, the initial particle velocity, and the mass of the particle, respectively. The superscripts
o and
n refer to old and new values, respectively. These equations describe the method to calculate the particle variables and the realization of the interphase transfer through the particle transport model. Equations (6) and (7) illustrate the calculation of the new value of one particle during the simulation, and
represents the timestep. The variables
,
,
,
,
, and
in Equation (
8), respectively, represent the drag force acting on the particle, the buoyancy force due to gravity, the forces due to domain rotation, the virtual mass force, the pressure gradient force, and the Basset force or history term that accounts for the deviation in flow pattern from a steady state.
2.2. Modeling and Analysis
The mixture in the moisture separator is swirled by a swirl vane in the moisture separator. Due to the differences in density, the droplet particles with a larger mass are subjected to more centrifugal force, leading to a move towards the riser wall. Several droplets in the mixture are captured and separated by the riser wall and become the reflux of the downcomer. Some of the droplets come out of the separator’s tangent nozzle into the steam generator’s gravity space. The particles are returned to the steam generator for further separating due to the action of gravity.
According to the automatic near-wall treatment method requirements of the CFX [
30], the first node distance should avoid the buffer layer. The solver will choose a suitable treatment based on the detection Y-plus value. For this study case, a Y-plus value between 30 and 200 was chosen, which means the Y-plus was located at the log-law layer of the boundary layer. This solution approach used a fully implicit discretization of the equations at any given time scales—set as 0.04 s. Since the particle tracking method selected a certain number of particles to substitute for all the droplet particles in the simulation [
30], a particle-quantity-sensitive study became necessary. The particle numbers were chosen from 100 to 20,000, which were distributed randomly in the geometry inlet to inspect the influence of the particle numbers. When the number of particles exceeded 1000, the result of the steam quality at the orifice outlet tended to be constant. Nevertheless, in order to test sufficient particles, the number of particles in different cases was chosen as 10,000 to represent all the water particles in this study.
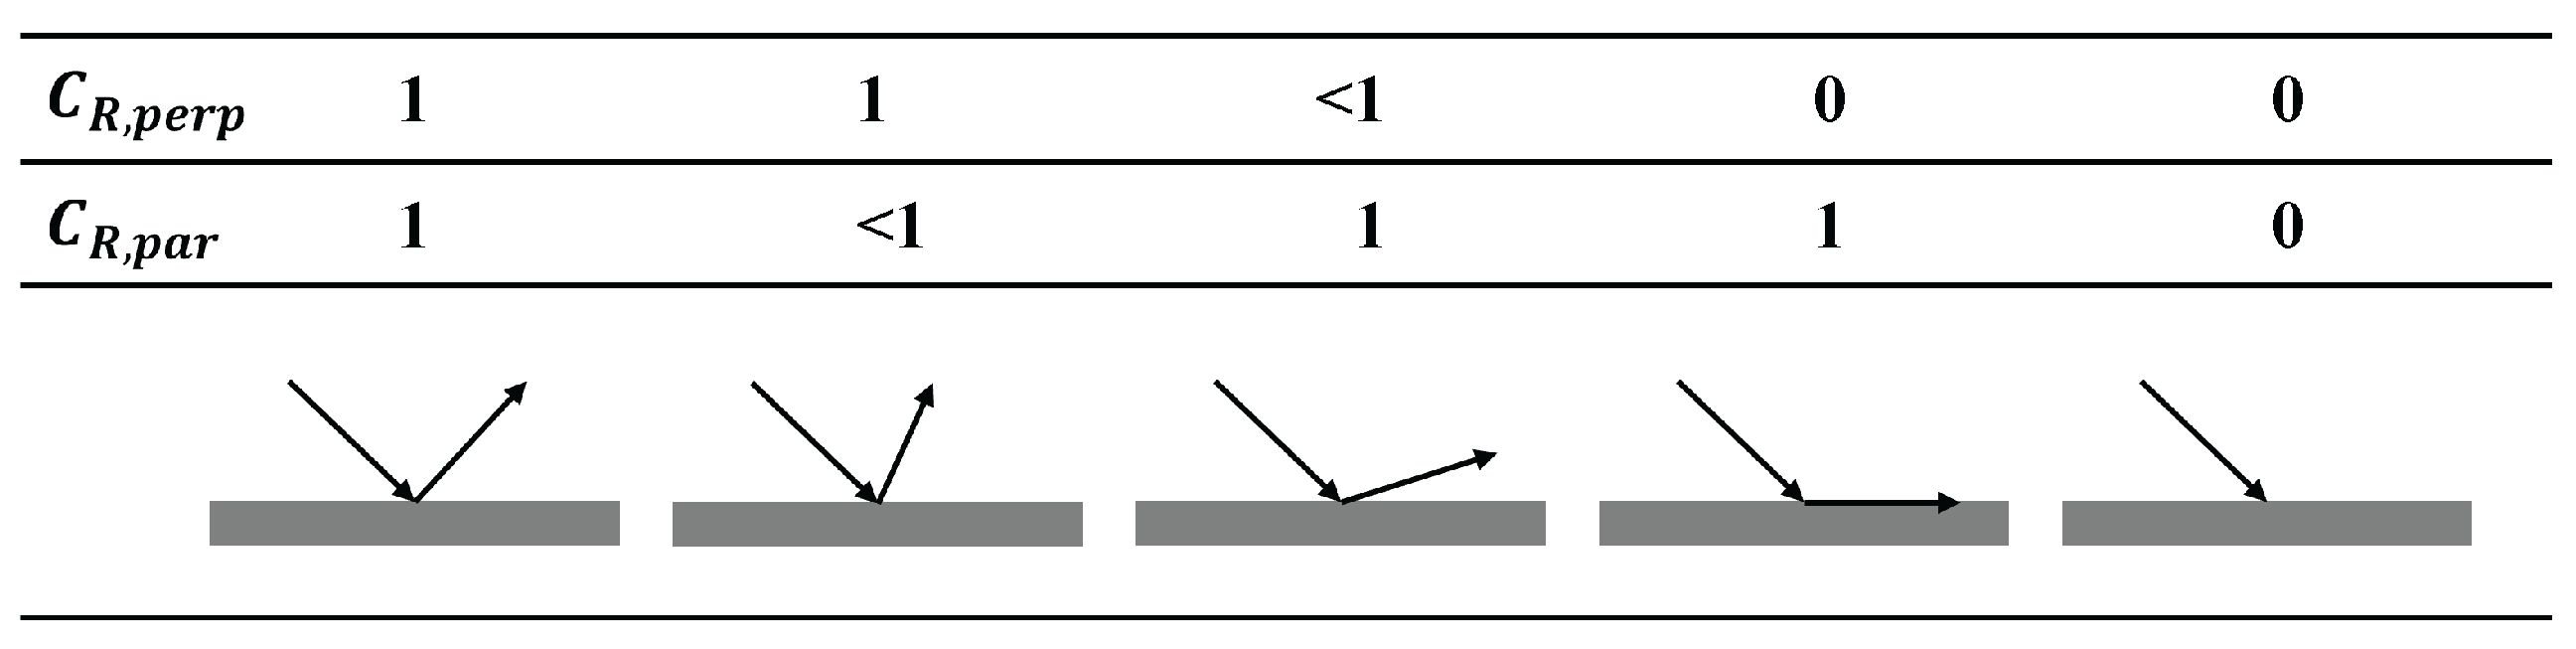
When the particles collide with each other and with the separator wall, we considered the exchange momentum only with the wall. During such collisions, the momentum loss is controlled by constant or time-dependent coefficients of restitution. In the case of a fully inelastic collision, the particles are collected on the wall. Generally, the droplets will migrate to the wall and become a film after contact with the separator surface. The model enforced that all particles hitting the wall became part of the wall film, regardless of their impact velocity or impact angle. To terminate the tracking of particles when they hit a wall boundary, both the perpendicular and parallel coefficients could be set to zero. The particle then came to a stop regardless of what was set for the parallel coefficient of restitution.
Figure 2 shows the schematic of the wall treatment method described above. When the parallel and perpendicular restitution coefficient is set to 1, the particle fully rebounds, and when both the coefficients are set to 0, the particles do not rebound because they are captured by the wall when they are in contact. The restitution coefficient was set to 0 in this study.
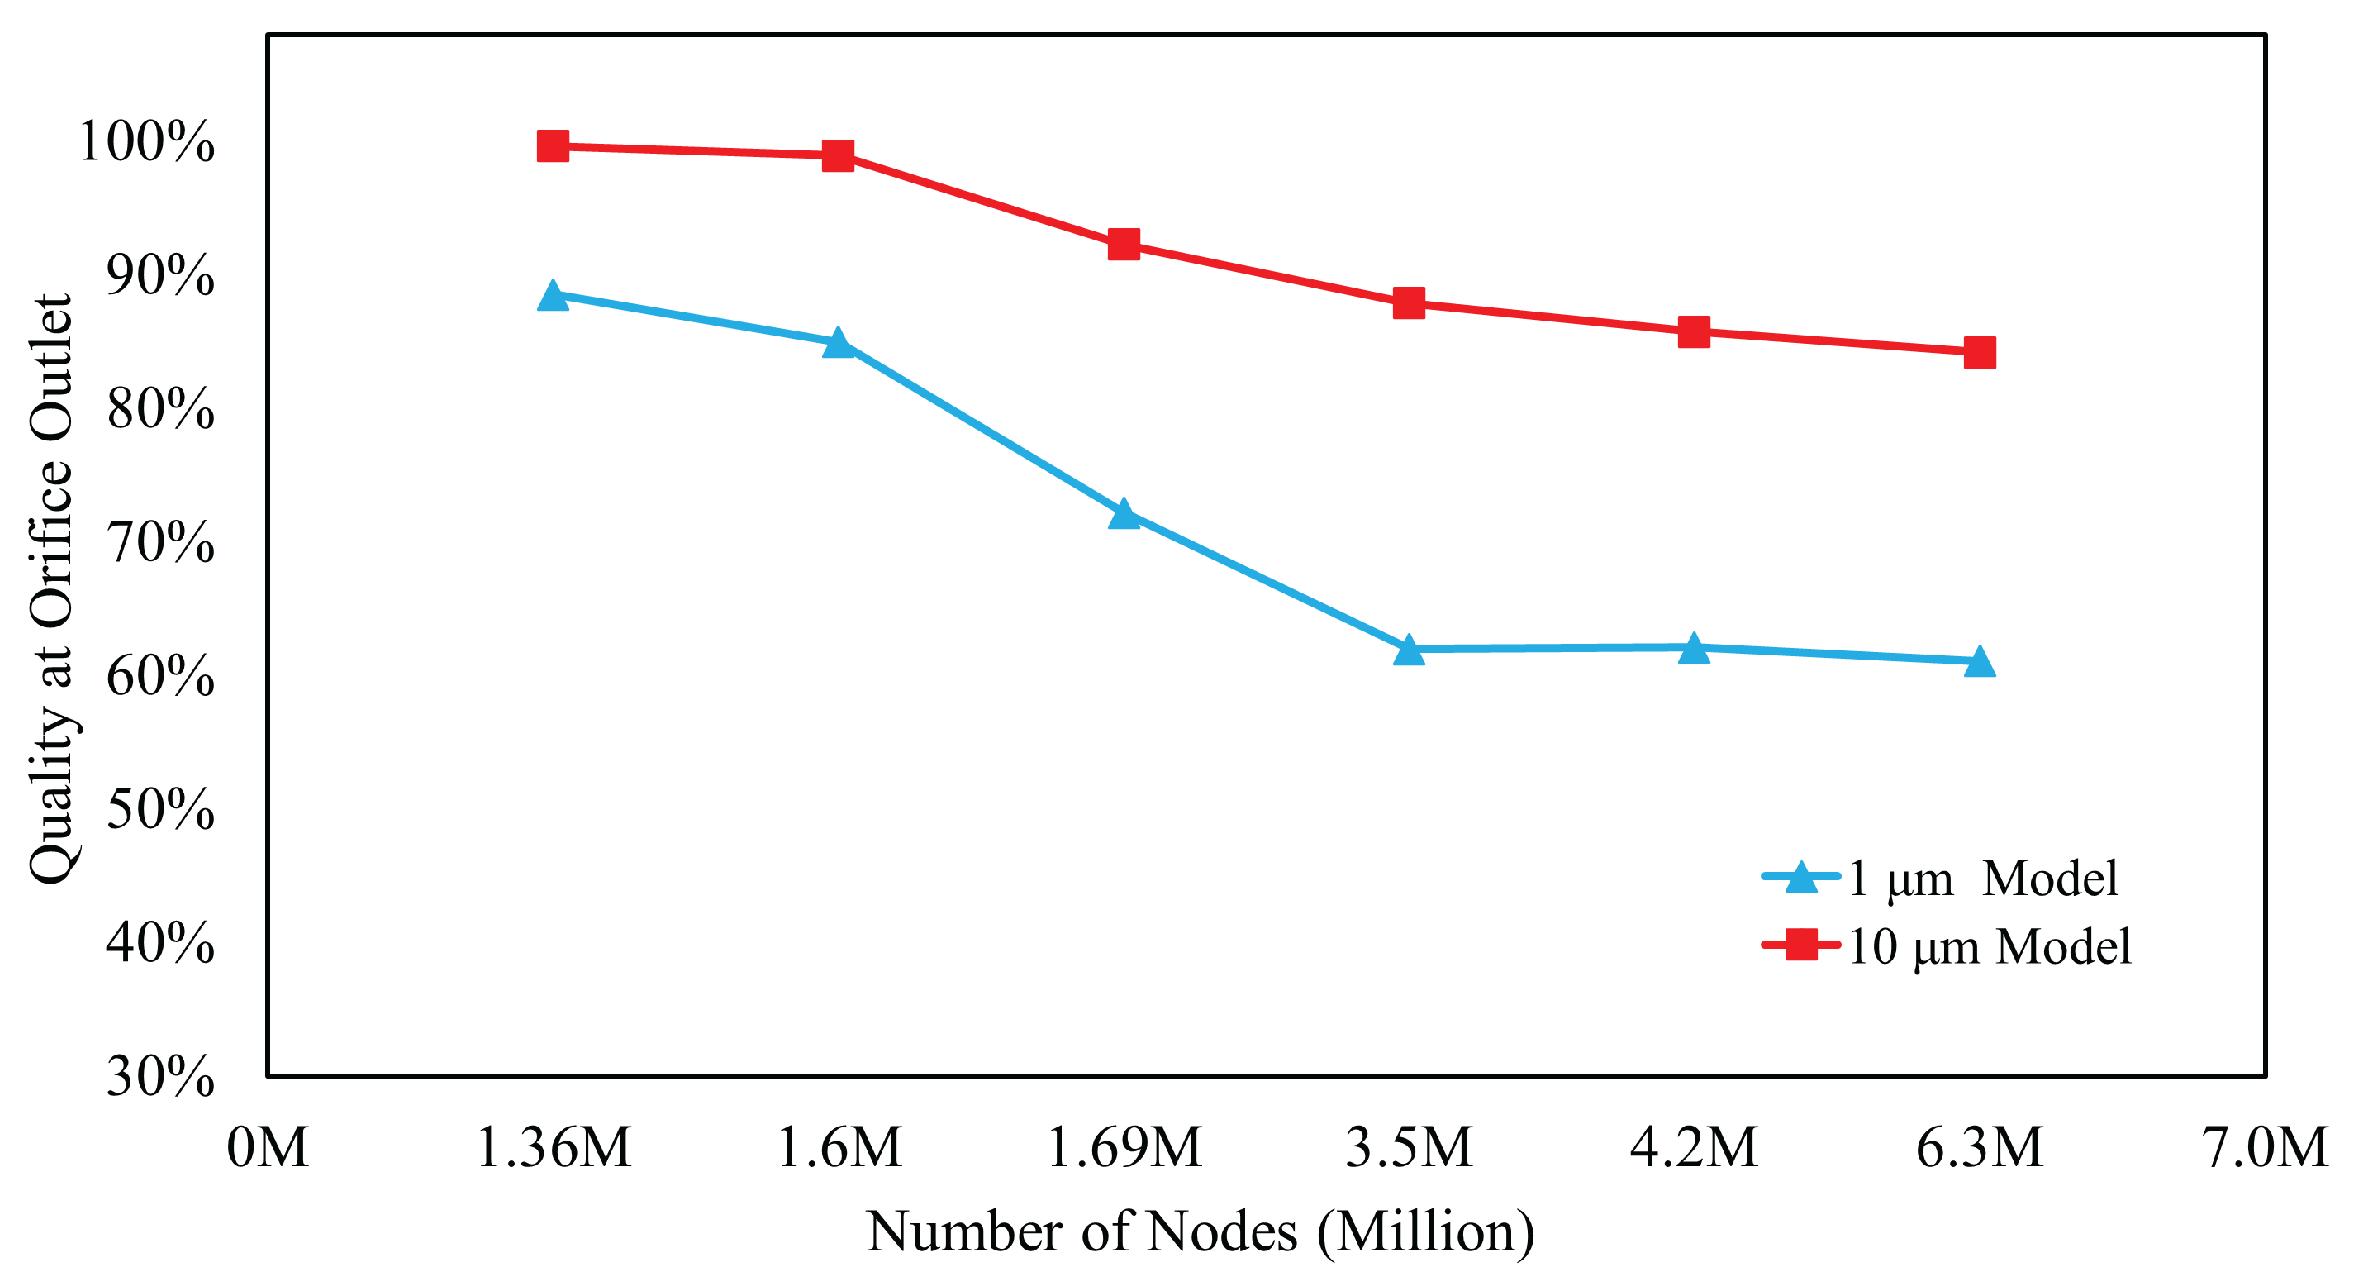
Since the separator consists of many curved surfaces and small holes, the tetra/mixed type meshing was used to better fit the mesh with the model. For the partitioning methods, the robust mode by which sufficient parts are divided was used. To accurately capture the boundary layer flow during the simulation process, all parts of the wall were added to the prism mesh in this study, and the grid was set to 5 layers. Before the particle quantity sensitivity analysis, we also completed a mesh independence study. The nodes’ quantities were, respectively, from 1.3 million to 6.3 million. The three-dimensional computational domain was discretized to an unstructured grid using the ICEM CFD meshing tool. As shown in
Figure 3, with the number of nodes at more than 4.2 million, the result of the steam quality at the orifice outlet changed within 3% from 4.2 million nodes to 6.3 million nodes. The changes were calculated by the function
, where SQ represents the steam quality with different mesh quantities. Thus, the study simulation of different conditions used the same order of magnitude as for node quantities over 4 million.
Generally, this study was based on a well-known moisture separator model. Most work was completed in the ANSYS platform. The preprocessing was based on the ANSYS ICEM CFD. The solving process applied was ANSYS CFX, which is known as a fully implicit coupled solver. As mentioned before, the turbulence model applied was the SST model, and the multiphase model was based on the particle transport theory. The discretization schemes in this study were chosen using the high-resolution method in CFX. The linear equations were solved using an algebraic multigrid method (AMG). Additionally, postprocessing was applied via ANSYS CFD-post.
2.3. Problem Description
To study the influence of different structures of the swirl vane separator, three different geometries—with different vane bending angles, different vane quantities, and different vane locations—were used.
Figure 4,
Figure 5 and
Figure 6 show the schematics of these different structures, respectively.
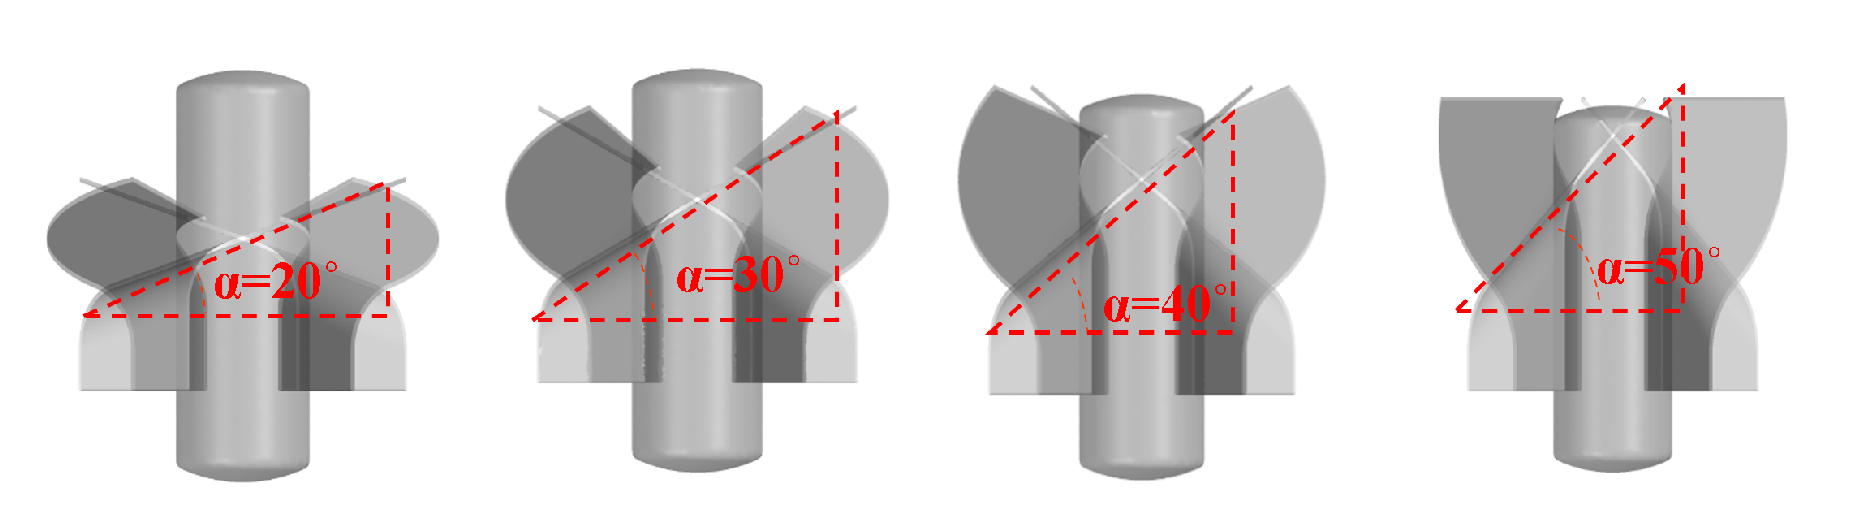
Figure 4 shows the vane bending angle
as the angle between the curved line of the swirl vane and the horizontal line. Four angle cases, namely, 20
, 30
, 40
, and 50
, were chosen.
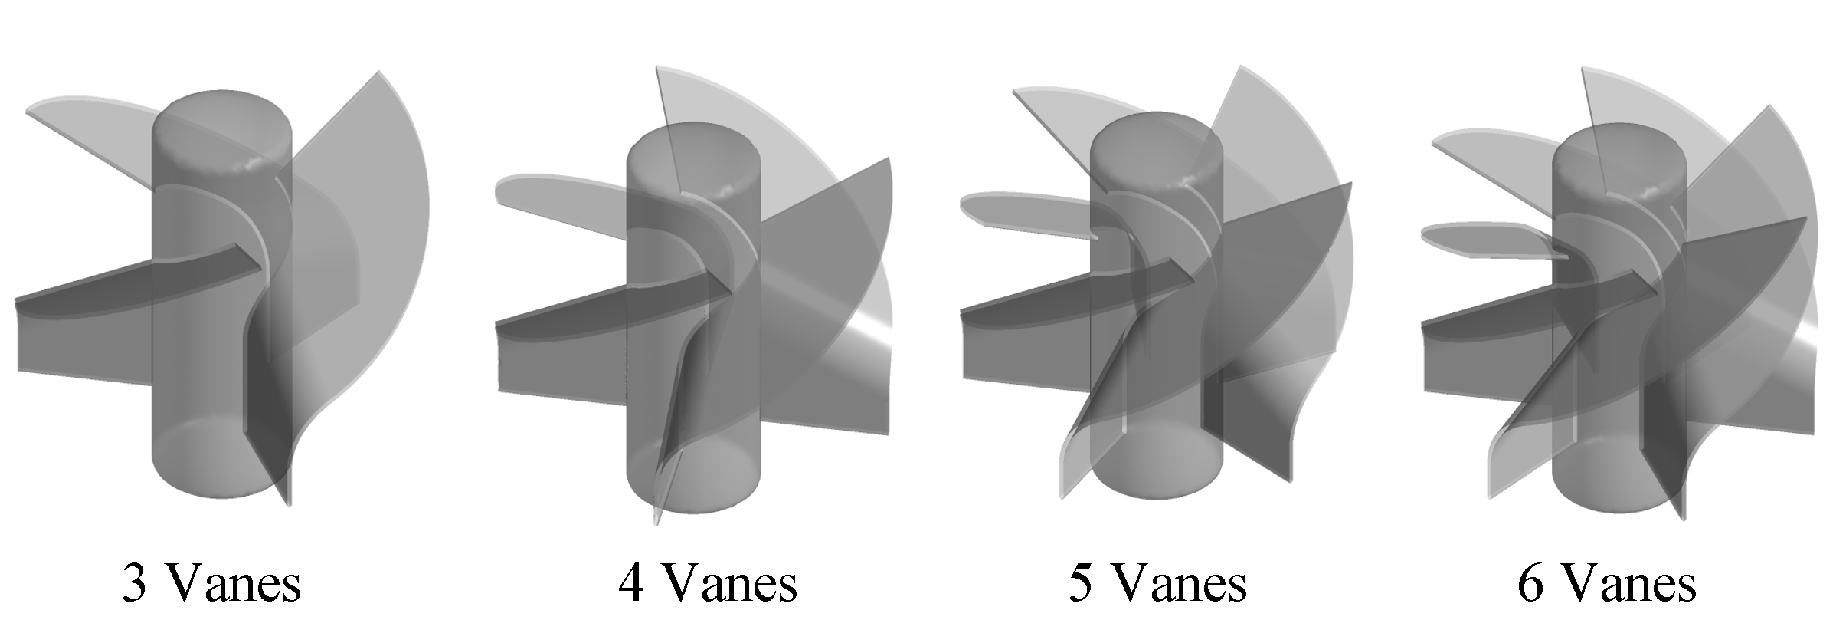
Figure 5 shows the variation in swirl vane quantities from 3 to 6.
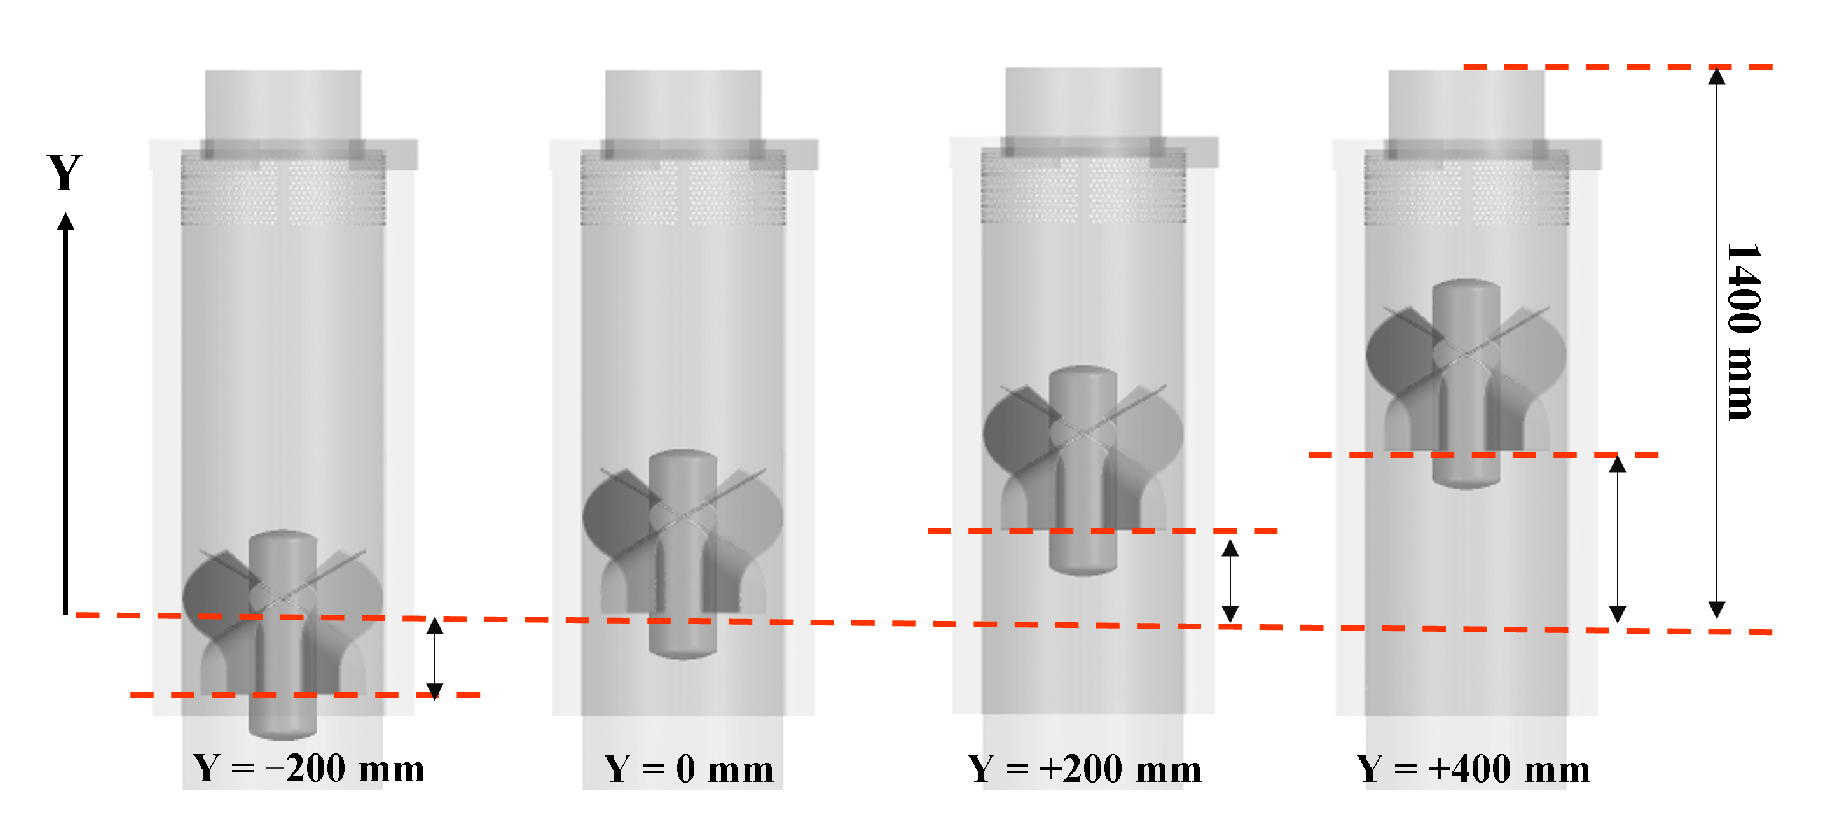
Figure 6 shows the different vane locations, where Y denotes the distance from the outline of the vane bottom to the original vane bottom outline. The reference model origin point was defined as the distance between the orifice outlet plane and the swirl start plane, which was equal to 1400 mm. The case with a bending angle of 30
, 4 vanes, and Y = 0 was taken as the reference model.
The physical parameters and boundary conditions used in this study are shown in
Table 1. The real operation conditions of the power plant were applied as the simulation conditions. The steam inlet mass flow rate and pressure were fixed as 30 kg/s and 6.9 MPa. The droplet particle size ranged from 1 to 50
m for all cases to investigate the influence on particle size. Forty-five cases were analyzed in this study and were divided into 4 groups. The pressure drop results were classified into 3 groups to visualize the effect of different geometries. The classification details are shown in
Table 2. Related discussions are provided in the next section.
The information about the droplet particle size distribution could be obtained from relevant references [
37,
38,
39,
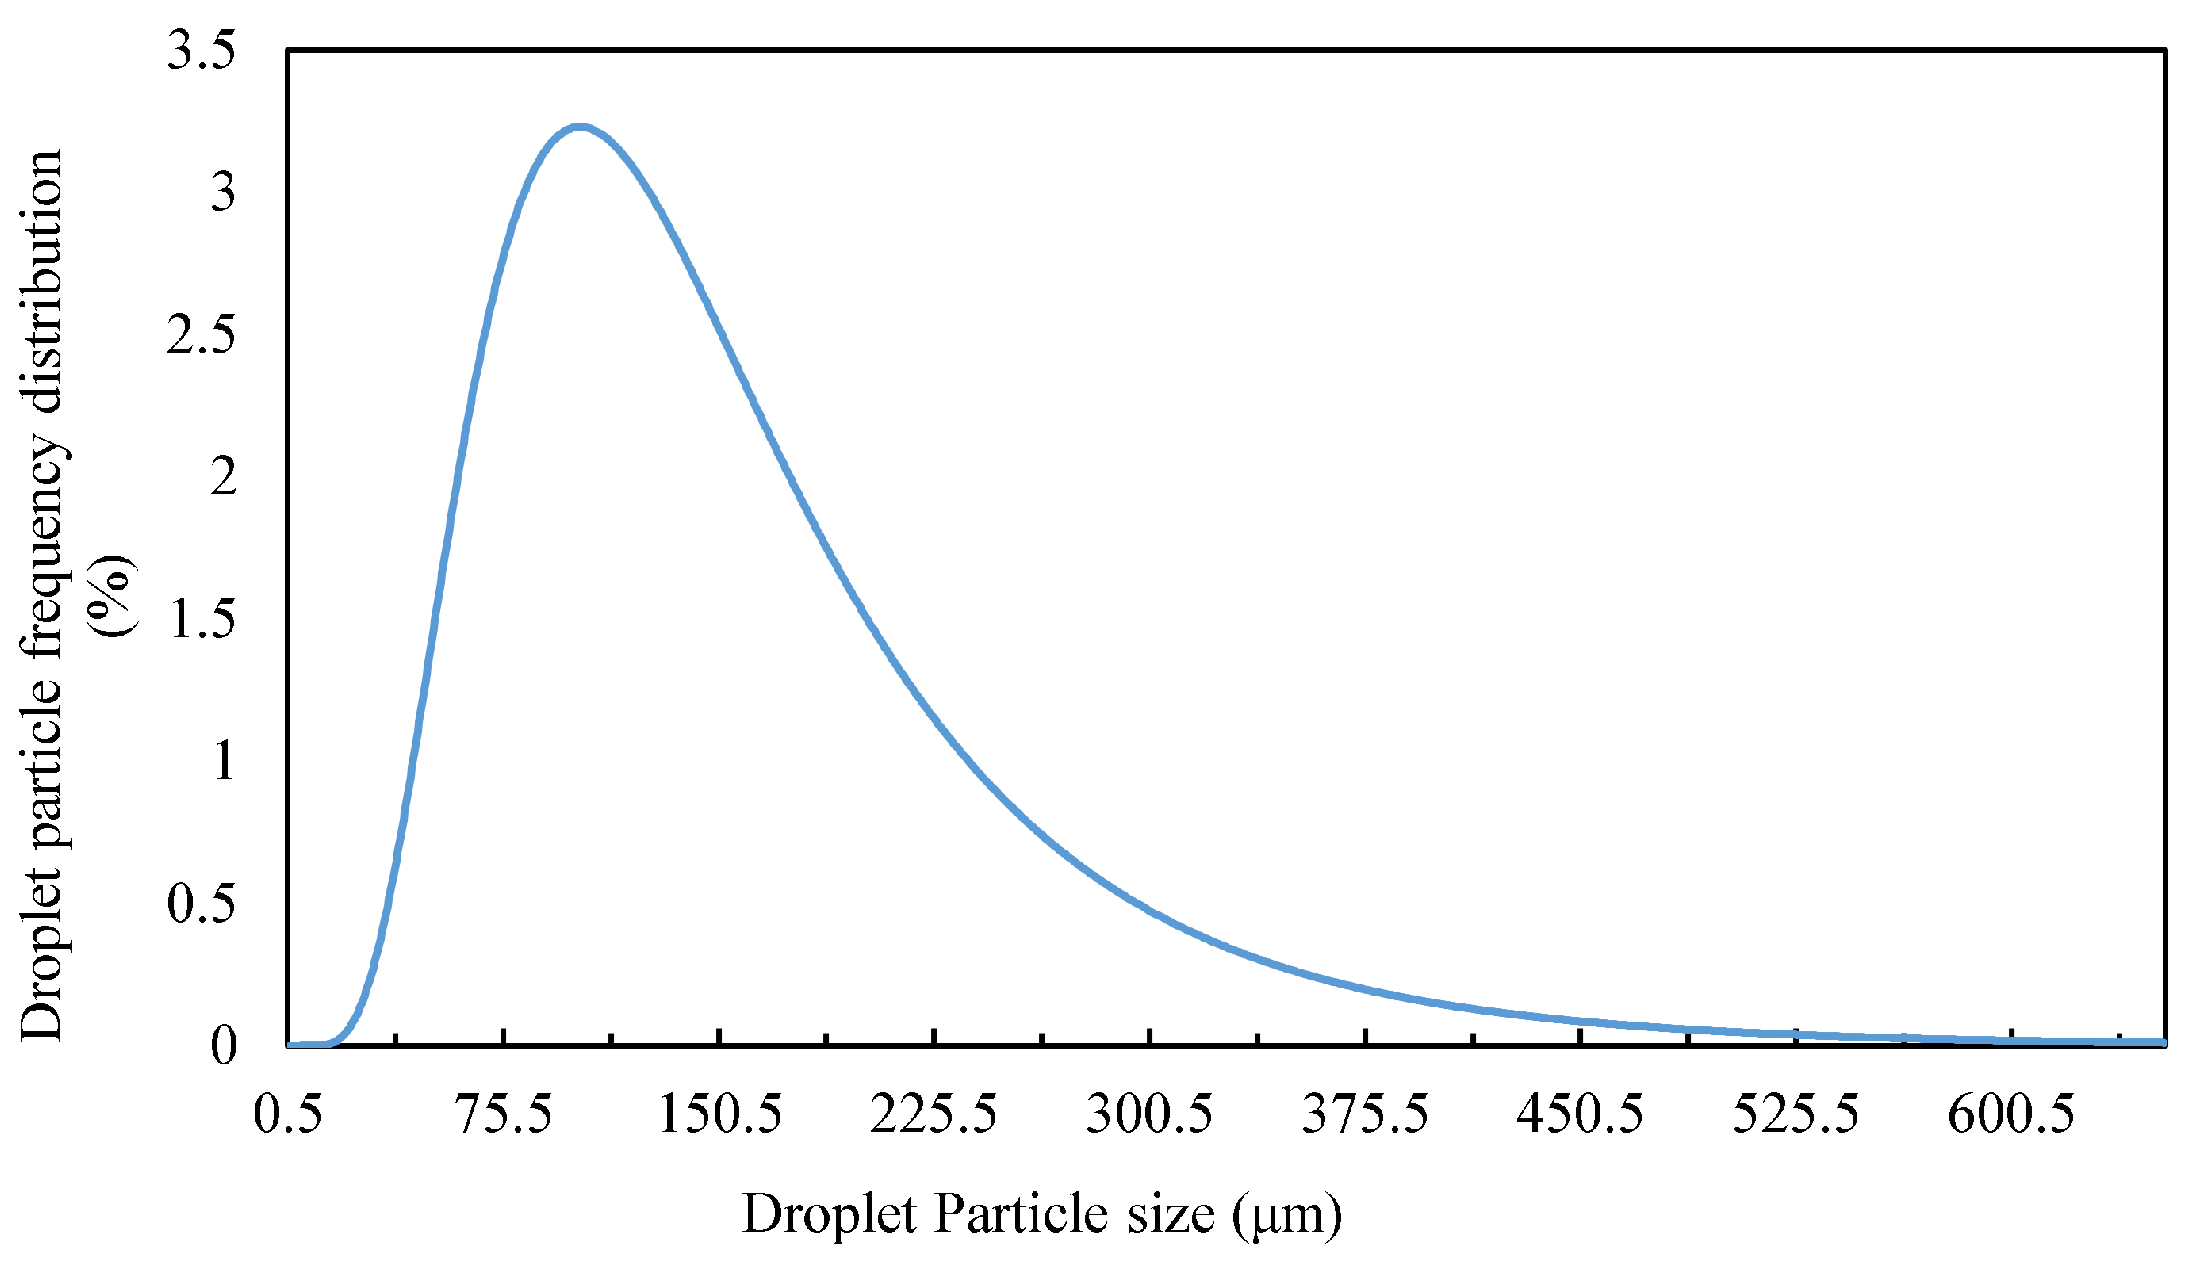
40], and the following conclusions could be made. When the number of droplet particles was large enough, the droplet size followed the law of a normal distribution, which is a continuous probability distribution of a random variable whose logarithm is normally distributed. Through this theory, we could further analyze the steam quality difference in this paper. The mathematical relationship between the steam quality result under a specific particle size and the real steam quality result could be determined. We provide the expression of the droplet size normal distribution as follows:
where
D represents the diameter of the droplet,
represents the average droplet size in this paper, and
represents the standard deviation of the droplet size. The average droplet size was set to be 138
m, the standard variance
, and the amplitude coefficient
[
40]. The droplet particle size normal distribution is shown in
Figure 7.
After integrating the equation, the cumulative distribution function could be obtained. After multiplying and summing the result of the numerical solution in this paper and the result of the distribution function, we obtained the theoretical real steam quality at the outlet of the moisture separator. The function was as follows:
represents the steam quality after the separator, represents the simulated results of the steam quality after the steam separator at a specific droplet size n, and F represents the percentage of the corresponding droplet size n obtained by the distribution function. Through this formula, we could calculate the real outlet steam quality of moisture separators of different structures.
3. Results and Discussion
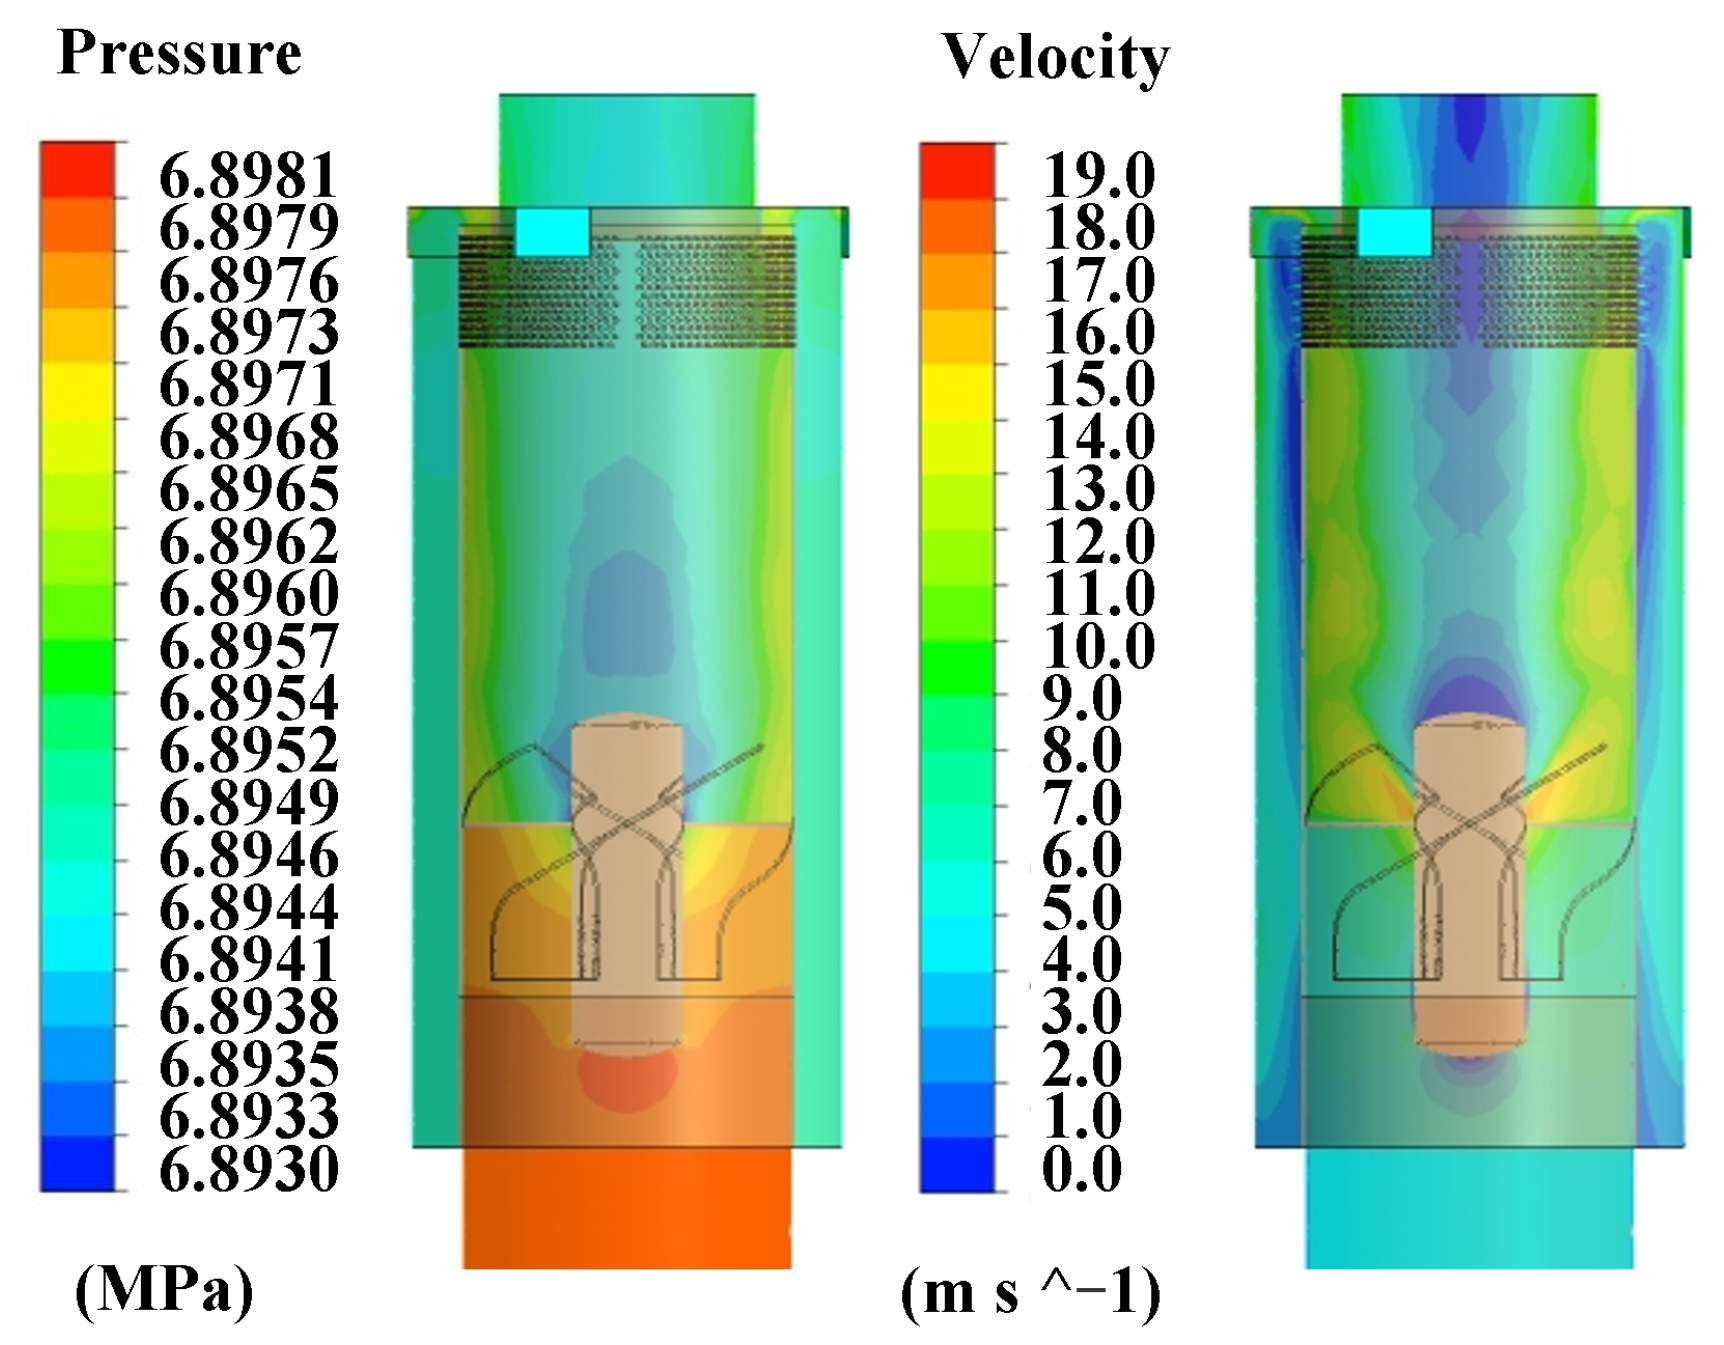
In this section, several flow fields are presented to briefly describe the separator flow. These results are based on the reference model with a bending angle of 30°, four swirl vanes, and a reference swirl vane location.
Figure 8 shows the pressure and velocity distribution of the reference model. The pressure decreased when the mixture flowed through swirl vanes. The velocity magnitude distribution had a different trend when the mixture flowed through the swirl vanes. The maximum velocity could be found at the bending point of the swirl vanes. The velocity magnitude of moisture was at a relatively low level compared to the location after the swirl vanes. On the contrary, when moisture flowed through the swirl vane, the velocity was significantly rotated. Finally, the fluid entered the downcomer through the holes in the riser, and the remaining part flowed into the tangent nozzle outlet and the orifice outlet. The reason for the sudden change in velocity and pressure was that the flow section area shrunk at the swirl vane. Similar results were found by He et al. [
41] and Fang et al. [
24]. The distribution of velocity in the separator changed sharply near the swirl vane. The corresponding visualizations can be seen in
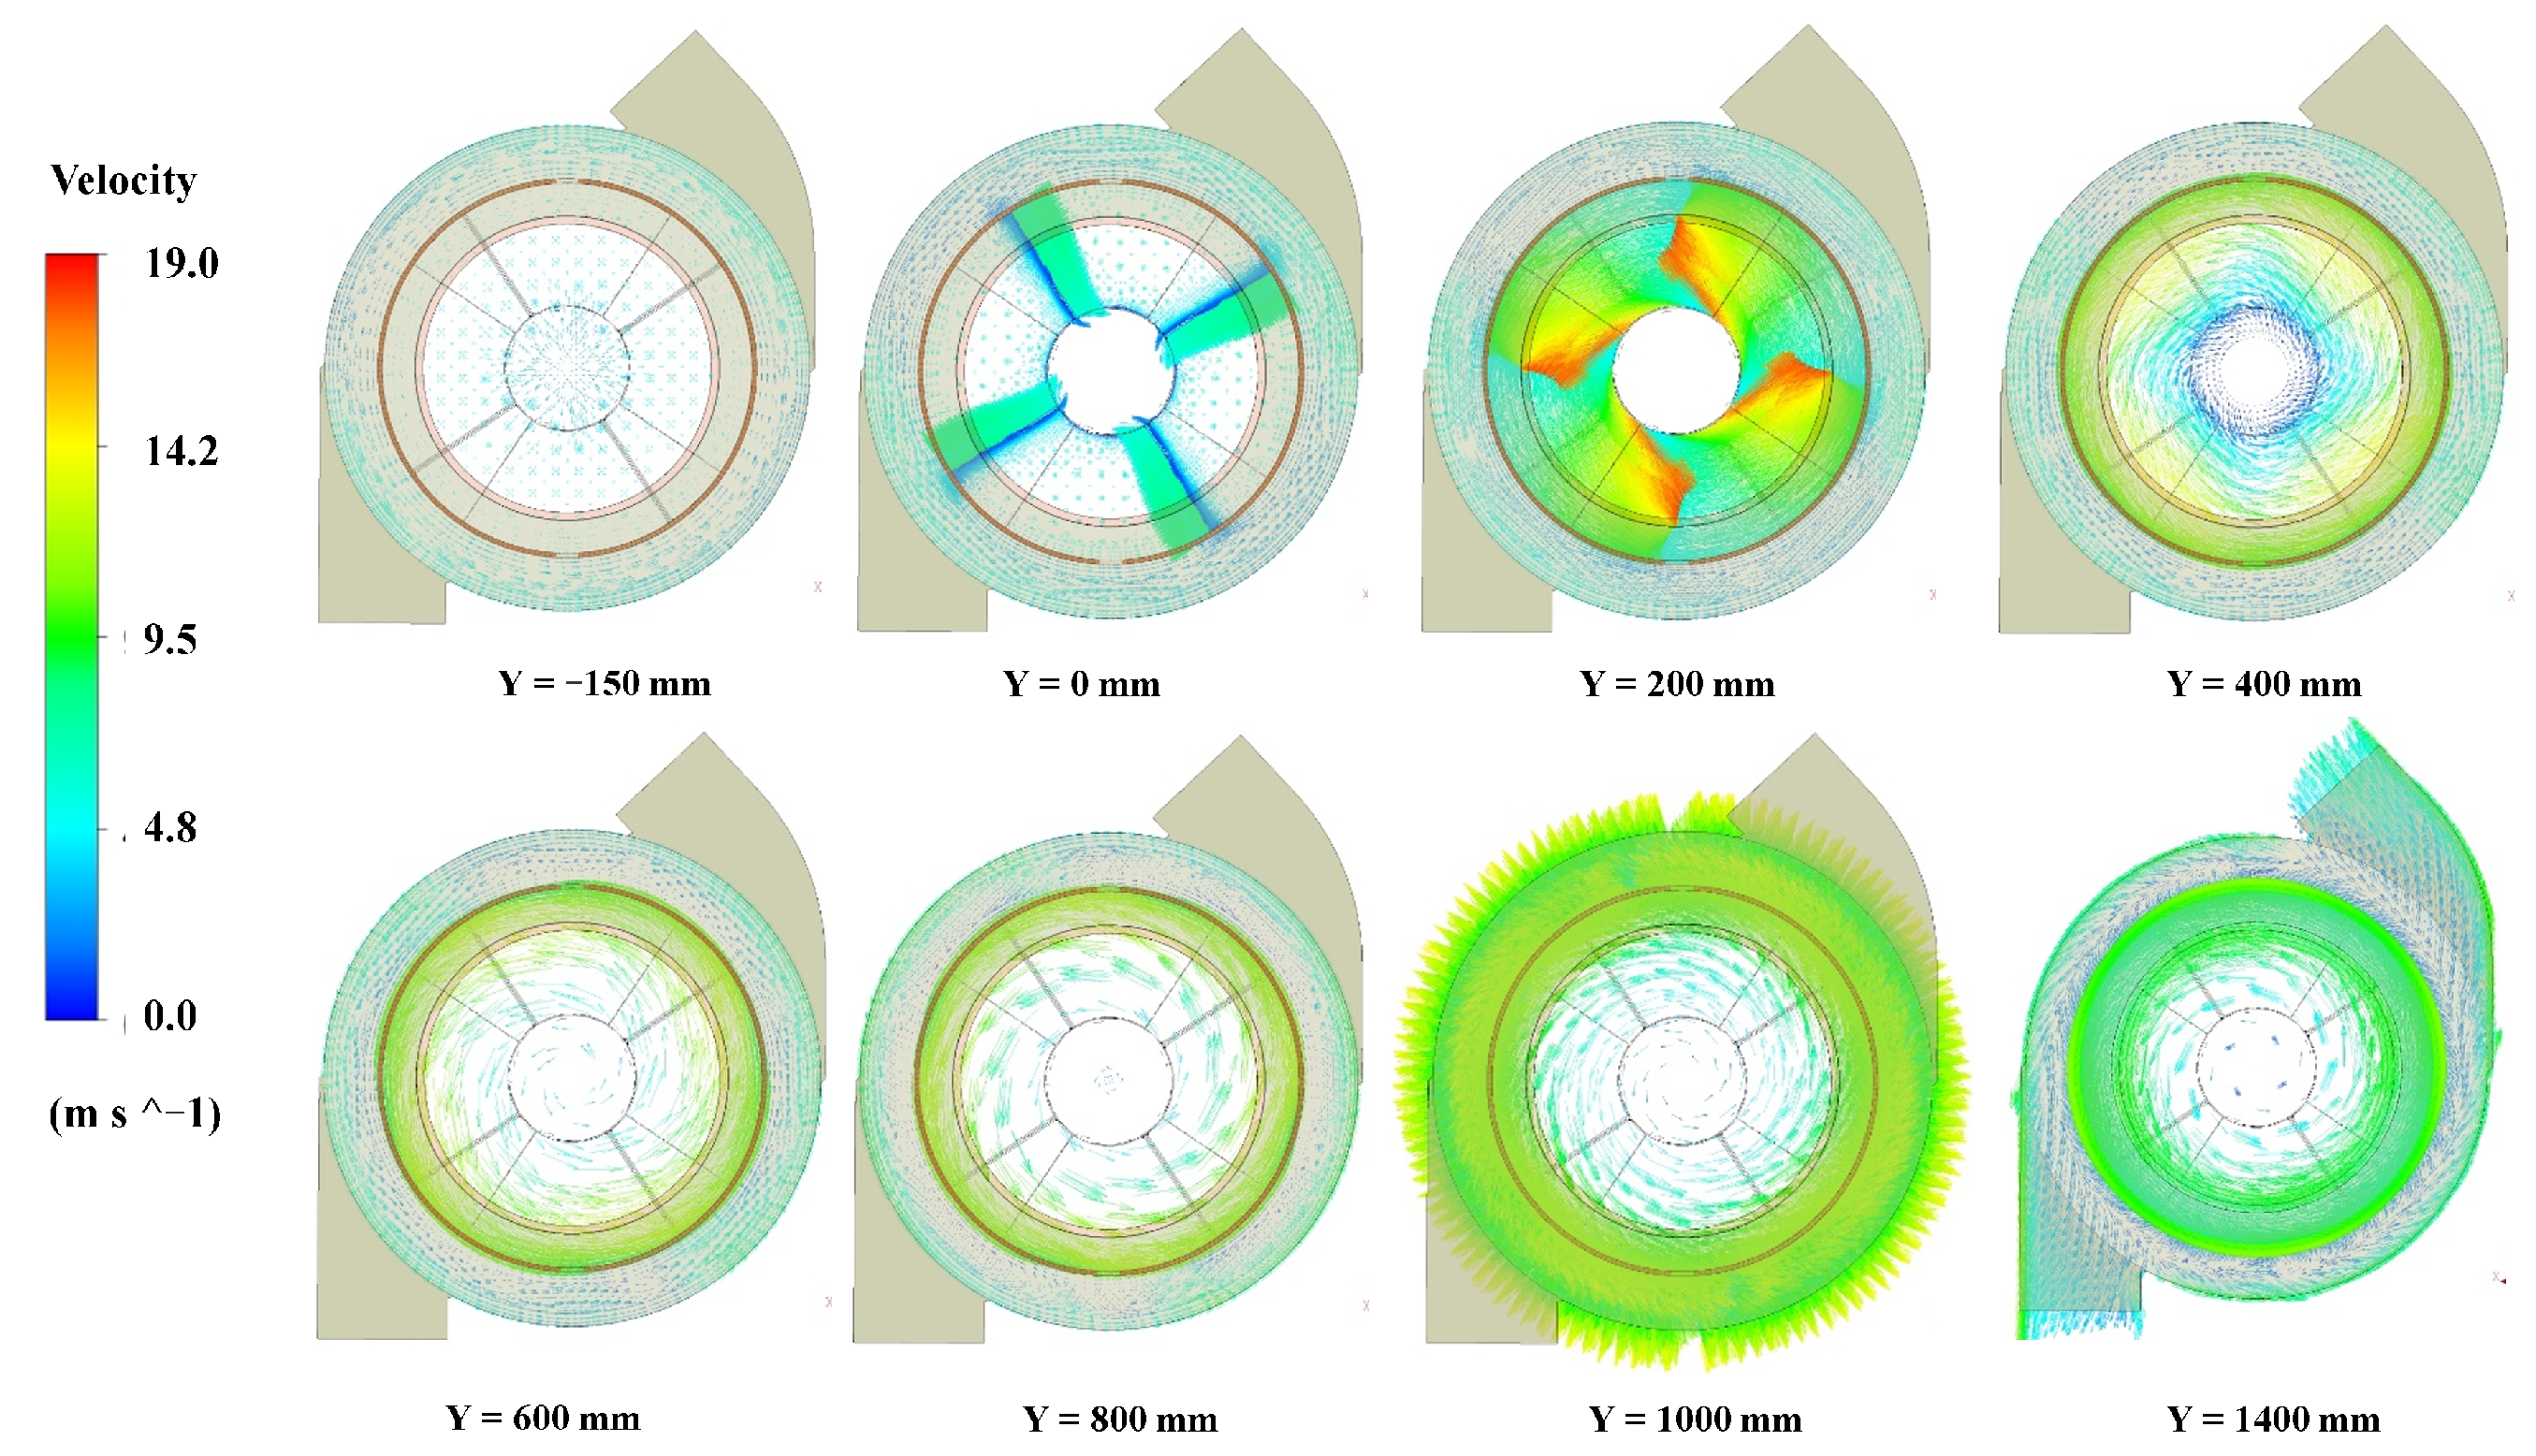
Figure 9 for different locations along the Y axis. Y = −150 mm and Y = 1400 mm represent the moisture separator’s bottom and top, respectively. The figure at −150 mm shows that the mixture flow had no swirl before the swirl vane. As the flow went up to 200 mm, a strong swirling flow was generated. At 1000 mm, it was clear that part of the mixture would flow out of the riser holes. Tian et al. [
21] found a similar distribution in sectional views. The above shows that the particle separated from the mixture process. Because of the swirl generated, several particles moved toward the wall and were captured by the wall. Several particles flowed out from the riser holes.
3.1. Droplet Separation Process
In this section, the effect of different structures on the droplets captured on the separator wall is considered. The results are summarized based on the reference model. Using the particle tracking method to simulate the process provided a simple way of capturing the water droplets’ motion features during the process of the steam flow [
31]. It allowed us to understand the correlation principle of the particles being captured by the wall in the separator.
Firstly, in
Figure 10, the streamline and velocity isosurface of the moisture flow are shown. It is obvious that the moisture obtained a swirl component during the process of passing through the swirl vanes. This caused the moisture to flow in the vertical direction with a tangential velocity. The droplet particles in the mixture fluid were collected by the riser wall when they encountered it. For the mixture, the density gap between the vapor and droplet particles were utilized for this process. As the density of the droplets was greater than that of the steam, the particles were subjected to a greater centrifugal force. Based on this principle, the swirl velocity in the separator needed to be increased if the droplets were to easily migrate to the wall.
The results related to the particle size are summarized in the following sections. When the droplet particle diameter increased, the mass of the droplets was continuously increased. This led to an increase in the centrifugal force of the droplet particles. The particles moved in the direction of the center of the cut surface and were captured by the wall. All three structures made use of this centrifugal force. As in the other two sections, the results show that the change in the swirl vane angle had the highest influence on particle capture.
In contrast, Fang et al. [
23] concluded that, when the particle diameter exceeded 102
m, all droplet particles were separated from the steam, and Matsubayashi et al. [
8] illustrated that the critical particle size was 25
m. These different results are due to the different inlet steam velocity in these investigations. Our results showed a critical particle size of around 50
m because the inlet velocity was higher than in previous studies. It is understood that different researchers have different critical particle sizes due to the particle collection rate. The results came from different kinds of geometries and various definition conditions in the simulations.
3.2. Effect of the Vane Bending Angle
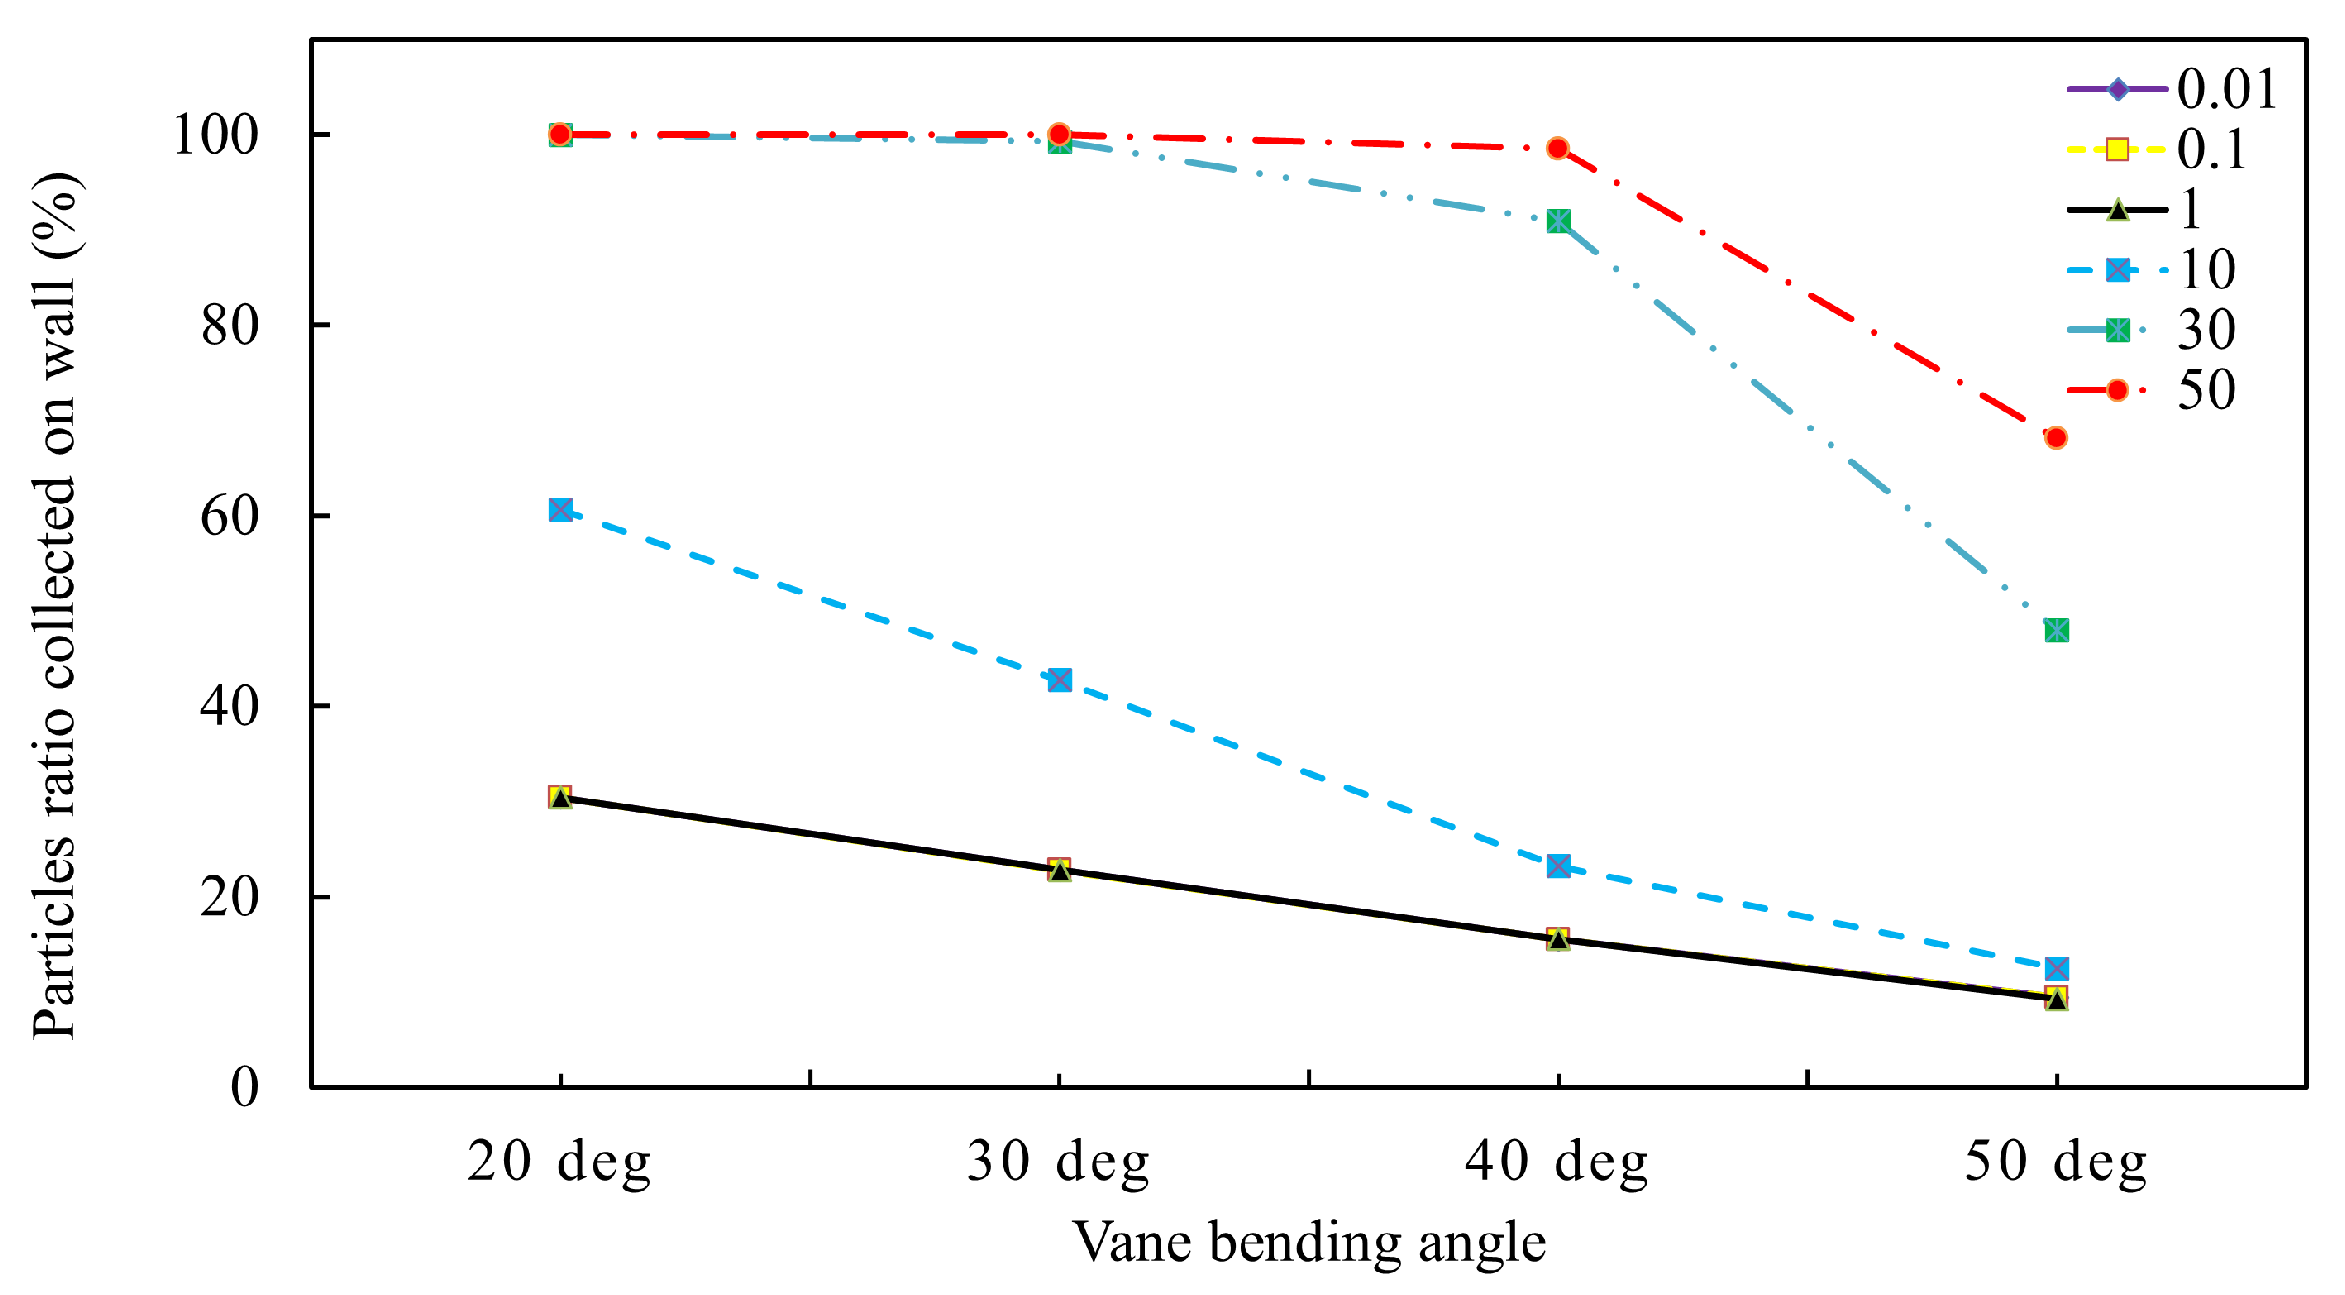
Figure 11 shows the rate of particles collected on the wall with changing vane angles and droplet sizes. The vertical axis is the ratio of water droplets removed by wall collisions. As the droplet size increased, the rate of particles collected on the wall increased. A vane bending angle from 20
to 50
maintained a constant collection rate if the droplet size was less than 1
m. A vane angle of 20
had the highest particle collection rate, and a vane bending angle of 50
had the lowest collection rate, even at 50
m. Moreover, the critical particle size, which is a collection rate on the wall of 100% at a certain particle size, was 10∼30
m in the 20
model, 30∼50
m in the 30
model, and over 50
m in the 40
model.
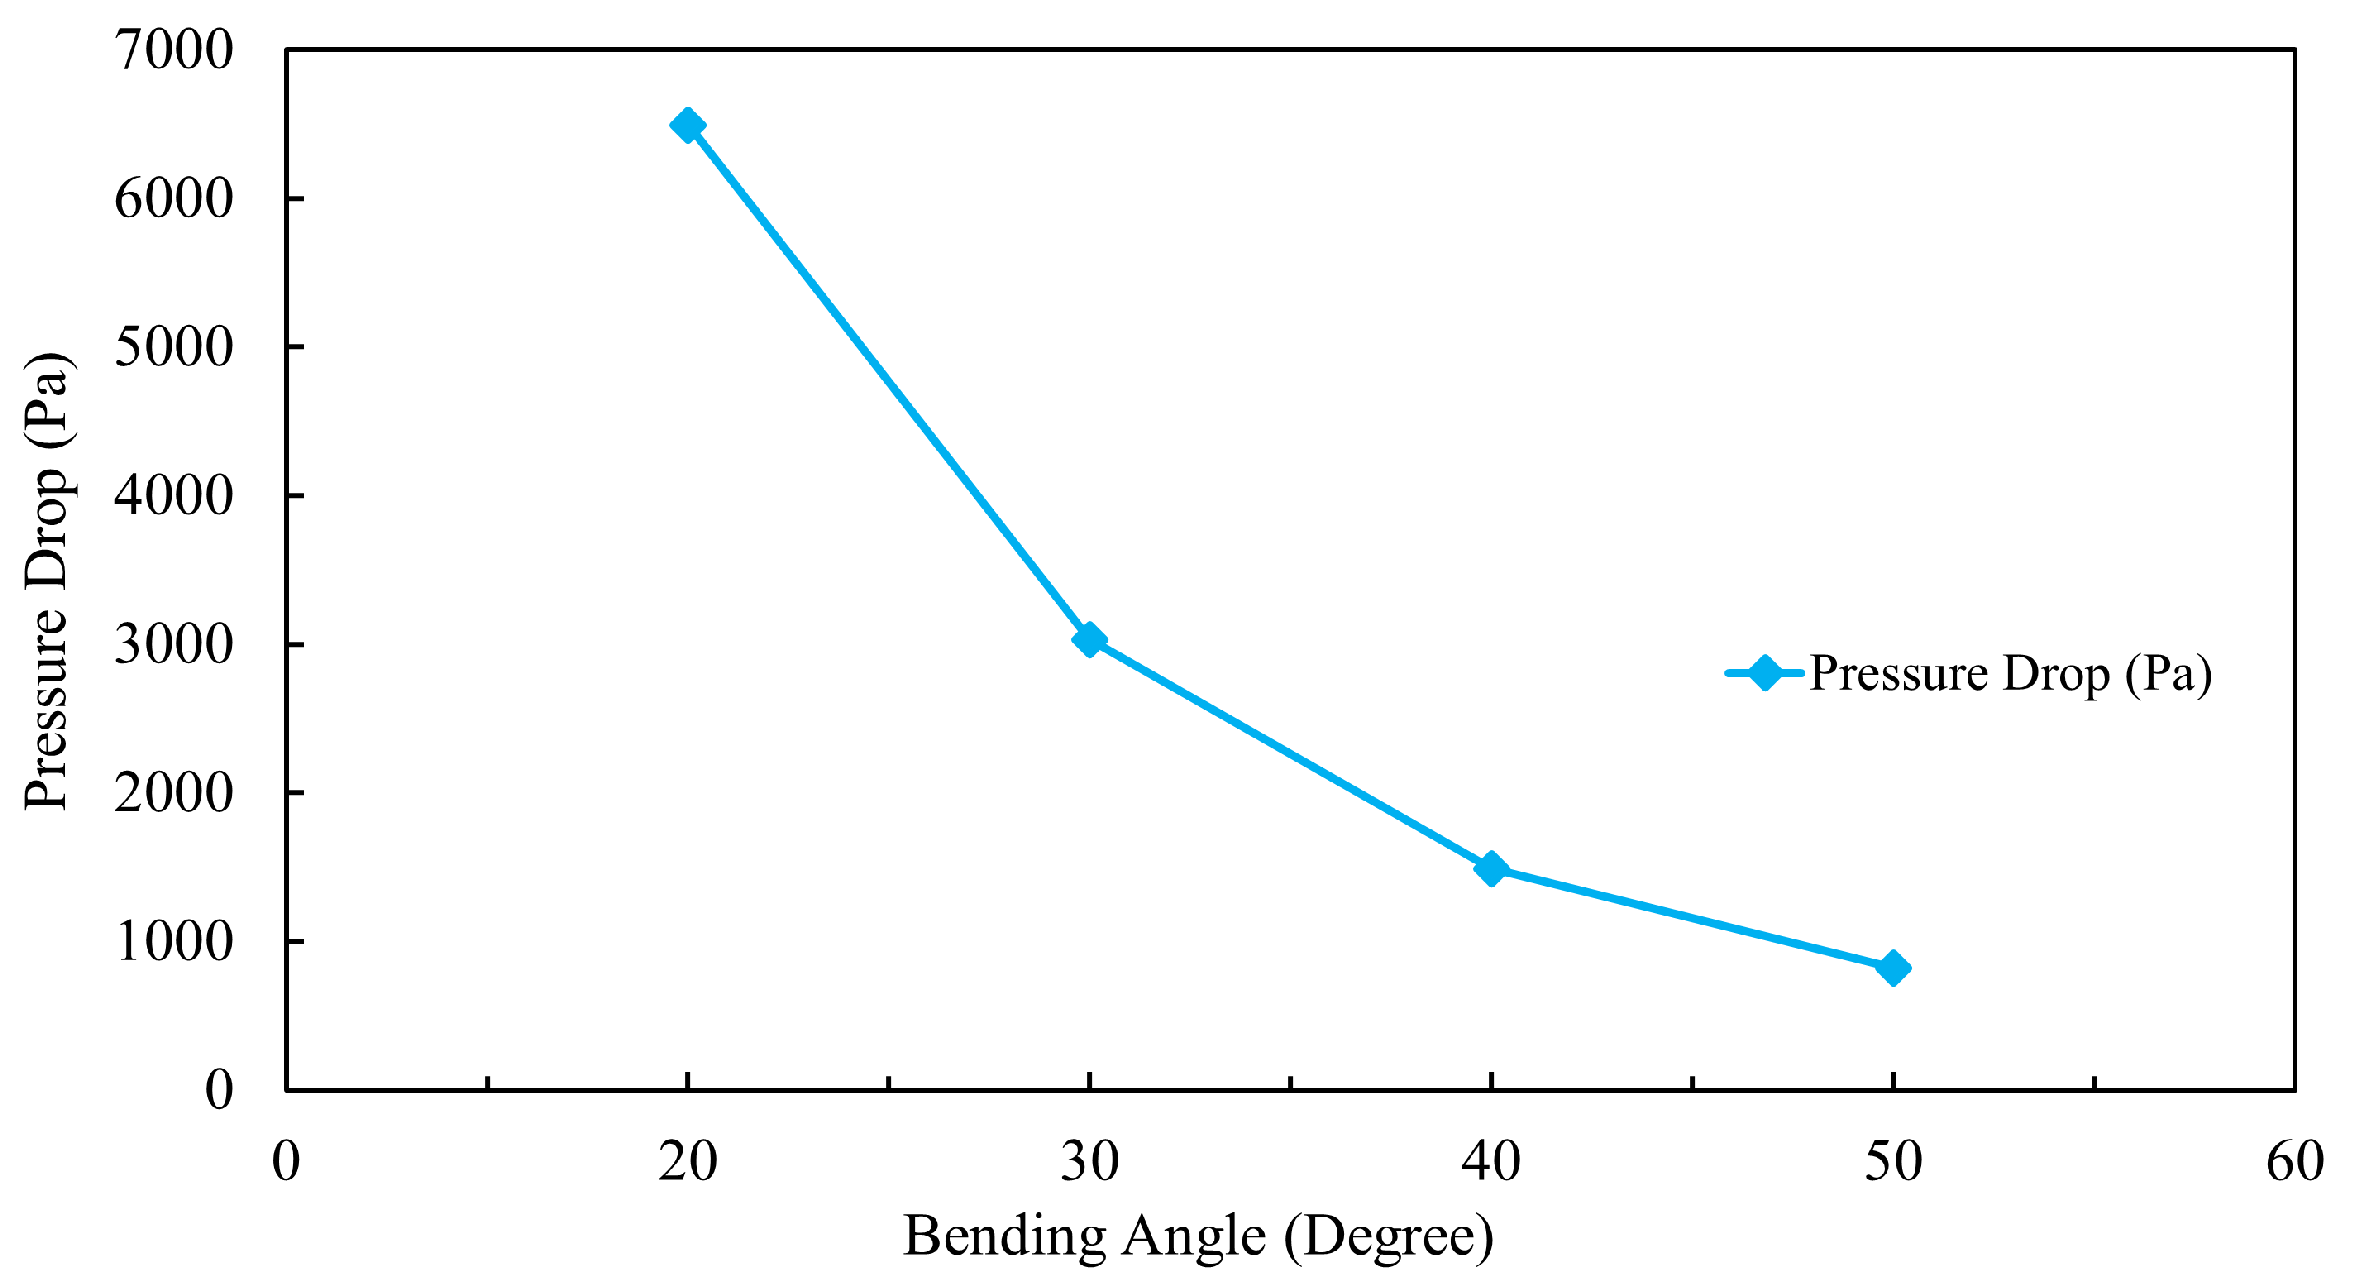
Figure 12 shows the pressure drop between the inlet and orifice outlet for various bending angles. With the bending angle changing from 20
to 50
, the pressure dropped by 6444, 3035, 1579, and 820.5 Pa, respectively, which implied that the pressure of the separator decreased gradually as the bending angle increased. As the vane angle decreased by 10
, the pressure drop increased to nearly twice that of the higher angle. The figure shows that a vane angle of 50° had the lowest pressure drop. Because the swirl vanes were fixed in the moisture separator, the flow section areas decreased in the axis direction. This caused the local friction to increase, meaning that the pressure drop increased at the same time. It can be understood from the conservation of energy that the reduction of the pressure term would result in an increase in the velocity term and the internal energy.
The steam that passes through the orifice outlet directly passes through the secondary moisture separator and then flows to the turbine. As the steam quality in a moisture separator outlet should be at least 80% [
34], the steam that flows out of the primary moisture separator should maintain a high quality to ensure the stability and efficiency of the turbine. The steam quality can be calculated by using Equation (
12).
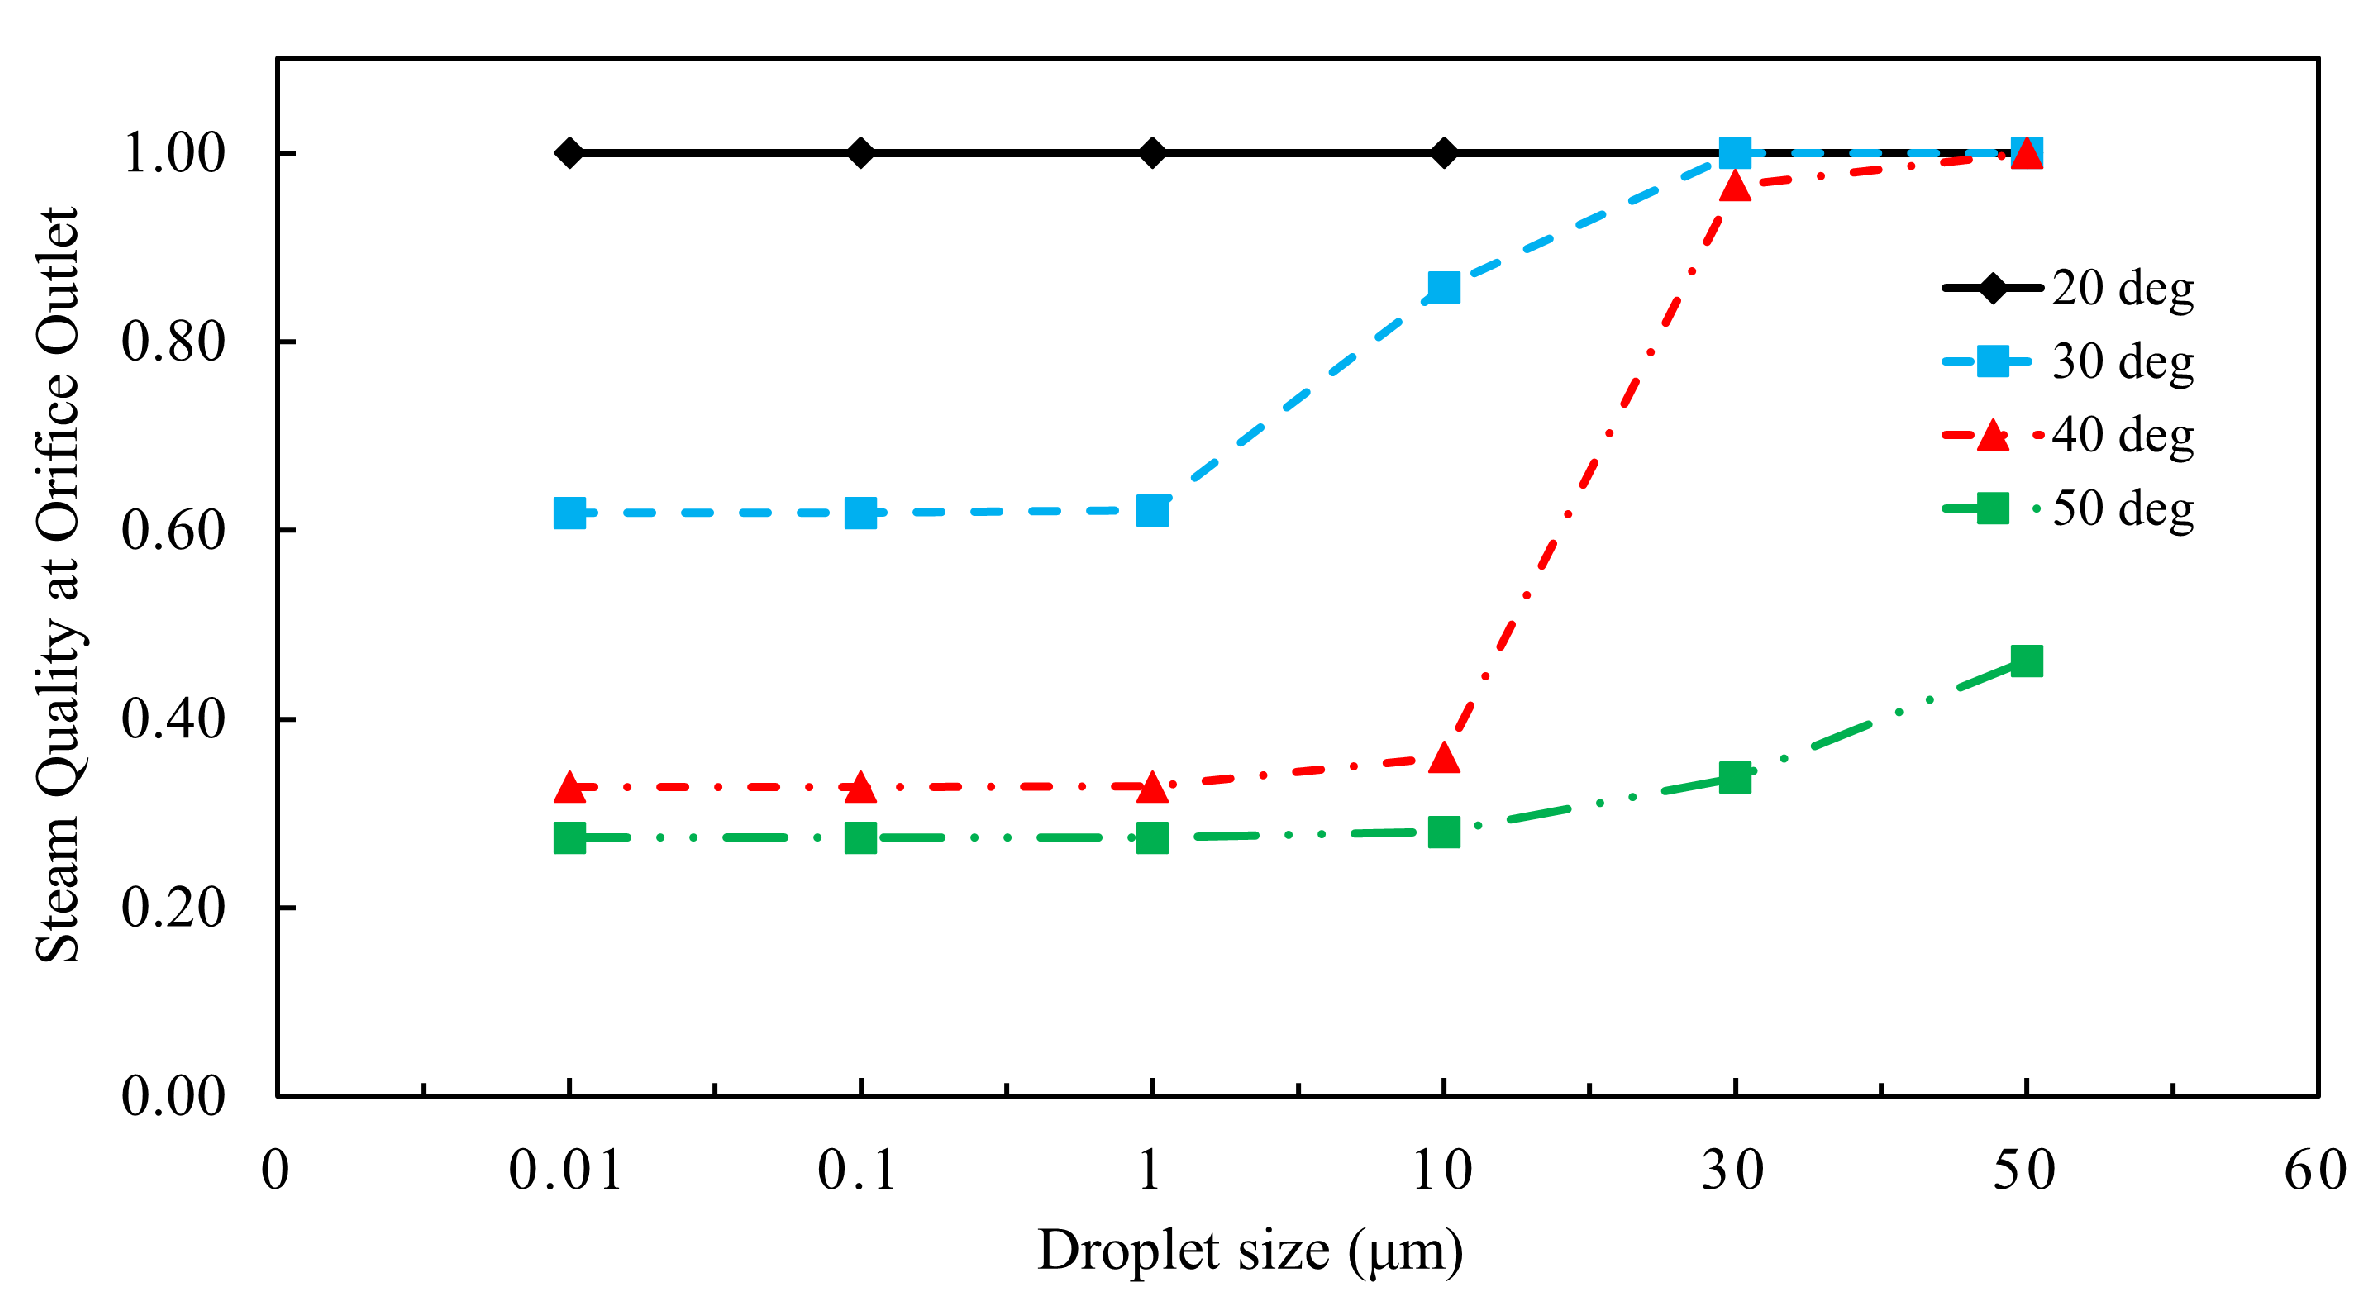
Figure 13 shows the steam quality at the orifice outlet for various swirl vane bending angles. The size of the droplet had no effect if the bending angle was 20
. The steam quality in the direction of the orifice outlet was 100%, which implied that all water droplets were separated from the steam. When the vane angle was 30
, the steam quality began at 62% at a particle size of 1
m and was 100% at 50
m. For a vane angle of 40
, the steam quality began at 32.3% at a particle size of 1
m and reached 100% at over 50
m. The geometry with a vane angle of 50
yielded the lowest efficiency in terms of steam quality; even for a particle size of 50
m, the orifice steam quality was only 40%. There were two reasons for this. Firstly, reducing the bending angle increased the resistance. This increased the local velocity. Secondly, the increase in particle diameter directly caused the mass of the droplet particles to increase. From the centrifugal force formula, the centrifugal force increased as the speed increased, and the mass increased. Fang et al. [
2] illustrated a separation efficiency change from 98.2% to 99.4% during a steam velocity increase from 2.5 m/s to 6 m/s. As our inlet velocity was greater than that, an orifice outlet steam quality of 100% was acceptable.
3.3. Effect of Vane Quantity
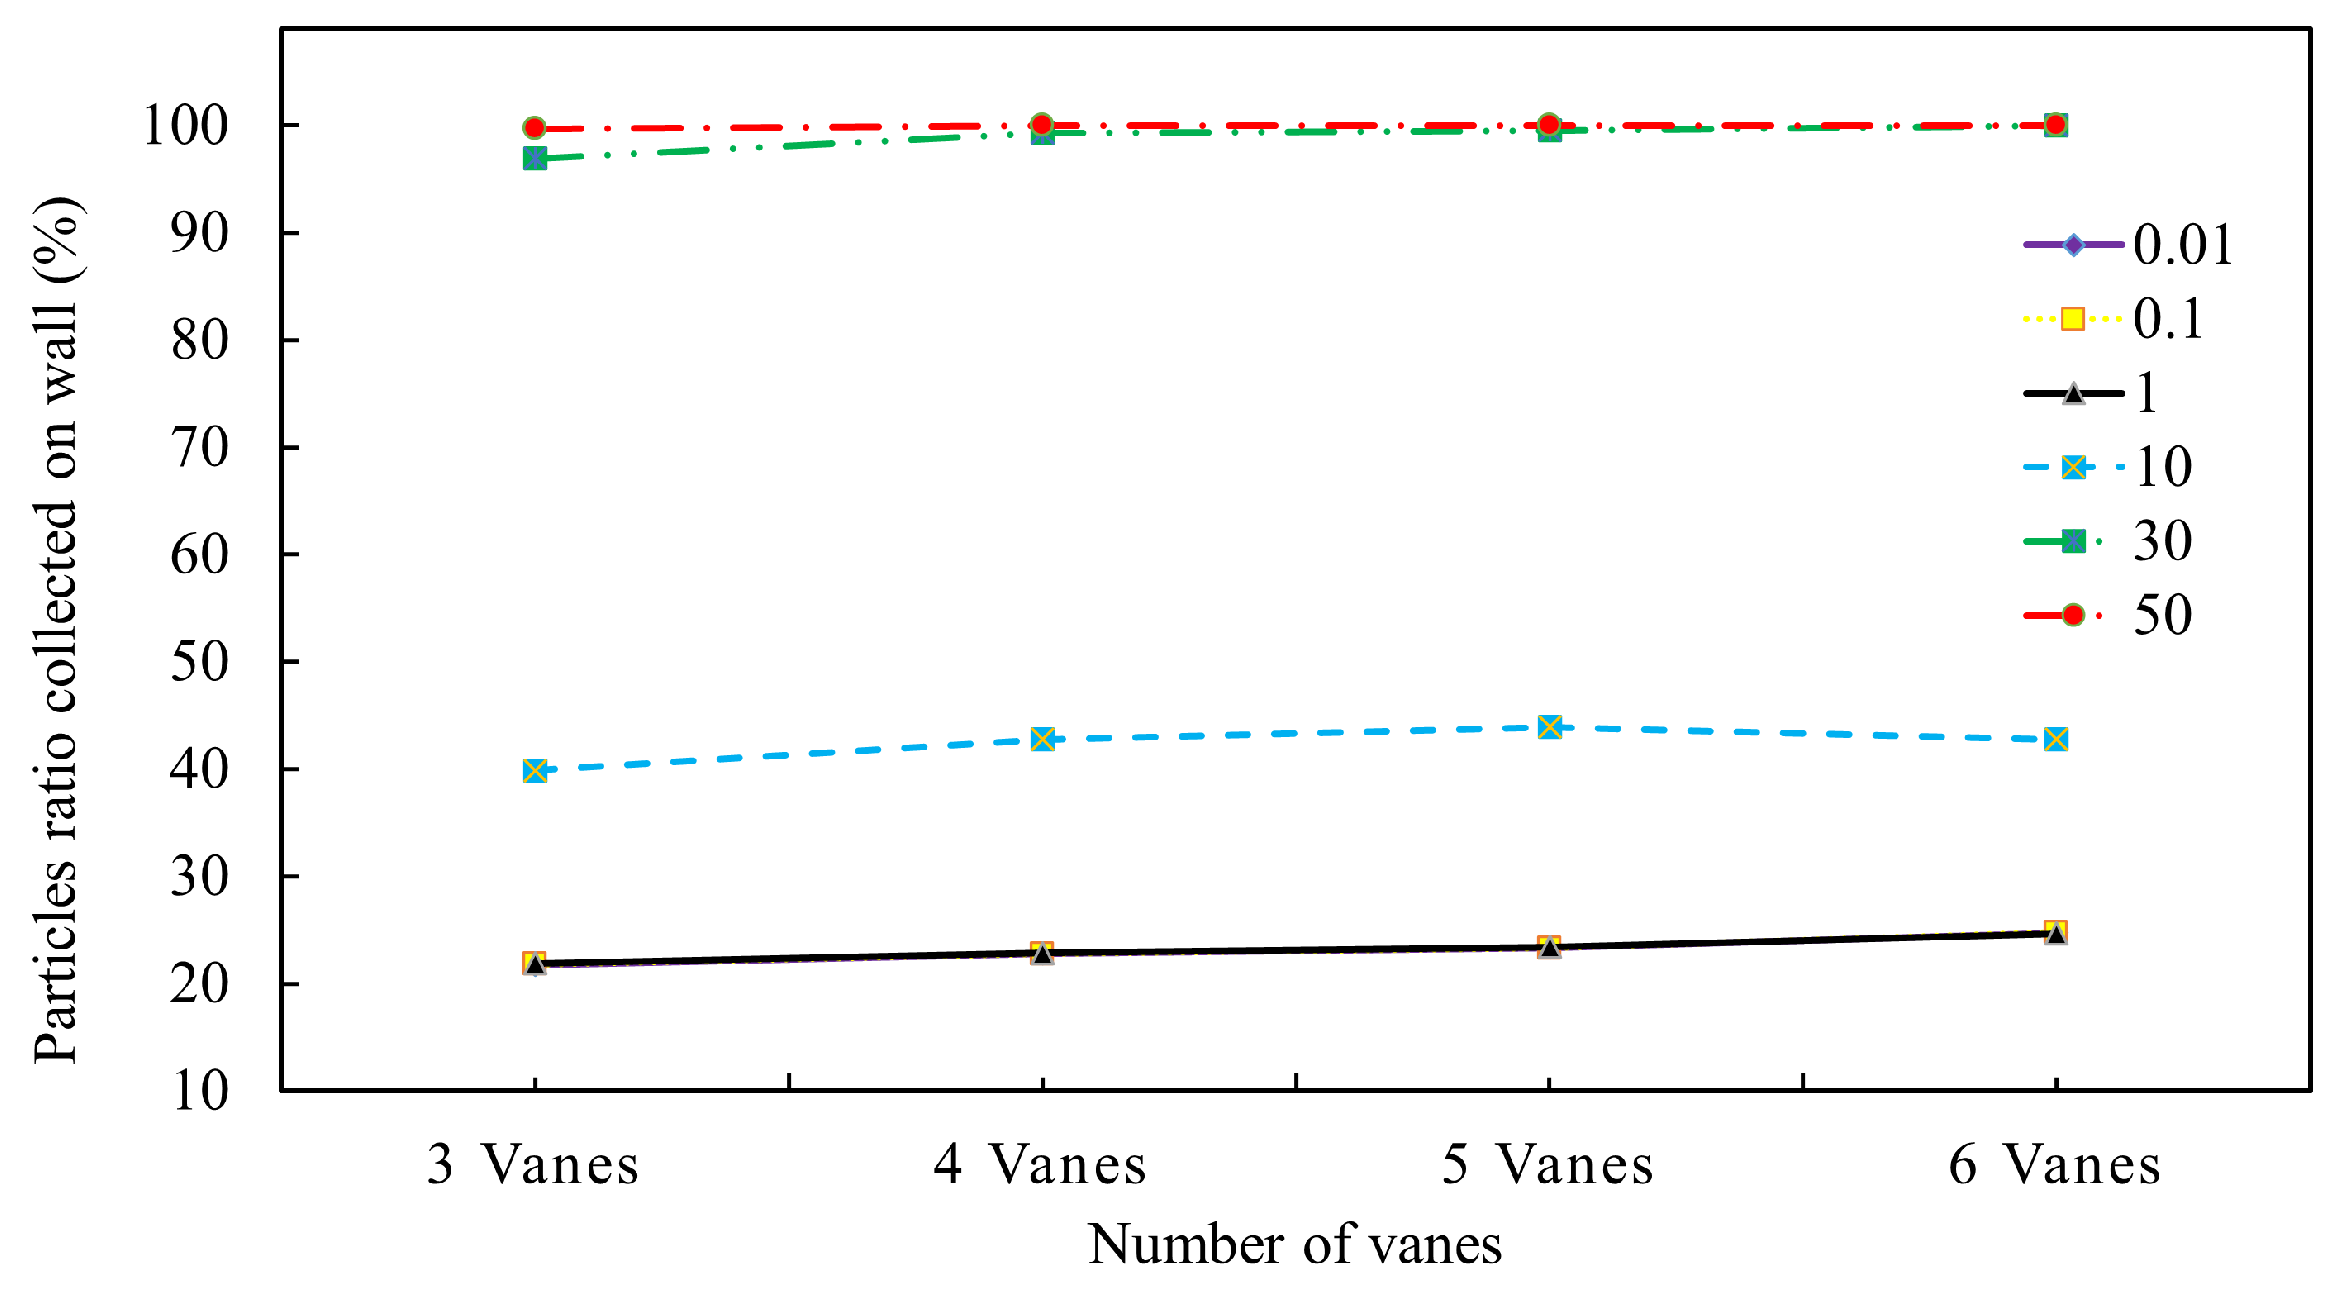
The probability of trapping droplet particles on the wall increased as the swirl vane quantities increased, as shown in
Figure 14. The vane quantity had little effect on particle collection. The particles were all captured by the wall when the diameter of the particles reached 30
m, implying that all particles were separated from the steam if the diameter exceeded 30
m.
Figure 15 shows the pressure drop between the inlet and outlet pressure of the moisture separator for various vane quantities. The pressure drop increased as the swirl vane quantity increased, implying that the resistance along the inside of the separator increased significantly. However, compared with the previous changing bending angle, the result was not as obvious. Thus, the flow section areas reduced more slowly as swirl vane quantities changed.
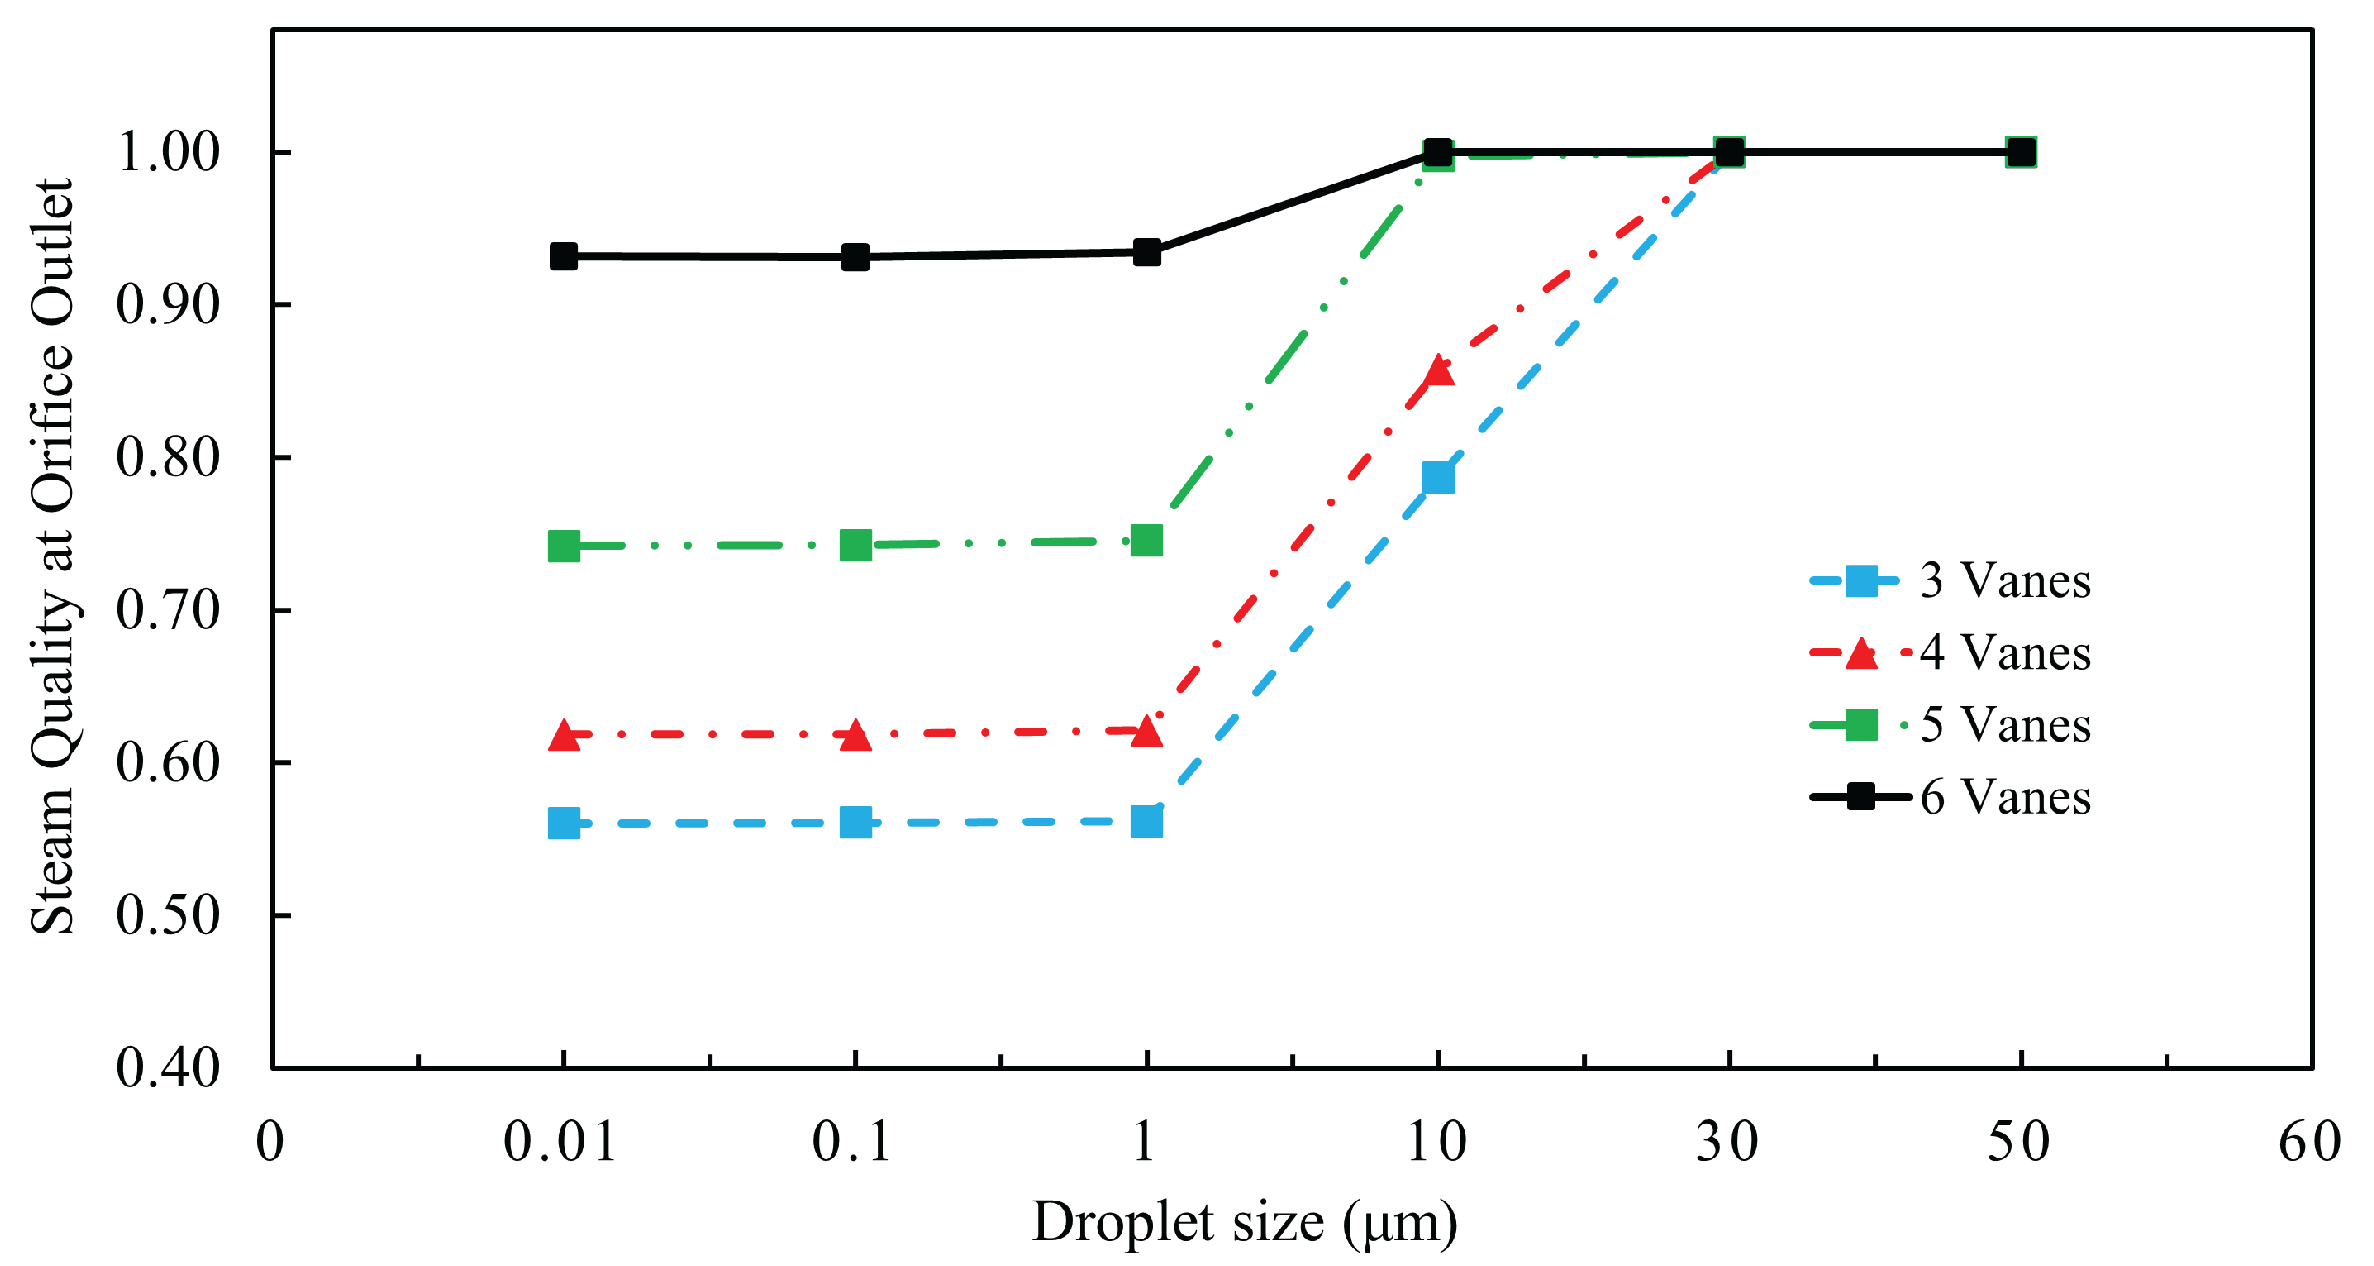
Figure 16 shows the steam quality at the orifice outlet for various swirl vane quantities. For six vanes, the steam quality in the direction of the orifice outlet exceeded 95%, which means that almost all water droplets were separated from the steam. For 3–6 vanes, the steam quality started from 56%, 62%, 74%, and 93%, respectively. Thus, the steam quality increased as the vane quantity increased. Similar results were found when more swirl vanes were fixed in the separator. As a result, the local resistance increased, which immediately led to a significant increase in speed. The droplet particles were subjected to more centrifugal force in this process, which was why the steam quality increased.
3.4. Effect of Vane Location
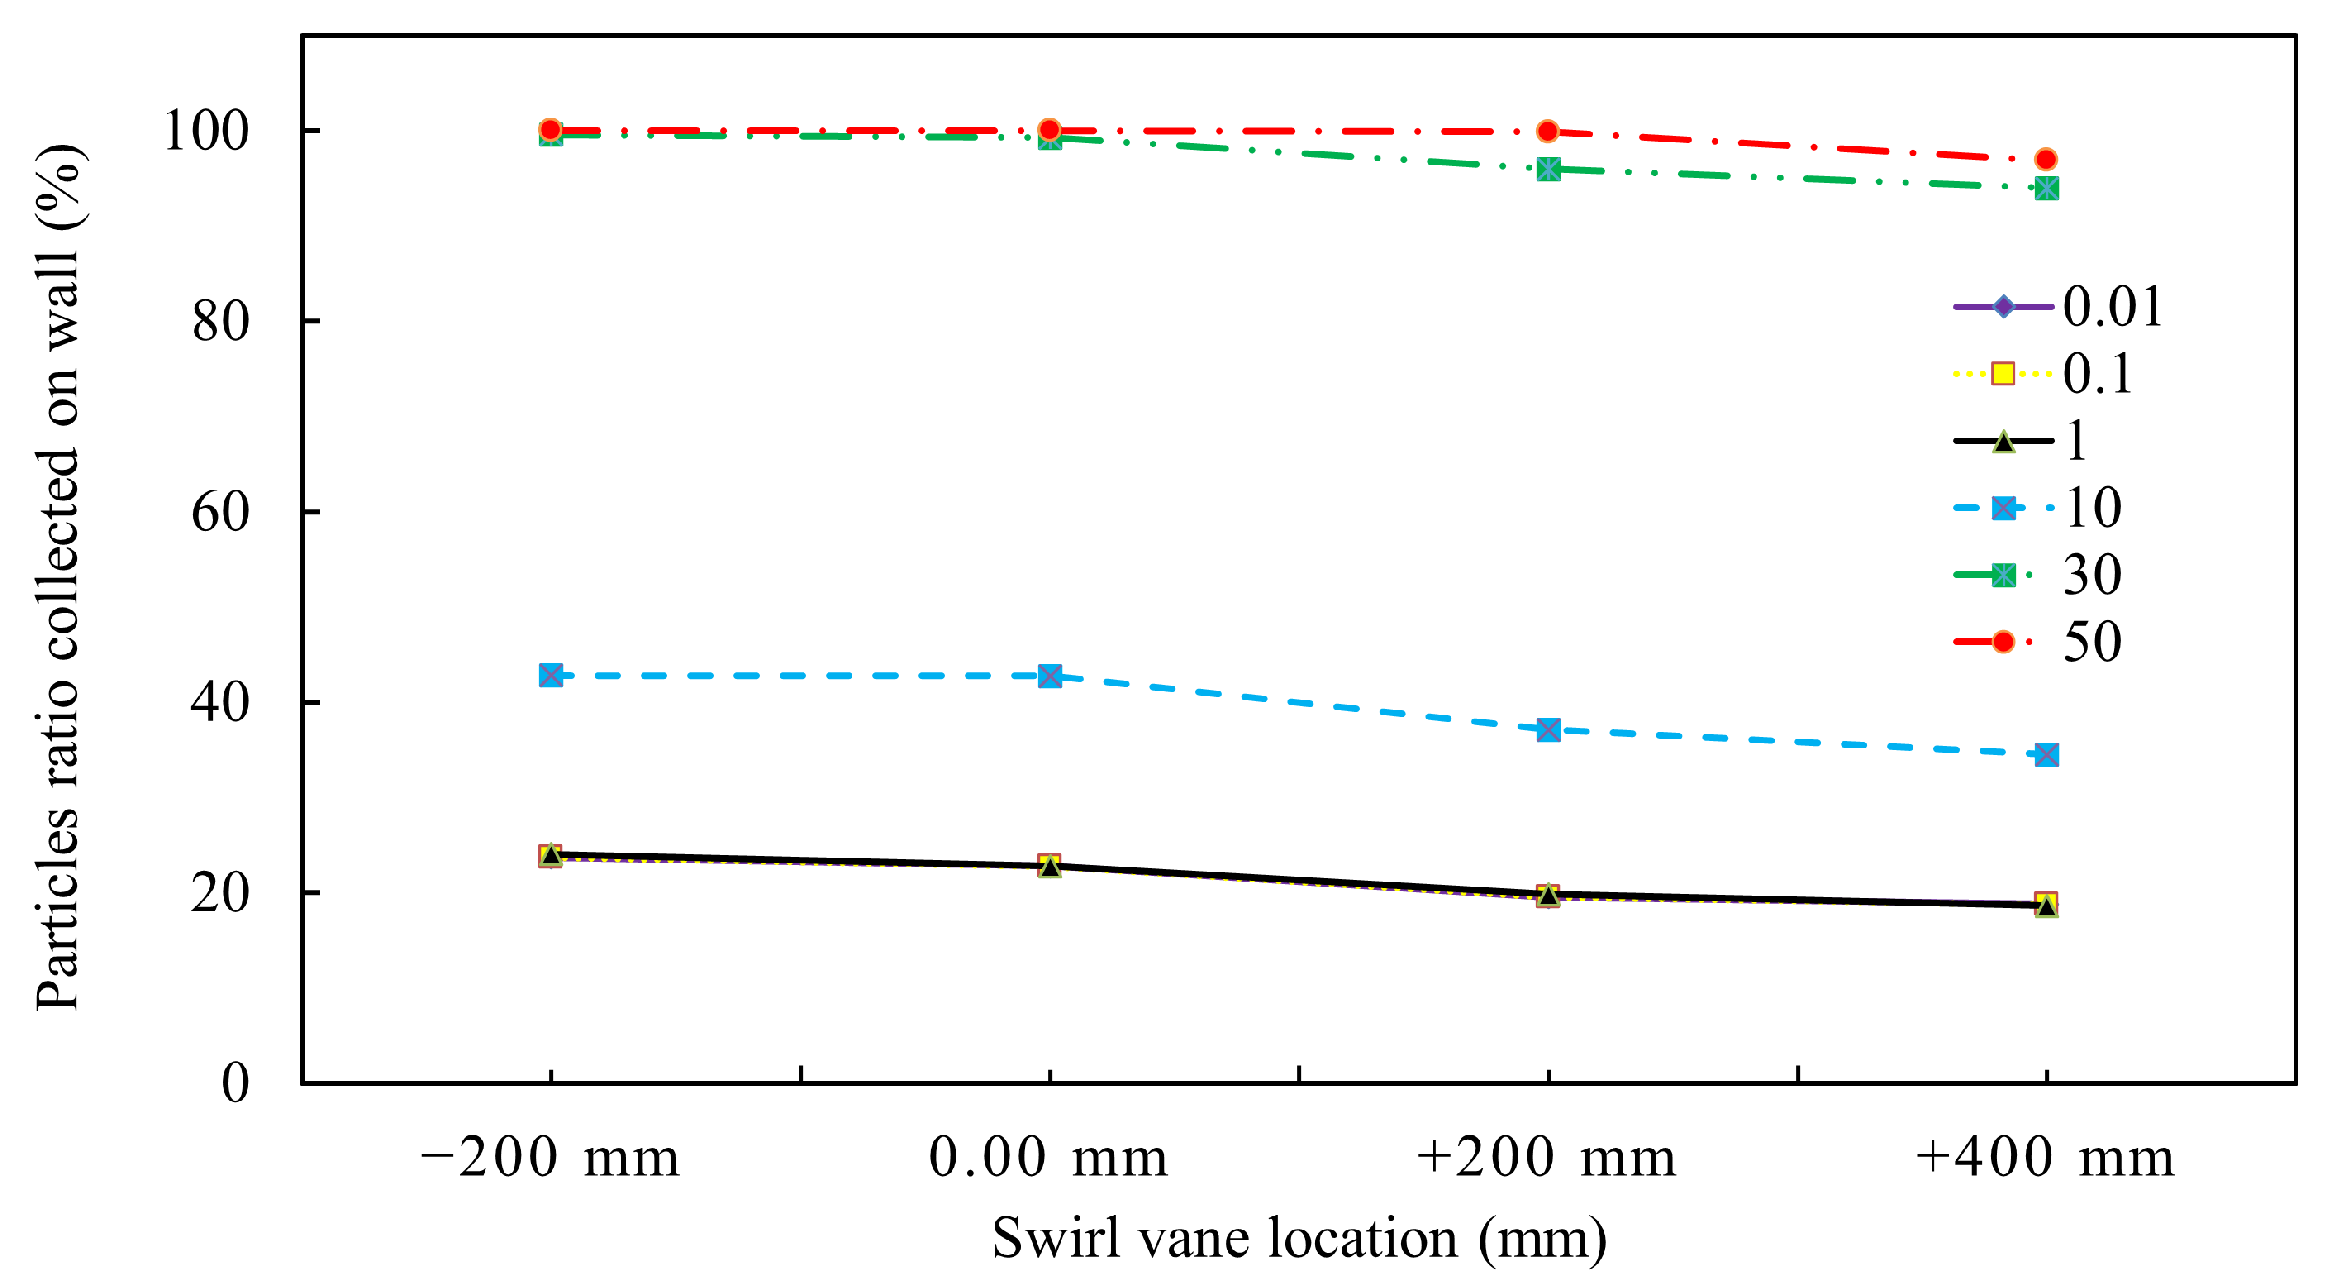
Figure 17 shows the simulation results of the particle collection rate at different vane locations and for different droplet sizes. The figure shows that the particle collection rate increased as the droplet size increased. However, the particle collection rate changes were not very significant at different vane positions. Nevertheless, raising the vane location increased the particle collection rate. This implied that when the location of the swirl vane was close to the orifice outlet, a higher particle collection rate was found.
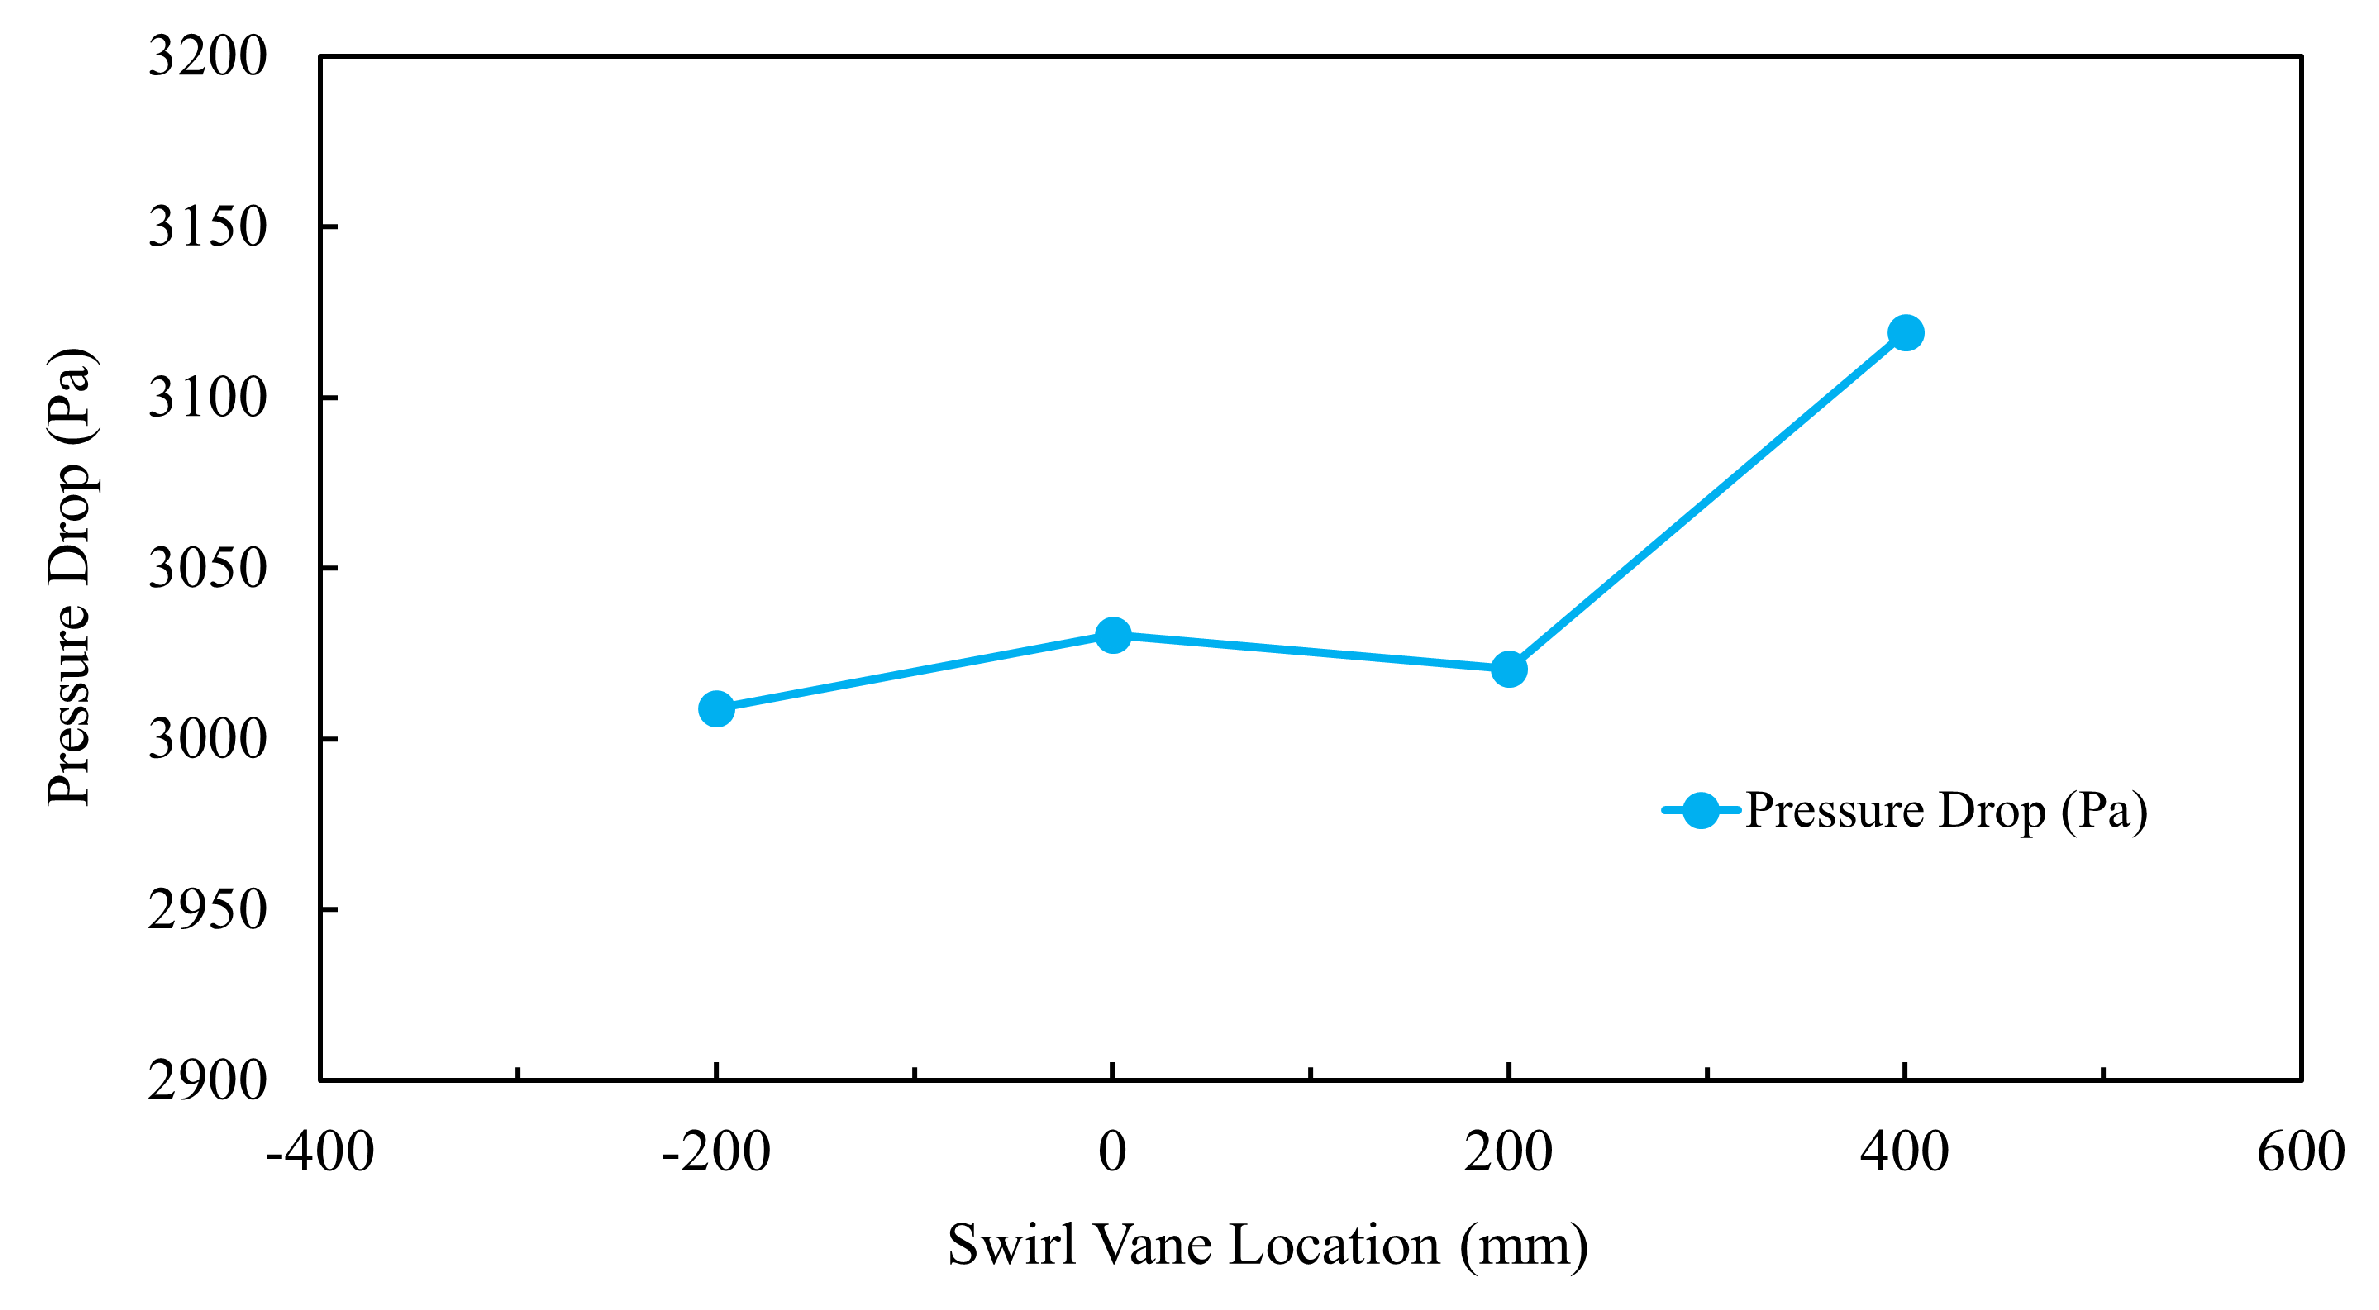
Figure 18 shows the pressure drop between the inlet and outlet pressure of the moisture separator at various vane locations. There was no significant pressure drop at various swirl vane locations, except for the location near the orifice outlet, as shown in the figure. Even this pressure increase near the orifice added only about 100 Pa. This pressure drop seems reasonable when compared with the case where the vane bending angle and the swirl vane quantity changed. Changing the swirl vane location did not increase the local resistance.
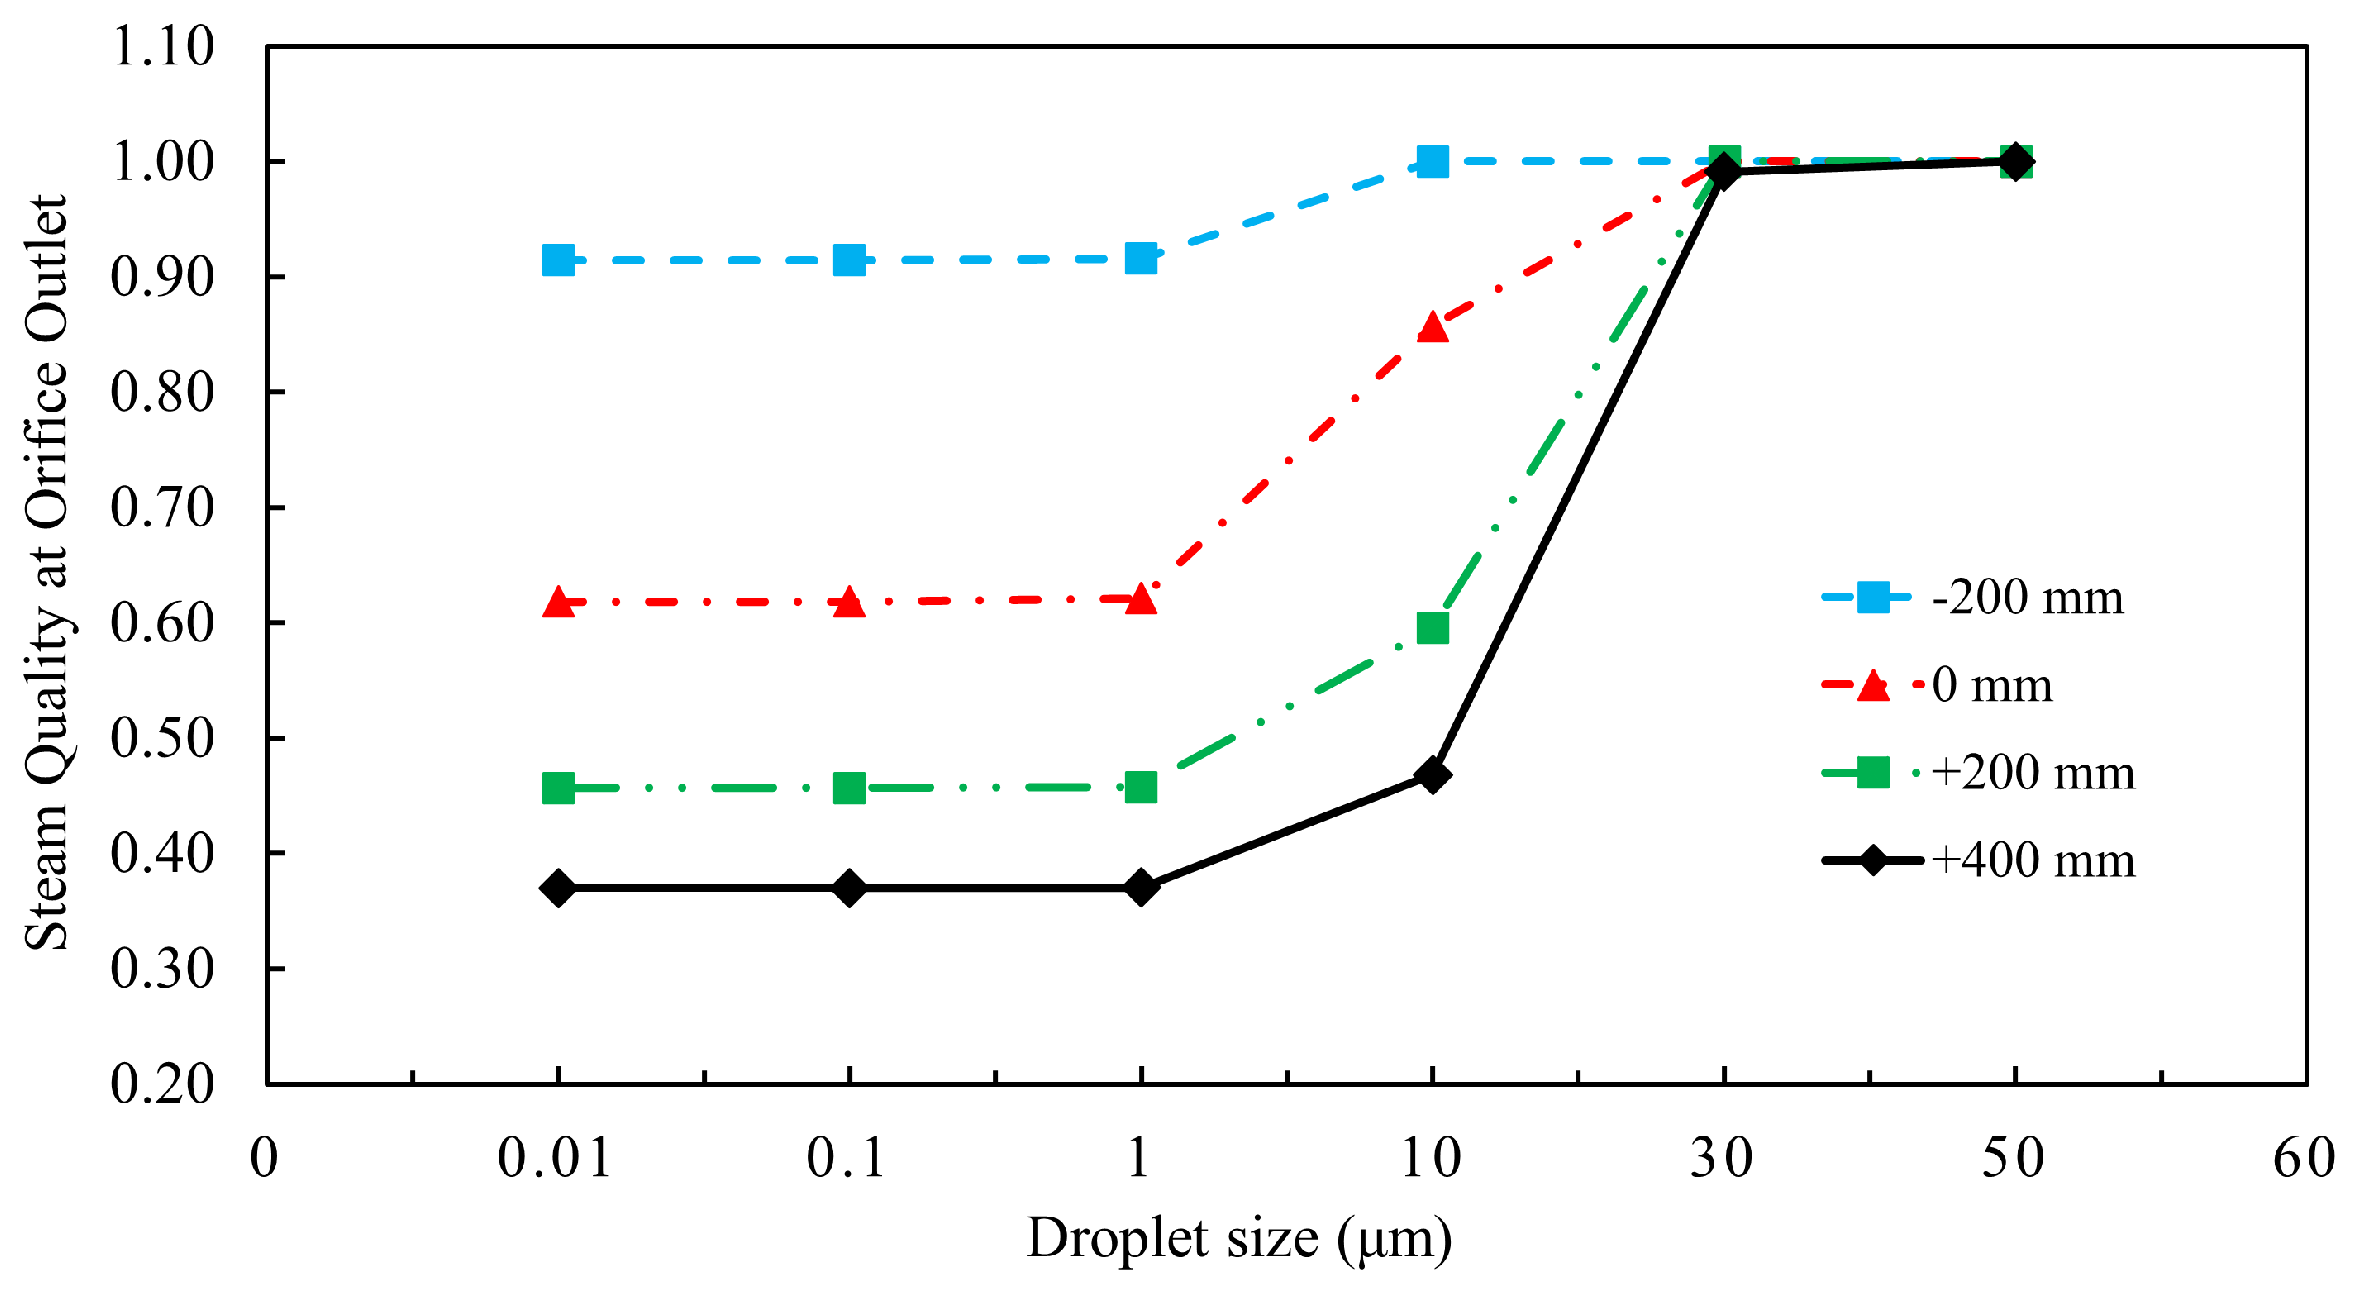
Figure 19 shows the steam quality at the orifice outlet at various vane locations. The steam quality changed from 37% to 91%, respectively, when the vane location changed from −200 to 400 mm. The greater the distance between the swirl vane and the orifice outlet plane, the higher the steam quality at the outlet. In addition, when the particle size was larger than 30 microns, the quality of the steam became 100%, implying that all droplets were being separated from the steam. This result is consistent with previous results shown in
Figure 15 and
Figure 17. The reason for this is mainly that the droplet particles were subjected to centrifugal force, and it took a certain amount of time to move from the inside of the separator to the riser wall. When the position of the swirl vanes was raised, the droplet particles were not captured by the wall collision, and they flowed directly out of the moisture separator. This caused the increase in the position of the rotor, which reduced the steam quality.
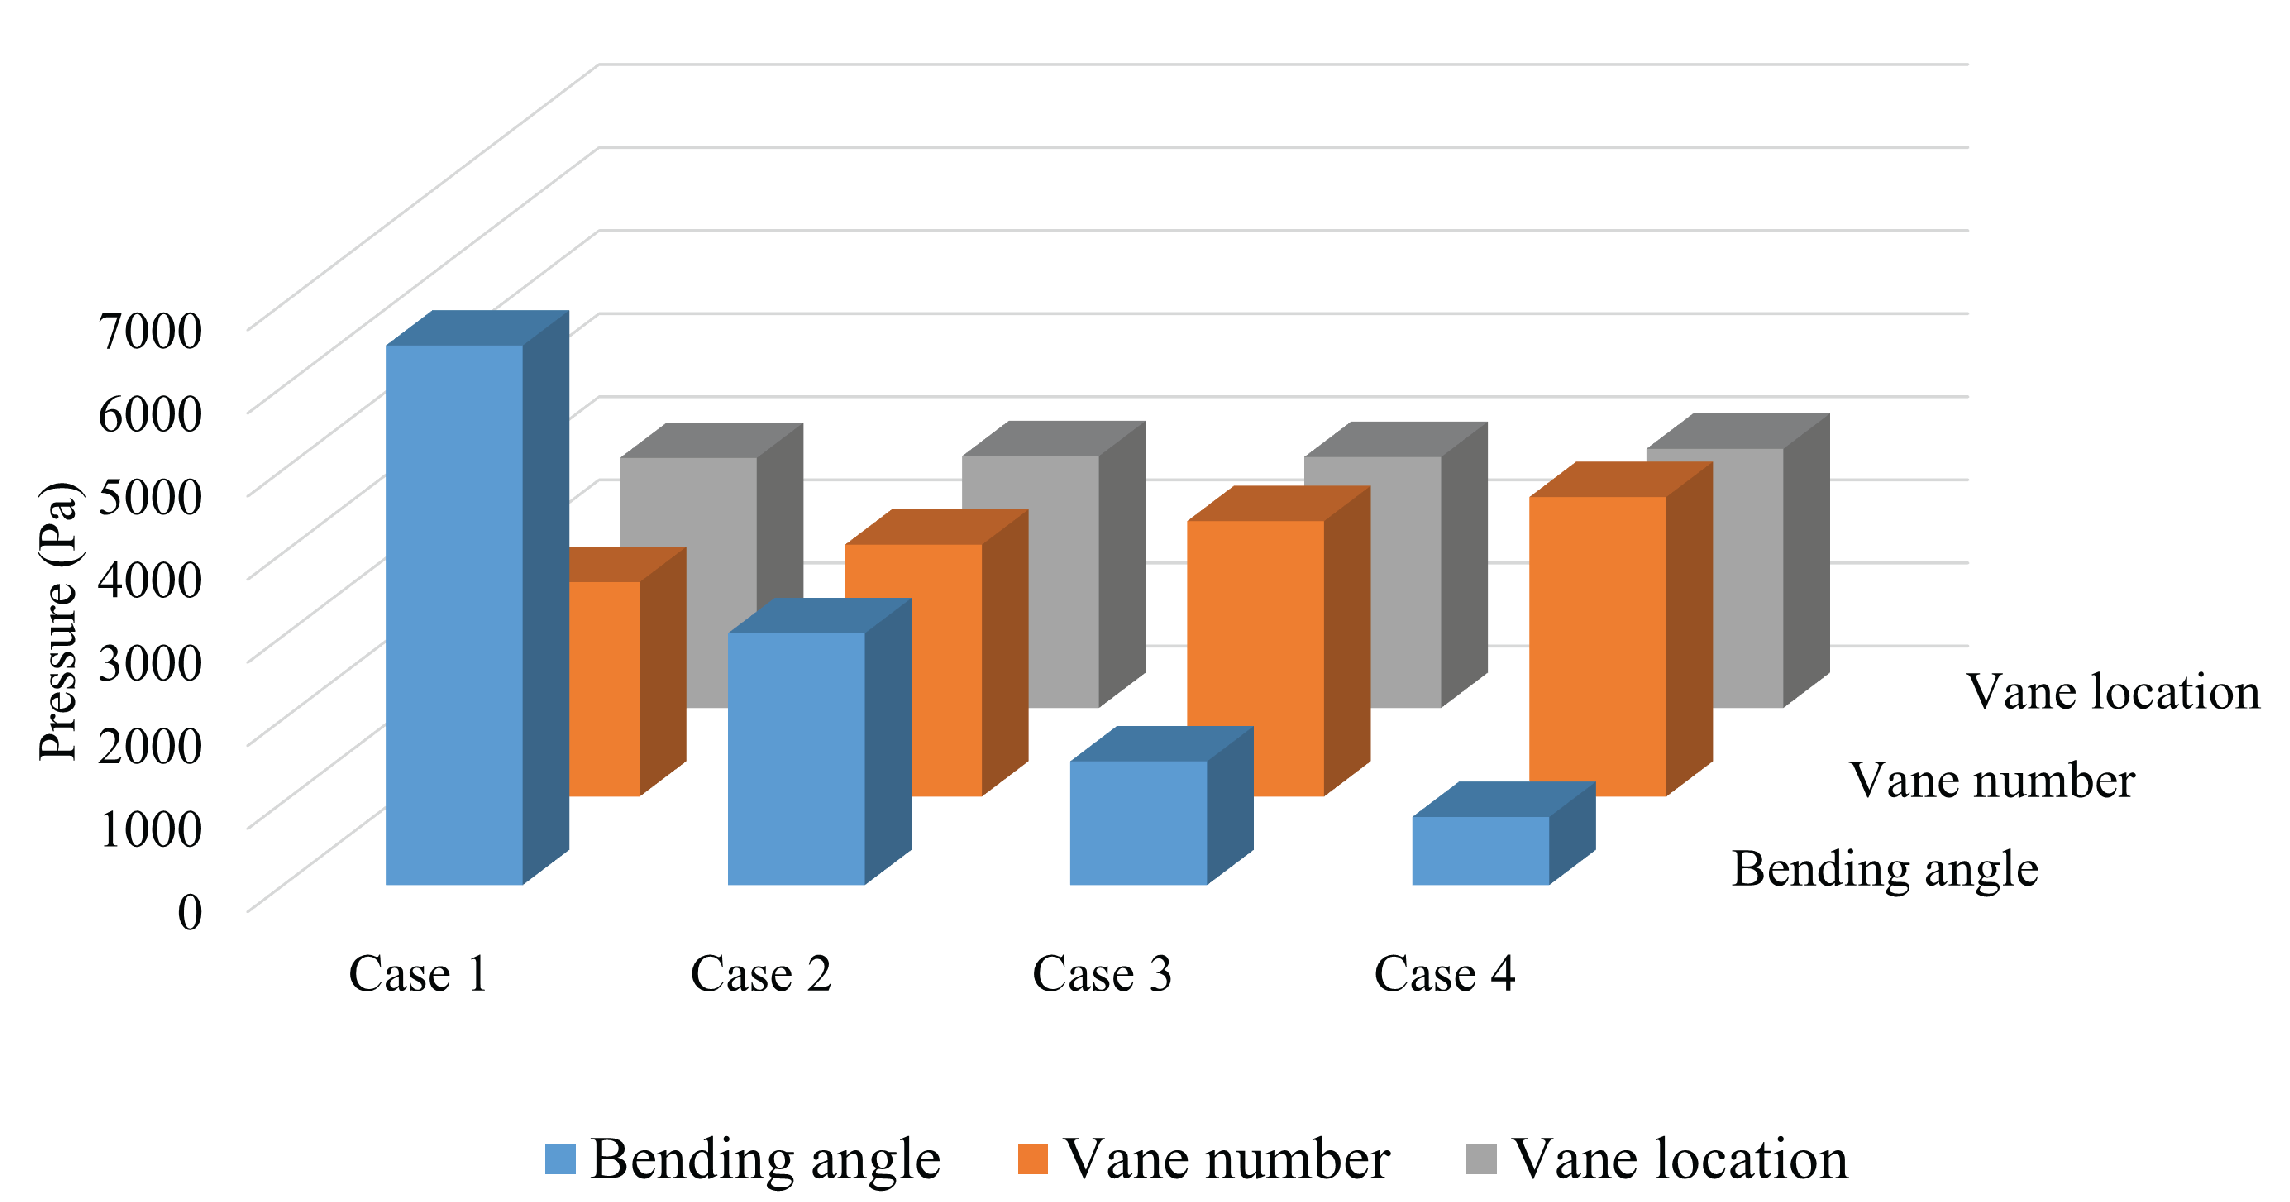
Figure 20 shows the classification and comparison of the pressure drop results for the three different structures, respectively. In
Figure 13, the swirl vane bending angle had the highest impact on the pressure drop, whereas the swirl vane location changes had the weakest effect. The changes in the drag factor of various structures increased the local resistance. The separator design specifications of Westinghouse indicate that the pressure drop of the swirl vane separator should be less than 2.8 psi (19.3 kPa) [
42]. Thus, although decreasing the angle of the swirl vanes caused a substantial pressure drop, the result met the requirements of the design specification (in this study, a maximum of 7 kPa).
From the above results, changing the bending angle of the swirl vane had the greatest effect on steam quality. When the bending angle of the vane was 50, the steam quality of the orifice outlet only reached 46%. In the process of changing the number of swirl vanes and their positions, the steam quality could be maximized when the droplet size was greater than 30m. In these three structures, the purpose of changing the bending angle, quantities, and locations was to increase the swirling velocity of the moisture, subjecting the particles to more centrifugal force. While changing the position of the swirl vanes from 400 to −200 mm, the particles took more time moving from the inside to the riser surface. All three of the above methods could effectively improve the steam quality at the orifice outlet.
In
Figure 13, the steam qualities with a bending angle of 30
were 0.62, 0.62, 0.62, 0.86, 1, and 1, respectively, with different droplet particle sizes. The total steam quality was 99.99% based on Equation (
11). Applying a similar method to other cases, the total steam quality was 100%, 99.99%, 99.54%, and 44.49% as the bending angle changed from 20
to 50
. In addition, the total steam quality values with changing swirl vane quantities and locations were all over 99%. This showed that changes in the droplet particle size within 50 microns did not have a significant impact on the total steam quality. The reason for this can be attributed to the fact that most of the droplet particles are larger than 50 microns in size [
43].
4. Conclusions
The characteristics of a PWR’s primary moisture separator were analyzed in this study. A study was conducted on three parameters affecting the quality of the steam: swirl vane angle, swirl vane quantity, and swirl vane location. Different water droplet sizes from 0.01 to 50 m were also considered. The results of a pressure drop between the inlet to the outlet, the steam quality at the orifice outlet, and the particle collection rate on the wall of the moisture separator were analyzed. The results were as follows:
Firstly, the steam quality increased as the bending angle decreased. However, the pressure drop between the inlet to the outlet increased during this process. When the vane angle decreased by 10, the pressure drop increased nearly twice as much. This showed that changing the vane bending angle had the greatest influence on the pressure drop.
Secondly, when the swirl vane quantity increased, both the pressure drop and steam quality increased. In addition, increasing the distance between the swirl vane location and the reference line increased the steam quality significantly but involved a relatively small pressure drop. The simulation results thus showed that a new moisture separator design that improved steam quality at the orifice outlet involved a significant pressure drop. However, even a pressure drop in a model with a bending angle of 20 could provide results that met the Westinghouse design specifications.
Finally, these three moisture separator structure changes had an effect only when the particle size was below 50 m, because all particles were collected on the wall if the particle size was over 50 m.


