Next Article in Journal
Hosting Capacity of Electric Vehicles on LV/MV Distribution Grids—A New Methodology Assessment
Previous Article in Journal
Economic Analysis of a Hydrogen Power Plant in the Portuguese Electricity Market
 
 
Correction published on 9 April 2024, see Energies 2024, 17(8), 1791.
Article

Estimating the Dominant Life Phase Concerning the Effects of Battery Degradation on CO2 Emissions by Repetitive Cycle Applications: Case Study of an Industrial Battery System Installed in an Electric Bus

1
Energy Systems Research and Development Center, Toshiba Energy Systems & Solutions Corporation, 72-34, Horikawa-cho, Saiwai-ku, Kawasaki 212-8585, Japan
2
Infrastructure Systems Research and Development Center, Toshiba Infrastructure Systems & Solutions Corporation, 72-34, Horikawa-cho, Saiwai-ku, Kawasaki 212-8585, Japan
*
Author to whom correspondence should be addressed.
Submission received: 16 December 2022 / Revised: 17 January 2023 / Accepted: 31 January 2023 / Published: 3 February 2023 / Corrected: 9 April 2024

Abstract

:
Many studies have evaluated CO2 emission from batteries. However, the impact of Li-ion battery (LiB) degradation on the CO2 emissions from the material through operation phases has not been sufficiently examined. This study aims to clarify the dominant CO2 emission phase and the impact of the degradation of general industrial LiBs from repetitive cycle applications. We developed a model common to general LiB composition and calculated CO2 emissions by the LCA method using the IDEA database. Our model simplifies the degradation process, including capacity decrease and internal resistance increase. We used it in a sensitivity analysis of the carbon intensity of electricity charged to a LiB. The loss mechanism was determined by experimental data for an electric bus with an industrial LiB. The results illustrate that the carbon intensity of electricity affects CO2 emissions dominance, the operation phase for mix (65.9%), and the material phase for renewables (77.3%), and that battery degradation over six years increases the total amount of CO2 emissions by 10.8% for mix and 3.0% for renewables equivalent. Although there are limitations regarding the assumed conditions, the present results will contribute to building a method for monitoring emissions and to standardizing degradation calculations.

1. Introduction

In the context of the widespread use of renewable energy, batteries are playing an important role in balancing the demand and supply of energy. In view of the rapid introduction of large numbers of batteries throughout society, demand for battery-related environmental treatment has become pressing. From the perspective of climate impact mitigation, many regulations concerning carbon footprints (CFPs) are being introduced in Europe and other regions [1]. To contribute to substantial carbon reduction, it is necessary to apportion responsibility for the total emissions related to the whole life phase of a battery regardless of the kind of battery used.
Toward this end, individual industrial fields related to battery use are promoting various measures to reduce CO2 emissions according to the product characteristics themselves. In the automotive industry, under the progression of the electrification of vehicles, the development of battery-powered and hydrogen-powered vehicles has become a representative trend [2,3]. Additionally, various studies from the viewpoint of eco-driving are being conducted with the aims of reducing fuel consumption [4], optimizing remaining battery power [5], examining the engine energy balance [6], and designing a method for machine-learning-based driving environment classification [7]. For battery-powered vehicles, coordination with EPA/NEDC/WLTP measurement standards is under way to improve the accuracy of CO2 reduction measurements.
For industrial batteries, IEC 63369 (Methodology for the Carbon Footprint calculation applicable to Lithium-ion batteries) is progressing toward the standardization of product environmental footprint category rules for industrial batteries. In these industries, individual users have not yet begun to disclose such data.
IEC 63369 requires the evaluation of CO2 emissions caused by production. For batteries used repetitively throughout their life, CO2 emissions during the operation phase should be a matter of concern. In addition, as charging and discharging are repeated, the inside of the battery becomes degraded. This state of degradation affects the charging and discharging loss of the battery and promotes increased CO2 emissions. Additionally, the fact that information about the internal degradation of batteries is hardly disclosed to the public makes the calculation difficult.
To address these problems, we constructed a model of an electric bus (E-bus) equipped with a general industrial lithium-ion battery (LiB) based on public information and estimated its CO2 emission from the extraction and processing of raw materials to operation and considering degradation. To construct a degradation model, we referred to the results of a demonstration experiment of an E-bus equipped with an industrial LiB for which actual data, such as internal resistance variation, had already been obtained. Under this condition, we focused on the losses caused by inevitable battery degradation, with capacity decrease and internal resistance during battery operation. In the operation phase, certain factors may exert considerable influence on the total amount of CO2 emissions. This study also took account of the sensitivity of these factors.
Even though we here developed a general virtual model, reflecting such characteristic changes due to degradation will be sufficiently useful to evaluate CO2 emissions. At the same time, this research can provide useful information for standardization studies such as IEC 63369 and will have the positive effect of promoting the acquisition of data on industrial batteries in the operation phase, allowing for more accurate calculations.
This study aims to clarify the impact of the battery degradation of general LiBs in E-buses caused by repetitive cycling on life cycle CO2 emissions. We develop a general industrial LiB model based on publicly available information to examine the detailed emissions that are closely related to the actual battery conditions, the power conversion loss scenario, and the electricity mix in the operation phase. Economic aspects are excluded from the scope of this paper, which focuses on batteries rather than on vehicles, since we view the economic value obtained by battery installation in terms of the whole vehicles, such as E-buses and locomotives equipped with batteries.

2. Literature Review

The present work seeks to clarify the impact of battery degradation of general LiBs by repetitive cycling on life cycle CO2 emissions. Within this scope, many studies have reported on CO2 emissions of lithium-ion batteries (LiBs), determining either the cradle-to-gate impact or the impact at the end-of-life (EoL) phase [8,9,10,11,12].
In the operation phase of a battery system, certain factors may considerably influence the total amount of CO2 emissions. These are classifiable into internal and external factors [13]. Internal factors include power conversion losses in the battery system and the weight of the battery itself [14]. The electricity losses due to diminishing batter efficiency are considered a significant factor in CO2 emissions in the operation phase [15]. Battery degradation is another major factor that can influence power conversion performance and result in increased CO2 emissions. The impact of the degradation-induced CO2 increase in the operation phase was analyzed based on an operation scenario considering the battery degradation condition [16,17]. However, a review of the literature suggests the impact of degradation is unclear because of a lack of information that could be used to compare efficiency between the initial state and the degraded state. In addition, the absence of a detailed calculation formula makes validity evaluation difficult.
Various verifications are undertaken by the manufacturers of electric automobiles and buses [18,19]. The battery degradation effects on GHG emissions from EV operation were investigated in each state of the United States. [20,21].
The mix ratio of the electricity charged to the battery is one of the external factors. Many studies mention the relationship between the carbon intensity of the electricity charged to the battery in the production phase [22] or the operation phase [23]. So far, it has been pointed out that the unavailability of data from the operation is likely to prevent improvement of the quality of assessment. Therefore, there is a pressing need to conduct a study based on a scenario with sufficient technical rigor reflecting both internal and external battery factors.
From the above, many studies on CO2 emissions in individual life cycle phases originated from batteries. However, no study has evaluated emissions related to the complete life cycle of a battery, from the extraction and processing of raw materials to operation, while factoring in both degradation and the carbon intensity of the electricity used to charge the battery.

3. Methods

3.1. Conceptual Assumption

The conceptual assumption of this paper is that the degradation of batteries affects CO2 emissions over the total battery life cycle, excluding the disposal stage. Based on this assumption, the aims of the present work are as follows.
  • To estimate the potential CO2 emissions of individual life cycle phases from a battery installed in an E-bus under the conditions of a practical, technically proven scenario.
  • To assess how the operation phase conditions, e.g., battery degradation (an increase in the internal resistance and a reduction in capacity) and electricity mix, affect the total CO2 emissions per function unit.

3.2. Tool Description and Inventory

LiB performance in an electric bus is assessed by applying the Life-Cycle Assessment (LCA) methodology according to ISO [24,25], which is widely used to assess the environmental performance of battery systems and other products and systems.
The secondary data of carbon emission factors are based on the IDEA ver2.2 database. IDEA is one of the most established and valid databases in Japan. IDEA (Inventory Database for Environmental Analysis), the standard equipment inventory database for life cycle assessment, has been jointly developed since FY2008 by the National Institute of Advanced Industrial Science and Technology (AIST) and the Japan Environmental Management Association for Industry (JEMAI) [26]. The data of IDEA are from Japan, and the statistical information used to formulate the data ver2.2 was published in 2018. For LiNiO2 and LiPF6, CO2 emissions corresponding to the precision of the stoichiometric process were estimated. From these estimations, the emissions of LiNiO2 and LiPF6 are calculated individually.
LiNiO2 is manufactured by means of the sintering reaction of Li2CO3 and NiO following Equation (1). The carbon emission intensities of Li2CO3, NiO, and O2 in the IDEA ver2.2 database are applied. Assuming a stoichiometric reaction, the CO2 emission intensity of LiNiO2 is calculated as 18.35 kg CO2/kg. Because the energy consumption data lack clarity, only ΔfH0 is considered. The carbon emissions of ΔfH0 of LiNiO2 (69.6 kJ/mol) are calculated by converting to LNG.
1 2 Li 2 CO 3 + NiO + 1 4 O 2   LiNiO 2 + 1 2 CO 2
LiPF6 is manufactured by means of the reaction of LiF and PF5 following Equation (2).
LiF + PF 5 LiPF 6
In view of the lack of carbon emission intensity data in the IDEA ver2.2 database for LiF and PF5, as well as for related submaterials, additional calculations are performed. LiF is manufactured by means of the reaction of Li2CO3 and HF following Equation (3). PF5 is manufactured by means of the reaction of PCl5 and HF following Equation (4). PCl5 is manufactured by means of the reaction of P4 and Cl2 following Equations (5) and (6). Assuming a stoichiometric reaction, from this condition, the CO2 emission intensity of LiPF6 is calculated as 6.52 kg CO2/kg.
1 2 Li 2 CO 3 + HF LiF + 1 2 H 2 CO 3
PCl 5 + 5 HF PF 5 + 5 HCl
PCl 3 + Cl 2 PCl 5
1 4 P 4 + 3 2 Cl 2 PCl 3
The CO2 emission intensity of the average Japanese grid electricity mix of 2015 IDEA (0.573 kg-CO2/kWh) was used for the electricity “mix”, and 10 MW class solar-based electricity [27] (0.059 kg-CO2/kWh) was used for “renewables”.
The transportation scenario was assumed to be 700 km by a truck with a carrying capacity of 10 tons in Japan (0.105 kg-CO2/ton km).

3.3. Analysis Scheme

3.3.1. Boundary

The system boundary of the present work and the individual targeted components are illustrated in Figure 1. The model includes the material (raw material extraction and processing), production (component processing and assembling), transportation, and operation phases. The EoL phase was excluded because of the unavailability of reliable information for modeling.

3.3.2. Assessed Battery Model and Components

The model in this study configures an industrial LiB installed in a WEB-3 E-bus [28]. To assess the LiB installed in the bus, a generic data model common to both the composition and components of the LiB is designed to ensure the generality of the product structure and the reality of the operational scenario. The composition of the cell and module is based on the WEB-3 battery unit, and the details on the LiB components are based on the inventory list obtained from a previous study of a standard LiB inventory dataset [29]. Individual material quantity values of the battery were broken down in proportion to the 45 kWh unit of WEB-3. The configurations of the cell and the module are listed in Table 1 [28,30]. The unit component and individual weights are shown in Table 2.
For production and assembly, only electricity was assumed to be used. The amount of electricity was calculated based on the energy consumed in the production of the 45 kWh battery system. The system specifications are shown in Table 3. Energy input into the LiNiO2 process was examined to identify the share of electricity in the production phase.

3.3.3. Functional Units

To quantify the performance of the storage system, two types of functional units are used. One is Wh of delivered electricity over the total service life (from material to operation) of the batteries. The other is per Wh of battery capacity (Wh_bc, cradle to gate). The batteries are assumed to be in operation for six years.

3.3.4. Operation Phase Scenario

The operation phase is analyzed, reflecting the battery losses both with and without factoring in degradation and the electricity mix.
In this paper, we define the power conversion loss as the energy loss due to decreasing system efficiency as a result of charging and discharging during charge and discharge. as is shown in Figure 2. As illustrated at the top of Figure 2, when the battery degrades, internal resistance increases and capacity decreases. When capacity decreases, the charge/discharge cycle number increases, resulting in an internal resistance increase. Since the charge/discharge loss of the battery is calculated from the internal resistance, an internal resistance increase results in an increase in the charge/discharge loss. Battery system loss is divided into three types based on a previous summary of battery efficiency [31]. The values for the degradation of batteries installed in E-buses are obtained from reference values [28]. According to Table 2 of reference [28], the data acquisition period was from 20 December 2011 to 31 January 2014, and it represents the general characteristics of Japan through the three lots of clearly distinguished four-season data. The initial value of the internal resistance was calculated from Figure 6 in reference [30], and the decrease in battery capacity and the increase in internal resistance due to degradation were obtained from Figures 9 and 11 in Reference [28]. We quoted the idea of loss when considering a storage battery as a system from [31].
Figure 2 illustrates the losses of a general battery system on the left and the losses applied to this evaluation for an EV on the right in an image simplified from [21]. These are composed of losses of PCS, auxiliary machines, and the storage device, and the losses are assumed to be equally organized. For the PCS and auxiliary machine losses for an EV shown on the right, the percentage of the battery system on the left was applied to the rated capacity of the E-bus.
  • Loss in the storage device (Loss_Sd)
  • Loss in the system auxiliary machines (Loss_Aux)
  • Loss in the power condition system (Loss_PCS)
Loss_Sd is calculated from rated current and internal resistance. Equation (7) describes the percentage of the Loss_Sd in terms of rated power capacity.
Loss _ Sd = I 2 ( Rsys + Rci ) / CP  
I: Rated current
Rci: Cable impedance
CP: Rated power capacity
I = 120 (A), CP = 44.68 (kWh) (ref. Table 2)
The value of internal resistance (Rsys) is calculated from internal resistance (Rcell) in accordance with the module configuration using the following Equation (8).
Rsys = Rcell N u m _ C e l l _ s e r i e s N u m _ C e l l _ p a r a l l e l N u m _ M o d u l e _ s e r i e s N u m _ M o d u l e _ p a r a l l e l
Rsys: Internal resistance of battery system
Rcell: Internal resistance of battery cell
Num_Cell_series: Number of cells in series in module
Num_Cell_parallel: Number of cells in parallel in module
Num_Module_series: Number of modules in series in unit
Num_Module_parallel: Number of modules in parallel in unit
Rcell is estimated to be 0.00165 (ohm) from the specification of discharge I-V [30] at SOC 50%. Rsys is calculated to be 0.054 (ohm) ( Rsys = 0.00165   ( ohm ) 7 1 14 3 = 0.054   ( ohm ) ). Rci is calculated to be 0.006 (ohm) from the length of the E-bus and the maximum conductor resistance at 20 °C (80 mm2 of cab tire cable) [32]. In this study, this calculation applies equally to both a general battery system and an evaluation of an E-bus. Loss_Sd is doubled to account for charge and discharge. From the above setting, Loss_Sd is calculated to be 3.8% ( Loss _ Sd = 120 2   ( A ) ( 0.054   ( ohm ) + 0.006   ( ohm ) ) /44.68 (kWh) ∗ 2 = 3.8%).
Loss_Aux and Loss_PCS are determined by referring to the values in a previous study [31]. Loss_Aux is set as 4.0%, which is inferred from the double (charge and discharge) ratio of a 2 kW auxiliary loss per 100 kW system. Loss_PCS is set as 7.9% based on the 7.9 kW loss in the 100 kW power system.
From the assumption above, the battery loss without degradation is calculated to be 15.7% as the sum of the values of Loss_Sd, Loss Aux, and Loss PCS.
For the battery degradation scenario, we estimated that degradation causes an increase in internal resistance and a reduction in capacity. Related values were set based on the actual measurement [28], 30% for the range of the state of charge, 148% for the increase in the rate of internal resistance, and 76% for the battery capacity retention rate for 6 years of service. Total yearly discharged electricity (D_Energy) is calculated to be 13.0 MWh based on the estimation of the steady discharge amount ( D Energy = 44.68   ( kWh ) 30 % 365 day 2.65 cycle 1000 = 13.0   ( MWh ) ).
Internal resistance increases 12% per year in response to the degradation scenario, and it increases the value of Rsys. In addition, battery power capacity decreases 6% per year. The voltage change caused by the volume decrease is compensated for by the electric current, and therefore the amount of Loss_Sd increases. Loss_Sd (one way) in the second year is calculated to be 2.4% (Loss_Sd(one way)=[(120 ∗ 1.06)]2 (A) ∗ (0.054(ohm) ∗ 1.12 + 0.006 (ohm))/44.68 (kWh) = 2.4%), under the condition that Loss_Aux, and Loss_PCS, and annual total discharged electricity are steady.
Table 4 summarizes the degradation calculation during the 6-year service lifetime. The ratio of electricity loss per unit of discharged electricity is calculated to be 18.5% in 6 years. This is a 17.4% increase compared to the value of 15.7% (=Loss/Discharge energy) with no consideration of degradation. The carbon emissions from the battery during operation are calculated by means of the emissions equivalent to the power conversion losses. The carbon emission factors of the average Japanese grid electricity mix and the predominance of renewable energy are the same in the operation phase as in the production phase.

4. Results

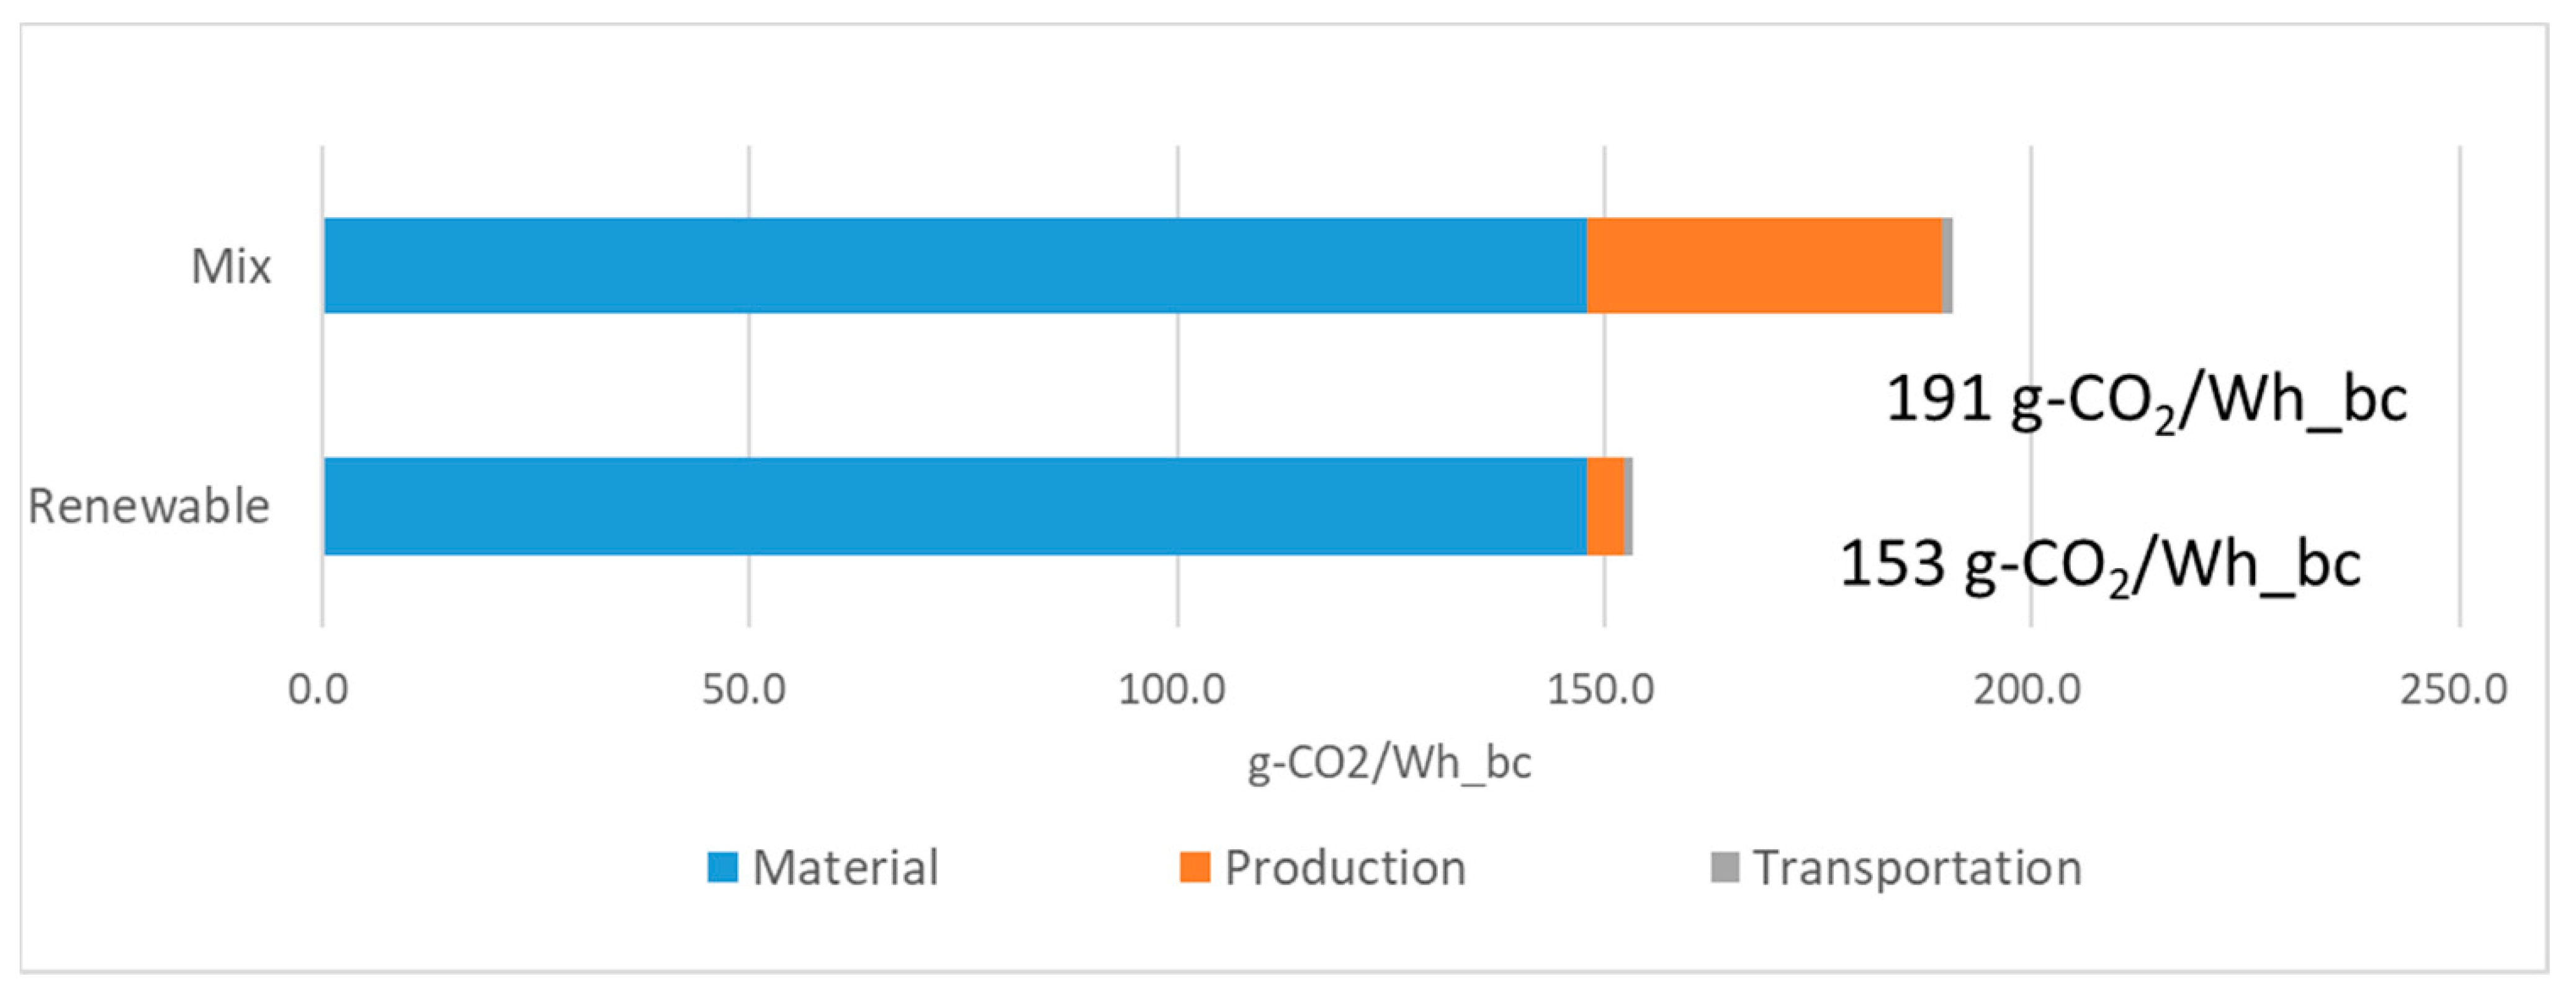
4.1. Material to Production Phase

The results of CO2 emissions in the material to production phases are illustrated in Table 5. CO2 emissions per Wh of battery capacity are calculated to be 188.3 g-CO2/Wh_bc for mix and 151.2 g-CO2/Wh_bc for renewables.
The CO2 emissions per battery unit storage capacity are illustrated in Figure 3. CO2 emissions per FU are 191 g-CO2/Wh_bc for mix and 153 g-CO2/Wh_bc for renewables. These results indicate that the carbon intensity of electricity production affects cradle-to-gate CO2 emissions.

4.2. Total CO2 Emissions

The total lifetime CO2 emissions are illustrated in Figure 4. CO2 emissions are 22.5 t-CO2 for mix, and 8.3 t-CO2 for renewables without degradation, and 25.0 t-CO2 for mix, and 8.5 t-CO2 for renewables with degradation. These results reveal that the dominant CO2 emission phases are the material phase for renewables and the operation phase for mix. The ratio of CO2 emission per total life cycle CO2 of the dominant phase are 65.9% for mix and 77.3% for renewables with degradation, and 62.2% for mix and 79.6% for renewables without degradation. These results indicate that determination of the dominant CO2 emission phase depends on the carbon intensity of electricity.
The CO2 emissions per total lifetime of delivered electricity are illustrated in Figure 5. CO2 emissions per FU are 0.145 g-CO2/Wh for mix, and 0.053 g-CO2/Wh for renewables without degradation, and 0.161 g-CO2 for mix, and 0.055 g-CO2 for renewables with degradation. These results indicate that battery degradation during the six years contributes to the total amount of CO2 emissions, the increases are 10.8 % for mix and 3.0% for renewables equivalent to the charge and discharge power. It was clarified that the impact of degradation on CO2 emissions, which is 3.0% of total life cycle CO2 even in the case of renewable energy, or 17.4% of operation phase CO2, cannot be ignored. These results are similar to those in a previous study [21].
Regarding the CO2 emissions of individual phases over the total life cycle, the present study revealed that the carbon intensity of electricity affects the life phase that is dominant in terms of CO2 emissions. Additionally, these emissions are associated with power conversion losses considering the impact of degradation.

5. Discussion

5.1. Overviews

To assess CO2 emitted from the LiB life cycle, we developed an inventory analysis model of common to general LiB composition. CO2 emissions per battery weight and Wh_bc have a wide range determined by the stoichiometric precision from the material to production phases. This is because of the differences in the composition of anode and cathode and in the solvent compositions of batteries, as well as the system boundary for evaluation. In the literature review of greenhouse gas (GHG) emissions per kWh of battery capacity relating to the production phase [10], GHG emissions per kWh battery capacity can range from 53 to more than 300 kg CO2eq/kWh_bc for the different technologies and depending on the age of the studies.
This study focuses on the loss mechanism of battery degradation caused by decreasing battery capacity and increasing internal resistance as well as the carbon intensity of electricity charged to a LiB. The results reconfirmed that degradation during a LiB’s six years of service contributes to the total amount of CO2 emissions by 10.8% for mix and 3.0% for renewables equivalent to the charged and discharged power.
In summary, we evaluated the life cycle CO2 emissions of a LiB installed in an E-bus from battery raw material extraction and manufacturing through to operation and revealed that the dominant phase for CO2 emissions changes depends on the carbon intensity of electricity. A comparison between the present study and previous studies using different degradation models [21] showed that similar values of CO2 emissions were obtained. We also confirmed the validity of our simple model. The results highlight the importance of CO2 emissions derived from battery degradation. This contributor to emissions should not be ignored even in the emerging era of renewable energy.

5.2. Limitations

5.2.1. Limitations to CO2 Calculations

The limitations in our CO2 calculations are listed below.
  • Limitation of primary data: It was difficult to acquire upstream information in the supply chain (data on electrode material manufacturing, etc.)
  • Limitations due to the LCA unit database associated with the use of secondary data: There are two limitations to the IDEA data: it was formulated in 2018 so it is not the latest one, it was only used for evaluation in Japan.
  • Only two types of carbon intensity of electricity are used: the average power source in Japan and typical PV values. Regional differences are not taken into account.
  • We relied on hypothetical rather than actual electricity power configurations supplied to the battery.
  • There is little information on the disposal/recycling stage. Although our evaluation this time did not include this phase, the impact of recycling should be taken into consideration in order to fully elucidate CO2 emissions for the whole life cycle of a battery, along with the improvement of data accumulation specific to that end stage.

5.2.2. Limitation Regarding Battery Condition Management

The limitation of this study regarding battery condition management is as follows:
  • There is only a small amount of available data on internal resistance and its change as the battery degrades.
There are few published data that can simultaneously refer to changes in battery capacity and internal resistance. In the present study, we designed the model by combining several published cases of different batteries. We believe that the accuracy of this research will improve when relevant data become available.

5.3. Further Steps

5.3.1. Further Steps in CO2 Calculations

The following are listed as further steps for CO2 calculation.
  • Practical use of the primary database that can be used to trace a supply chain (utilization of data linkage frameworks such as Digital Product Passport).
  • To ensure reduction in CO2 emissions, a methodology must include monitoring during operation in accordance with the principles of MRV (measuring, reporting, and verifying) methodology for implementing energy efficiency measures [33]. In addition, the present results can provide useful information for the standardization of the calculation method for CO2 emissions over the entire life cycle of IEC 63369, which is being studied for industrial batteries.
  • Utilization of the Global LCA Data Access network (GLAD), that is the largest directory of LCA datasets to achieve wide usage of LCA through better accessibility and interoperability of LCA data [34].
  • Evaluation of the disposal/recycling stage.

5.3.2. Further Steps for Battery Condition Management

The following is a further step for battery condition management.
  • Rule formulation for monitoring KPIs (Key Performance Indicators) to identify battery conditions such as internal resistance and capacity reduction concerning battery degradation.
This study clarified that the carbon intensity of the grid electricity for charging and discharging affects total CO2 emissions. It is necessary to build a system to collect data on such changes in the power source composition along with the KPIs of battery degradation.
LiBs are utilized for diverse purposes, not just for mobility but also in the stationary power sector for both normal and emergency situations. Consequently, there are many types of scenarios to consider, ranging from short-term frequency disturbance to relatively long-term hourly or daily balance. To properly evaluate battery performance depending on several usage scenarios and conditions, a methodology should be established that can be tailored to individual requirements.
Comparison with multiple kinds of actual data and analysis of the impact of differences in the operation phase would be required for statistical analysis, but the future accumulation of battery degradation data is awaited. Regarding the creation of systems that will make it possible to obtain data in the future, it is assumed that disclosure will start from batteries for industrial systems using the data linkage framework. It is also possible to develop a battery degradation calculation model by matching simulation results from our proposed simplified model with actual information based on measurement standards. The results of this research will surely contribute to the construction of such future systems.

6. Conclusions

In the present work, an LCA study was performed to ascertain the life cycle CO2 emissions of a LiB installed in an E-bus, focusing on phases from material to practical operational scenarios that reflect power conversion losses and degradation conditions as internal factors, while considering the carbon intensity of electricity charged to the LiB as an external factor.
Regarding the CO2 emissions of individual phases over the total life cycle, our results revealed that the carbon intensity of electricity affects the life phase that is dominant in terms of CO2 emissions. Additionally, these emissions are associated with power conversion losses considering the impact of degradation.
The results also illustrate that that the carbon intensity of electricity affects which life phase will dominate CO2 emissions: the operation phase is dominant for mix (65.9%) while the material phase is dominant for renewables (77.3%); and degradation during the battery’s six years of service increases the total amount of CO2 emissions by 10.8% for mix and 3.0% for renewables equivalent to the charge and discharge power. These results highlight the fact that a real and precise battery condition scenario during operation contributes to the accuracy of CFP calculations and the fact that improving the resilience of battery performance will be indispensable to reducing total CO2 emissions in the coming era, in which renewable energy is expected to predominate.

Author Contributions

Conceptualization, R.T. and H.N.; methodology, R.T., H.N., K.N. and M.M.; validation, R.T. and H.N.; formal analysis, R.T. and H.N.; investigation, K.N. and M.M.; data curation, K.N.; writing—original draft preparation, R.T.; writing—review and editing, H.N., K.N. and M.M.; visualization, R.T., K.N. and M.M.; supervision, H.N. All authors have read and agreed to the published version of the manuscript.

Funding

This research received no external funding.

Conflicts of Interest

The authors declare no conflict of interest.

Abbreviations

The following abbreviations are used in this manuscript:
CFPCarbon footprint
EoL End of life
EV Electric vehicle
KPIs Key performance indicators
LCA Life cycle assessment
LiB Lithium-ion battery

References

  1. Proposal for a regulation of the European Parliament and of the council concerning batteries and waste batteries, repealing directive 2006/66/EC and amending regulation (EU) No 2019/1020 COM/2020/798. Available online: https://eur-lex.europa.eu/legal-content/EN/TXT/?uri=celex%3A52020PC0798 (accessed on 2 February 2023).
  2. Deliali, A.; Chhan, D.; Oliver, J.; Sayess, R.; Pollitt, K.J.G.; Christofa, E. Transitioning to zero-emission bus fleets: State of practice of implementations in the United States. Transp. Rev. 2021, 41, 164–191. [Google Scholar] [CrossRef]
  3. Moriarty, P.; Honnery, D. Prospects for hydrogen as a transport fuel. Int. J. Hydrog. Energy 2019, 44, 16029–16037. [Google Scholar] [CrossRef]
  4. Fafoutellis, P.; Mantouka, E.; Vlahogianni, E. Eco-driving and its impacts on fuel efficiency: An overview of technologies and data-driven methods. Sustainability 2020, 13, 226. [Google Scholar] [CrossRef]
  5. He, H.; Liu, D.; Lu, X.; Xu, J. ECO Driving Control for Intelligent Electric Vehicle with Real-Time Energy. Electronics 2021, 10, 2613. [Google Scholar] [CrossRef]
  6. Wróblewski, P.; Drożdż, W.; Lewicki, W.; Miązek, P. Methodology for assessing the impact of aperiodic phenomena on the energy balance of propulsion engines in vehicle electromobility systems for given areas. Energies 2021, 14, 2314. [Google Scholar] [CrossRef]
  7. Julio-Rodríguez, J.D.C.; Rojas-Ruiz, C.A.; Santana-Díaz, A.; Bustamante-Bello, M.R.; Ramirez-Mendoza, R.A. Environment Classification Using Machine Learning Methods for Eco-Driving Strategies in Intelligent Vehicles. Appl. Sci. 2022, 12, 5578. [Google Scholar] [CrossRef]
  8. Romare, M.; Dahllöf, L. The Life Cycle Energy Consumption and Greenhouse Gas Emissions from Lithium-Ion Batteries; IVL Swedish Environmental Research Institute: Stockholm, Sweden, 2017. [Google Scholar]
  9. Emilsson, E.; Dahllöf, L. Lithium-Ion Vehicle Battery Production-Status 2019 on Energy Use, CO2 Emissions, Use of metals, Products Environmental Footprint, and Recycling; IVL Swedish Environmental Research Institute: Stockholm, Sweden, 2019. [Google Scholar]
  10. Temporelli, A.; Carvalho, M.L.; Girardi, P. Life cycle assessment of electric vehicle batteries: An overview of recent literature. Energies 2020, 13, 2864. [Google Scholar] [CrossRef]
  11. Arshad, F.; Lin, J.; Manurkar, N.; Fan, E.; Ahmad, A.; Tariq, M.-U.; Wu, F.; Chen, R.; Li, L. Life Cycle Assessment of Lithium-ion Batteries: A Critical Review. Resour. Conserv. Recycl. 2022, 180, 106164. [Google Scholar] [CrossRef]
  12. Sadik-Zada, E.R.; Gatto, A.; Scharfenstein, M. Sustainable management of lithium and green hydrogen and long-run perspectives of electromobility. Technol. Forecast. Soc. Chang. 2023, 186, 121992. [Google Scholar] [CrossRef]
  13. Takahashi, R.; Hiromasa, K.; Kobayashi, T. Environmental impact of battery energy storage systems in power grids. In Proceedings of the 2019 Annual Conference of Power and Energy Society IEE of Japan, Hiroshima, Japan, 6 September 2019. (In Japanese). [Google Scholar]
  14. Ellingsen, L.A.-W.; Hung, C.R.; Strømman, A.H. Identifying key assumptions and differences in life cycle assessment studies of lithium-ion traction batteries with focus on greenhouse gas emissions. Transp. Res. Part D Transp. Environ. 2017, 55, 82–90. [Google Scholar] [CrossRef]
  15. Cusenza, M.A.; Bobba, S.; Ardente, F.; Cellura, M.; Di Persio, F. Energy and environmental assessment of a traction lithium-ion battery pack for plug-in hybrid electric vehicles. J. Clean. Prod. 2019, 215, 634–649. [Google Scholar] [CrossRef]
  16. Deng, Y.; Li, J.; Li, T.; Gao, X.; Yuan, C. Life cycle assessment of lithium sulfur battery for electric vehicles. J. Power Sources 2017, 343, 284–295. [Google Scholar] [CrossRef]
  17. Faria, R.; Marques, P.; Garcia, R.; Moura, P.; Freire, F.; Delgado, J.; de Almeida, A.T. Primary and secondary use of electric mobility batteries from a life cycle perspective. J. Power Sources 2014, 262, 169–177. [Google Scholar] [CrossRef]
  18. Abdurazzokov, U.; Sattivaldiev, B.; Khikmatov, R.; Ziyaeva, S. Method for assessing the energy efficiency of a vehicle taking into account the load under operating conditions. E3S Web Conf. 2021, 264, 05033. [Google Scholar] [CrossRef]
  19. Wassiliadis, N.; Steinsträter, M.; Schreiber, M.; Rosner, P.; Nicoletti, L.; Schmid, F.; Ank, M.; Teichert, O.; Wildfeuer, L.; Schneider, J.; et al. Quantifying the state of the art of electric powertrains in battery electric vehicles: Range, efficiency, and lifetime from component to system level of the Volkswagen ID. 3. eTransportation 2022, 12, 100167. [Google Scholar] [CrossRef]
  20. Yang, F.; Xie, Y.; Deng, Y.; Yuan, C. Predictive modeling of battery degradation and greenhouse gas emissions from US state-level electric vehicle operation. Nat. Commun. 2018, 9, 1–10. [Google Scholar]
  21. Yang, F.; Xie, Y.; Deng, Y.; Yuan, C. Impacts of battery degradation on state-level energy consumption and GHG emissions from electric vehicle operation in the United States. Procedia CIRP 2019, 80, 530–535. [Google Scholar] [CrossRef]
  22. Ellingsen, L.A.-W.; Majeau-Bettez, G.; Singh, B.; Srivastava, A.K.; Valøen, L.O.; Strømman, A.H. Life cycle assessment of a lithium-ion battery vehicle pack. J. Ind. Ecol. 2014, 18, 113–124. [Google Scholar] [CrossRef]
  23. Ellingsen, L.A.-W.; Singh, B.; Strømman, A.H. The size and range effect: Lifecycle greenhouse gas emissions of electric vehicles. Environ. Res. Lett. 2016, 11, 054010. [Google Scholar] [CrossRef]
  24. ISO 14040; Environmental Management Life-Cycle Assessment—Principles and Framework. International Organization for Standardization: Geneva, Switzerland, 2006.
  25. ISO 14044; Environmental Management—Life-Cycle Assessment—Requirements and Guidelines. International Organization for Standardization: Geneva, Switzerland, 2006.
  26. Inventory Database for Environmental Analysis (IDEA), Greenhouse Gas Protocol. Available online: https://ghgprotocol.org/third-party-databases/IDEA (accessed on 2 February 2023).
  27. Imamura, E.; Iuchi, M.; Bando, S. Comprehensive Assessment of Life Cycle CO2 Emissions from Power Generation Technologies in Japan; CRIEPI Socio-economic Research Center Report No. Y06; Central Research Institute of Electric Power Industry: Tokyo, Japan, 2016. (In Japanese) [Google Scholar]
  28. Taniguchi, K.; Kamiya, Y.; Daisho, Y. Performance evaluation of short range frequent charging electric bus (second report) -Detailed analysis of battery deterioration over long-term operation of development bus. Trans. Soc. Automot. Eng. Jpn. 2015, 46, 373–378. (In Japanese) [Google Scholar]
  29. Industrial Technology Council. Life Cycle Assessment of Lithium Cell; Ministry of International Trade and Industry: Tokyo, Japan, 1997.
  30. Seyama, Y.; Shimozono, T.; Nishiyama, K.; Nakajima, H.; Sonoda, T. Development of Large-scale Lithium Ion Batteries “LIM series” for Industrial Applications. GS News Tech. Rep. 2003, 62, 76–81. [Google Scholar]
  31. Mizutani, M.; Kobayashi, T.; Watabe, K.; Wada, T. Study of efficiency of battery energy storage system. IEEJ Trans. Power Energy 2016, 136, 1–9. (In Japanese) [Google Scholar] [CrossRef]
  32. Allowance, B.E.; Kabushikigaisya, I.S. Available online: http://ishidasangyo.co.jp/technicaldata/busba.html (accessed on 2 February 2023). (In Japanese).
  33. Gupta, A.; Mason, M. Making REDD+ transparent: The politics of measuring, reporting and verification systems. In Transparency in Global Environmental Governance: Critical Perspectives; MIT Press: Cambridge, MA, USA, 2014; pp. 181–201. [Google Scholar]
  34. Global LCA Data Access Network. Available online: https://www.globallcadataaccess.org/ (accessed on 2 February 2023).
Figure 1. System boundary and individual targeted components.
Energies 16 01508 g001
Figure 2. Simplified battery system configuration and losses.
Energies 16 01508 g002
Figure 3. Material to production CO2 emissions per battery unit storage capacity.
Energies 16 01508 g003
Figure 4. Total CO2 emissions considering battery degradation (a) with degradation; (b) without degradation.
Energies 16 01508 g004
Figure 5. CO2 emission per total lifetime delivered electricity (a) mix; (b) renewables.
Energies 16 01508 g005
Table 1. System specification.
CellRated power capacity (Ah)40
Nominal voltage (V)3.8
Rated power capacity (Wh)152
Volumetric energy density (Wh/L)143
Weight energy density (Wh/kg)72
Dimensions (mm)W170 × D47 × H133
Weight (kg)2.1
ModuleCell configuration1 in Parallel × 7 in Series
Rated power capacity (Wh)1064
Weight energy density (Wh/kg)63
Weight (kg)17
UnitModule configuration3 in Parallel × 14 in Series (for E-bus)
Rated power capacity (kWh)44.68
Rated current (A)120
Service life (year)6
Weight (kg)714
Table 2. Unit components of generic data model.
ComponentMaterialWeight (kg)
Cathode
(Positive terminal)
LiNiO2205.256
Carbon black4.729
Binder (PVDF)4.729
NMP18.681
Al foil38.308
PP0.071
Anode
(Negative terminal)
Graphite87.967
Binder (PVDF)1.892
NMP7.804
Cu foil72.360
NiO2.838
ElectrolytePC, DEC47.294
LiPF65.912
SeparatorCellulose30.978
GasketPP2.365
Insulating plate for plus terminalPP0.946
Intermediate mating bodyPBT1.419
StripAl 2.578
Outer filmPolyester film5.770
Safety valveAl 5.770
Sub-discAl 0.733
Cell casingAl 39.727
CapFe11.587
Insulation for capPP0.899
Center coreFe9.695
Fixing tapePP2.128
Insulation for baseplatePP1.419
Upper insulation sheetPP0.236
Insulation for upper coverPP1.182
PTC elementPE2.128
Parts for moduleCu14.862
PP55.731
Silicone phenolic resin26.008
Total 714.000
Table 3. Electricity used for production.
Component/ProcessElectricity (kWh)
CellCathode1046.57
Anode1476.15
Electrolyte167.04
Assembly267.27
ModuleAssembly291.61
Table 4. Degradation calculation.
LossLoss_Sd
(One Way)
Charge/Discharge CycleLoss
(MWh/Year)
Discharge Energy
(MWh/Year)
Charged Energy
(MWh/Year)
1st year15.7%1.9%2.65 2.0 13.0 15.0
2nd year16.6%2.4%2.81 2.2 13.0 15.2
3rd year17.7%2.9%3.00 2.3 13.0 15.4
4th year18.9%3.5%3.21 2.4 13.0 15.7
5th year20.2%4.1%3.46 2.6 13.0 16.0
6th year21.7%4.9%3.74 2.8 13.0 16.4
Sum of 6 years14.477.8 93.8
Loss/Discharge18.5%
Table 5. CO2 emissions of material to production phases.
ComponentsWt% of Total Battery SystemCO2 Emission
MixRenewable
% kg-CO2kg-CO2/wh_bc%kg-CO2kg-CO2/wh_bc
Cathord38.1%52.9%4480.699.665.9%4480.699.6
Anode24.2%9.9%838.618.612.3%838.618.6
Electrolyte7.5%1.6%134.13.02.0%134.13.0
Separator4.3%0.3%26.20.60.4%26.20.6
Cell casing5.6%7.8%663.714.89.8%663.714.8
Other component for cell6.8%3.0%256.15.73.8%256.15.7
Parts for module13.5%2.5%209.34.73.1%209.34.7
Energy for cell manufacture-20.0%1693.937.72.6%174.53.9
Energy for module manufacture-2.0%167.03.70.3%17.20.4
ToTal100%100%8470188.3100%6609151.2
* kg of battery unit.
Disclaimer/Publisher’s Note: The statements, opinions and data contained in all publications are solely those of the individual author(s) and contributor(s) and not of MDPI and/or the editor(s). MDPI and/or the editor(s) disclaim responsibility for any injury to people or property resulting from any ideas, methods, instructions or products referred to in the content.

