
Energy Intensity of Food Industry Production in Poland in the Process of Energy Transformation


1
Department of Logistics, Institute of Economics and Finance, Warsaw University of Life Sciences—SGGW, 02-787 Warsaw, Poland
2
Department of Agribusiness and Bioeconomy, Institute of Agricultural and Food Economics National Research Institute, 00-002 Warsaw, Poland
*
Author to whom correspondence should be addressed.
Energies 2023, 16(4), 1843; https://0-doi-org.brum.beds.ac.uk/10.3390/en16041843
Submission received: 28 December 2022
/
Revised: 1 February 2023
/
Accepted: 9 February 2023
/
Published: 13 February 2023
(This article belongs to the Special Issue Policy and Economics Analysis of Renewable Energy Sources and Bioenergy)
Abstract
:The aim of this study was to assess the energy consumption of production in selected branches of the food industry in Poland and to identify its changes after Poland’s accession to the EU. This issue is particularly important in the period of energy transformation and soaring energy prices. The novelty of this article is the determination of changes in the energy efficiency of various branches of the food industry. The main source of data was mass statistics data and unpublished data from the Central Statistical Office for 2004–2020. Descriptive statistics, comparative analysis, and strategic group mapping were used in the data analysis. The research shows that the production of foodstuffs is one of the most energy-intensive processing sectors. This results, among others, from many active enterprises in this sector and a large variety of industries. Individual food-processing industries are characterized by large differences in the energy consumption of production, which determines the different levels of electricity costs and affects the competitiveness of enterprises. In 2004–2019, the average electricity consumption in the food industry in Poland decreased by 31.5%. A greater increase in the value of sold production compensated for the higher energy consumption. This indicates an improvement in production efficiency and contributes to greater environmental protection. In the food sector, simple comparative advantages disappear in the form of lower production costs. This situation encourages processing companies to look for energy savings. The research results can be useful not only in Poland but also in other countries in shaping economic policy. The energy crisis caused by the war in Ukraine may require different actions to be taken against various sectors of the food industry.
Keywords:
energy efficiency; branches; changes; consumption; sold production; employment; fuels; electricity; innovations; energy policy1. Introduction
According to estimates by the Food and Agriculture Organization of the United Nations, the food sector accounts for around 30% of the world’s demand for primary energy. The vast majority of this energy is used for the needs of energy-intensive food processing, i.e., processes such as cooling, washing, cooking, extraction, pureeing, brewing, baking, pasteurization, and drying. Data from the FAO and the European Environment Agency show that the food sector consumes approximately 200 EJ annually [1,2], of which 45% is related to food processing and distribution [3,4]. The high energy intensity of the food industry is associated with high levels of greenhouse gas emissions (GHGE) and the depletion of natural resources [1]. Although the use of solid fuels is decreasing, the food industry is still dependent on other fossil energy sources [5,6,7], such as natural gas and oil, so current food production practices are considered unsustainable [1,8].
From 2021, the energy market in the EU will be significantly affected by the war in Ukraine. The sanctions imposed on Russia by the US and the European Union have increased fuel prices. It is estimated that as a result of this conflict and the sanctions imposed on Russia, energy prices increased three to four times. Russia is a significant exporter of both gas and crude oil [9].
The reduction in energy consumption is influenced by its effective use, i.e., rational and sustainable management of both the energy itself and the energy resources used to produce it. Improving efficiency reduces the increase in demand for fuels and energy and also reduces the negative impact of the energy sector on the environment and human health by reducing greenhouse gas emissions [10]. Many countries recognize that energy efficiency brings benefits to national security because, thanks to its increase, it is possible to reduce the import of energy from abroad and reduce the use of energy from domestic sources [11].
Increased energy efficiency and its management can provide companies with a competitive advantage and an important strategic asset, allowing them to react flexibly in scenarios of change and development [12,13,14] and to maximize the use of their energy sources and assets, thus reducing energy costs, as well as its consumption [15]. Energy efficiency is a key turn in modern industry, and has become an important factor in competitiveness, sustainable development, and environmental performance [16].
Reducing energy consumption and reducing waste are increasingly important issues for the EU. In 2007, EU leaders set a target of reducing the EU’s annual energy consumption by 20% by 2020. Then in 2018, the Clean Energy for All Europeans package set a new target of reducing energy consumption by 2030 by at least 32.5%. Ensuring energy efficiency is increasingly recognized as a means of ensuring a sustainable energy supply, reducing greenhouse gas emissions, increasing the security of supply, reducing energy import expenditure, and promoting the EU’s competitiveness.
Energy efficiency (EE) is, therefore, a strategic priority of the Energy Union, and the EU promotes the ‘energy efficiency first’ principle [17]. Energy efficiency is particularly important for the food industry due to the high consumption of electricity, water, and heat. Improving the energy efficiency of enterprises translates into lower operating costs and brings environmental benefits. Through the rational use of energy resources, a company can reduce CO2 emissions to the atmosphere [18]. At a time of serious challenges regarding the increase in prices for individual energy carriers, which result primarily from limited energy resources and the war in Ukraine, this topic is extremely important. In terms of energy, Poland is still dependent on foreign imports. It still bases its economy and industry on non-renewable, including imported, energy sources. The costs and demand for energy are increasing; therefore, reducing its consumption and increasing the efficiency of products, installations, or facilities are significant challenges for enterprises [19].
Individual food-processing industries are characterized by large differences in the energy consumption of production. Production companies use different production technologies and have different systems of material and energy flows. Diversified energy intensity of production determines different levels of electricity costs and affects the competitiveness of enterprises in a given industry. The energy crisis caused by the war in Ukraine may require different actions for various branches of the food industry. The literature review shows that this problem has not been widely analysed so far due to the limited access to data from enterprises. Therefore, the aim of this study was to assess the energy consumption of production in selected branches of the food industry in Poland and to identify its changes after Poland’s accession to the EU. The most energy-intensive industries are particularly sensitive to the continuity of supplies and changes in energy prices and should be included in the government’s protective measures. The research results can be useful not only in Poland but also in other countries in shaping economic policy. This study attempts to answer the following questions:
- What is the energy consumption in different branches of the food industry?
- What is the consumption of fossil fuels in food-industry enterprises?
- What energy-efficiency strategies characterize individual branches of the food industry?
- What is the share of energy costs in the total costs of food-industry enterprises?
The study consists of six chapters. The introduction presents the justification for undertaking the subject of the research. The second chapter reviews the literature on energy consumption in the food industry, energy-efficiency measurement, energy policy in the EU and Poland, and innovations in shaping energy transformation. The third chapter describes the research methodology, and the fourth presents the research results on changes in energy intensity in individual sections of the food industry in Poland from 2004 to 2019. The next chapter discusses the obtained results. The article ends with conclusions and recommendations for further research.
2. Literature Review
2.1. Research on Energy Consumption in the Food Industry
Energy consumption by the food industry varies from country to country and depends on the type of product produced [20]. Low productivity and inefficient processing technologies contribute to the high energy consumption of food products [21,22,23]. This phenomenon is particularly noticeable in less-developed countries [24]. In Poland, in 2020, the food industry’s share in the processing industry’s energy-consumption structure was 13.3%, and the average annual growth rate of value-added energy intensity in 2011–2020 was 0.9% [25]. In the structure of food production, enterprises from the dairy, fruit and vegetable processing, and refrigeration industries are the most sensitive to energy costs.
Research on energy consumption in the American food system was conducted by Hendrickson, who summarized energy data divided into food subsectors and also pointed to potential measures to reduce energy consumption [26]. In Sweden, research on energy consumption in the food sector was carried out by Carlsson-Kanyama and Faist [27]. They analysed food-processing data, taking into account very detailed information on products, processes, and energy sources. Foster et al. analysed the life cycle of many food products in a report prepared for DEFRA (Department for Environment, Food and Rural Affairs). They indicated the energy consumption at various stages of the product life cycle and identified the most energy-intensive stages [28]. Similar research was carried out by Compton, Willis, Rezaie, and Humes, who updated the processing of data on energy consumption at various stages of the product life cycle and identified more efficient processes [29].
According to Wojdalski and Drożdż, the consumption of energy carriers in food enterprises depends on many factors. The most important are the thermophysical properties of raw materials, requirements for products, production technology, size and structure of production, technical equipment, degree of mechanization of production operations, degree of utilization of processing capacity, and organization of production [30]. The key to the legitimacy of undertaking actions in the field of energy-efficiency improvement is the development of guidelines for technically and economically justified projects. These activities should be supported by an energy-efficiency audit [31]. According to Dołęga, the improvement of energy efficiency in the industry can be achieved by [32]:
- -
- use of modern technologies and devices,
- -
- development of energy-management systems and energy-audit systems,
- -
- development of high-efficiency cogeneration,
- -
- introducing a mechanism of financial incentives supporting market transformation towards increasing the share of energy-saving devices,
- -
- introduction of a training program in the field of energy management,
- -
- changes in technology to reduce energy demand,
- -
- reuse of waste energy,
- -
- thermal modernization of facilities.
Many publications indicate the existence of discrepancies between the energy-efficiency potential and the solutions actually implemented [33]. This phenomenon is referred to as the energy-efficiency gap, and its occurrence results from various barriers [34]. Considerations regarding the energy-efficiency gap focus mainly on the reasons why investments in reducing energy consumption are not introduced. It is also indicated that energy management can be beneficial for enterprises for economic, environmental, and social reasons [35].
According to Thollander and Ottosson, barriers to energy efficiency can be divided into market, organizational, and behavioural. The market perspective emphasizes the importance of maximizing utility and minimizing costs with regard to energy efficiency. It draws attention to the aspect of costs and international competitiveness [36]. With regard to efficiency investments, the availability of capital and the problem of hidden costs are frequent barriers. Market barriers also include market failures related to asymmetry or lack of information on the energy performance of technologies and savings potential. A lack of complete information may lead to suboptimal decisions [33]. Organizational barriers are internal and result from solutions shaping the organization. They include a lack of capital, time, and the risk of disrupting production [37]. The third group includes behavioral barriers related to the individual, e.g., limited rationality of decision-making, failure to adjust the form of information to the recipient’s needs, lack of trust in information sources [38], or different values [39].
O’Driscoll et al. stated that the manufacturing sector should focus on achieving energy transparency by connecting an effective energy-metering system to monitor and control the energy needs of the production facility. With greater energy visibility, it is easier to identify opportunities to improve energy efficiency [40]. In turn, Jeon et al. looked for a way to improve the energy efficiency of production plants using the plant’s energy footprint [41].
2.2. Measures of Energy Efficiency in the Food Industry
Energy efficiency is defined as the ratio of the obtained value of the utility effect of a given device, installation, or production plant in typical conditions of their use or operation to the amount of energy consumed by this device, installation, or production plant necessary to obtain the mentioned effect [42,43]. It is the result of production (industrial) activity, the quotient of the effect obtained, and the outlay incurred. One way to measure energy efficiency is to use indicators to show the relationship between energy consumption and products. Indicators must consider the impact of economic and technical aspects [44]. Performance indicators are used to determine whether systems perform as intended and help assess progress in a given direction [45]. This allows for better tracking and control of energy consumption, which is extremely important for increasing energy efficiency in production. Energy-metric analysis can also combine consumption-related factors such as energy efficiency, energy price developments, environmental policy, changes in international energy trade, intensive intermediate or final products, and structural impacts from economic cycles to develop energy-efficiency improvement tools [46]. According to Reindl, Jekel, and Elleson, the indicator for assessing energy performance and energy efficiency in food production plants is benchmarking, i.e., a method based on comparing specific energy consumption in facilities with similar characteristics [47].
Fysikopoulos et al. illustrated an approach to assessing the energy efficiency of production at four production levels: process, machine, production line, and factory [48]. Tristo et al. presented a method for measuring the energy consumption of energy-intensive micro-production processes [49]. Sivila et al. proposed developing a measurement of energy efficiency in the energy-intensive industrial sector [50]. Raileanu et al. presented an agent-based approach to measuring the energy consumption of resources in production processes in real time in order to find easier and faster ways to optimize energy consumption. In turn, Aguirre et al. proposed a methodology for measuring the relative energy efficiency of production facilities using energy-production signatures (EPS) [51].
In some studies, the DEA method was used to assess energy efficiency. Mukherjee has used this method to measure energy efficiency in various Indian states [52]. Similar studies have been conducted by Hu et al. in Taiwan [53], Wang et al. in China [54], and Özkara and Atak in Turkey [55]. Honma and Hu carried out this kind of research in Japan, using the DEA method to measure the total energy efficiency of factors in various production sectors [56]. In turn, Martinez used the DEA method to measure the development of energy efficiency in areas of non-energy-intensive sectors in Germany and Colombia [57].
Pradella et al. conducted a systematic literature review to identify energy-efficiency indicators in the food industry. They served as input to the sectoral assessment based on multi-criteria techniques. Until now, they identified six criteria in sectoral assessments, such as Benchmarks, Key Performance Indicators, Frameworks, Monitoring, ISO 50001, and Information Communication Technologies (ICT). These criteria were assessed by experts using the Analytical Hierarchy Process (AHP), which prioritizes the food industry’s most important issues using a rating scale. Each issue was assigned weights and ranked according to the Preference Ranking Organization Method for Enrichment Evaluations (PROMETHEE) [58].
2.3. Energy Policy of the EU and Poland in the Process of Energy Transformation
Energy transformation is usually defined as the economy’s process of moving away from using fossil fuels in energy-production processes and replacing them with non-emission or low-emission sources. Such a process is accompanied by measures aimed at increasing energy efficiency, saving energy, and preferring distributed generation, which is consistent with the principle of sustainable development [59]. A key element of the energy transformation in the EU is improving energy efficiency. In 2007, the European Council adopted the so-called energy and climate package 3 × 20. It set three main goals for the European Union countries [60]:
- -
- 20% reduction in greenhouse gas emissions in 2020 compared to 1990,
- -
- increasing to 20% the share of energy from renewable sources in 2020 in total energy consumption in the EU compared to 1990,
- -
- increasing energy efficiency by 20% in 2020 compared to 2005.
The 2014 climate and energy package proposes an increase in the reduction in internal greenhouse gas emissions by 2030 by at least 40% compared to the 1990 level. In addition, the need to increase the share of energy from renewable sources to at least 27% and to improve energy efficiency in 2030 compared to the forecasts of at least 27% was indicated [61]. In December 2018, these goals were updated. The most important changes included an increase in the share of energy from RES in the total energy consumption in the EU to 32% and an increase in energy efficiency to 32.5% by 2030 [41,62]. In July 2021, the European Commission proposed, in line with the new, ambitious climate goal of reducing greenhouse gas emissions in the EU by at least 55% by 2030 compared to 1990 levels and achieving climate neutrality by 2050, to increase the reduction targets for primary and final energy consumption to 39% and 36%, respectively, by 2030, measured based on updated baseline forecasts from 2020 [63].
In Poland, the energy-efficiency policy until 2020 was shaped by such documents as:
- -
- Poland’s Energy Policy until 2030 [64],
- -
- National Action Plans (NAPs) concerning energy efficiency.
These documents were consistent with the assumptions of the EU policy. They assumed:
- improving energy efficiency, increasing the security of fuel and energy supplies, developing RES, including biofuels,
- development of competitive fuel and energy markets and reduction of the impact of the energy sector on the environment.
In the longer term, the state energy policy is defined by strategic framework documents, such as:
The “Energy Policy of Poland until 2040” adopted in 2021 provides for, among others:
- -
- the implementation of nuclear energy in 2033,
- -
- reducing greenhouse gas emissions by 30% by 2030,
- -
- an increase in energy efficiency by 23% by 2030 compared to the 2007 primary-energy-consumption forecasts.
In the short term, the National Plan for Energy and Climate for 2021–2030 sets the following climate and energy goals for 2030 [68]:
- reduction in greenhouse gas emissions by 7% in sectors not covered by the European Emissions Trading Scheme (EU ETS) compared to 2005 levels,
- 21–23% share of renewable energy sources (RES) in gross final energy consumption. At the same time, the 23% target will be achievable if Poland is granted additional EU funds, including for just transition, taking into account:
- -
- 14% share of RES in transport,
- -
- annual increase in the share of RES in heating and cooling by 1.1 percentage points,
- increase in energy efficiency by 23% compared to PRIMES2007 forecasts,
- reduction to 56–60% of the share of coal in electricity production.
2.4. Innovations in Shaping the Energy Transformation
Improving energy efficiency is primarily about promoting such solutions as [69]:
- -
- thermal modernization of buildings,
- modernization and replacement of devices with better energy efficiency (e.g., electrical devices, light sources, electric drives, technologies used in various technological processes),
- increasing the combined generation of electricity and heat,
- -
- reduction in losses in energy transmission,
- -
- increase in the use of energy from renewable sources.
The energy transformation aims to apply technological innovations that reduce energy consumption but also reduce operating costs. The currently binding Energy Efficiency Act introduces a national final energy-savings target by the end of 2030 in the amount of PLN 5,580,000 toe [70]. This goal is implemented through the system of energy-efficiency certificates (the White Certificates system) and the so-called alternative measures. The implementation of modern technologies for the operation of industrial plants is an important factor in building a competitive market position in the face of energy transformation.
In the food industry, electricity is used simultaneously to produce cold and fuel to produce heat in the form of process steam. Therefore, the use of high-efficiency cogeneration may be a valuable solution. The combined production of electricity and heat contributes to reducing the use of raw materials and environmental impact, but also to increase the energy security of the company. Cogeneration provides entrepreneurs with security by producing energy on the premises of their own plants. This also contributes to partial independence from the rising prices of energy from the power grid. Such investments contribute to savings and minimization of greenhouse gas emissions.
The agri-food sector also creates a large field of development for biogas technologies, which are a potential factor in reducing the impact of industry enterprises on the environment. Due to the large amount of water used in the food industry and the need to treat wastewater, wastewater-treatment plants are installed in enterprises. From a circular economy perspective, it is possible to build a biogas plant that provides many economic and energy benefits at the treatment plant. According to data from the Central Statistical Office, in 2018, about 72 MWe of power using biogas from sewage treatment plants was generated in Poland [71]. Implementing such solutions in large food plants (e.g., fruit- and vegetable-processing plants), combined with cogeneration, is a very good way to reduce costs and increase a company’s energy efficiency.
A valuable solution is the modernization of refrigeration systems, which in the food industry sometimes account for 60%–70% of the total electricity consumption in the plant. They are an essential part of the energy transition of the food production sector. The main directions of increasing the energy efficiency of refrigeration installations concern the selection of the refrigerant, the cooling circuit, the use of optimal thermal insulation of cold rooms, the selection of refrigeration equipment, the use of waste heat, and proper operation. Reducing the energy consumption of industrial plants can be achieved by installing RES and increasing the share of non-emission sources in the total energy balance used for cooling purposes [72].
The literature also points to examples of the beneficial use of heat energy from food-processing wastewater for heating processes to minimize the consumption of steam and, indirectly, the amount of natural gas burned in boilers [73,74]. Replacing part of the natural gas consumption with recovered waste heat reduces the amount of fuel purchased for processing, thus reducing greenhouse gas emissions and bringing economic benefits to the food sector [75].
3. Materials and Methods
Due to the inability to obtain information on the energy intensity of production from enterprises, the research used the Statistical Yearbooks of Industry from 2005 to 2020 and unpublished data of the Central Statistical Office for medium and large enterprises in 2004–2019. These data are provided by enterprises to the Central Statistical Office in the form of reports. Obtaining these data requires financial outlays. According to the classification of the Central Statistical Office, medium-sized enterprises employ from 50 to 249 people, and large enterprises employ more than 249 people. The analysis covered the consumption of fuels and electricity in the industry by selected sections and divisions, the volume of sold production and the level of employment in the food industry, as well as the share of electricity in the consumption of production materials in selected branches of the food industry. The assessment of production-energy consumption in individual branches of the food industry was made based on the two most frequently used indicators: the production-energy consumption index and the employment-energy consumption index. The production-energy intensity ratio is the ratio of energy consumption to sold production (Equation (1)).
where:
- Ep—production energy consumption
- Ez—direct energy consumption in a given branch of the food industry
- P—value of production sold in a given branch of the food industry
The production-energy intensity index is the ratio of energy consumption to employment in a given branch of the food industry (Equation (2)).
where:
- Ep—energy intensity of employment
- Ez—direct energy consumption in a given branch of the food industry
- Z—size of employment in a given branch of the food industry
The calculated indicators allowed us to identify the most and least energy-intensive industries in the food industry in Poland. Then, the total energy intensity was calculated by multiplying the obtained energy intensity indicators by the value of sold production and the number of people employed in individual industries. The ratio analysis, comparative analysis, and the method of strategic groups were used in relation to separate branches of the food industry. In the creation of strategic groups, two indicators were used: energy intensity of sold production and energy intensity of employment. In relation to these indicators, a two-level scale was used: low and high. On this basis, it was possible to qualify individual industries to one of the strategic groups in 2014 and 2019 [76]. This solution made it possible to determine the direction of changes in separate branches of the food industry (Scheme 1).
Then, a detailed analysis covered the most energy-intensive branches of the food industry. In order to illustrate the changes in the years 2004–2019 more accurately, the production value was determined in fixed prices for 2019. For these industries, a trend line was defined in terms of the energy intensity of production and the energy intensity of employment.
4. Results
4.1. Consumption of Energy and Fuels in the Food Industry
The food industry, including the production of food and beverages, is one of Poland’s most energy-intensive production sectors. In 2004, companies in this sector used 91,327 TJ of energy. They were ranked fourth in terms of direct energy consumption in industrial processing, after companies dealing in the production of chemicals and chemical products (199,637 TJ), coke and refined petroleum products (190,757 TJ), and metals (161,644 TJ). The share of the three most energy-intensive sectors in direct energy consumption in manufacturing was 58.7%, and the food industry was 68.4%. At the opposite pole, there are such departments as the production of clothing, leather and leather products, tobacco products, computers, and electronic products, whose share in energy consumption in manufacturing ranged from 0.1% to 0.4% (Table 1).
After Poland acceded to the EU, within 15 years, the energy intensity of the food industry increased by 5.1% to 98,515 TJ in 2019, moving this sector to the third place among the most energy-intensive processing sectors, behind companies producing coke and refined petroleum products (252,083 TJ) and chemicals and chemical products (195,911 TJ). The share of the food industry (production of foodstuffs and beverages) in direct energy consumption in manufacturing amounted to 9.6%, i.e., similar to 2004. It was slightly higher than the section producing metals. The increase in energy consumption in the food industry resulted primarily from the increase in sold production by 135% (from PLN 113.5 to PLN 266.2 billion) in current prices and by 91% in constant prices [80]. Significantly, at that time, food industry companies invested in purchasing new, more efficient, and energy-saving machines and devices and introduced more energy-saving production technologies and alternative energy sources (RES).
In terms of consumed fuels and electricity, the food industry is ranked at the forefront of industrial processing departments in Poland. From 2004 to 2019, the direct consumption of hard coal in enterprises of the processing industry decreased by 26.0% to 4690 thousand tons, and even more, because the consumption of coke and semi-coke decreased by 67.5% and amounted to 450 thousand tons. On the other hand, the consumption of high-methane natural gas increased by 45.8% to 7393 hm3 and of electricity by 31.9% to 56,196 GWh (Table 2 and Table 3).
Similar trends in the structure of changes in the consumption of energy carriers used in production processes also occurred in the food industry, i.e.:
- -
- consumption of hard coal decreased by 35.8% (to 997 thousand tons),
- -
- the use of coke and semi-coke was reduced by 39.5% (to 26 thousand tons),
- -
- consumption of high-methane natural gas increased by 126.7% (to 916 hm3),
- -
- electricity consumption increased by 71.6% (to 7291 GWh).
At the same time, hard coal, coke, and semi-coke were subsidized by natural gas and electricity in production processes in industrial processing. This subsidization of fuels was related, among others, to moving away from coal in the Polish economy and greater care and concern for the environment, which is reflected in the reduction in pollution, including, among others, reducing CO2 emissions. These activities result from the pro-ecological attitude of the European Union to issues related to environmental protection and the dynamically changing conditions in the market of energy and agricultural raw materials. An expression of the announced changes is the European Green Deal, an integral part of which is the “Farm to Fork” strategy. As Szajner and Szczepaniak point out, this strategy applies to all actors in the food chain that have undergone or will transform towards sustainable practices. It is assumed that each of them should contribute to this process. Entities operating in all links of the supply chain contribute to air, soil, and water pollution, as well as greenhouse gas emissions, and also have a significant impact on biodiversity [81].
The food industry has changed its position in terms of fuels used and electricity compared to other industrial processing sectors. In 2004, it was ranked first in terms of hard coal consumption, second in terms of the use of nitrogen-rich natural gas, and third in terms of other fuels and electricity. In 2019, the food industry ranked second in terms of hard coal consumption, third in terms of high-methane natural gas and electricity, and fourth in terms of coke, semi-coke, and nitrogen-rich gas (Table 4):
4.2. Energy Intensity of Production and Employment in the Food Industry
In the years 2004–2019, the total energy intensity of the food industry, including the production of food products and beverages, measured by the value of sold production of the sector, increased by 70.5% to 8,052,509.8 MWh, with the increase in the production of food products by 71.5%, and in the production of beverages by 43.0% (Table 5). In the analysed branches of the food industry, changes in energy intensity ranged from minus 20.3% for the sugar industry to 605.5% for the production of spices. This was mainly the result of changes in the level of production, as its value in the sugar industry decreased by 4.8% in current prices, while the value of spices sold increased six times. The data show that in the food industry, there is a correlation between production and energy consumption, as an increase in production usually entails higher energy consumption. In the analysed period, the value of sold production of medium-sized and large companies in the food industry (producing food and beverages) in current prices increased by nearly 150% (from PLN 87.5 to 217.6 billion), and in constant prices by about 103%. This increase was the share of practically all production activities of the food industry. The analysed activities ranged from 36.7% in the production of beer to 413.4% in the processing and preservation of fish. The only exception was the value of sold sugar production. Such a large diversification in production growth resulted from many factors and conditions, e.g., reference level, the use of opportunities arising from Poland’s accession to the European Union, the economic situation and competition 5n the market, oandr the existing and used comparative advantages.
Another regularity consisted in lowering the unit energy intensity of production with the increase in production. This resulted, among others, from the distribution of fixed costs in each enterprise (e.g., electricity in administrative and office premises) into a larger value of the production volume. In the case of products sold in terms of value, the weakness is the volatility of producer prices, which in the case of volume, is eliminated. The decrease in the unit energy intensity of production, along with the increase in the value of production, occurred in the vast majority of selected branches of the food industry. In the years 2004–2019, the average energy consumption per PLN 100 of sold production in medium-sized and large food-industry enterprises decreased from 5.4 to 3.7 kWh. In 2004, the energy intensity of production in the analysed industries of this sector ranged from 1.8 to 12.7 kWh, and in 2019 from 1.6 to 9.8 kWh.
The data in Table 4 show that the most energy-intensive branches of the food industry in Poland are:
- -
- meat industry (production, processing, and preservation of meat and meat products),
- -
- dairy industry with ice cream (manufacture of dairy products),
- -
- fruit and vegetable industry.
In 2019, electricity consumption in these branches of the food industry in medium-sized and large enterprises amounted to 3,901,406 MWh, which accounted for 48.4% of the energy consumed in the entire sector. In 2004, this share was 52.3%.
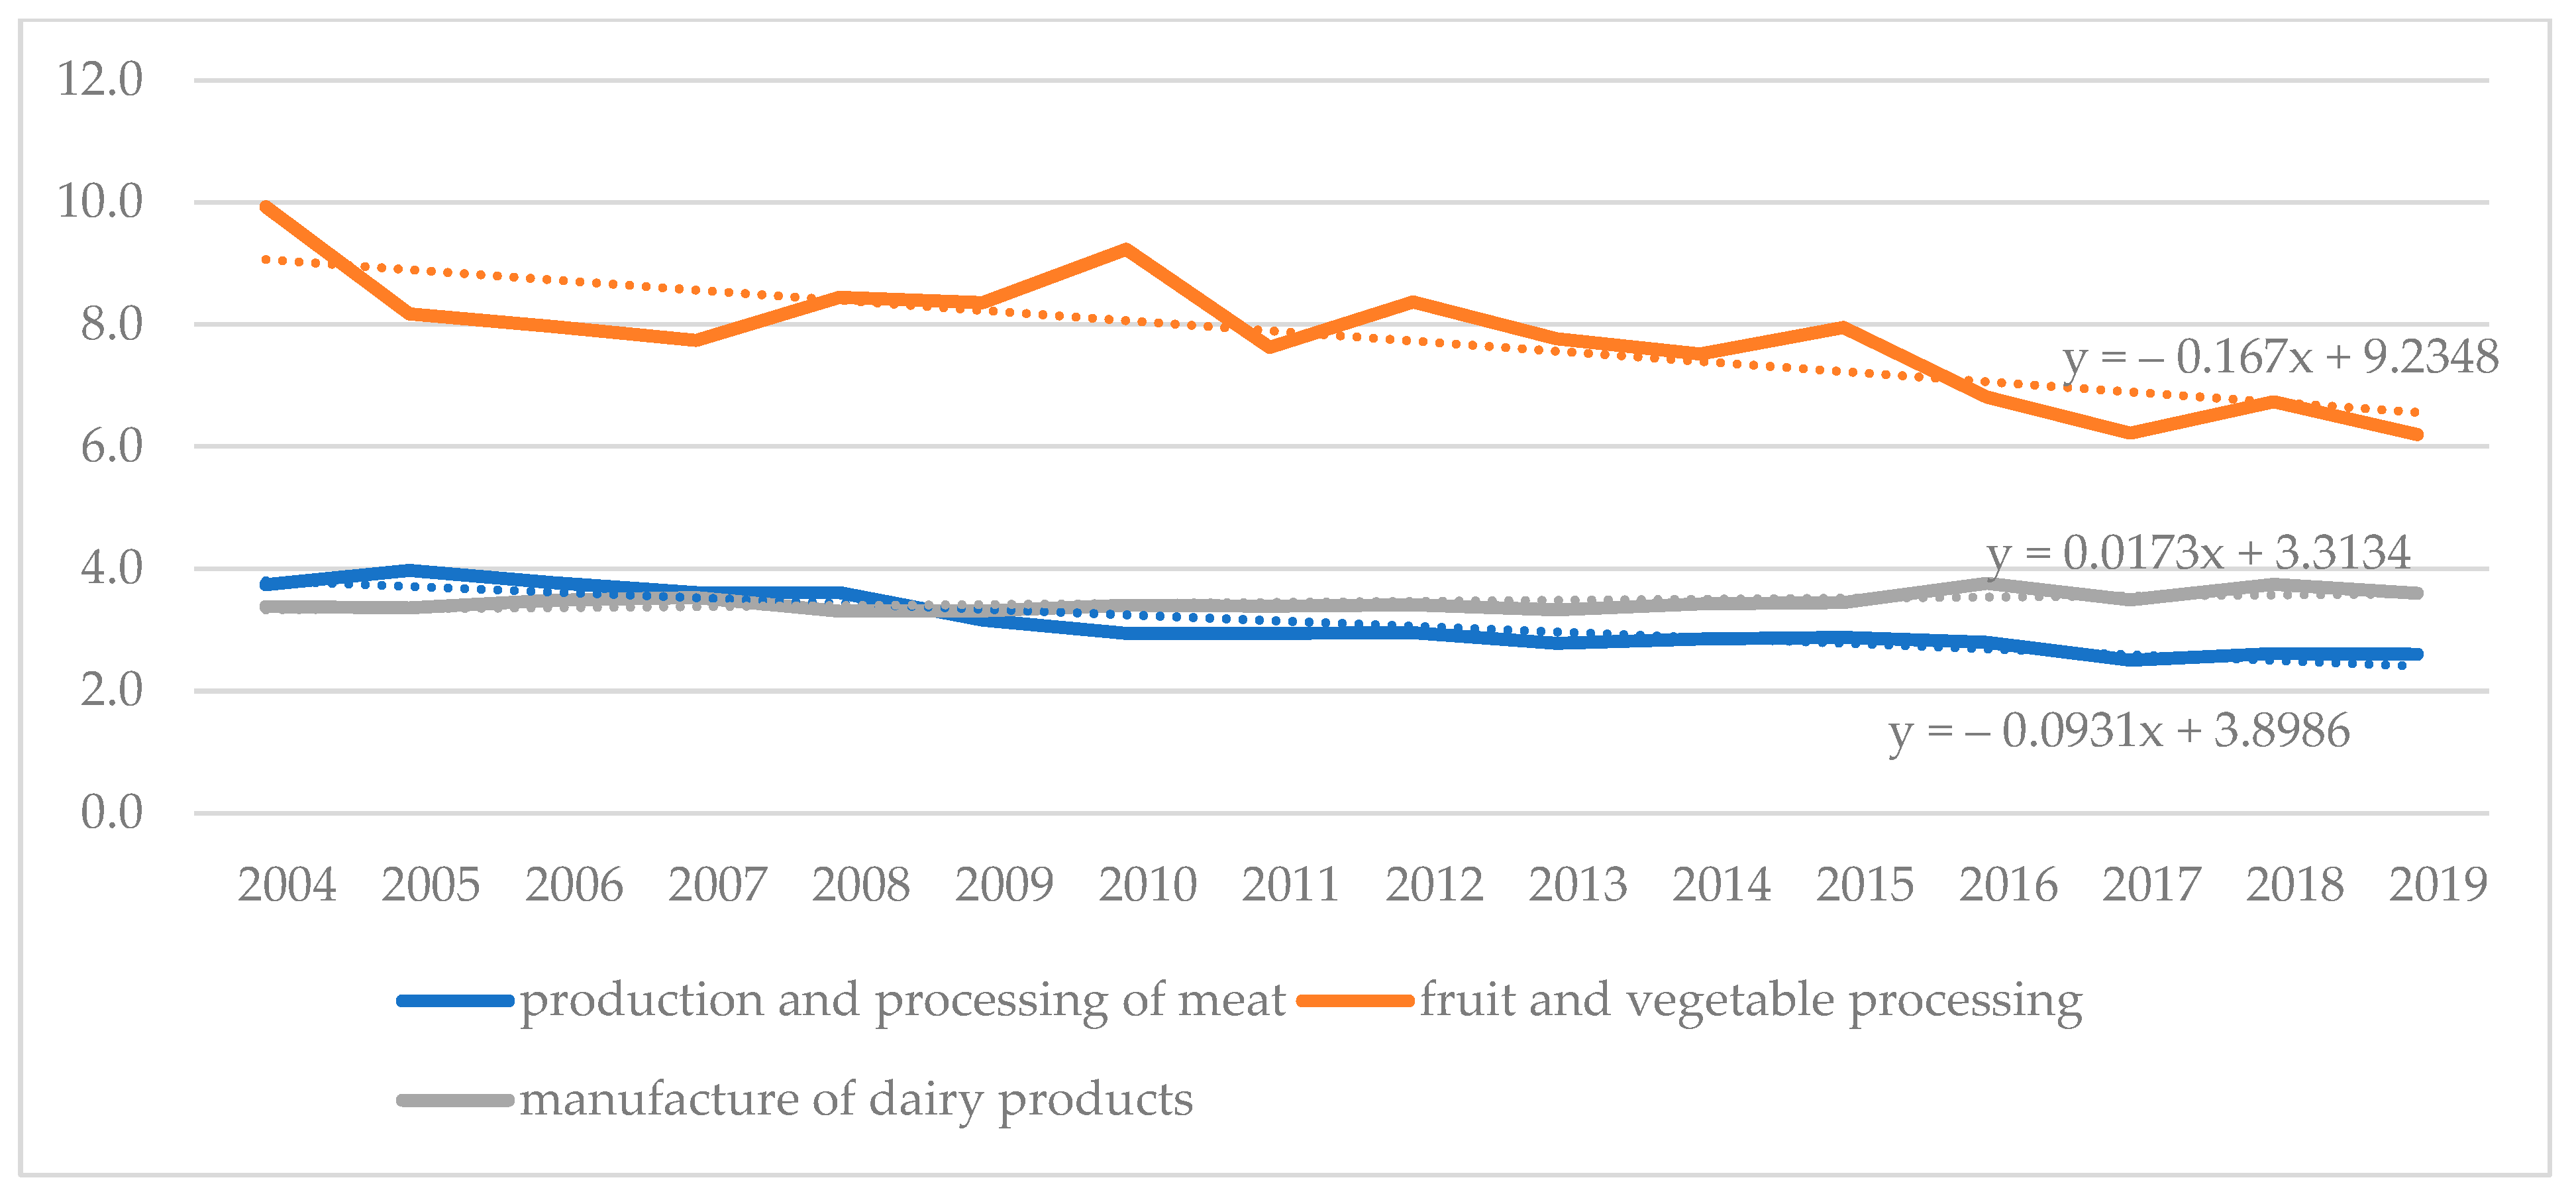
In order to illustrate changes in the electricity consumption per PLN 100 of sold production more objectively, the value of production in current prices was converted into constant prices. Indices of changes in producer prices are presented for the three most energy-intensive branches of the food industry (in total terms), i.e., production and processing of meat, fruit, and vegetables as well as milk and milk products. In the years 2004–2019, in fruit and vegetable processing, including (1) potato processing and canning, (2) fruit and vegetable juice production, and (3) fruit and vegetable processing and canning, electricity consumption had a decreasing trend and decreased by 37.4 % from 9.9 to 6.2 kWh/PLN 100 of the value of sold production (in constant prices from 2019). Investments in more efficient fixed assets contributed to this. There was also a downward trend in electricity consumption in the production and processing of meat, the consumption of which decreased by 29.7% (from 3.7 to 2.6 kWh/PLN 100). This resulted from the use of more efficient machines and devices. The production of milk and milk products was characterized by a relatively stable level of electricity consumption, as its consumption ranged from 3.3 to 3.8 kWh/PLN 100 of the value of sold production (Figure 1).
Different trends were observed in electricity consumption per employee. They were growing, even in those activities where employment increased (Table 6). This was because the increase in employment in these industries was lower than the total increase in electricity consumption.
Electricity consumption per employee in the meat, fruit and vegetable, and dairy industries is shown in Figure 2. In 2004–2019, electricity consumption in these departments increased by 62.4, 56.6, and 86.5% to 19.0, 56.6, and 86.5 MWh per employee, respectively. It should be emphasized that in processing enterprises, the consumption of electricity is determined primarily by the size and profile of production, modern machinery and production equipment, and the use of production capacity.
The obtained results regarding energy consumption in individual branches of the food industry differ from each other because they refer to two different parameters: the value of production and the size of employment. With regard to employment, it is not easy to optimize it in enterprises, which, in conjunction with the size of the enterprise (scale of production), affects the productivity (efficiency) of work. In addition, in some industries, production is seasonal, i.e., not evenly distributed throughout the year, e.g., in the sugar industry.
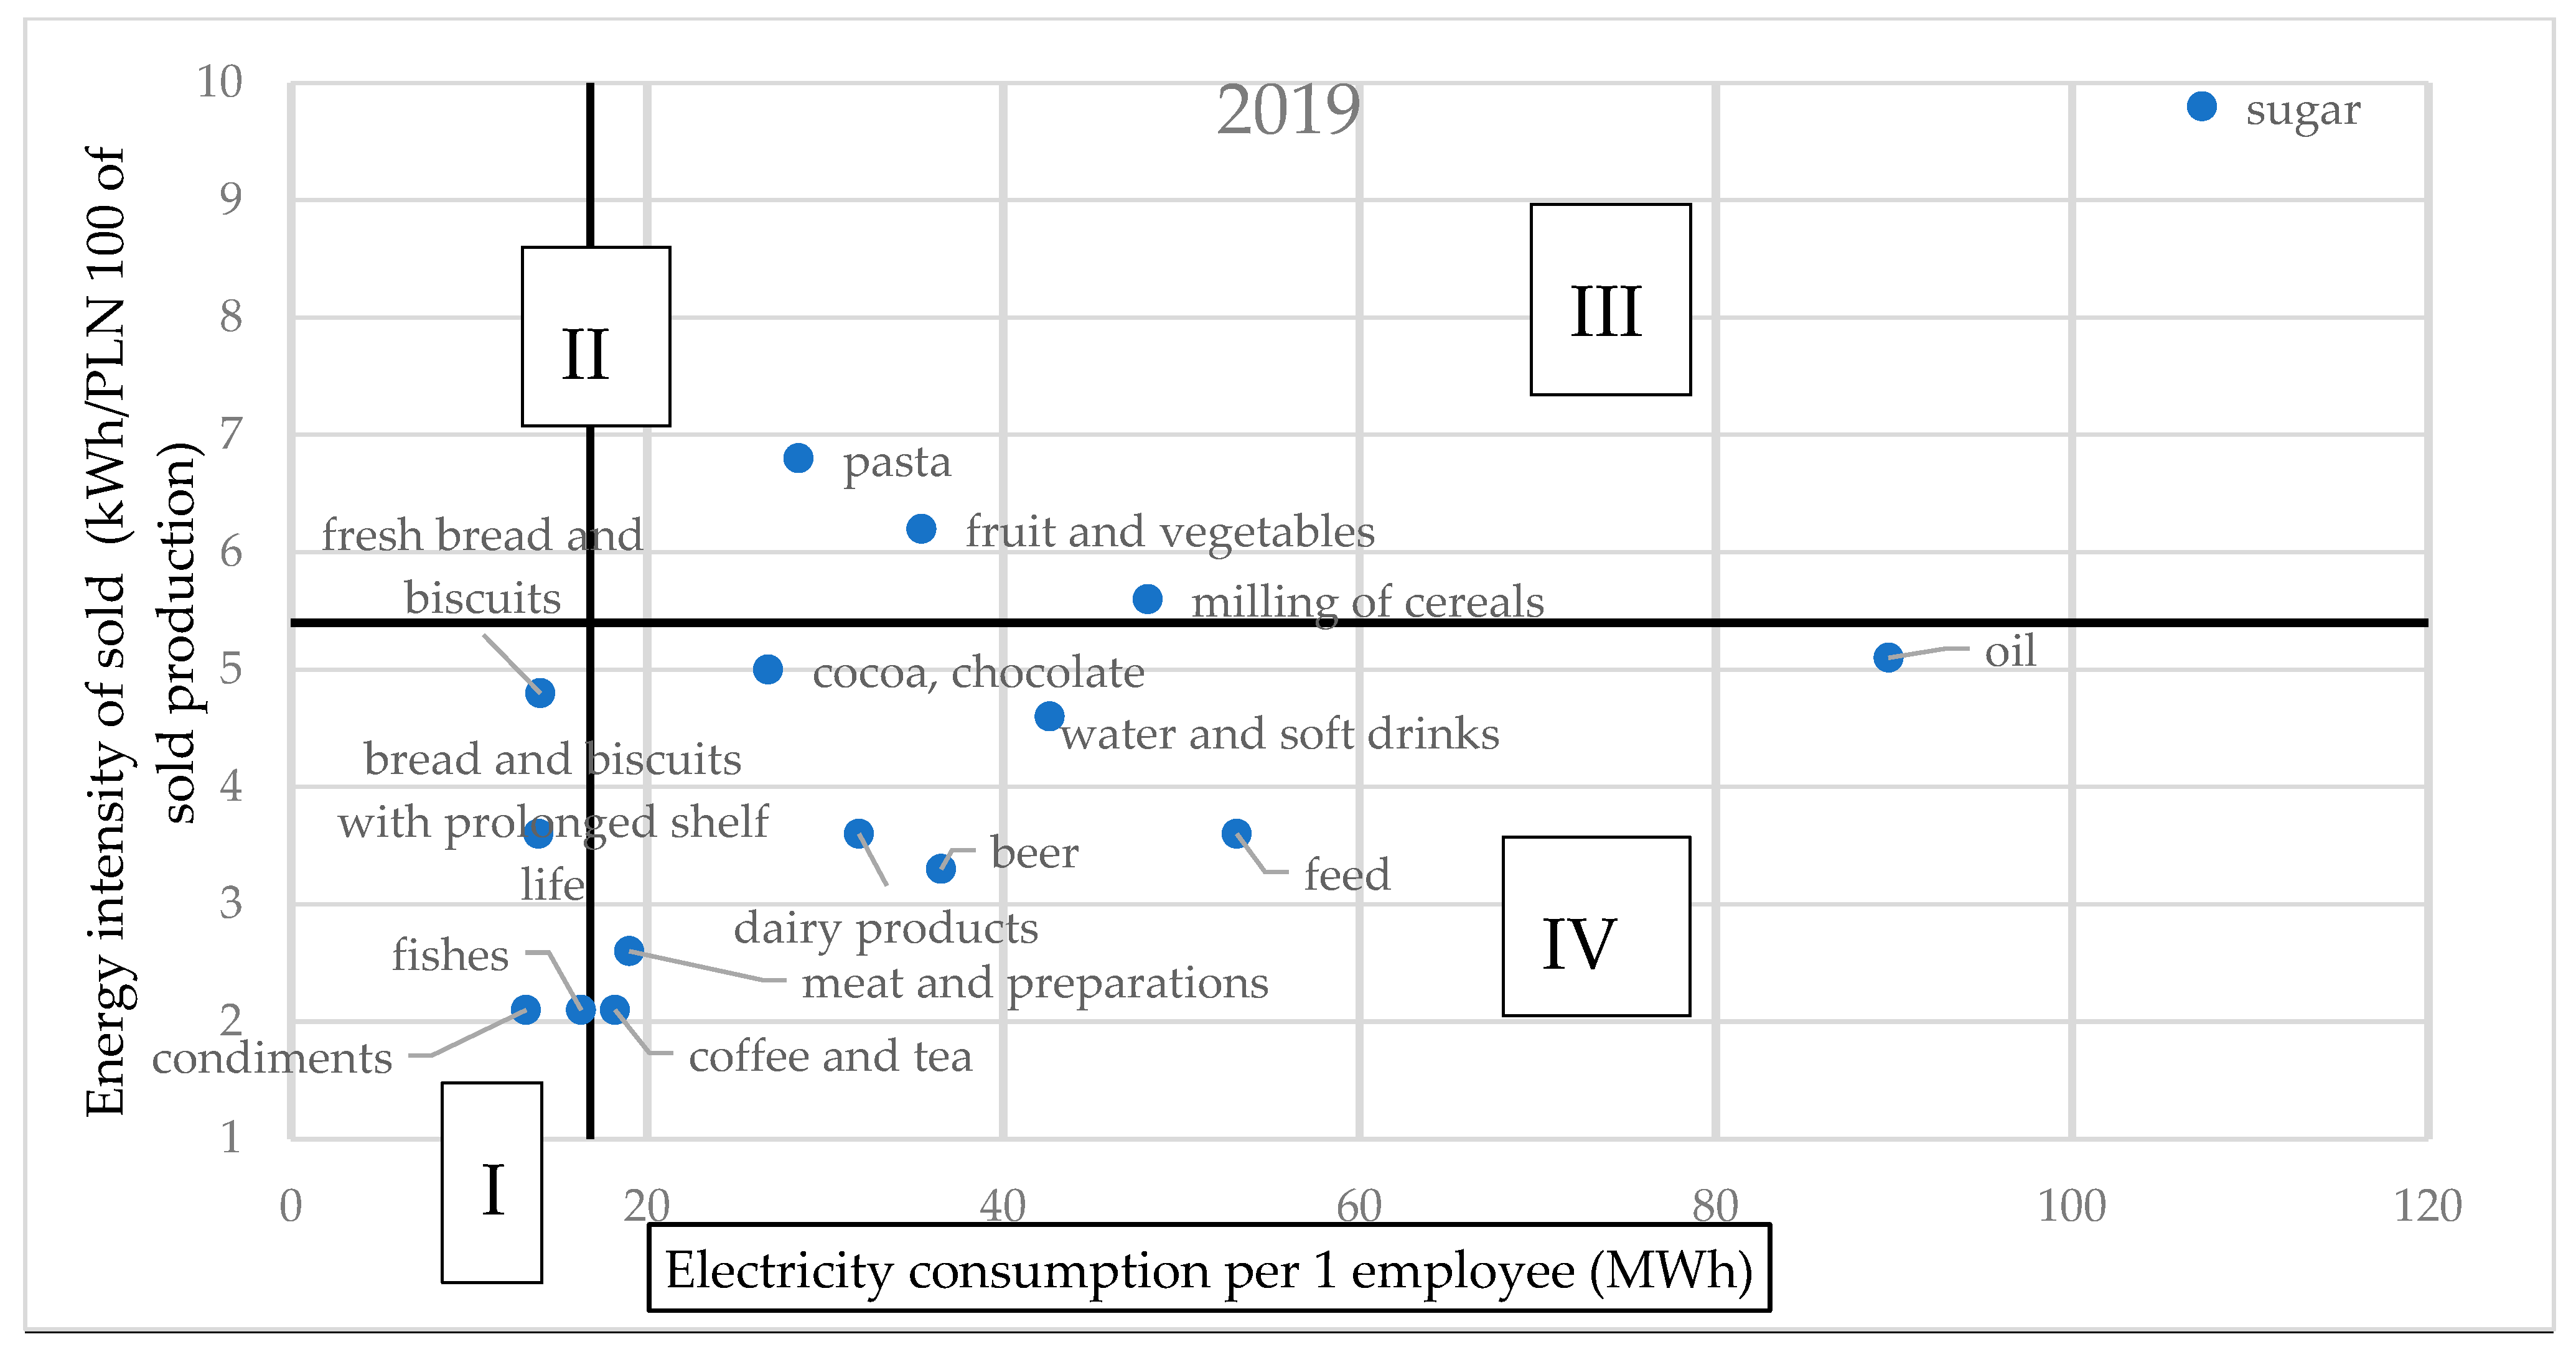
Changes in energy consumption in the analysed branches of the food industry are shown in Figure 3 and Figure 4. The analysis considers changes in the operating strategy distinguished on the basis of energy intensity of sold production and employment energy intensity. A matrix was built including four strategies:
- I—low energy consumption of production and employment,
- II—high energy consumption of production and low energy consumption of employment,
- III—high energy intensity of production and employment,
- IV—low energy consumption of production and high energy consumption of employment.
The boundary defining the areas of individual strategies was the intersection of the average production-energy consumption and the average energy consumption per employee in food enterprises in 2004 (with the coordinates of 16.8 and 5.4). The data show that in 2004, most industries were characterized by a low energy intensity of production and employment. Low energy intensity of production and high energy intensity of employment were introduced in the production of beer, oils, and fodder. In turn, the high energy intensity of production and low energy intensity of employment characterized the production of bread, cakes, and pasta. In turn, a high energy intensity of production and employment was characteristic of sugar production, grain milling, and fruit and vegetable processing.
In 2019, none of the industries followed the strategy of high energy intensity of production and low energy intensity of employment. On the other hand, the number of industries with high employment efficiency and low production efficiency increased. This is a favorable phenomenon because the reduction in energy consumption in production improves production efficiency, especially in the case of high (increasing) electricity prices.
The following enterprises remained in the area of the strategy with high energy intensity of production and employment: fruit and vegetable processing, grain milling, sugar, and the production of pasta joined them. Significantly, also in these activities, the energy intensity of production decreased. The highest energy intensity of production and employment is characteristic of the sugar industry, which results from the seasonality of barracks processing (a campaign lasting several months).
4.3. The Share of Energy in Production Costs in Selected Branches of the Food Industry
In 2004, the share of electricity in the costs of materials used for production in selected branches of the food industry ranged from 1.5% in the sugar industry to 4.3% in the fruit and vegetable industry. In 2019, this share remained at a similar level and increased sharply in the feed industry to 13.5% (Figure 5). The costs of electricity did not constitute the main item in the costs of purchase of production materials for food-industry companies, but the several-fold increase in electricity prices in the last year may have caused the share of energy in these costs to increase by several percentage points, depending on the industry, which, together with the increase in material prices, resulted in a significant increase in production costs and prompted producers to increase the prices of their products. This is visible, among others, in higher prices of bread, meat, dairy products, and vegetable oil.
A sharp increase in the prices of energy raw materials, i.e., coal, crude oil, and natural gas in 2022, caused by the war in Ukraine, had a significant impact on the increase in the price of electricity, which is necessary for production. In addition, fees for CO2 emissions have recently increased significantly. When the prices of conventional energy sources remain high, the share of energy from renewable sources will increase. In such a situation, the renewable energy market will gradually reduce costs and become more and more attractive [84]. According to International Renewable Energy, in 2020, compared to 2019, the costs of photothermal energy and land wind energy decreased by 16% and 13%, respectively, those of sea wind energy by 9%, and solar photovoltaic costs by 7%. The increase in energy consumption from renewable sources will reduce the use of crude oil and coal and will contribute to slowing down the growth in the prices of these raw materials [85].
Considering that the food industry is one of the most energy-intensive branches of the processing industry in Poland and also meets the basic human needs for food production, it should be at least partly treated as a sensitive sector. Particular protection should be extended to the meat, dairy, and bakery industries. The difficult situation especially concerns small, local companies dealing in the production of bread, for which high prices of gas and electricity put their future in question, the more so because they produce small quantities of bread using traditional recipes and often using “aged” machines and furnaces characterized by high energy consumption. The bakery industry brings together the largest number of companies among all food industry sectors, and moreover, micro and small enterprises dominate in its entity structure.
In order to mitigate the effects of the increase in prices of energy carriers, on 14 October 2022, the government adopted a project in which the electricity rate for small- and medium-sized enterprises will not be higher than PLN 785 per megawatt-hour (MWh). This rate is to apply from December 2022 to the end of 2023.
5. Discussion
Energy is one of the most important resources in the food industry. The availability of an uninterrupted supply of energy in the future is a cause for concern due to the depletion of fossil fuel resources, a growing world population, and armed conflicts [86].
The food industry is very diverse in terms of the variety of products it produces and includes different categories of production processes. It performs heterogeneous operations related to meat and fish processing, fruit and vegetable preservation, beverages, dairy, bakery, oil and fat processing, etc. [87]. Several studies have categorized the energy use in the food industry, but each is based on different concepts. For example, Seck et al. used 11 energy vectors [88], while Leduc et al. divided the processes into four main processes with some sub-processes [89]. These discrepancies show the difficulty of comparing energy efficiency results from different studies in the same sector. According to Charun, the most important indicator allowing us to determine the competitiveness and condition of the food sector is the energy intensity of sold production [90]. According to Szalbierz et al., the determination of the level and forecasting of energy-efficiency indicators for individual branches of the industry allows for obtaining the necessary information to determine the long-term strategy of the state energy policy [91].
The improvement of energy efficiency is related to, among others, the reduction in energy consumption during transformation, transmission, and its final use. Reduced energy consumption results in reduced operating costs and can lead to savings in production, provided that the energy savings exceed the additional costs associated with the implementation of energy-saving technologies [11]. The rational use of energy is closely related to the manifestation of eco-efficiency, consisting in improving environmental performance, i.e., energy conservation, reduction in natural resource consumption, reduction in pollutant emissions, and reduction in the amount of waste generated at each stage of raw material processing [92,93,94,95]. The growing need for pro-environmental activities forces the development of innovative solutions for energy efficiency. In order to reduce energy consumption, some energy-intensive food companies try to diversify their energy sources and invest in renewable energy sources (RES). Due to the war in Ukraine and problems with Europe’s dependence on supplies of Russian gas and coal, the transition to green energy will definitely accelerate [96].
Individual agri-food-processing industries are characterized by significantly different energy efficiency. This differentiation also applies to individual enterprises. In the product structure of the Polish agri-food industry, three leading segments emerge: meat, beverages, and dairy products. In 2019, they accounted for 52% of the total sold production of food processing [80]. The analyses of Wojdalski and Drożdż show that the greatest energy-efficiency diversification occurs in fruit, vegetable, and meat enterprises; for example, in fruit and vegetable plants, the use of 1 kWh is related to the processing of an amount of raw material that varies from 60 to 200 times depending on the source. The use of 1 GJ of thermal energy in the plants of this industry may be related to the processing of a mass of raw materials that differs even 100–200 times. In meat plants, the use of 1 kWh can be accompanied by a production that varies from 30 to 100 times. Similar ranges of differentiation in the effectiveness of using 1 GJ may occur in dairy plants. The results of the research on the production of bread show that, compared to other industries, energy efficiency in bakery-industry plants varies to a lesser extent and may differ at most by a dozen or so times. In general, energy efficiency depends mainly on a group of factors that make up the level of production mechanization and technical conditions, as well as on technological factors specific to individual types of production plants. Research in this area should include the impact of the use of polygeneration on the overall energy efficiency of production plants, as well as the reduction in carbon dioxide emissions [30].
The food industry is exploring different ways to improve its energy efficiency to reduce energy costs, carbon emissions, and environmental impact. Some of the options for reducing energy consumption are reducing energy-intensive activities without affecting the profitability of the producer or improving energy management and energy recovery [74].
The energy transformation aims to apply technological innovations that reduce energy consumption but also optimize operating costs. Modern technologies improve production and, at the same time, guarantee product safety, thus influencing consumers’ purchasing decisions. Implementing modern technologies to operate industrial plants is a factor in building a competitive market position in the face of energy transformation.
According to Chiaroni et al., energy-saving technologies and devices are not in demand in the industry due to limited short-term economic benefits and long payback times [97]. Against this backdrop, Backlund, Thollander, Palm, and Ottosson found that, rather than investing in costly energy performance technologies, it makes sense to finance low-cost smart metering and monitoring of energy supported by energy-efficient management practices [98]. In turn Tanaka suggested various actions that the industry can take to manage energy better. For example, companies may seek to maintain, refurbish, and reorganize equipment to minimize energy loss or upgrade, replace, and dispose of obsolete equipment, process lines with new technologies, and better insulation to reduce heat loss and energy wastage. Companies can also reuse wasted heat and energy; improve the energy, material, and process productivity-management process; or restructure processes by adopting new production concepts [99].
Energy efficiency is treated as a new emission-free fuel of the economy. It is indicated that in the coming months and years, energy efficiency will be a key factor affecting the ability to maintain profitability and further development of the industrial sector, and at the same time, it is recognized by the European Commission as a pillar of decarbonisation [100].
6. Conclusions
The food industry, including the production of foodstuffs and beverages, is one of the most energy-intensive processing sectors (next to the production of coke and crude oil refining semi-finished products, chemicals and chemical products, metals, and paper and paper products). This results, among others, from a large number of active enterprises in this sector, approximately 17.5 thousand entities (including micro-enterprises), and a large variety of industries.
In the years 2004–2019, the average electricity consumption in the food industry in Poland decreased by 31.5%, from 5.4 to 3.7 kWh per PLN 100 of sold production (at current prices). It was a common phenomenon and concerned the vast majority of industries. A greater increase in the value of sold production more than compensated for the higher energy consumption. This indicates an improvement in production efficiency and also contributes to greater environmental protection, which is required by the European Union in the “From Farm to Fork” strategy.
Simple comparative advantages in the form of lower production costs (lower prices of energy, gas, coal, raw material for processing, labor costs, etc.) on the part of the Polish food industry are disappearing. This situation encourages, or even forces, processing companies to look for savings, e.g., by installing more energy-efficient machines and devices and introducing innovative solutions. Sometimes the mere improvement of the organization of the production process in the enterprise can already bring measurable benefits, just like the circular economy.
The research results can be used by decision-makers in shaping Poland’s energy policy. Bearing in mind the high prices of energy raw materials and the related increase in electricity prices, it is possible to introduce appropriate programs to support solutions that reduce the energy intensity of production and employment in the food industry. This industry is one of the most energy-intensive branches of the processing industry, and at the same time, food is a first-need good. Support should be provided especially to the most sensitive sectors, i.e., the dairy-, meat-, and fruit-processing industries. Rising production costs result in an increase in selling prices and, subsequently, a rise in retail food prices.
In order to take appropriate actions to increase energy efficiency in the food industry, research on the energy consumption of production in individual enterprises and sectors is recommended. They will make it possible to make rational decisions in manufacturing processes and shaping energy policy.
Author Contributions
Conceptualization, E.J.S. and R.M.; methodology, E.J.S. and R.M.; validation, E.J.S. and R.M.; formal analysis, E.J.S. and R.M.; investigation, E.J.S. and R.M.; resources, E.J.S. and R.M.; data curation, R.M.; writing—original draft preparation, E.J.S. and R.M.; writing—review and editing, E.J.S. and R.M.; visualization, E.J.S. and R.M.; supervision, E.J.S.; project administration, E.J.S. and R.M.; funding acquisition, E.J.S. and R.M. All authors have read and agreed to the published version of the manuscript.
Funding
This research received no external funding.
Data Availability Statement
The data presented in this study are available on request from the corresponding author.
Conflicts of Interest
The authors declare no conflict of interest.
References
- FAO. The Future of Food and Agriculture—Trends and Challenges; Food and Agriculture Organization of the United Nations: Rome, Italy, 2017; Available online: http://www.fao.org/3/a-i6583e.pdf (accessed on 15 November 2020).
- Energy Information Administration (EIA). International Energy Outlook (2017). Available online: https://www.eia.gov/outlooks/archive/ieo17/pdf/exec_summ.pdf (accessed on 10 November 2020).
- FAO. Energy-Smart Food for People and Climate; Issue Paper; Food and Agriculture Organization of the United Nations: Rome, Italy, 2011; Available online: http://www.fao.org/docrep/014/i2454e/i2454e00.pdf (accessed on 16 December 2021).
- Sims, R.; Flammini, A.; Puri, M.; Bracco, S. Opportunities for Agri-Food Chains to Become Energy-Smart; FAO: Rome, Italy, 2015; Available online: http://www.fao.org/3/ai5125e.pdf (accessed on 15 November 2020).
- Food Drink Europe. A Time to Act—Climate Action and the Food and Drink Industry; Food Drink Europe: London, UK, 2015; Available online: http://www.fooddrinkeurope.eu/uploads/publications_documents/FoodDrink_Europe_Climate_Action_Brochure.pdf (accessed on 22 November 2010).
- Department for Business, Energy and Industrial Strategy. Digest of United Kingdom Energy Statistics (DUKES) July 2018; Department for Business, Energy and Industrial Strategy: London, UK, 2018. Available online: https://assets.publishing.service.gov.uk/government/uploads/system/uploads/attachment_data/file/736148/DUKES_2018.pdf (accessed on 15 December 2021).
- Department for Business, Energy and Industrial Strategy. Annual Prices of Fuels Purchased by Manufacturing Industry (p/kWh); Department for Business, Energy and Industrial Strategy: London, UK, 2018. Available online: https://assets.publishing.service.gov.uk/government/uploads/system/uploads/attachment_data/file/743784/table_314.xls (accessed on 15 May 2020).
- EEA. The European Environment—State and Outlook 2015: Synthesis Report; European Environment Agency: Copenhagen, Denmark, 2015; Available online: https://www.eea.europa.eu/soer/#pdf-choice-synthesis (accessed on 15 November 2020).
- Horton, J.; Palumbo, D.; Bowler, T. Russia Sanctions: Can the World Cope without Its Oil and Gas? BBC News. 26 January 2022. Available online: https://www.bbc.co.uk/news/58888451 (accessed on 2 May 2022).
- NIK. Efektywność Energetyczna Gospodarki; Najwyższa Izba Kontroli: Warsaw, Poland, 2019. Available online: https://www.nik.gov.pl/kontrole/P/18/021/ (accessed on 15 May 2020).
- Gembicki, J. Energy efficiency in the agricultural and food industry illustrated with the example of the feed production plant. E3S Web Conf. 2016, 10, 00138. [Google Scholar] [CrossRef]
- Laitner, J.A. An overview of the energy efficiency potential. Environ. Innov. Soc. Transit. 2013, 9, 38–42. [Google Scholar] [CrossRef]
- Dobes, V. New tool for promotion of energy management and cleaner production on no cure, no pay basis. J. Clean. Prod. 2013, 39, 255–264. [Google Scholar] [CrossRef]
- Pye, M.; McKane, A. Making a stronger case for industrial energy efficiency by quantifying non-energy benefits. Resour. Conserv. Recycl. 2000, 28, 171–183. [Google Scholar] [CrossRef]
- Bunse, K.; Vodicka, M.; Schoensleben, P.; Brülhart, M.; Ernst, F.O. Integrating energy efficiency performance in production management e gap analysis between industrial needs and scientific literature. J. Clean. Prod. 2011, 19, 667–679. [Google Scholar] [CrossRef]
- Semkov, K.; Mooney, E.; Connolly, M.; Adley, C. Efficiency improvement through waste heat reduction. Appl. Therm. Eng. 2014, 70, 716–722. [Google Scholar] [CrossRef]
- Energia Ze Źródeł Odnawialnych. Noty Tematyczne o Unii Europejskiej. Available online: https://www.europarl.europa.eu/factsheets/pl/sheet/70/energia-ze-zrodel-odnawialnych (accessed on 15 May 2020).
- Wszystko, Co Powinieneś Wiedzieć O Audycie Energetycznym W Firmie. Available online: https://energia.rp.pl/zielony-dom/art18969851-wszystko-co-powinienes-wiedziec-o-audycie-energetycznym-w-firmie (accessed on 20 November 2020).
- Zwiększanie Efektywności Energetycznej W Przemyśle. Available online: https://dalkiapolska.com/pl/zwiekszanie-efektywnosci-energetycznej-w-przemysle (accessed on 20 December 2021).
- Clairand, J.M.; Briceño-León, M.; Escrivá-Escrivá, G.; Pantaleo, A.M. Review of energy efficiency technologies in the food industry: Trends, barriers, and opportunities. IEEE Access 2020, 8, 48015–48029. [Google Scholar] [CrossRef]
- Degerli, B.; Nazir, S.; Sorgüven, E.; Hitzmann, B.; Özilgen, M. Assessment of the energy and exergy efficiencies of farm to fork grain cultivation and bread making processes in Turkey and Germany. Energy 2015, 93, 421–434. [Google Scholar] [CrossRef]
- Lin, B.; Xie, X. Factor substitution and rebound effect in China’s food industry. Energy Convers. Manag. 2015, 105, 20–29. [Google Scholar] [CrossRef]
- Özilgen, M. Energy utilization and carbon dioxide emission during production of snacks. J. Clean. Prod. 2016, 112, 2601–2612. [Google Scholar] [CrossRef]
- Wang, L. Energy efficiency technologies for sustainable food processing. Energy Effic. 2014, 7, 791–810. [Google Scholar] [CrossRef]
- GUS. Efektywność Wykorzystania Energii W Latach 2010–2020. Available online: https://stat.gov.pl/files/gfx/portalinformacyjny/pl/defaultaktualnosci/5485/9/5/1/efektywnosc_wykorzystania_energii_w_latach_2010-2020.pdf (accessed on 18 December 2022).
- Hendrickson, J. Energy Use in the U.S. Food System: A Summary of Existing Research and Analysis; Center for Integrated Agriculture Systems: Madison, WI, USA, 2008; Available online: https://www.cias.wisc.edu/wp-content/uploads/2008/07/energyuse.pdf (accessed on 18 December 2021).
- Carlsson-Kanyama, A.; Faist, M. Energy Use in the Food Sector: A Data Survey; Swedish Environmental Protection Agency: Stockholm, Sweden, 2000. Available online: http://citeseerx.ist.psu.edu/viewdoc/download?rep=rep1&type=pdf&doi=10.1.1.205.8375 (accessed on 18 December 2021).
- Foster, C.; Green, K.; Bleda, M.; Dewick, P.; Evans, B.; Flynn, A.; Mylan, J. Environmental Impacts of Food Production and Consumption: A Report to the Department for Environment Manchester; Food and Rural Affairs, Manchester Business School: Manchester, UK, 2006. Available online: http://randd.defra.gov.uk/Document.aspx?Document=EV02007_4601_FRP.pdf (accessed on 18 May 2021).
- Compton, M.; Willis, S.; Rezaie, B.; Humes, K. Food processing industry energy and water consumption in the Pacific northwest. Innov. Food Sci. Emerg. Technol. 2018, 47, 371–383. [Google Scholar] [CrossRef]
- Wojdalski, J.; Drożdż, B. Efektywność energetyczna zakładów przemysłu spożywczego. Zarys problematyki i podstawowe definicje. Inżynieria Przetwórstwa Spożywczego 2012, 3, 37–49. [Google Scholar]
- Leszczyńska, A.; Lee, K. Źródła i bariery efektywności energetycznej polskich przedsiębiorstw. Ann. Univ. Maria Curie-Skłodowska 2016, 3, 105–111. [Google Scholar]
- Dołęga, W. Efektywność energetyczna w aspekcie bezpieczeństwa dostaw energii i bezpieczeństwa ekologicznego. Rynek Energii 2014, 2, 24–28. [Google Scholar]
- Sardianou, E. Barriers to Industrial Energy Efficiency Investments in Greece. J. Clean. Prod. 2008, 16, 1416–1423. [Google Scholar] [CrossRef]
- Hertel, M.; Menra, K. Adoption of energy-efficient technologies in German SMEs of the horticultural sector—The moderating role of personal and social factors. Energy Effic. 2015, 9, 791–806. [Google Scholar] [CrossRef]
- Christoffersen, L.B.; Larsen, A.; Togeby, M. Empirical Analysis of Energy Management in Danish Industry. J. Clean. Prod. 2006, 14, 516–526. [Google Scholar] [CrossRef]
- Thollander, P.; Ottosson, M. An Energy Efficient Swedish Pulp and Paper Industry—Exploring Barriers to and Driving Forces for Cost-Effective Energy Efficiency Investments. Energy Effic. 2008, 1, 21–34. [Google Scholar] [CrossRef]
- Rohdin, P.; Thollander, P.; Solding, P. Barriers to and Drivers for Energy Efficiency in the Swedish Foundry Industry. Energy Policy 2007, 35, 672–677. [Google Scholar] [CrossRef]
- Stern, P.C.; Aronson, E. Energy Use: The Human Dimension; Stern, P.C., Aronson, E., Eds.; W.H. Freeman: New York, NY, USA, 1984. [Google Scholar]
- Stern, P.C. What Psychology Knows about Energy Conservation. Am. Psychol. 1992, 47, 1224–1232. [Google Scholar] [CrossRef]
- O’Driscoll, E.; Cusack, D.O.; O’Donnell, G.E. The development of energy performance indicators within a complex manufacturing facility. Int. J. Adv. Manuf. Technol. 2013, 68, 2205–2214. [Google Scholar] [CrossRef]
- Jeon, H.W.; Taisch, M.; Prabhu, V.V. Modelling and analysis of energy footprint of manufacturing systems. Int. J. Prod. Res. 2014, 53, 7049–7059. [Google Scholar] [CrossRef]
- Efektywność Energetyczna. Available online: https://pgeenergiaciepla.pl/strefa-klienta/efektywnosc-energetyczna (accessed on 10 September 2022).
- Wojdalski, J.; Grochowicz, J.; Drózdz, B.; Bartoszewska, K.; Zdanowska, P.; Kupczyk, A.; Ekielski, A.; Florczak, I.; Hasny, A.; Wójcik, G. Energy efficiency of a confectionery plant—Casestudy. J. Food Eng. 2015, 146, 182–191. [Google Scholar] [CrossRef]
- Martínez, C.I.P. Analysis of energy efficiency development in the German and Colombian foodindustries. Int. J. Energy Sect. Manag. 2010, 4, 113–136. [Google Scholar] [CrossRef]
- May, G.; Taisch, M.; Prabhu, V.; Barletta, I. Energy related key performance indicators—State-of-the-art, gaps and industrial needs. Advances in production management systems. Sustainable production and service supply chains. Adv. Inf. Commun. Technol. 2013, 414, 257–267. [Google Scholar]
- Eichhammer, W.; Mannsbart, W. Industrial Energy Efficiency—Indicators for a European cross-country comparison of energy efficiency in the manufacturing industry. Energy Policy 1997, 25, 759–772. [Google Scholar] [CrossRef]
- Reindl, D.T.; Jekel, T.B.; Elleson, J.S. Industrial Refrigeration Energy Efficiency Guidebook; The University Wisconsin IRC, Industrial Refrigeration Consortium: Madison, WI, USA, 2005. [Google Scholar]
- Fysikopoulos, A.; Pastras, G.; Alexopoulos, T.; Chryssolouris, G. On a generalized approach to manufacturing energy efficiency. Int. J. Adv. Manuf. Technol. 2014, 73, 1437–1452. [Google Scholar] [CrossRef]
- Tristo, G.; Bissacco, G.; Lebar, A.; Valentinčič, J. Real time power consumption monitoring for energy efficiency analysis in micro EDM milling. Int. J. Adv. Manuf. Technol. 2015, 78, 1511–1521. [Google Scholar] [CrossRef]
- Sivill, L.; Manninen, J.; Hippinen, I.; Ahtila, P. Success factors of energy management in energy-intensive industries: Development priority of energy performance measurement. Energy Res. 2013, 37, 936–951. [Google Scholar] [CrossRef]
- Aguirre, F.; Villalobos, J.R.; Phelan, P.E.; Pacheco, R. Assessing the relative efficiency of energy use among similar manufacturing industries. Int. J. Energy Res. 2011, 35, 477–488. [Google Scholar] [CrossRef]
- Mukherjee, K. Energy use efficiency in the Indian manufacturing sector: An interstate analysis. Energy Policy 2008, 36, 662–672. [Google Scholar] [CrossRef]
- Hu, J.L.; Lio, M.C.; Kao, C.H.; Lin, Y.L. Total-factor Energy Efficiency for Regions in Taiwan. Energy Sources Part B Econ. Plan. Policy 2012, 7, 292–300. [Google Scholar] [CrossRef]
- Wang, Z.-H.; Zeng, H.-L.; Wei, Y.-M.; Zhang, Y.-X. Regional total factor energy efficiency: An empirical analysis of industrial sector in China. Appl. Energy 2012, 97, 115–123. [Google Scholar] [CrossRef]
- Özkara, Y.; Atak, M. Regional total-factor energy efficiency and electricity saving potential of manufacturing industry in Turkey. Energy 2015, 93, 495–510. [Google Scholar] [CrossRef]
- Honma, S.; Hu, J.L. Total-factor energy efficiency for sectors in Japan. Energy Sources Part B Econ. Plan. Policy 2013, 8, 130–136. [Google Scholar] [CrossRef]
- Martínez, C.P. Energy efficiency development in German and Colombian non-energy-intensive sectors: A non-parametric analysis. Energy Effic. 2011, 4, 115–131. [Google Scholar] [CrossRef]
- Pradella, A.M.; Rocha de, L.E.F.; Gouvea da, C.S.E.; Pinheiro de, L.E. Energy efficiency in the food industry: A systematic literature review. Braz. Arch. Biol. Technol. 2019, 62, 1–15. [Google Scholar] [CrossRef]
- Marszałek, M. Normatywne uwarunkowania procesu wdrażania transformacji energetycznej w Polsce na podstawie polityk energetycznych UE i Polski oraz wobec zagrożeń i wyzwań unijnego wewnętrznego rynku. Polityka Społeczeństwo 2018, 16, 64–76. [Google Scholar] [CrossRef]
- European Council (8/9 March 2007) Presidency Conclusions 7224/1/07 REV 1 (2 May 2007). Available online: https://www.consilium.europa.eu/uedocs/cms_data/docs/pressdata/en/ec/93135.pdf (accessed on 20 December 2022).
- European Council (23 and 24 October 2014)—Conclusions. Available online: https://data.consilium.europa.eu/doc/document/ST-169-2014-INIT/en/pdf (accessed on 20 October 2022).
- Communication from the Commission to the European Parliament, The Council, the European Economic and Social Committee and the Committee of the Regions United in delivering the Energy Union and Climate Action—Setting the Foundations for a Successful Clean Energy Transition COM/2019/285. Available online: https://eur-lex.europa.eu/legal-content/EN/TXT/?uri=CELEX%3A52019DC0285 (accessed on 20 November 2022).
- European Commission. Proposal for a Directive of the European Parliament and of the Council on Energy Efficiency. COM/2021/558. 2021. Available online: https://eur-lex.europa.eu/resource.html?uri=cellar:a214c850-e574-11eb-a1a5-01aa75ed71a1.0001.02/DOC_1&format=PDF (accessed on 15 September 2021).
- Ministerstwo Gospodarki. Polityka Energetyczna Polski do 2030 Roku. Załącznik do Uchwały nr 202/2009 Rady Ministrów z Dnia 10 Listopada 2009 r. Available online: https://www.pigeor.pl/media/js/kcfinder/upload/files/Polityka-energetyczna-Polski-do-2030r.pdf (accessed on 15 September 2021).
- Ministerstwo Klimatu i Środowiska. Polityka Energetyczna Polski do 2040 Roku. Załącznik do Uchwały nr 22/2021 Rady Ministrów z Dnia 2 Lutego 2021 r. Available online: File:///C:/Users/Ela/Downloads/PEP2040_2021-02-02.pdf (accessed on 15 September 2021).
- Ministerstwo Klimatu i Środowiska. Krajowy Plan Na Rzecz Energii i Klimatu Na Lata 2021–2030. Available online: https://www.gov.pl/web/klimat/krajowy-plan-na-rzecz-energii-i-klimatu (accessed on 15 September 2022).
- Długoterminowa Strategia Renowacji Budynków. Załącznik do Uchwały nr 23/2022 Rady Ministrów z Dnia 9 Lutego 2022 r. Available online: https://www.gov.pl/web/rozwoj-technologia/Dlugoterminowa-strategia-renowacji-budynkow (accessed on 15 December 2022).
- The National Energy and Climate Plan for 2021–2030 Objectives and Targets, and Policies and Measures. Available online: https://energy.ec.europa.eu/system/files/2020-08/pl_final_necp_part_1_3_en_0.pdf (accessed on 25 December 2022).
- Polska Net-Zero 2050: Podręcznik Transformacji Energetycznej dla Samorządów. Available online: http://climatecake.ios.edu.pl/wp-content/uploads/2022/01/Polska-net-zero.-Podrecznik-transformacji-energetycznej-dla-samorzadow..pdf (accessed on 15 September 2020).
- Ustawa z Dnia 20 Maja 2016 r. o Efektywności Energetycznej. Dz.U. 2016 poz. 831. Available online: https://isap.sejm.gov.pl/isap.nsf/download.xsp/WDU20160000831/T/D20160831L.pdf (accessed on 15 December 2022).
- Biogaz w Polsce—Raport 2022. Available online: www.magazynbiomasa.pl (accessed on 10 September 2022).
- CIRE.PL Centrum Informacji o Rynku Energii. Transformacja Energetyczna, a Produkcja Żywności. Available online: https://www.cire.pl/artykuly/materialy-problemowe/transformacja-energetyczna-a-produkcja-zywnosci (accessed on 10 September 2022).
- Featherstone, S. Canning with Pulses and Pasta. In A Complete Course in Canning and Related Processes; Elsevier: Amsterdam, The Netherlands, 2016; pp. 169–197. [Google Scholar]
- Woolley, E.; Luo, Y.; Simeone, A. Industrial Waste Heat Recovery: A Systematic Approach. Sustain. Energy Technol. Assess. 2018, 29, 50–59. [Google Scholar] [CrossRef]
- Luo, Y.; Jagtap, S.; Trollman, H.; Garcia-Garcia, G. A Framework for Recovering Waste Heat Energy from Food Processing Effluent. Water 2023, 15, 12. [Google Scholar] [CrossRef]
- Gierszewska, G.; Romanowska, M. Analiza Strategiczna Przedsiębiorstw; PWE: Warsaw, Poland, 2003. [Google Scholar]
- GUS. Roczniki Statystyczne Przemysłu; GUS: Warsaw, Poland, 2006. [Google Scholar]
- GUS. Roczniki Statystyczne Przemysłu; GUS: Warsaw, Poland, 2021. [Google Scholar]
- GUS. Roczniki Statystyczne Przemysłu; GUS: Warsaw, Poland, 2005. [Google Scholar]
- GUS. Rocznik Statystyczny Przemysłu; GUS: Warsaw, Poland, 2020. [Google Scholar]
- Szajner, P.; Szczepaniak, I. Challenges of energy management in the food industry in Poland in the context of the objectives of the European Green Deal and the „Farm to Fork” strategy. Energies 2022, 15, 9090. [Google Scholar]
- GUS. Rocznik Statystyczny Przemysłu; GUS: Warsaw, Poland, 2010. [Google Scholar]
- GUS. Rocznik Statystyczny Przemysłu; GUS: Warsaw, Poland, 2015. [Google Scholar]
- Su, C.-W.; Yuan, X.; Tao, R.; Umar, M. Can new energy vehicles help to achieve carbon neutrality targets? J. Environ. Manag. 2021, 297, 113348. [Google Scholar] [CrossRef]
- Su, C.-W.; Yuan, X.; Umar, M.; Chang, T. Dynamic price linkage of energies in transformation: Evidence from quantile connectedness. Resour. Policy 2022, 78, 102886. [Google Scholar] [CrossRef]
- Jagtap, S.; Rahimifard, S.; Duong, L.N.K. Real-time data collection to improve energy efficiency: A case study of food manufacturer. J. Food Process. Preserv. 2022, 46, e14338. [Google Scholar] [CrossRef] [Green Version]
- Malagié, M.; Jensen, G.; Graham, J.C.; Smith, D.L. Encyclopaedia of Occupational Health and Safety; [CD-ROM]; International Labour Organization: Geneva, Switzerland, 1998; Available online: http://www.ilocis.org/documents/chpt67e.htm (accessed on 18 May 2021).
- Seck, G.S.; Guerassimoff, G.; Maizi, N. Heat recovery with heat pumps in non-energy intensive industry: A detailed bottom-up model analysis in the French food & drink industry. Appl. Energy 2013, 111, 489–504. [Google Scholar]
- Leduc, G.; Kamiński, J. Energy efficiency improvement options for the EU food industry. Energy Policy J. 2010, 13, 81–96. [Google Scholar]
- Charun, H. Podstawy Gospodarki Energetycznej. Cz. 1. Wybrane Zagadnienia Dydaktyczne; Wydawnictwo Uczelniane Politechniki Koszalińskiej: Koszalin, Poland, 2011. [Google Scholar]
- Szalbierz, Z.; Kott, M.; Kott, J. Wskaźniki energochłonności w przemyśle. Zarządzanie Finans. 2012, 1, 585–593. [Google Scholar]
- Pagan, R.; Renouf, M.; Prasad, P. Eco-Efficiency Manual for Meat Processing; Meat and Livestock Australia, Ltd.: Sydney, Australia, 2002. [Google Scholar]
- Pelletier, N. Environmental performance in the US broiler poultry sector: Life cycle energy use and greenhouse gas, ozone depleting, acidifying and eutrophying emissions. Agric. Syst. 2008, 98, 67–73. [Google Scholar] [CrossRef]
- Salminen, E.; Rintala, J. Anaerobic digestion of organic solid poultry slaughterhouse waste—A review. Bioresour. Technol. 2002, 83, 13–26. [Google Scholar] [CrossRef]
- Truchliński, J.; Podgórski, W.; Koper, R.; Lebiedowicz, W. Bioenergetyczne aspekty produkcji brojlerów kurzych. MOTROL—Motoryz. Energetyka Rol. 2001, 4, 333–340. [Google Scholar]
- Firmy z Branży Spożywczej Przyspieszą Transformację Energetyczną. Available online: https://biznes.newseria.pl/biuro-prasowe/przemysl_spozywczy/firmy-z-branzy,b792052749 (accessed on 10 December 2021).
- Chiaroni, D.; Chiesa, M.; Chiesa, V.; Franzo, S.; Frattini, F.; Toletti, G. Introducing a new pespective for the economic evaluation of industrial energy efficiency technologies: An empirical analysis in Italy. Sustain. Energy Technol. Assess. 2016, 15, 1–10. [Google Scholar] [CrossRef]
- Backlund, S.; Thollander, P.; Palm, J.; Ottosson, M. Extending the energy efficiency gap. Energy Policy 2012, 51, 392–396. [Google Scholar] [CrossRef]
- Tanaka, K. Review of policies and measures for energy efficiency in industry sector. Energy Policy 2011, 39, 6532–6550. [Google Scholar] [CrossRef]
- Transformacja Energetyczna—Zysk Czy Koszt Dla Przemysłu Spożywczego? Available online: https://www.portalspozywczy.pl/technologie/artykuly/transformacja-energetyczna-zysk-czy-koszt-dla-przemyslu-spozywczego,215489.html (accessed on 20 December 2022).
Scheme 1.
Map of strategic groups for food-industry sectors.

Figure 1.
Electricity consumption in selected branches of the food industry in kWh per PLN 100 of sold production (in constant prices). Source: own elaboration based on [77,80,82,83].

Figure 2.
Electricity consumption in selected branches of the food industry in MWh per employee. Source: own elaboration based on [77,80,82,83].

Figure 3.
Distribution of selected food-industry production activities according to electricity consumption per PLN 100 of sold production and per employee in 2004. Source: own elaboration.
Figure 3.
Distribution of selected food-industry production activities according to electricity consumption per PLN 100 of sold production and per employee in 2004. Source: own elaboration.

Figure 4.
Distribution of selected food-industry production activities according to electricity consumption per PLN 100 of sold production and per employee in 2019. Source: own elaboration.
Figure 4.
Distribution of selected food-industry production activities according to electricity consumption per PLN 100 of sold production and per employee in 2019. Source: own elaboration.

Figure 5.
The share of electricity in the consumption of materials for production in selected branches of the food industry. Source: own elaboration based on unpublished GUS data, from F-01 financial statements submitted by food-industry companies.
Figure 5.
The share of electricity in the consumption of materials for production in selected branches of the food industry. Source: own elaboration based on unpublished GUS data, from F-01 financial statements submitted by food-industry companies.


Table 1.
Direct energy consumption of industrial processing by section and division.
| Specification | 2004 | 2010 | 2019 | |||
|---|---|---|---|---|---|---|
| in TJ | hare (%) | in TJ | share (%) | in TJ | share (%) | |
| Industrial processing | 940,154 | 100.0 | 897,955 | 100.0 | 1,023,241 | 100.0 |
| including production: | ||||||
| 91,327 | 9.7 | 71,478 | 8.0 | 88,839 | 8.7 |
| 9048 | 1.0 | 9676 | 0.9 | ||
| 1043 | 0.1 | 1418 | 0.2 | 1692 | 0.2 |
| 10,207 | 1.1 | 3757 | 0.4 | 3857 | 0.4 |
| 1889 | 0.2 | 1683 | 0.2 | 1036 | 0.1 |
| 1218 | 0.1 | 790 | 0.1 | 613 | 0.1 |
| 30,645 | 3.3 | 33,098 | 3.7 | 48,490 | 4.7 |
| 50,491 | 5.4 | 52,040 | 5.8 | 82,422 | 8.1 |
| 190,757 | 20.3 | 244,024 | 27.2 | 252,083 | 24.6 |
| 199,637 | 21.2 | 179,635 | 20.0 | 195,911 | 19.1 |
| . | . | 3184 | 0.4 | 2886 | 0.3 |
| 14,843 | 1.6 | 16,871 | 1.9 | 26,534 | 2.6 |
| 161,644 | 17.2 | 97,900 | 10.9 | 96,525 | 9.4 |
| 12,512 | 1.3 | 13,565 | 1.5 | 16,524 | 1.6 |
| 3819 | 0.4 | 2361 | 0.3 | 1720 | 0.2 |
| 9905 | 1.1 | 6757 | 0.8 | 7480 | 0.7 |
| 14,601 | 1.6 | 9918 | 1.1 | 8466 | 0.8 |
| 9411 | 1.0 | 12,573 | 1.4 | 15,445 | 1.5 |
| 9753 | 1.0 | 6086 | 0.7 | 10,723 | 1.0 |
| 126,452 | 13.5 | 131,769 | 14.7 | 152,319 | 14.9 |
Table 2.
Consumption of certain fuels and electricity in industry by selected sections in 2004.
| Specification | Hard Coal | High-Methane Natural Gas | Nitrogenated Natural Gas | Coke and Semi-Coke | Electrical Energy | |||||
|---|---|---|---|---|---|---|---|---|---|---|
| Total | Including Direct | Total | Including Direct | Total | Including Direct | Total | Including Direct | Total | Including Direct | |
| in thousand tons | in hm3 | in hm3 | in thousand tons | in GWh | ||||||
| Total | 72,822 | 7369 | 7203 | 5306 | 2567 | 552 | 4463 | 1393 | 74,130 | 71,863 |
| including: | ||||||||||
| Industrial processing | 21,218 | 6337 | 5716 | 5069 | 379 | 376 | 4434 | 1384 | 42,606 | 42,606 |
| including production: | ||||||||||
| 1699 | 1554 | 407 | 404 | 54 | 53 | 43 | 43 | 4248 | 4248 |
| 1 | 1 | 4 | 4 | 2 | 2 | - | - | 84 | 84 |
| 11 | 10 | 11 | 11 | 3 | 2 | 1 | 1 | 147 | 147 |
| 278 | 268 | 75 | 75 | 9 | 9 | 0 | 0 | 1609 | 1609 |
| 738 | 594 | 36 | 36 | 26 | 26 | 0 | 0 | 2938 | 2938 |
| 11,293 | 148 | 655 | 44 | 0 | 0 | 62 | 2 | 2693 | 2693 |
| 1758 | 1237 | 2444 | 2441 | 6 | 6 | 132 | 132 | 7446 | 7446 |
| 200 | 107 | 63 | 59 | 6 | 6 | 1 | 1 | 1591 | 1591 |
| 3199 | 500 | 638 | 628 | 131 | 130 | 4000 | 1010 | 10,952 | 10,952 |
| - | - | 0 | 0 | - | - | - | - | 2 | 2 |
| 18 | 16 | 55 | 54 | 4 | 4 | 1 | 1 | 761 | 761 |
| 36 | 20 | 64 | 61 | 5 | 5 | 2 | 2 | 1121 | 1121 |
| 86 | 67 | 9 | 9 | 0 | 0 | 0 | 0 | 699 | 699 |
Source: [77].
Table 3.
Consumption of certain fuels and electricity in industry by selected sections in 2019.
| Specification | Hard Coal | High-Methane Natural Gas | Nitrogenated Natural Gas | Coke and Semi-Coke | Electrical Energy | |||||
|---|---|---|---|---|---|---|---|---|---|---|
| Total | Including Direct | Total | Including Direct | Total | Including Direct | Total | Including Direct | Total | Including Direct | |
| in thousand tons | in hm3 | in hm3 | in thousand ions | in GWh | ||||||
| Total | 58,250 | 4862 | 11,061 | 7666 | 3365 | 877 | 2650 | 457 | 86,173 | 85,140 |
| including | ||||||||||
| Industrial processing | 18,275 | 4690 | 9268 | 7393 | 492 | 459 | 2 643 | 450 | 56,196 | 56,196 |
| including production: | ||||||||||
| 1027 | 938 | 844 | 830 | 51 | 50 | 26 | 26 | 6632 | 6632 |
| 59 | 59 | 91 | 86 | 2 | 2 | 0 | 0 | 659 | 659 |
| 2 | 2 | 14 | 14 | 5 | 5 | - | - | 248 | 248 |
| 2 | 2 | 11 | 11 | 0 | 0 | - | - | 95 | 95 |
| 64 | 60 | 35 | 35 | 19 | 19 | - | - | 2594 | 2594 |
| 576 | 335 | 216 | 205 | 125 | 94 | - | - | 4711 | 4711 |
| 11,246 | 29 | 3004 | 1174 | - | - | 76 | - | 3823 | 3823 |
| 27,744 | 2067 | 2462 | 2455 | 96 | 96 | 81 | 81 | 7825 | 7825 |
| 163 | 75 | 149 | 148 | 4 | 4 | - | - | 4157 | 4157 |
| 1458 | 195 | 707 | 702 | 121 | 121 | 2385 | 269 | 8768 | 8768 |
| 1 | 1 | 10 | 10 | 0 | 0 | - | 311 | 311 | |
| 22 | 19 | 44 | 44 | 5 | 5 | 2 | 2 | 1225 | 1225 |
| 17 | 16 | 92 | 92 | 9 | 9 | - | - | 2600 | 2600 |
| 4 | 3 | 15 | 15 | 1 | 1 | - | - | 1110 | 1110 |
Source: [78].
Table 4.
Position of the food industry in terms of fuel and electricity consumption in 2004 and 2019.
Table 4.
Position of the food industry in terms of fuel and electricity consumption in 2004 and 2019.
| Fuels and Electricity | Rank in 2004 | Fuels and Electricity | Rank in 2019 |
|---|---|---|---|
| hard coal | 1 | hard coal | 2 |
| high-methane natural gas | 3 | high-methane natural gas | 3 |
| nitrogen-rich natural gas | 2 | nitrogen-rich natural gas | 4 |
| coke and semi-coke | 3 | coke and semi-coke | 4 |
| electricity | 3 | electricity | 3 |
Table 5.
Sold production of the food industry a and energy intensity of production b (in medium and large companies).
Table 5.
Sold production of the food industry a and energy intensity of production b (in medium and large companies).
| Specification | 2004 | 2019 | Change (%) 2019 2004 | 2004 | 2019 | 2004 | 2019 | Change (%) 2019 2004 |
|---|---|---|---|---|---|---|---|---|
| Value of Sold Production (PLN million) | Energy Intensity of Sold Production (kWh/PLN 100 of sold production) | Total Energy Intensity of Marketed Production (MWh) | ||||||
| Food and beverage production, including: | 87,481.7 | 217,635.4 | 148.8 | 5.4 | 3.7 | 4,724,011.8 | 8,052,509.8 | 70.5 |
| food | 76,044.8 | 197,428.5 | 159.6 | 5.6 | 3.7 | 4,258,508.8 | 7,354,975.2 | 71.5 |
| drinks | 11,436.9 | 20,206.9 | 76.7 | 4.2 | 3.4 | 480,349.8 | 697,534.6 | 43.0 |
| Selected activities, including: | ||||||||
| production, processing, and preservation of meat and meat products | 20,870.0 | 66,681.1 | 219.5 | 4.7 | 2.6 | 980,890.0 | 1,733,708.6 | 76.7 |
| fish processing and preservation | 2342.7 | 12,027.2 | 413.4 | 3.4 | 2.1 | 79,651.8 | 252,571.2 | 217.1 |
| processing of fruit and vegetables, including: | 8635.3 | 16,434,3 | 90.3 | 9.0 | 6.2 | 777,177.0 | 1,018,926.6 | 31.1 |
| 1322.5 | 2714.0 | 105.2 | 7.5 | 5.3 | 99,187.5 | 143,842.0 | 45.0 |
| 2284.0 | 5096.1 | 123.1 | 4.8 | 4.3 | 109,632.0 | 219,132.3 | 99.9 |
| 5028.8 | 8624.2 | 71.5 | 11.4 | 7.6 | 573,283.2 | 655,439.2 | 14.3 |
| production of oils and fats of vegetable and animal origin | 2302.6 | 3744.9 | 62.6 | 4.3 | 5.1 | 99,011.8 | 190,989.9 | 92.9 |
| manufacture of dairy products, including: | 14,871.0 | 31,910.3 | 114.6 | 4.8 | 3.6 | 713,808.0 | 1,148,770.8 | 60.9 |
| 14,377.7 | 30,094.0 | 109.3 | 4.5 | 3.3 | 646,996.5 | 993,102.0 | 53.5 |
| 493.3 | 1816.3 | 268.2 | 12.7 | 8.3 | 62,649.1 | 150,752.9 | 140.6 |
| manufacture of cereal milling products, starch, and starch products | 2675.8 | 6060.4 | 126.5 | 9.4 | 5.6 | 251,525.2 | 339,382.4 | 34.9 |
| production of ready-made animal feed | 6248.8 | 14,317.1 | 129.1 | 4.0 | 3.6 | 249,952.0 | 515,415.6 | 106.2 |
| production of bread and fresh pastry products | 2339.5 | 10,664.4 | 355.8 | 5.9 | 4.8 | 138,030.5 | 511,891.2 | 270.9 |
| production of bread and pastry products with prolonged durability | 1329.7 | 2547.3 | 91.6 | 4.3 | 3.6 | 57,177.1 | 91,702.8 | 60.4 |
| sugar production | 4232.4 | 4027.5 | −4.8 | 11.7 | 9.8 | 495,190.8 | 394,695.0 | −20.3 |
| production of cocoa, chocolate, and confectionery | 4833.2 | 10,966.1 | 126.9 | 3.9 | 5.0 | 188,494.8 | 548,305.0 | 190.9 |
| pasta production | 429.4 | 850.7 | 198.1 | 7.3 | 6.8 | 31,346.2 | 57,847.6 | 84.5 |
| coffee and tea processing | 1405.7 | 3292.7 | 134.2 | 2.5 | 2.1 | 35,142.5 | 69,146.7 | 96.8 |
| production of spices | 786.1 | 5546.2 | 605.5 | 2.6 | 2.1 | 20,438.6 | 116,470.2 | 469.9 |
| production of beverages, including: | ||||||||
| 1480.4 | 3 710.4 | 150.6 | 1.8 | 1.6 | 26,647.2 | 59,366.4 | 122.8 |
| 240.5 | . | 4.3 | . | 10,341.5 | . | . | |
| 5778.1 | 7898.0 | 36.7 | 4.2 | 3.3 | 242,680.2 | 260,634.0 | 7.4 |
| 3036.1 | 7731.4 | 154.6 | 5.8 | 4.6 | 176,093.8 | 355,644.4 | 102.0 |
Table 6.
Employment in the food industry a and electricity consumption per employee (in medium and large companies).
Table 6.
Employment in the food industry a and electricity consumption per employee (in medium and large companies).
| Specification | 2004 | 2019 | Change (%) 2019 2004 | 2004 | 2019 | 2004 | 2019 | Change (%) 2019 2004 |
|---|---|---|---|---|---|---|---|---|
| Average Paid Employment (tys.) | Electricity Consumption per Employee (MWh) | Total Energy Consumption (MWh) | ||||||
| Food and beverage production, including: | 289.2 | 321.9 | 11.3 | 16.8 | 26.6 | 4,858,560.0 | 8,562,540.0 | 76.2 |
| food | 262.9 | 302.6 | 15.1 | 16.6 | 26.2 | 4,356,230.0 | 7,917,920.0 | 81.8 |
| drinks | 26.3 | 19.3 | −26.6 | 19.1 | 33.4 | 502,330.0 | 644,620.0 | 28.3 |
| Selected activities, including: | ||||||||
| production, processing, and preservation of meat and meat products | 86.4 | 95.3 | 10.3 | 11.7 | 19.0 | 1,010,880.0 | 1,810,700.0 | 79.1 |
| fish processing and preservation | 9.5 | 15.9 | 67.4 | 7.9 | 16.3 | 75,050.0 | 259,170.0 | 245.3 |
| processing of fruit and vegetables, including: | 33.4 | 28.7 | −14.1 | 22.6 | 35.4 | 754,840.0 | 1,015,980.0 | 34.6 |
| 4.9 | 3.7 | −24.5 | 20.5 | 38.0 | 100,450.0 | 140,600.0 | 40.0 |
| 5.3 | 6.5 | 22.6 | 19.2 | 34.7 | 101,760.0 | 225,550.0 | 121.6 |
| 23.2 | 18.5 | −20.3 | 24.0 | 35.2 | 556,800.0 | 651,200.0 | 17.0 |
| production of oils and fats of vegetable and animal origin | 2.6 | 2.2 | −15.4 | 38.0 | 89.7 | 98,800.0 | 197,340.0 | 99.7 |
| manufacture of dairy products, including: | 42.1 | 36.1 | −14.3 | 17.1 | 31.9 | 719,910.0 | 1,151,590.0 | 60.0 |
| 38.8 | 31.6 | −18.6 | 16.9 | 31.8 | 655,720.0 | 1,004,880.0 | 53.2 |
| 3.3 | 4.5 | 36.4 | 19.6 | 32.9 | 64,680.0 | 148,050.0 | 128.9 |
| manufacture of cereal milling products, starch, and starch products | 6.5 | 8.3 | 27.7 | 40.5 | 48.1 | 263,250.0 | 399,230.0 | 51.7 |
| production of ready-made animal feed | 6.5 | 9.6 | 47.7 | 41.0 | 53.1 | 266,500.0 | 509,760.0 | 91.3 |
| production of bread and fresh pastry products | 23.1 | 44.7 | 93.5 | 6.4 | 14.0 | 147,840.0 | 625,800.0 | 323.3 |
| production of bread and pastry products with extended shelf life | 7.3 | 7.0 | −4.1 | 8.2 | 13.9 | 59,860.0 | 97,300.0 | 62.5 |
| sugar production | 11.9 | 3.7 | −68.9 | 39.4 | 107.3 | 468,860.0 | 397,010.0 | −15.3 |
| production of cocoa, chocolate and confectionery | 16.6 | 20.7 | 24.7 | 9.9 | 26.8 | 164,340.0 | 554,760.0 | 237.6 |
| pasta production | 2.7 | 2.1 | −22.2 | 11.1 | 28.5 | 29,970.0 | 59,850.0 | 99.7 |
| coffee and tea processing | 3.2 | 4.0 | 25.0 | 11.7 | 18.2 | 37,440.0 | 72,800.0 | 94.4 |
| production of spices | 2.9 | 9.0 | 210.3 | 5.8 | 13.2 | 16,820.0 | 118,800.0 | 606.3 |
| production of beverages, including: | ||||||||
| 3.7 | 3.9 | 5.4 | 7.0 | 14.8 | 25,900.0 | 57,720.0 | 22.9 |
| 1.0 | . | . | 10.5 | . | 10,500.0 | . | . |
| 8.7 | 7.3 | −16.1 | 28.0 | 36.5 | 243,600.0 | 266,450.0 | 9.4 |
| 11.2 | 7.1 | −36.6 | 16.9 | 42.6 | 189,280.0 | 302,460.0 | 59.8 |
Disclaimer/Publisher’s Note: The statements, opinions and data contained in all publications are solely those of the individual author(s) and contributor(s) and not of MDPI and/or the editor(s). MDPI and/or the editor(s) disclaim responsibility for any injury to people or property resulting from any ideas, methods, instructions or products referred to in the content. |
© 2023 by the authors. Licensee MDPI, Basel, Switzerland. This article is an open access article distributed under the terms and conditions of the Creative Commons Attribution (CC BY) license (https://creativecommons.org/licenses/by/4.0/).
Share and Cite
MDPI and ACS Style
Szymańska, E.J.; Mroczek, R. Energy Intensity of Food Industry Production in Poland in the Process of Energy Transformation. Energies 2023, 16, 1843. https://0-doi-org.brum.beds.ac.uk/10.3390/en16041843
AMA Style
Szymańska EJ, Mroczek R. Energy Intensity of Food Industry Production in Poland in the Process of Energy Transformation. Energies. 2023; 16(4):1843. https://0-doi-org.brum.beds.ac.uk/10.3390/en16041843
Chicago/Turabian StyleSzymańska, Elżbieta Jadwiga, and Robert Mroczek. 2023. "Energy Intensity of Food Industry Production in Poland in the Process of Energy Transformation" Energies 16, no. 4: 1843. https://0-doi-org.brum.beds.ac.uk/10.3390/en16041843
Note that from the first issue of 2016, this journal uses article numbers instead of page numbers. See further details here.