
Ensemble-Learning-Based Decision Support System for Energy-Theft Detection in Smart-Grid Environment

1
Center of Excellence in Information Assurance (CoEIA), King Saud University, Riyadh 12372, Saudi Arabia
2
College of Computer and Information Sciences (CCIS), King Saud University, Riyadh 11461, Saudi Arabia
*
Author to whom correspondence should be addressed.
Energies 2023, 16(4), 1907; https://0-doi-org.brum.beds.ac.uk/10.3390/en16041907
Submission received: 30 October 2022
/
Revised: 21 December 2022
/
Accepted: 22 December 2022
/
Published: 14 February 2023
(This article belongs to the Special Issue New Trends in Power Networks' Transition towards Renewable Energy)
Abstract
:Theft of electricity poses a significant risk to the public and is the most costly non-technical loss for an electrical supplier. In addition to affecting the quality of the energy supply and the strain on the power grid, fraudulent electricity use drives up prices for honest customers and creates a ripple effect on the economy. Using data-analysis tools, smart grids may drastically reduce this waste. Smart-grid technology produces much information, including consumers’ unique electricity-use patterns. By analyzing this information, machine-learning and deep-learning methods may successfully pinpoint those who engage in energy theft. This study presents an ensemble-learning-based system for detecting energy theft using a hybrid approach. The proposed approach uses a machine-learning-based ensemble model based on a majority voting strategy. This work aims to develop a smart-grid information-security decision support system. This study employed a theft-detection dataset to facilitate automatic theft recognition in a smart-grid environment (TDD2022). The dataset consists of six separate electricity thefts. The experiments are performed in four different scenarios. The proposed machine-learning-based ensemble model obtained significant results in all scenarios. The proposed ensemble model obtained the highest accuracy of 88%, 87.24%, 94.75%, and 94.70% with seven classes including the consumer type, seven classes excluding the consumer type, six classes including the consumer type, and six classes excluding the consumer type. The suggested ensemble model outperforms the existing techniques in terms of accuracy when the proposed methodology is compared to state-of-the-art approaches.
1. Introduction
A smart grid is an attractive integration of information and communication technologies (ICTs) [1,2,3]. It consists of smart meters and sensors linked to the energy server through wireless/wired communication [4]. Compared to the traditional grid, a smart grid allows for more efficient management of electric power [5,6,7,8,9,10]. A smart grid uses an analytical approach and efficient load scheduling to maximize resource use [11]. To lessen the impact of peak demand and facilitate more affordable power trading, researchers proposed a hierarchical energy-management system [12]. A technique based on information-gap decision theory is offered to mitigate the effects of the intermittent nature of renewable energy [13].
A nation’s ability to effectively and efficiently use its energy resources is crucial to its social and economic development in light of the high cost of procuring energy and the limited number of energy resources accessible. The smart grid has become an essential component of optimizing future energy monitoring. An intelligent monitoring system keeps tabs on the habits and routines of everyone connected to the system, as well as the power system architecture and machines used to manage and monitor energy consumption which make up the smart-grid system [14,15]. The smart grid enables utilities and customers to do these things by integrating digital technologies with the existing electrical grid. A crucial component of the energy internet (EI) is the two-way flow of energy and data [16]. It is the next level of smart-grid technology. The advanced metering infrastructure (AMI) is the primary foundation of the EI [17]. Incredibly detailed information about energy use is available to utilities through the AMI. Through the strategic rollout of smart meters, we can accurately analyze consumer consumption behavior, predict load, and respond to demand. Power transmission and distribution experience technical and non-technical losses [18]. The term “technical losses” refers to the energy lost in the machinery used to carry out the electricity transmission and distribution [19]. Non-technical losses (NTL) occur because of electricity theft, utility-worker misbehavior, and billing discrepancies [20]. Utilities spend almost USD 96 billion annually on the NTL worldwide, according to research [21].
Power companies, engineers, and academics are all scrambling to find practical solutions to cut down on NTL to prevent this massive financial hit [22]. The most effective method of preventing energy theft is the introduction of an energy internet based on smart meters. Possible applications of this technique include the remote monitoring and recording of consumers’ consumption statistics and the quick transmission of this data to the utility should any suspicious activity be detected. Though there are many benefits to using an energy meter, the significant costs associated with deploying and operating them make them impractical for countries with severe economic challenges. In addition, increasing cyber dangers must be mitigated before the widespread usage of such devices is possible. Securing the EI’s information flow takes work because of the unique characteristics of AMI. Criminal individuals can utilize infiltration techniques to tamper with smart meter data. Thefts of electricity on the EI are distinct from those that occurred on the traditional grid and involved, for the most part, the physical avoidance of or destruction of mechanical meters [18]. Artificial-intelligence (AI) algorithms might enable automated user-energy usage tracking. Combined with data from other smart meters, it might help catch electricity thieves.
Credible sources have recorded multiple instances of organized energy theft, including the US Federal Bureau of Investigation [18]. These are based on strategies and methods manipulated to cause massive, non-trivial losses to smart meters. To successfully address the NTL issue, employing efficient methods for power-theft detection based on EI is necessary [23,24]. As conventional detection approaches, such as sending out technical staff or keeping tabs on things via video surveillance, are time-consuming and labor-intensive, we need EI-based tactics for energy-theft detection if we solve the NTL problem.
There are three categories of NTL detection strategies: theoretical, hardware and non-hardware based [25]. Theoretical approaches to the problem of NTLs involve linking socioeconomic and demographic factors [26]. The hardware-based solutions take additional precautions in the distribution network to detect electrical theft [27]. Trespassers are not allowed to tamper with a network’s diagnostics. Consequently, there will be discrepancies between the smart-meter data and the system states. It is possible to achieve high accuracy in theft detection, but doing so will require additional equipment. The high upkeep and sensor-deployment costs make these methods impractical for many utility providers. Despite hardware-based solutions, non-hardware-based energy-theft detection procedures do not need additional NTL-detecting equipment. The two primary categories of such strategies are those grounded in artificial intelligence and those grounded in game theory [28]. To identify the NTL, game-theory-based methods build on the idea of a game between the provider and the fake customers [29]. A clear definition of the essential responsibilities of users, violators, regulatory bodies, and distributors renders these strategies impractical despite their lower costs. In contrast, AI-based solutions are more practical since they employ machine-/deep-learning techniques such as classification and clustering to assess consumer load profiles and spot outliers [30,31]. This is because fake-customers’ consumption habits are assumed to be distinct from regular users. The clustering method is the cornerstone of unsupervised learning since it can be used with an unlabelled dataset [32]. Alternatively, a labeled dataset is necessary for supervised-learning-based classification [33].
According to our knowledge, this is the second study to successfully implement a fully automated identification of theft detection. Machine-learning and deep-learning methods are applied to customer energy-use data to learn and identify anomalous patterns. This study employed a method based on artificial intelligence and proposed a machine-learning-based ensemble model. This paper’s most significant contributions are:
- Proposed a framework based on machine-learning and deep-learning approaches to develop a decision support system for smart-grid environments and examine smart-grid energy-usage behavior.
- Proposed an ensemble model based on machine learning to effectively identify six distinct forms of theft.
- According to experiments, the suggested ML ensemble model performs better than the state of the art in all circumstances.
The rest of the paper is organized as follows. Section 2 briefly describes previous studies on electricity-theft detection methods. The proposed approach for this study is presented in Section 3. The dataset employed in this study is explained in Section 3.1. The experimental results and comparative analysis is provided in Section 4. This study’s conclusion and future work are shown in Section 5.
2. Literature Review
Multiple non-technical-losses detection strategies have been implemented to combat the growing issue of electricity fraud and theft detection. Hardware and data-driven solutions are only examples of how experts from different fields contribute to non-technical-losses detection solutions. Hardware solutions rely on gadgets to track the parameters of the grid system, including energy, current, and voltages [34]. The primary drawback of this tactic is that it requires expensive new machinery. With the introduction of AMI in the smart grid, a large amount of data can now be obtained. Therefore, data-driven methods for identifying NTL have gained popularity as of late [29]. Examples of such approaches include game theory, statistical methodologies, and machine-learning approaches [35,36]. Compared to other hardware options, these techniques are less complicated and cheaper to implement. After extensive study, researchers separated energy-theft detection methods into three categories: supervised, semi-supervised, and unsupervised [17]. According to the findings, these methods may be broken down into three categories: game-theory-based, state-based, and classification-based [37]. Most datasets involving electrical theft have an imbalanced class, with the outliers being substantially smaller than that of the norm [38]. Due to the imbalanced dataset, the trained model will focus on the more common categories while ignoring the less common ones.
The paper takes into account the problem of managing incomplete data in intelligent systems. We offer a prediction approach for the likely recovery of partially missing or fully lost data based on the enhancement of an ensemble of two GRNNs with the extra usage of an extended-input SGTM neural-based mechanism. An actual dataset depicting air-conditioning monitoring was used to test the enhanced ensemble prediction method’s ability to fill in the gaps. Future study opportunities and the method’s inherent limitations are discussed in [39]. This work describes a prediction method employing a new, stacking-based GRNN ensemble model [40]. Each formed ensemble member processes its dataset, in which the original dataset’s vectors have been randomized and displaced to the current point. The researchers selected SGTM neural-based mechanism as a meta-algorithm for the construction of the result of the ensemble. Its results’ high quality and rapidity are used to support its selection. Several experimental investigations’ findings on selecting the best settings for the created ensemble are detailed.
Replicating different types of solar-energy system relies heavily on prefab modeling techniques [33]. This study presents a literature review on the various methods of modeling non-technical losses. Time- and money-saving modeling approaches for the electrical system were the subject of this study. This review article also covers the benefits and prospects of modeling methodologies. Many researchers have proposed a technique for building non-technical-losses attack models which can accurately reflect the nuances of actual attacks [41,42,43,44]. Furthermore, data-driven techniques must capture the behavior of typical and atypical consumption patterns to detect non-technical losses accurately. Unfortunately, real-world anomaly cases are not included in any public datasets for developing or testing detection methods.
The authors proposed a fascinating comparative study of supervised-learning strategies for identifying power outages [45]. This study compares the results of many supervised-learning methods (including AdaBoost, decision trees, ANNs, and DL-ANNs). The investigation here utilized data that was made accessible online by the State Grid Corporation of China. Results showed that deep neural networks used in artificial-intelligence research performed better than alternative supervised-learning classifiers. The authors also provided a fascinating survey which looked at the causes and manifestations of attacks on the advanced metering-infrastructure system that lead to non-technical losses [46]. They also analyzed assaults which originated from less sophisticated sources which were unsuccessful. They also spoke about various features, feature-engineering approaches, and how well they can categorize standard and attack samples [47,48]. In addition, this research looked into the efficacy of numerous learning models at spotting various forms of cyberattacks. Non-technical-losses attack detection was also summarized, along with suggestions for improvement. Compared to previous works, our contributions are novel in the following ways:
- Provide a decision support system based on machine learning and deep learning to analyze and investigate smart grid energy consumption for smart grids.
- Develop an ensemble model to detect six types of theft: theft1, theft2, theft3, theft4, theft5, and theft6.
- Experiments reveal that the proposed ensemble model outperforms the state of the art in every scenario.
3. Proposed Approach
This study introduces a unique ensemble-learning approach and ML-classifier training method for detecting theft from the provided dataset. The suggested approach as given in Figure 1 involves an electricity-theft dataset. The suggested technique for this research study is covered in this section.
Figure 2 shows the proposed solution in detail. The dataset was first gathered with an Open Energy Data Initiative (OEDI) platform. The three primary stages of data preparation are label encoding, missing-value removal, and data normalization. Four prominent ML classifiers, including multi-layer perceptron (MLP), k-nearest neighbour (KNN), random forest (RF), and extreme gradient boosting (XGB), combined with a unique ensemble-learning model, which is based on a majority voting approach, are used to detect the electricity theft. The deep-learning approach is also used in this study. Model prediction on new unseen data was performed after several ML/DL models were trained on training data.
3.1. Dataset Selection
Measurements of energy use from various consumers over a year are included in the original data (12 months). Every hour, readings are taken. There are sixteen distinct consumer categories included in the dataset, each with its unique energy-consumption patterns. The dataset is provided at Mendeley datasets (https://data.mendeley.com/datasets/c3c7329tjj/1, accessed date 20 August 2022).
The data include a wide variety of fraudulent activities which specific customers may initiate. One kind of electricity theft is the intentional lowering of daytime use. To save energy, multiply the usual usage by 0.1 and 0.8. The second form of theft occurs when a victim’s electrical use suddenly and for no apparent reason reduces to zero. The third form of theft works analogous to the first, except that each consumption unit (per hour) is multiplied by an unpredictable factor. For the fourth form of theft, we produce a random percentage of the average consumption. The sixth form of theft swaps the positions of the readings, while the fifth type gives the average consumption. We created a robbery generator which could randomly produce any of the six forms of theft discussed above. The primary source of information comes from the Open Energy Data Initiative (OEDI). It is a database for energy research which collects data from many OEDI offices and labs [27].
The collection has 560,640 occurrences in total. The dataset has 12 characteristics, one category feature, and ten numerical features. The dataset is composed of 16 consumer types, and each consumer type contains 35,040 instances. The dataset has seven classes in total due to the six distinct forms of theft and the normal class. The normal class contains 331,824 instances, and the remaining six theft classes, theft1, theft2, theft3, theft4, theft5, and theft6, contain 51,083, 22,958, 44,349, 41,460, 33,553, and 35,413 instances.
3.2. Theft Detection Approach
The information was gathered for 16 distinct customers, as previously said in Section 3.1. Our technique consists of a series of learning tests by four validation mechanisms. Figure 1 shows the process of the classification mechanisms. The experiments are performed in four stages to adequately analyze and select the optimum methodology. We began with the first method (P7), which divides the data into seven classes (6 thefts and normal instances), utilizing the consumption attributes and the consumer type as inputs, i.e., the classifier is aware of the consumer type. The second method divides the data into seven classes, utilizing only the consumption attributes and discarding the consumer type. Five types of theft and normal class were the only ones taken into account in the third mechanism (P6C). Based on the experimental results of P7, we concluded that identifying theft6 is challenging and presented an auxiliary method which only involves six classifications. In this approach, we also employ a categorization based on a specific customer type. Classification of P7U and P6U mechanisms occurs regardless of the consumer types. The customers’ identities still need to be clarified in both processes; we studied seven categories for the P7U mechanism but only six for the P6U mechanism. Only the top 10 consumption characteristics are considered when designing these procedures.
3.3. Data Pre-Processing
The quality of the data and the important information extracted strongly impact our model’s capacity to learn, making data pre-processing crucial in machine learning and deep learning. Due to this, the pre-processing of data is a crucial step in the machine-learning process [49]. Imputation of missing values, data normalization, and category-codes-based label encoding are the three most essential steps in preparing data [50]. Our dataset did not include null values during the pre-processing phase. In the following preprocessing stage, we eliminated some columns from the dataset that were unimportant to theft identification. In the data-preprocessing stage, we encoded using category codes. Using this technique, we were able to convert qualitative information into a numerical format. We started by checking the column data types; the category column must be of type “category” for this approach to work. To use this strategy, we first had to convert the data type to a “category.” Given the wide variety of feature values, we used a generic scaler to normalize the data for this study. A standard scaler is a python function which normalizes the data to a specified range [51]. To function, it modifies characteristics such as its distribution so that its mean is zero and its standard deviation is one. The formula for the standard scaler is shown in Equation (1), where is the standardized form of .
3.4. Classification Models
We analyzed the efficacy of our suggested method and describe the ML ensemble classifier and DL classifier.
3.4.1. Ensemble-Learning Classifier
Academics have increasingly turned to ensemble learning to solve many ML challenges [52,53]. Since there are six different forms of theft in the dataset, an ensemble-learning method was used to identify them and classify them accordingly. Combining many ML classifiers and employing different voting processes, ensemble-learning approaches seek to improve performance [54]. The main advantage of this ML ensemble model is that it combines the prediction of various ML models, uses the majority voting strategy, and improves the accuracy rate. As soon as a new data point is received, all the classifiers within the ensemble make predictions for its class label. The class label that receives the most votes from the classifiers is then used to label the instance. The suggested method takes the aggregated predictions from many classifiers and returns the results using a weighted majority approach. After each categorization model is tweaked, the best results are provided. Using the formula in the equation, one may maximize support (2).
In Equation (2), stands for the group that received the most votes (ref. votes). The ensemble uses several classification algorithms, such as random forest (RF), XGBoost, and multilayer perceptron (MLP). Soft voting is used in the ensemble-model voting process. The voting classifier is a function of sklearn which combines and converts multiple weaker models into an individual, more robust model. This study used the voting-classifier function of the sklearn python library to combine the three machine-learning models (RF, MLP, and XGB) into a single, more robust model. The parameters of XGB, MLP, and RF remained their default. The individual machine-learning models that contribute to the voting process are explained below:
Random forest: The RF algorithm is a form of supervised learning. It can perform various tasks such as classification, regression, and more. Similarly, this is an ensemble-learning technique. It is a part of the ML ensemble model, which generates several classification trees [55]. An ensemble method produces a more precise classification tree than a single method. In place of more conventional classifiers, random forests are frequently employed when dealing with complicated datasets. The many decision trees that make up random forest’s (RF) categorization engine each settle on a single-best possible target label. To produce the forecast, we employed the method of majority vote. A random forest has an n-estimator of 100. In addition, we used a Gini criteria parameter with a zero random state. It takes at least two split samples and one leaf sample to reliably generate a statistical distribution.
Extreme gradient boosting: Maximizing efficiency while using available memory is the goal of the XGB technique. The XGBoost optimization method is used in this ensemble classification model to improve classification accuracy further. The XGBoost classifier is used to boost the accuracy of the classification process. The scalable ML technique XGBoost optimizes the loss function with gradient descent and provides predictions by way of an enhancing ensemble of weak classification trees [56]. XGBoost’s novel gradient-boosting model combines weak and stronger learners through a flexible and adaptive process. At each iteration of gradient boosting, the residual error is used to fine tune the prior prediction and optimize the loss function. XGBoost’s objective function for measuring model performance is specified by the equation where the loss function is regularized.
The parameter estimates denoted by in Equation (3) are derived from the input data. The loss function measures the model’s complexity, where L is the training portion, and is the regularization term. This research employed these parameters for the XGBoost algorithm: XGBoost’s model’s maximum depth was set using a dedicated parameter. The maximum depth has a value of 6. Parameters included a scale position weight of 1, a minimum children weight of 1, a booster of a gb-tree, and an eta value of .
Multi-layer perceptron (MLP): a part of an artificial neural network that takes inputs in a forward (ANN). Classification and prediction problems are ideal for MLP. Back probation is another supervised-learning strategy used in MLP training. The MLP model consists of a minimum of three layers of nodes: an input layer, a hidden layer, and an output layer. The MLP model’s third and final layer consists of one or more computational nodes. To summarize the results of the MLP model’s computation nodes, an output layer is produced. The feature values of an attribute are represented by the nodes in the input layer, whereas the nodes in the output layer are responsible for classifying the attribute. To train, MLP employs a supervised-learning strategy based on the function . Assuming an input dimension of x, the output dimension is y. An assortment of attributes, denoted by , and the desired outcome, T, are available. Each “node” represents a neuron approximating a nonlinear activation function to perform classification or regression. With rectified linear unit (ReLU) as the activation function and adam as the optimizer, the staple length of the hidden layer is around 100 in this study. The greatest number of iterations was around 200, and the alpha value was 0.0001.
3.4.2. Deep-Learning Classifier
The deep-learning model was also used in this study to compare ML and DL approaches on the provided dataset. The deep-learning model comprises a single input layer with 720 parameters and two hidden layers. The first hidden layer contains 975 parameters and the ReLU activation function, while the second hidden layer contains 112 parameters. The last layer is a fully connected layer where the results of all the previous layers are stored vertically. The total number of trainable parameters is 1747. The categorical_crossentropy and 0.01 learning rate are used to compute the loss. The validation split value is 0.2. A total of 20% of the training data is utilized for validation purposes. The model training comprises 50 epochs, and the verbose value is 1. In the end, validation, training loss, and accuracy are calculated, and multiple other evaluation metrics are used to assess the deep-learning model’s ability.
3.5. Performance Evaluation Measures
Assessing the quality of a machine-/deep-learning algorithm is crucial to any investigation’s success. Metrics used for evaluation determine how well a machine-learning or deep-learning model performs. It is possible to put a model through its paces using any one of a wide variety of evaluation measures. Accuracy, precision, recall, the F-measure, the AUC score, and the confusion matrix are all taken into account, as well as a few others that are often used to evaluate performance in this study, as shown in Equations (4)–(7). Results such as true positives (TP), true negatives (TN), false positives (FP), and false negatives (FN) can be determined by examining the resulting confusion matrices. Values for accuracy, precision, recall, and F-measure, can be calculated using the below equations:
Accuracy is a measure of the quality of the models’ classification performance. It represents the percentage of labels assigned to the correct categories. Accuracy might be a percentage between 0 and 100, where higher values indicate better performance. The precision of an algorithm may be calculated by dividing the number of correct predictions by the total number of positive outcomes. In statistics, recall is the ratio of true positives to all anticipated positives. The F1 score is a combined measurement of both precision and recall. It is a valuable which supplements the accuracy score, the primary metric for evaluating performance.
Area under the Receiver Operating Characteristic (ROC) Curve
One technique to evaluate a model’s predictive abilities is ROC curve analysis, which involves a plot of sensitivity versus specificity. The area under the receiver operating characteristic (ROC) curve can be used to determine whether a classification algorithm consistently assigns correct labels to data. The ROC curve is constructed by putting the TPR on the y axis and the FPR on the x axis. A probability curve depicting TPR versus FPR at different cutoffs is shown. The area under the curve (AUC) is a statistic used to distinguish between groups. An improved ability to predict classes is indicated by a higher AUC for a model. The AUC can range from 0 to 1, with 0 indicating that the classifier incorrectly labels positive data as negative and 1 indicating that the classifier correctly labels positive and negative data.
4. Experimental Results and Discussion
This section reviews the key findings and compares them to the conventional approaches. For experimentation, Python 3 and a Jupyter notebook were run on a laptop with a GTX 1050 GPU, 2GB VRAM, an i5-8300H CPU, and 16GB RAM. The experimental results of this study are shown in Table 1, Table 2, Table 3 and Table 4. This study uses various machine-learning and deep-learning approaches and proposes an ML_Ensemble model to build a decision support system for smart-grid information security. This study used an electricity-theft dataset collected over 12 months. The so-called “known consumer” type uses 11 input features, including the consumption attributes and consumer type. This second option, “unknown customer”, solely uses the consumption variables, leaving out the consumer type. The ML and DL classifiers with seven and six output classes are evaluated.
Two auxiliary mechanisms are evaluated for every primary mechanism. In the first stage, ML and DL classifiers are evaluated with seven output classes and 11 features, including consumer type. In the next stage, ML and DL classifiers are evaluated with seven output classes and 10 features, excluding consumer type. Furthermore, the experiments are performed with six output classes, including and excluding the consumer type. As detecting theft involving six classes proved difficult, as shown in Figure 3a, we presented an additional technique focusing on these theft types. This study employed five evaluation metrics to assess the model’s abilities for electricity-theft detection. This study used accuracy, precision, recall, F1-score, AUC score, and confusion matrix to analyze the models. This study uses four machine-learning models and a deep neural network (DNN). The four machine-learning models are nearest neighbour (KNN), extreme gradient boosting (XGB), random forest (Rf), and multi-layer perceptron (MLP). This work provided a more robust ensemble model which outperformed previous approaches in terms of performance by combining the prediction of weak machine-learning models to create a better decision support system. To experiment, the dataset was initially split in half; 80% of the data was used to train the machine-learning models, while the remaining 20% was used for testing. Additionally, 80 percent of training data was further separated into 70 percent and 10 percent, with 10 percent used for DNN model validation and 70 percent used for DNN model training.
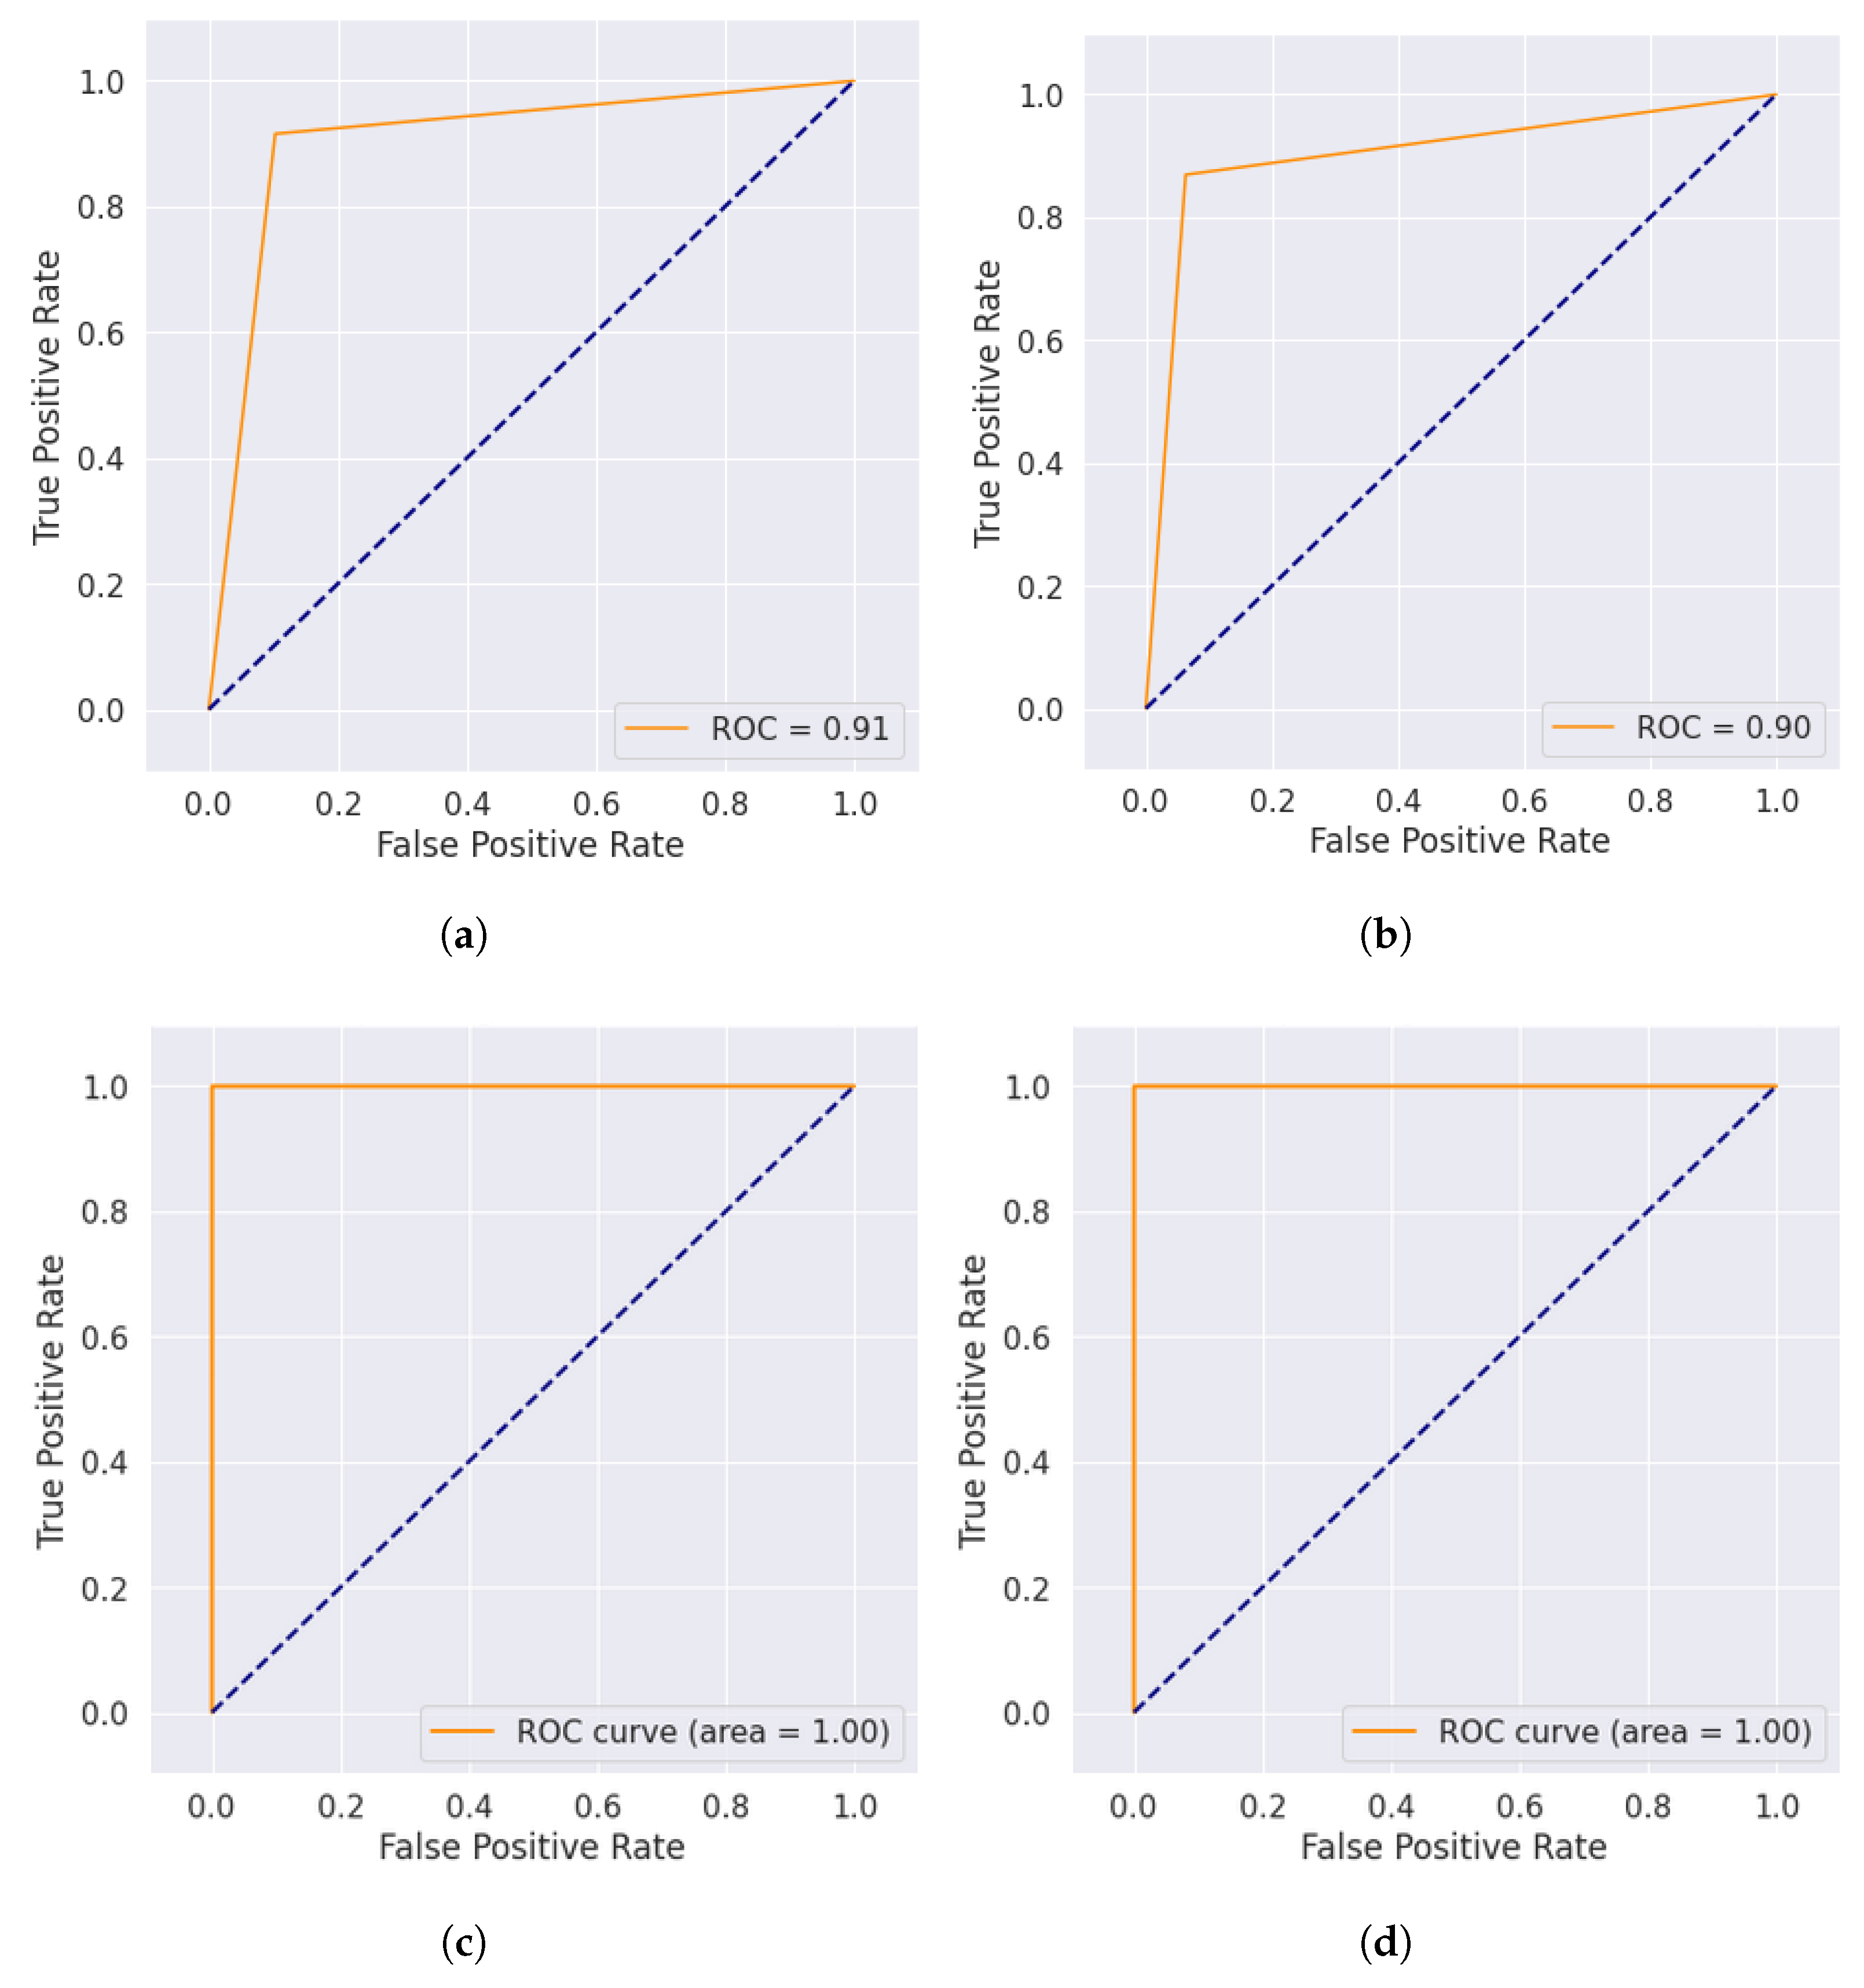
While analyzing the results of seven output classes with 11 features, including the consumer type, the ML_Ensemble model obtained the highest results with an accuracy rate of 88%. The proposed model outperformed all other ML and DL models. The precision, recall, and F1-score of the ML_Ensemble model with 11 features and seven classes were also computed. The precision score, recall score, and F1-score were 83.40%, 88.55%, and 85.49%. The ROC curve was plotted to show the performance of models during the training process. The ROC curve is shown in Figure 4a. The ROC curve score is 91%, depicting that the proposed model performed very well on this dataset. The confusion matrix was also plotted to identify the classwise accuracy. Figure 3a shows the confusion matrix of the proposed ensemble model, where diagonal values show those instances accurately classified by the proposed ensemble model and others which were misclassified. The ML_Ensemble model also obtained the highest result, with ten features and seven classes, excluding the consumer type. The proposed model obtained the best accuracy of 87.24% with 82.10% precision, 87.50% recall, and 84.82% F1 score. The wall time of the proposed ensemble model was, on average, 36 min for each experiment. The confusion matrix of the ensemble classifier with ten features and seven classes is shown in Figure 3b, while the ROC curve is shown in Figure 4b.
The experiments were also performed with six classes and computed the experimental results. In the experiments with six classes and 11 features, the ML_Ensemble model again outperformed the other ML and DL model results. The proposed ML_Ensemble achieved a 94.75% accuracy score. The precision, recall, and F1 score were also computed. The findings show that the ensemble model with six classes and 11 features obtained 94.90% precision, 94.88% recall, and 94.87% F1 score. The confusion matrix of this stage of the experiment with the ensemble model is depicted in Figure 3c, and the ROC curve of the ensemble model with six classes is shown in Figure 4c. The last stage of experiments was performed with ten features and six classes. Again, the proposed ensemble model performed more effectiely than other ML and DL models. The proposed ML_Ensemble model obtained the best score of 97.70% with 94.85% precision, 94.88% recall, and 94.90% F1 score. According to the results, the proposed ML_Ensemble model performed better than all other machine-learning and deep-learning models.
Comparative Analysis
A comparison between the suggested method and the state-of-the-art method is provided in Table 5. Our research is compared to the standard method described in [57] to validate our findings. The experimental conditions in the proposal and existing research are very similar. The existing approach employed five classifiers with various evaluation mechanisms. The baseline method achieved the maximum accuracy (85%) using the random forest in the first stage of the experiments (with 11 features and seven classes), whereas the suggested ML_Ensemble model achieved the highest accuracy (88%) under the same conditions. A 3% improvement in accuracy was achieved using the proposed approach. Next, experiments were conducted using seven classes and ten features; the existing technique achieved the highest accuracy (84.89%) with the random forest, whereas the suggested ML_Ensemble model achieved the best accuracy (87.24%) using identical empirical parameters, a 2.35 percentage point improvement in accuracy. Third-stage experiments employing the baseline method’s selection of six classes and eleven characteristics yielded an accuracy of 94.71% when using the RF model. Using the suggested ML_Ensemble model, we achieved a maximum accuracy of 94.75 percent. The baseline technique employing the RF model achieved the highest accuracy (94.64 percent) when used with the dataset, including the six classes and ten characteristics used in the final round of testing. The proposed method, employing the ML_Ensemble model, achieved 94.70 percent accuracy. Overall, the accuracy of the suggested method is higher than that of the baseline method throughout all experimental phases.
5. Conclusions
In this research, a decision support system for smart-grid environments was developed and assessed using a unique and extensive dataset for energy-theft detection (ETD2022). The ETD2022 dataset includes 560 and 640 samples, each having 11 numeric characteristics and one categorical feature for the target class. The proposed approach utilized machine learning and deep learning to make a decision support system. The four machine-learning models—KNN, XGB, RF, MLP, and a deep neural network were combined on ETD2020 to create a decision support system. To develop an intelligent autonomous decision support system, this study proposed a unique ML_Ensemble classifier based on a majority voting mechanism. Four common performance indicators—accuracy, precision, recall, and F measure—were also employed to gauge how well the applied models worked. In every scenario (mechanisms), the ML_Ensemble model achieved the best accuracy results. The proposed ensemble model obtained the highest accuracy of 88%, 87.24%, 94.75%, and 94.70% with seven classes including the consumer type, seven classes excluding the consumer type, six classes including the consumer type, and six classes excluding the consumer type. The biggest drawback of the suggested method is how expensive and computationally intensive the ensemble model is.
5.1. Future Work
To improve the efficacy of our seven-class and six-class classification methods, we will focus in the future on creating a more efficient model which decides in significantly less time and is computationally less expensive. Furthermore, increased data-engineering and feature-selection work can enhance the recognition outcomes and impact overhead. In the future, we intend to use deep neural network-based approaches to build better models soon, but this was not valid due to the limited processing resources available in our commodity PCs.
5.2. Limitations
Some of the limitations of this research are as follows;
- The computational cost of the proposed ensemble model with four distinct mechanisms is very high.
- The deep-learning approach could perform better in all the mechanisms due to the small dataset.
- The main limitation of this work is its computational complexity, which we will resolve in the future.
- One of the limitations is that this method does not apply to detecting real-time electricity at the moment. Still, our future goal is to use this technique to identify power outages in real-time. This method was tested using OEDI consumption patterns, and it may be further verified using datasets from other regions to ensure it works well elsewhere.
Author Contributions
Conceptualization, F.M., K.S. and J.A.-M.; methodology, F.M. and K.S.; software, F.M.; validation, F.M.; formal analysis, F.M.; investigation, F.M.; resources, F.M., K.S. and J.A.-M.; writing original draft preparation, F.M.; writing—review and editing, F.M., K.S. and J.A.-M.; visualization, F.M., K.S. and J.A.-M.; supervision, K.S. and J.A.-M.; project administration, K.S. and J.A.-M.; funding acquisition, K.S. and J.A.-M. All authors have read and agreed to the published version of the manuscript.
Funding
This work was supported by the Deanship for Research & Innovation, Ministry of Education in Saudi Arabia for funding this research work through the project number IFKSURG-2-1187.
Institutional Review Board Statement
Not applicable.
Informed Consent Statement
Not applicable.
Data Availability Statement
Not applicable.
Acknowledgments
The authors extend their appreciation to the Deanship for Research & Innovation, Ministry of Education in Saudi Arabia for funding this research work through the project number IFKSURG-2-1187.
Conflicts of Interest
The authors share no conflict of interest.
References
- Altaf, A.; Abbas, H.; Iqbal, F.; Khan, F.; Rubab, S.; Derhab, A. Context-oriented trust computation model for industrial Internet of Things. Comput. Electr. Eng. 2021, 92, 107123. [Google Scholar] [CrossRef]
- Al Muhtadi, J.; Alamri, R.; Khan, F.; Saleem, K. Subjective logic-based trust model for fog computing. Comput. Commun. 2021, 178, 221–233. [Google Scholar] [CrossRef]
- Bhattacharya, S.; Chengoden, R.; Srivastava, G.; Alazab, M.; Javed, A.R.; Victor, N.; Maddikunta, P.K.R.; Gadekallu, T.R. Incentive mechanisms for smart grid: State of the art, challenges, open issues, future directions. Big Data Cogn. Comput. 2022, 6, 47. [Google Scholar] [CrossRef]
- Majid, M.; Habib, S.; Javed, A.R.; Rizwan, M.; Srivastava, G.; Gadekallu, T.R.; Lin, J.C.W. Applications of wireless sensor networks and internet of things frameworks in the industry revolution 4.0: A systematic literature review. Sensors 2022, 22, 2087. [Google Scholar] [CrossRef] [PubMed]
- Nazari-Heris, M.; Mirzaei, M.A.; Mohammadi-Ivatloo, B.; Marzband, M.; Asadi, S. Economic-environmental effect of power to gas technology in coupled electricity and gas systems with price-responsive shiftable loads. J. Clean. Prod. 2020, 244, 118769. [Google Scholar] [CrossRef]
- Javed, A.R.; Shahzad, F.; ur Rehman, S.; Zikria, Y.B.; Razzak, I.; Jalil, Z.; Xu, G. Future smart cities requirements, emerging technologies, applications, challenges, and future aspects. Cities 2022, 129, 103794. [Google Scholar] [CrossRef]
- Mujeeb, S.; Javaid, N. ESAENARX and DE-RELM: Novel schemes for big data predictive analytics of electricity load and price. Sustain. Cities Soc. 2019, 51, 101642. [Google Scholar] [CrossRef]
- Adil, M.; Javaid, N.; Qasim, U.; Ullah, I.; Shafiq, M.; Choi, J.G. LSTM and bat-based RUSBoost approach for electricity theft detection. Appl. Sci. 2020, 10, 4378. [Google Scholar] [CrossRef]
- Gul, H.; Javaid, N.; Ullah, I.; Qamar, A.M.; Afzal, M.K.; Joshi, G.P. Detection of non-technical losses using SOSTLink and bidirectional gated recurrent unit to secure smart meters. Appl. Sci. 2020, 10, 3151. [Google Scholar] [CrossRef]
- Albogamy, F.; Ashfaq, Y.; Hafeez, G.; Murawwat, S.; Khan, S.; Ali, F.; Khan, F.A.; Rehman, K. Optimal Demand-Side Management Using Flat Pricing Scheme in Smart Grid. Processes 2022, 10, 1214. [Google Scholar] [CrossRef]
- Jadidbonab, M.; Mohammadi-Ivatloo, B.; Marzband, M.; Siano, P. Short-term self-scheduling of virtual energy hub plant within thermal energy market. IEEE Trans. Ind. Electron. 2020, 68, 3124–3136. [Google Scholar] [CrossRef]
- Gholinejad, H.R.; Loni, A.; Adabi, J.; Marzband, M. A hierarchical energy management system for multiple home energy hubs in neighborhood grids. J. Build. Eng. 2020, 28, 101028. [Google Scholar] [CrossRef]
- Mian Qaisar, S. Event-driven coulomb counting for effective online approximation of Li-ion battery state of charge. Energies 2020, 13, 5600. [Google Scholar] [CrossRef]
- Khan, Z.A.; Adil, M.; Javaid, N.; Saqib, M.N.; Shafiq, M.; Choi, J.G. Electricity theft detection using supervised learning techniques on smart meter data. Sustainability 2020, 12, 8023. [Google Scholar] [CrossRef]
- Iwendi, C.; Rehman, S.U.; Javed, A.R.; Khan, S.; Srivastava, G. Sustainable security for the internet of things using artificial intelligence architectures. ACM Trans. Internet Technol. (TOIT) 2021, 21, 1–22. [Google Scholar] [CrossRef]
- Wang, K.; Yu, J.; Yu, Y.; Qian, Y.; Zeng, D.; Guo, S.; Xiang, Y.; Wu, J. A survey on energy internet: Architecture, approach, and emerging technologies. IEEE Syst. J. 2017, 12, 2403–2416. [Google Scholar] [CrossRef]
- Jiang, R.; Lu, R.; Wang, Y.; Luo, J.; Shen, C.; Shen, X. Energy-theft detection issues for advanced metering infrastructure in smart grid. Tsinghua Sci. Technol. 2014, 19, 105–120. [Google Scholar] [CrossRef]
- Zheng, K.; Chen, Q.; Wang, Y.; Kang, C.; Xia, Q. A novel combined data-driven approach for electricity theft detection. IEEE Trans. Ind. Inform. 2018, 15, 1809–1819. [Google Scholar] [CrossRef]
- Henriques, H.; Corrêa, R.; Fortes, M.; Borba, B.; Ferreira, V. Monitoring technical losses to improve non-technical losses estimation and detection in LV distribution systems. Measurement 2020, 161, 107840. [Google Scholar] [CrossRef]
- de Souza Savian, F.; Siluk, J.C.M.; Garlet, T.B.; do Nascimento, F.M.; Pinheiro, J.R.; Vale, Z. Non-technical losses: A systematic contemporary article review. Renew. Sustain. Energy Rev. 2021, 147, 111205. [Google Scholar] [CrossRef]
- Hussain, S.; Mustafa, M.W.; Jumani, T.A.; Baloch, S.K.; Alotaibi, H.; Khan, I.; Khan, A. A novel feature engineered-CatBoost-based supervised machine learning framework for electricity theft detection. Energy Rep. 2021, 7, 4425–4436. [Google Scholar] [CrossRef]
- Arango, L.G.; Deccache, E.; Bonatto, B.D.; Arango, H.; Pamplona, E. Study of electricity theft impact on the economy of a regulated electricity company. J. Control. Autom. Electr. Syst. 2017, 28, 567–575. [Google Scholar] [CrossRef]
- Imran, M.; Durad, M.; Khan, F.; Abbas, H. DAISY: A Detection and Mitigation System Against Denial-of-Service Attacks in Software-Defined Networks. IEEE Syst. J. 2020, 14, 1933–1944. [Google Scholar] [CrossRef]
- Yu, K.; Tan, L.; Mumtaz, S.; Al-Rubaye, S.; Al-Dulaimi, A.; Bashir, A.; Khan, F. Securing Critical Infrastructures: Deep-Learning-Based Threat Detection in IIoT. IEEE Commun. Mag. 2021, 59, 76–82. [Google Scholar] [CrossRef]
- Viegas, J.L.; Esteves, P.R.; Melicio, R.; Mendes, V.; Vieira, S.M. Solutions for detection of non-technical losses in the electricity grid: A review. Renew. Sustain. Energy Rev. 2017, 80, 1256–1268. [Google Scholar] [CrossRef]
- Yurtseven, Ç. The causes of electricity theft: An econometric analysis of the case of Turkey. Util. Policy 2015, 37, 70–78. [Google Scholar] [CrossRef]
- Leite, J.B.; Mantovani, J.R.S. Detecting and locating non-technical losses in modern distribution networks. IEEE Trans. Smart Grid 2016, 9, 1023–1032. [Google Scholar] [CrossRef]
- Jokar, P.; Arianpoo, N.; Leung, V.C. Electricity theft detection in AMI using customers’ consumption patterns. IEEE Trans. Smart Grid 2015, 7, 216–226. [Google Scholar] [CrossRef]
- Amin, S.; Schwartz, G.A.; Cardenas, A.A.; Sastry, S.S. Game theoretic models of electricity theft detection in smart utility networks. IEEE Control. Syst. 2015, 35, 66–81. [Google Scholar]
- Ahuja, R.; Chug, A.; Gupta, S.; Ahuja, P.; Kohli, S. Classification and clustering algorithms of machine learning with their applications. In Nature-Inspired Computation in Data Mining and Machine Learning; Springer: Berlin/Heidelberg, Germany, 2020; pp. 225–248. [Google Scholar]
- Hafeez, G.; Khan, I.; Jan, S.; Shah, I.; Khan, F.; Derhab, A. A novel hybrid load forecasting framework with intelligent feature engineering and optimization algorithm in smart grid. Appl. Energy 2021, 299, 117178. [Google Scholar] [CrossRef]
- Zanetti, M.; Jamhour, E.; Pellenz, M.; Penna, M.; Zambenedetti, V.; Chueiri, I. A tunable fraud detection system for advanced metering infrastructure using short-lived patterns. IEEE Trans. Smart Grid 2017, 10, 830–840. [Google Scholar] [CrossRef]
- Ahmad, T.; Chen, H.; Wang, J.; Guo, Y. Review of various modeling techniques for the detection of electricity theft in smart grid environment. Renew. Sustain. Energy Rev. 2018, 82, 2916–2933. [Google Scholar] [CrossRef]
- Henriques, H.; Barbero, A.; Ribeiro, R.; Fortes, M.; Zanco, W.; Xavier, O.; Amorim, R. Development of adapted ammeter for fraud detection in low-voltage installations. Measurement 2014, 56, 1–7. [Google Scholar] [CrossRef]
- Tao, J.; Michailidis, G. A statistical framework for detecting electricity theft activities in smart grid distribution networks. IEEE J. Sel. Areas Commun. 2019, 38, 205–216. [Google Scholar] [CrossRef]
- Adil, M.; Javaid, N.; Ullah, Z.; Maqsood, M.; Ali, S.; Daud, M.A. Electricity Theft Detection using Machine Learning Techniques to Secure Smart Grid. In Conference on Complex, Intelligent, and Software Intensive Systems; Springer: Cham, Switzerland, 2020; pp. 233–243. [Google Scholar]
- Nizar, A.; Dong, Z. Identification and detection of electricity customer behaviour irregularities. In Proceedings of the 2009 IEEE/PES Power Systems Conference and Exposition, Seattle, WA, USA, 15–18 March 2009; pp. 1–10. [Google Scholar]
- Maamar, A.; Benahmed, K. Machine learning techniques for energy theft detection in AMI. In Proceedings of the 2018 International Conference on Software Engineering and Information Management, Phnom Penh, Cambodia, 3–5 December 2018; pp. 57–62. [Google Scholar]
- Izonin, I.; Tkachenko, R.; Verhun, V.; Zub, K. An approach towards missing data management using improved GRNN-SGTM ensemble method. Eng. Sci. Technol. Int. J. 2021, 24, 749–759. [Google Scholar] [CrossRef]
- Izonin, I.; Tkachenko, R.; Vitynskyi, P.; Zub, K.; Tkachenko, P.; Dronyuk, I. Stacking-based GRNN-SGTM ensemble model for prediction tasks. In Proceedings of the 2020 International Conference on Decision aid Sciences and Application (DASA), Online, 8–9 November 2020; pp. 326–330. [Google Scholar]
- Chen, Y.C.; Gieseking, T.; Campbell, D.; Mooney, V.; Grijalva, S. A hybrid attack model for cyber-physical security assessment in electricity grid. In Proceedings of the 2019 IEEE Texas Power and Energy Conference (TPEC), College Station, TX, USA, 7–8 February 2019; pp. 1–6. [Google Scholar]
- Ahmad, W.; Rasool, A.; Javed, A.R.; Baker, T.; Jalil, Z. Cyber security in iot-based cloud computing: A comprehensive survey. Electronics 2021, 11, 16. [Google Scholar] [CrossRef]
- Messinis, G.M.; Rigas, A.E.; Hatziargyriou, N.D. A hybrid method for non-technical loss detection in smart distribution grids. IEEE Trans. Smart Grid 2019, 10, 6080–6091. [Google Scholar] [CrossRef]
- Nabil, M.; Ismail, M.; Mahmoud, M.; Shahin, M.; Qaraqe, K.; Serpedin, E. Deep recurrent electricity theft detection in AMI networks with random tuning of hyper-parameters. In Proceedings of the 2018 24th International Conference on Pattern Recognition (ICPR), Beijing, China, 20–24 August 2018; pp. 740–745. [Google Scholar]
- Bohani, F.A.; Suliman, A.; Saripuddin, M.; Sameon, S.S.; Md Salleh, N.S.; Nazeri, S. A comprehensive analysis of supervised learning techniques for electricity theft detection. J. Electr. Comput. Eng. 2021, 2021, 233–243. [Google Scholar] [CrossRef]
- Chuwa, M.G.; Wang, F. A review of non-technical loss attack models and detection methods in the smart grid. Electr. Power Syst. Res. 2021, 199, 107415. [Google Scholar] [CrossRef]
- Punmiya, R.; Choe, S. Energy theft detection using gradient boosting theft detector with feature engineering-based preprocessing. IEEE Trans. Smart Grid 2019, 10, 2326–2329. [Google Scholar] [CrossRef]
- Razavi, R.; Gharipour, A.; Fleury, M.; Akpan, I.J. A practical feature-engineering framework for electricity theft detection in smart grids. Appl. Energy 2019, 238, 481–494. [Google Scholar] [CrossRef]
- Shahzad, F.; Mannan, A.; Javed, A.R.; Almadhor, A.S.; Baker, T.; Al-Jumeily, D. Cloud-based multiclass anomaly detection and categorization using ensemble learning. J. Cloud Comput. 2022, 11, 74. [Google Scholar] [CrossRef]
- Fayyaz, M.; Farhan, A.A.; Javed, A.R. Thermal Comfort Model for HVAC Buildings Using Machine Learning. Arab. J. Sci. Eng. 2022, 47, 2045–2060. [Google Scholar] [CrossRef]
- Gautam, S.; Henry, A.; Zuhair, M.; Rashid, M.; Javed, A.R.; Maddikunta, P.K.R. A Composite Approach of Intrusion Detection Systems: Hybrid RNN and Correlation-Based Feature Optimization. Electronics 2022, 11, 3529. [Google Scholar] [CrossRef]
- Abbasi, A.; Javed, A.R.; Chakraborty, C.; Nebhen, J.; Zehra, W.; Jalil, Z. ElStream: An Ensemble Learning Approach for Concept Drift Detection in Dynamic Social Big Data Stream Learning. IEEE Access 2021, 9, 66408–66419. [Google Scholar] [CrossRef]
- Abbasi, A.; Javed, A.R.; Iqbal, F.; Jalil, Z.; Gadekallu, T.R.; Kryvinska, N. Authorship identification using ensemble learning. Sci. Rep. 2022, 12, 9537. [Google Scholar] [CrossRef] [PubMed]
- Dong, X.; Yu, Z.; Cao, W.; Shi, Y.; Ma, Q. A survey on ensemble learning. Front. Comput. Sci. 2020, 14, 241–258. [Google Scholar] [CrossRef]
- Elnagar, A.; Lataifeh, M. Predicting Quranic Audio Clips Reciters Using Classical Machine Learning Algorithms: A Comparative Study. In Recent Advances in NLP: The Case of Arabic Language; Springer: Berlin/Heidelberg, Germany, 2020; pp. 187–209. [Google Scholar]
- Sahin, E. Assessing the predictive capability of ensemble tree methods for landslide susceptibility mapping using XGBoost, gradient boosting machine, and random forest. Appl. Sci. 2020, 2, 1308. [Google Scholar] [CrossRef]
- Zidi, S.; Mihoub, A.; Qaisar, S.M.; Krichen, M.; Al-Haija, Q.A. Theft detection dataset for benchmarking and machine learning based classification in a smart grid environment. J. King Saud-Univ.-Comput. Inf. Sci. 2022; in press. [Google Scholar] [CrossRef]
Figure 1.
Different stages of the methodology.

Figure 2.
Proposed solution for electricity-theft detection.

Figure 3.
Proposed approach results with four distinct mechanisms. (a) Confusion matrix of ensemble model with P7C mechanism. (b) Confusion matrix of ensemble model with P7U mechanism. (c) Confusion matrix of ensemble model with P6C mechanism. (d) Confusion matrix of ensemble model with P6U mechanism.

Figure 4.
Proposed approach ROC curve of four distinct mechanisms. (a) ROC curve of ensemble model with P7C mechanism. (b) ROC curve of ensemble model with P7U mechanism. (c) ROC curve of ensemble model with P6C mechanism. (d) ROC curve of ensemble model with P6U mechanism.
Figure 4.
Proposed approach ROC curve of four distinct mechanisms. (a) ROC curve of ensemble model with P7C mechanism. (b) ROC curve of ensemble model with P7U mechanism. (c) ROC curve of ensemble model with P6C mechanism. (d) ROC curve of ensemble model with P6U mechanism.


Table 1.
Proposed-approach classifiers accuracy.
| Accuracy | ||||
|---|---|---|---|---|
| Number of Classes | 7 Classes | 7 Classes | 6 Classes | 6 Classes |
| Classifier/Protocol | KC | UKC | KC | UKC |
| KNN | 84.34 | 84.10 | 90.50 | 89.65 |
| XGB | 85.67 | 85.70 | 91.21 | 90.79 |
| RF | 85.72 | 85.65 | 94.70 | 94.69 |
| MLP | 78.85 | 76.41 | 83.27 | 84.70 |
| DNN | 77.05 | 76.02 | 83.24 | 83.45 |
| ML_Ensemble | 88.00 | 87.24 | 94.75 | 94.70 |
Table 2.
Proposed-approach classifiers F1-score. Key: known consumer—KC, unknown consumer—UKC.
| F1-Score | ||||
|---|---|---|---|---|
| Number of Classes | 7 Classes | 7 Classes | 6 Classes | 6 Classes |
| Classifier/Protocol | KC | UKC | KC | UKC |
| KNN | 81.90 | 81.60 | 90.54 | 88.90 |
| XGB | 82.17 | 82.90 | 91.25 | 90.88 |
| RF | 84.10 | 84.70 | 85.83 | 95.93 |
| MLP | 74.50 | 71.90 | 82.90 | 82.95 |
| DNN | 74.70 | 71.90 | 83.10 | 81.50 |
| ML_Ensemble | 85.49 | 84.82 | 94.87 | 94.90 |
Table 3.
Proposed-approach classifiers recall. Key: known consumer—KC, unknown consumer—UKC.
| Recall | ||||
|---|---|---|---|---|
| Number of Classes | 7 Classes | 7 Classes | 6 Classes | 6 Classes |
| Classifier/Protocol | KC | UKC | KC | UKC |
| KNN | 84.34 | 84.10 | 90.55 | 89.85 |
| XGB | 85.15 | 85.60 | 91.20 | 91.78 |
| RF | 85.70 | 85.71 | 95.84 | 95.67 |
| MLP | 78.20 | 76.85 | 83.50 | 84.90 |
| DNN | 77.45 | 76.20 | 83.10 | 83.55 |
| ML_Ensemble | 88.55 | 87.50 | 94.88 | 94.88 |
Table 4.
Proposed-approach classifiers precision. Key: known consumer—KC, unknown consumer—UKC.
| Precision | ||||
|---|---|---|---|---|
| Number of Classes | 7 Classes | 7 Classes | 6 Classes | 6 Classes |
| Classifier/Protocol | KC | UKC | KC | UKC |
| KNN | 80.30 | 80.50 | 90.55 | 88.78 |
| XGB | 81.15 | 81.20 | 91.22 | 90.79 |
| RF | 83.57 | 83.72 | 95.83 | 95.87 |
| MLP | 72.25 | 70.90 | 81.54 | 82.10 |
| DNN | 72.90 | 68.70 | 83.14 | 80.50 |
| ML_Ensemble | 83.40 | 82.10 | 94.90 | 94.85 |
Table 5.
Comparative analysis.
| Accuracy | ||||
|---|---|---|---|---|
| Number of Classes | 7 Classes | 7 Classes | 6 Classes | 6 Classes |
| Classifier/Protocol | KC | UKC | KC | UKC |
| Existing research results [57] | ||||
| KNN | 84.91 | 84.69 | 90.72 | 90.50 |
| DT | 82.67 | 82.48 | 93.36 | 93.19 |
| RF | 85.00 | 84.89 | 94.71 | 94.64 |
| Bagging | 84.85 | 84.65 | 90.76 | 90.56 |
| ANN | 80.49 | 78.55 | 86.41 | 85.52 |
| Proposed approach results | ||||
| Proposed Ensemble | 88.00 | 87.24 | 94.75 | 94.70 |
Disclaimer/Publisher’s Note: The statements, opinions and data contained in all publications are solely those of the individual author(s) and contributor(s) and not of MDPI and/or the editor(s). MDPI and/or the editor(s) disclaim responsibility for any injury to people or property resulting from any ideas, methods, instructions or products referred to in the content. |
© 2023 by the authors. Licensee MDPI, Basel, Switzerland. This article is an open access article distributed under the terms and conditions of the Creative Commons Attribution (CC BY) license (https://creativecommons.org/licenses/by/4.0/).
Share and Cite
MDPI and ACS Style
Mohammad, F.; Saleem, K.; Al-Muhtadi, J. Ensemble-Learning-Based Decision Support System for Energy-Theft Detection in Smart-Grid Environment. Energies 2023, 16, 1907. https://0-doi-org.brum.beds.ac.uk/10.3390/en16041907
AMA Style
Mohammad F, Saleem K, Al-Muhtadi J. Ensemble-Learning-Based Decision Support System for Energy-Theft Detection in Smart-Grid Environment. Energies. 2023; 16(4):1907. https://0-doi-org.brum.beds.ac.uk/10.3390/en16041907
Chicago/Turabian StyleMohammad, Farah, Kashif Saleem, and Jalal Al-Muhtadi. 2023. "Ensemble-Learning-Based Decision Support System for Energy-Theft Detection in Smart-Grid Environment" Energies 16, no. 4: 1907. https://0-doi-org.brum.beds.ac.uk/10.3390/en16041907
Note that from the first issue of 2016, this journal uses article numbers instead of page numbers. See further details here.