Article

Decarbonization Analysis for Thermal Generation and Regionally Integrated Large-Scale Renewables Based on Minutely Optimal Dispatch with a Kentucky Case Study

1
SPARK Laboratory, ECE Department, University of Kentucky, Lexington, KY 40506, USA
2
PPL Corporation, Allentown, PA 18101, USA
3
Louisville Gas and Electric and Kentucky Utilities, Louisville, KY 40202, USA
4
Department of Engineering Science, University of Oxford, Oxford OX13PJ, UK
*
Author to whom correspondence should be addressed.
Submission received: 11 January 2023 / Revised: 31 January 2023 / Accepted: 7 February 2023 / Published: 17 February 2023

Abstract

:
Decarbonization of existing electricity generation portfolios with large-scale renewable resources, such as wind and solar photo-voltaic (PV) facilities, is important for a transition to a sustainable energy future. This paper proposes an ultra-fast optimization method for economic dispatch of firm thermal generation using high granularity, one minute resolution load, wind, and solar PV data to more accurately capture the effects of variable renewable energy (VRE). Load-generation imbalance and operational cost are minimized in a multi-objective clustered economic dispatch problem with various generation portfolios, realistic generator flexibility, and increasing levels of VRE integration. The economic feasibility of thermal dispatch scenarios is evaluated through a proposed method of levelized cost of energy (LCOE) for clustered generation portfolios. Effective renewable economics is applied to assess resource adequacy, annual carbon emissions, renewable capacity factor, over generation, and cost to build between thermal dispatch scenarios with incremental increases in VRE penetration. Solar PV and wind generation temporally complement one another in the region studied, and the combination of the two is beneficial to renewable energy integration. Furthermore, replacing older coal units with cleaner and agile natural gas units increases renewable hosting capacity and provides further pathways to decarbonization. Minute-based chronological simulations enable the assessment of renewable effectiveness related to weather-related variability and of complementary technologies, including energy storage for which a sizing procedure is proposed. The generally applicable methods are regionally exemplified for Kentucky, USA, including eight scenarios with four major year-long simulated case studies and 176 subcases using high performance computing (HPC) systems.

1. Introduction

Changes in policy and increased awareness of environmental impacts are driving the development and implementation of technology to significantly reduce greenhouse gas (GHG) emissions including carbon dioxide (CO2). According to the International Energy Agency (IEA), electric power generation around the world accounts for about 40% of energy-related CO2 emissions and offers significant opportunities for emissions reduction with increased variable renewable energy (VRE) generation [1].
One of the major challenges with the integration of increased clean energy is resource adequacy, or the ability to produce sufficient generation to meet customer loads at all hours due to the weather-dependent variability of solar photovoltaic (PV) and wind resources. Increased renewable penetration requires cost-effective support of firm, agile generation that can turn on quickly when needed and operate as long as needed, and/or long-term energy storage to handle extreme weather, peaking periods, and periods of low renewable generation [2]. Hourly analysis of generation including VRE may not be able to accurately evaluate the capability of firm generation to match demand with rapidly changing VRE power output, which changes realistically at the minutely-scale.
To evaluate pathways for decarbonization through gradually increased renewable penetration backed by firm generation, a method of ultra fast minute to minute (M-M) multi-objective optimization (MOO) was developed for clustered generation economic dispatch and implemented on high performance computing (HPC) systems, as described in the current paper. The proposed general method was applied for a case study in Kentucky, USA, (Figure 1) using actual load, renewable (Figure 2), and fossil generating unit data provided by the state’s largest utility Louisville Gas and Electric and Kentucky Utilities (LG&E and KU), part of the PPL Corporation family of companies. Electric power utilities in Kentucky operate in coordination with power balancing authorities within the wider eastern US interconnection [3].
Carbon dioxide emissions from electricity generation in Kentucky have already declined by more than 40% from 2010 through 2021, due primarily to the closure of coal-fired generators and the addition of cleaner-burning natural gas combined cycle and renewables [4,5]. In the absence of federal or state policy requiring decarbonization, electric utilities operating in Kentucky have voluntarily committed to increase renewable generation, and reduce carbon dioxide emissions, with some pledging to achieve net-zero emissions by 2050 [6]. As additional retirements of coal-fired electricity generating units are scheduled to occur before 2035, the important decision arises of what type of generating resources to build next [7].
Minute-to-minute analysis also enables detailed studies into energy storage requirements and imbalance compensation to quantify the mismatch between weather-based generation and expected demand on short and long-term timescales. Economic and CO2 emissions analysis of optimization results were performed with capital expenditures (CAPEX), cost to build, per clustered generation type, carbon dioxide emissions per generation type, and a proposed method of levelized cost of energy (LCOE) for generation portfolios considering fuel cost and cost of operation.
A first main novel contribution of the research described in the current paper is the ultra-fast optimization of dispatchable generation to minimize generation/demand imbalance and cost for a chronological year of minutely data using high performance computing (HPC) systems. To the authors’ knowledge, this study is the first to consider such high resolution in economic dispatch of thermal generation considering operational limitations. The general method developed in this study is applicable for the analysis of large generation fleets with units of different types considering increased operational flexibility.
Figure 1. Maps of Kentucky annual average global horizontal irradiance and wind speed at 100 m hub height from NREL [8]. Kentucky experiences a mild climate with large seasonal variation, and is located at approximately 37.5° N by −85.29° E.
Energies 16 01999 g001
Figure 2. Kentucky state-wide utility solar PV (a) and land-based wind (b) aggregated minutely generation capacity factor across the year with white dotted lines differentiating meteorological seasons. Resources were found to be beneficially disjoint and complementary with high output from solar PV in the summer months and wind in the winter months.
Energies 16 01999 g002
Additional contributions include proposed methods for evaluating the economic and technical feasibility of increased renewable penetration with high seasonal generation variability. A method is proposed for calculating the LCOE of a generation portfolio derived from equations and projections published by the National Renewable Energy Laboratory (NREL) [9]. A second main contribution is represented by the proposed method for improved sizing of complementary technology to reduce imbalances, while considering energy on a minutely basis. Minute to minute chronological firm dispatch is used to assess the limitations imposed by operational flexibility and the requirements of energy storage for decarbonization beyond 80%.
The paper is structured as follows: a review of relevant global and regional developments and an introduction to the Kentucky specific studies in Section 2, detailed economic load dispatch problem formulation and optimization in Section 3, and minutely simulation cases for various generation mixes with results in Section 4. The results are further analysed in Section 5, including a discussion of the findings with implications to future infrastructure development for renewable generation facilities, zero to low carbon firm generation, and energy storage, based on widely used cost and emission indexes. Concluding remarks are presented in the Section 6.

2. Global and Regional Developments and Studies—Literature Review

The cost of solar PV and wind power generation has reduced significantly over the last decade; however, the intermittency of these resources limits the maximum amount that can be integrated into the existing generation and transmission system without affecting the reliability of service. For example, during a very sunny day, solar PV units can produce near rated capacity but experience large variability in output early and late in the day, requiring sufficient firm generation ramping capability to maximize energy utilization and effectiveness [10,11]. On the other hand, a very cloudy day can cause periods of low renewable generation, necessitating enough firm generation capacity to fill the deficit between generation and demand [12]. Example variation is shown in Figure 2 and Figure 3, depicting the solar and wind capacity factor for each day and per week respectively.
The current North American Electricity Reliability Corporation (NERC) standard commonly adopted by utilities specifies that the frequency of under-generation events, a loss of load expectation (LOLE), is at most 0.1 days per year or 99.97% reliability [2,13]. Sufficient controllable generation is necessary to maximize effective techno-economic integration of renewable generation, necessitating studies into the capability of firm generation to ramp to meet expected demand, such as those reported in [10,11,12,14,15,16]. Hence, a growing field in the scientific and technical literature focuses on analyzing the impact of integrating variable renewable energy (VRE) alongside firm generation in future power system planning and operation.
Figure 3. Average solar PV and wind capacity factor (CF), normalized load, and temperature in Fahrenheit with irradiance for each week across the year. The capacity factors for wind and solar peak in winter and summer, respectively, illustrating the complementary nature of the renewable resources.
Energies 16 01999 g003
Limitations of short-term weather dependent VRE integration summarized in [15] have found significant mismatch between demand and generation across time scales (diurnal, daily, seasonal) with increased renewable annual energy contributions. A previous study by other authors identified that higher resolution decarbonization studies, such as the minutely approach proposed in the current paper, are needed to capture the nuanced interactions between system resources and expected cost of generation [17]. Furthermore, it was found that temporal aggregation or time slices, deployed in many previous studies, may not capture fundamental relationships, understate the value of broad technology portfolios, and do not solve time-based mismatch issues [18]. These studies, as well as others reported in [16,19,20], discussed chronological simulation as necessary to capture the challenges of long-term energy deficits due to seasonal variability.
Research into increased decarbonization, i.e., the reduction in CO2 emissions, has been published for complete generation overhaul, examples including Germany [21], Europe [22,23], the US [24,25,26], and Southeast Asia [27]. In the US, previous analysis of very high renewable energy penetration included, for example, [28] and, more recently, the NREL-led ERGIS Integration Study that considered increased spatial and temporal resolution to include synchronous components of the Eastern Interconnection [29]. Towards deep decarbonization, i.e., 80 to 100% reduction in CO2 emissions from current levels, more than 40 studies were considered and tabulated in [30] and 88 regional studies summarized in [31]. Within the majority of the papers reviewed, the main focus was placed on deep decarbonization economic feasibility rather than resource adequacy with gradual renewable adoption and none simulated chronologically minute-to-minute. This represents a significant gap in literature that is addressed by the minutely firm generation dispatch method proposed and the case study completed in this paper.
A variety of upcoming technologies may address the challenge of firm near zero-carbon generation, including carbon capture and sequestration (CCS), focusing on the extraction and removal of carbon dioxide from conventional generation [16,32], hydrogen production through water electrolysis [27,33], and hydrogen-ready combustion turbines [34,35,36]. Sizing of these complementary technologies for deep decarbonization in the near-future will still require consideration of near zero-carbon thermal generation unit operational flexibility [28,37].
The impact of realistic unit commitment constraints including built capacity, ramping limits, and turn-down capability significantly affect system reliability simulation and results with increased VRE penetration. Hybrid methods of economic dispatch coupled with thermal generation operational flexibility were published on studies for gradual integration of renewable generation, e.g., [19,38,39,40,41].
Hybrid economic dispatch was further developed to group distributed generation units into clusters, combining the constraints on operational flexibility from multiple plants as an energy type [42]. Additionally, clustered unit commitment, used in this cited study, has been found to represent unit flexibility with very small difference in optimal solution and is significantly more computationally efficient, up to 15× faster than individual units at large scale [43,44].
Sub-hourly scheduling and planning has been found prior to be not only beneficial and essential for long-term planning but reduces expected reserves and generator movement to balance supply and demand [45]. A recent study into VRE integration established feasible regional penetration of solar PV through economic dispatch of thermal generation with individual unit commitment [46]. Minute-to-minute unit commitment developed within the study sought to capture the realistic contributions of firm thermal generation to compensate for dips in VRE output due to quick changes in weather. Minute-based chronological analysis, not performed in previous papers, models fast variations not captured in typical long-term simulations and is essential for the rating and planning of broad technologies to ensure system reliability.
Hybrid clustered economic dispatch with unit commitment constraints, optimization was employed chronologically minute by minute for generation to meet load. Rather than priority list stacking of generation by least cost or conventional numerical optimization, evolutionary optimization was employed to handle the complex formulation without simplification, allowing for future expansion of objectives, constraints, and scalability [40]. A heuristic multi-objective differential evolution (MODE) type algorithm, adapted from [47], was chosen to identify the optimal Pareto front with comparable results to an NSGA-II alternative at a faster speed. A detailed review of the state-of-the-art techniques for unit commitment using genetic algorithms can be found in [48] including but not limited to DE integration, hybrid evolutionary optimization, etc.
The example region studied, Kentucky, is a land-locked service area with a humid subtropical Koppen climate classification (Cfa), characteristic of large seasonal temperature variation [49]. Average solar irradiance and wind speed distribution is similar across the region with small pockets of higher wind generation, as shown in the annual average maps of Figure 1. Renewable generation distributed across large regions may smooth resource output variability, enabling, in principle, more constant system generation [15,24,29,45]. Still, our analysis of minute-to-minute solar data found that generation may decrease from 100% to 10% capacity in as little time as two minutes. While current solar penetration in Kentucky pose no risk to grid reliability, if all electricity came directly from solar and wind resources, the availability of electricity would fluctuate greatly with the weather.
In the following, multiple scenarios of firm generation sets were considered with varying levels of solar PV and wind penetration to analyze paths of gradual renewable energy integration. Four cases have been simulated, as depicted in Figure 4, with a mixture of firm thermal generation capacity with 44 subcases of increasing renewable penetration and a ratio of 2:1 for solar PV to wind generation. The weather data are from 2018 and includes correlated minutely measured and geospatially-aggregated solar irradiance and wind speed from 60+ weather stations. Within each subcase, the gap between generation and measured minutely load for 2018 was analyzed following generation MOO to minimize system imbalance and operational cost.
Figure 4. Proposed procedure for hybrid economic dispatch and clustered unit commitment towards analyzing the limits of renewable generation with operational flexibility. Per scenario, simulations were run chronologically for a year of minutely data to capture high renewable variability.
Energies 16 01999 g004

3. Economic Load Dispatch Problem Formulation and Optimization

3.1. Problem Formulation

On the pathway to increased future integration of VRE resources, planning for the cost-effective dispatch of firm, controllable, thermal generation is essential to meet demand due to renewable energy generation variability. A minute-based economic dispatch is used to capture the capabilities of firm generation to complement solar PV and wind power variation towards gradual renewable integration. Objectives for the optimization are to minimize imbalance between generation and load, as well as the price of generation operation including fuel/consumables, operation and maintenance, and fuel heat rate using each firm generation type. Decision variables considered for the system are the scheduled generation output from three firm generation types, i = 1 , 2 , 3 , i.e., coal and natural gas of the combined cycle and combustion turbine type, respectively, with units distributed across Kentucky.
Thermal generation clustered unit constraints, such as ramping rate, i.e., the ability to alter power output in each minute, and generation capacity limits must be considered to evaluate the time constrained output. In clustered unit commitment, the capacity limits are dependent upon the rated power capacity from all distributed units in that group. The power output of each generator, P i ( t ) , is bounded by two mathematical inequality sets as described by:
P m i n P i ( t ) P m a x , P m a x R R i P i ( t ) P i ( t 1 ) P m a x R R i ,
where a maximum rated capacity, P m a x , and minimum generation, P m i n are specified for each generator type, and the power variation for each time step is limited by the generator ramping rate, R R i .
From these generation-specific operational limits, a power output is selected:
min I ( t ) = | i = 1 3 P i ( t ) + P r e n ( t ) P L ( t ) | ,
to minimize the power imbalance, I ( t ) , between load, P L ( t ) , and generation considering renewable, P r e n ( t ) , and firm capability, P i ( t ) . Minimal imbalance is an objective of the optimization, as the US regional operation is coordinated through the controls of utilities and balancing power authorities within the interconnected large power system.
With a scheduled power output from each generation type, the amount of fuel needed to reach that power output and the overall cost of generation are calculated. Cost per thermal generation dispatch within a minute of scheduling, P r ( t ) , is calculated by:
min P r ( t ) = | i = 1 3 ( C g + C o n i + M C i ) · P i ( t ) | , where C g = H R i · F C i .
where the running cost of the generator, C g , is a function of the heat rate, H R i ; the fuel cost, F C i ; the fixed cost of consumables for emission reduction, C o n i ; and M C i the fixed cost of system maintenance.
Since thermal generation unit efficiency varies with percentage output for different unit types, heat rate is calculated using the heat requirement for power considering currently scheduled generation following:
H R i = a · P i ( t ) 2 + b · P i ( t ) + c P i ( t ) ,
per each generation type with thermal coefficients, a , b , c . Heat rate integration approximates the running cost of thermal generation at selected output power while considering operational limitations.

3.2. Optimization Method

An augmented differential evolution (DE) MODE algorithm was developed based on the concept initially proposed in [47] and adapted to solve the linear programming (LP) dispatch problem. A recent systematic review of optimization methods for unit commitment problems, in [40], documents the advantages of evolutionary optimization, such as DE, in mapping the feasible solution space, while handling more complex formulations without simplification, which may enable scaled application of the general method to larger case studies. In addition to the advantages that evolutionary algorithms may better handle more objectives and complexity, and for enabling the trade-offs between conflicting feasible solutions, it has been shown in previous studies that they can support integrated decision making [50].
The optimization was integrated into the hybrid economic dispatch and clustered unit commitment model, as depicted in Algorithm 1, with a solution selected per minute as the minimal cost thermal dispatch from the minimal generation/demand imbalance set from multiple populations, as depicted in Figure 4. In the following description of the optimization procedure, population is used in place of iterations or the number of evolution generations in order to avoid possible confusion with electricity generation.
Algorithm 1 Pseudo-code of the implemented multi-objective optimization algorithm for economic load dispatch based on differential evolution.
Create an initial population G 1 , p with designs of selected quantities from the firm generation types
while stopping criteria is not satisfied do
    for each population, p, in  G n , p  do
        Sample random indices R
▹ Mutation
         G M , n , p G n , p [ R [ 0 ] ] + F ( G n , p [ R [ 1 ] ] G n , p [ R [ 2 ] ] )
        if  R A N D ( 0 , 1 ) C R  then▹ Crossover
            G U , n , p G M , n , p
        else
            G U , n , p G n , p
        end if
        if  f ( G U , n , p ) f ( G n , p )  then▹ Selection
            G n + 1 , p G U , n , p
        else
            G n + 1 , p G n , p
        end if
    end for
     n n + 1 ▹ Increment to the next iteration
end while
For initialization, the designs (i.e., sets of firm generation output) within an initial population vector of the first generation are determined through uniform randomization:
g n , p , d = g p , l o w + ( ( g p , u p g p , l o w ) R A N D p ( 0 , 1 ) ) ,
where d is the design index; p, the population index; n, the generation index with n = 1 to indicate the first generation; G p , l o w , the lower population bound; and G p , u p , the upper population bound.
To expand the search space, the designs within a population G n , p are mutated in order to create a new population ( G M , n , p ):
g M , n , p , d = g n , p , r 1 + F ( g n , p , r 2 g n , p , r 3 ) ,
where r 1 , r 2 , and r 3 are distinct design indices selected from a random permutation that cannot be equal to d, and F is the scaling factor, producing more population diversity as it is increased and is typically set within the range of (0, 2) [47]. Based on designs from the target ( G n , p ) and mutated ( G M , n , p ) vectors, the cross-over process determines a vector of trial designs ( G U , n , p ) as follows:
G U , n , p = G M , n , p if R A N D ( 0 , 1 ) C R G n , p otherwise ,
where C R is the cross-over probability. It should be noted that a random value for each of the individual design variables is generated as denoted by the R A N D ( 0 , 1 ) function. The final step of selection compares the evaluations of the objective function for G U , n , p and G n , p to improve the G n , p for the next generation:
G n + 1 , p = G U , n , p if f ( G U , n , p ) f ( G n , p ) G n , p otherwise .
This multi-step process, described in Algorithm 1, is repeated until a stopping criteria, represented by the maximum number of iterations, is satisfied. The DE algorithm employed an initial random population, and has been applied with a population vector of 40 solutions (20× the number of objectives), a scaling factor, F, of 0.5, and a crossover probability, C R , of 0.7 as suggested by the primary reference [47]. The final population provides a trial vector which populates a Pareto space of optimal designs and represents the trade off between operational cost and total number of imbalances in the system. The minimum imbalance dispatch at the lowest cost is selected per minute due to the potential for large cost penalties for significant, long-lasting imbalances.
Numerous trial studies were performed to ascertain the set-up of parameters for the optimization algorithm. For each minutely optimization, the number of populations to be set for the stopping criteria was trialled from 10 to 400 using the correlated weather and load data across the month of January with both the MODE and non-dominated sorting genetic algorithm 2 (NSGA-II) algorithms. For each population size, the amount of short term undergeneration was compared and the reduction trend with the increasing number of populations was noted. The performance of the DE algorithm was superior to the NSGA-II algorithm results in terms of accelerated improvement for minimizing imbalances and cost. To give the best possible results for the case study, optimizations were conducted at the maximum considered of 400 populations per time step.
All 176 subcases of solar PV and wind power generation within this study were simulated using Python in parallel with each generation portfolio solved on a separate core of a large high-performance computer (HPC). The optimizer used Intel(R) Xeon(R) Gold 6144 CPUs with a frequency of 3.50 GHz, which could run 400 iterations per timestep in 1.3 s for an overall simulation runtime of approximately 8 days per subcase for 525,600 timesteps. The procedure illustrated in Figure 4 can be performed for different locations and regions and is scalable to larger power levels.

3.3. Input Data and Assumptions

Input data for an optimization case study was sourced from measured data across the state of Kentucky and used assumptions for generator operation in-line with actual utilization. Minute resolution load data were measured across the service area of the Louisville Gas and Electric and Kentucky Utilities, part of the PPL Corporation family of companies.
Bounds on operational flexibility are derived from real generator characteristics. Natural gas combustion turbine (NGCT) generation, for example, has regulatory limits on maximum capacity due to its large emissions output. Coal generation, the slowest to ramp up and with low turn-down flexibility, is used as a base-load with a minimum power output near 40% of rated capacity due to its long starting/stopping time. Coal maximum capacity varies each day depending on coal generation used to meet load within the year 2021. When the maximum capacity changes between days, so does the minimum base load generation. Natural gas generation comprises two types: combined cycle (NGCC) and combustion turbine. The ramp rate, heat rate coefficients, fuel cost, consumables cost for emissions reduction, and maintenance cost for fuel generation types are summarized in Table 1.
Capacity factor of solar PV and wind turbine power output is defined as the ratio of current output to maximum capacity and was derived from measured data and expected device parameters. Solar irradiance and wind characteristics, which were employed to create an aggregated capacity factor, were collected from the MesoNet, a network of 60 weather stations distributed throughout Kentucky [51]. Wind turbine capacity factor was derived from wind speed assuming a cut-in speed of 2.5 m/s, a nameplate wind speed of 13 m/s, and a cut-out wind speed of 30 m/s.
The solar PV capacity factor corresponds to one of the best case generation scenarios with relatively predictable power output through the day and low cloud cover, as shown in Figure 2a. The wind capacity factor, while suffering from relatively large variability, complements daily solar cycle generation and seasonal power output reduction with generation during the night and across the colder months, as illustrated in Figure 2b. As an illustration of the solar and wind resources, average capacity factors per week are plotted in Figure 3 together with temperature measurements sourced from data collected at the E.W. Brown solar farm owned by LG&E and KU [52]. The combination of temperature and capacity factors indicate a strong potential for synergistic renewable deployment with wind peaking in the colder months and solar peaking in the warmer months.
For each predefined mixture of firm generation types, 44 sub-cases of varying renewable penetration were simulated with a 2:1 ratio of solar power to wind power generation. Factors not included in the modeling were transmission losses, interconnection costs for improvement, stability analysis, and transmission line limitations. Trading or transfer between external regions is not considered and all energy is generated and consumed within the region. The maximization of VRE utilization was prioritized and sufficient land surface (acreage) was assumed to be available for renewable deployment. Additionally, all generation was assumed to be available for commitment across the year with no downtime or maintenance required.

4. Minutely Economic Dispatch Case Studies

4.1. Pathways to Decarbonization Scenarios

Eight scenarios were proposed and studied to better understand the impact of thermal generation operational constraints with gradually integrated VRE generation. Four of these scenarios were optimized using economic dispatch while the remaining four were derived for cost and emissions analysis. Within each scenario, firm capacity portfolios were defined such that their combined capacity would meet the current generation capability within the LG&E and KU service area.
The four simulated scenarios are meant to capture the influence of gradual integration of solar and wind resources and firm generation flexibility: C S , the current energy portfolio with solar; C S W , the current portfolio with solar and wind; N G S , replacing all coal with natural gas and solar; and N G S W , natural gas-dominant generation with solar and wind. The additionally derived scenarios include the current generation portfolio, C; the current portfolio converted to all natural gas, N G ; the introduction of carbon capture and sequestration, C C S S W ; and the introduction of hydrogen fuel cells, H S W .
Gradual renewable adoption was simulated within each scenario by varying the rated capacity for solar PV from 0 to 20 GW and for wind turbines from 0 to 10 GW. In order to assess the VRE penetration impacts and effective economics, the maximum capacity of solar PV and wind was sized to supply two times the maximum demand. For the example land-locked region of Kentucky, hydropower is limited in availability to a maximum 143 MW. The generation portfolios studied for each scenario are summarized in Table 2.

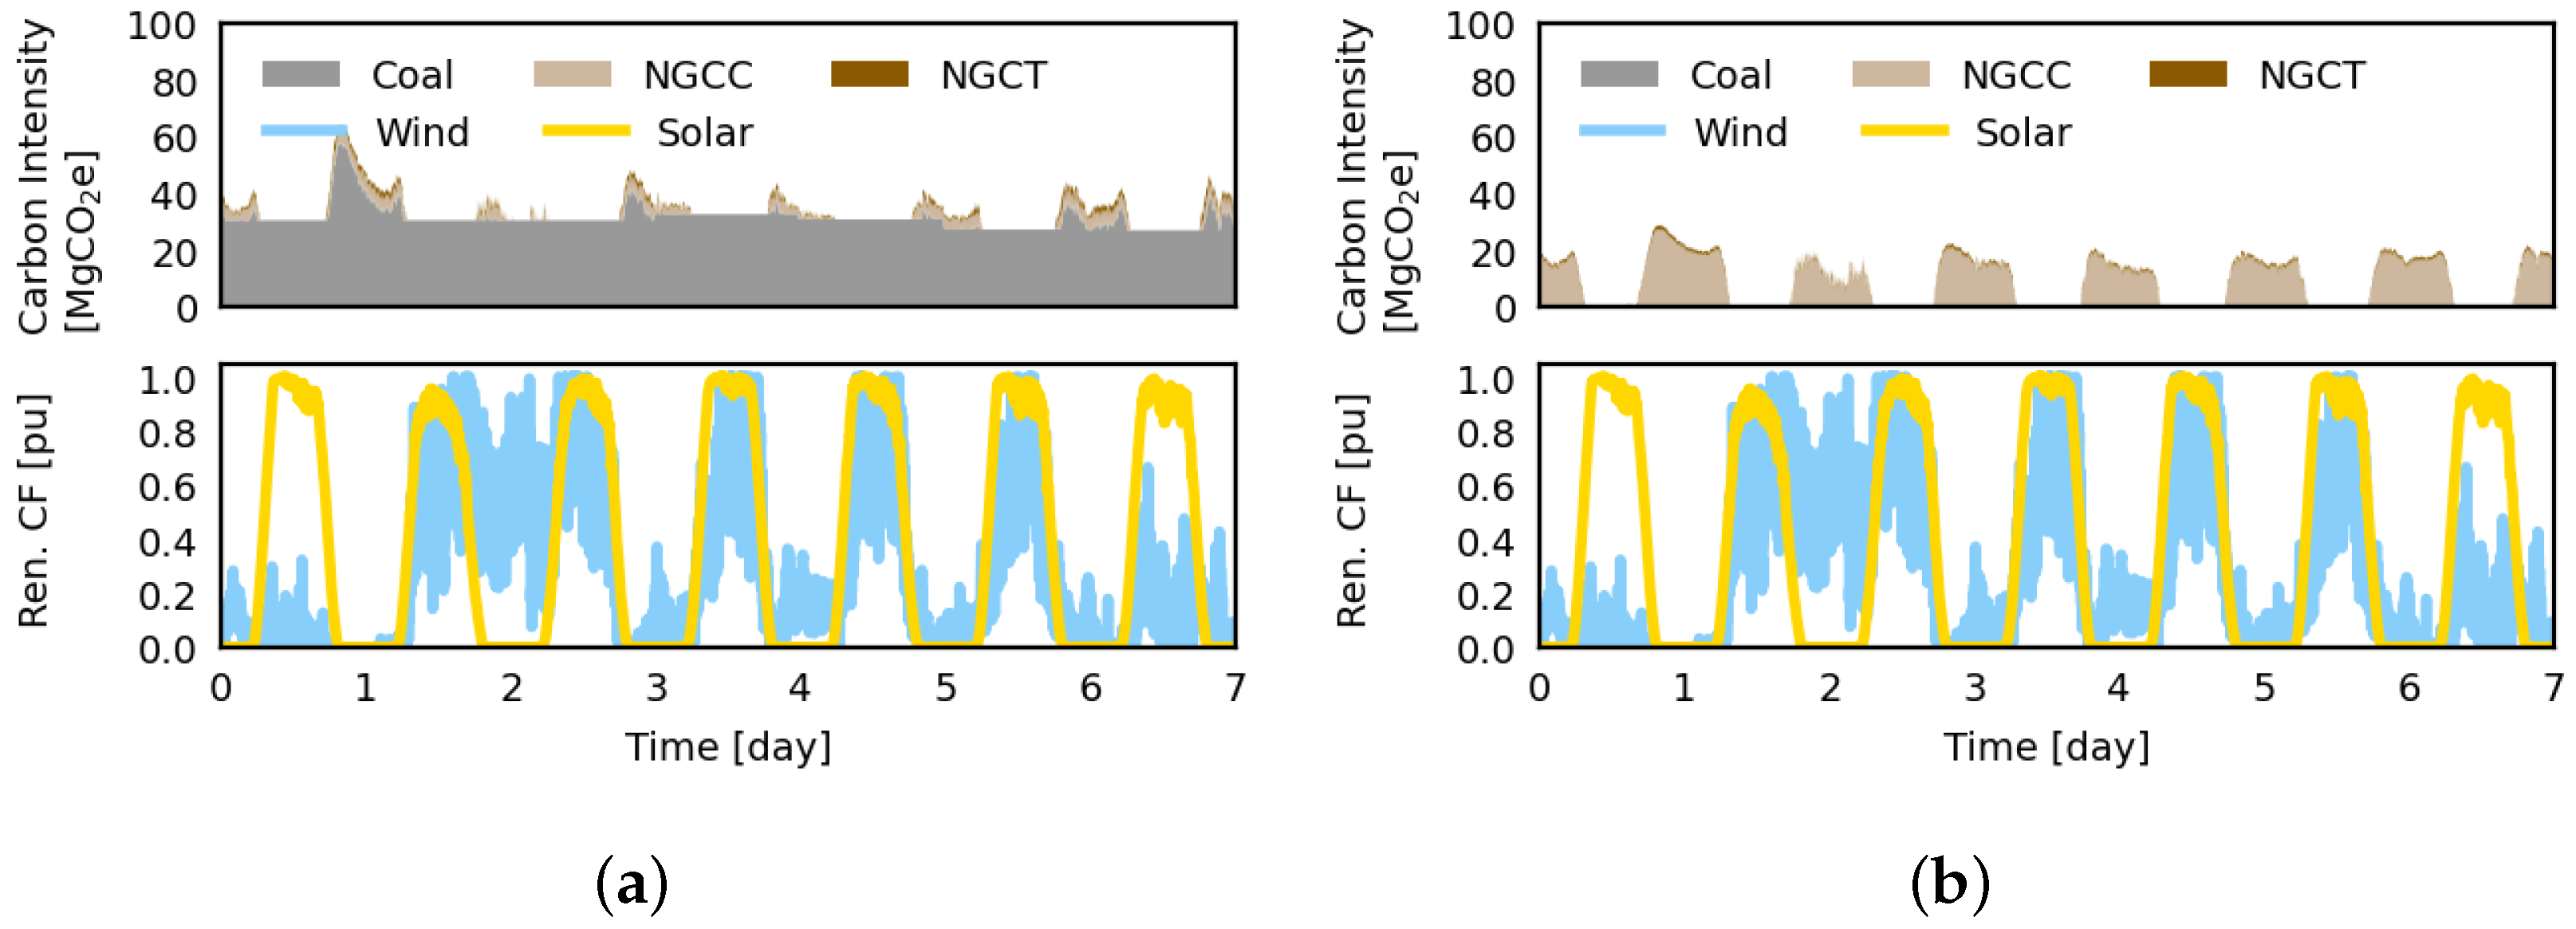
4.2. Simulation Results

Economic dispatch results with increasing penetration varied significantly depending on the season and mixture of firm thermal generation. For coal-dominant cases, it was found that renewable integration is limited due to low ramp rates and turn down capability of the coal generation. Natural gas dominant generation benefits from more agile ramp rates and turn down capabilities, allowing larger renewable capacity integration. In the full year results for the four simulated cases shown in Figure 5 the coal-dominant cases (a) and (c) have to curtail renewable generation significantly as compared to natural-gas dominant cases (b) and (d).
Two weeks are exemplified from case C s w in Figure 6a,b, one with the highest combined average renewable capacity factor from May 8 through 14th and one with the lowest from January 8 to 14th, respectively. It is visualized that when significant overgeneration occurs it cannot be used to meet demand due to the inflexiblity of baseload operation from coal. Additionally, the limited flexibility of generation leads to large utilization of NGCT in the low capacity week in Figure 6b to close the gap, costing more to operate and in CO2 emissions.
Figure 5. Full year minutely simulation of optimal power dispatch for 4 decarbonization scenarios: (a) C S ; (b) N G S ; (c) C S W ; and (d) N G S W . Compared to natural gas at the same solar PV ratings, coal-dominant cases suffer from a significant under-utilization of available VRE generation.
Energies 16 01999 g005
Figure 6. Example weeks of economic dispatch with a coal-dominated scenario for (a) a high renewable capacity factor week from May 8–14 and (b) low renewable capacity factor week from January 8–14. Renewable output may need to be significantly curtailed compared to natural-gas dominant generation due to slow turn-down and start-up times specific to coal operation as a base load.
Energies 16 01999 g006
Natural gas-dominated firm dispatch mixtures from the N G s w case are shown in Figure 7 with significantly increased VRE utilization in Figure 7a and sufficient NGCC capacity and ramping capabilities to close gaps without requiring NGCT in Figure 7b. The transition from coal to natural gas dominant generation enables greater potential to decarbonize with the gradual integration of VRE resources, while greatly decreasing thermal generation emissions.
Solar and wind resources are expected to complement one another because solar PV generation outputs during the day and wind generation yielding considerable output during the night. Seasonal variation also drastically changes output with maximal solar capacity factor in the summer, while wind capacity factor is improved in the cooler months (see also Figure 3). The combination of solar and wind resources allows for more renewable penetration than either solar and wind alone due to their time shifted generation periods.
Figure 7. Example weeks of economic dispatch with a natural gas-dominated scenario for (a) a high renewable capacity factor week from May 8–14 and (b) low renewable capacity factor week from January 8–14. Utilization of natural gas-dominant generation allows for greater renewable potential due to faster ramping rates.
Energies 16 01999 g007

5. Results and Discussion

5.1. Technical Feasibility

In order to ensure both the technical and the economic feasibility, the resource adequacy for the four scenarios of mixed firm generation with increasing VRE was studied for imbalances represented by the difference between load demand and generation. Limits for minute averaged generation power deficits vary greatly depending on the large interconnected system with particular definitions by regulators [13,53,54], or previously proposed in the scientific literature, e.g., [29,55,56]. Post-processing was used to monitor simulation imbalances larger than a threshold of 100 MW or 1.5% of the maximum expected load. Consecutive imbalances are considered long-term or significant if larger than this threshold for longer than 15 continuous minutes as in [46].
None of the four scenarios suffer from long term undergeneration even at high VRE penetration indicating resource adequacy for all four scenarios with the accompanying thermal generation. If there were to be deficits smaller than 100 MW for shorter than 15 min due to short-term uncertainty of renewable generation, peaking reserves or energy storage rated at 100 MW, 25 MWh can handle minute to minute imbalances. The introduction of wind resources may increase minute to minute or short-term undergeneration due to large minute-to-minute variability relative to the thermal generation ramping capability.
Of the four optimized scenarios, there are two major groups, coal-dominant cases with a baseload and small ramping rate, colored in grey, and natural gas-dominant cases with two variant generation types of slower and faster ramping rates, colored in beige. Total annual overgeneration is depicted in Figure 8 with four distinct trends correlated to the dominant thermal generation type and the combination of solar and wind. Renewable penetration, used throughout for the differentiation between subcases, is defined as the ratio of annual renewable energy generation to annual energy generation throughout the year. Typical methods for handling overgeneration, which may increase with the renewables penetration, include regional energy trading and power flow, energy storage, and curtailment.
Within all four thermal generation mixtures, a limit level may be considered for integrated VRE capacity related to significant annual overgeneration. At low values of overgeneration, under two example levels of 0.1 and 1 TWh, respectively, natural gas-dominant cases can effectively use approximately double the amount of renewables without significant curtailment compared to coal-dominant generation. This effect benefits of the increased operational flexibility of natural gas generation including ramp rate and turn down capabilities. Overall, the integration of both solar PV and wind generation allows for increased effectiveness due to distributed temporal generation and seasonal capacity factor variation with wind being better in the winter and night and solar PV being best during summer days.
Figure 8. Annual overgeneration for four generation portfolios plotted together with two example imbalance levels at 0.1 and 1 TWh, respectively.
Energies 16 01999 g008

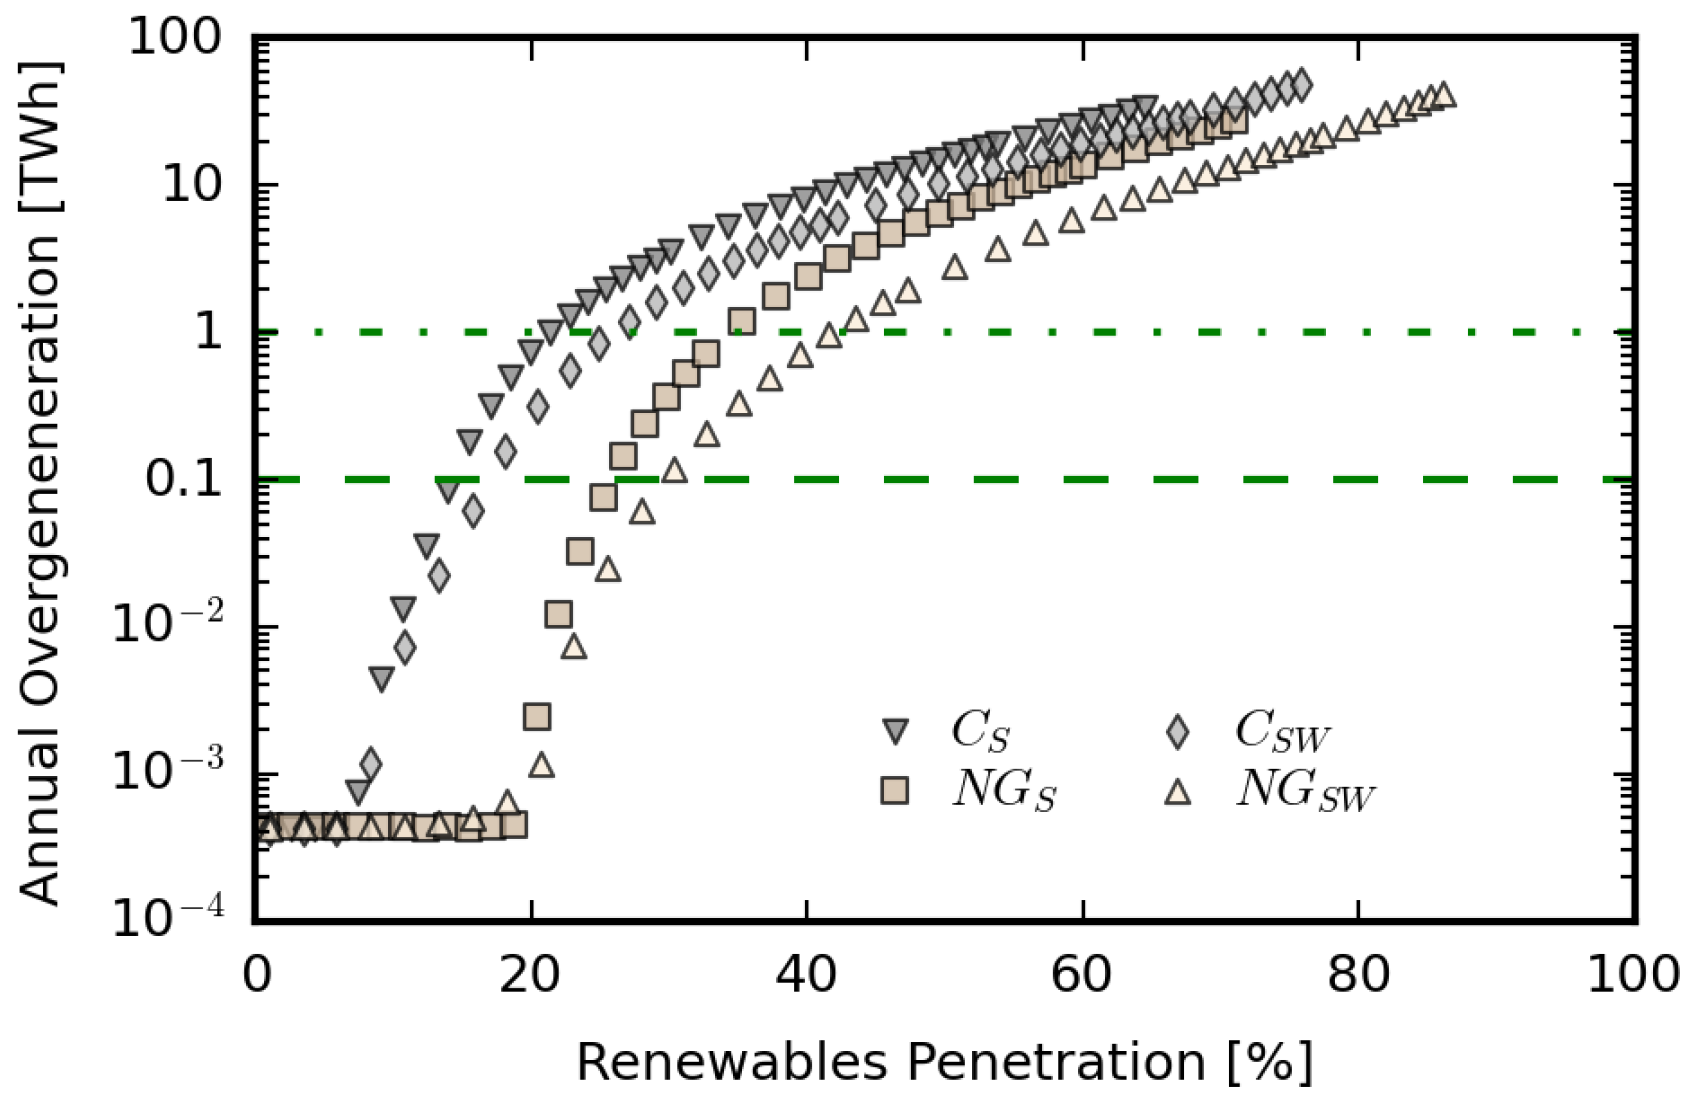
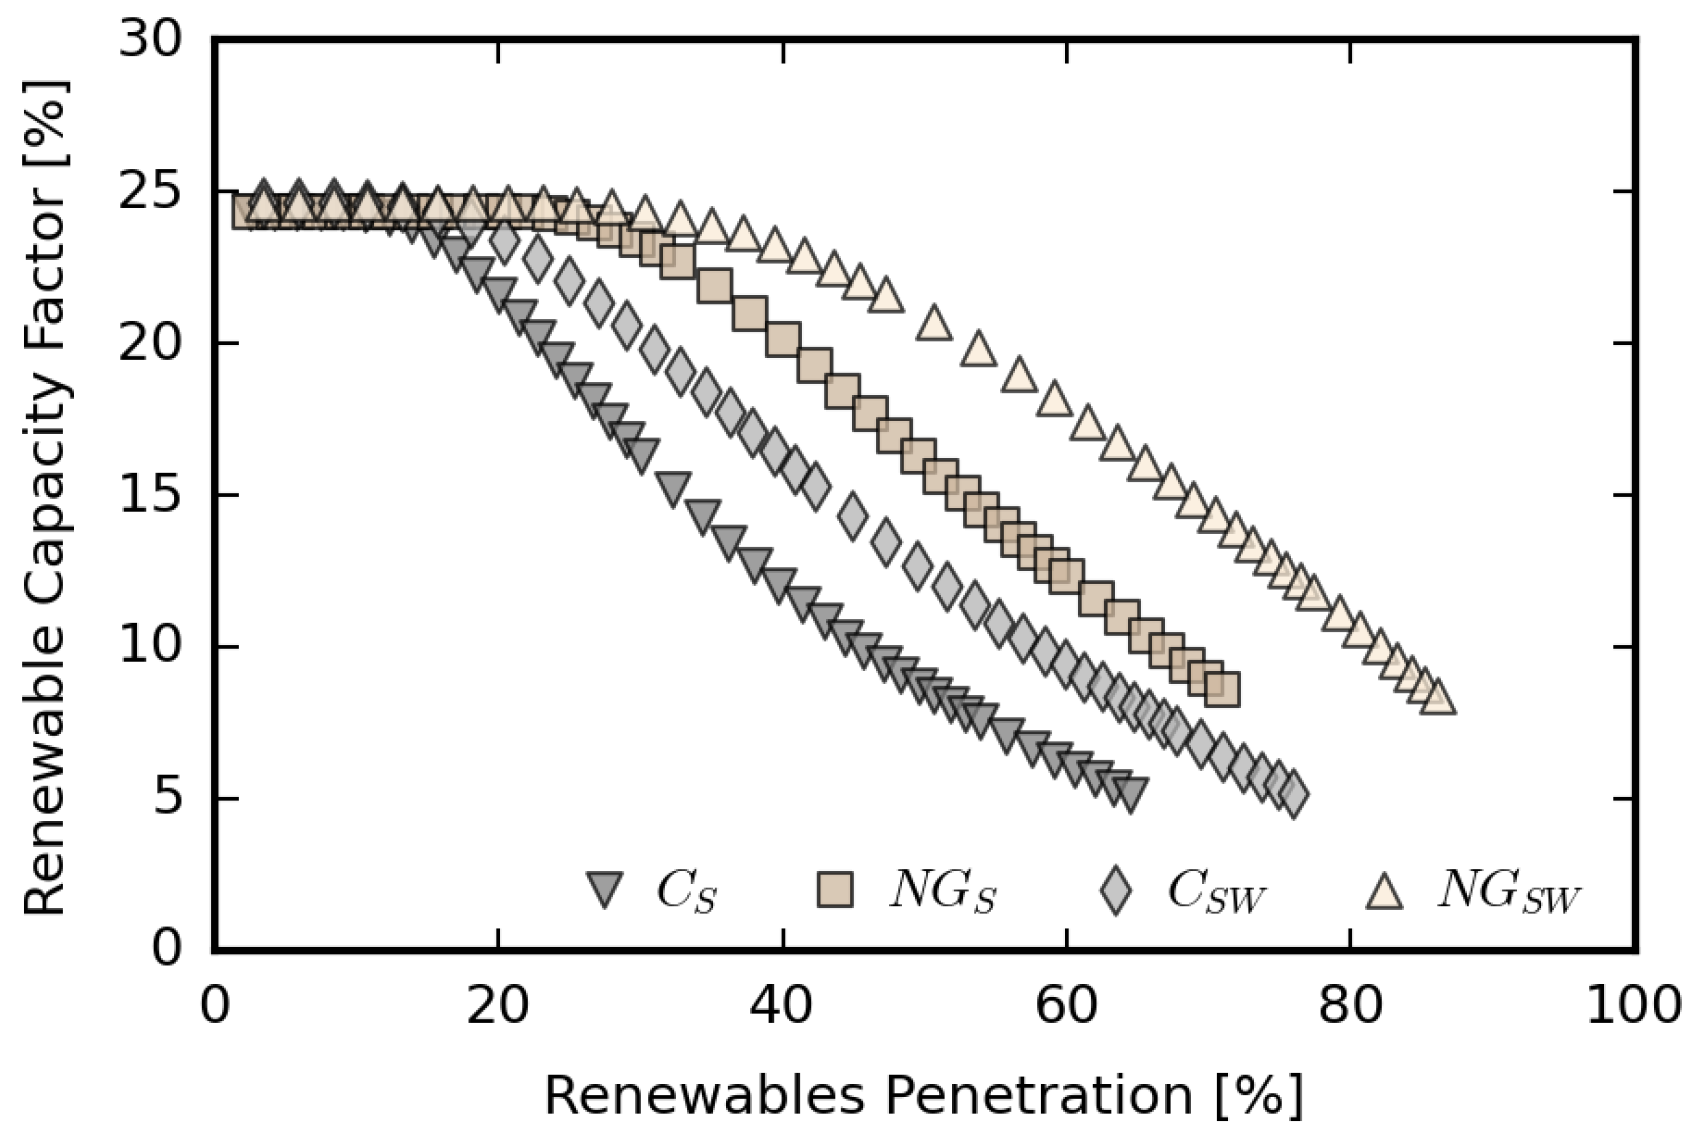
5.2. Effective Renewable Integration

To analyze the impact of VRE introduction on CO2 emissions over time, carbon intensity can be approximated as the product of thermal generation per minute and the median of the published total life cycle emissions factor per generation technology recently published by NREL [57]. Example results for coal and natural gas dominant generation are shown in Figure 9a,b, respectively, with renewable capacity factor as the normalized output of renewable generation relative to maximum capacity. The expected outcome for a theoretical optimization with carbon intensity as a third objective is reflected in Figure 9b, as natural gas is scheduled to match demand with half of the carbon emissions of coal. The switch from coal-dominant generation to natural gas-dominant generation halves the expected annual CO2 emissions as it will be later discussed with portfolio-level analysis.
Quick and large spikes in carbon intensity, shown in Figure 9, occur to compensate for variability and periods of low VRE output in both scenarios correlating with periods of fast ramping. Distributed solar generation with low minute to minute variability ultimately leads to greatly reduced spikes in the intensity of CO2 emissions when compared to more rapidly varying wind power output. Due to the short nature of the large ramping spikes, short-term energy storage may be used to mitigate significant portions of carbon output to compensate for large variability. The heatmaps from Figure 10 illustrate that the majority of the overgeneration within the studied cases occurs during the daytime hours revealing a potential for shifting the generated energy in time through demand response or storage.
Overgeneration due to high renewables penetration diminishes the benefits of increased renewable energy, as curtailment, trading, or energy storage may be needed to shift excess generation or demand in time. A renewable capacity factor was calculated considering overgeneration from the output of the economic dispatch to quantify deterioration in renewable economics with curtailment:
C F = E s + E w E o 8760 · ( R C s + R C w ) ,
where an E s and E w are the annual solar and wind energy generation, respectively, and E o is the annual energy overgeneration, over the 8760 h of the year and R C s and R C w are the maximum solar and wind power capacity, respectively. The results for the four scenarios plotted in Figure 11 show a decline in renewable generation effectiveness with increased penetration and curtailment. Renewable capacity factor for coal-dominant cases diminishes after 17–20% while potential for natural gas-dominant cases decreases after 30–35% due to their faster turn up and turn down rates.
Figure 9. Example week of economic dispatch carbon intensity for a high renewable capacity factor weeks with (a) coal-dominant support and (b) natural gas-dominant support, respectively. Large spikes in carbon intensity occur in response to renewable power fluctuation. Quick spikes appear to peak and meet demand which can be compensated for with short term energy storage or demand response.
Energies 16 01999 g009
Figure 10. Positive imbalance magnitude and frequency increase with installed renewable energy capacity as overgeneration does not cover unfulfilled demand. Shifting energy in time to meet temporal mismatch between renewable output and demand increases utilization potential.
Energies 16 01999 g010
Increased renewable penetration studies revealed constraints towards maximizing renewable economics. The effect of improved operational flexibility of natural gas over coal is reflected in Figure 8 as more renewable energy can be effectively hosted and integrated into the system. Once a level is reached in VRE penetration, additional capacity fails to contribute to covering demand and limited contributions to emissions reduction may result from VRE output in low capacity periods. Shifting energy demand and/or overgeneration in time and/or the deployment of low-carbon firm generation is beneficial to allow for increased utilization of VRE generation.

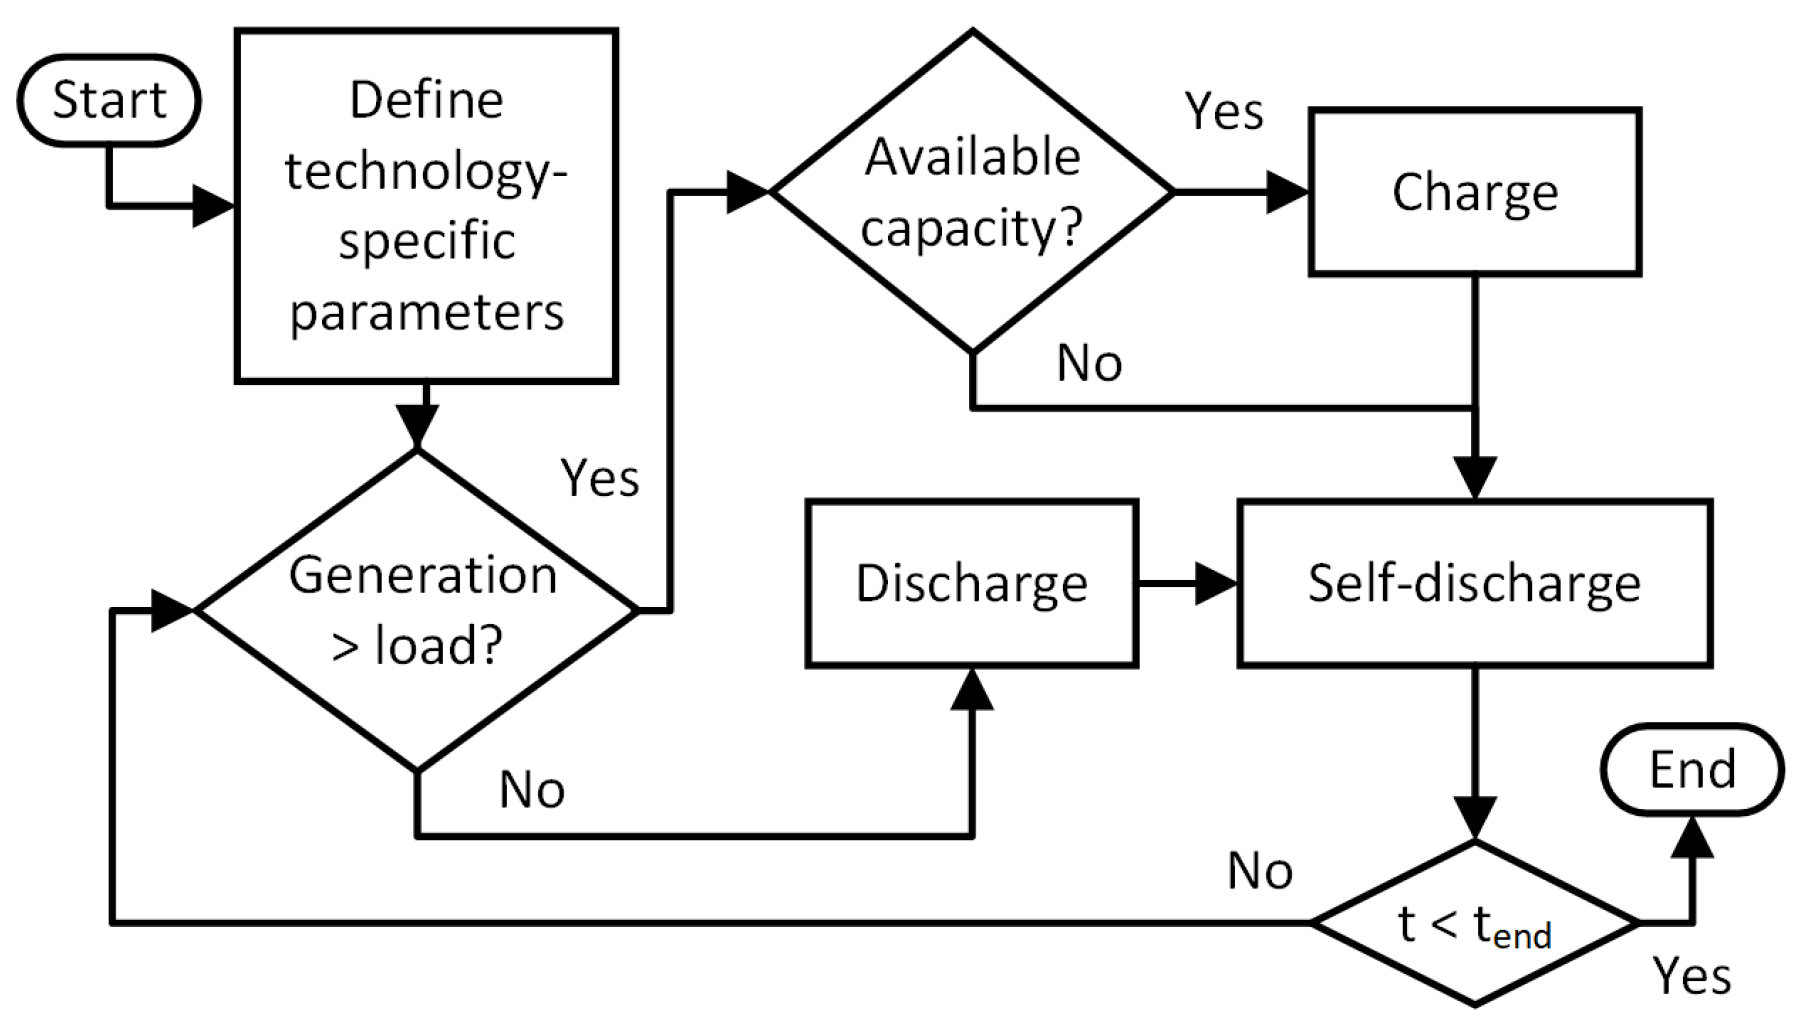
5.3. Uncertainty, Peaking Reserves, and Energy Storage

Previous studies by other authors have discussed the effect on unit commitment of uncertainties, due to, for example, variability in operational downtime, expected load, and renewable energy output [40,58]. The application of our minute-to-minute proposed method, which is tightly optimized for expected weather data able to capture the inherent variability of wind and solar PV output, would benefit, in principle, from advanced and precise forecasting [45]. Furthermore, in order to assess the capability of peaking reserves and energy storage to compensate for weather-related uncertainty, stochastic evaluation was undertaken. The results of a theoretical comparative weekly example study between the optimal dispatch for a natural gas dominated case to the same dispatch with a 15% largely reduced renewable energy output is presented in Figure 12a,b, respectively.
Minute-based chronological imbalance analysis enables an additional step to systematically size energy storage, such as the battery employed in this theoretical example, to resolve the uncertainty-caused deficit. A proposed post-processing procedure considering energy and power capacities, round trip efficiencies, and self-discharge rates is presented in Figure 13. The power and energy capacity for the Li-Ion battery in this example was iteratively selected based on minimizing undergeneration and battery energy capacity.
Figure 11. Capacity factor for the studied cases, including possible curtailment at higher renewable penetration.
Energies 16 01999 g011
Figure 12. Example week of economic dispatch for in the critical month of January for a gas dominated system with for 6.5 GW solar PV and 3.25 GW wind capacity with (a) dispatch with pre-defined weather data and (b) reduction in VRE output by 15% post-dispatch and battery energy storage for matching load demand.
Energies 16 01999 g012
The theoretical example has been purposely selected to illustrate visible differences in Figure 12 and numerically show how chronological minutely simulation can track relatively small power deficits that can accumulate over time, requiring significantly large energy storage capacity and/or fast-ramping firm generation. The example natural gas dominated case in the critical month of January has 6.5 GW solar PV and 3.25 GW wind capacity. For a reduction in renewable power output by 15% through the week, energy storage is sized to 0.5 GW and 9 GWh to compensate for shortfalls in generation. The very large battery capacity required in this extreme case also highlights the benefit of alternatively employing peaking reserves, such as NGCT generation.
Increased renewable generation integration may expose the power system to sharp changes due to weather variability, necessitating quickly ramping resources and/or energy storage. Time variation of available battery state of charge (SOC) for two case studies of a natural gas dominant scenario is plotted in Figure 14. The dips in the available SOC correspond to discharging to compensate imbalances on a minute basis. It should be noted that there are only very few and short periods without imbalances, such as those circled in blue in the month of March. There are also sharp drops in renewable power output leading to the very low SOC occurrences circled in green during summer and fall, respectively.
The rising deployment of electric vehicles (EV) opens up additional opportunities for distributed energy storage with managed control for charging and vehicle to grid (V2G) capability [37,59]. In principle, the EV batteries have great potential for storing renewable overgeneration during the day and for supplying the grid during evening and night. Additionally, mixtures of diverse energy storage systems including hydrogen, and centralized storage may prove greatly beneficial towards meeting the energy deficit due to different operational timescales, efficiencies, and costs [15,27,60].
Figure 13. Proposed procedure for sizing of the energy deficit and potential solutions for a specified generation portfolio. Minute to minute variation largely defines reliability for systems with high renewable energy penetration and can be accounted for using a broad spectrum of technologies to shift energy when needed.
Energies 16 01999 g013
Figure 14. Battery energy storage sized to solve minutely imbalances with plotted available SOC across the year for natural gas dominant generation with (a) 20 GW of solar PV capacity, 10 GW of wind capacity, rated power of 4.6 GW, and energy capacity of 0.41 GWh; and (b) 6.5 GW solar, 3.25 GW wind, 2.5 GW power, and 0.112 GWh energy capacity. Dominant renewable generation significantly shifts the expected maximum peaking power to meet quick drops in VRE output and BESS energy capacity is non-linearly related to renewable capacity.
Energies 16 01999 g014

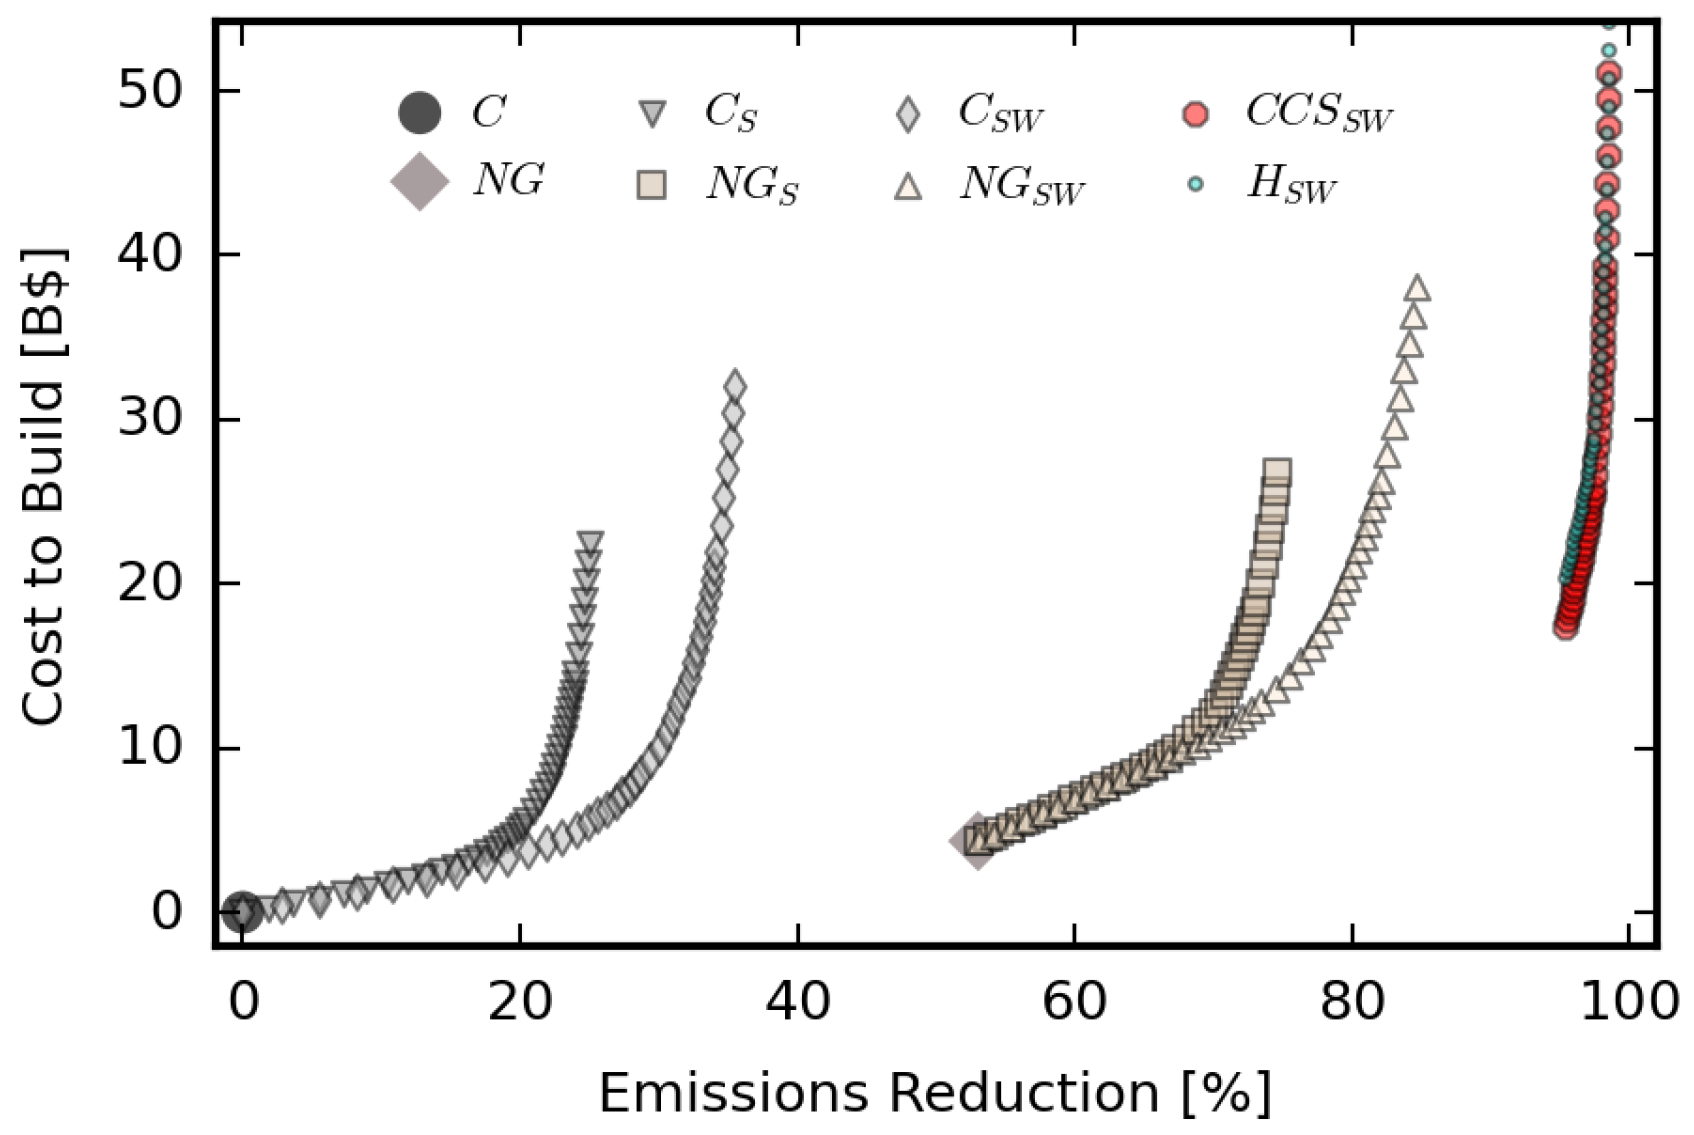
5.4. Cost to Build per Portfolio

Economic feasibility per scenario was quantified by approximating the cost to build additional generation to the current LG&E and KU generation portfolio, which is specified in Table 2 as C, using capital expenditure (CAPEX) construction costs and approximating the emissions reduction using the annual production per generation type similarly to previously published studies [9,23,39]. Table 3 summarizes the CAPEX construction costs from the 2021 NREL ATB [9]. Per portfolio, the cost to build was estimated as the product of rated generation capacity and that type’s CAPEX cost per kW. Emissions rates per generation type were also used as measured from LG&E and KU’s generation plants with hydrogen fuel cost to build and emissions approximated based on ongoing research. Renewable energy generation was assumed to be CO2 emission-less.
Eight scenarios were extrapolated from the four optimized cases described prior, assuming the same ramping rate and capacity for different technologies. The resulting CAPEX cost to build and emissions reduction relative to the current Kentucky generation portfolio, C or the large dot, is plotted in Figure 15. From 0 to 35% emissions reduction, there are many low-cost renewable options that are currently actionable. Coal-fired electricity generation is not only the most carbon-intensive generation technology, but also one of the least able to integrate intermittent renewables with diminishing returns for emissions reductions. For the existing portfolio, solar PV can be effectively integrated up to approximately 20% and furthermore, the combination of wind and solar allows for additional emissions reduction.
Transitioning from coal to natural gas generation results in a 50% reduction in emissions without renewable integration, as shown by the N G , the diamond, in Figure 15. The reduction in CO2 emissions with increased renewable penetration stagnates without firm generation with faster ramping rates or shifting in time to meet unfulfilled demand, in line with expectations based on findings published by other authors, e.g., [15].
Table 3. Table of CAPEX construction cost and CO2 emissions rates per generation type.
CoalNGCCCCSNGCTHydrogenSolarWind
CAPEX [$/kW]305588323041025270011211135
CO2 [lbs./kWh]200080080120080N/AN/A
Figure 15. CO2 emissions reduction vs. capital expenditure (CAPEX) cost to build relative to the current generation portfolio. Transition from coal dominant to natural gas dominant generation could reduce emissions by half. Solar and wind co-integration allows for increased VRE penetration as their generation timing is displaced from one another.
Energies 16 01999 g015

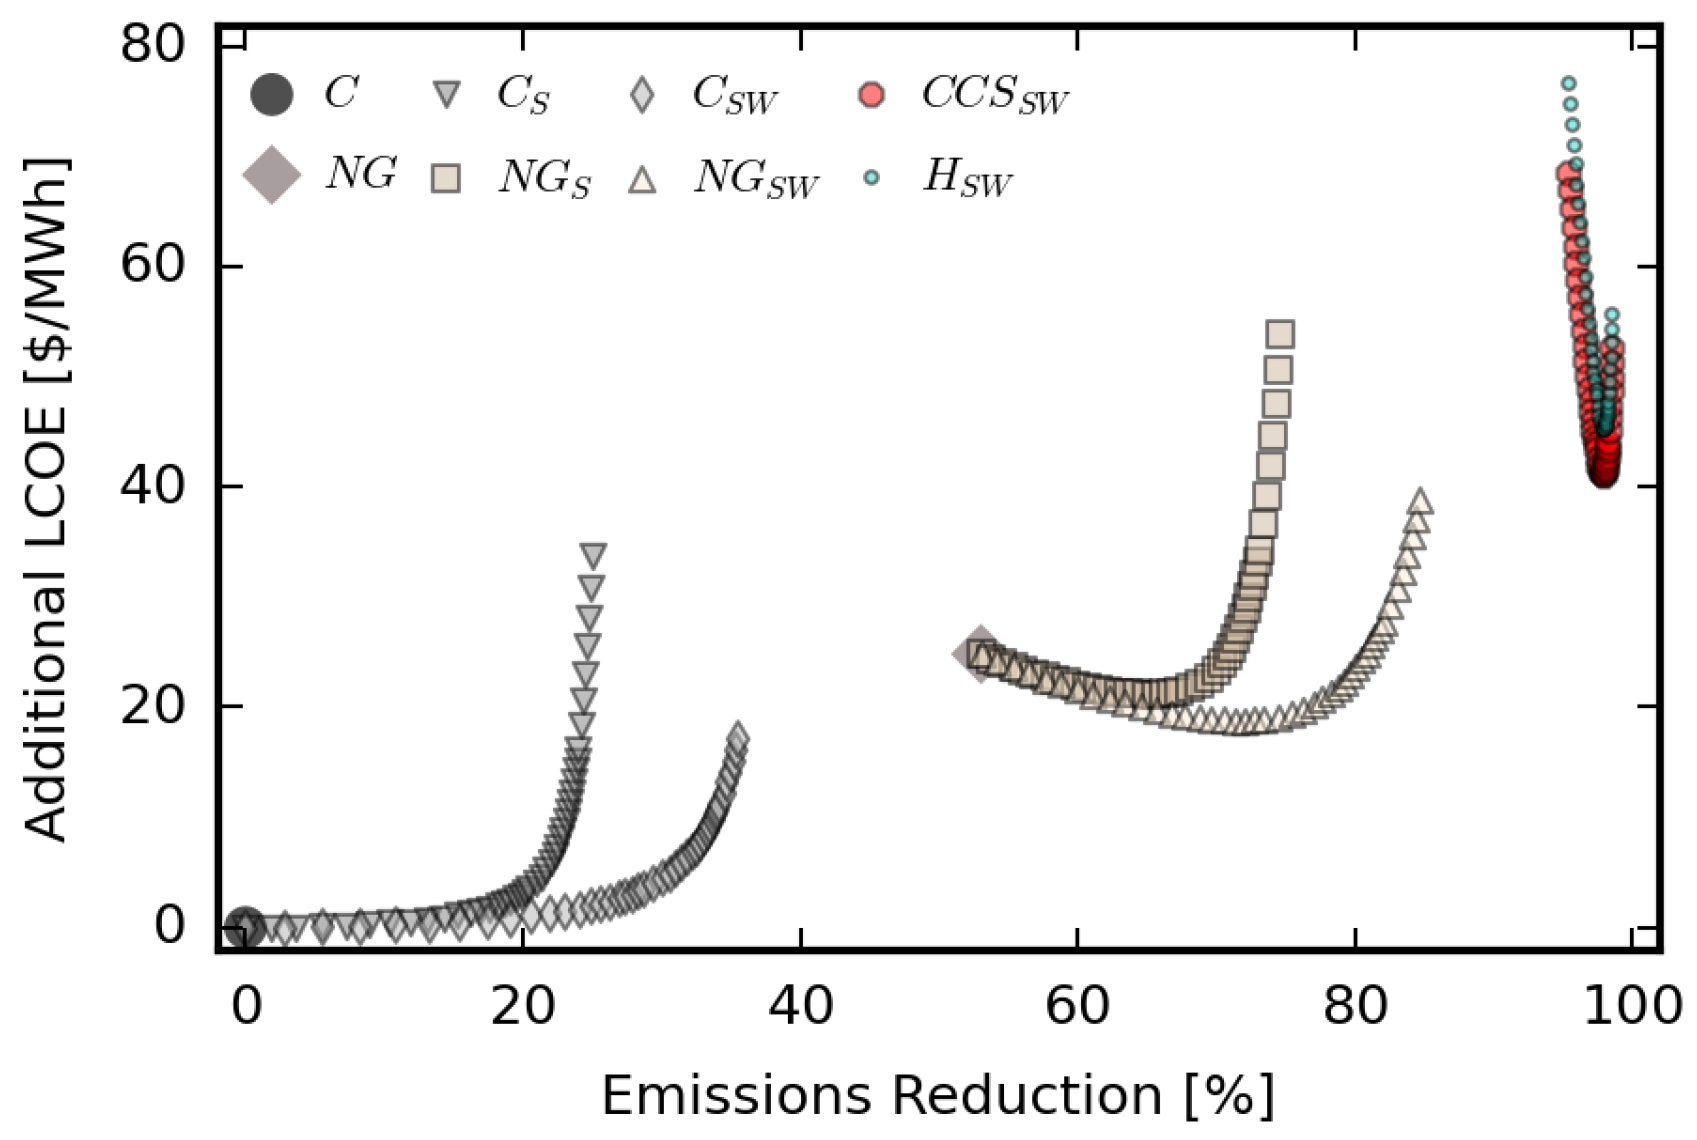
5.5. Levelized Cost of Energy per Generation Portfolio

A method is proposed to describe the levelized cost of energy (LCOE) of generation portfolios consisting of multiple generation types. Additional LCOE was calculated starting from the current generation portfolio to compare the lifetime cost of electricity generation per subcase over a 30 year period. The LCOE per generation source was derived from methods published in the NREL’s 2021 Annual Technology Baseline (ATB) [9] and adapted from the formulation described in [61] to summarize the portfolio cost by combining all generation technologies.
Combining LCOEs per generation type, the following relationship was used to approximate the combined LCOE ($/MWh) per portfolio:
L C O E = i = 1 7 F C R i C A P E X i + F O M i E D + V O M i + F C i E G i E D ,
where i is the generation type, including fossil-based and renewables; F C R the fixed charge rate or amount of revenue per dollar of investment collected annually to pay for the initial investment; F O M the annual fixed operation and maintenance cost; E D the total energy demand for the year of 2019; E G is the energy used from that generation type; V O M the variable operation and maintenance cost per MWh; and F C the fuel cost per MWh.
Technology-specific parameters, including FCR, FOM, VOM, CAPEX, and F C , were extracted from the NREL 2021 ATB based on 2019 data prior to COVID-19 related disruption. All fixed charge rates and operation and maintenance costs were assumed to follow conservative technology innovation with classes associated with the type of generation in Kentucky specifically solar-utility PV class 7, land-based wind class 4, and hydropower class 5 classifications. Hydrogen fuel is assumed to be readily available and equivalent to NGCC operation. The 30 year lifetime demand is directly copied from the sample year of minutely load. For each generation type, a ratio was implemented to LCOE per generation type to the total energy demand over the year, approximating LCOE if generation capacity was perfectly sized to annual utilization.
Trends in the cost and emissions resulting from renewable energy integration in the example study vary greatly depending on the dominant fossil fuel used for generation as shown in Figure 16. The addition of solar PV and wind resources to coal-dominant generation results in an additional LCOE near zero as the cost of installing more renewable resources negates the operational costs of thermal generation up to a limit. After this limit, which is approximately 20% for solar PV and higher for solar and wind combined, increases to generation capacity require significant capital investment.
Figure 16. Lifetime CO2 emissions reduction from current Kentucky generation vs. LCOE of generation portfolio construction and operation for a 30 year period. The introduction of VRE reduced emissions and the LCOE non-linearly increased with higher renewables penetration. Operation, maintenance, and fuel costs lead to an increased gap in cost between coal, natural gas, and low-carbon dominant cases.
Energies 16 01999 g016
In the case study, natural gas and low carbon thermal generation dominant scenarios require significant capital investment for capacity development with an initial peak in LCOE. Higher renewable generation results in emission reduction and offsets operational costs and the need for some thermal generation capacity, resulting in a lower cost. As renewable generation increases, there is a limit for this trend, around 70% with solar and 80% with combined solar and wind.
Towards the development of low-carbon firm generation, carbon capture and sequestration, as well as green hydrogen generation and storage, are emerging technologies to maintain control of generation timing while greatly reducing emissions. Carbon capture and sequestration technologies (CCS) capture and restrict carbon emissions from generation plants, resulting in greatly reduced emissions for firm capability. Hydrogen energy storage and thermal generation is another alternative, allowing for green electrolysis using overgeneration and thermal generation when necessary to fill in the gap. New combustion turbine and combined cycle capacity may be further developed and integrated with hydrogen and carbon-capture to additionally reduce—or completely eliminate—carbon dioxide emissions.

5.6. Kentucky Regional Case Study Specific Conclusions

The results of the case study indicate that moderate amounts of regionally dispersed solar PV generation, up to approximately 20%, could be integrated into the current portfolio at low costs without significant imbalances. Additional renewables up to 25% may be integrated without increases to additional LCOE if a balance of solar and wind generation is used due to their temporally shifted generation. At high renewable penetration, the benefit of additional renewable generation decreases as more generation has to be curtailed due to over-generation and the inability to shift generated energy to timely coordinate with load demand.
Deep decarbonization and renewable integration, from 20 to 80%, can be achieved with the replacement of older coal-fired units, which are unable to effectively adjust output for variable generating resources, with new natural gas generation. Transitioning from coal to natural gas generation also results in a substantial reduction in emissions, with more than 50% reduction possible even without renewable integration. Furthermore, replacing coal with natural gas generation also enables the effective integration of double the renewable generation when comparing overgeneration because of increased operational flexibility. Firm generation is currently necessary to maintain system reliability, and the integration of resources with greater flexibility can allow more immediate and effective investment in renewable energy generation.
Complete decarbonization between 80 and 100% necessitates the implementation of higher cost, emerging technologies, such as large-scale energy storage, potentially from EVs in V2G operation, large-scale demand response and electric power distribution virtual power plants, advanced nuclear, carbon capture, or renewable green hydrogen sources. New natural gas combustion turbine and combined cycle capacity can be built using current state of the art technology and integrated with hydrogen and carbon-capture to further reduce—or completely eliminate—carbon dioxide emissions. Current R&D is focused on improving the performance and efficiency and lowering implementation costs for such technologies.

6. Conclusions

The method proposed for optimized economic dispatch employs a minute-based approach that is able to consider the fast changes specific to variable renewable energy (VRE) generation and required measures to ensure the balanced operation of the electric power system. The method has been implemented with differential evolution algorithms and demonstrated through year-long simulations with detailed minutely resolution data for weather, load, and operational constraints, resulting in large-scale computational problems that have been paralleled and solved on high-performance computing (HPC) systems. The proposed chronological clustered economic dispatch method may support the analysis of different generation portfolios considering operational flexibility and renewables natural variability.
The generally applicable simulation procedures have been applied for a regional case study in Kentucky, USA with eight different scenarios including varying mixtures of firm and renewable generation capacity. These provided examples for evaluating feasibility, estimating overgeneration and the effectiveness of VRE integration, cost to build, and carbon dioxide emissions reductions, alongside a proposed method for mixed generation portfolio levelized cost of energy (LCOE). The results illustrate the advantages, in terms of improved operational flexibility for electricity generation and support for larger scale integration of renewables, for the faster ramping natural gas power plants, as compared with those using coal. The proposed minute-based methods are also suitable for sizing energy storage systems, which can further support the very large penetration of renewable energy generation.

Author Contributions

Conceptualization, D.D.L., A.P., A.A.H., M.D.M. and D.M.I.; Methodology, D.D.L. and E.S.J.; Software, D.D.L., E.S.J. and R.E.A.; Investigation, D.D.L., E.S.J. and R.E.A.; Formal analysis, D.D.L., A.P., M.D.M. and D.M.I.; Data curation, A.P.; Writing—original draft, D.D.L., A.P., E.S.J., R.E.A., A.A.H. and D.M.I.; Supervision, A.P. and D.M.I.; Funding acquisition, A.P. and D.M.I. All authors have read and agreed to the published version of the manuscript.

Funding

This research was funded in part by the National Science Foundation under Grant No. 1839289, the Department of Education’s GAANN Fellowship Program through the University of Kentucky Electrical and Computer Engineering Department, Louisville Gas and Electric and Kentucky Utilities (LG&E and KU), part of the PPL Corporation family of companies, and of University of Kentucky.

Institutional Review Board Statement

Not applicable.

Informed Consent Statement

Not applicable.

Data Availability Statement

Not applicable.

Acknowledgments

The support received by Donovin D. Lewis through an National Science Foundation (NSF) Graduate Research Fellowship under Grant No. 1839289 and through University of Kentucky Otis A. Singletary Fellowship, by Evan S. Jones through a US Department of Education (DoEd) GAANN Fellowship, and by Rosemary E. Alden through an NSF Graduate Research Fellowship under Grant No. 1839289 and through University of Kentucky, the L. Stanley Pigman Chair in Power Endowment is also gratefully acknowledged. The support of the Louisville Gas and Electric and Kentucky Utilities (LG&E and KU), part of the PPL Corporation family of companies, is gratefully acknowledged. Any opinions, findings, conclusions, or recommendations expressed in this material are those of the authors alone and do not necessarily reflect the views of the NSF, DoEd, University of Kentucky, LG&E and KU, and PPL.

Conflicts of Interest

The authors declare no conflict of interest.

Nomenclature

The following main symbols and abbreviations are employed in this manuscript:
ATBAnnual technology baseline
CCurrent coal-dominant energy portfolio case for example region
C S Adaption of C case with added solar generation
C S W Adaption of C case with added solar and wind generation
CCSCarbon capture and sequestration
C C S S W Adaption of N G S W case with full adaptation of CCS
CAPEXCapital expenditures
C F Capacity Factor
CfaTemperate, dry winter, hot summer Koppen climate classification
C g Running cost of generator
CO2Carbon dioxide
C o n i Cost of consumables for emission reduction
CPUCentral processing unit
C R Cross-over probability
d , p , n Design, population, and generation index
E D Total energy demand for the year 2019
E G i Energy used per generation type
E O Annual overgeneration
ERGISEastern Renewable Generation Integration Study
E S , E W Annual solar and wind generation
FScaling factor
FCFuel cost
F C i Fuel cost
FCRFixed charge rate
F C R i Fixed charge rate per generation type
FOMFixed operation and maintenance
F O M Annual fixed operation and maintenance cost
gElements within generation vectors
GHGGreenhouse gas emissions
HPCHigh performance computing
H R i Heat rate
H S W Adaption of N G S W case with hydrogen generation
IEAInternational Energy Agency
I ( t ) Power imbalance
LCOELevelized cost of energy
LG&E and KULouisville Gas and Electric and Kentucky Utilities
LOLELoss of load expectation
M C i Cost of maintenance
M-MMinute to minute
MODEMulti-objective differential evolution
MOOMulti-objective optimization
NERCNorth American Electricity Reliability Corporation
NGCTNatural gas combustion turbine
NGCCNatural gas combined cycle
N G Current energy portfolio case with all coal replaced with NG
N G S Adaption of N G case with added solar generation
N G S W Adaption of N G case with added solar and wind generation
NRELNational Renewable Energy Laboratory
NSGA-IINon-dominated sorting genetic algorithm 2
P i ( t ) Power output of each thermal generator
P L Load
P m i n Minimum rated capacity
P m a x Maximum rated capacity
P r e n Renewable output
P r ( t ) Cost per thermal generation dispatch
SOCState of charge
R A N D p ( 0 , 1 ) Function to produce a set of random values (0 and 1)
R C S , R C W Rated capacity of solar and wind
R R i Generator ramping rate
r 1 , r 2 , r 3 Distinct design indices not equal to d
VOMVariable operation and maintenance
V O M Variable operation and maintenance cost
VREVariable renewable energy

References

  1. Global Energy-Related CO2 Emissions by Sector—Charts—Data & Statistics. 2022. Available online: https://www.iea.org/data-and-statistics/charts/global-energy-related-CO2-emissions-by-sector (accessed on 5 August 2022).
  2. Burdick, A.; Schlag, N.; Au, A.; Go, R.; Ming, Z.; Olson, A. Lighting a Reliable Path to 100% Clean Electricity: Evolving Resource Adequacy Practices for a Decarbonizing Grid. IEEE Power Energy Mag. 2022, 20, 30–43. [Google Scholar] [CrossRef]
  3. Hoff, S. U.S. Electric System Is Made up of Interconnections and Balancing Authorities; Technical Report; U.S. Energy Information Administration: Washington, DC, USA, 2016. Available online: https://www.eia.gov/todayinenergy/detail.php?id=27152 (accessed on 29 January 2023).
  4. EPA. Clean Air Markets Program Data (CAMPD); Technical Report; EPA: Washington, DC, USA, 2022. Available online: https://campd.epa.gov (accessed on 16 September 2022).
  5. EIA. United States Energy Information Administration (EIA) Monthly Electric Generator Inventory; Technical Report; EIA: Washington, DC, USA, 2022. Available online: https://www.eia.gov/electricity/data/eia860m/archive/xls/january_generator2022.xlsx (accessed on 16 September 2022).
  6. Pennsylvania Power and Light. PPL’s 2021 Climate Assessment Report; Technical Report; Pennsylvania Power and Light: Allentown, PA, USA, 2022; Available online: https://www.pplweb.com/wp-content/uploads/2022/01/PPL_Corp-2021-Climate-Assessment_2022-01-04.pdf (accessed on 16 September 2022).
  7. Louisville Gas and Electric and Kentucky Utilities. EIA 860M and LG&E and KU 2021 Integrated Resources Plan; Technical Report; Louisville Gas and Electric and Kentucky Utilities: Louisville, KY, USA, 2021. Available online: https://psc.ky.gov/pscecf/2021-00393/rick.lovekamp%40lge-ku.com/10192021013101/5-LGE_KU_2021_IRP_Volume_III.pdf (accessed on 16 September 2022).
  8. Geospatial Data Science. 2021. Available online: https://www.nrel.gov/gis/index.html (accessed on 8 September 2022).
  9. NREL. Electricity ATB Technologies and Data Overview; Technical Report; National Renewable Energy Laboratory (NREL): Golden, CO, USA, 2021. Available online: https://atb.nrel.gov/electricity/2021/index (accessed on 15 January 2022).
  10. Javed, M.S.; Ma, T.; Jurasz, J.; Canales, F.A.; Lin, S.; Ahmed, S.; Zhang, Y. Economic Analysis and Optimization of a Renewable Energy Based Power Supply System with Different Energy Storages for a Remote Island. Renew. Energy 2021, 164, 1376–1394. [Google Scholar] [CrossRef]
  11. Heuberger, C.F.; Staffell, I.; Shah, N.; Dowell, N.M. A Systems Approach to Quantifying the Value of Power Generation and Energy Storage Technologies in Future Electricity Networks. Comput. Chem. Eng. 2017, 107, 247–256. [Google Scholar] [CrossRef]
  12. van der Wiel, K.; Stoop, L.; Van Zuijlen, B.; Blackport, R.; Van den Broek, M.; Selten, F. Meteorological Conditions Leading to Extreme Low Variable Renewable Energy Production and Extreme High Energy Shortfall. Renew. Sustain. Energy Rev. 2019, 111, 261–275. [Google Scholar] [CrossRef]
  13. Lauby, M.; Villafranca, R. Method to Model and Calculate Capacity Contributions of Variable Generation for Resource Adequacy Planning; Technical Report; NERC: Atlanta, GA, USA, 2011; Available online: https://www.nerc.com/pa/RAPA/ra/Reliability%20Assessments%20DL/IVGTF1-2.pdf (accessed on 9 September 2022).
  14. Copp, D.A.; Nguyen, T.A.; Byrne, R.H.; Chalamala, B.R. Optimal Sizing of Distributed Energy Resources for Planning 100% Renewable Electric Power Systems. Energy 2022, 239, 122436. [Google Scholar] [CrossRef]
  15. Denholm, P.; Arent, D.J.; Baldwin, S.F.; Bilello, D.E.; Brinkman, G.L.; Cochran, J.M.; Cole, W.J.; Frew, B.; Gevorgian, V.; Heeter, J.; et al. The Challenges of Achieving a 100% Renewable Electricity System in the United States. Joule 2021, 5, 1331–1352. [Google Scholar] [CrossRef]
  16. Denholm, P.; Brown, P.; Cole, W.; Mai, T.; Sergi, B.; Brown, M.; Jadun, P.; Ho, J.; Mayernik, J.; McMillan, C.; et al. Examining Supply-Side Options to Achieve 100% Clean Electricity by 2035; Technical Report; NREL: Golden, CO, USA, 2022. Available online: https://www.nrel.gov/docs/fy22osti/81644.pdf (accessed on 24 January 2023).
  17. Bistline, J.E.T. The Importance of Temporal Resolution in Modeling Deep Decarbonization of the Electric Power Sector. Environ. Res. Lett. 2021, 16, 084005. [Google Scholar] [CrossRef]
  18. Tejada-Arango, D.A.; Morales-España, G.; Wogrin, S.; Centeno, E. Power-Based Generation Expansion Planning for Flexibility Requirements. IEEE Trans. Power Syst. 2020, 35, 2012–2023. [Google Scholar] [CrossRef] [Green Version]
  19. Sepulveda, N.A.; Jenkins, J.D.; de Sisternes, F.J.; Lester, R.K. The Role of Firm Low-Carbon Electricity Resources in Deep Decarbonization of Power Generation. Joule 2018, 2, 2403–2420. [Google Scholar] [CrossRef] [Green Version]
  20. Li, H.; Lin, Y.; Lu, Z.; Qiao, Y.; Qin, J.; Kang, C.; Ye, X. Long Duration Flexibility Planning Challenges and Solutions for Power System With Ultra High Share of Renewable Energy. IEEE Open Access J. Power Energy 2022, 9, 412–424. [Google Scholar] [CrossRef]
  21. Lunz, B.; Stöcker, P.; Eckstein, S.; Nebel, A.; Samadi, S.; Erlach, B.; Fischedick, M.; Elsner, P.; Sauer, D.U. Scenario-based Comparative Assessment of Potential Future Electricity Systems—A New Methodological Approach Using Germany in 2050 as an Example. Appl. Energy 2016, 171, 555–580. [Google Scholar] [CrossRef] [Green Version]
  22. Van Zuijlen, B.; Zappa, W.; Turkenburg, W.; Van der Schrier, G.; Van den Broek, M. Cost-optimal Reliable Power Generation in a Deep Decarbonisation Future. Appl. Energy 2019, 253, 113587. [Google Scholar] [CrossRef]
  23. Zappa, W.; Junginger, M.; Van den Broek, M. Is a 100% Renewable European Power System Feasible by 2050? Applied Energy 2019, 233–234, 1027–1050. [Google Scholar] [CrossRef]
  24. Shaner, M.R.; Davis, S.J.; Lewis, N.S.; Caldeira, K. Geophysical constraints on the reliability of solar and wind power in the United States. Energy Environ. Sci. 2018, 11, 914–925. [Google Scholar] [CrossRef] [Green Version]
  25. Phadke, A.; Wooley, D.; Abhyankar, N.; Paliwal, U.; Paulos, B. 2035 The Report; Technical Report; Goldman School of Public Policy, University of California Berkeley: Berkeley, CA, USA, 2020; Available online: http://www.2035report.com/wp-content/uploads/2020/06/2035-Report.pdf (accessed on 4 April 2022).
  26. Larson, E.; Greig, C.; Jenkins, J.; Mayfield, E.; Pascale, A.; Zhang, C.; Drossman, J.; Williams, R.; Pacala, S.; Socolow, R.; et al. Net-Zero America: Potential Pathways, Infrastucture, and Impacts; Technical Report; Princeton University: Princeton, NJ, USA, 2021; Available online: https://netzeroamerica.princeton.edu/ (accessed on 4 April 2022).
  27. Gyanwali, K.; Komiyama, R.; Fujii, Y. Deep Decarbonization of Integrated Power Grid of Eastern South Asia Considering Hydrogen and CCS Technology. Int. J. Greenh. Gas Control 2021, 112, 103515. [Google Scholar] [CrossRef]
  28. Budischak, C.; Sewell, D.; Thomson, H.; Mach, L.; Veron, D.E.; Kempton, W. Cost-minimized combinations of wind power, solar power and electrochemical storage, powering the grid up to 99.9% of the time. J. Power Sources 2013, 225, 60–74. [Google Scholar] [CrossRef] [Green Version]
  29. Bloom, A.; Townsend, A.; Palchak, D.; Novacheck, J.; King, J.; Barrows, C.; Ibanez, E.; O’Connell, M.; Jordan, G.; Roberts, B.; et al. Eastern Renewable Generation Integration Study; Technical Report; NREL: Golden, CO, USA, 2016. Available online: https://www.nrel.gov/docs/fy16osti/64472.pdf (accessed on 24 January 2023).
  30. Jenkins, J.D.; Luke, M.; Thernstrom, S. Getting to Zero Carbon Emissions in the Electric Power Sector. Joule 2018, 2, 2498–2510. [Google Scholar] [CrossRef] [Green Version]
  31. Borasio, M.; Moret, S. Deep Decarbonisation of Regional Energy Systems: A Novel Modelling Approach and its Application to the Italian Energy Transition. Renew. Sustain. Energy Rev. 2022, 153, 111730. [Google Scholar] [CrossRef]
  32. United States Mid-Century Strategy for Deep Decarbonization. 2016. Available online: https://unfccc.int/files/focus/long-term_strategies/application/pdf/mid_century_strategy_report-final_red.pdf (accessed on 28 March 2022).
  33. Chapman, A.; Itaoka, K.; Farabi-Asl, H.; Fujii, Y.; Nakahara, M. Societal Penetration of Hydrogen into the Future Energy System: Impacts of Policy, Technology and Carbon Targets. Int. J. Hydrogen Energy 2020, 45, 3883–3898. [Google Scholar] [CrossRef]
  34. Southern Company. Implentation and Action towards Net Zero; Technical Report; Southern Company: Atlanta, GA, USA, 2020; Available online: https://www.southerncompany.com/content/dam/southern-company/pdf/public/Net-zero-report.pdf (accessed on 24 January 2023).
  35. Bistline, J.E.T.; Young, D.T. The role of natural gas in reaching net-zero emissions in the electric sector. Nat. Commun. 2022, 13, 4743. [Google Scholar] [CrossRef]
  36. Wu, T.; Wang, J.; Yue, M. On the Integration of Hydrogen Into Integrated Energy Systems: Modeling, Optimal Operation, and Reliability Assessment. IEEE Open Access J. Power Energy 2022, 9, 451–464. [Google Scholar] [CrossRef]
  37. Kiviluoma, J.; Helistö, N.; Putkonen, N.; Smith, C.; Koivisto, M.; Korpås, M.; Flynn, D.; Söder, L.; Taibi, E.; Guminski, A. Flexibility From the Electrification of Energy: How Heating, Transport, and Industries Can Support a 100% Sustainable Energy System. IEEE Power Energy Mag. 2022, 20, 55–65. [Google Scholar] [CrossRef]
  38. Kumano, T. A functional optimization based dynamic economic load dispatch considering ramping rate of thermal units output. In Proceedings of the 2011 IEEE/PES Power Systems Conference and Exposition, Phoenix, AZ, USA, 20–23 March 2011; pp. 1–8. [Google Scholar] [CrossRef]
  39. Luz, T.; Moura, P. 100% Renewable Energy Planning with Complementarity and Flexibility Based on a Multi-Objective Assessment. Appl. Energy 2019, 255, 113819. [Google Scholar] [CrossRef]
  40. Montero, L.; Bello, A.; Reneses, J. A Review on the Unit Commitment Problem: Approaches, Techniques, and Resolution Methods. Energies 2022, 15, 1296. [Google Scholar] [CrossRef]
  41. Guerra, K.; Haro, P.; Gutiérrez, R.; Gómez-Barea, A. Facing the High Share of Variable Renewable Energy in the Power System: Flexibility and Stability Requirements. Appl. Energy 2022, 310, 118561. [Google Scholar] [CrossRef]
  42. Palmintier, B.S.; Webster, M.D. Impact of Operational Flexibility on Electricity Generation Planning With Renewable and Carbon Targets. IEEE Trans. Sustain. Energy 2016, 7, 672–684. [Google Scholar] [CrossRef]
  43. Meus, J.; Poncelet, K.; Delarue, E. Applicability of a Clustered Unit Commitment Model in Power System Modeling. IEEE Trans. Power Syst. 2018, 33, 2195–2204. [Google Scholar] [CrossRef] [Green Version]
  44. Morales-España, G.; Tejada-Arango, D.A. Modeling the Hidden Flexibility of Clustered Unit Commitment. IEEE Trans. Power Syst. 2019, 34, 3294–3296. [Google Scholar] [CrossRef] [Green Version]
  45. Bird, L.; Lew, D. Integrating Wind and Solar Energy in the U.S. Bulk Power System: Lessons from Regional Integration Studies; Technical Report; NREL: Golden, CO, USA, 2012. Available online: https://www.osti.gov/biblio/1051913 (accessed on 24 January 2023).
  46. Akeyo, O.M.; Patrick, A.; Ionel, D.M. Study of Renewable Energy Penetration on a Benchmark Generation and Transmission System. Energies 2021, 14, 169. [Google Scholar] [CrossRef]
  47. Storn, R.; Price, K. Differential Evolution—A Simple and Efficient Heuristic for Global Optimization over Continuous Spaces. J. Glob. Optim. 1997, 11, 341–359. [Google Scholar] [CrossRef]
  48. Muralikrishnan, N.; Jebaraj, L.; Rajan, C.C.A. A Comprehensive Review on Evolutionary Optimization Techniques Applied for Unit Commitment Problem. IEEE Access 2020, 8, 132980–133014. [Google Scholar] [CrossRef]
  49. Peel, M.C.; Finlayson, B.L.; McMahon, T.A. Updated World Map of the Köppen-Geiger Climate Classification. Hydrol. Earth Syst. Sci. 2007, 11, 1633–1644. [Google Scholar] [CrossRef] [Green Version]
  50. Li, Y.; Wang, J.; Zhao, D.; Li, G.; Chen, C. A Two-stage Approach for Combined Heat and Power Economic Emission Dispatch: Combining Multi-objective Optimization with Integrated Decision Making. Energy 2018, 162, 237–254. [Google Scholar] [CrossRef] [Green Version]
  51. Kentucky Mesonet at WKU. 2022. Available online: http://www.kymesonet.org/ (accessed on 15 January 2022).
  52. E.W. Brown Solar Facility Historical Data|LG&E and KU. 2022. Available online: http://lge-ku.com/live-solar-generation/historical-data (accessed on 2 February 2022).
  53. North American Electric Reliability Corporation. BAL-002-1; Technical Report; North American Electric Reliability Corporation: Atlanta, GA, USA, 2015; Available online: https://www.nerc.com/pa/Stand/Pages/BAL002-1RI.aspx (accessed on 30 July 2022).
  54. Western Electricity Coordinating Council. Balancing Authority and Regulation Overview; Technical Report; Western Electricity Coordinating Council: Salt Lake City, UT, USA, 2011; Available online: https://www.wecc.org/Administrative/06-Balancing%20Authority%20Overview.pdf (accessed on 29 January 2023).
  55. Ela, E.; O’Malley, M. Studying the Variability and Uncertainty Impacts of Variable Generation at Multiple Timescales. IEEE Trans. Power Syst. 2012, 27, 1324–1333. [Google Scholar] [CrossRef] [Green Version]
  56. Surender Reddy, S.; Bijwe, P.R.; Abhyankar, A.R. Real-Time Economic Dispatch Considering Renewable Power Generation Variability and Uncertainty Over Scheduling Period. IEEE Syst. J. 2015, 9, 1440–1451. [Google Scholar] [CrossRef]
  57. NREL. Life Cycle Greenhouse Gas Emissions from Electricity Generation: Update; Technical Report; NREL: Golden, CO, USA, 2021. Available online: https://www.nrel.gov/docs/fy21osti/80580.pdf (accessed on 14 July 2022).
  58. Hong, Y.Y.; Apolinario, G.F.D. Uncertainty in Unit Commitment in Power Systems: A Review of Models, Methods, and Applications. Energies 2021, 14, 6658. [Google Scholar] [CrossRef]
  59. Gong, H.; Alden, R.E.; Ionel, D.M. Stochastic Battery SOC Model of EV Community for V2G Operations Using CTA-2045 Standards. In Proceedings of the 2022 IEEE Transportation Electrification Conference & Expo (ITEC), Anaheim, CA, USA, 15–17 June 2022; pp. 1144–1147. [Google Scholar] [CrossRef]
  60. Crozier, C.; Quarton, C.; Mansor, N.; Pagnano, D.; Llewellyn, I. Modelling of the Ability of a Mixed Renewable Generation Electricity System with Storage to Meet Consumer Demand. Electricity 2022, 3, 2. [Google Scholar] [CrossRef]
  61. Lai, C.S.; McCulloch, M.D. Levelized Cost of Electricity for Solar Photovoltaic and Electrical Energy Storage. Appl. Energy 2017, 190, 191–203. [Google Scholar] [CrossRef]
Table 1. Ramp rates, cost coefficients, and fixed maintenance and operation costs for the three types of thermal generation considered in the case study.
TypeRamp Rate [%]a [ 10 3 ]bcFuel Cost [$/MMBtu]Aux [$/MWh]
NGCC40.0003857.700745630.06651761.28
NGCT200.0207312.741114753.03481765.65
Coal1.230.00000110.50.000011962.34
Table 2. Summary of generation portfolio capacity with thermal and renewable energy resources. Solar and wind capacity were varied within sub-cases and simulated to emulate gradual renewable energy integration. All values are in GW.
Case [GW]CoalNGCCCCSHydrogenNGCTHydroSolarWind
C50.70020.10.10
N G 05.60020.10.10
C S 50.70020.10–200
N G S 05.60020.10–200
C S W 50.70020.10–200–10
N G S W 05.60020.10–200–10
C C S S W 007.6000.10–200–10
H S W 0007.600.10–200–10
Disclaimer/Publisher’s Note: The statements, opinions and data contained in all publications are solely those of the individual author(s) and contributor(s) and not of MDPI and/or the editor(s). MDPI and/or the editor(s) disclaim responsibility for any injury to people or property resulting from any ideas, methods, instructions or products referred to in the content.

