Article

Prediction of NOx Emission Based on Data of LHD On-Board Monitoring System in a Deep Underground Mine

1
Faculty of Geoengineering, Mining and Geology, Wroclaw University of Science and Technology, Na Grobli 15, 50-421 Wroclaw, Poland
2
KGHM Polska Miedz S.A., ul. Marii Skłodowskiej-Curie 48, 59-301 Lubin, Poland
*
Author to whom correspondence should be addressed.
Submission received: 20 January 2023 / Revised: 14 February 2023 / Accepted: 21 February 2023 / Published: 23 February 2023
(This article belongs to the Special Issue Mining Technologies Innovative Development II)

Abstract

:
The underground mining industry is at the forefront when it comes to unsafe conditions at workplaces. As mining depths continue to increase and the mining fronts move away from the ventilation shafts, gas hazards are increasing. In this article, the authors developed a statistical polynomial model for nitrogen oxide (NOx) emission prediction of the LHD vehicle with a diesel engine. The best-achieved prediction accuracy by the 4th order polynomial model for 11 and 10 input variables is about 8% and 13%, respectively. It is comparable with the sensors’ accuracy of 10% at a stable regime of loading and 20% in the transient periods of operation. The obtained results allow planning of ventilation system capacity and power demand for the large fleet of vehicles in the deep underground mines.

1. Introduction

One of the main tasks of an employer is to ensure safe working conditions for its employees regardless of the industry in which they work. According to [1], the underground mining industry is at the forefront when it comes to unsafe conditions at workplaces. As mining depths continue to increase, and the mining fronts move away from the ventilation shafts, gas hazards are increasing. This article will analyze the danger of nitrogen oxides (NOx). Sources of NOx emissions into the mine atmosphere can be divided into natural and technological. It is assumed that diesel mining machinery has the greatest impact on air pollution. It is important to properly control gas concentrations in mine workings. Unfortunately, not all mining machines have NOx measurement sensors installed—making it difficult to control the concentrations of these gases in workings. Rapidly changing standards for reducing gas concentration limits at workplaces are forcing the use of new methods in assessing workers’ exposure to harmful gases. Not only is the lack of machine-mounted sensors a major problem in assessing the work environment, but also the problem of variable selection or data recording errors.
Monitoring, analyzing, and now also predicting parameters to ensure safe and trouble-free continuous operation of underground crews has been carried out for years [2,3,4,5]. Due to the difficult working conditions and unreliability of electronic equipment in underground conditions, the use of prediction sometimes turns out to be the only option for assessing the state of the environment or the condition of the equipment/vehicle.
The article uses measurement data from the SYNAPSA system, which data is obtained from the monitoring system mounted on an LHD. Authors selected from the full list of parameters those ones, which affect the value of NOx concentrations. Based on them, a model for the prediction of the value of these concentrations was created. To ensure safe working conditions for underground crews, it is important to know the values of emissions of harmful compounds from mining machinery. The created prediction model can be used to estimate the values that are generated by mining machines that do not have a nitrogen oxide sensor installed.
Nitrogen oxides are currently a critical problem. Their negative impact on human health results in continuous changes and lowering of nitrogen oxide concentration limits in the working environment of underground crews. The solution presented in the article will help improve working conditions. In further research, the proposed statistical models can provide valuable assistance in determining further parameters that can affect NOx from vehicle emissions, like measurements of other important engine variables such as cylinder pressure. In addition, statistical modeling can be very useful for predicting emissions under transient conditions of engine operation, where physical models still need significant improvement.
The main difference is that we used a new multi-polynomial statistical model to predict the NOx emissions and verified it by the unique data of LHD working in the underground mine with harsh environmental conditions. The majority of previous studies were conducted either for different types of diesel vehicles on-surface or in-lab conditions. The obtained accuracy of NOx emission prediction allows applying the developed model for practical needs.

Problem Formulation

Following the own observations of the ventilation systems in the deep underground mines and taking into account the capabilities of onboard monitoring systems in Load-Haul-Dump (LHD) vehicles, the following problems can be distinguished:
  • Although all manufacturers of diesel engines for heavy-duty vehicles include the exhaust gas aftertreatment systems, NOx sensors are not present in the LHD machines working in deep underground mines.
  • To solve the urgent issues of ventilation, especially in the deep underground mines, and provide safe working conditions, the engineering and management staff would like to know immediately the NOx emissions from every vehicle working in different geological conditions. This is practically more efficient to realize by the on-board monitoring systems instead of permanent numerous sensors installation in the mines with constantly changing the configuration of tunnels. However, all recorded data, including signals from onboard NOx sensors, are uploaded to the server via wireless connections only once per working shift (about 6 h). Therefore, mathematical models and software tools are required for the post-processing of big data sets offline.
  • Since the onboard monitoring system can record a huge number of working parameters, the problem arises of their optimal selection from the whole set. Moreover, due to different reasons, data are not always correctly stored (NaN values, missed data, etc.); therefore, data pre-processing and cleaning procedures are required for correct calculations.
  • While designing a NOx prediction model, the problem exists of the balance between fit quality and overfitting related to smoothing of initial data (already after pre-processing and invalid data cleaning). Also, having an even enough accurate model tested over certain working conditions and machine technical state, its robustness should be provided for other working locations, operators’ experience, and critical elements deterioration (engine, turbine, exhaust system, tires).

2. State of the Art

The safety of a worker while at work these days should be the most important criterion for an employer. However, there are industries where the health and safety of workers are at risk more than others. One such process is raw materials mining - mainly in underground mines. The ever-increasing demand for mineral resources results in the exploitation of deposits from ever deeper. The great depth of mining (up to 1000–1500 m) is associated with an increase in the exposure of workers to natural hazards prevailing underground [6,7,8]. The most dangerous at present is the climatic hazard associated with the constantly increasing primary temperature of the rocks, which in Polish copper ore mines is almost 50 °C [9]. Another critical problem is the gas hazard. As the mining depth increases and the mining fronts move away from the ventilation shafts, the rate of rarefying of harmful gases and ventilation of the workings decreases. According to Struminski [10] and Szlazak [11], the most harmful gases are carbon monoxide (CO), hydrogen sulfide (H 2 S), methane (CH 4 ), and nitrogen oxides (NOx). In the recent studies of Yin and Linga [12], it has been proposed to use hydrogen or natural gas hydrate as a source of primary fuel to eliminate NOx and SOx.
As reported by Shaw et al. [13], NOx is understood as the sum of nitrogen oxide (NO) and nitrogen dioxide (NO 2 ) compounds. In underground mines, NOx gas hazards can have a natural or technological source. Natural sources include the oxidation of nitrogen from the atmosphere or the natural outflow of nitrogen oxides from the rock mass. The most significant, however, are nitrogen oxides that are generated by technological processes—these include nitrogen oxides that originate in the blasting process, those from welding processes, and, above all, those from diesel engines [14,15,16].
According to Kampa [17], nitrogen oxides are gases that are harmful to a living organism. Both NO and NO 2 are odorless gases. Nitrogen oxide is additionally a colorless gas, while nitrogen dioxide in higher concentrations can take on a brown color [18,19,20]. According to Galbreath et al. [21], in the exhaust of a diesel engine, the percentage of nitrogen oxides is about 90% NO and about 10% NO 2 . As reported by Hori et al. in [22], it is nitrogen dioxide that is more toxic. NO 2 causes respiratory problems as low as 1.5 ppm, while at 5 ppm, it causes a drop in blood pressure. Death occurs at concentrations near 200 ppm of NO 2 [23].
Given the chemical and physical properties of nitrogen oxides and how they affect the human body working in the underground mine, continuous monitoring of the values of these concentrations is being introduced. Measurements are made of the values of NOx concentrations in the mine atmosphere and at the exhaust of the internal combustion engine. The limit values in the exhaust gases are 500 ppm for NO 2 and 750 ppm for NO.
Due to the harmfulness of the compounds in the exhaust, numerous studies are being conducted on predicting the emissions of harmful compounds, including nitrogen oxides, into the atmosphere from diesel vehicles [24,25,26].
This article represents the research results related to NOx emission from load-haul-dump (LHD) vehicles driven by diesel engines.
The articulated load-haul-dump (LHD) machine (LKP-1701), which was under investigation (see Figure 1), is designed for underground application in a confined space of low transportation tunnels. The main parameters of its diesel engine (DEUTZ TCD 12.0 V6) are given in Table 1. These LHDs are equipped with an onboard system for machine working parameters monitoring via CAN bus. The exhaust gas NOx concentration signal from the sensor is stored in the database among other signals of the diesel engine and operator actions (gear selection, torque converter locking, acceleration, and braking). This type of machine is characterized by the continuous reverse motion for blasted bulk material (copper ore) taking and haul truck loading. Due to that, diesel engine exhibits excessive exhaust gas emissions. The most intensive mode of engine loading determined based on working cycles analysis [27] and dynamical model [28] is the bucket digging in the hill.
To reduce the harmful gas emission due to lower combustion temperature, the diesel engine is equipped with the exhaust aftertreatment (EAT) or exhaust gas recirculating (EGR) systems. The exhaust gas is typically routed through a Diesel Oxidation Catalyst (DOC) where a chemical reaction is induced to convert hydrocarbons, NOx, and other pollutants of diesel exhaust to less harmful compounds like carbon dioxide. The remaining particles (soot) are reduced by the Diesel Particulate Filter (DPF).
CanmetMINING Diesel Research Laboratory (Canada) conducted a progressive load test (PLT) and vehicle transient test (VTT) to estimate the contribution in NOx emission of Diesel Oxidation Catalysts (DOC) [31]. The VTT simulated operation of a load-haul-dump (LHD) vehicle’s working cycle. Three groups of DOCs are tested: (1) platinum; (2) base metal/palladium; and (3) the “advanced” group. All groups showed a good reduction of carbon monoxide (CO) and total hydrocarbon emissions. However, the change in NO 2 (g/kWh) emissions varied from an increase of 446% to a reduction of 47% for groups 1 and 2 while group 3 showed NOx reduction in any mode of operation.
Those systems provide Tier 4 Interim (Stage IIIB) emissions in accordance with EU regulations. For this class of engine power (up to 560 kW), the allowed maximum amount of nitrogen oxides (NOx) is 3.3 g/kWh; non-methane hydrocarbons (NMHC) —0.19 g/kWh; particulate matter (PM) 0.025 g/kWh. In other types of vehicles and EU regulations, these emission parameters are given per kilometer regardless of engine power. Although advanced technologies for emissions reduction are proposed and applied in civil cars [32], e.g., Lean NOx Trap (LNT), Selective Catalytic Reduction (SCR), they have not been yet widely implemented in underground mining vehicles. Moreover, the Common Rail Direct Injection (CRDI) system stabilizes the output power and reduces the fuel consumption of the turbocharged diesel engine under transient modes of loading and speed.
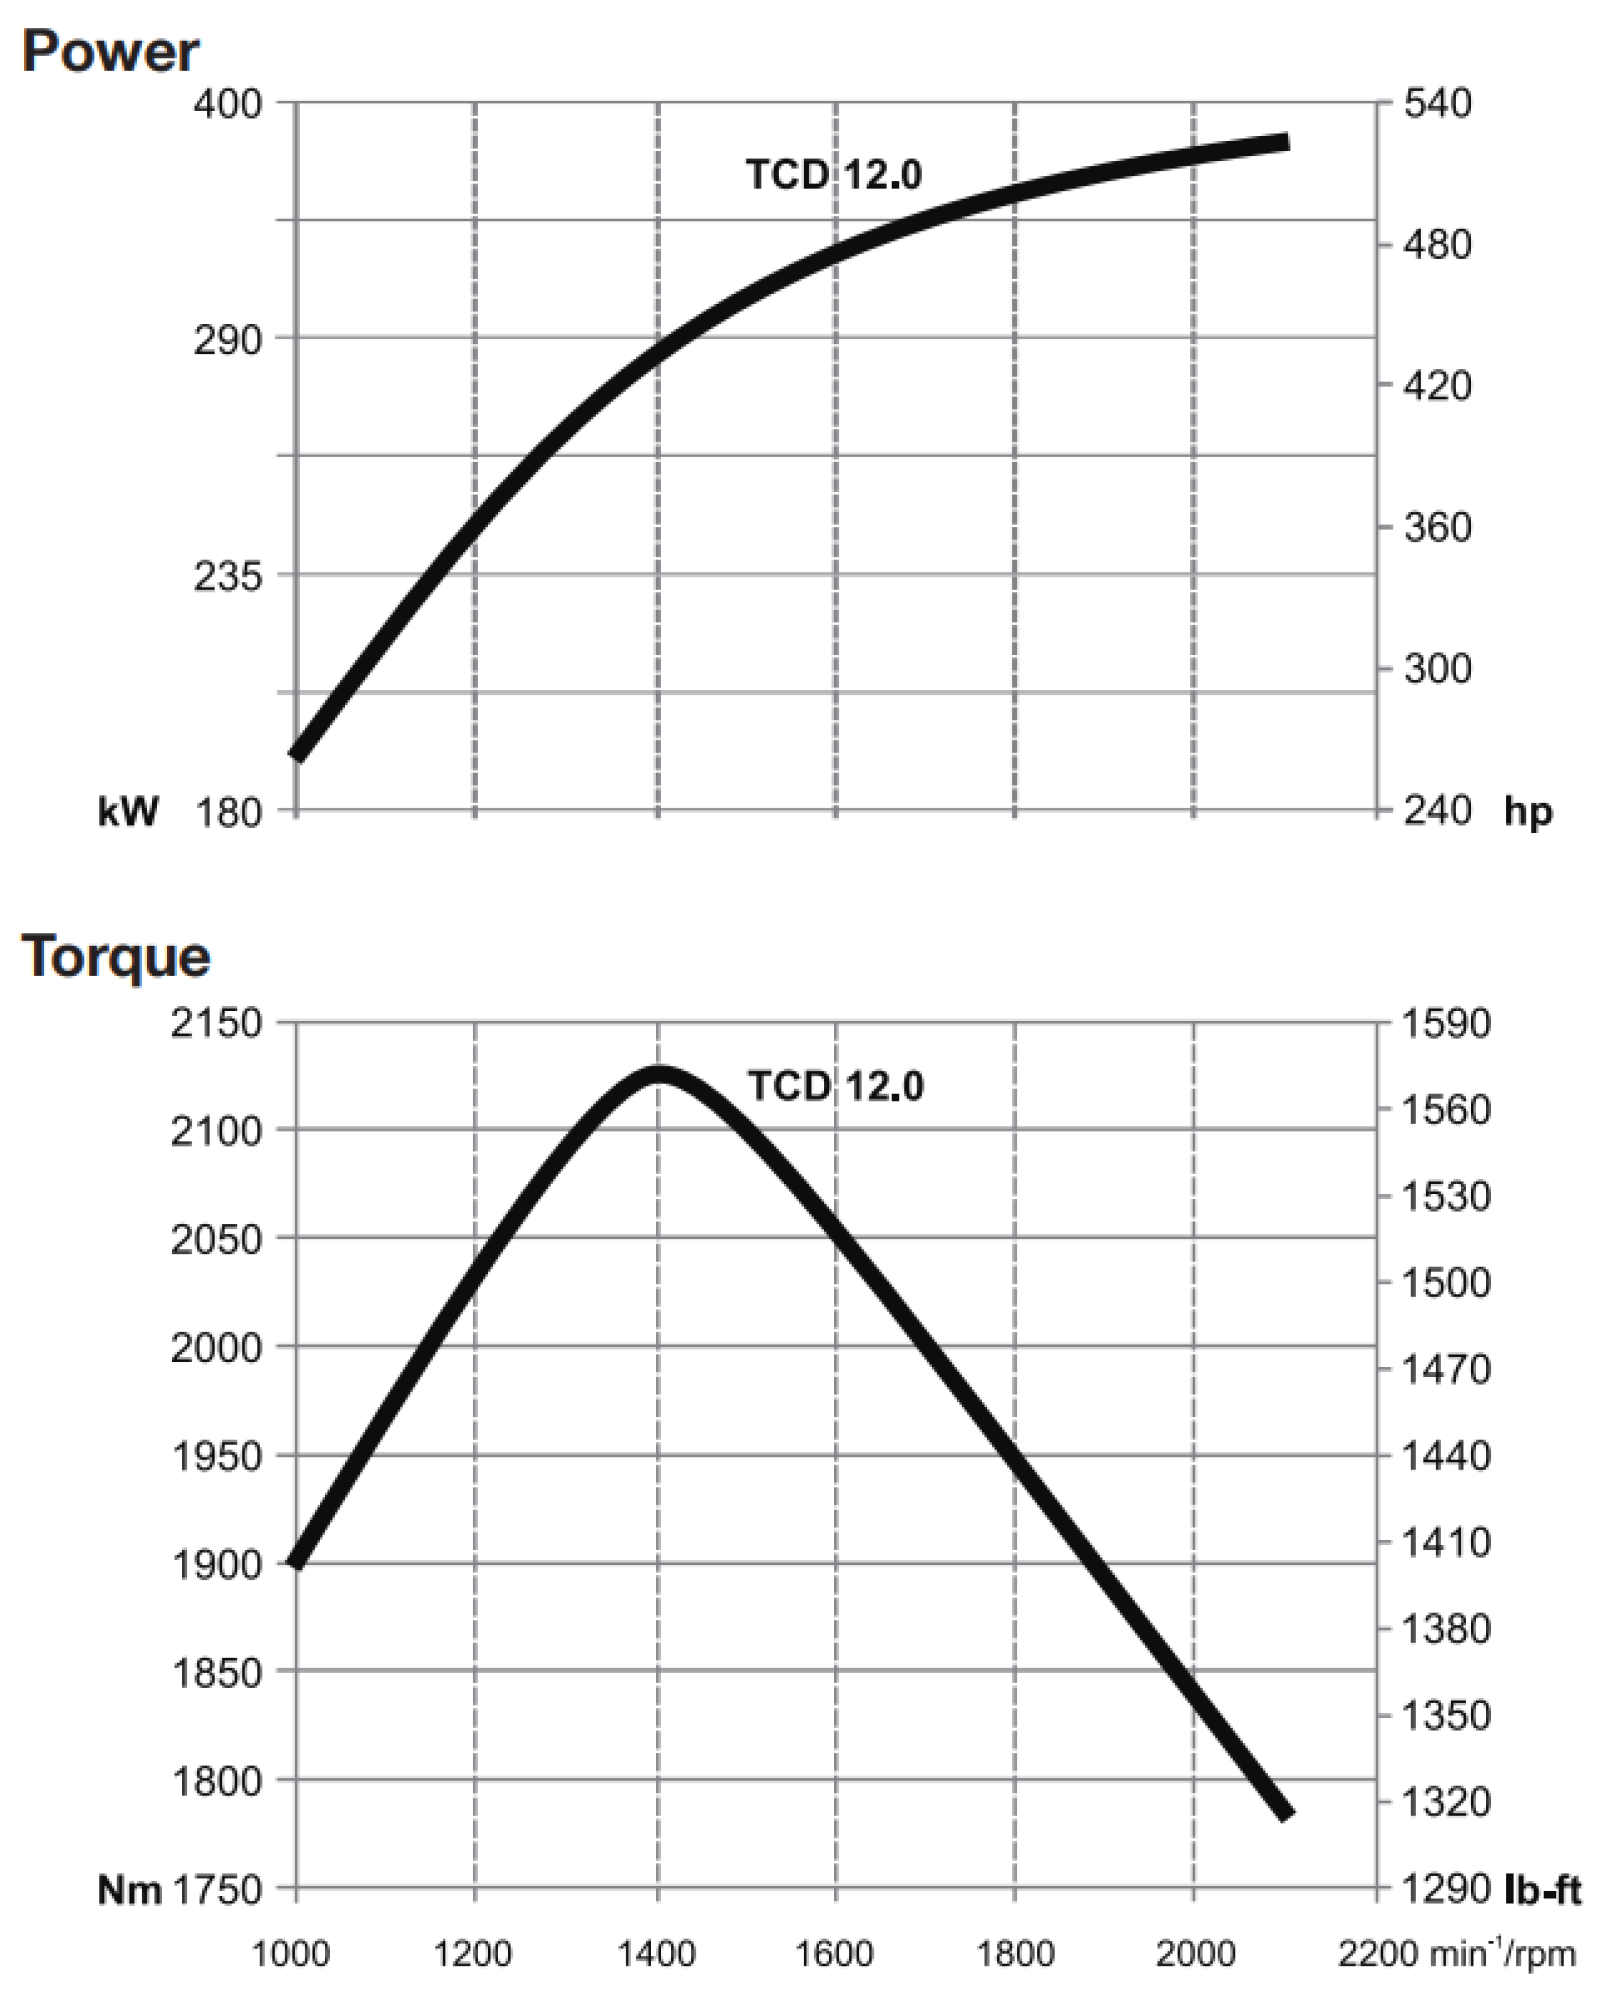
The important role in exhaust gas emission is the setting made by the machine producer in the Electronic Control Unit (ECU), which controls the whole process of machine operation. Depending on certain operator experience, the machine can be operated at different engine rotations and motion speeds. The real power and torque characteristics are given in Figure 2. For this engine, the maximum torque is provided at about 1400 rpm. Although the operators intuitively try to work around this point by gear selection and acceleration regulation; it could not be the optimum by the minimum of exhaust gas emission.
As mentioned earlier, nitrogen oxides from combustion engines are the largest contributor to pollution of the mine atmosphere. Therefore, it is important for the safety of the underground crew to monitor them constantly. Since not all machines are equipped with appropriate sensors, this problem can be solved by modeling. Once the factors and their influence on the increase in the value of NOx concentrations on the engine exhaust have been determined, it is possible to determine the top-down operating parameters of the machine, which the machine operator can control independently, e.g., machine speed, and engine rotation.
In the area of exhaust gas emission prediction, there are several approaches to get a relation based both on physical and empirical models [33,34]. The limitations of physical models are, in fact, that they require some not measured parameters, e.g., in-cylinder burned gas temperature, the ambient gas-to-fuel ratio, the mass of injected fuel, etc. [35]. Engine emissions due to components’ aging, parameters drift, and tolerances violation pose serious problems in meeting emission regulations. To meet practical demand, some authors [36] proposed an optimal linear output feedback controller and a set-point adaption loop on the exhaust gas recirculating rate. Low accuracy restricts the application of physical models in practice. Therefore, in the paper [37], the authors used a statistical approach and correlation analysis to study the main influencing factors of engine torque and NOx emission. They obtained accurate regression models and discovered that ambient temperature in the range 5–30 °C has a great influence both on torque and NOx prediction. The experimental research of intake air humidity influence on the emissions of a turbocharged diesel engine has been conducted in [38]. The relative air humidity was varied from 31 to 80% at a fixed ambient air temperature of 26 °C. The results of tests under three levels of load and rotation speed showed that increasing the intake of air moisture causes less by 3–14% of the NOx emissions. However, since the ambient temperature and humidity in certain underground mines do not variate significantly (+35 °C and 60%), these factors can be neglected in the prediction model.
In general, ANN-based engine models offer a multi-dimensional, adaptive, and learning tool, which does not require knowledge of the governing equations for engine combustion kinetics for emissions prediction [39]. However, this approach requires model training and is difficult to implement in the vehicle onboard monitoring systems due to restricted computing resources. For earth-moving operations with wheel loaders, authors in [40] analyzed energy use and emissions (CO 2 , CO, NOx, CH4, VOC, PM) based on the criterion of the fuel consumption per cubic meter of hauled material. Using Artificial Neural Networks (ANN) and discrete event simulations, they showed that the fuel consumption and emissions of wheel loaders are mostly dependent on engine load, utilization rate (idle time), and bucket payload.
In the paper [41], three nonlinear models were evaluated: ANN, the split and fit algorithm, and a polynomial NARX model with linear parameters. In the transient mode of the automotive diesel engine, each algorithm showed good prediction accuracy and a short time (0.3 ms) of calculation. By the training time, the split and fit algorithm was the quickest (50 s). The authors concluded that such models are much more accurate than the frequently used engine map and the linear fit models, moreover, in the transient mode. Authors in [42] developed fast one-dimensional models for NOx emission prediction based on the Extended Zeldovich mechanism and different calibration multiplier maps. It is shown that turbine inlet temperature, in-cylinder maximum temperature, maximum pressure, load, CA50 (Crank Angle position where 50% of the heat is released), exhaust gas recirculating rate, and fuel-air ratio are the most critical map parameters for accurate NOx prediction. The problem of input parameter selection for the AI-based NOx emission prediction models is considered in [43]. The gradient boosting regression (GBR) model was used to train based on 10 input features. The coefficient of determination (R 2 ) values is within 0.88–0.99 for different driving routes. The most important features for the NOx prediction are mass air flow rate (g/s), exhaust flow rate (m 3 /min), and CO 2 (ppm).

3. Measurement Method

The NOx sensor is permanently installed on the underground articulated LHD vehicle with the diesel engine DEUTZ TCD 12.0 V6 (see Figure 3). This is a 6-cylinder in-line engine with a charge air cooling and exhaust turbocharger. The engine manufacturer declares a lifespan of about 1 million km. By official information, the engine copes well with sharply increasing loads providing 90% of the maximum torque already at 1300 rpm. Additional parameters of the engine are given in Table 2. Best point consumption refers to diesel with a density of 0.835 kg/dm 3 at 15 °C.
The typical parameters of the NOx sensor are given in Table 3. The current regulation implies the minimum NOx mass measurement accuracy requirements of either ±20% or ±0.1 g/bhp-h [44]. However, the majority of NOx sensors are not able to meet these demands under transient loading due to different factors of noise like NOx sensor tolerance, exhaust flow rate, cross-sensitivity to ammonia (NH3), mass airflow (MAF), and sensor position. The noise of many sensors is about 10 ppm at a zero NOx concentration, which can be caused by residual NOx in the exhaust system. While at 100 ppm NOx concentration, the accuracy is approximate ±10% and achieves a better than ±10% accuracy at NOx values of 500 ppm or higher [45].
In the data given for analysis taken from the onboard monitoring system, any of the above-mentioned combustion process model parameters were not available. Instead, the list of parameters stored on the server of the mining enterprise is given in Table 4.
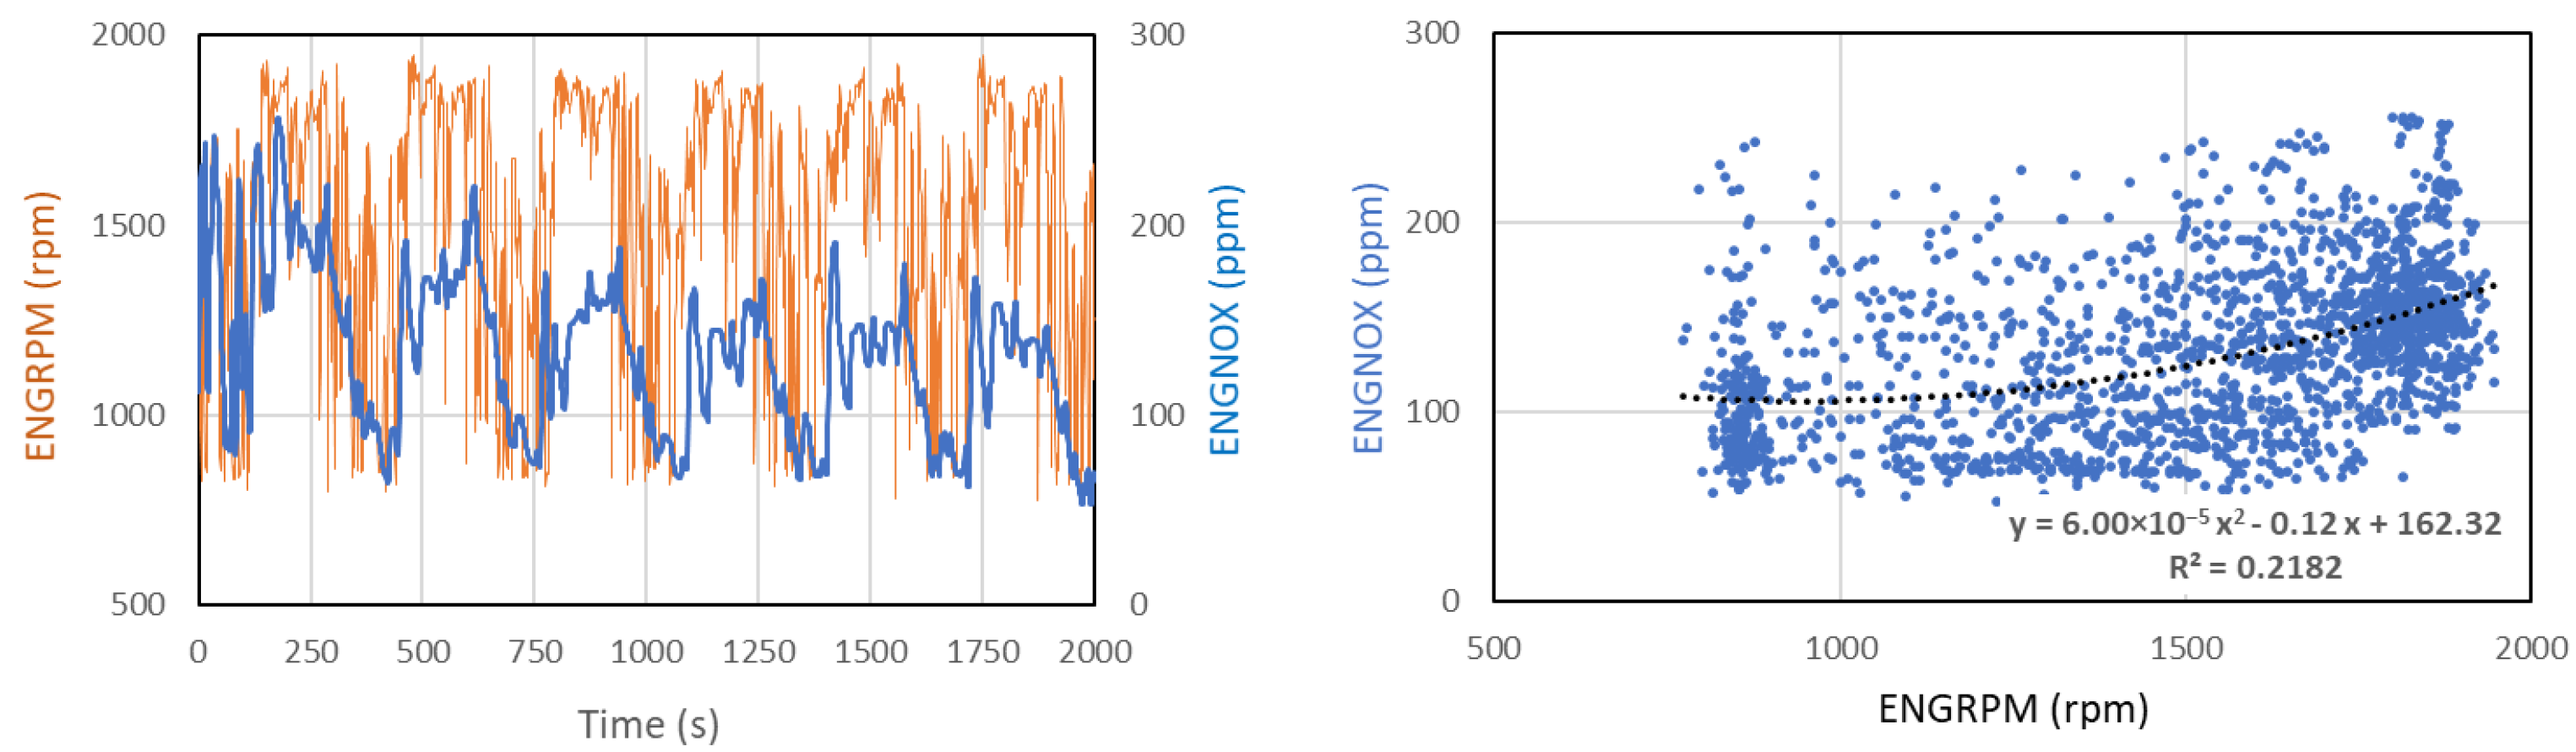
The sampling frequency of all parameters is 1 s except for INTAKEP, with 5 s. Results of preliminary data analysis of are represented in Figure 4 and Figure 5. On the first graph, several cycles are shown of LHD loading and unloading, each lasting about 4 min (240–250 s). In every cycle, the largest oscillating values of NOx are observed at the beginning and during the completion of the cycle. On the other graphs, for the different engine parameters, the first cycle is shown along with moving average (10 points) curves. The most correlated with a NOx parameter is intake pressure (INTAKEP), although it has the longest sampling period (5 s). The other parameters, namely, rotation speed (ENGRPM). fuel use (FUELUSE) and engine acceleration (ENGTPS) are less statistically related to emission (ENGNOX) due to larger short-time deviations. The smoothed curves have fewer deviations and follow the ENGNOX curve more clearly. The other parameters from Table 4 react more slowly to NOx changes. The highest accuracy of the second-order polynomial regression function ( R 2 = 0.5216 for INTAKEP) is enough low. Other types of regression functions with a single input parameter do not increase fitting accuracy. Hence, further improvement of prediction methodology is needed based on multivariate regression models.
Variables for multivariate analysis were selected based on their impact on the fit of the predictive model to real data. The indicator referred to by the authors was primarily the coefficient of determination R 2 . Additionally, information value and weight of evidence analysis have been conducted, and the results are consistent with the R 2 assessment.

4. Methodology

After the input variables selection, the algorithm of data processing assumed in this paper consists of the following steps:
  • Selection of recorded data segment not less than 10–20 working cycles.
  • Data is split into 90% training part and 10% test part.
  • A model is selected for the training data set (polynomial).
  • Model is tested on the test data.
  • From the original data and model output, R 2 and RMSE statistics are calculated, which allows evaluation of the prediction quality.
  • Moreover, the RMSE is calculated normalized to the segment length to be able to calculate the learning and test parts and compare them correctly.
  • The above steps have been done for two different model orders: 3 and 4, to see which model is good enough on the learning part, but not too good that there is no over-fitting on the test part, as seen in the higher order predictions.
  • The above-mentioned steps are fulfilled for two scenarios: first, for all 11 variables that are initially selected, and then for those 10 variables, for which the predicted and initial data are correlated most strongly.

4.1. Model Estimation

Multivariate polynomial (sometimes called “multinomial”) fitting procedure solves for the coefficients of a polynomial regression model using traditional linear least squares technique [46]. It is implemented using QR factorization with pivoting to solve the system. This is more stable than the simple, unpivoted QR. We have also used automatic variable scaling to deal with a simple cause of ill-conditioning.
Once the model has been specified, the estimation procedure itself is rather simple. The problem becomes that of estimation of the vector x, given the linear system of equations:
A x = y
For this estimation to have a unique solution, matrix A should be both non-singular and have more rows than columns. Problems with fewer rows than columns are called under-determined, and in such cases, it is strongly recommended to either obtain more data or reduce the order of the model. Assuming matrix A n × p with n > p , we can solve this system via many different approaches, such as the pseudoinverse method, least-squares method, normal equations, i.e., x = ( A A ) \ ( A y ) , QR or pivoted QR, just to name a few. Of these methods, only those based on the QR factorization will also directly yield estimated variances for the parameters. A pivoted QR is also reasonably efficient, as well as numerically stable, which is why this approach has been chosen.

5. Data Analysis

For testing the methodology, the authors used data describing a single work shift in the mine. In the first step, a subset of usable variables have been selected from all of the channels since most of them contained only (or almost only) empty values. Out of those, the authors selected the ones that presented any meaningful behavior at all. For example, the variable describing if the engine is on or off is not helpful, since it is on during the entire shift. At this point, 11 variables remained, and those were used for the analysis (see Table 4). Raw signals of the selected variables are presented in Figure 6.
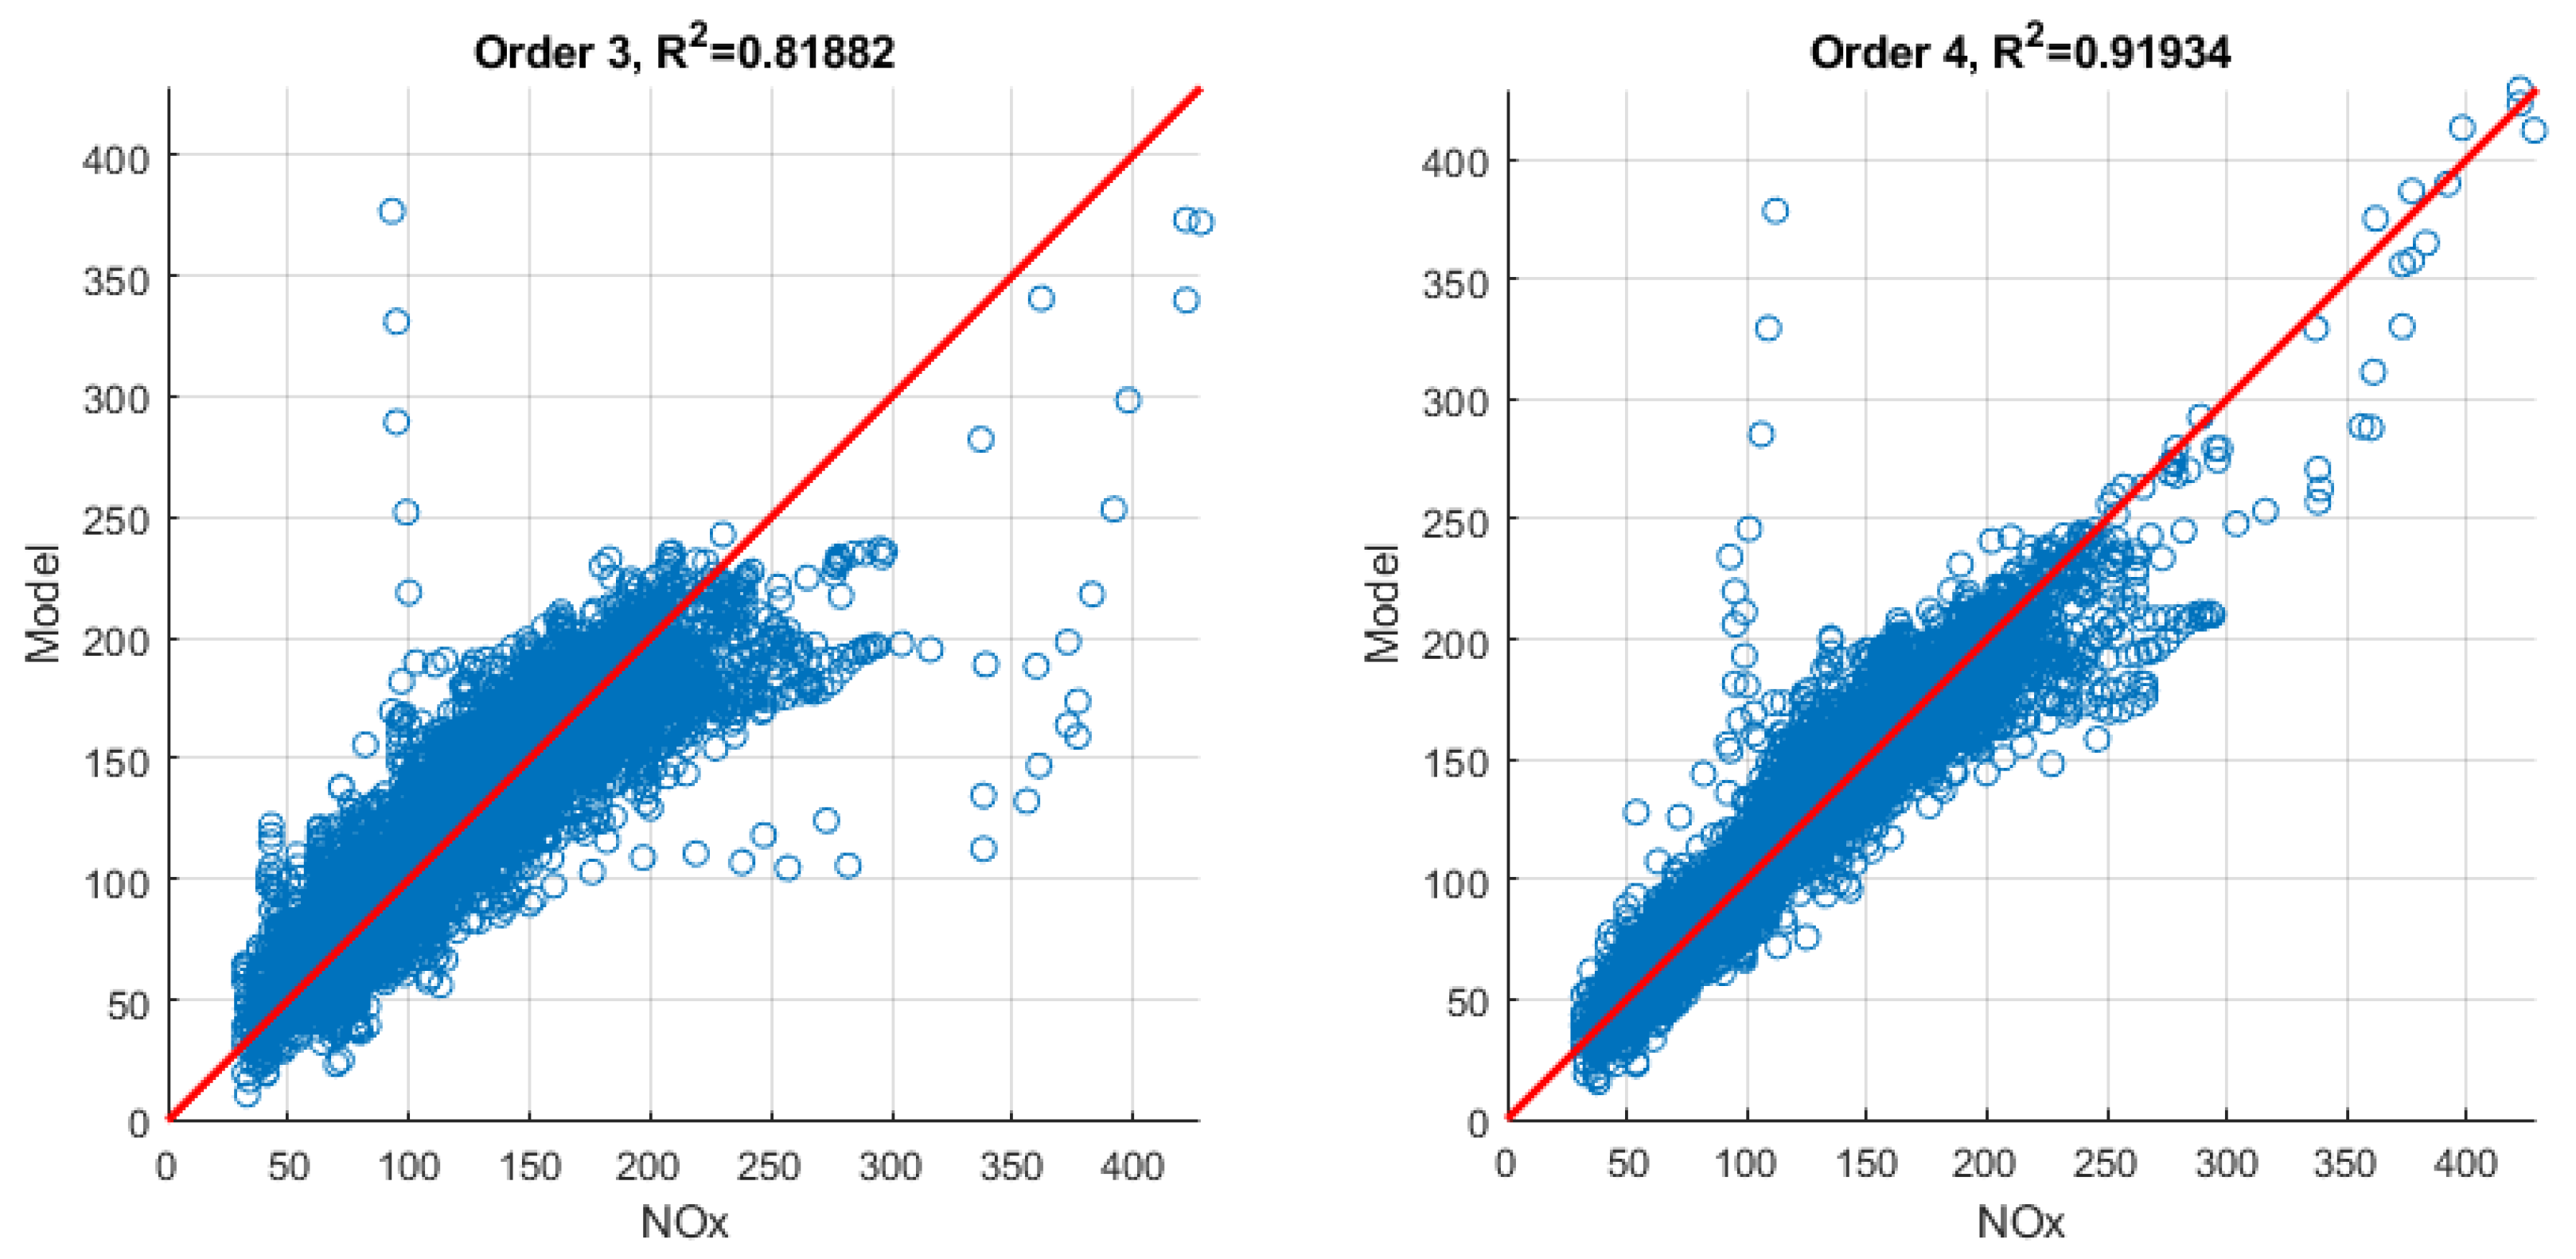
The remaining data set has been divided into the training set and a testing set with a proportion of 90–10%, respectively. The input variables of the training set are then provided to the multivariate polynomial fitting procedure (see Section 4.1). When the models are fitted, they are evaluated in the testing segment. Models of orders 3 and 4 were tested. Those orders were chosen because orders lower than 3 presented poor quality of fit, and orders higher than 4 experienced too strong over-fitting errors. The results of fitting the models can be observed in Figure 7. RMSE values are summarised in Table 5.
Additionally, Table 6 presents the normalized RMSE (NRMSE) values for both orders with the distinction of training and testing segments. It is obtained by calculating the ordinary RMSE value and then dividing it by the number of samples in each respective segment. This way, the values can be compared. It is clearly visible that with higher order, the quality of fitting the model to the training segment increases, but it also causes increasing over-fitting problems in the testing segment. Moreover, the error value is always lower for the training segment in comparison to the testing segment, which is understandable.
After that, the authors measured the cross-correlation between the obtained models and the individual input variables. One variable with the lowest correlation factor (ENGCOOLT—temperature of engine coolant) has been removed from the set of input variables. A reduced set of 10 input variables was used again to fit the models. The results are presented in Figure 8. Similarly, Table 7 presents the NRMSE values. In this case, one can also observe the effect where with increasing model order, the fit quality increases but also over-fitting values increase the error on the testing set.
It is also interesting to compare NRMSE tables. For 11 variables, errors for training segments are lower than for 10 variables. There is more input data to work on, so the fit is better. However, for 11 variables, errors for testing segments are higher than for 10 variables, because the over-fitting is more significant, and models with 10 input variables have better generalizing quality.
One can observe that NRMSE values for the training segment are lower for a full set of variables than for the reduced set. It comes from the fact that the model has more information to learn on. Similarly, NRMSE values are higher for a full set of variables than for the reduced set, because the model fitted on the full set is more specialized and has worse generalization properties, hence it tends to display over-fitting problems. The correlation of predicted and original data on NOx emission is shown in Figure 9 and Figure 10.

6. Discussion

The research presented in this paper allows putting forth several points for the discussion:
  • The decision of the model order selection has to be balanced between the quality of fit during the fitting phase and the amount of over-fitting exhibited while testing on a new portion of data.
  • It is important to select the meaningful input variables. The authors made an attempt to use the full data set of 56 variables, no matter how irrelevant they were, because in theory, it would maximize the information. In practice, the results were meaningless and unusable. Moreover, even if one thinks that they selected the meaningful data set, it becomes visible that removing some variables can improve the generalization capability of the model, even if it slightly decreases the quality of fit on the training segment.
  • For a larger data set (in terms of time), it is not obvious if the modeling with the same parameters will yield better or worse results. The authors attempted to use not one but two shifts of time as a working data set. It turned out that for the second shift, some other operator was driving the machine, and the data looked completely different. One could say that more data did not provide more information, and with the same parameters, the results were much worse.
  • Some other parameters of LHD vehicle’s operation, which are not explicitly reflected in the signals available via CAN bus, may have an influence on the NOx prediction, such as road waviness and its watering. However, this factor is reflected in several working parameters (FUELUS and partly ENGRPM). Temperature and humidity are also among the factors influencing the fuel combustion process. However, they are enough stable in a certain location of every underground mine and easily measured by the simple, low-cost digital sensors, which signals can easily be added to the onboard monitoring system.
  • The achieved deviation of the values predicted by the model from the values measured by the permanently installed sensor is less than 15%, which is comparable with the accuracy of the NOx sensor itself (up to 20% under sharp loads application). Following Figure 9, the certain role in accuracy level plays the outliers, which are also visible in time series graphs as rare peaks during the transient periods of work. The duration of these separate periods and in total is very short; hence, they can be rejected to increase the accuracy of NOx prediction over the majority of remaining data samples.
  • Subjectively, the authors assess that the result of the presented research was successful. However, it is obvious that further research needs to be conducted to try different modeling techniques. In this paper, the authors made the first attempt to solve the problem of the lack of NOx sensors on a large scale using the simplest possible technique, which is modeled using polynomial fitting. This way, it is possible to provide a practical solution for NOx emission assessment for the industry using simple software tools and not time-consuming procedures. The authors are well aware that there are a lot of different techniques of mathematical modeling, and the investigation of their potential for such use cases will be the subject of further work.

7. Conclusions

The conducted research resulted in the development of the statistical model for NOx emission values prediction.
  • The model structure is optimized by order of polynomials and the number of input parameters. During the research, it was decided to include 11 parameters measured with SYNAPSA systems (Table 4). In addition, models of orders 3 and 4 were compared. The choice is explained in Section 5—Data Analysis. The best achieved prediction accuracy by the 4th order polynomial model for 11 and 10 input variables is about 8% and 13%, respectively. It is comparable with the sensors’ accuracy of 10% at a stable regime of loading and 20% in the transient periods of operation.
  • The developed model can be considered as a “soft sensor” and used for NOx emissions monitoring and prediction in heavy-duty LHD vehicles with diesel engines. The solution presented in the article will contribute to a better understanding of the working atmosphere of underground crews at workplaces near LHDs. Since most machines are not equipped with sensors for measuring the concentrations of harmful gases, the proposed statistical methods can help improve working conditions by predicting the possible threat of atmospheric pollution by nitrogen oxides.
  • These data of predicted NOx emissions can be utilized as input information for ventilation system power demand and capacity planning based on the production plan, required fleet of vehicles, the length of the transportation routes, and underground mining conditions. With the statistical method proposed in the article for predicting the emission of NOx concentrations into the mine atmosphere, it will be possible to optimize the ventilation system for underground workings. Knowing the production plan and the demand for diesel-powered machinery will make it possible to estimate the value of nitrogen oxide concentrations at the workplace. This will enable ventilation services to manoeuvre the ventilation system accordingly, for example, by increasing the air volume flow to ventilate the workings faster.

Author Contributions

Conceptualization, A.B. and R.Z.; methodology, J.W.; software, J.W.; validation, P.Ś. and J.W.; formal analysis, P.K., P.Ś. and R.Z.; investigation, A.B.; resources, R.Z.; data curation, P.Ś., P.K.; writing—original draft preparation, A.B., J.W., P.K. and R.Z.; writing—review and editing, A.B. and P.K.; visualization, J.W.; supervision, R.Z.; project administration, A.B.; funding acquisition, R.Z. All authors have read and agreed to the published version of the manuscript.

Funding

This research received no external funding.

Data Availability Statement

Data is unavailable due to privacy restrictions.

Acknowledgments

This work is supported by the European Institute of Innovation and Technology (EIT), a body of the European Union, under the Horizon Europe, the EU Framework Programme for Research and Innovation. EIT RawMaterials GmbH under Framework Partnership Agreement No. 21119 (VOT3D—Ventilation Optimizing Technology based on 3D-scanning).

Conflicts of Interest

The authors declare no conflict of interest.

Abbreviations

The following abbreviations are used in this manuscript:
LHDLoad-haul-dumping vehicle
NOxNitrogen Oxides
NMHCNon-Methane Hydro Carbons
SCRSelective Catalytic Reduction
LNTLean NOx Trap
DOCDiesel Oxidation Catalysts
EATExhaust Aftertreatment
EGRExhaust Gas Recirculating
DPFDiesel Particulate Filter
ECUElectronic Control Unit
CRDICommon Rail Direct Injection
PLTProgressive load test
VTTVehicle transient test
PMParticulate matter
VOCVolatile organic compounds
ANNArtificial Neural Networks
MAFMass airflow
RMSERoot mean square error
NRMSENormalized Root Mean Square Error

References

  1. Jiskani, I.M.; Cai, Q.; Zhou, W.; Chang, Z.; Chalgri, S.R.; Manda, E.; Lu, X. Distinctive model of mine safety for sustainable mining in Pakistan. Mining Metall. Explor. 2020, 37, 1023–1037. [Google Scholar] [CrossRef]
  2. Hebda-Sobkowicz, J.; Gola, S.; Zimroz, R.; Wyłomańska, A. Identification and statistical analysis of impulse-like patterns of carbon monoxide variation in deep underground mines associated with the blasting procedure. Sensors 2019, 19, 2757. [Google Scholar] [CrossRef] [PubMed] [Green Version]
  3. Wodecki, J.; Stefaniak, P.; Michalak, A.; Wyłomańska, A.; Zimroz, R. Technical condition change detection using Anderson–Darling statistic approach for LHD machines—Engine overheating problem. Int. J. Min. Reclam. Environ. 2017, 32, 392–400. [Google Scholar] [CrossRef]
  4. Wyłomańska, A.; Zimroz, R. The analysis of stochastic signal from LHD mining machine. In Stochastic Models, Statistics and THEIR Applications; Springer: Berlin/Heidelberg, Germany, 2015; pp. 469–478. [Google Scholar]
  5. Michalak, A.; Śliwiński, P.; Kaniewski, T.; Wodecki, J.; Stefaniak, P.; Wyłomańska, A.; Zimroz, R. Condition Monitoring for LHD Machines Operating in Underground Mine—Analysis of Long-Term Diagnostic Data. In Proceedings of the 27th International Symposium on Mine Planning and Equipment Selection-MPES 2018; Springer: Cham, Switzerland, 2019; pp. 471–480. [Google Scholar]
  6. Dong, L.; Tong, X.; Li, X.; Zhou, J.; Wang, S.; Liu, B. Some developments and new insights of environmental problems and deep mining strategy for cleaner production in mines. J. Clean. Prod. 2019, 210, 1562–1578. [Google Scholar] [CrossRef]
  7. Ziętek, B.; Banasiewicz, A.; Zimroz, R.; Szrek, J.; Gola, S. A portable environmental data-monitoring system for air hazard evaluation in deep underground mines. Energies 2020, 13, 6331. [Google Scholar] [CrossRef]
  8. Wallace, K.; Prosser, B.; Stinnette, J.D. The practice of mine ventilation engineering. Int. J. Min. Sci. Technol. 2015, 25, 165–169. [Google Scholar] [CrossRef]
  9. Wróblewski, A.; Banasiewicz, A.; Gola, S. Heat Balance Determination Methods for Mining Areas in Underground Mines-A Review. In Proceedings of the IOP Conference Series: Earth and Environmental Science, Surakarta, Indonesia, 24–25 August 2021; IOP Publishing: Bristol, UK, 2021; Volume 942, p. 012011. [Google Scholar]
  10. Strumiński, A.; Madeja-Strumińska, B. Mine ventilation practice in Polish copper mines. In Mining in the New Millennium Challenges and Opportunities; CRC Press: Boca Raton, FL, USA, 2020; pp. 173–179. [Google Scholar]
  11. Slazak, N.; Obracaj, D.; Borowski, M. Methods for controlling temperature hazard in Polish coal mines. Arch. Min. Sci. 2008, 53, 497–510. [Google Scholar]
  12. Yin, Z.; Linga, P. Methane hydrates: A future clean energy resource. Chin. J. Chem. Eng. 2019, 27, 2026–2036. [Google Scholar] [CrossRef]
  13. Shaw, S.; Van Heyst, B. An Evaluation of Risk Ratios on Physical and Mental Health Correlations due to Increases in Ambient Nitrogen Oxide (NOx) Concentrations. Atmosphere 2022, 13, 967. [Google Scholar] [CrossRef]
  14. Ghose, M.K.; Majee, S. Sources of air pollution due to coal mining and their impacts in Jharia coalfield. Environ. Int. 2000, 26, 81–85. [Google Scholar] [CrossRef]
  15. Oluwoye, I.; Dlugogorski, B.Z.; Gore, J.; Oskierski, H.C.; Altarawneh, M. Atmospheric emission of NOx from mining explosives: A critical review. Atmos. Environ. 2017, 167, 81–96. [Google Scholar] [CrossRef] [Green Version]
  16. Banasiewicz, A.; Janicka, A.; Michalak, A.; Włostowski, R. Photocatalysis as a method for reduction of ambient NOx in deep underground mines. Measurement 2022, 200, 111453. [Google Scholar] [CrossRef]
  17. Kampa, M.; Castanas, E. Human health effects of air pollution. Environ. Pollut. 2008, 151, 362–367. [Google Scholar] [CrossRef] [PubMed]
  18. Fukuto, J.M.; Cho, J.Y.; Switzer, C.H. The Chemical Properties of Nitric Oxide and Related Nitrogen Oxides. In Nitric Oxide; Elsevier: Amsterdam, The Netherlands, 2000; pp. 23–40. [Google Scholar] [CrossRef]
  19. Abdelsalam, E.M.; Mohamed, Y.; Abdelkhalik, S.; El Nazer, H.A.; Attia, Y.A. Photocatalytic oxidation of nitrogen oxides (NOx) using Ag-and Pt-doped TiO2 nanoparticles under visible light irradiation. Environ. Sci. Pollut. Res. 2020, 27, 35828–35836. [Google Scholar] [CrossRef] [PubMed]
  20. Almetwally, A.A.; Bin-Jumah, M.; Allam, A.A. Ambient air pollution and its influence on human health and welfare: An overview. Environ. Sci. Pollut. Res. 2020, 27, 24815–24830. [Google Scholar] [CrossRef]
  21. Galbreath, K.C.; Zygarlicke, C.J.; Tibbetts, J.E.; Schulz, R.L.; Dunham, G.E. Effects of NOx, α-Fe2O3, γ-Fe2O3, and HCl on mercury transformations in a 7-kW coal combustion system. Fuel Process. Technol. 2005, 86, 429–448. [Google Scholar] [CrossRef]
  22. Hori, M.; Matsunaga, N.; Malte, P.C.; Marinov, N.M. The effect of low-concentration fuels on the conversion of nitric oxide to nitrogen dioxide. In Proceedings of the Symposium (International) on Combustion, Sydney, Australia, 5–10 July 1992; Elsevier: Amsterdam, The Netherlands, 1992; Volume 24, pp. 909–916. [Google Scholar]
  23. Özmen, İ.; Aksoy, E. Respiratory emergencies and management of mining accidents. Turk. Thorac. J. 2015, 16, S18. [Google Scholar] [CrossRef] [Green Version]
  24. Shriwas, M.; Pritchard, C. Ventilation Monitoring and Control in Mines. Min. Metall. Explor. 2020, 37, 1015–1021. [Google Scholar] [CrossRef]
  25. Iqbal, M.Y.; Wang, T.; Li, G.; Li, S.; Hu, G.; Yang, T.; Gu, F.; Al-Nehari, M. Development and Validation of a Vibration-Based Virtual Sensor for Real-Time Monitoring NOx Emissions of a Diesel Engine. Machines 2022, 10, 594. [Google Scholar] [CrossRef]
  26. Söderena, P.; Laurikko, J.; Weber, C.; Tilli, A.; Kuikka, K.; Kousa, A.; Väkevä, O.; Venho, A.; Haaparanta, S.; Nuottimäki, J. Monitoring Euro 6 diesel passenger cars NOx emissions for one year in various ambient conditions with PEMS and NOx sensors. Sci. Total Environ. 2020, 746, 140971. [Google Scholar] [CrossRef]
  27. Krot, P.; Sliwinski, P.; Zimroz, R.; Gomolla, N. The identification of operational cycles in the monitoring systems of underground vehicles. Measurement 2020, 151, 107111. [Google Scholar] [CrossRef]
  28. Krot, P.; Zimroz, R.; Sliwinski, P.; Gomolla, N. Safe Operation of Underground Mining Vehicles Based on Cyclic Fatigue Monitoring of Powertrains. In Structural Integrity and Fatigue Failure Analysis; Lesiuk, G., Szata, M., Blazejewski, W., Jesus, A.M.D., Correia, J.A., Eds.; Springer International Publishing: Cham, Switzerland, 2022; pp. 283–292. [Google Scholar] [CrossRef]
  29. KGHM ZANAM. LHD LD1701. Available online: https://www.kghmzanam.com/wp-content/uploads/2021/05/LKP_1701_EN.pdf (accessed on 16 January 2023).
  30. DEUTZ TCD 12.0 and TCD 16.0 Diesel Engine. Available online: https://www.deutzsupport.com/product-details/tcd-12-0-and-tcd-16-0/ (accessed on 16 January 2023).
  31. Stachulak, J.; Allen, C. Evaluation of the effects of diesel oxidation catalysts on NO2 emissions from diesel-powered mining vehicles. CIM J. 2020, 11, 104–110. [Google Scholar] [CrossRef]
  32. Demuynck, J.; Favre, C.; Bosteels, D.; Bunar, F.; Spitta, J.; Kuhrt, A. Diesel Vehicle with Ultra-Low NOx Emissions on the Road. In Proceedings of the 14th International Conference on Engines & Vehicles; SAE International, Napoli, Italy, 15–19 September 2019. [Google Scholar] [CrossRef]
  33. Stobart, R.; Yang, Z. A control-oriented NOx emissions model for diesel engines. Int. J. Powertrains 2016, 5, 191–210. [Google Scholar] [CrossRef]
  34. Rao, V.; Honnery, D. A comparison of two NOx prediction schemes for use in diesel engine thermodynamic modelling. Fuel 2013, 107, 662–670. [Google Scholar] [CrossRef]
  35. d’Ambrosio, S.; Finesso, R.; Fu, L.; Mittica, A.; Spessa, E. A control-oriented real-time semi-empirical model for the prediction of NOx emissions in diesel engines. Appl. Energy 2014, 130, 265–279. [Google Scholar] [CrossRef]
  36. Tschanz, F.; Amstutz, A.; Onder, C.H.; Guzzella, L. Control of diesel engines using NOx-emission feedback. Int. J. Engine Res. 2013, 14, 45–56. [Google Scholar] [CrossRef]
  37. Yuan, Z.; Shi, X.; Jiang, D.; Liang, Y.; Mi, J.; Fan, H. Data-Based Engine Torque and NOx Raw Emission Prediction. Energies 2022, 15, 4346. [Google Scholar] [CrossRef]
  38. Asad, U.; Kelly, C.; Wang, M.; Tjong, J. Effects of Intake Air Humidity on the NOX Emissions and Performance of a Light-Duty Diesel Engine. In Proceedings of the 2012 Internal Combustion Engine Division Fall Technical Conference, Vancouver, BC, Canada, 23–26 September 2012. [Google Scholar] [CrossRef]
  39. Obodeh, O.; Ajuwa, C.I. Evaluation of Artificial Neural Network Performance in Predicting Diesel Engine NOx Emissions. Eur. J. Sci. Res. 2009, 33, 642–653. [Google Scholar]
  40. Jassim, H.S.; Lu, W.; Olofsson, T. Determining the environmental impact of material hauling with wheel loaders during earthmoving operations. J. Air Waste Manag. Assoc. 2019, 69, 1195–1214. [Google Scholar] [CrossRef] [Green Version]
  41. Krijnsen, H.C.; Bakker, R.; van Kooten, W.E.J.; Calis, H.P.A.; Verbeek, R.P.; van den Bleek, C.M. Evaluation of Fit Algorithms for NOx Emission Prediction for Efficient DeNOx Control of Transient Diesel Engine Exhaust Gas. Ind. Eng. Chem. Res. 2000, 39, 2992–2997. [Google Scholar] [CrossRef]
  42. Ozgul, E.; Bedir, H. Fast NOx emission prediction methodology via one-dimensional engine performance tools in heavy-duty engines. Adv. Mech. Eng. 2019, 11, 1–16. [Google Scholar] [CrossRef] [Green Version]
  43. Wen, H.T.; Lu, J.H.; Jhang, D.S. Features Importance Analysis of Diesel Vehicles NOx and CO2 Emission Predictions in Real Road Driving Based on Gradient Boosting Regression Model. Int. J. Environ. Res. Public Health 2021, 18, 13044. [Google Scholar] [CrossRef] [PubMed]
  44. Funk, S. Real world NOx sensor accuracy assessment and implications for REAL NOx tracking. In SAE Technical Paper Series; SAE International: Warrendale, PA, USA, 2021; Number 2021-01-0593. [Google Scholar]
  45. Kawamoto, Y.; Todo, Y.; Shimokawa, H.; Aoki, K.; Kawai, M.; Ide, K. Development of High Accuracy NOx Sensor. In Proceedings of the WCX SAE World Congress Experience, Detroit, MI, USA, 9–11 April 2019; SAE International: Warrendale, PA, USA, 2019. [Google Scholar] [CrossRef]
  46. Draper, N.R.; Smith, H. Applied Regression Analysis; John Wiley & Sons: Hoboken, NJ, USA, 1998; Volume 326. [Google Scholar]
Figure 1. The LHD vehicle under investigation: LKP-1701 (KGHM ZANAM) with a powerful diesel engine for the underground mines [29].
Energies 16 02149 g001
Figure 2. The characteristics of the output power and torque by the rotation speed for DEUTZ TCD 12.0 V6 diesel engine [30].
Energies 16 02149 g002
Figure 3. The diesel engine DEUTZ TCD 12.0 V6 installed on the LHD-1701 vehicle and its SCR system [30]: 1—Engine control module; 2—AdBlue® pipe; 3—AdBlue® pump; 4—AdBlue® tank; 5—Solenoid valve; 6—Coolant line for preheating the AdBlue® tank; 7—Exhaust gas temperature sensor; 8—Coolant line for cooling the proportioner; 9—Dispenser; 10—SCR catalytic converter; 11—NOx sensor.
Energies 16 02149 g003
Figure 4. Relation of NOx emission (ENGNOX) with engine rotation speed (ENGRPM) over several working cycles with corresponding second-order polynomial regression.
Energies 16 02149 g004
Figure 5. Relations of NOx emission (ENGNOX) with engine rotation speed (ENGRPM); engine intake pressure (INTAKEP); fuel use (FUELUS); and engine acceleration (ENGTPS) with the corresponding second-order polynomial regressions.
Energies 16 02149 g005
Figure 6. Full set of input variables.
Energies 16 02149 g006
Figure 7. Orders 3 and 4, all 11 variables.
Energies 16 02149 g007
Figure 8. Orders 3 and 4, selected 10 variables.
Energies 16 02149 g008
Figure 9. Correlation of predicted and original data for all 11 variables.
Energies 16 02149 g009
Figure 10. Correlation of predicted and original data for selected 10 variables.
Energies 16 02149 g010
Table 1. Parameters of DEUTZ TCD 12.0 V6 diesel engine [30].
ParameterValueUnits
Power output as per ISO 14396390kW
at speed2100rpm
Max. torque2130Nm
at speed1400rpm
Min. idling speed600rpm
Max. nominal speed1800–2100rpm
Table 2. Additional parameters of DEUTZ TCD 12.0 V6 diesel engine [30].
ParameterValueUnits
Number of cylinders6
Piston stroke145mm
Cylinder bore132mm
Displacement11.900cc
Specific fuel consumption194g/kWh
Euro standardsEuro 5
Table 3. Parameters of NOx sensor.
ParameterValueUnits
Measuring range (NOx)0–1500ppm
Accuracy±10 (20)%
Operating temperature−40–105°C
Exhaust gas temperature<800°C
Table 4. Parameters of the monitoring system taken for analysis.
NrParameterDescriptionUnits
ENGNOXNOx Emissionsppm
1ENGCOOLTCoolant temperature°C
2ENGOILTOil TemperaturekPa
3ENGRPMEngine rotationsrpm
4ENGTPSEngine acceleration%
5FUELUSFuel consumptionL/h
6GROILPGear oil pressurekPa
7GROILTGear oil temperatureC
8HYDOILPHydraulic oil pressureMPa
9INTAKEPIntake air pressurekPa
10INTAKETIntake air temperature°C
11SPEEDMachine speedkm/h
Table 5. RMSE values for the different input variables taken in the model.
10 Variables11 Variables
Model of order 323.23121.179
Model of order 417.34214.131
Table 6. NRMSE errors for respective model orders and 11 variables.
Training SegmentTesting Segment
Model of order 30.00240.0342
Model of order 40.00160.0478
Table 7. NRMSE errors for respective model orders and 10 variables.
Training SegmentTesting Segment
Model of order 30.00260.0337
Model of order 40.00190.0362
Disclaimer/Publisher’s Note: The statements, opinions and data contained in all publications are solely those of the individual author(s) and contributor(s) and not of MDPI and/or the editor(s). MDPI and/or the editor(s) disclaim responsibility for any injury to people or property resulting from any ideas, methods, instructions or products referred to in the content.

