1. Introduction
Managing information quality is crucial in ICT systems used in modern technical installations. It is primarily associated with ensuring the quality of provided services and security, including guaranteeing information privacy. Information quality management is fundamental in a situation of implementing reliable information exchange between ICT system components. In addition, in the case of their advanced functionalities, it includes control over mechanisms of autonomous delegation of specific functions. Information quality management should be knowledge-based, cumulative and anticipatory, resulting from gathered experience, and use codified standards and recommendations. One needs to be aware that no information quality management will eliminate the risk associated with utilising the possibilities of ICT technical networks. Given the increasing complexity of their structure and growing functional sophistication, it is entirely natural. However, management enables changing unjustified risk to a risk that is well thought through and justified by anticipated benefits. The increasing complexity of ICT networks leads to redefining information flow management methods. Two development directions are provided. The first one will be based on developing monitoring mechanisms. After some time, this may lead to accumulating vast (excessively high) amounts of data on the functioning of an ICT network and a significant increase in maintenance and management costs. The second direction will be associated with strengthening the importance of confidence in ICT network functioning and limiting monitoring mechanisms to a necessary minimum.
On the other hand, information quality management is very important in critical ICT systems considering that our lives and health often depend on the quality of information we obtain from them [
1]. Transport systems can frequently be called critical systems. One example of depending on a critical transport system is a dysfunctional traffic light power system, which may give the right of way to users from colliding directions [
1]. Of course, such a system will ultimately lead to a traffic accident. This example is very significant. Another example based on traffic lights at an intersection is related to a response to a red light that can be misled by the colourful red advertisements seen by drivers in the background. Such a driver may be unable to react to the red light of a system that manages the right of way because there is a continuous red advertisement illumination in the background. The research presented herein may lead to searching for such ICT power system elements that, e.g., convey information to users in an ambiguous or unclear manner. Hence, it can improve numerous elements of critical supply systems. In the case of transport systems, these will usually include streamlining the transport of goods, faster travel, reduced exhaust gas emissions, and fewer accidents and collisions. They can also enable a higher level of delivery system perfection, resulting in eco-friendlier technical systems [
2,
3].
Using information quality assessment (IQA) based on information quality (IQ) measurement by uncertainty modelling to evaluate ICT systems will enable monitoring the maintenance of appropriate information quality, e.g., after ICT system modifications or locating system elements weakest in terms of quality [
3,
4]. We use the IQA method presented in our own previous publications [
1,
2].
We can recognise three ways of improving IQ using IQM:
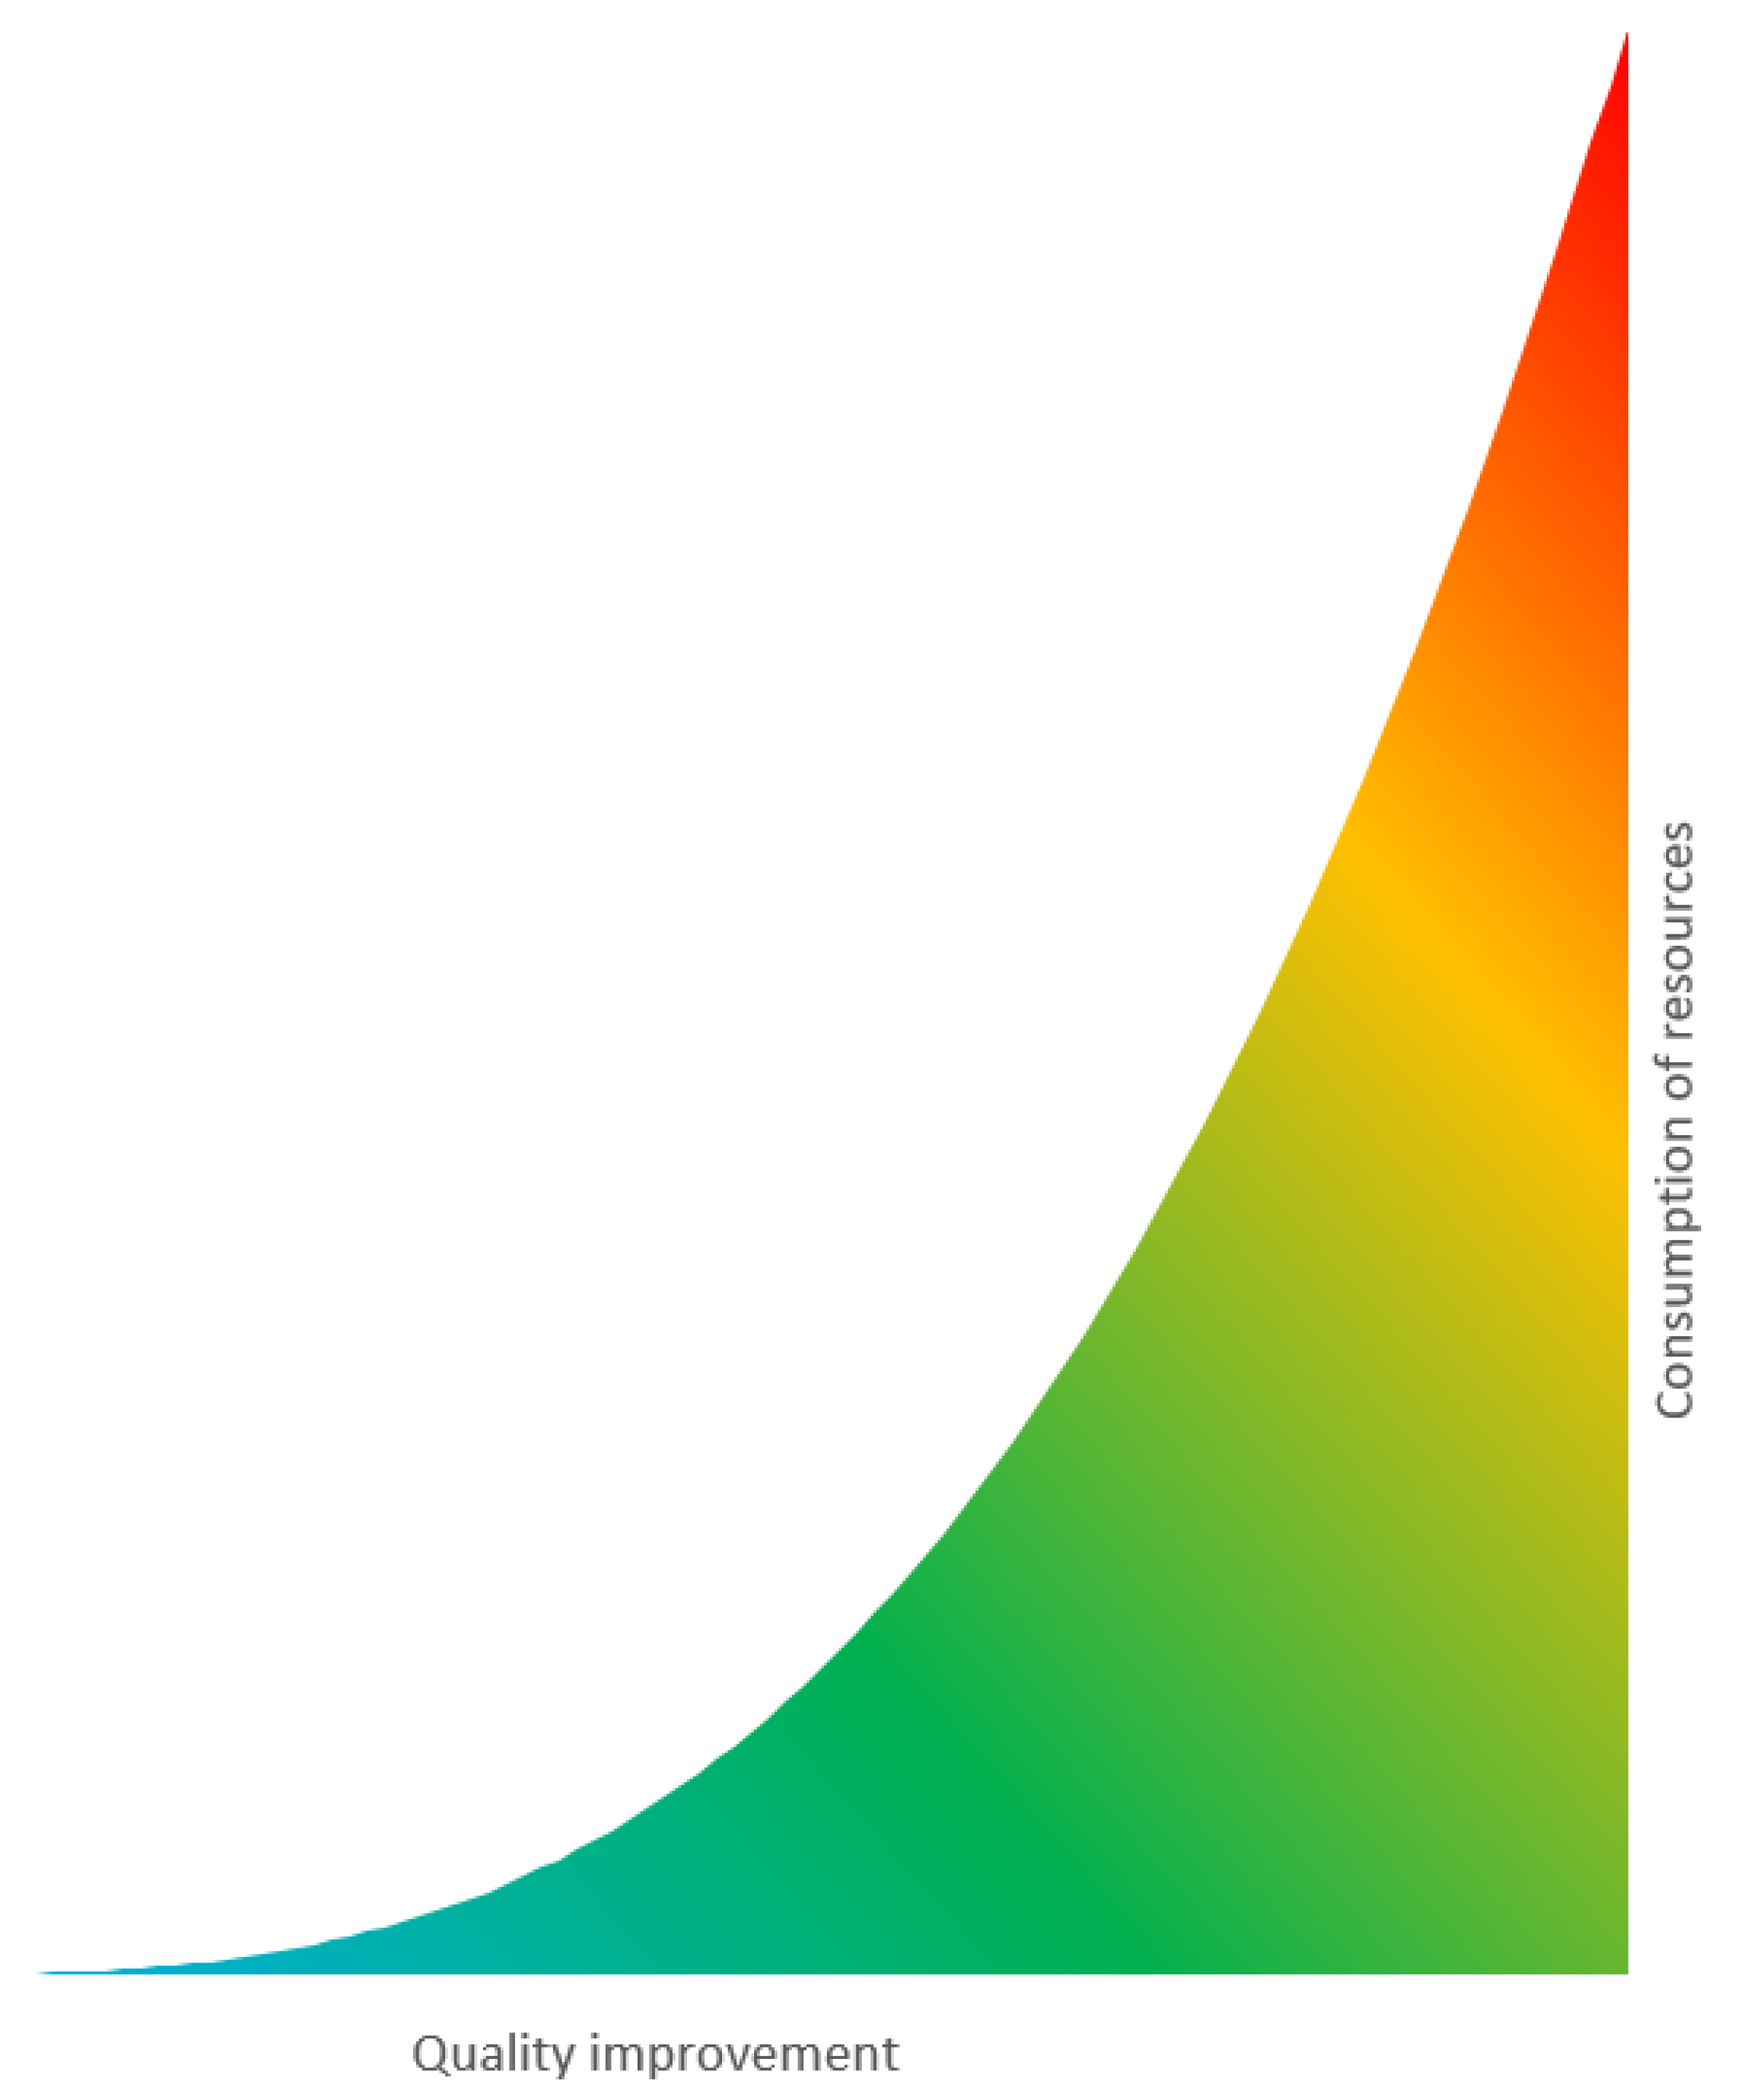
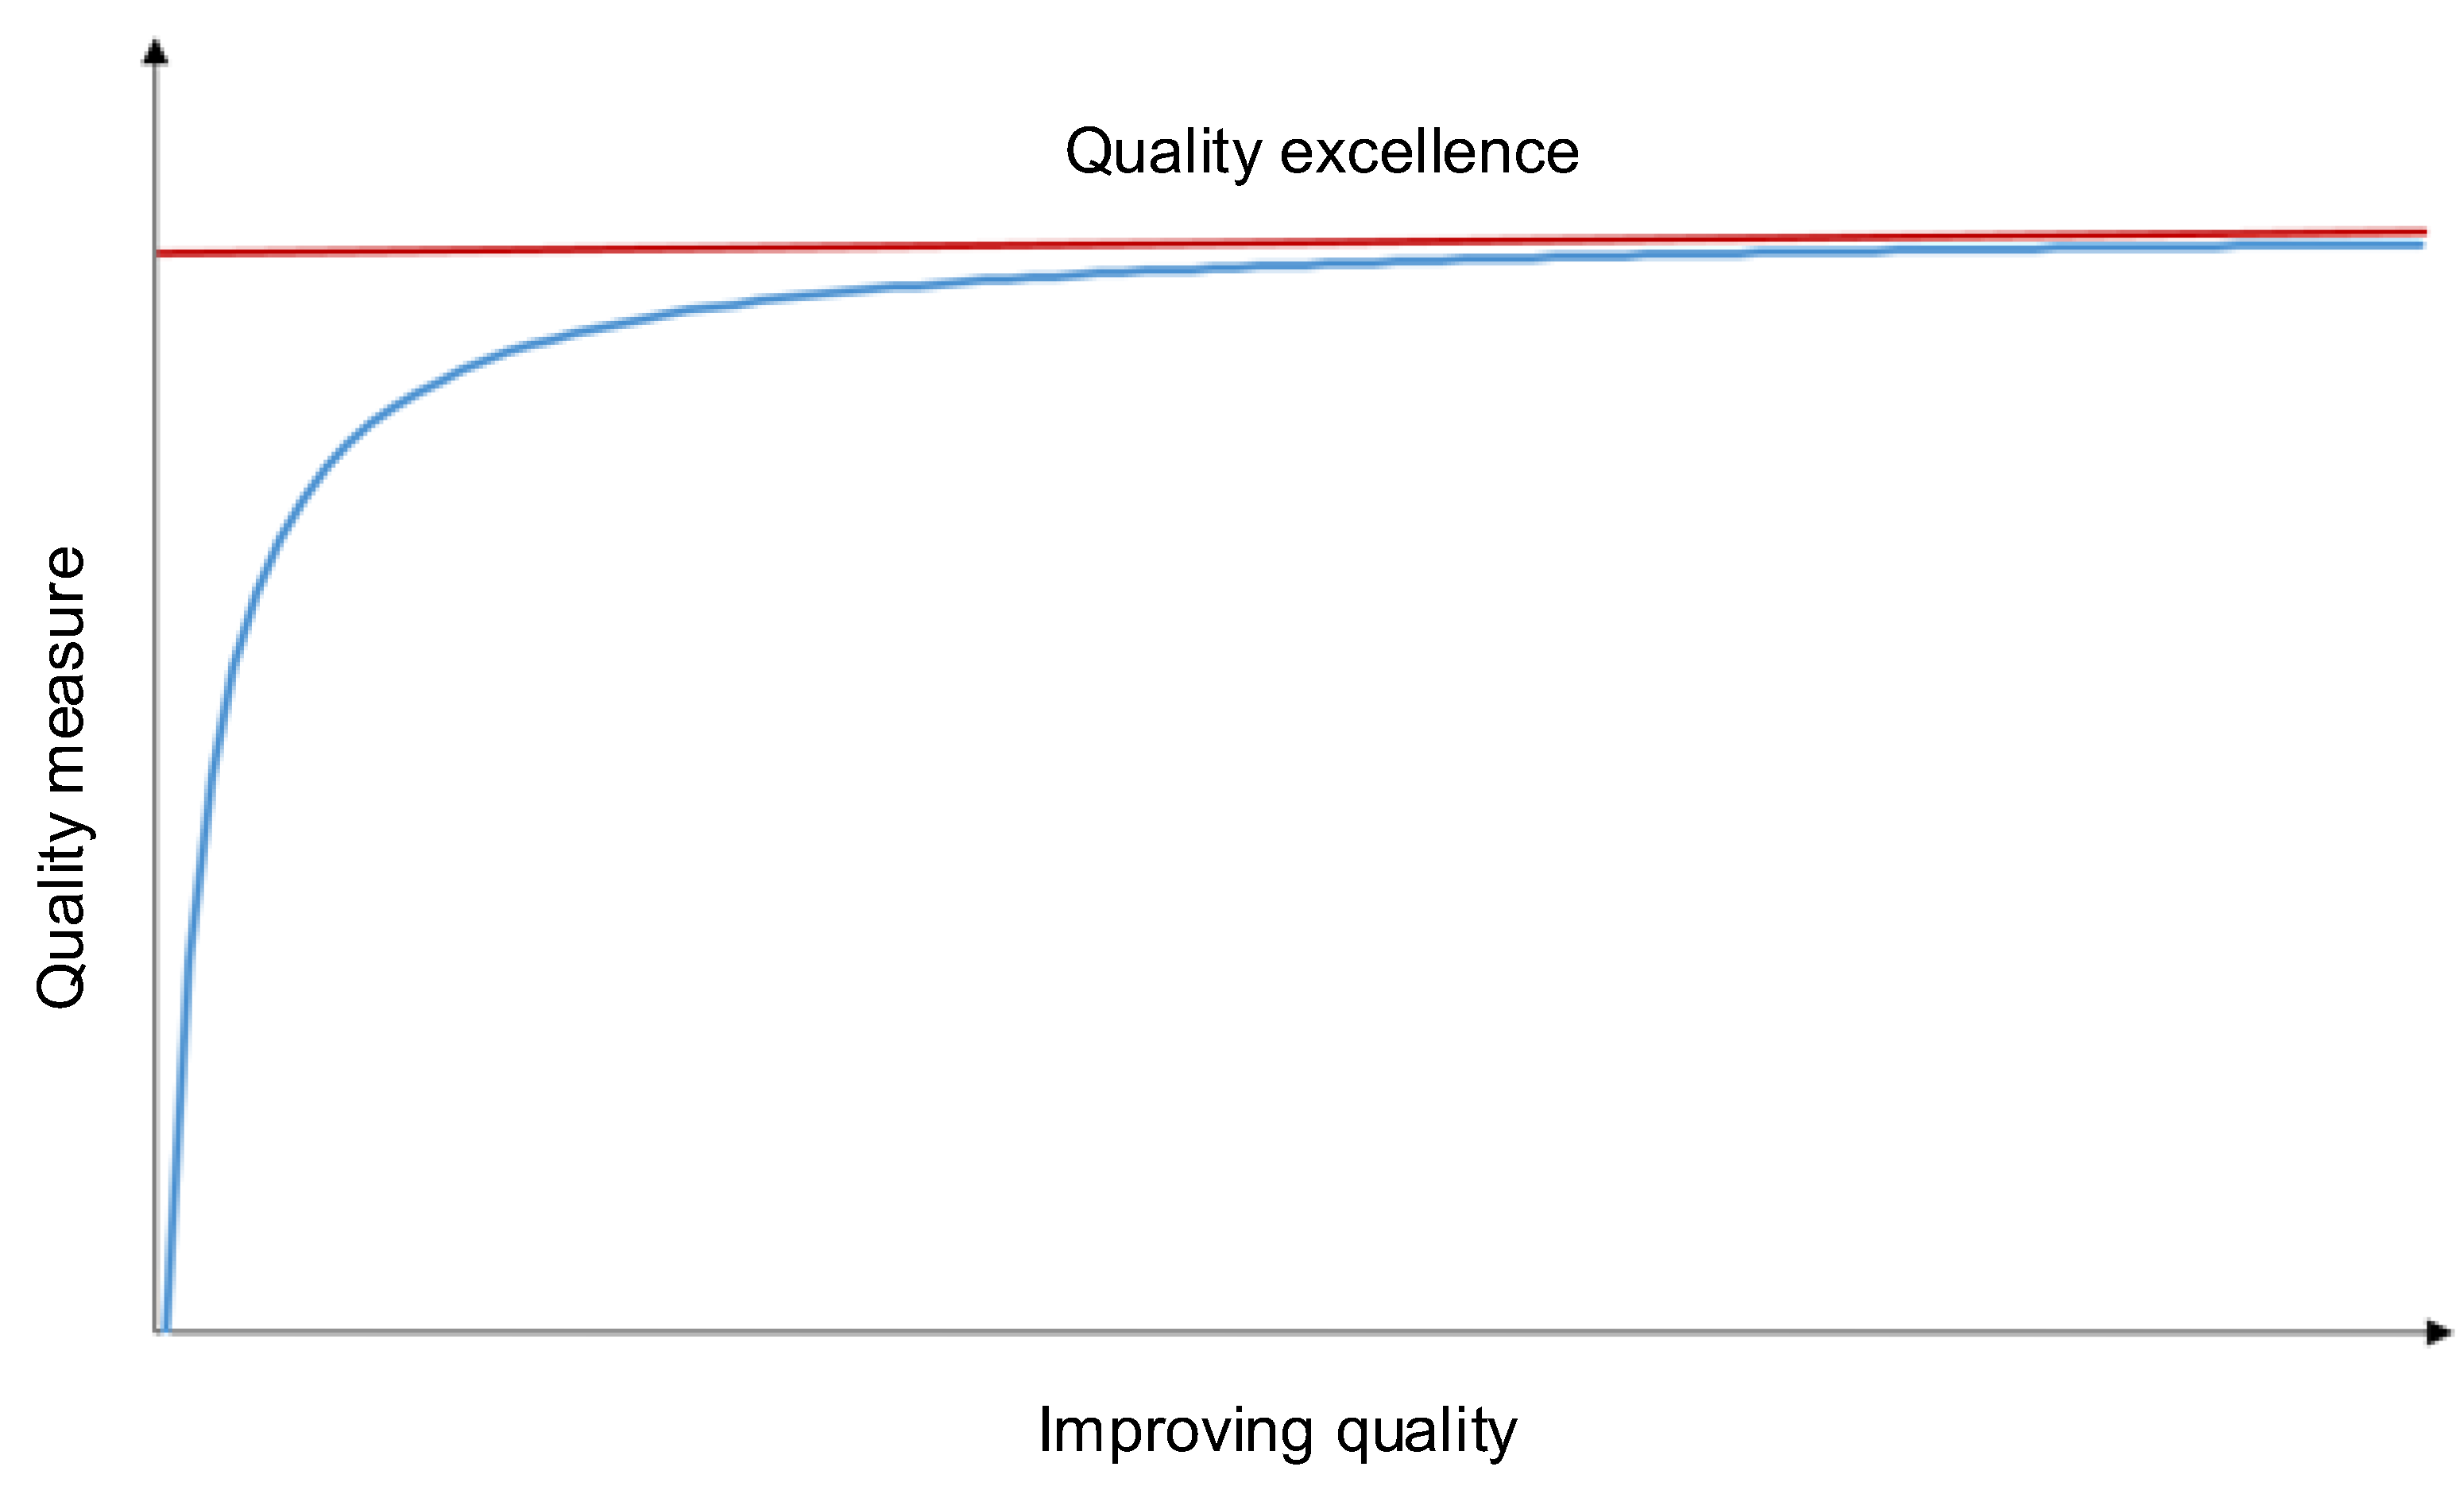
The IQ index optimisation. As indicated by
Figure 1, even a small change in information quality improvement (allocating resources to improving quality) may lead to a significant difference in the information quality index. However, when information quality is high, improving the quality may be unprofitable (in other words—requiring large expenditures to provide mediocre results) [
2,
3,
5,
6].
Weakest parts of the IQ model can be found. It makes it possible to use IQM to improve the IQ of the whole system by improving the IQ of the weakest elements. This function of IQM can improve the system’s IQ at the lowest cost [
1,
3].
The mistakes in the IQ model can be found. Mistakes found in models make system optimisation possible, for instance, removing unnecessary, redundant elements or showing where additional or redundant components are needed. Mistakes found in models make proper system assessments possible too. In section four of this article, the authors show an example of seeking mistakes in the IQ model using IQM based on IQA. It will be possible to use the results obtained within this study for IQ model assessment by seeking and eliminating mistakes in the IQ models. Thus, our road safety can be approved based on the example mentioned in the previous paragraph. Unnecessary, redundant system elements give unneeded information. On the other hand, information elements can provide too little information. Both unneeded and too little information reduce the level of interpretation by drivers. It is associated with one dimension of IQ named “appropriate amount of data”. This dimension determines what amount of data is appropriate to enable task execution and simultaneously indicates that the given amount is sufficient and that more data could decrease the quality of information [
1,
2,
3].
2. Research Background
Information quality management in ICT systems is critical, which is why there is an increasing interest in entities in this issue. Entities already involved in information quality management see the benefits and strive to improve the quality of information continuously. Currently, with the growing popularity of information quality management, it is carried out in an extensive range of topics. The information quality management method presented in the article is based on the assessment of information quality based on uncertainty modelling and is an innovative solution. The current state of knowledge and the thematic scopes of the conducted research are presented below.
The articles [
7,
8] might help organise a diagnostic system that uses artificial neural networks. These studies [
7,
8] propose a technique that illustrates the practical application of technical diagnostics findings in planning a technical object maintenance system. The work demonstrates the essence of a state shift in a technical object, which results in a decline in functional qualities. As a result, an efficient recognition of the object’s current state is required. Organising preventive measures is an acceptable countermeasure if the detected condition is incompleteness or unfitness (restoration of the object). This process can help information quality management.
The aim of the research, the results of which are presented in [
9], was to assess the impact of information management elements (information quality (IQ), quality of e-services (E-SQ) and quality of the system (SYQ)) on the results of Jordanian commercial banks (in the electronic banking sector) and to examine the possibilities applying the dimensions of information system success (IS Success, ISS) and electronic service quality (E-SERVQUAL (ESQ)) in explaining bank performance. As part of the survey, a research model was created to examine the three components INQ, E-SQ and SYQ as independent variables carrying information about the results of banks. The final results of the research make it clear that INQ E-SQ and SYQ are the main factors associated with improving the bank’s performance. However, the presented method is based on a statistical approach. In order to increase flexibility and obtain a universal method, the uncertainty modelling method should be used in this case, enabling finding and removing quality problems at the lowest cost.
The article [
10] summarises the problems encountered in mass production to order and the review of information quality management based on the experience of predecessors. The article compares quality management models (Juran Trilogy, PDCA, quality control circle (QCC), total quality management (TQM), zero defect, quality loss function, the two kinds of quality multivariate diagnosis), taking into account their benefits and limitations. In addition, the concept, basic theory and recursive formula of comprehensive information quality management are presented, which is proposed to solve the main problems related to mass personalisation in China.
The authors of the work [
11] presented a new approach to quality assessment, which was proposed for data acquisition, information extraction and combining data and information in the process of making decisions about data acquisition using remote sensing. The case of assessing the quality of geographic information systems using remote sensing products is also discussed. Aspects of a comprehensive quality model for remote sensing and the problems that remain to be solved offer the prospect of possible changes in this field.
The work [
12] presents selected relevant approaches and findings that illustrate how considerations of the quality of information and analytical technologies can enable the improvement of medical practice. The authors of the article proposed the basic components of a medical coding support system, followed by related data analysis, information fusion, and information quality measurement. The uncertainty modelling method presented in this article could be used to search for information of poor quality, as well as to remove quality problems at the lowest cost, which is very important in the case of medical systems.
The author of [
13] proposed an improved aspect of high-level information linking (HLIF). Actively managing the quality of the information in HLIF is essential to ensure that it does not adversely affect decision-making and the ability to determine the best course of action (COA). The authors of the result of the work proposed a comprehensive structure that enables the development of an information quality meta-model (IQMM), characteristics of information quality elements, assessing the impact of information quality elements and their corresponding mitigation, and integrating the above-mentioned objectives into the HILF processes and lifecycle.
The article [
14] presents a theoretical analysis of data quality management. Data quality is crucial in the proper measurement and analysis of science, technology and innovation, which allows for proper monitoring of research performance, productivity, and strategic decision-making. The article presents a data quality measurement model, which is a modified version of the model developed by Wang and Strong in 1996 [
15]. This model groups twenty different data quality dimensions into four main categories: internal, contextual, representative, and access. Together, all dimensions determine data quality. The model proposed in this article could be successfully used to improve the quality of data related to education at the lowest possible cost.
The article [
16] presents the progress of the work on the method of modelling contradictions that appear when assessing the quality of marketing information. The first part of the work presents the essence of the principle of quality mapping and the principle of assessing the quality of objects, paying attention to the problem of qualitative contradictions. A model of the quality of marketing information was defined, and a method of researching and assessing the quality of marketing information was adopted. The author of the work, designing his own model, referred to Gray’s Systems Theory and Theory of Relations and Regression at the stage of identifying and ordering qualitative contradictions and to the Theory of Solving Inventive Problems at the stage of determining methods of solving the problem of qualitative contradictions to improve the quality of marketing information. To solve quality problems, the uncertainty model presented in this article could work very well here.
The aim of the research presented in [
17] was to assess the relationship between information quality management and organisational performance in telecommunications companies in Rivers State, Nigeria. The study found that information quality management can impact organisational performance by ensuring information accuracy. The method presented in this source is based on a statistical approach that is not very flexible. If an uncertainty modelling method is used, greater universality could be achieved because certain information is not needed, and information already available may come from sources that are not correlated with each other.
The article [
18] comprehensively describes the current literature on data fusion, emphasising information quality (IQ) and performance assessment. Next, the main data fusion models, frameworks, architectures, algorithms, solutions, problems and requirements were analysed. The general process of data fusion engineering is presented, and the IQ approach, as well as the different methodologies and frameworks used to assess IQ in information systems, are discussed. In addition, data fusion systems and related criteria are presented. Information on the context in data fusion systems and their IQ assessment is also presented. Next, performance issues of data fusion systems were reviewed. The method based on uncertainty modelling presented in this article could be used to remove quality problems at the lowest cost, increasing the efficiency of data fusion systems.
The article [
19] presents information quality management in relation to Internet of Things (IoT) systems. As part of the study, 21 data quality (DQ) management methodologies were tested and compared, including the processes of DQ definition, assessment and improvement, and five International Organization for Standardization (ISO) standards related to DQ. The authors emphasised that their work can be a guide to assessing the quality of data in IoT systems, with the caveat that IoT DQ management techniques are still young and require constant analysis in order to improve them. The proposed uncertainty modelling method could be used as a model for further development developed by methods [
19] and its verification in the context of information quality.
The aim of the research presented in [
20] was to develop a prioritisation-based taxonomy of accounting information system (AIS) information quality factors using a fuzzy analytical hierarchy process (AHP) approach. AIS information production processes directly affect the quality of the information produced. The authors of the article stressed that the implications of the fuzzy AHP approach are novel in this field of research, as it has been successfully used previously in various other fields, e.g., electrics and electronics, selection of suppliers, agile software development, and selection of personnel.
The article [
21] presents issues concerning the impact of operating conditions on the functional reliability of fire alarm systems (FAS) in selected critical infrastructure (CIB) buildings. Identifying the course of changes in the safety hazards of the SSP operation process in individual lines of the system, especially in the initial phase of operation, allows the persons supervising the work to influence the work parameters on an ongoing basis. Quality indicators could also be used to detect threats and thus manage quality to improve CIB security. The method based on data uncertainty modelling presented in this article could be used to check errors in the fire protection system and find its weaknesses, as well as to remove quality problems at the lowest cost.
The importance of management is also presented in the article [
22]. This article presents proprietary approaches to dynamically solving the problem of aircraft parking stand allocation when the planned allocation cannot be implemented due to operational disruptions. The proposed multi-criteria dynamic job allocation method uses fuzzy logic to support decision-making under conditions of uncertainty. The proposed approach is similar to information quality management presented in the following chapters, with the difference that the method presented on the following pages has much more advanced possibilities.
The article [
23] presents research on the reliability of wind farm (WF) equipment based on analytical models using reliability dependencies. However, the results indicate that this approach is quite challenging to implement in simulation studies. The article presents the organisation, implementation, and analysis of the simulations carried out for the evaluation of the quality of the maintenance system of wind farm equipment WF. Farm management is based on many factors, and the method based on uncertainty modelling presented in this article could work perfectly.
The article [
24] presents the development of a general method for determining the minimum level of training at which the risk of causing an accident in air traffic is acceptable. The article uses an innovative method of accident risk assessment based on an expert system. The developed expert system with a hierarchical structure made it possible to describe both the actions of the participants in the event and their consequences depending on the work of the ground service personnel. Ultimately, a sensitivity analysis determined the minimum level of operator training. This article [
24] deals with risk management through the lower probability of an air accident occurrence. This topic is concurrent with information quality management to reduce road accident risk.
In the article [
25], the authors propose a so-called light model of data quality management that can be used to assess the maturity of the processes that manage the quality of data in IoT environments in which general data and sensor data are combined. Light models mean they accept a low-level amount of information for created models. It is the first step to the IQA based on uncertainty models, which we have been using for many years.
The authors of all the above publications suggest the possibility of using quality or information quality management. Still, none of them proposes a specific way of proceeding except solutions based on statistical models.
Only in two publications [
22,
25] did the authors propose an approach based on uncertainty models. However, their solutions are in the early stages, and we have been using them for several years. Other authors still rely on solutions based on statistical models.
Table 1 summarises the above publications, specifying the area of application. It should be noted that information quality management is used in an extensive and diverse application area. For this reason, it is necessary to ensure that modern methods are universal and can support information quality management with information that is not correlated with each other.
This article aims to present one of the aspects of IQM, namely the detection of imperfections in models of IQA (created by one of the authors [
1,
2]) based on uncertainty modelling. This aspect of IQM has been shown based on the example of cross-road light management, actually by the IQM of lights management. This article presents a method of IQM that uses IQA based on uncertainty modelling developed by one of the authors. Uncertainty modelling for IQA has the primary advantage: we do not need complete information about the system, like in assessments based on statistical models (usually found in the literature), for effective assessment. That is a primary gap that this article tries to fill.
3. Information Quality Model
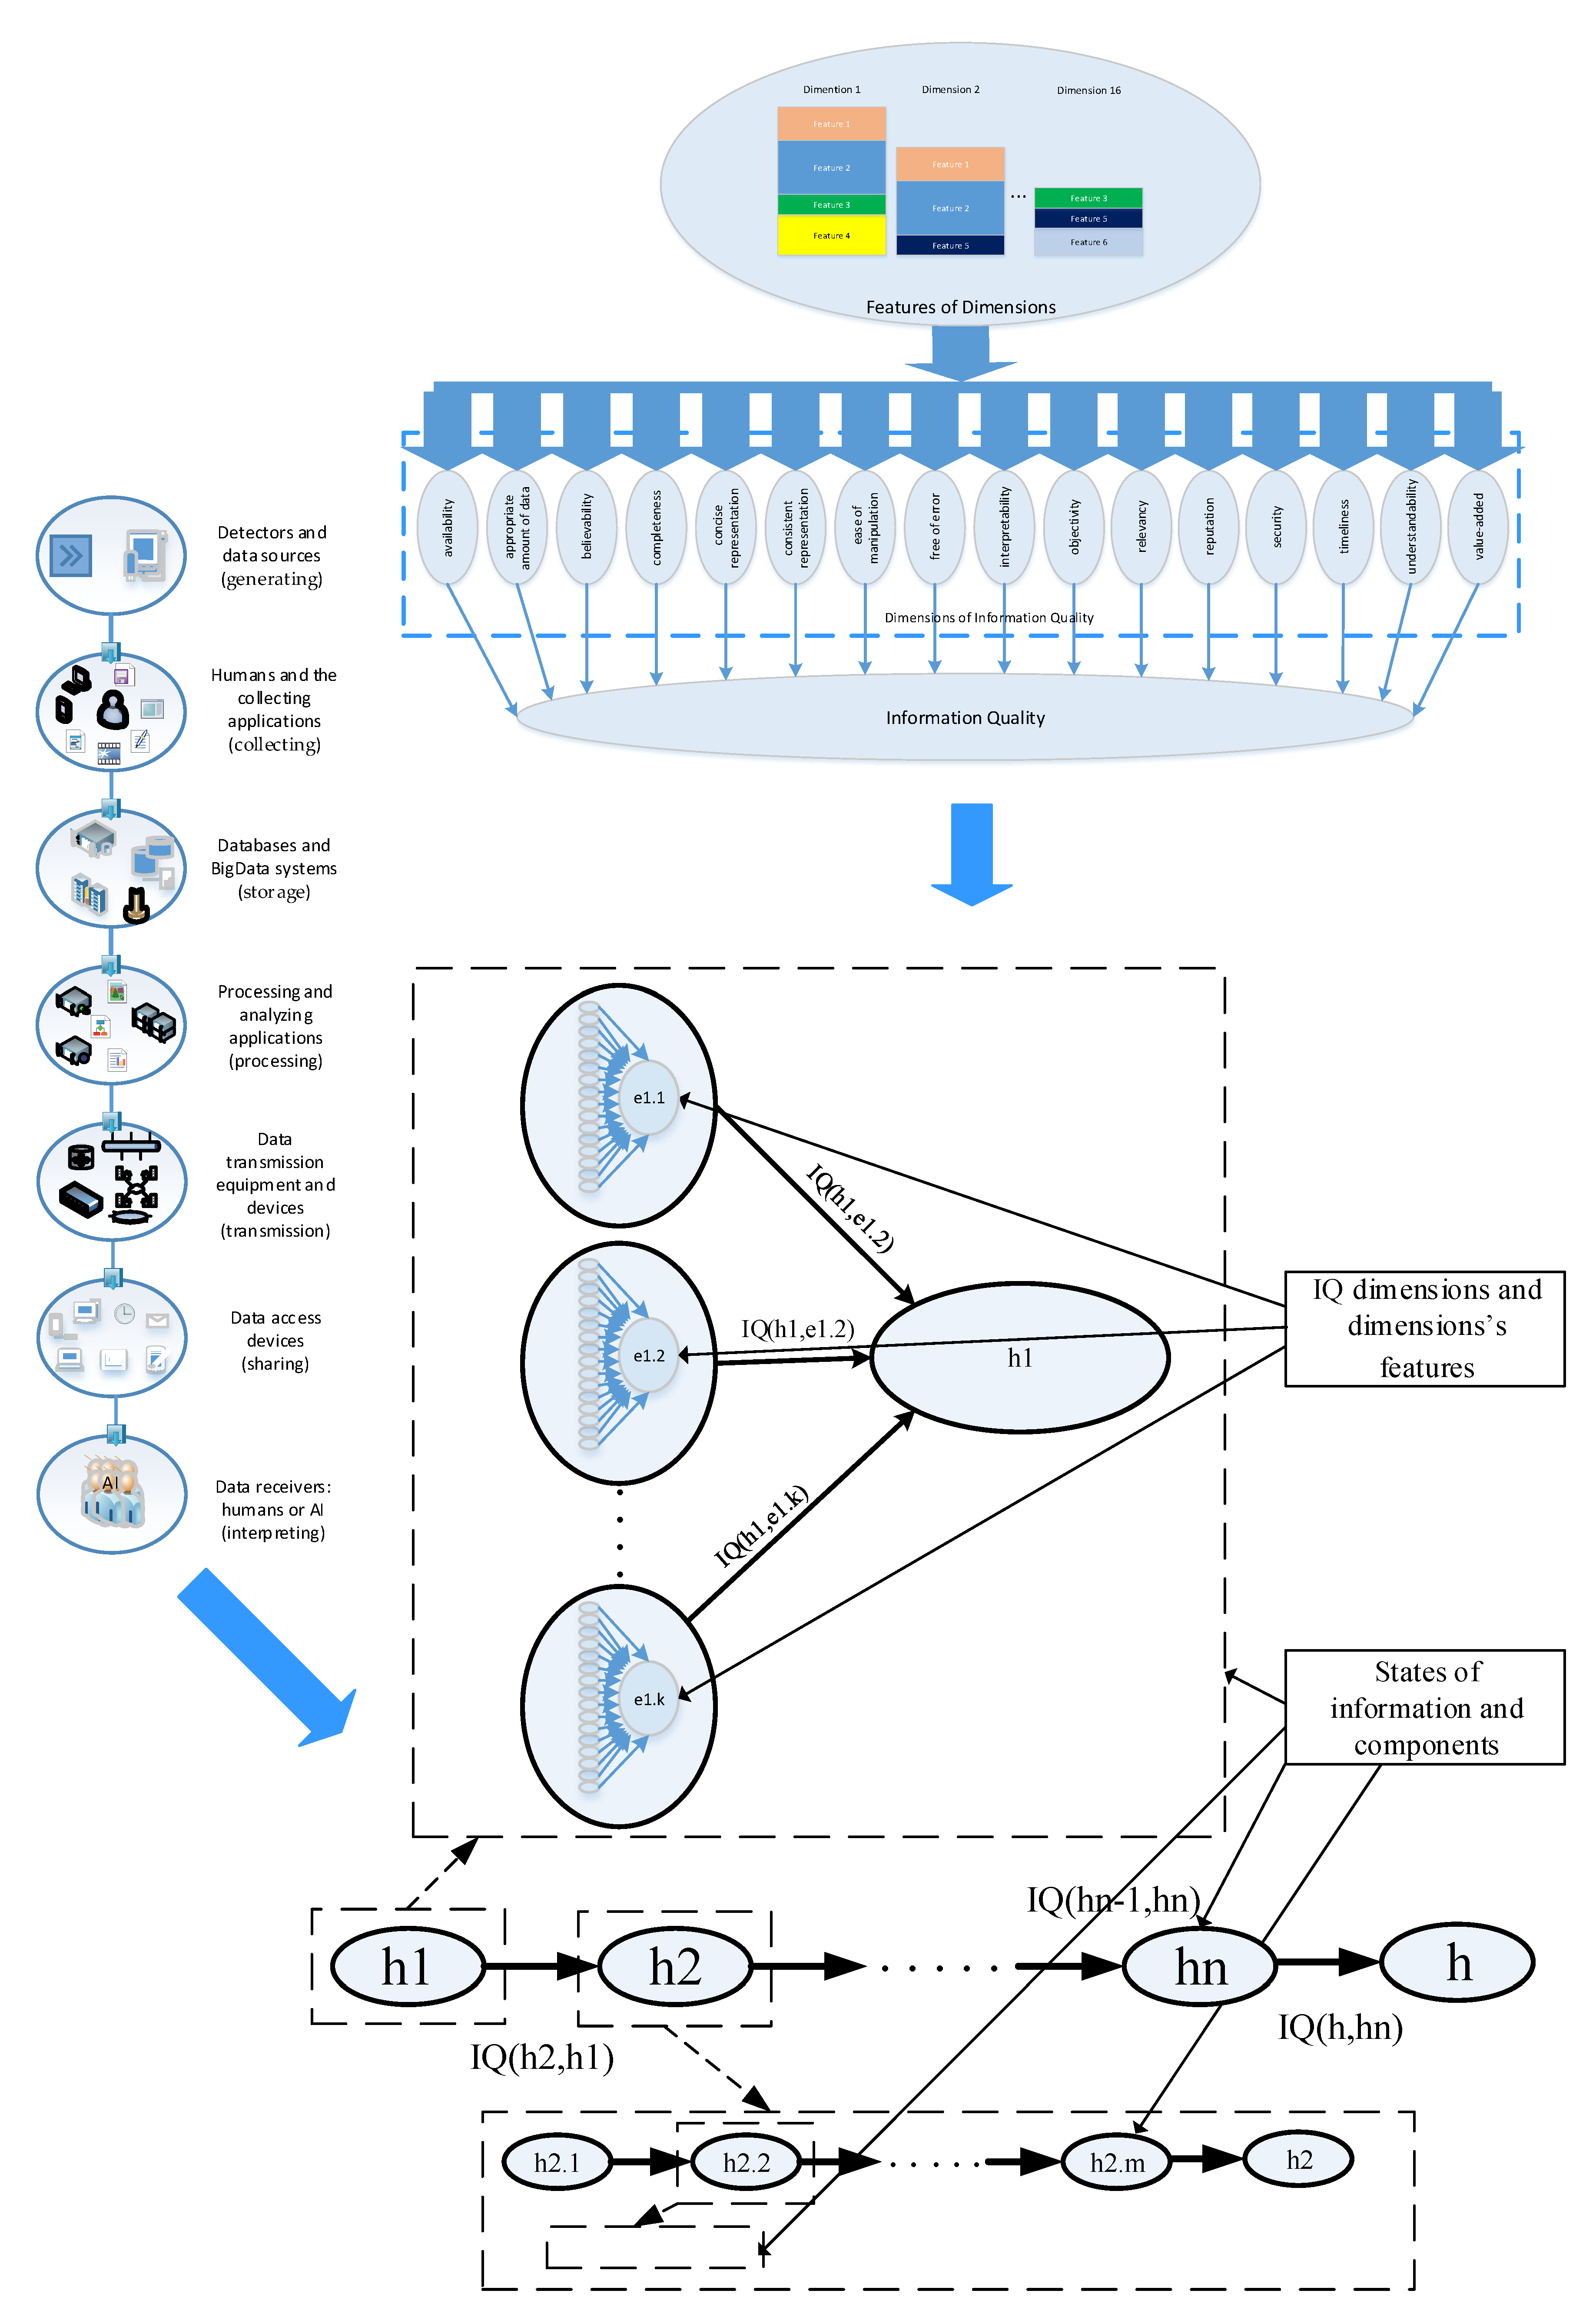
The first modelling stage involves creating a model that describes information quality dimensions. The assumptions in this article adopted a model described in [
1,
2,
5,
6,
26], which is based on sixteen information dimensions. It is a two-layer model. One layer contains dimension properties, and the other contains information quality dimensions (
Figure 2). By employing known uncertainty modelling and estimating methods, the authors were able to make the quality dimensions independent of the second layer, and dependence was left in the feature layer. Thus, each of the features can be an element of numerous dimensions.
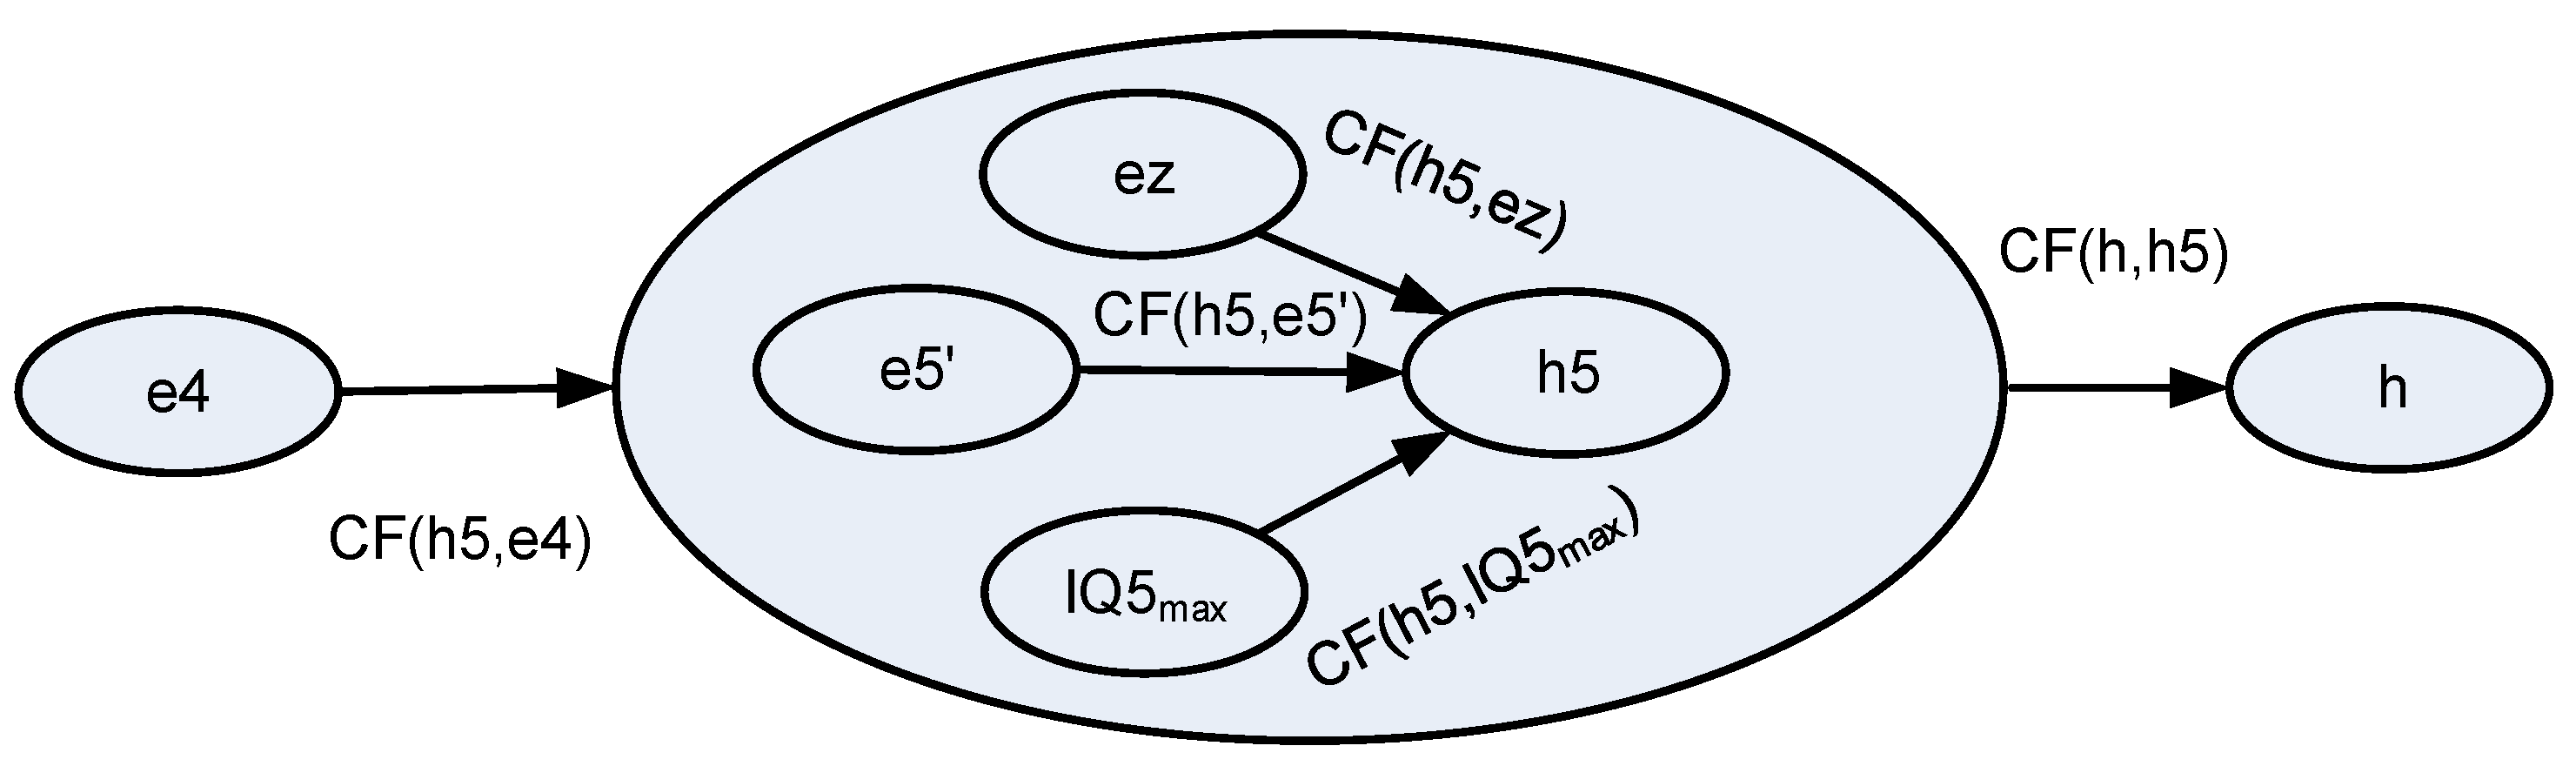
As mentioned before, a convenient method to describe an information quality model can be modelled based on the hypothesis’s certainty factor (CF). It is assumed that its value should directly indicate the quality level of information related to a given hypothesis. For example, a vehicle is moving within a scene observed by a camera. The sole fact of the vehicle’s movement is information on the vehicle. Simultaneously, it is a hypothesis deduced based on premises analysed by the visual monitoring system. The CF of this hypothesis can be a measure of the quality of information on vehicle movement.
A reliable presentation requires describing formalisms [
27,
28]. A formal (
Appendix A—descriptions for all formulas), simplified description of the certainty factor is as follows:
where:
CF—certainty factor;
MB—knowledge mapping, i.e., a measure of belief;
MD—ignorance mapping, i.e., a measure of disbelief;
s—a hypothesis based on a specific observation.
The MB measure of belief and MD measure of disbelief associated with probability can be interpreted as follows:
where:
P—probability;
s—a hypothesis based on a specific observation.
As mentioned previously, we do not strive to determine probability since the quality measure is to be related to the CF of the final hypothesis of the model.
Because there are many variations of CF modelling, basic dependencies [
27] employed in this study are described below.
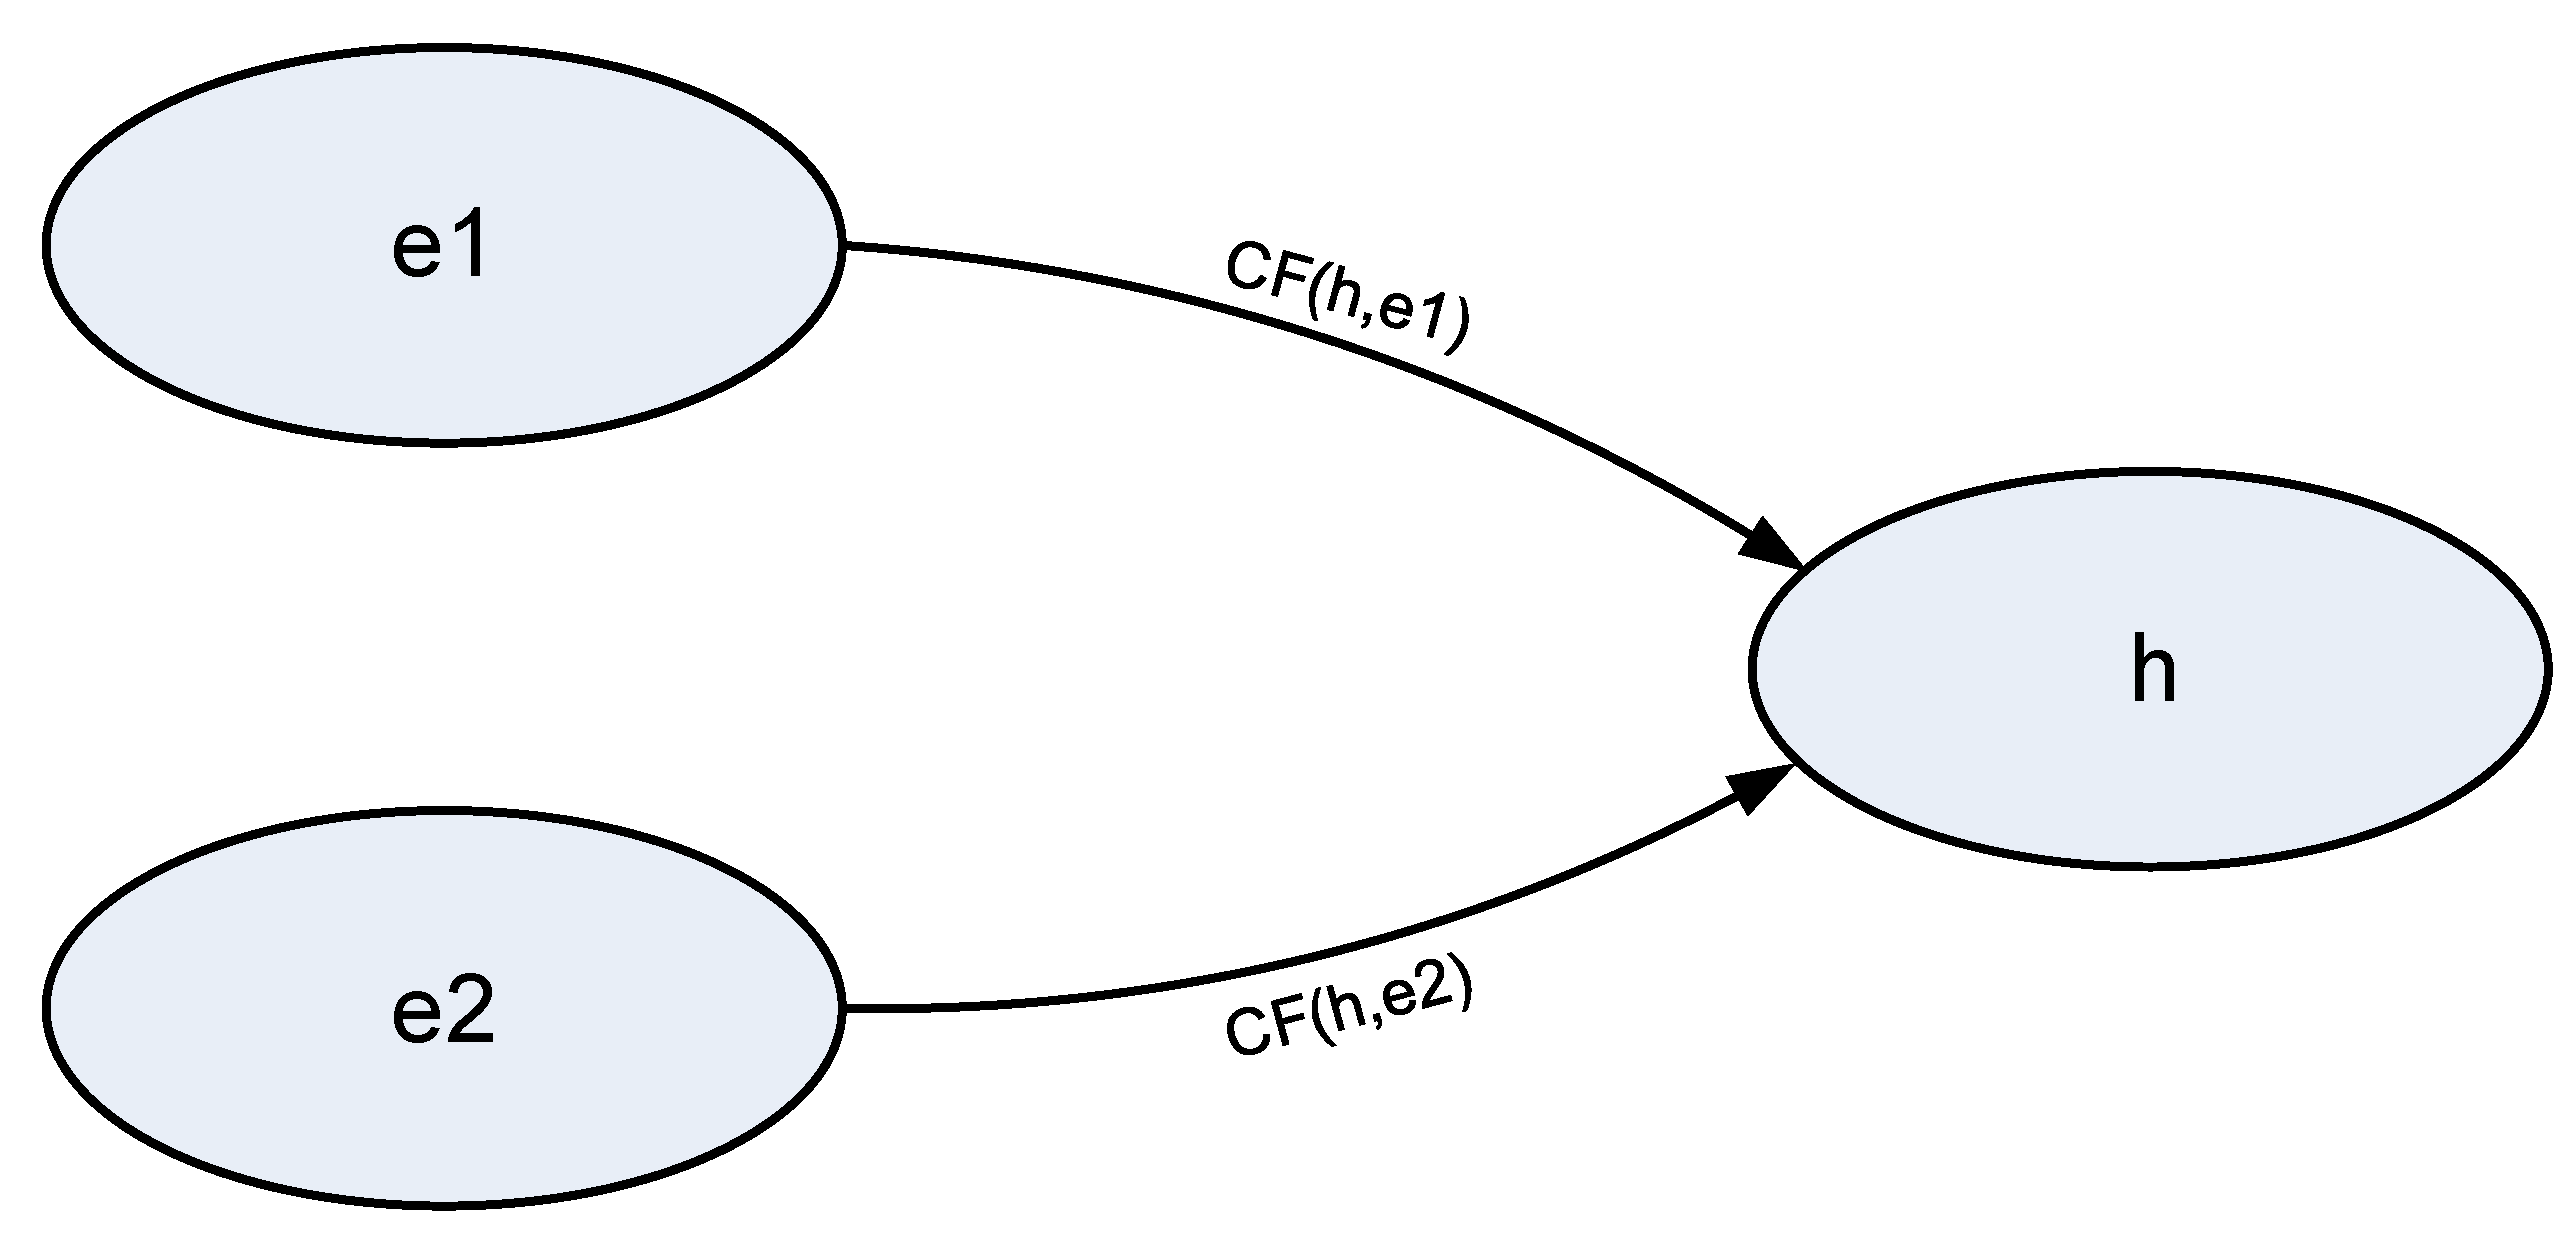
3.1. Parallel Baseline Model
The formula to calculate the transition according to
Figure 3 between two parallel observations and the hypothesis is as follows [
27]:
3.2. Serial Baseline Model
The following dependence was used in the case of the serial model for positive values (these will appear within the modelling described below) according to
Figure 4 [
27]:
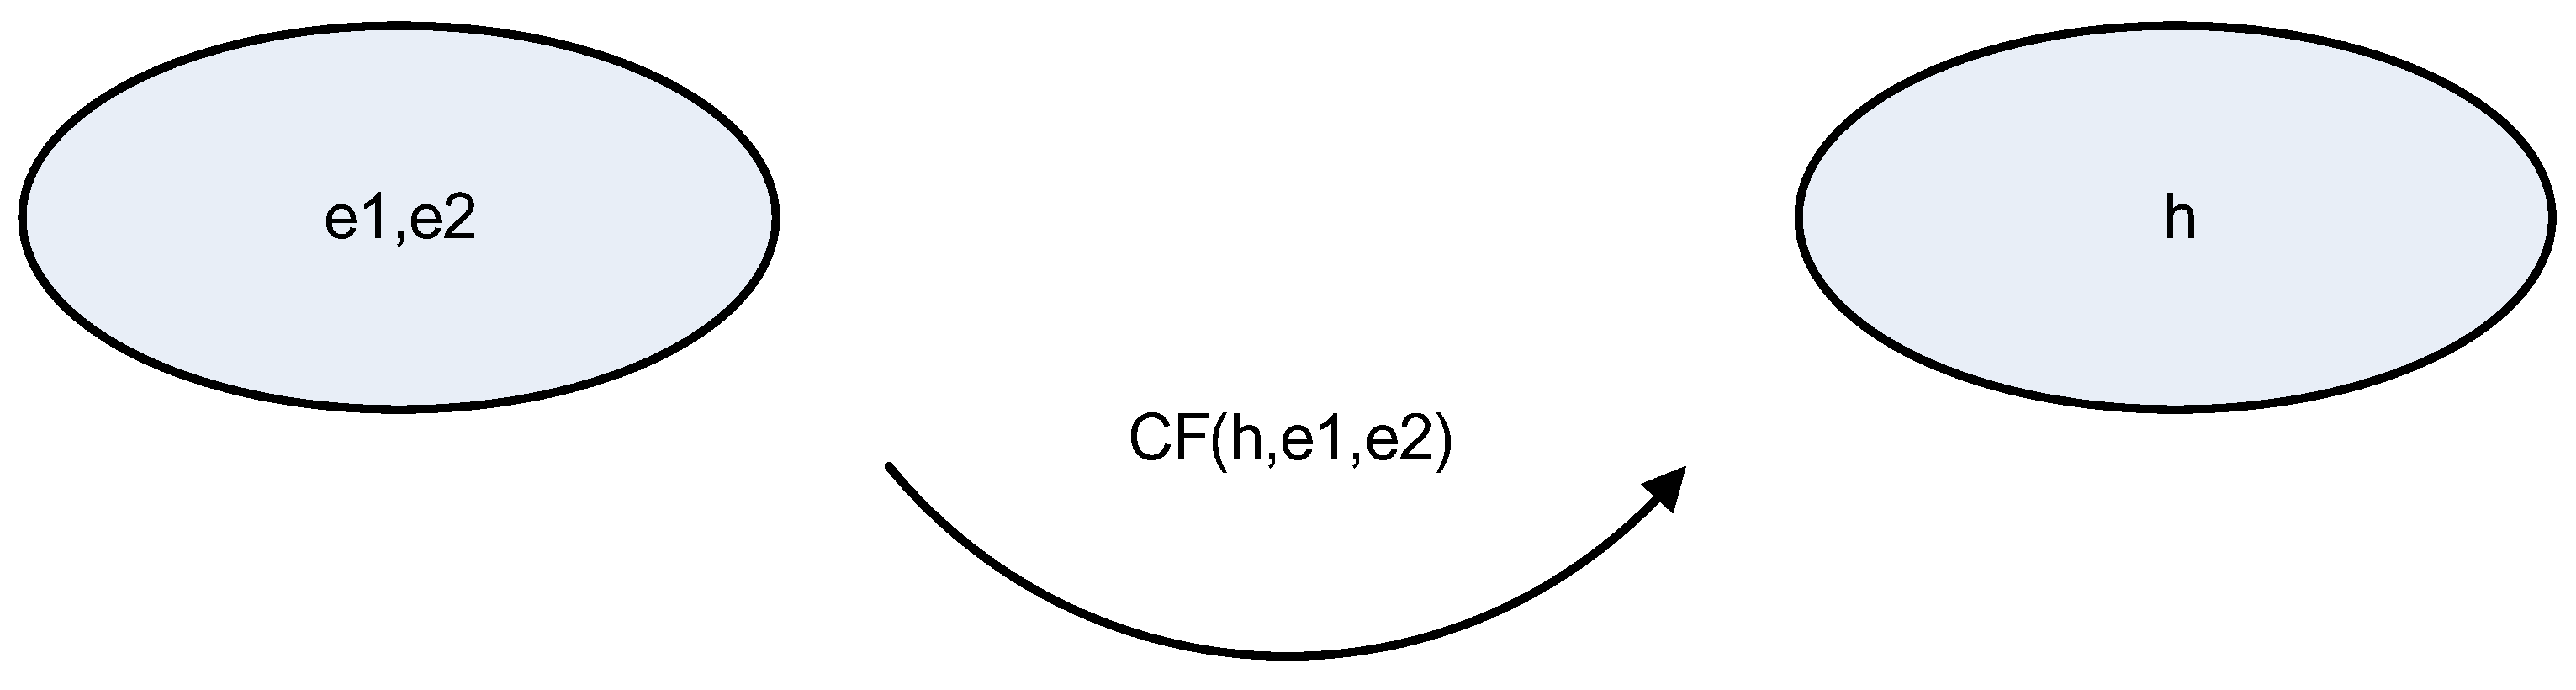
Both (parallel and serial) connections, as shown in [
27], can be reduced to a single link, as in
Figure 5. This property enables simplifying calculations within the model proposed in the next section.
The source literature often contains an incorrect interval (−1.1). However, based on Formula (3), the range of variables used in this model is determined by the interval <−1.1>. 1 indicates the full certainty of the studied hypothesis, and −1 means its negation. 0 indicates the lack of premises related to the studied hypothesis. When analysing Equations (2) and (3), one can notice that the values of interval extremes cannot be taken into account as model functionality would not be satisfied.
4. Calculation and Demonstration
In order to demonstrate the method’s effectiveness, the project authors selected an intersection traffic light system as an example. At this intersection, the no-entry rule is frequently violated when the red light is lit. A photographic view from a driver’s position is shown in
Figure 6.
Figure 7 presents a photograph with the probable element that disturbs the correct interpretation of the intersection’s lighting system state. Pictures have been taken from the car travel registration because we would like to show how this scene looks from the driver’s position. It is a red-coloured glowing roadside advertisement. The blue oval indicates this red roadside advertisement in both pictures in
Figure 6 and
Figure 7. The model describing the object will consist of two last information states, forwarding and interpretation. Information transfer redundancy (double traffic lights at the intersection) was conducted in this case. Two cases were considered:
Forwarding information without redundancy (
Figure 8),
Forwarding information with redundancy (
Figure 9).
Table 2 shows observation values for both models in
Figure 8 and
Figure 9. Item 4 in
Table 2 determines traffic light effectiveness under normal conditions and assumes that one vehicle in a hundred drives through the intersections while red light is one (research by the authors indicates that there are several cases during a day when a vehicle runs the red light at an intersection). Items 4.1 and 4.2 are e4 values of 1 (as per the developed method [
1,
5]) for double traffic lights. Item 5 in
Table 2 indicates drivers’ interpretability of the intersection’s traffic lights. The IQ4
max value was set at 0.9999. Data were taken from the project in which we are publishing this article. We made measurements using the organoleptic method directly on the crossway. It was statistical data from direct observation of a specific (
Figure 6) intersection. The value 0.99 of e4 (without traffic light redundancy) means that 1% of drivers did not recognise the light colour. The value 0.98 of e5 means two from one hundred drivers went through the intersection at the red light. The values of e4.1 and e4.2 are based on the e4 and equal to e4–1. It is a requirement for the method applied [
1,
3].
Applying the method described above in this section, the authors determined the information quality for both solutions:
Model without traffic light redundancy from
Figure 8:
Model with traffic light redundancy from
Figure 9:
According to the method for assessing IQ described above, traffic light redundancy to improve correct traffic light interpretation can be expected. Information quality management should involve, among others, searching for information quality model imperfections. The example presented here contains a certain simplification since it does not consider a change in information interpretation status. Therefore, the model is not perfect. A change in information quality at the interpretation status level should be considered. It can be achieved through two information-sharing states impacting the information status. This is shown in
Figure 10.
The IQ5max value was set at 0.9999. Using the method described above in this section, the authors determined the information quality for both solutions:
model with traffic light redundancy from
Figure 10:
Calculation result for the model that considers status improvement is higher. Therefore, the failure to include interpretation status improvement in the model was a mistake that impacted the result and must be considered in general relations.
Another element that was not considered is the impact of advertising illumination that leads to poor interpretation of the intersection’s traffic control lights. We may not omit this component since it significantly affects the quality of information passed to the recipient. Therefore, this element should be added as an observation reducing information quality. It is shown in
Figure 11.
As previously, the IQ5max value was set at 0.9999. The ez value was set at −0.01, corresponding to the theorem that one percent of drivers confuse intersection traffic control light colour. Using the method described above in this section, the authors determined the information quality for both solutions:
Model with traffic light redundancy from
Figure 11:
Calculations enable the formulation of a conclusion that interpretation distortion in this case has a negligible impact on the quality of provided information to be interpreted.
In order to determine the magnitude of the impact of an intersection traffic lights control redundancy, it is required to expand the model from
Figure 8 with the impact of the interfering element on interpretation status. Such a comparison makes it possible to determine whether improving the quality of information from an intersection traffic lights control will actually improve traffic safety at such an intersection. Such a model is shown in
Figure 12.
The IQ5max value was set at 0.9999. The ez value was set at −0.01 since one per cent of the drivers confuse intersection traffic light colours. The e5 value should be set at e5′ = e5 − 1 = −0.02 because it is a parallel object. Using the method described above in this section, the authors determined the information quality for both solutions:
model without traffic lighting redundancy from
Figure 12:
Therefore, the model proposed in
Figure 8 is not perfect. The result of Equations (6) and (17) indicates that the impact of interpretation-interfering advertisement illumination was probably poorly estimated. It is confirmed by comparing the results of Equations (11) and (14).
5. The Result Simulation and Comparison
As demonstrated in the previous section, the impact of specific elements not considered during modelling can significantly affect the results of calculations based on such a model.
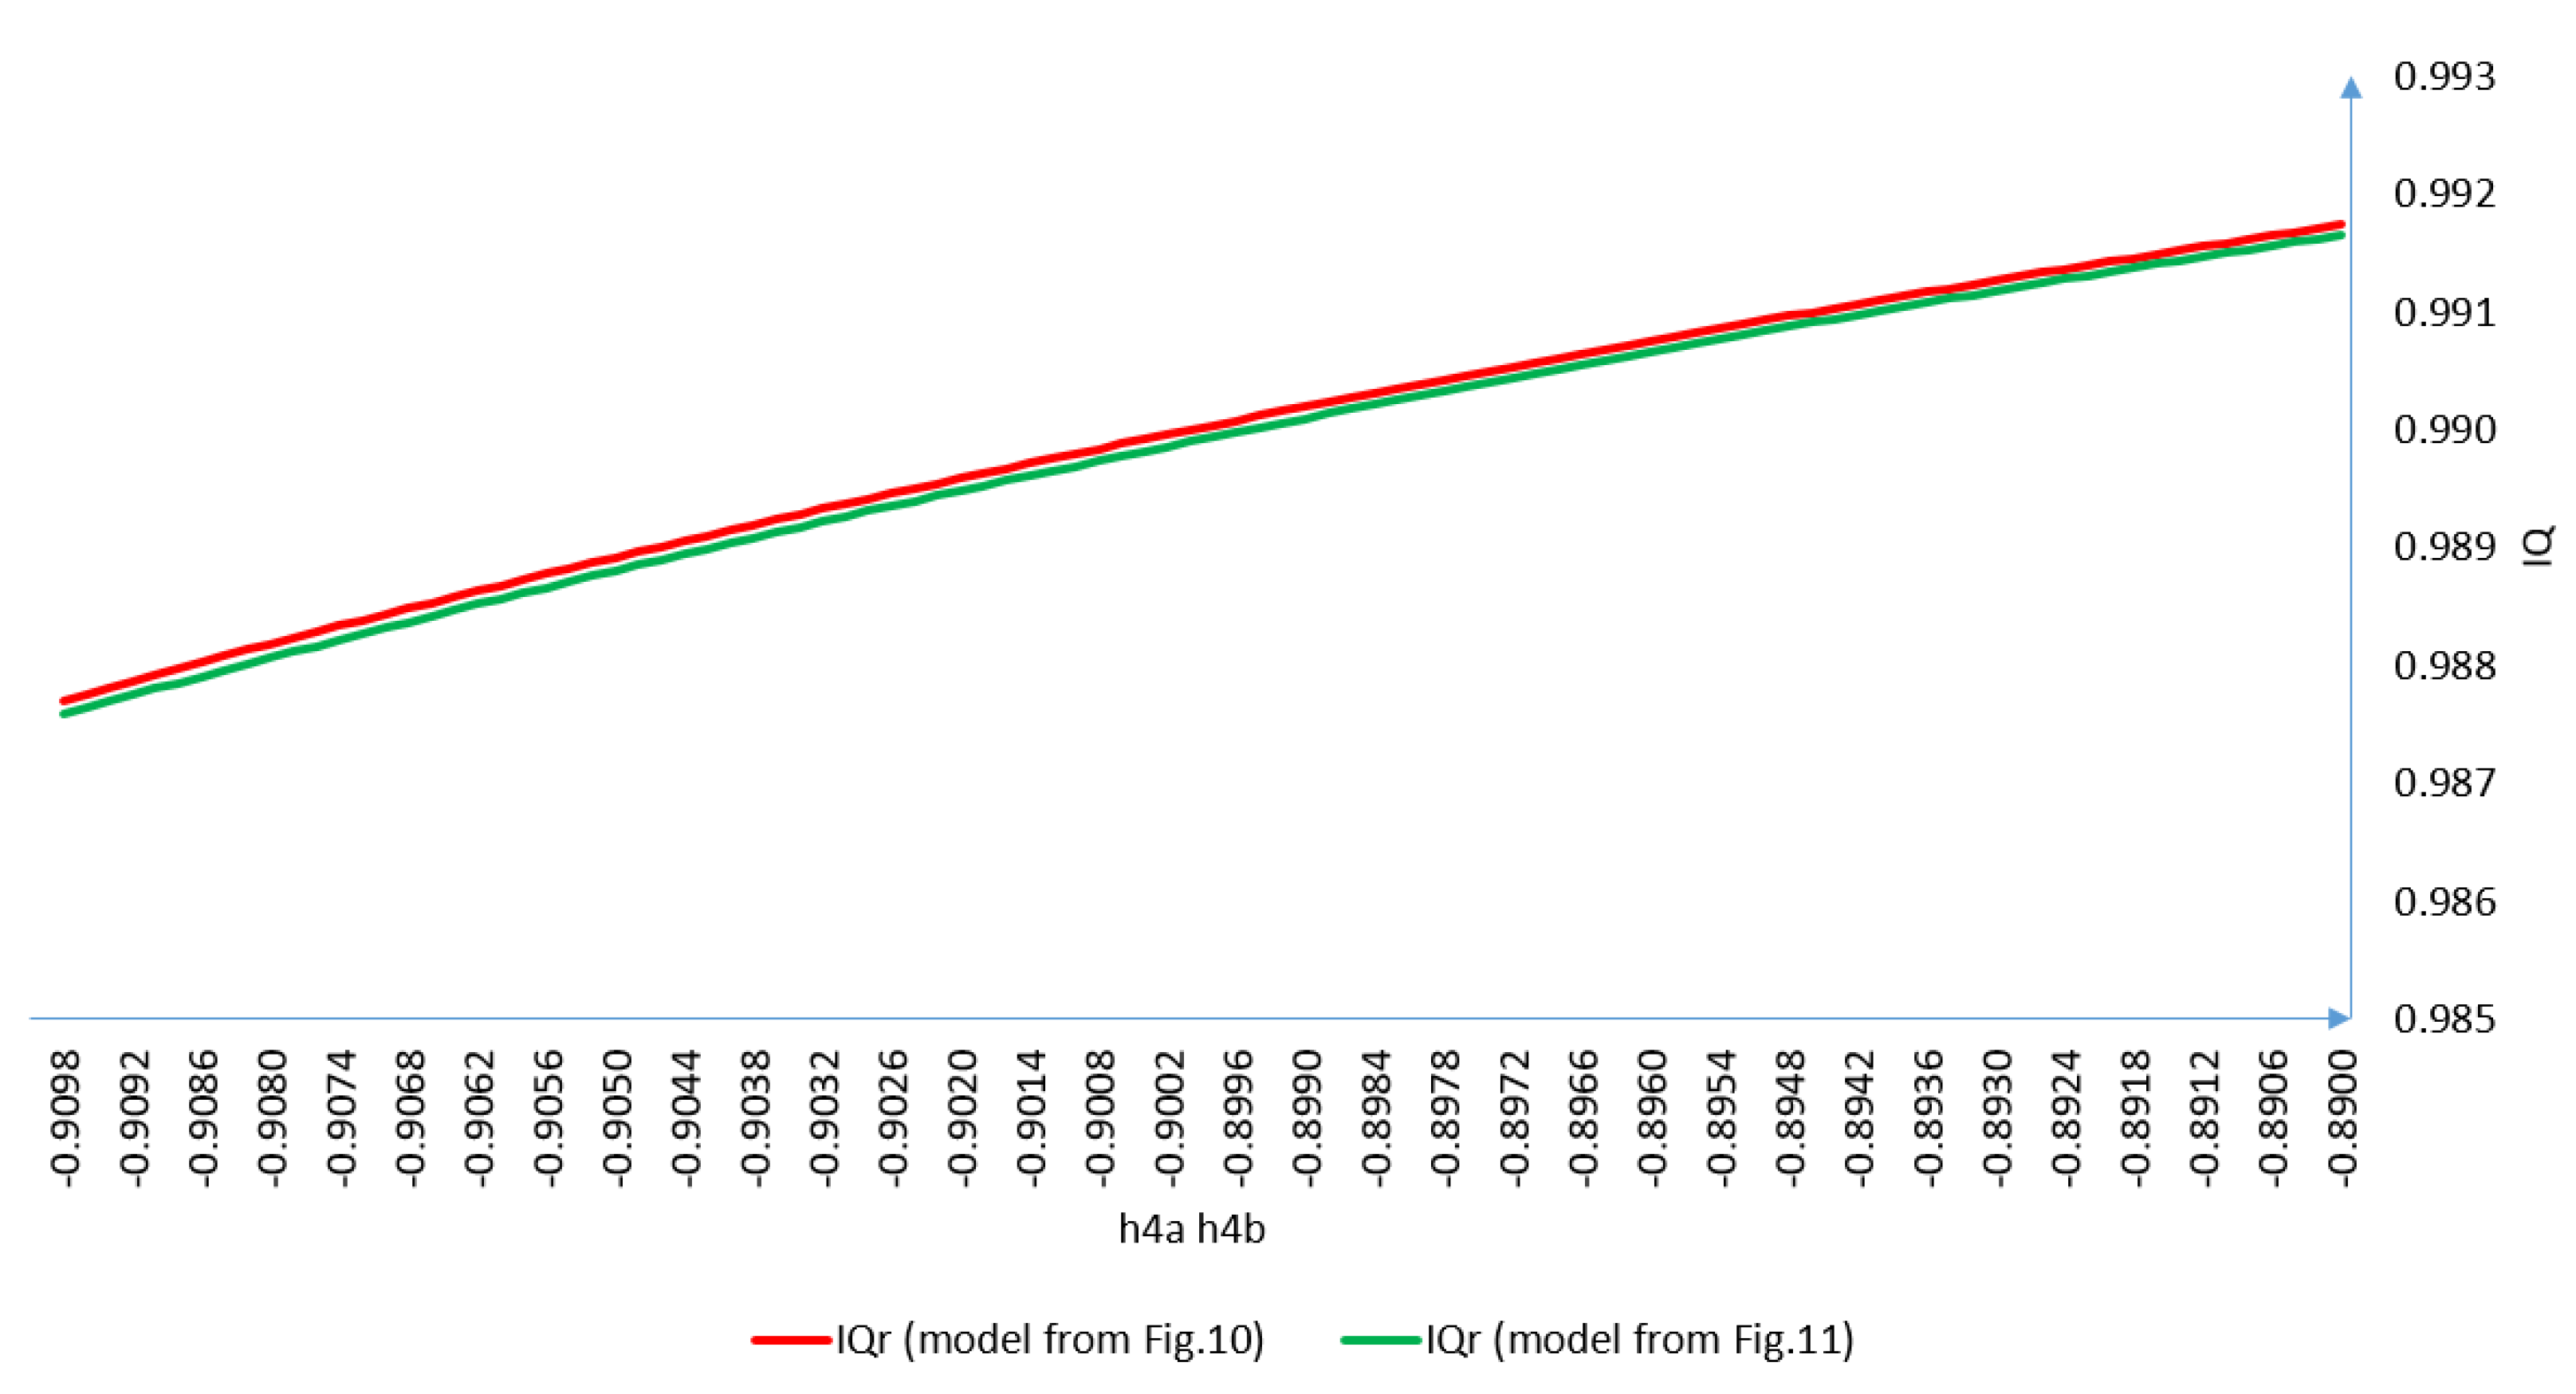
Figure 13 shows differences in the impact of observation of IQ
r coefficient values for the models from
Figure 10 and
Figure 11. The h4a = h4b coefficient ranges from −0.91 to −0.89. The value range was selected based on the values in
Table 2. In this range, we would expect a proper IQ variability in relation to observations h4a and h4b for authenticating the proposed method. We created these simulations based on research published in our previous articles [
1,
2,
3,
5,
6,
28].
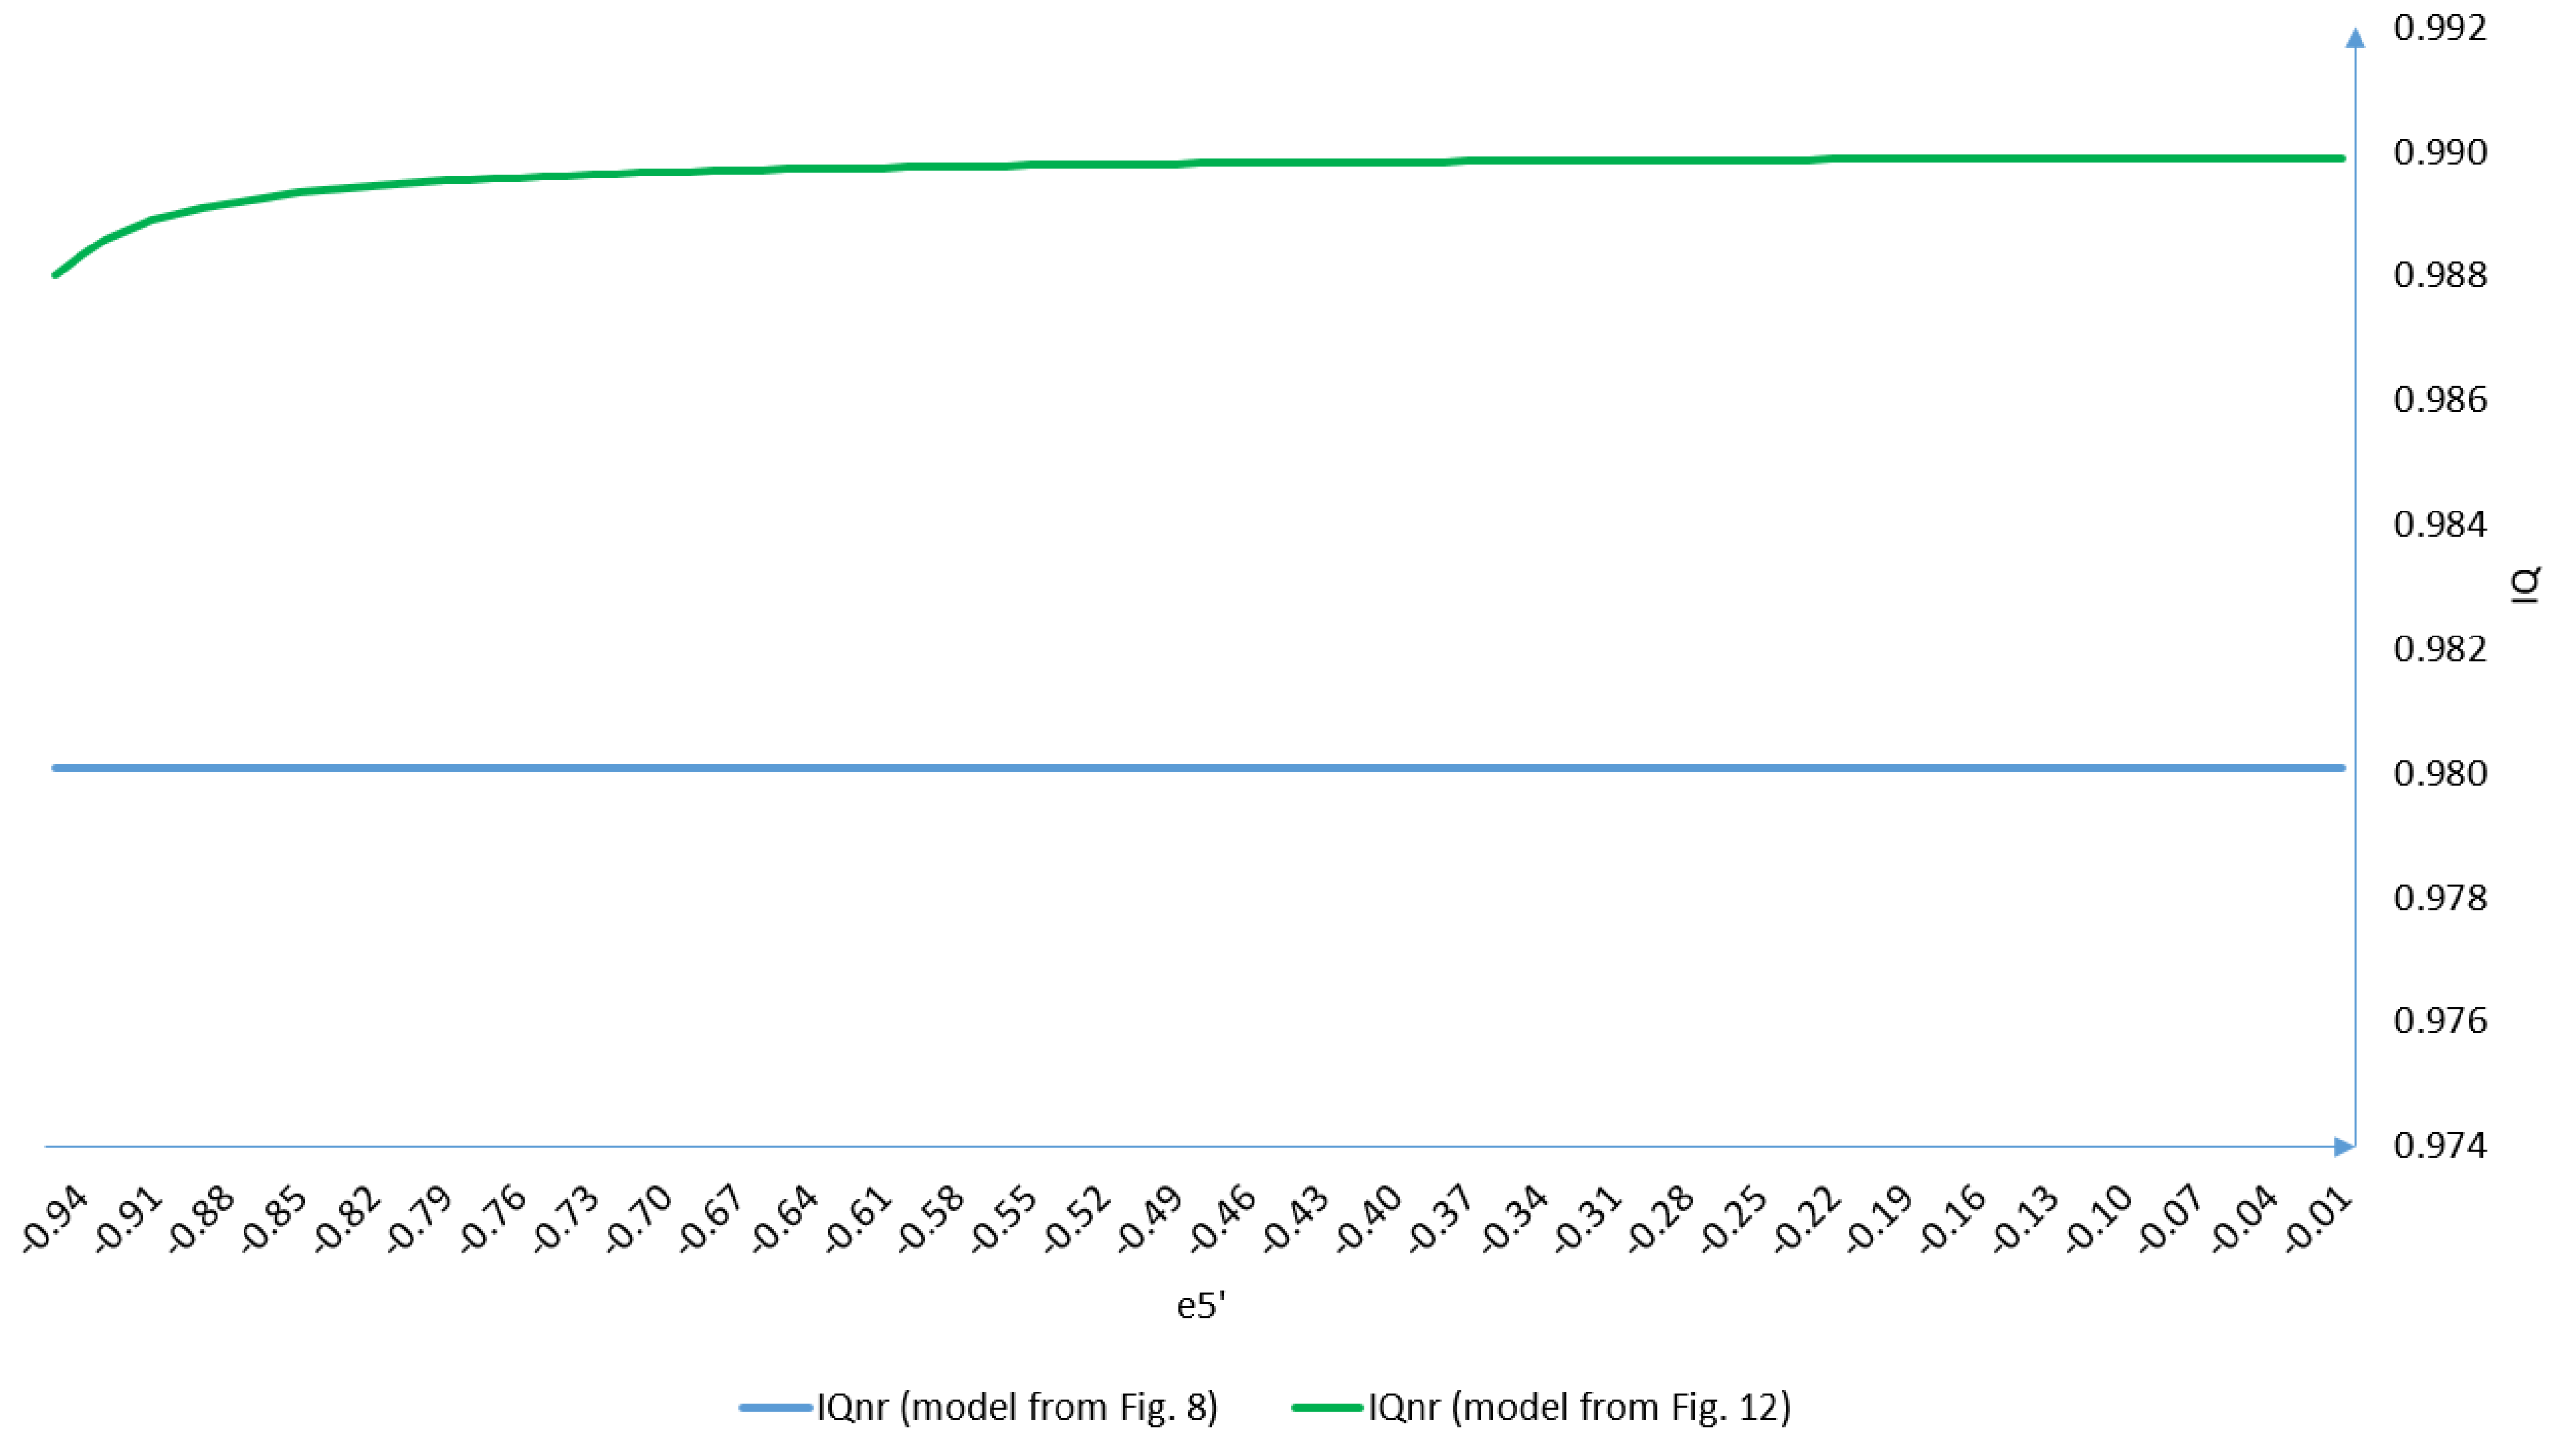
Figure 14 shows differences in the impact of observation of IQ
nr coefficient values for the models from
Figure 8 and
Figure 12. The e5′ coefficient ranged from −0.95 to −0.01.
As demonstrated in this and previous
Section 4 and
Section 5, the impact of specific elements not considered during modelling can significantly modify the results of calculations based on such a model. The model proposed in
Figure 8 in
Section 4 is imperfect. Equations (6) and (17) indicate that the impact of interpretation-interfering advertisement illumination was probably poorly estimated. It is confirmed by comparing the results of Equations (11) and (14). It is also verified by simulations discussed in
Section 4. Based on simulation graphs from
Figure 13 and
Figure 14, it can be concluded that the results are rather doubtful in the first model version (i.e., the model from
Figure 8 and
Figure 10), where not all elements were considered. The results became more reliable after the models were supplemented with missing elements. Results have been compared with similar examples published in [
1,
3].
Figure 1 demonstrates how vital it is to determine the level of information quality. Namely, a slight change in information quality improvement (allocating resources to improving quality) may significantly change the information quality index of the whole system. However, when information quality is high, improving the quality may be unprofitable (in other words—requiring large expenditures with small profits) [
1,
3]. Therefore, the weakest element in the quality model should be found, and only this one should be corrected. After using this by recursive procedures, it can gain the expected information quality level for the modelled system. In connection with the above, an information quality management system should be introduced to optimise information quality improvement processes.
In another way, the function’s graph should have a similar shape as the theoretical function presented in
Figure 15.
Figure 15 showed dependences from
Figure 1 differently, making it possible to compare
Figure 15 to
Figure 13 and
Figure 14. As a result, the number of resources devoted to IQ improvement should increase nonlinearly with the increase in IQ.

 ,
, 


