
Cooling Water for Electricity Production in Poland: Assessment and New Perspectives

Department of Geoengineering and Water Management, Faculty of Environmental Engineering and Energy, Cracow University of Technology, Warszawska 24, 31-155 Cracow, Poland
Energies 2023, 16(6), 2822; https://0-doi-org.brum.beds.ac.uk/10.3390/en16062822
Submission received: 12 February 2023
/
Revised: 1 March 2023
/
Accepted: 16 March 2023
/
Published: 17 March 2023
(This article belongs to the Special Issue A New Water-Energy Nexus: The Transition to Sustainable Energy Ⅱ)
Abstract
:Sustainable development requires a holistic approach to natural resources and ecosystems to avoid their degradation. Cooling water—water used for cooling in industrial or manufacturing processes and then returned at elevated temperature to a local river or lake—is a common cause of thermal pollution. The purpose of the analysis was to assess how much cooling water is currently abstracted to generate electricity in Poland, what the dynamics of this abstraction in the last 20 years (2000–2019) were, and to what extent this abstraction affects the available freshwater resources in the country and in individual river basins. Moreover, the latest plans for the development of the electricity sector in Poland were analyzed to determine how the implementation of these plans may affect cooling water abstractions and the condition of Poland’s freshwater resources. Trend analysis was performed in order to assess the strength of linear trends in the studied time series. The results show that in Poland from 2000–2019, nearly 75% of water abstracted from surface resources was cooling water used to produce electricity. The dynamics of cooling water abstraction show a clear downward trend of 54.5 million m3 annually, despite a significant increase in electricity production. This decline is likely to continue over the next 20 years, with the major unknown being the planned introduction of nuclear power as an energy source.
1. Introduction
Sustainable human development requires the integrated management of available resources and a holistic approach to natural resources and ecosystems to avoid their degradation [1]. In order to achieve sustainable economies, the transformation of the energy sector from one based on fossil fuels to one based more on renewable energy sources (RES, green energy) seems to be a promising path [2], but even the use of RES has its own, nonnegligible impact on the environment [3,4,5,6]. It is also clear that expected growing demand for electricity in the coming years and decades [7,8,9] will require better energy management and saving, as well as the need for increased electricity generation.
Energy and freshwater resources are closely related: energy is used to purify and transport fresh water, and water is used to produce energy [10]. The production and use of energy often require a significant amount of water; water is needed in the extraction of energy sources (e.g., fossil fuels), as a feedstock to change the properties of fuels, for the construction, operation, and maintenance of energy generating facilities, for power-plant cooling, and for the disposal of waste products [10].
Power plants can affect the quality and quantity of local water resources [11]. A significant quantity of water is required for thermoelectric power plants to support electricity generation [12,13]. Thermoelectric generation relies on a fuel source (fossil, nuclear, or biomass), which is used to heat water to steam that is then used to drive a turbine-generator [13]. Steam exhausted from the turbine is condensed by the flow of cooling water in a heat exchanger (condenser) and recycled to a steam generator or boiler. Generally, three types of cooling systems are used in thermoelectric power plants: once through (open loop), wet recirculating (closed loop), and dry (air-cooled) [14]. In once through systems, the cooling water is abstracted (withdrawn—in US literature [15]) from a local body of water (lake, river, or ocean) and, after passing through the condenser, the cooling water at the elevated temperature is then returned to the same water body. Consequently, power plants equipped with once through cooling water systems have relatively high water abstraction, but low water consumption [13]. Wet recirculating cooling systems use cooling towers or cooling ponds to circulate the abstracted water in a closed loop. In most wet recirculating cooling systems, the cooling water at the elevated temperature is pumped from the steam condenser to a cooling tower to dissipate the heat from the water to the atmosphere, and the cooled water is then recycled to the condenser [13]. A cooling pond serves the same purpose as a wet cooling tower, but it relies on natural conduction/convection heat transfer from the water to the atmosphere as well as on evaporation to cool the recirculating water [13]. Compared to once through systems, plants with wet recirculating systems have relatively low water abstraction, but high water consumption [13,14]. Regarding water losses in the process of electricity generation, in once-through systems, consumption levels are extremely small at the plant boundaries (about 1% of the abstraction [15]), but downstream consumption (evaporation) due to the elevated discharge temperature is not negligible [13]. The consumption volume for closed-loop systems is about 1% of the abstraction volume at equivalent once-through systems [14]. In closed-loop systems, the consumptive losses are 4–9% (pond) and 61–95% (wet tower) of abstraction [15]. Dry cooling systems can use either a direct or indirect air cooling process. No cooling water is used in the direct air-cooled system, while in the indirect dry cooling system both water abstraction and consumption are minimal [13,14].
Solar photovoltaic (PV) power systems, wind turbines, and other renewable energy sources often require minimal amounts of water [14,16], though some renewable or unconventional energy technologies are water intensive as well, such as geothermal plants [10].
The distribution of aquatic fauna and flora in river ecosystems is mainly shaped by water flow and thermal patterns [17,18]. Most organisms living in rivers are ectothermic; therefore, water temperature affects their metabolic rate, growth, development, and survival [18,19]. For freshwater fish species adapted to a specific fluvial environment, an increase in water temperature above the preferred temperature range results in detrimental thermal stress [20]. Additionally, many aquatic species will fail to reproduce at elevated temperatures [21,22,23].
Cooling water is a common cause of thermal pollution. Thermal pollution is the degradation of water quality by any process that changes the ambient water temperature [21]. When cooling water is returned to a lake or stream at a higher temperature, the abrupt change in temperature can kill fish and other organisms adapted to a particular temperature range. Since the solubility of a gas in water is inversely proportional to temperature, the heated discharges lower the solubility of oxygen in the water, thereby reducing the amount of dissolved oxygen available to oxygen-dependent species. The higher water temperature reduces the dispersion of oxygen to deeper waters, contributing to anaerobic conditions [21,22,23].
Therefore, in order to reduce thermal pollution caused by cooling water, closed loop cooling rather than open loop cooling systems are often used in new thermoelectric power plants [15].
Poland has been a member state of the European Union (EU) since 2004. In its water policy, the EU focuses on the protection of water resources, and the EU Water Framework Directive (WFD) aims to protect European waters, achieve good ecological status, and enable sustainable use [24]. In this context, it seems reasonable to ask how much cooling water is currently abstracted to generate electricity in Poland, what the dynamics of this abstraction have been in the last 20 years, and to what extent this abstraction affects the available freshwater resources in the country and in individual river basins. In addition to assessing the current situation, the newly adopted development plans for the Polish energy sector until 2040 (EPP2040) [25] are also important, as they will decide on the use of cooling water for electricity production in the next two decades or so. It is also worth considering how the implementation of these plans may affect the state of freshwater resources in Poland.
The main objective of the paper was to assess the dynamics of cooling water abstraction for electricity production in Poland over the last two decades (2000–2019) and the scope of this abstraction from surface waters at the national and basin scale. Moreover, in order to place the obtained results in an appropriate, i.e., European, context, abstractions of cooling water for electricity production in Poland and two other EU countries (Czechia and Romania) from the same part of Europe were compared. Subsequently, the percentage share of the main energy sources in the total gross electricity production in Poland in 2000–2019 was examined in order to assess the changes in energy sources in the context of cooling water abstraction. Finally, the latest plans for the development of the electricity sector in Poland were analyzed to determine how the implementation of these plans may affect cooling water abstractions and the condition of Poland’s freshwater resources.
2. Materials and Methods
The analysis is based on publicly available data from the Eurostat database (https://ec.europa.eu/eurostat/data/database (accessed on 27 January 2022)), retrieved in January and February 2022. Regulation No 223/2009 on European statistics [26] defines Eurostat to be the statistical authority of the European Union [27]. Eurostat ensures the production of European statistics at the union level according to established rules and statistical principles that were laid down in the European statistics Code of Practice [27]. Eurostat coordinates the statistical activities of the institutions and bodies of the Union, in particular with a view to ensuring consistency and quality of the data [27]. Available data on cooling water abstraction for electricity production cover the period of the last 20 years (2000–2019) and this time period was taken into account in the current analysis for all other data. Some missing values in the data (<1%) were not filled in as it was not necessary in the analysis performed. All analyzed data are presented in the following figures.
Each time series was carefully examined to ensure there were no processing errors or spurious values. Linear trend analysis was performed in order to assess the strength of trends in the studied time series. Linear regression [28] (pp. 221–263) at the significance level α = 0.05 was used.
3. Assessment
3.1. Available Fresh Surface Water Resources
According to Eurostat data, Poland, with a population of approx. 38 million, ranks in the European Union (EU-27) at a distant 24th place in terms of the amount of available freshwater resources per capita (1583 m3) per year. Similar places (23rd and 25th) are occupied by Romania and Czechia (approx. 19 and 11 million inhabitants, respectively), with 1779 and 1575 m3 of freshwater available per capita, respectively.
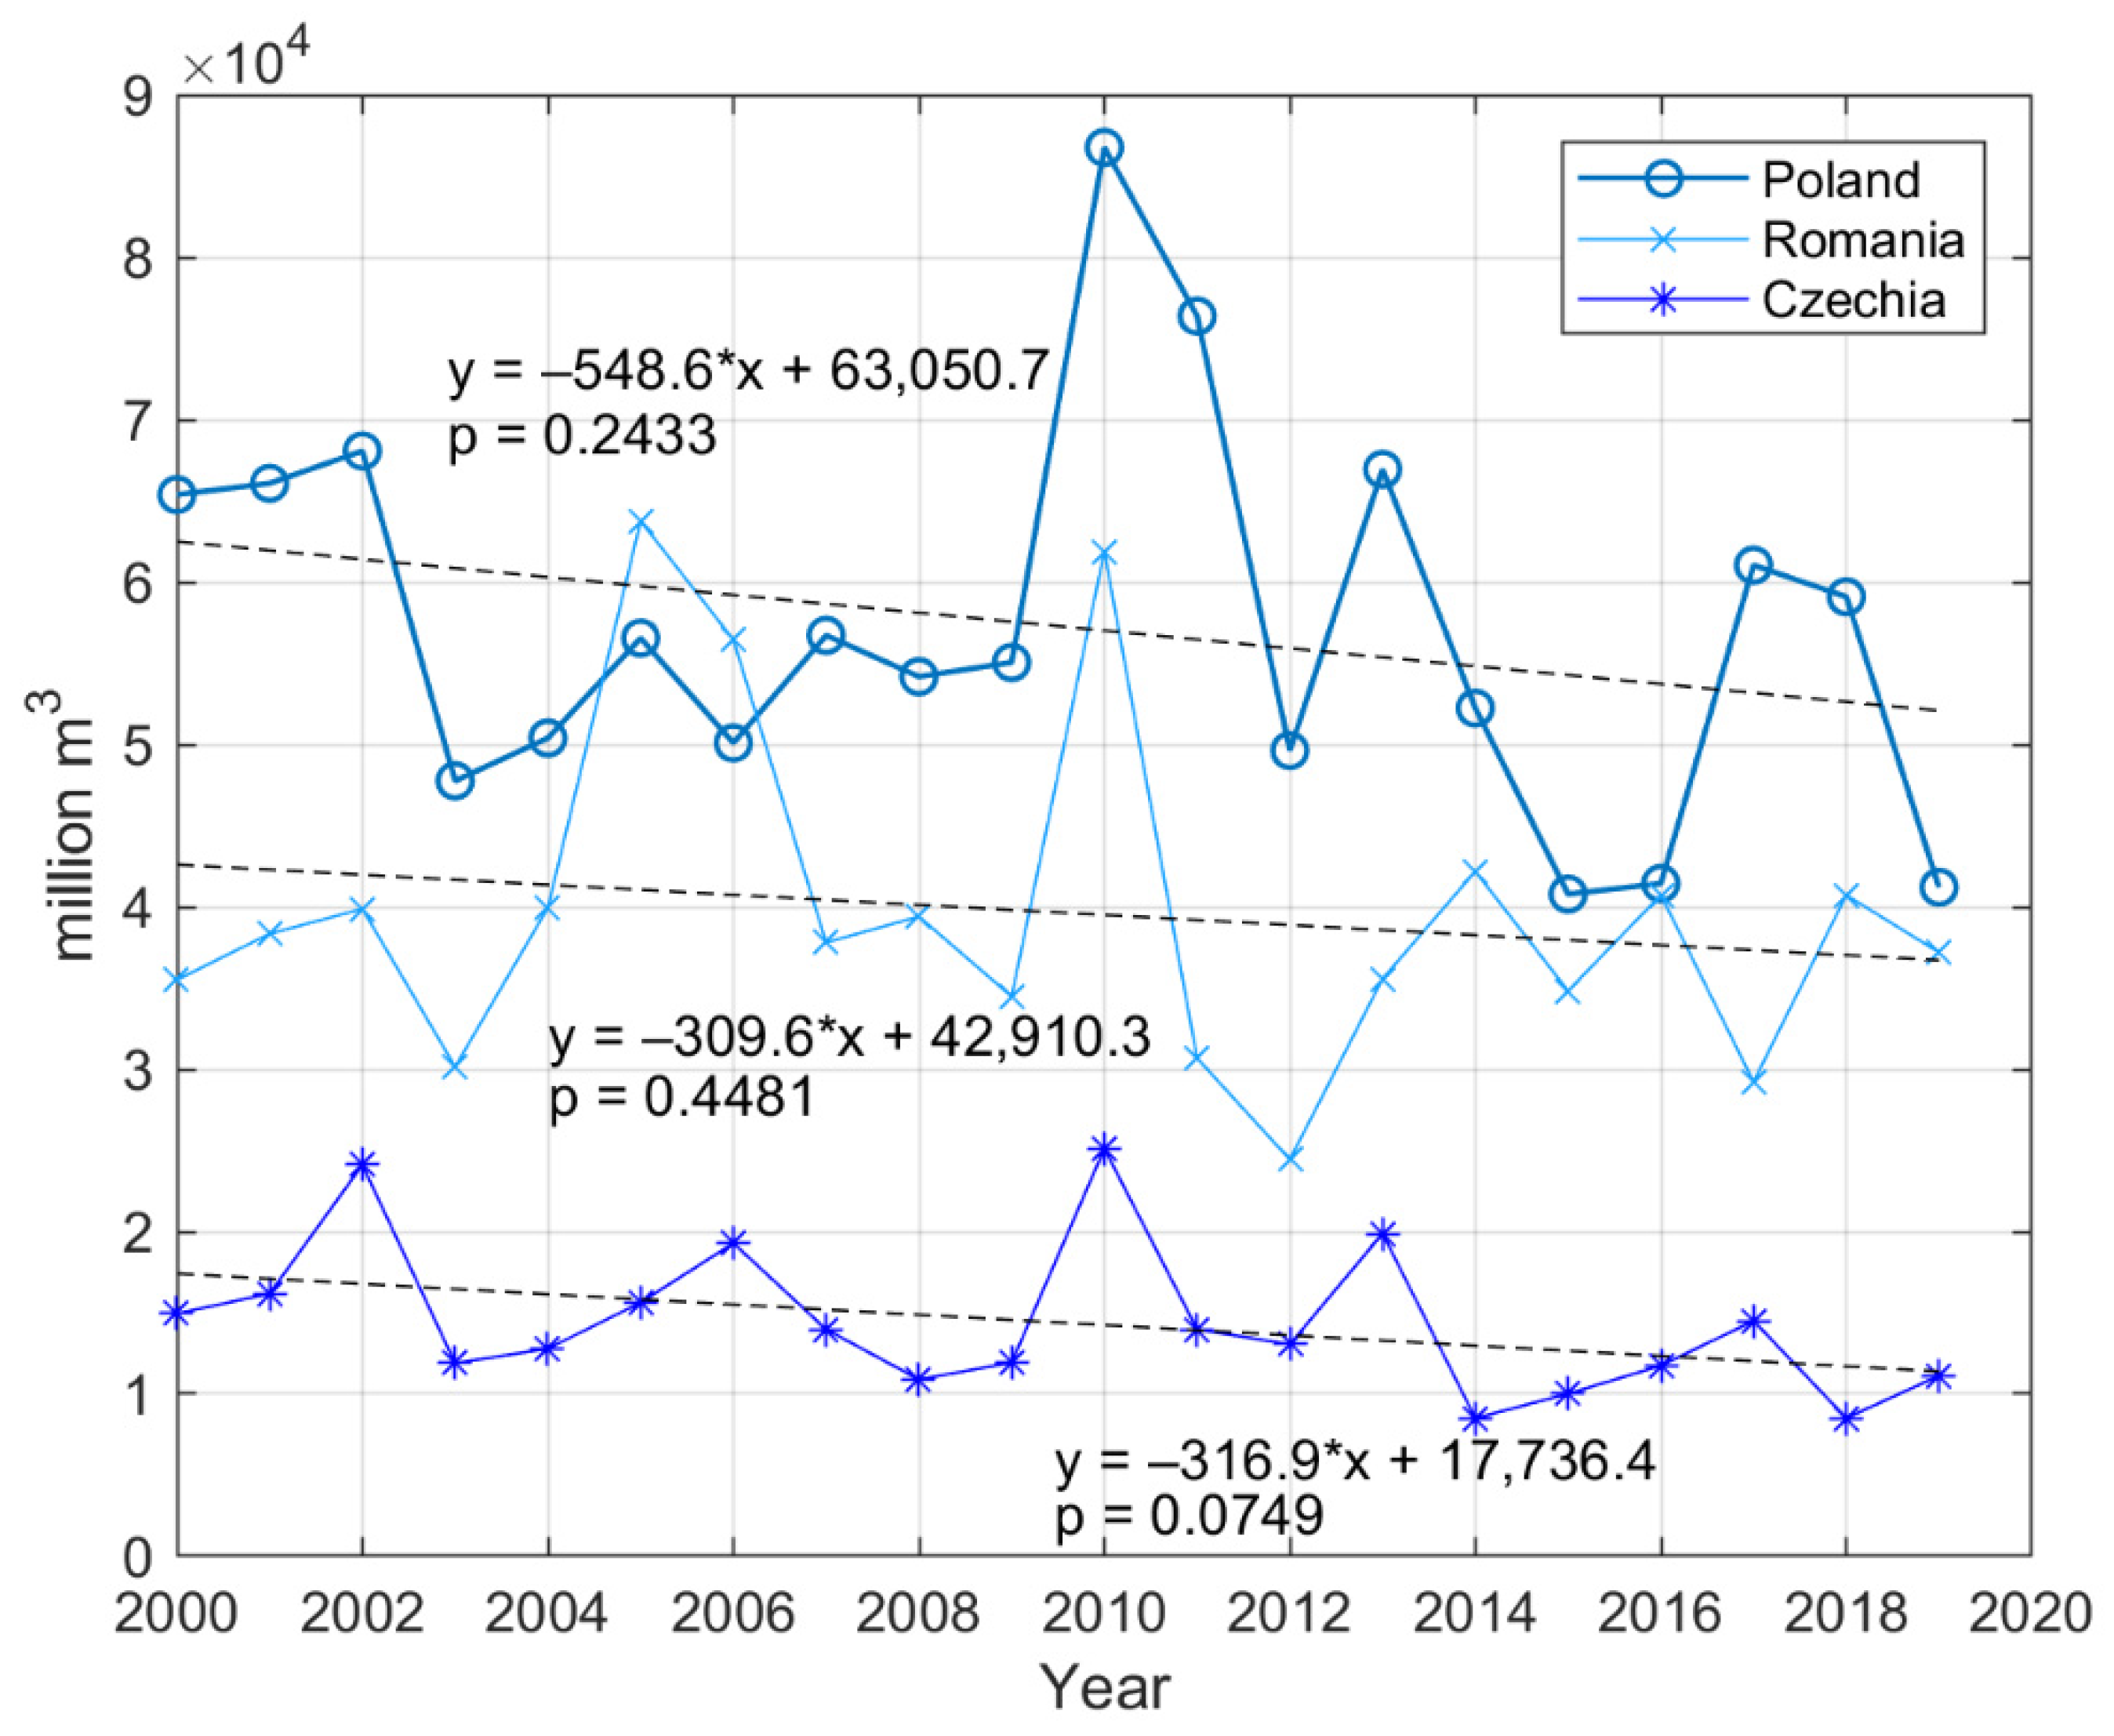
According to data from the Eurostat database, in the years 2000–2019 the average annual fresh surface water resources in Poland amounted to 57,290.6 million m3. Despite the high variability of these resources from year to year (between 40,785.5 and 86,763.2 million m3, in 2015 and 2010, respectively), there is no significant trend in this data (Figure 1), but a slight downward tendency can be observed. At the same time, a similar situation (high variability and no significant trends) can be observed in Romania and Czechia (Figure 1), while the average annual fresh surface water resources are smaller and amount to 39,659.2 and 14,408.5 million m3, respectively.
3.2. Dynamics of Abstraction of Fresh Surface Waters in Poland on a National Scale
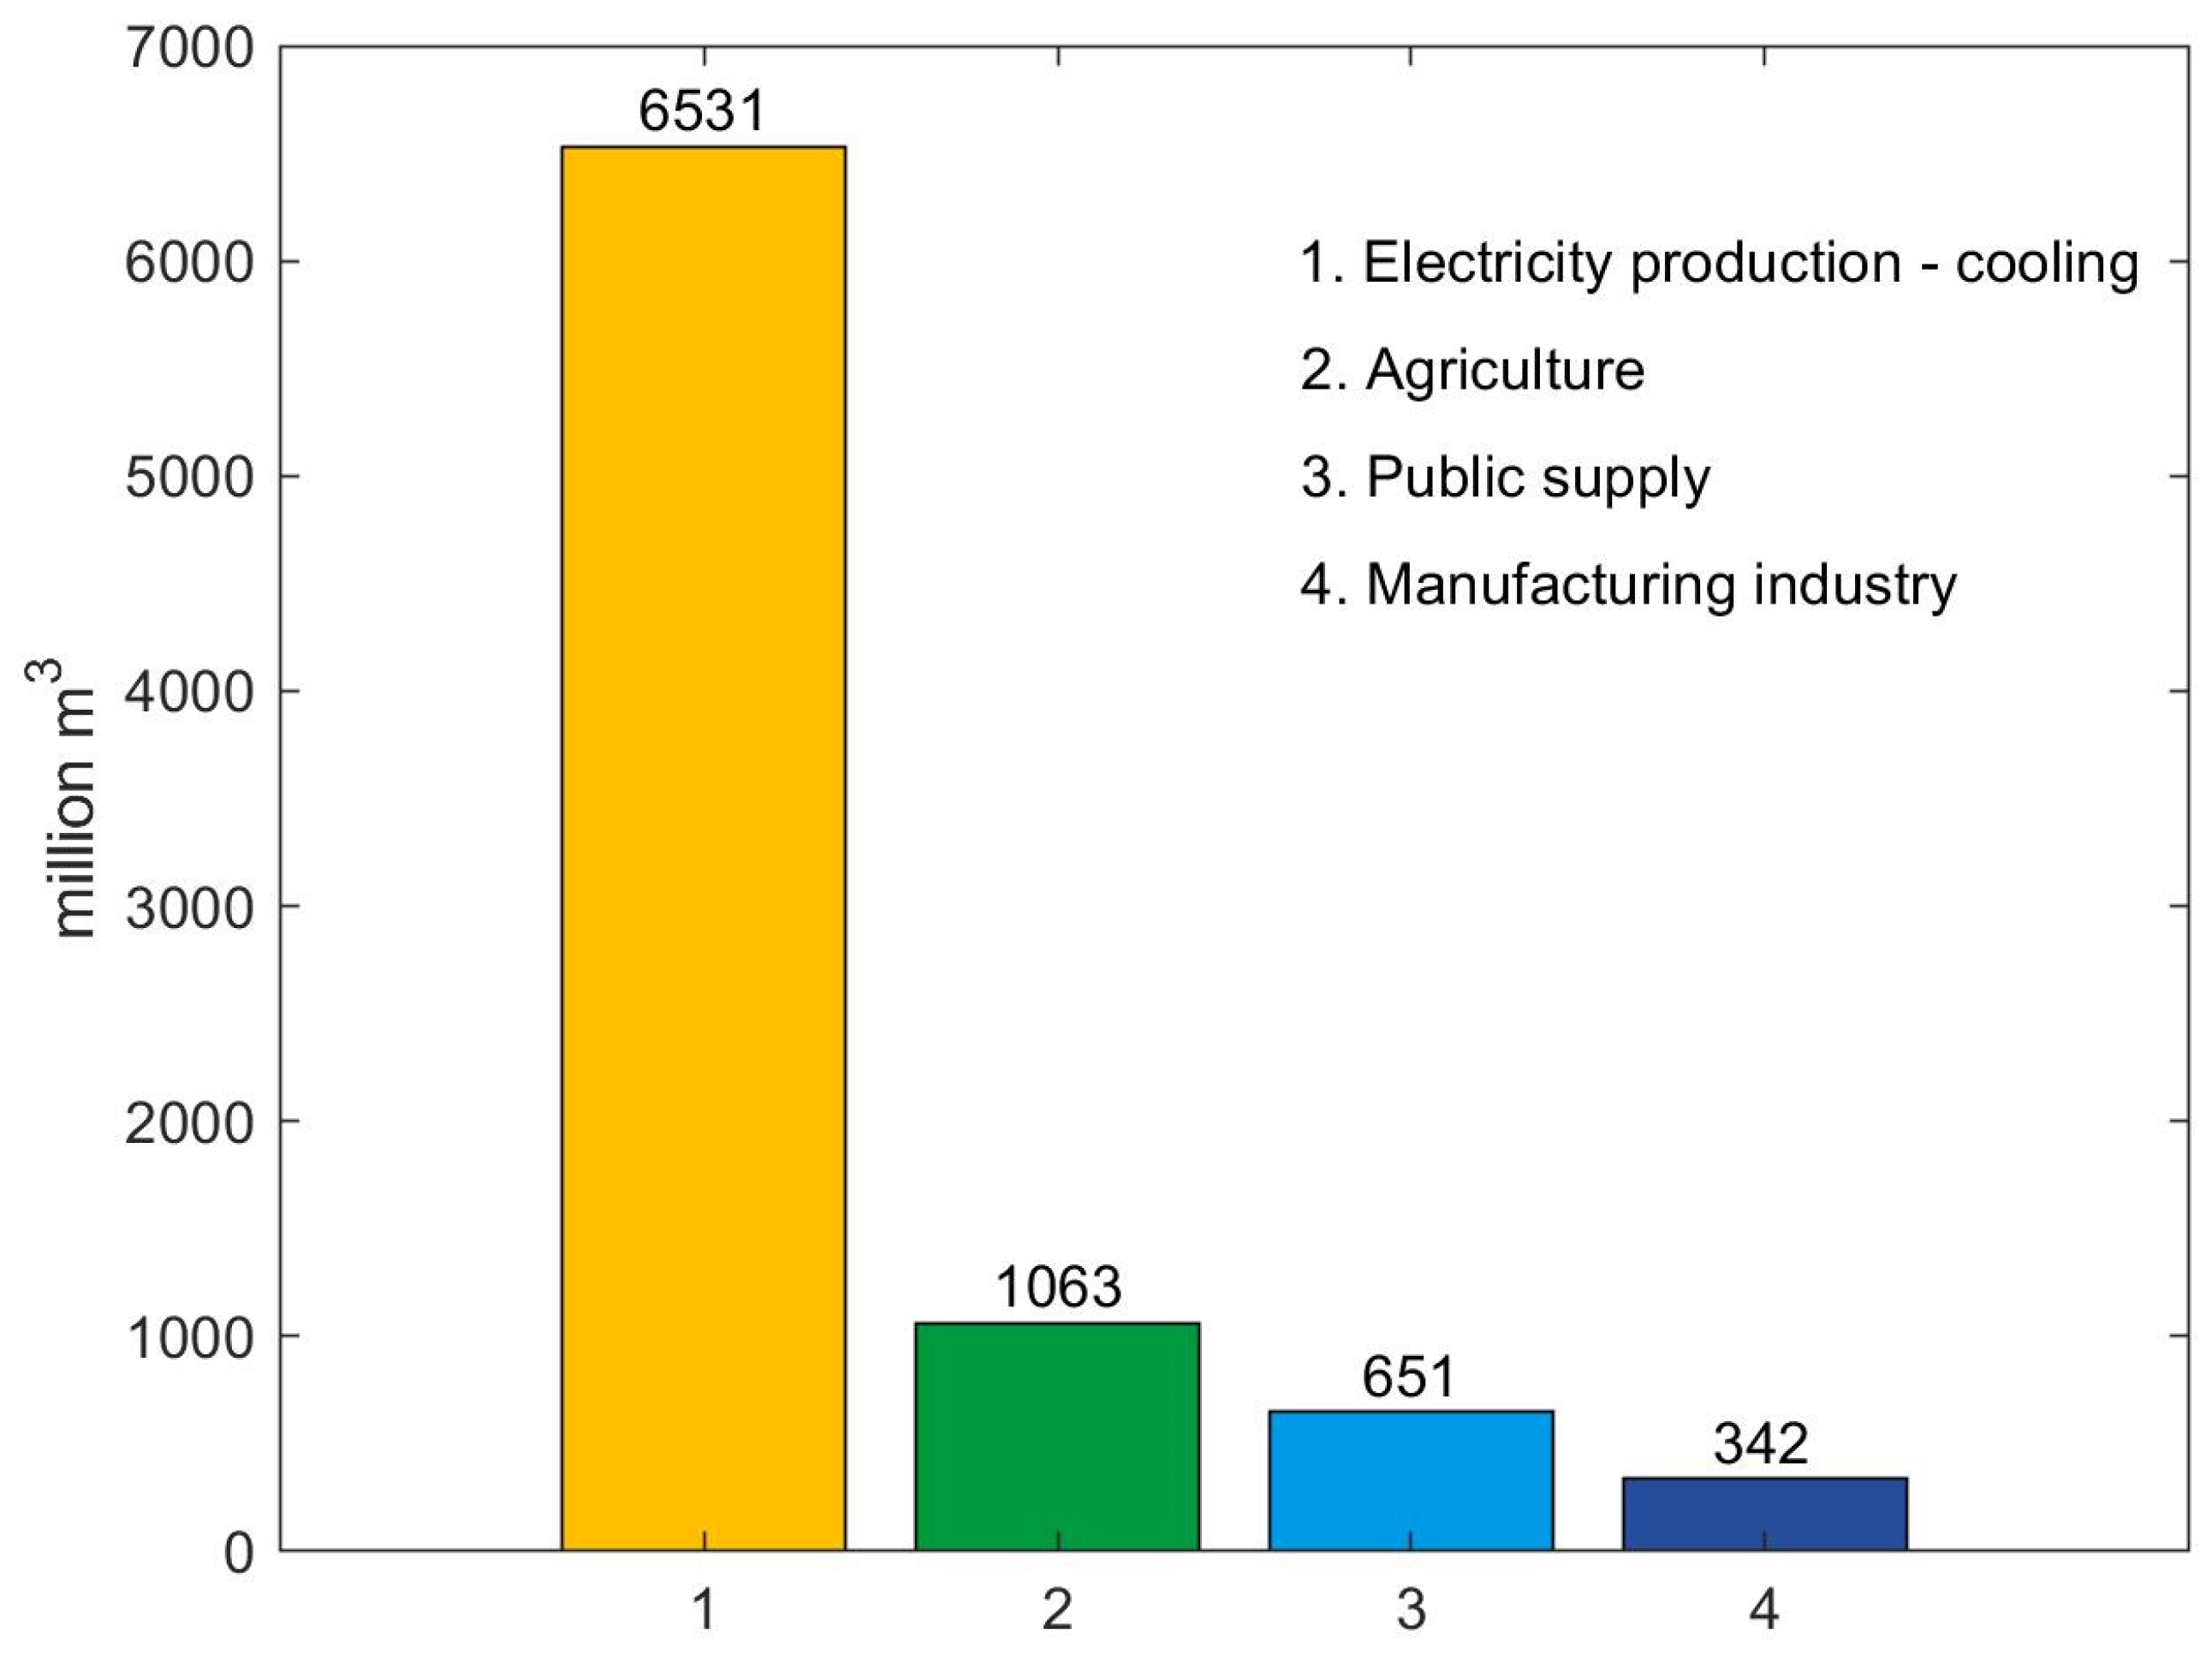
At the same time (2000–2019), the mean annual total gross abstraction from surface freshwaters in Poland amounted to 8753.4 million m3, or 15.8%, and it was mainly used for cooling in electricity production (74.6%), but also for agriculture (12.1%), public water supply (7.4%), and for manufacturing industry (3.9%) (Figure 2).
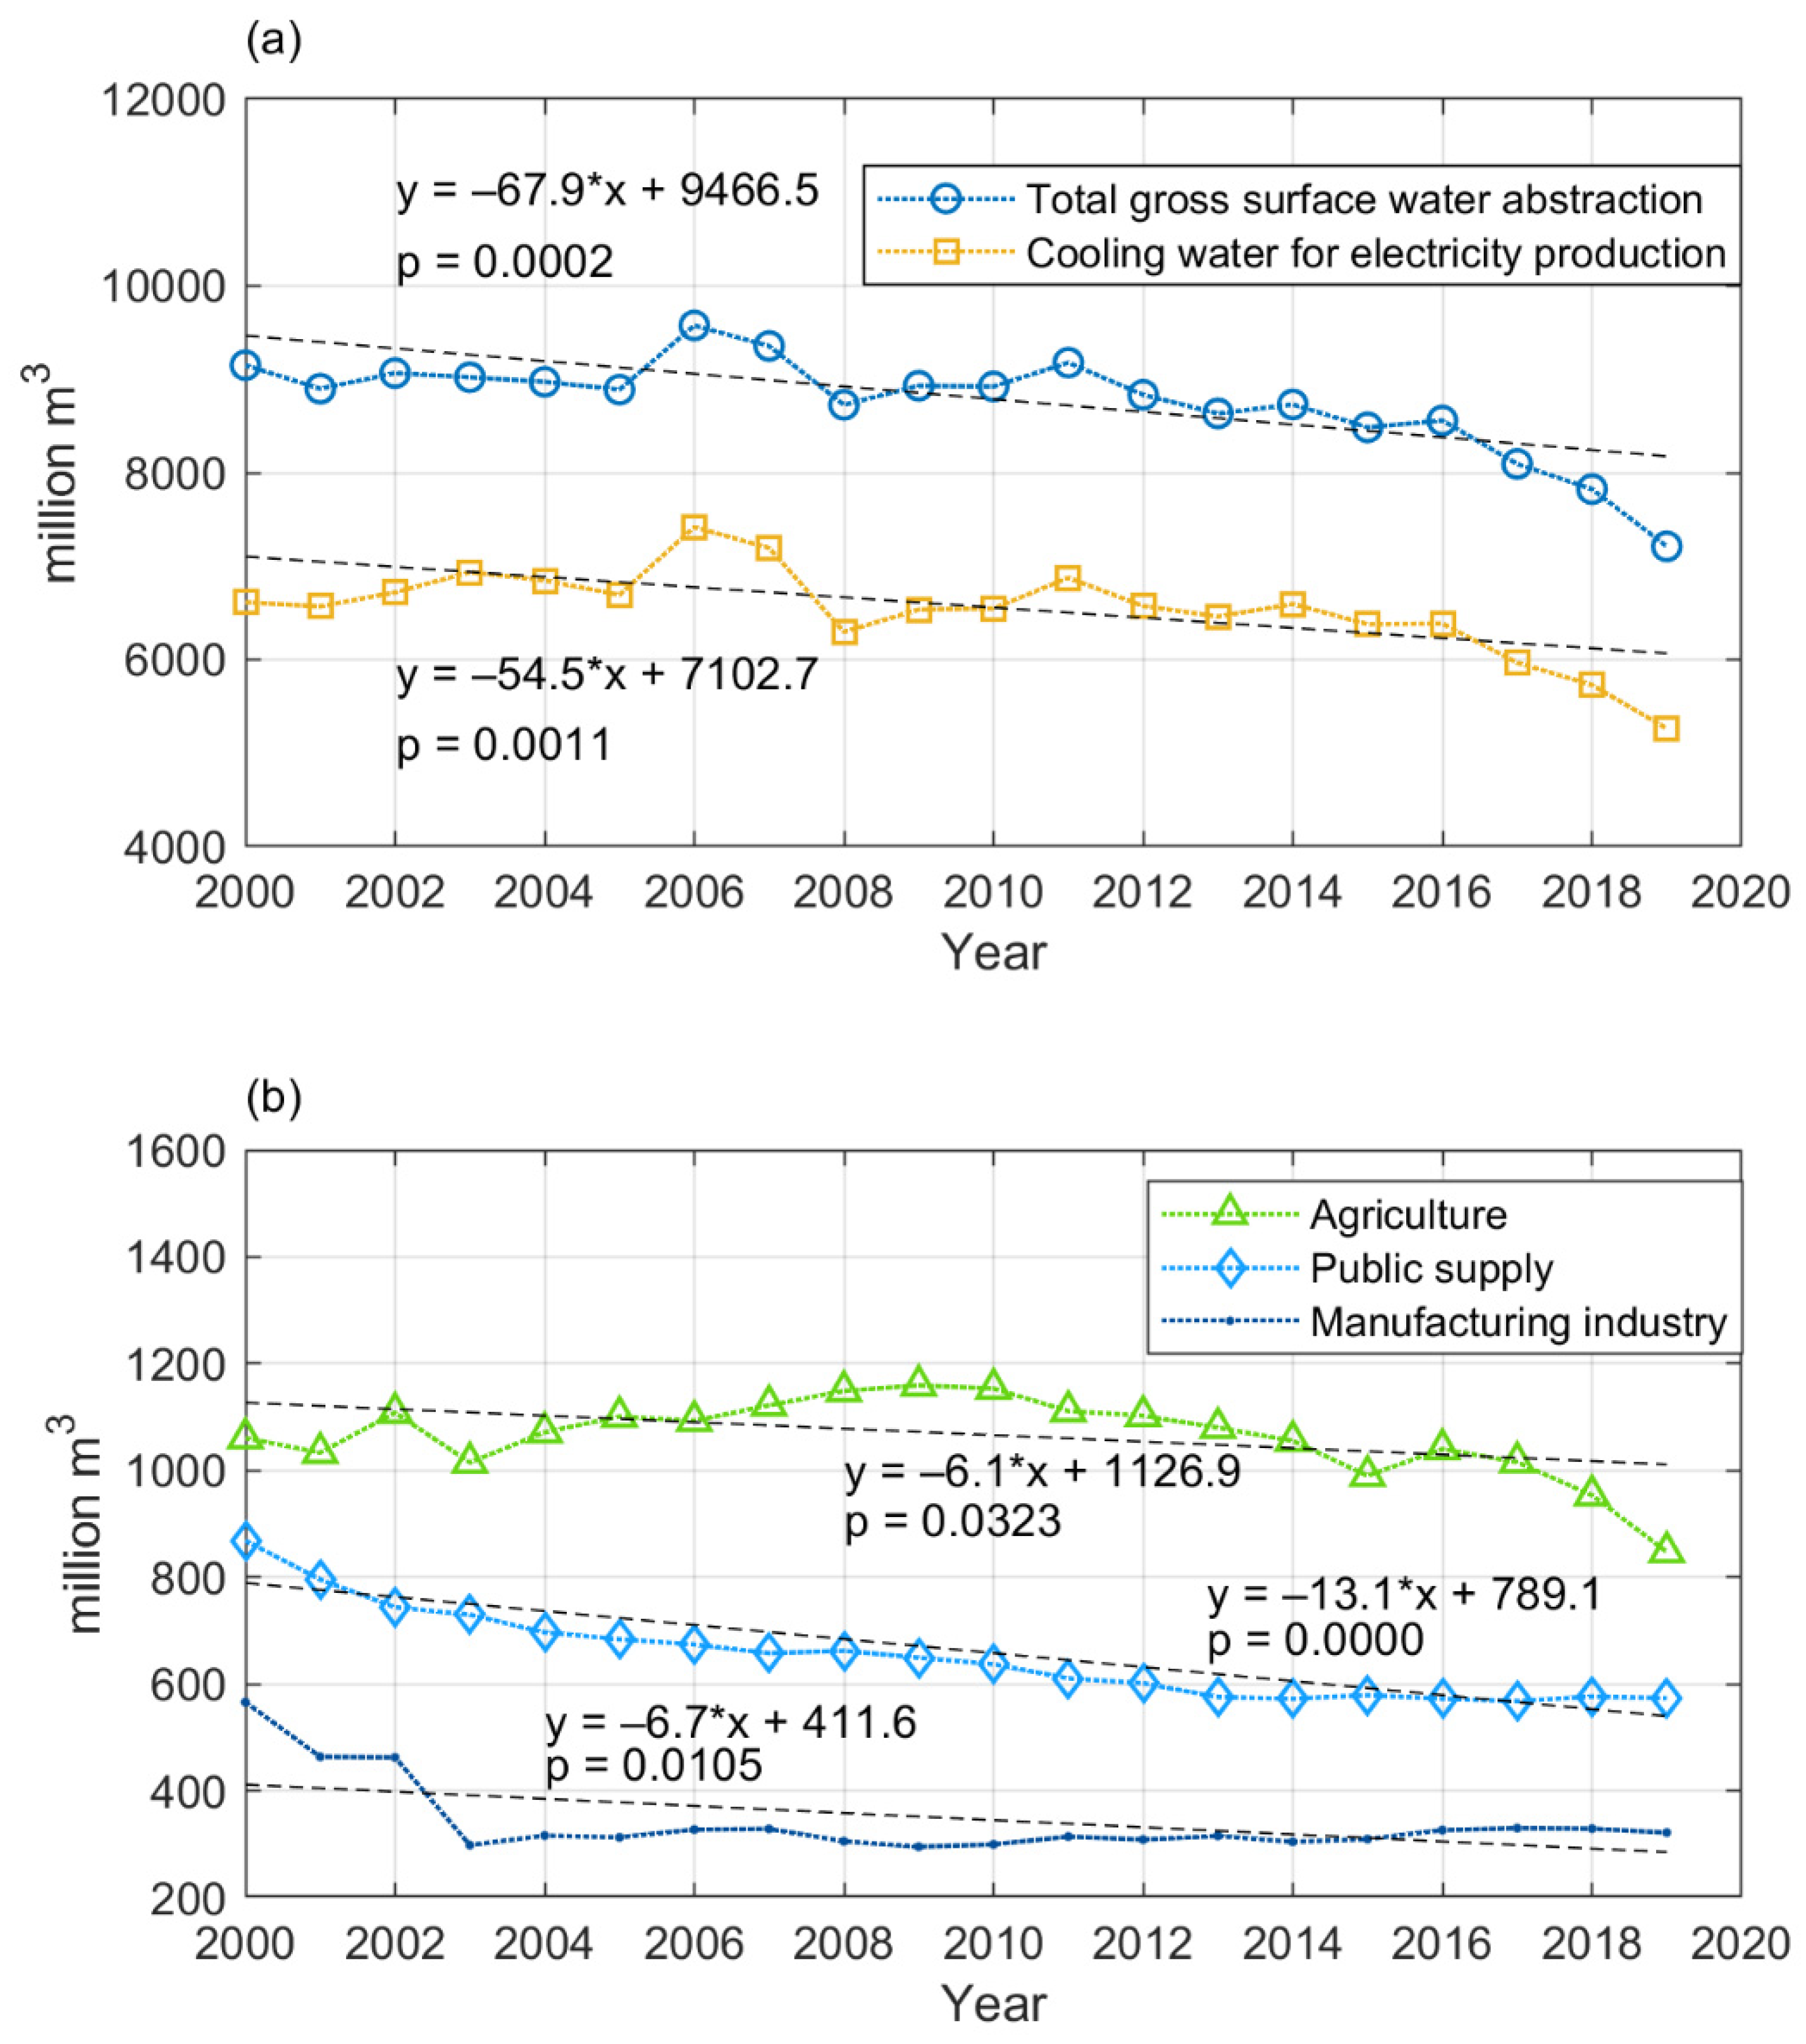
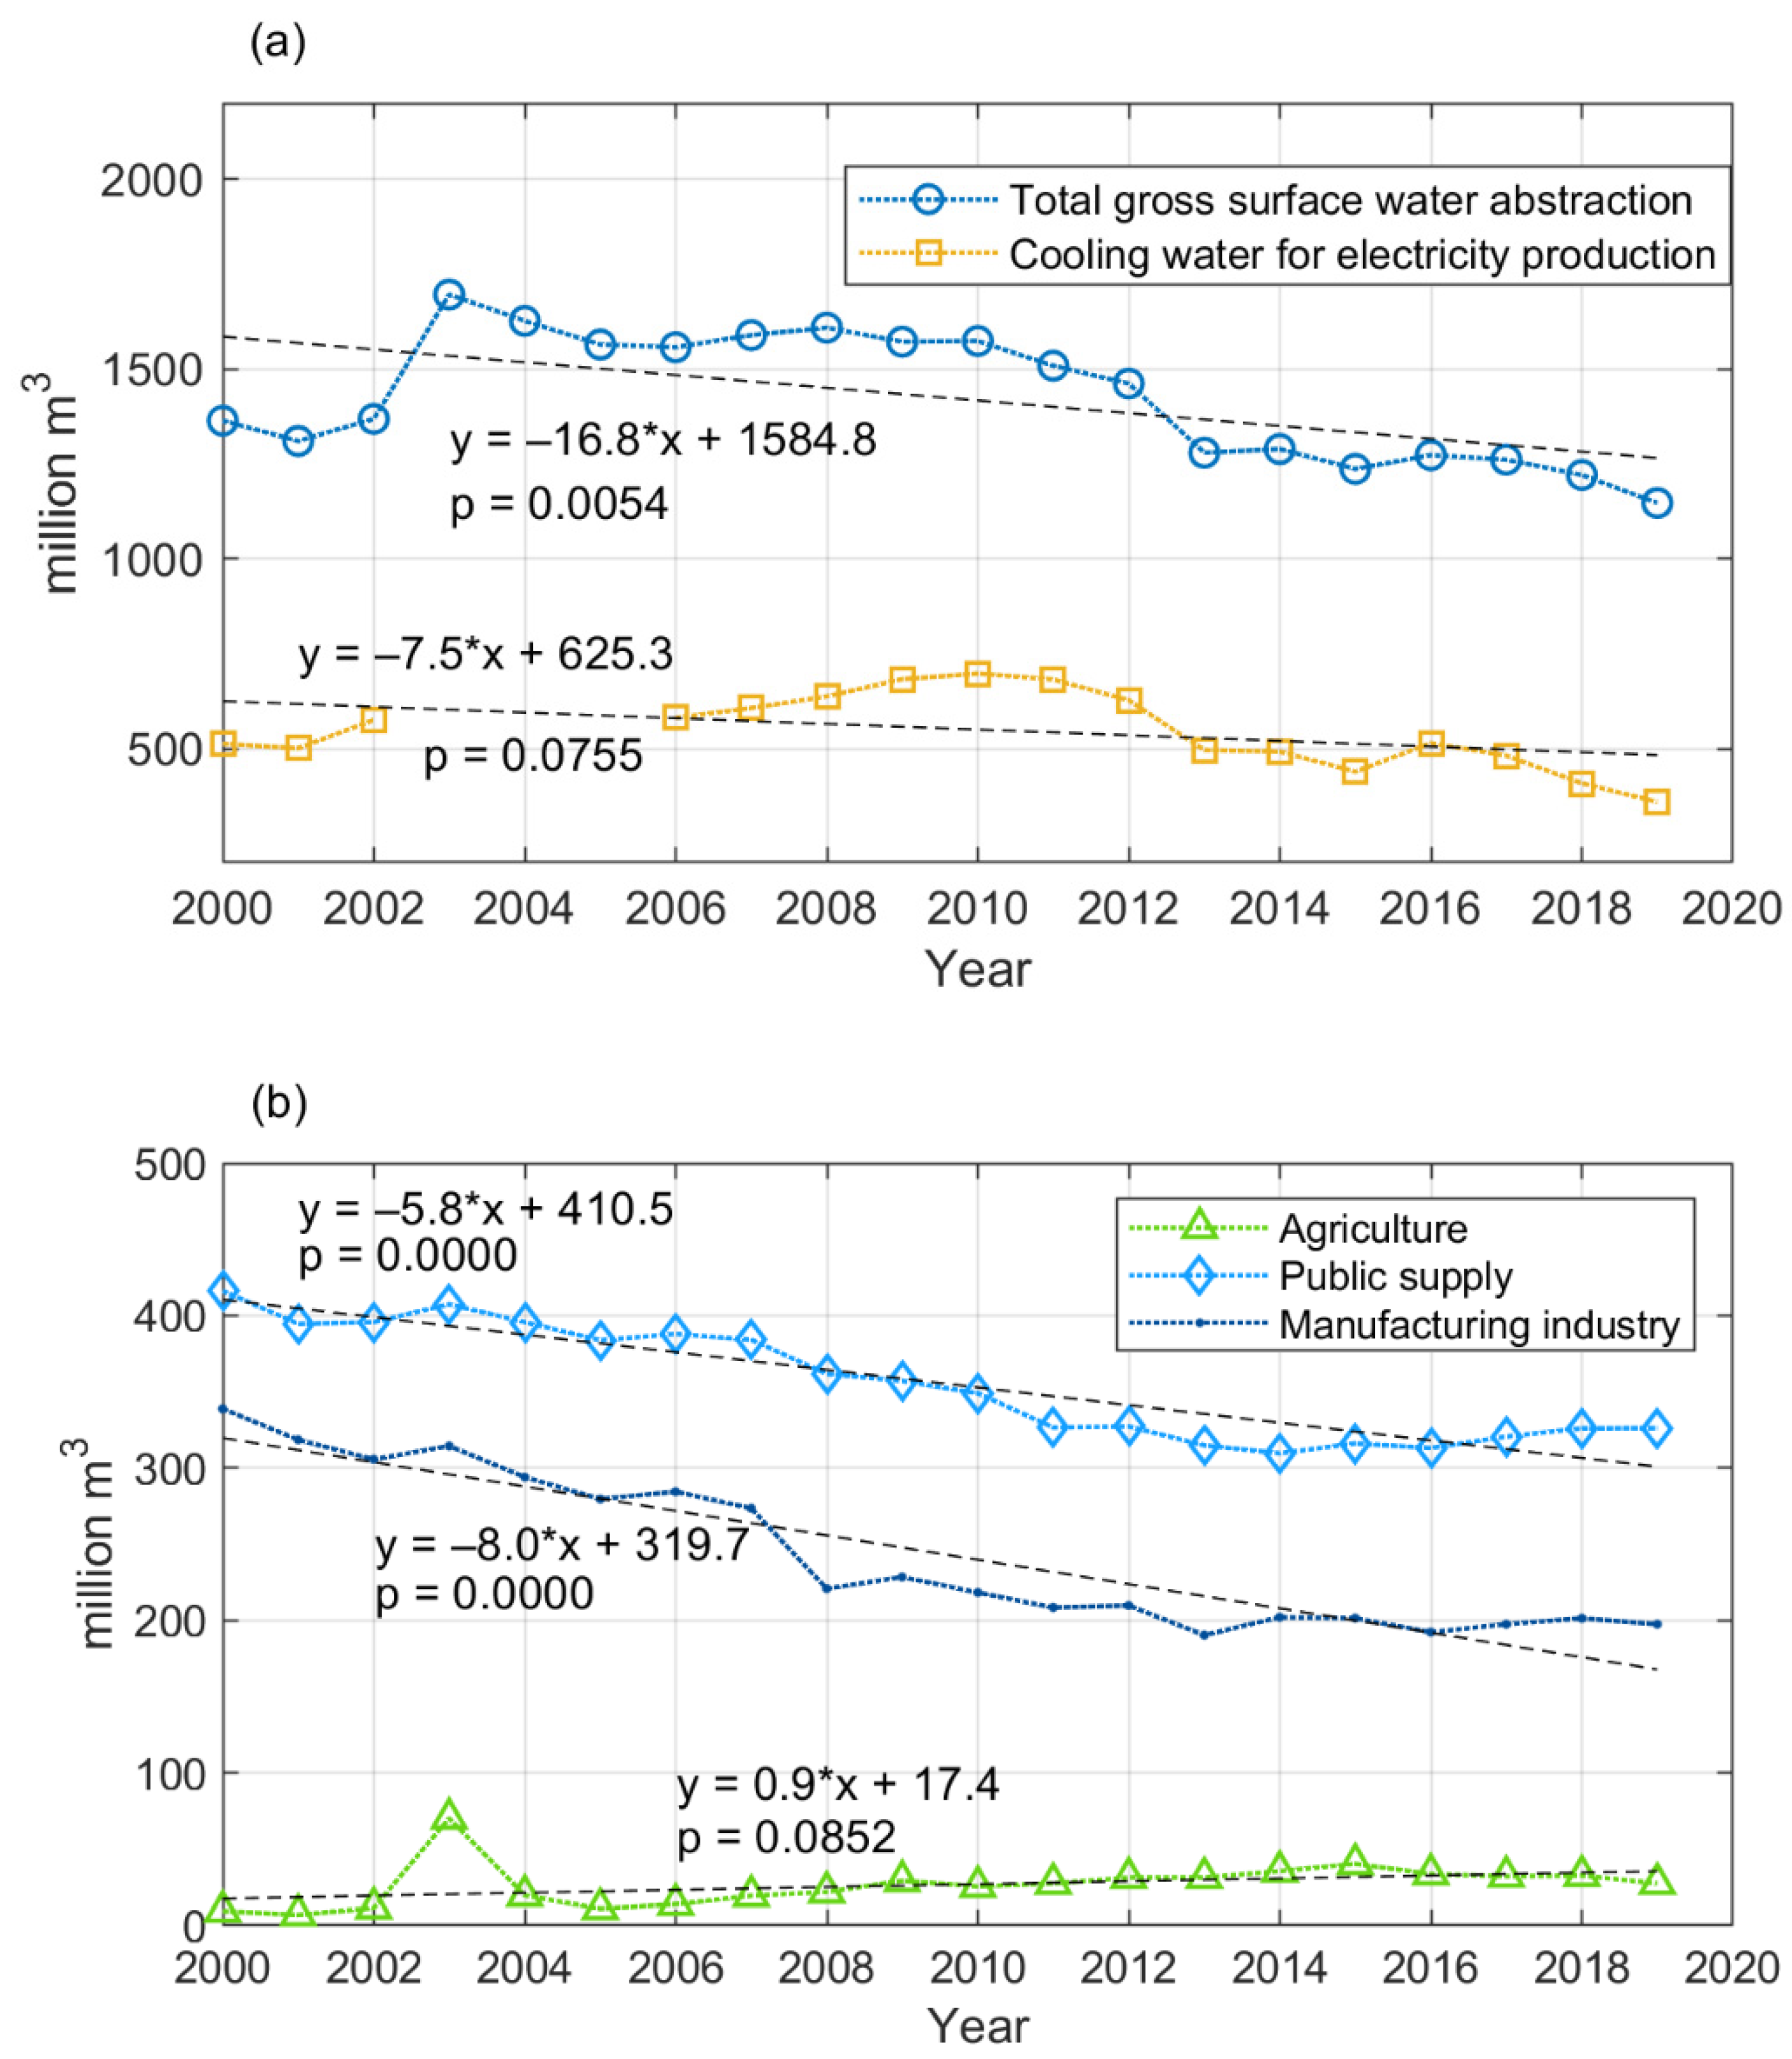
The dynamics of the total gross surface water abstraction and water used for cooling in electricity production in Poland is shown in Figure 3a. It is clearly visible that in Poland, in the last two decades (2000–2019), the dynamics of the total gross water abstraction were strongly related to the dynamics of water used for cooling in the production of electricity; the very high Pearson correlation coefficient (r = 0.9667) also indicates a strong positive linear relationship between them. Moreover, both the dynamics of the total gross water abstraction and cooling water in electricity production show a statistically significant downward trend of 67.9 and 54.5 million m3 per year (p < 0.01), respectively. At the same time, in the dynamics of water abstracted for public purposes, there is a significant (p < 0.0001) downward trend of 13.1 million m3 annually, and the dynamics of surface water abstracted for agriculture and manufacturing industry also show a significant (p < 0.05) downward trend of 6.1 and 6.7 million m3 per year, respectively (Figure 3b).
3.3. Dynamics of Abstraction of Fresh Surface Waters in Poland on a River Basin Scale
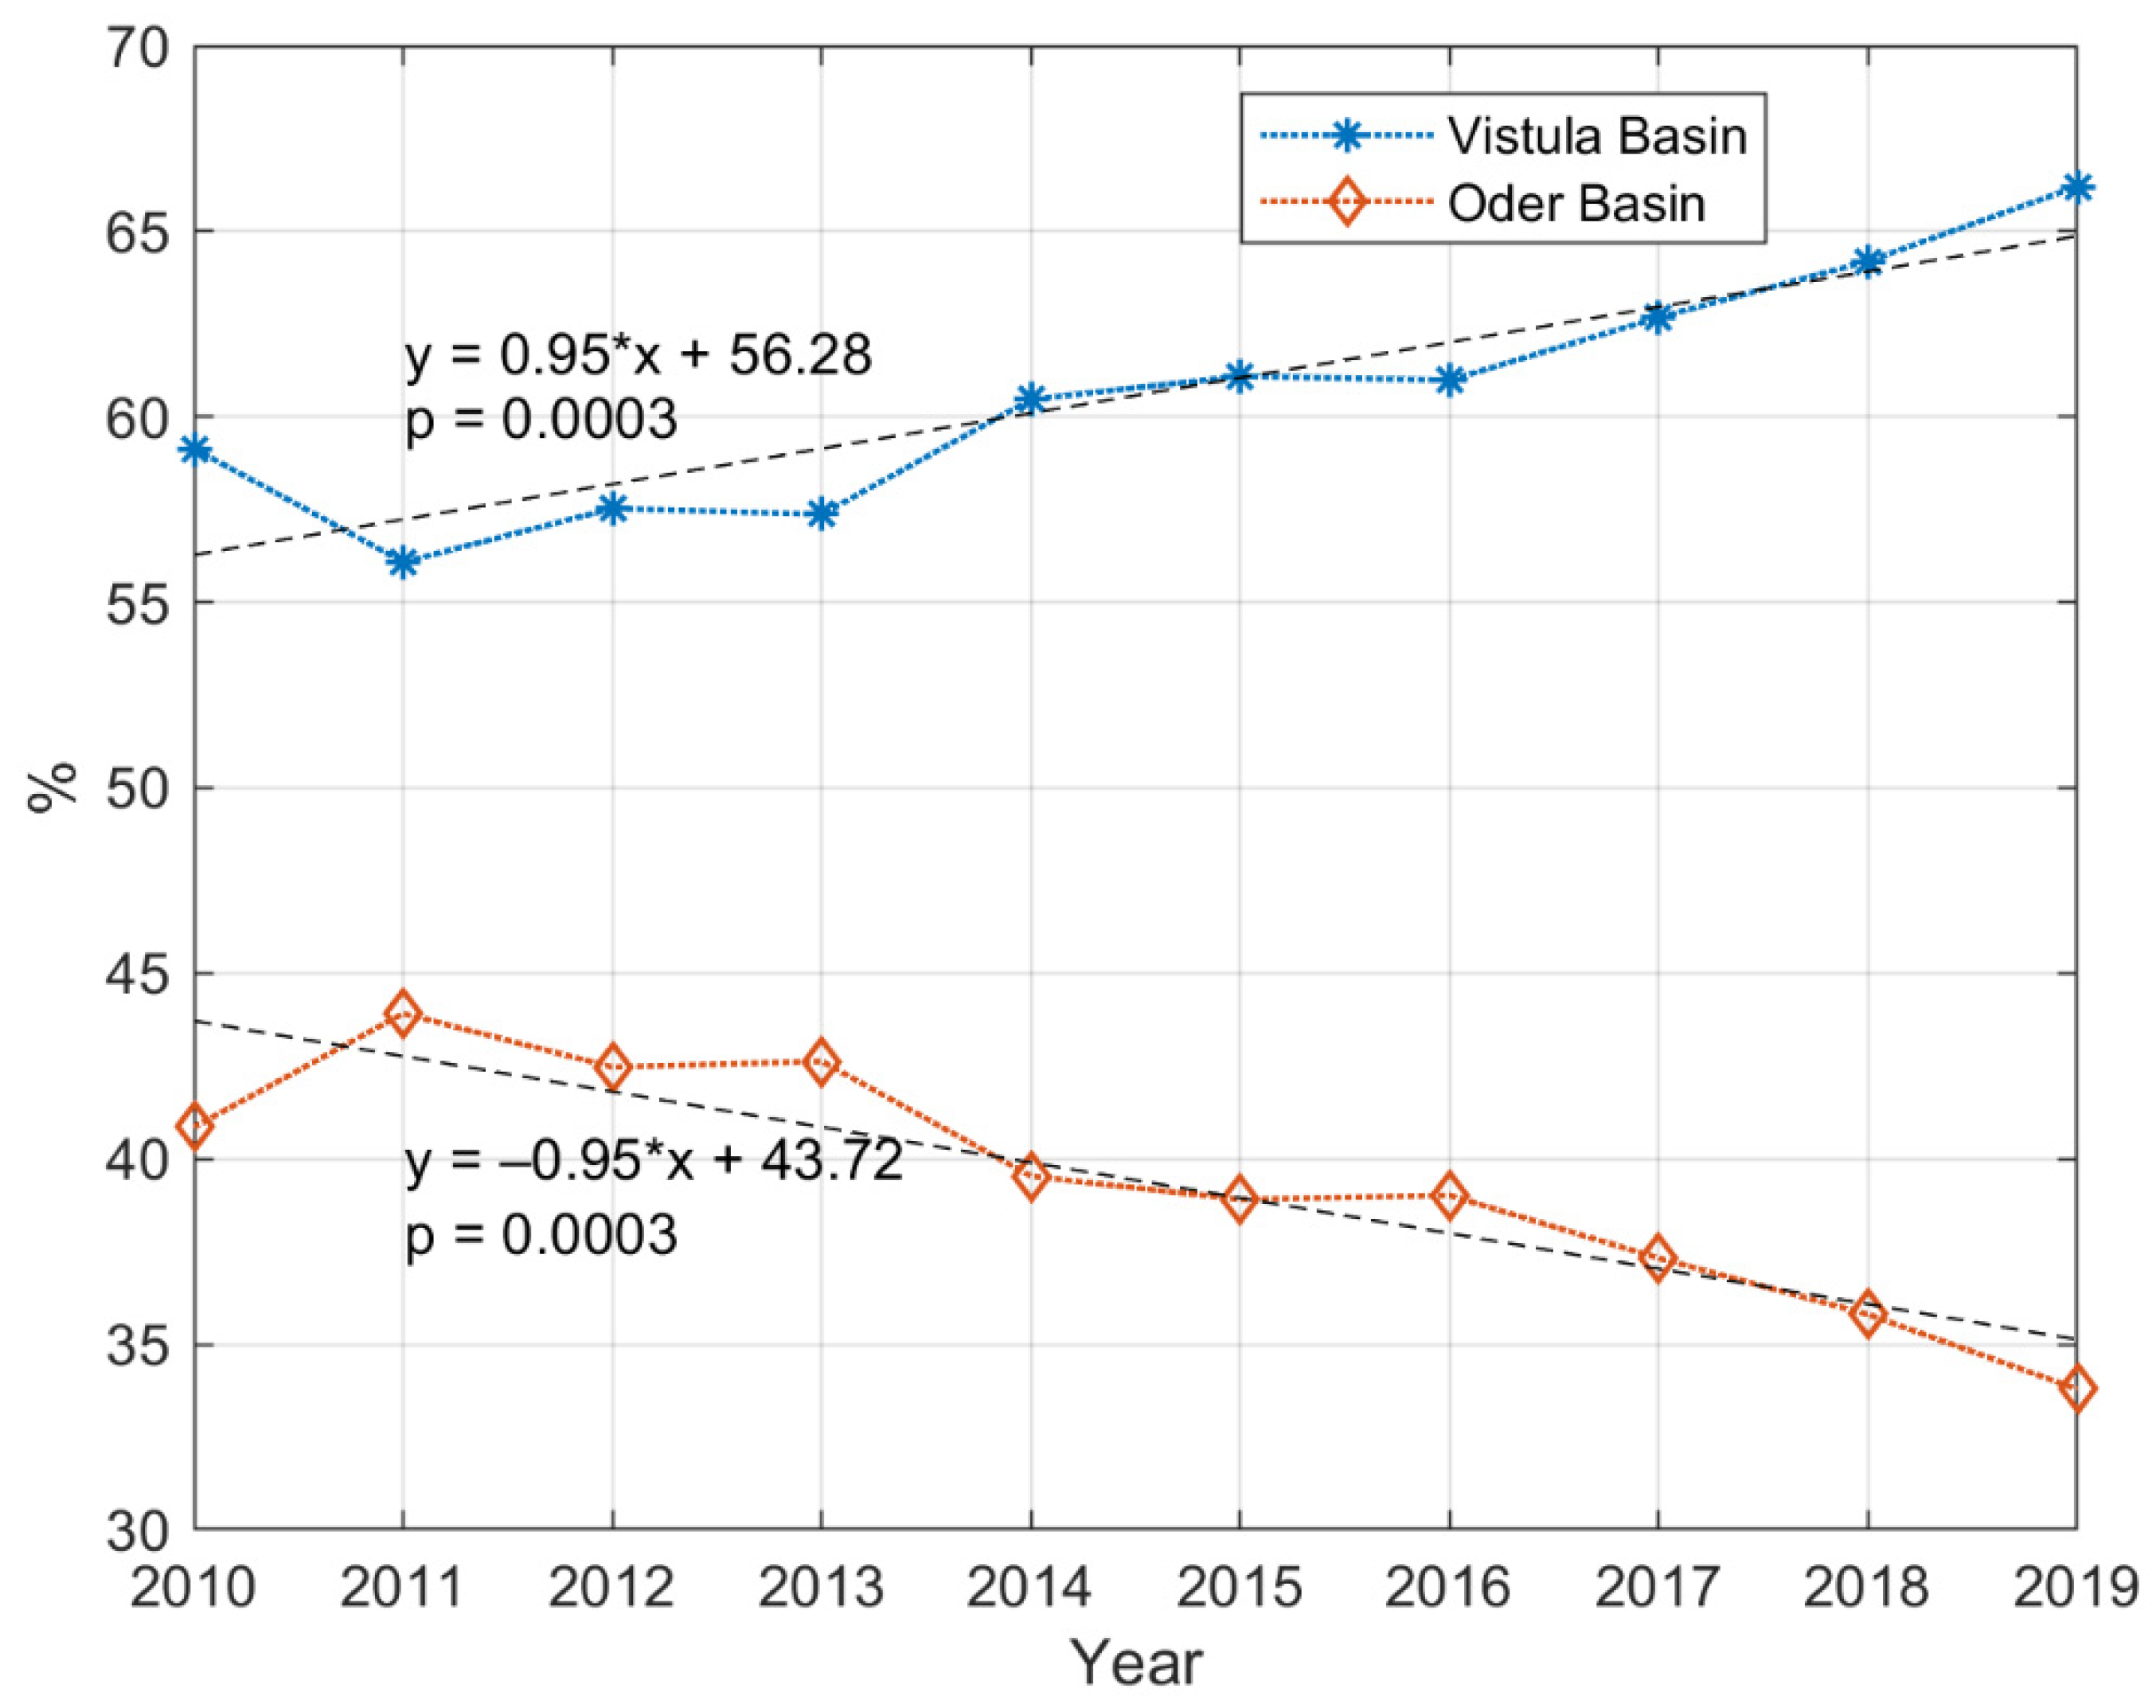
For river basins, data on water abstraction for the years 2000–2009 are not available in the Eurostat database. As a consequence, only available data for the decade 2010–2019 were taken into account for river basins. In 2010–2019, approximately 96% of renewable freshwater resources in Poland were accumulated in two river basins: the Vistula and the Oder, on average 62.5% and 33.3%, respectively. In the 2010–2019 decade in Poland, the Vistula Basin accounted for 59.3–66.7% of the total gross abstraction from surface freshwater (average: 62.6%, i.e., 5273.1 million m3), while the Oder Basin accounted for 33.2–40.5% (average: 37.3%, i.e., 3159.4 million m3) (Figure 4). Moreover, as shown in Figure 4, in 2010–2019, a statistically significant (p < 0.001) increase in water abstraction from the Vistula Basin (by 0.95% per year) was accompanied by a significant (p < 0.001) decrease in water abstraction from the Oder Basin (by 0.95% annually).
3.4. Dynamics of Abstraction of Fresh Surface Waters in Czechia and Romania
In the years 2000–2019, the average annual total gross abstraction from surface freshwaters in Romania and Czechia amounted to 5867.5 and 1425.1 million m3, or 15.8 and 10.7%, respectively. In Romania, the abstracted water was mainly used for cooling in electricity production (34.2%) and for the manufacturing industry (31.7%), while in Czechia, it was mainly used for cooling in electricity production (39.1%) and for public water supply (25.1%). As shown in Figure 5a, in the last two decades (2000–2019) in Czechia, as in Poland, the dynamics of total gross water abstraction were strongly related to the dynamics of water used for cooling in electricity production, which is confirmed by a very high Pearson correlation coefficient (r = 0.9199). In addition, the dynamics of the total gross water abstraction show a statistically significant downward trend of 16.8 million m3 per year (p < 0.01). As depicted in Figure 5b, both the dynamics of surface water abstracted for public purposes and for the manufacturing industry show a statistically significant downward trend of 5.8 and 8.0 million m3 per year (p < 0.0001), respectively.
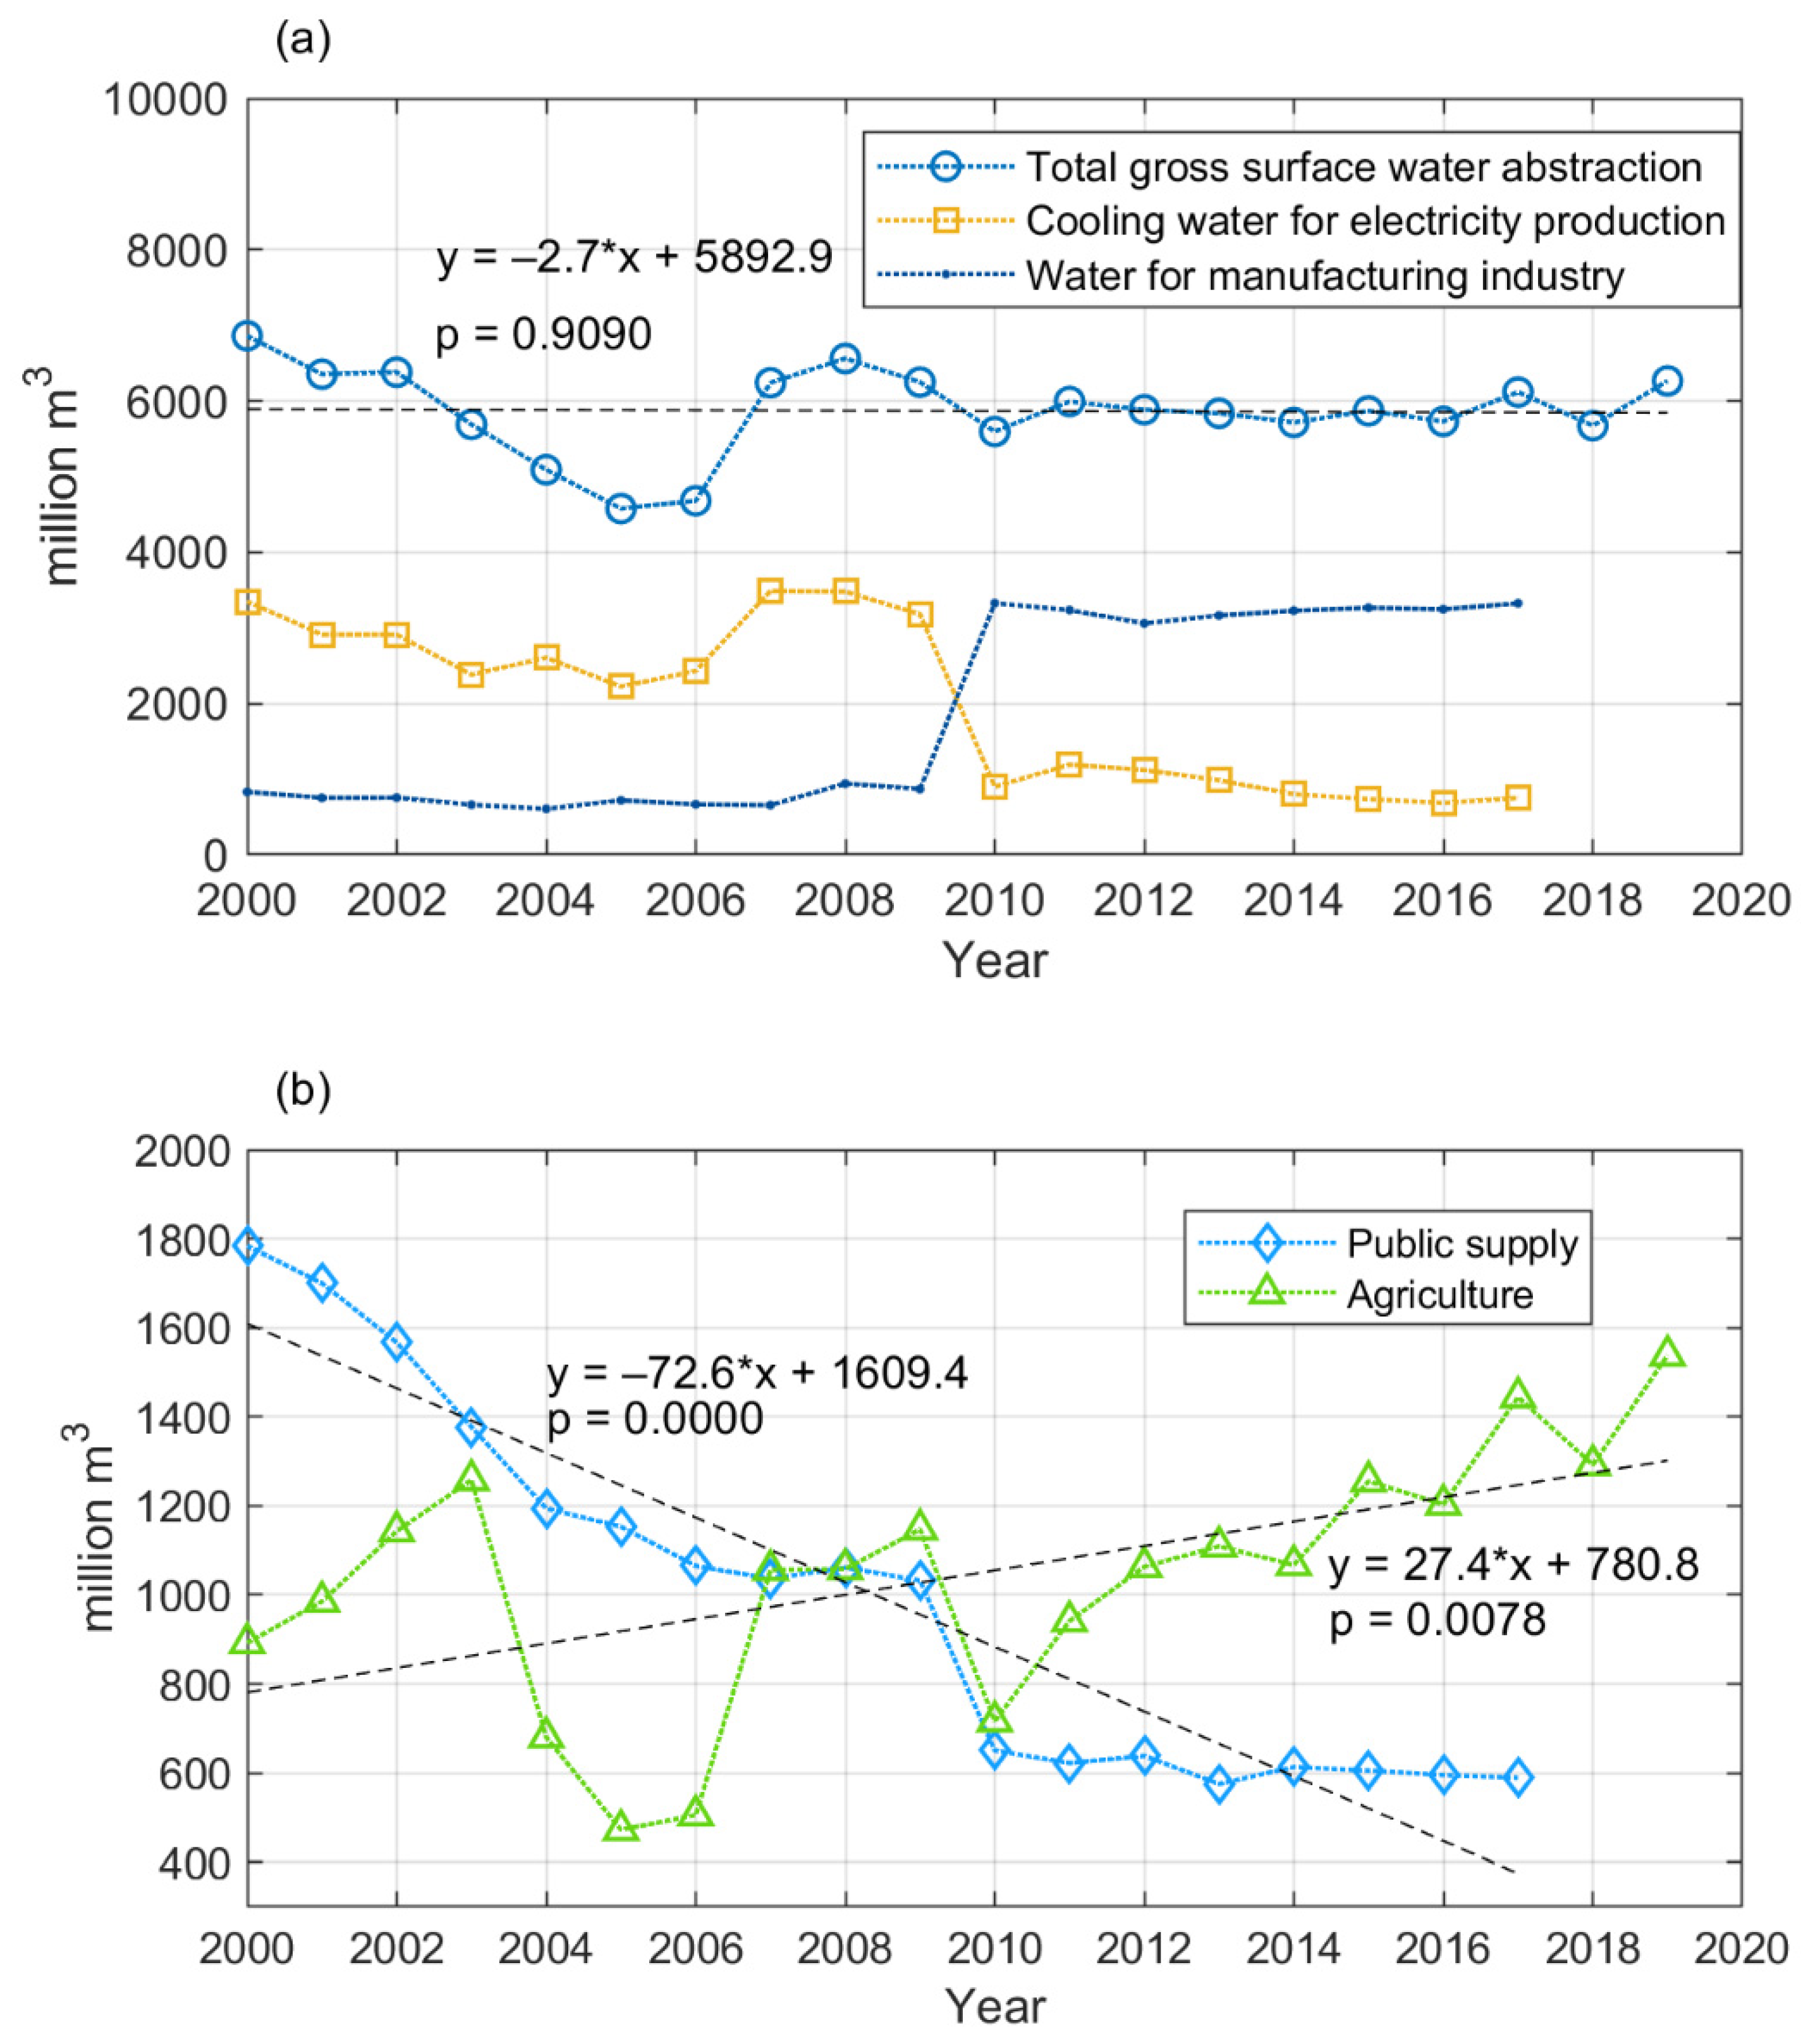
In the last two decades (2000–2019) in Romania, the dynamics of total gross water abstraction do not show a significant linear trend (Figure 6a). Interestingly, as shown in Figure 6a, since 2010, the reduction in the amount of water abstracted for cooling in electricity production (on average) from 2896.1 to 897.0 million m3 has been accompanied by an increase in the amount of water abstracted for the manufacturing industry, (on average) from 746.7 to 3230.6 million m3. As a result, the high correlation (r = 0.8513) between water abstracted for cooling in electricity production and the total gross surface water abstraction in 2000–2009 decreased to a very weak one (r = 0.2053) in 2010–2017. Figure 6b shows a significant (p < 0.0001) decreasing trend in water abstracted in Romania for public purposes of 72.6 million m3 per year as well as a significant (p < 0.01) increasing trend in water abstracted for agriculture of 27.4 million m3 annually.
3.5. Dynamics of the Share of the Main Energy Sources in Electricity Production in Poland
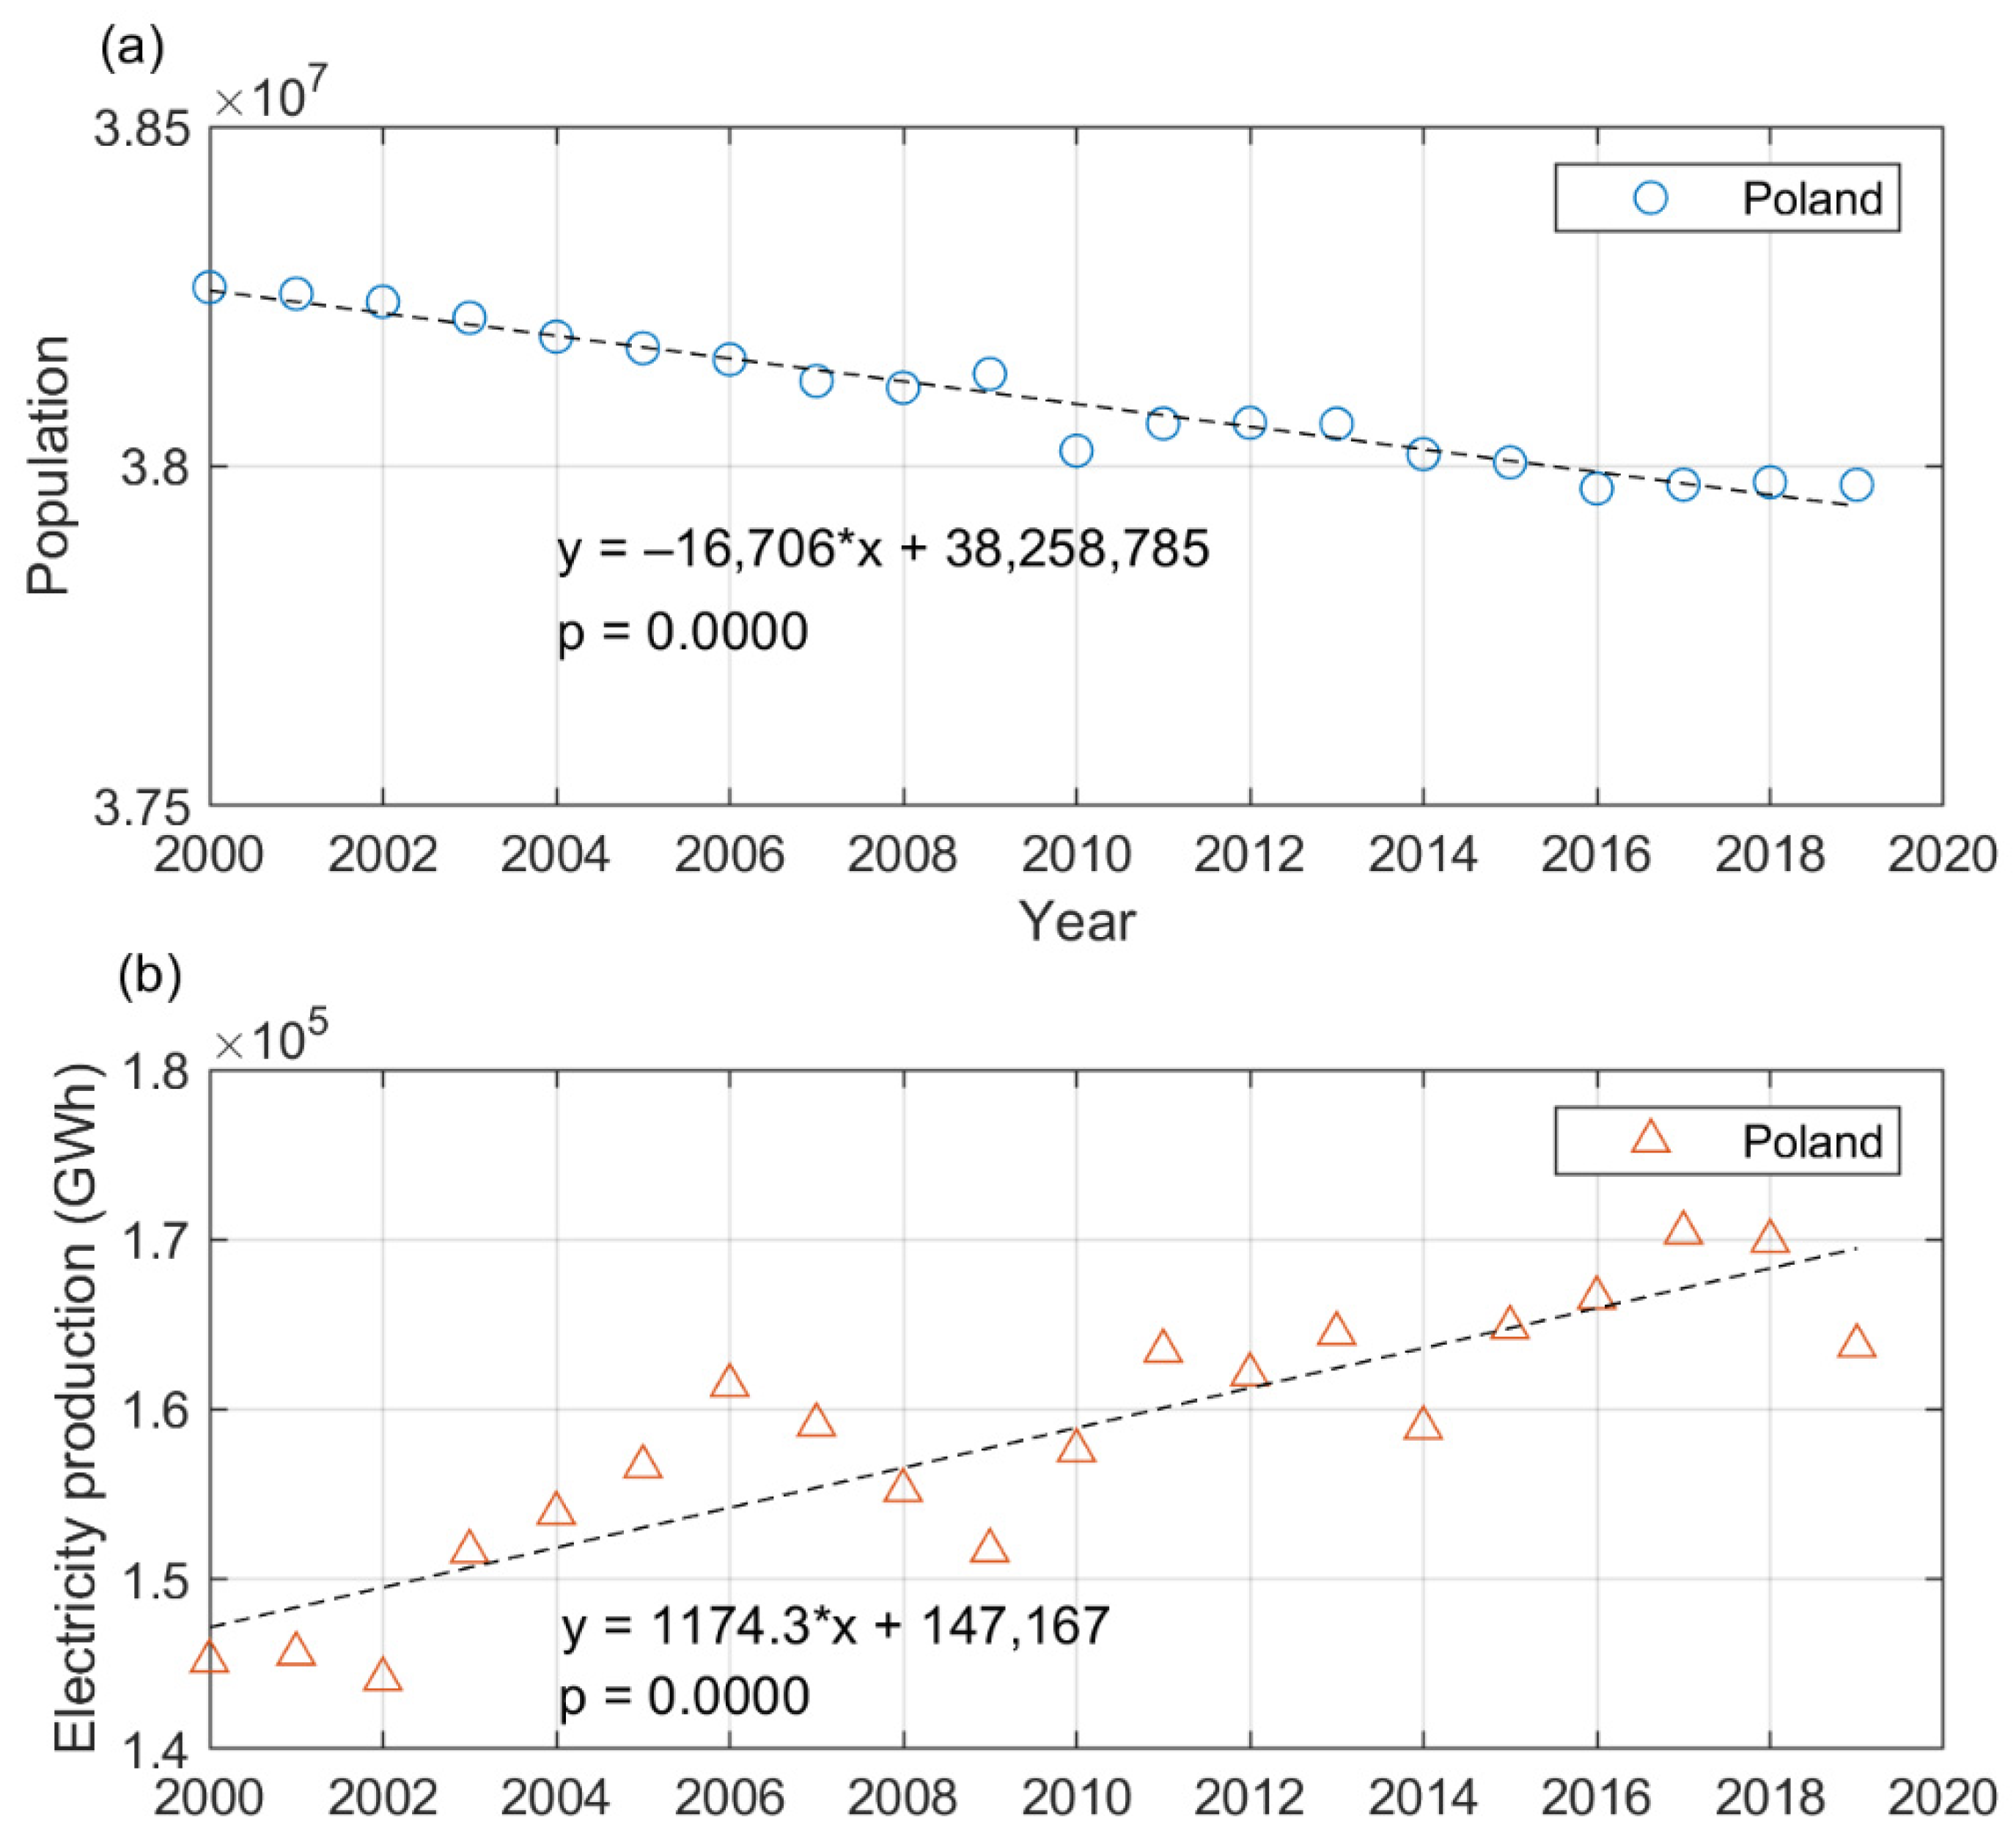
According to Eurostat data, in the years 2000–2019 the population in Poland decreased significantly (p < 0.0001), by an average of 16.7 thousand people per year (Figure 7a), while total gross electricity production increased significantly (p < 0.0001), by an average of 1174.3 GWh per year (Figure 7b), that is, from 145,185 GWh in 2000 to 163,751 GWh in 2019, with a maximum of 170,404 GWh in 2017. These results indicate that in the years 2000–2019 in Poland there was an increase in energy demand despite a significant decrease in the population. On the other hand, a significant increase in electricity production (Figure 7a) was accompanied by a significant decrease in cooling water abstraction for electricity production (Figure 3a). This involved significant changes in the structure of electricity production, as shown in Figure 8 and explained in the text below.
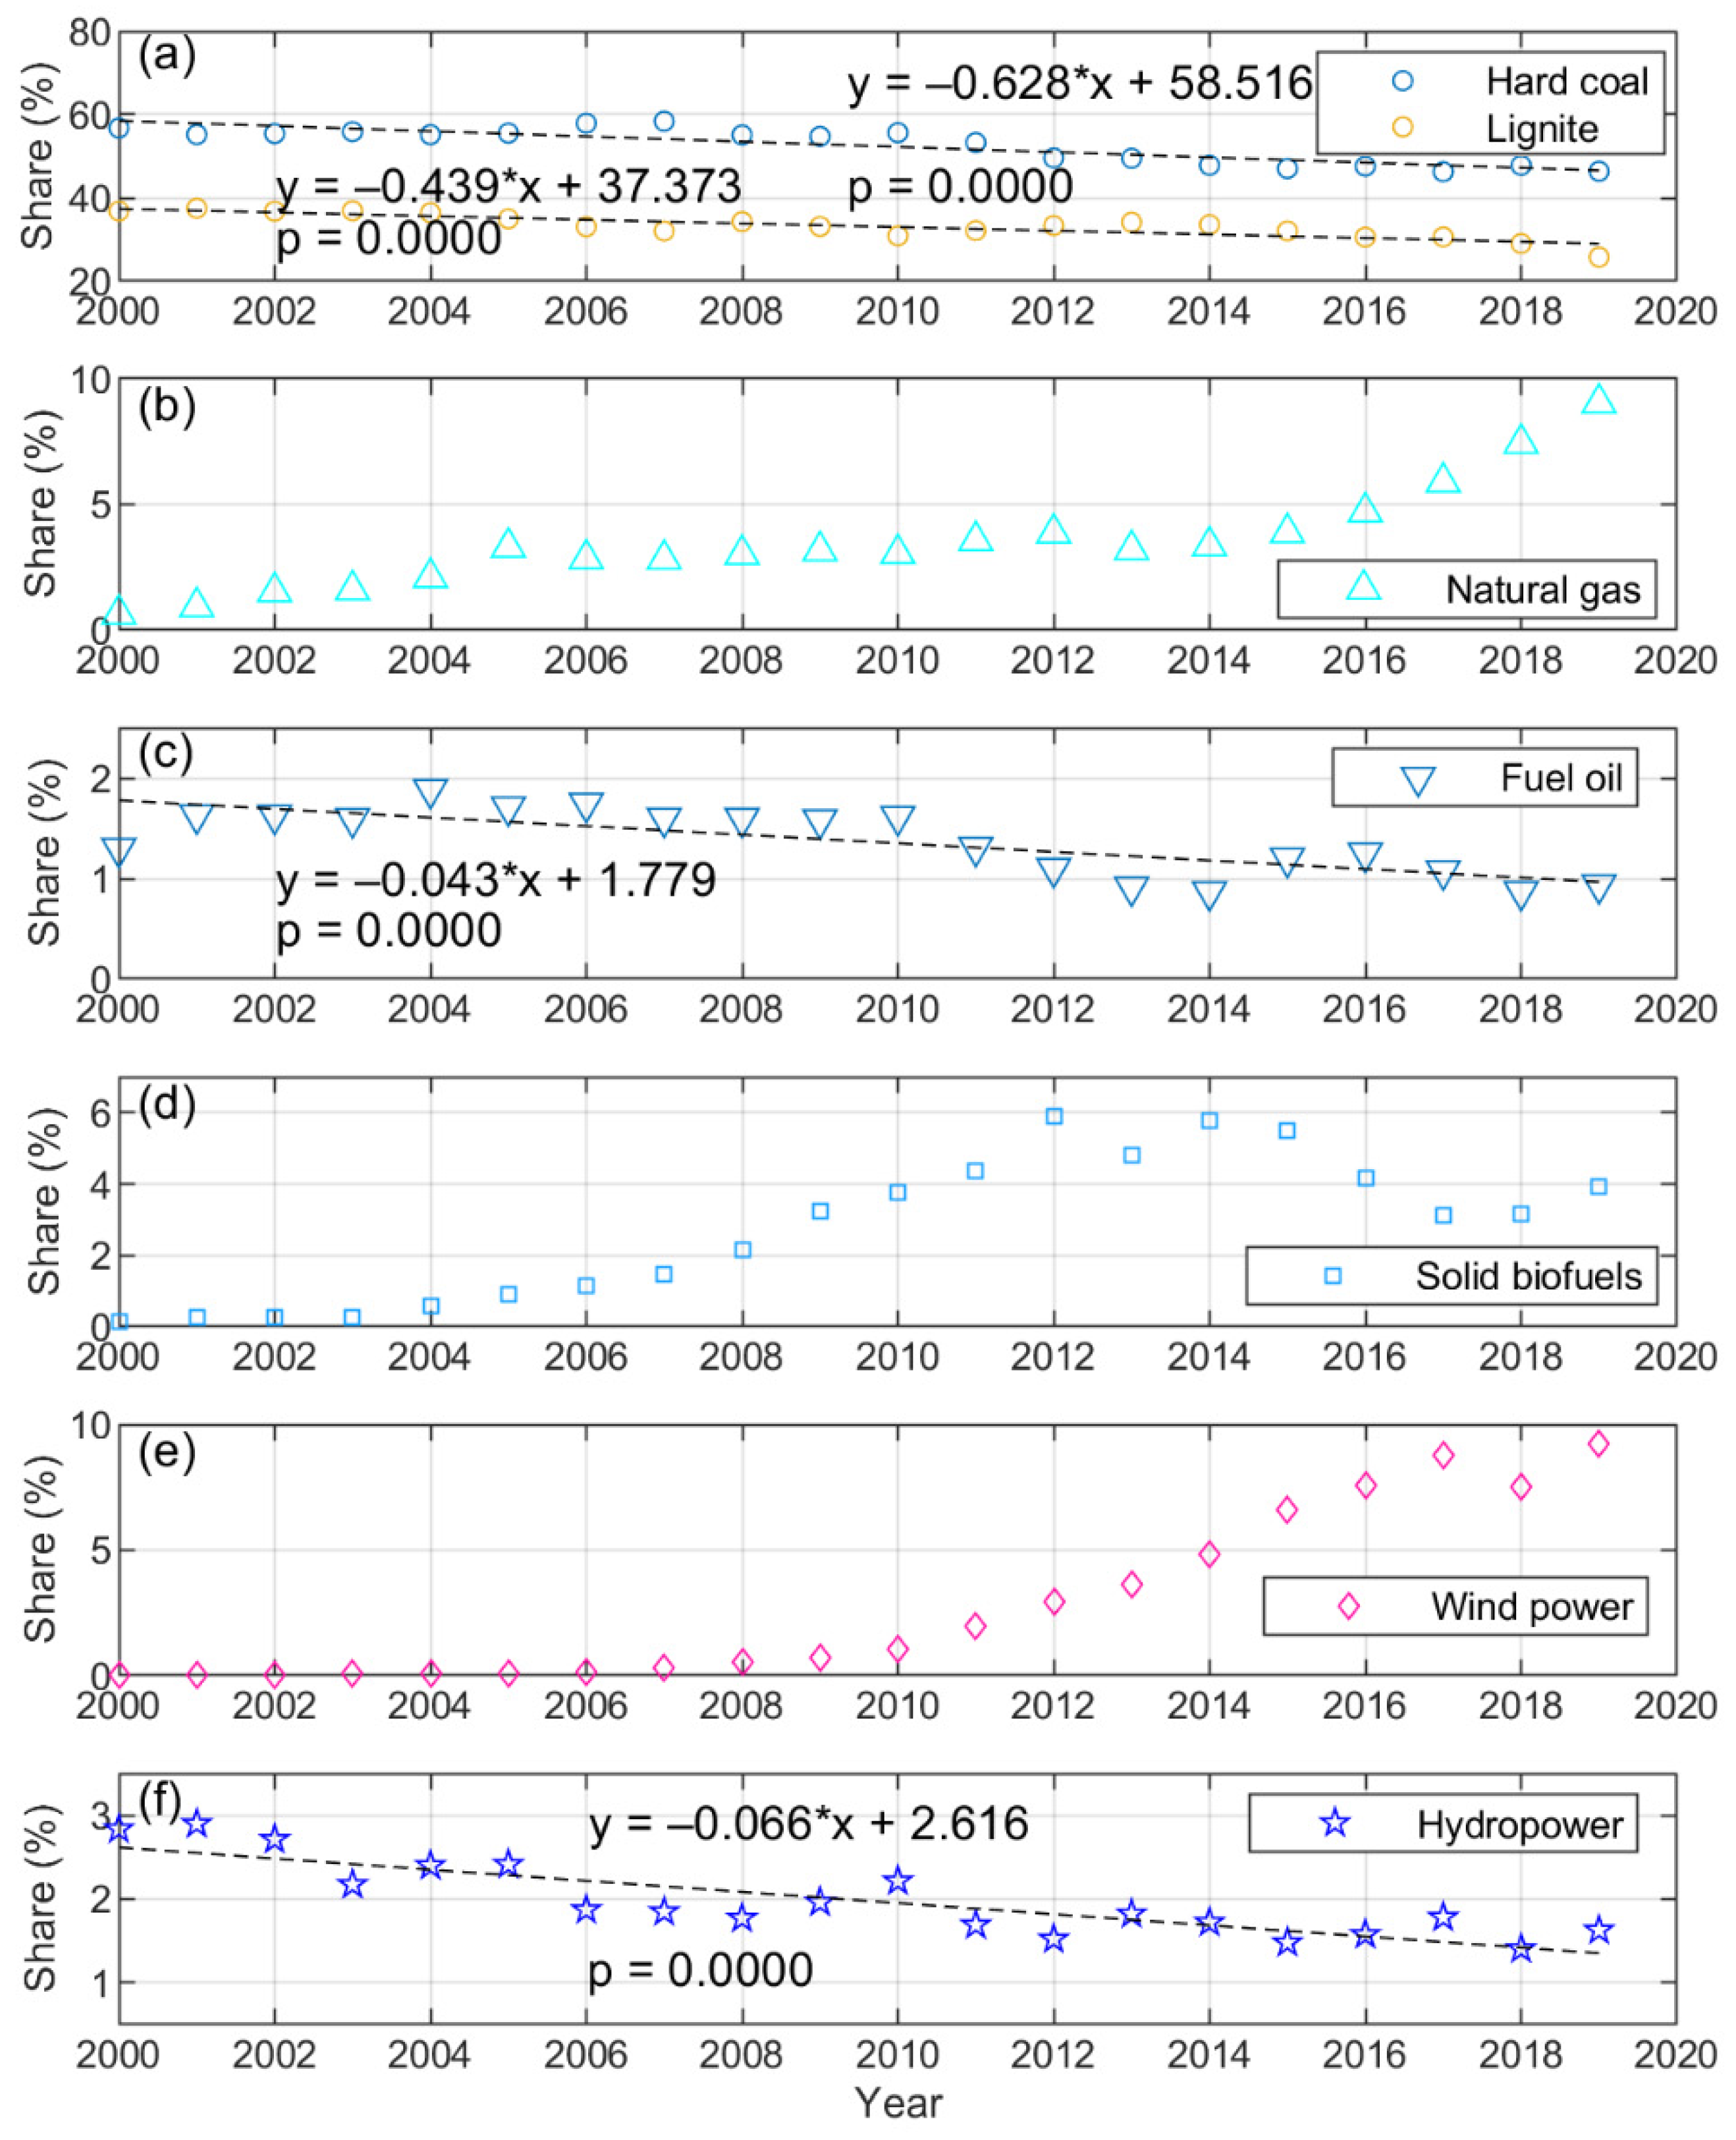
According to Eurostat data, in 2000–2019, in Poland, the largest share in electricity production was held by hard coal and lignite, on average 52.6% and 33.2%, respectively, i.e., 85.8% in total. At the same time, however, there was a significant (p < 0.0001) downward trend in the share of hard coal and lignite in electricity production by 0.63% and 0.44% annually (Figure 8a), and their share in 2019 was 46.4% and 25.8%, respectively; that is, 72.2% in total. In contrast, natural gas had an increasing share of electricity production, from 0.6% in 2000 to 9.0% in 2019 (Figure 8b). Among other fossil fuels, fuel oil had an average share of 1.4% in electricity production in Poland in 2000–2019, with a downward trend of 0.04% per year (Figure 8c). Moreover, other combustible fuels are solid biofuels, whose average share in electricity production in Poland in 2000–2019 was 2.7%, with a maximum of 5.9% in 2012 (Figure 8d). Among the main renewables, the share of (onshore) wind power in electricity production in Poland has been increasing, especially in the last decade, from 1.1% in 2010 to 9.2% in 2019, and an average of 2.8% in 2000–2019 (Figure 8e), while the average share of hydropower in the years 2000–2019 was 2.0%, and a maximum of 2.9%, with a significant downward trend of 0.07% annually (Figure 8f). Moreover, an analysis (not shown) similar to the above but in absolute units (GWh) confirms that the directions of change are analogous to those expressed as percentages (Figure 8). It is worth remembering that the above-described changes in the use of various energy sources for electricity production in Poland in 2000–2019 resulted in, among other effects, a reduction of cooling water abstraction.
3.6. Dynamics of the Predicted Share of the Main Energy Sources in Electricity Production in Poland
In accordance with Appendix 2 [29] to the Energy Policy of Poland until 2040 (EPP2040), the predictive analyses presented by Agencja Rynku Energii S.A. (ARE S.A.) indicate an increase in gross electricity production from 176,700 GWh in 2020 to 201,200 GWh in 2030 to 225,800 GWh in 2040, and gradual changes in the structure of electricity production in Poland from the perspective of 2040, with particularly dynamic changes in the years 2030–2040. Based on the data from Table 22 in Appendix 2 [29] to the EPP2040, the main trends expected in the 2040 perspective are presented in Figure 9.
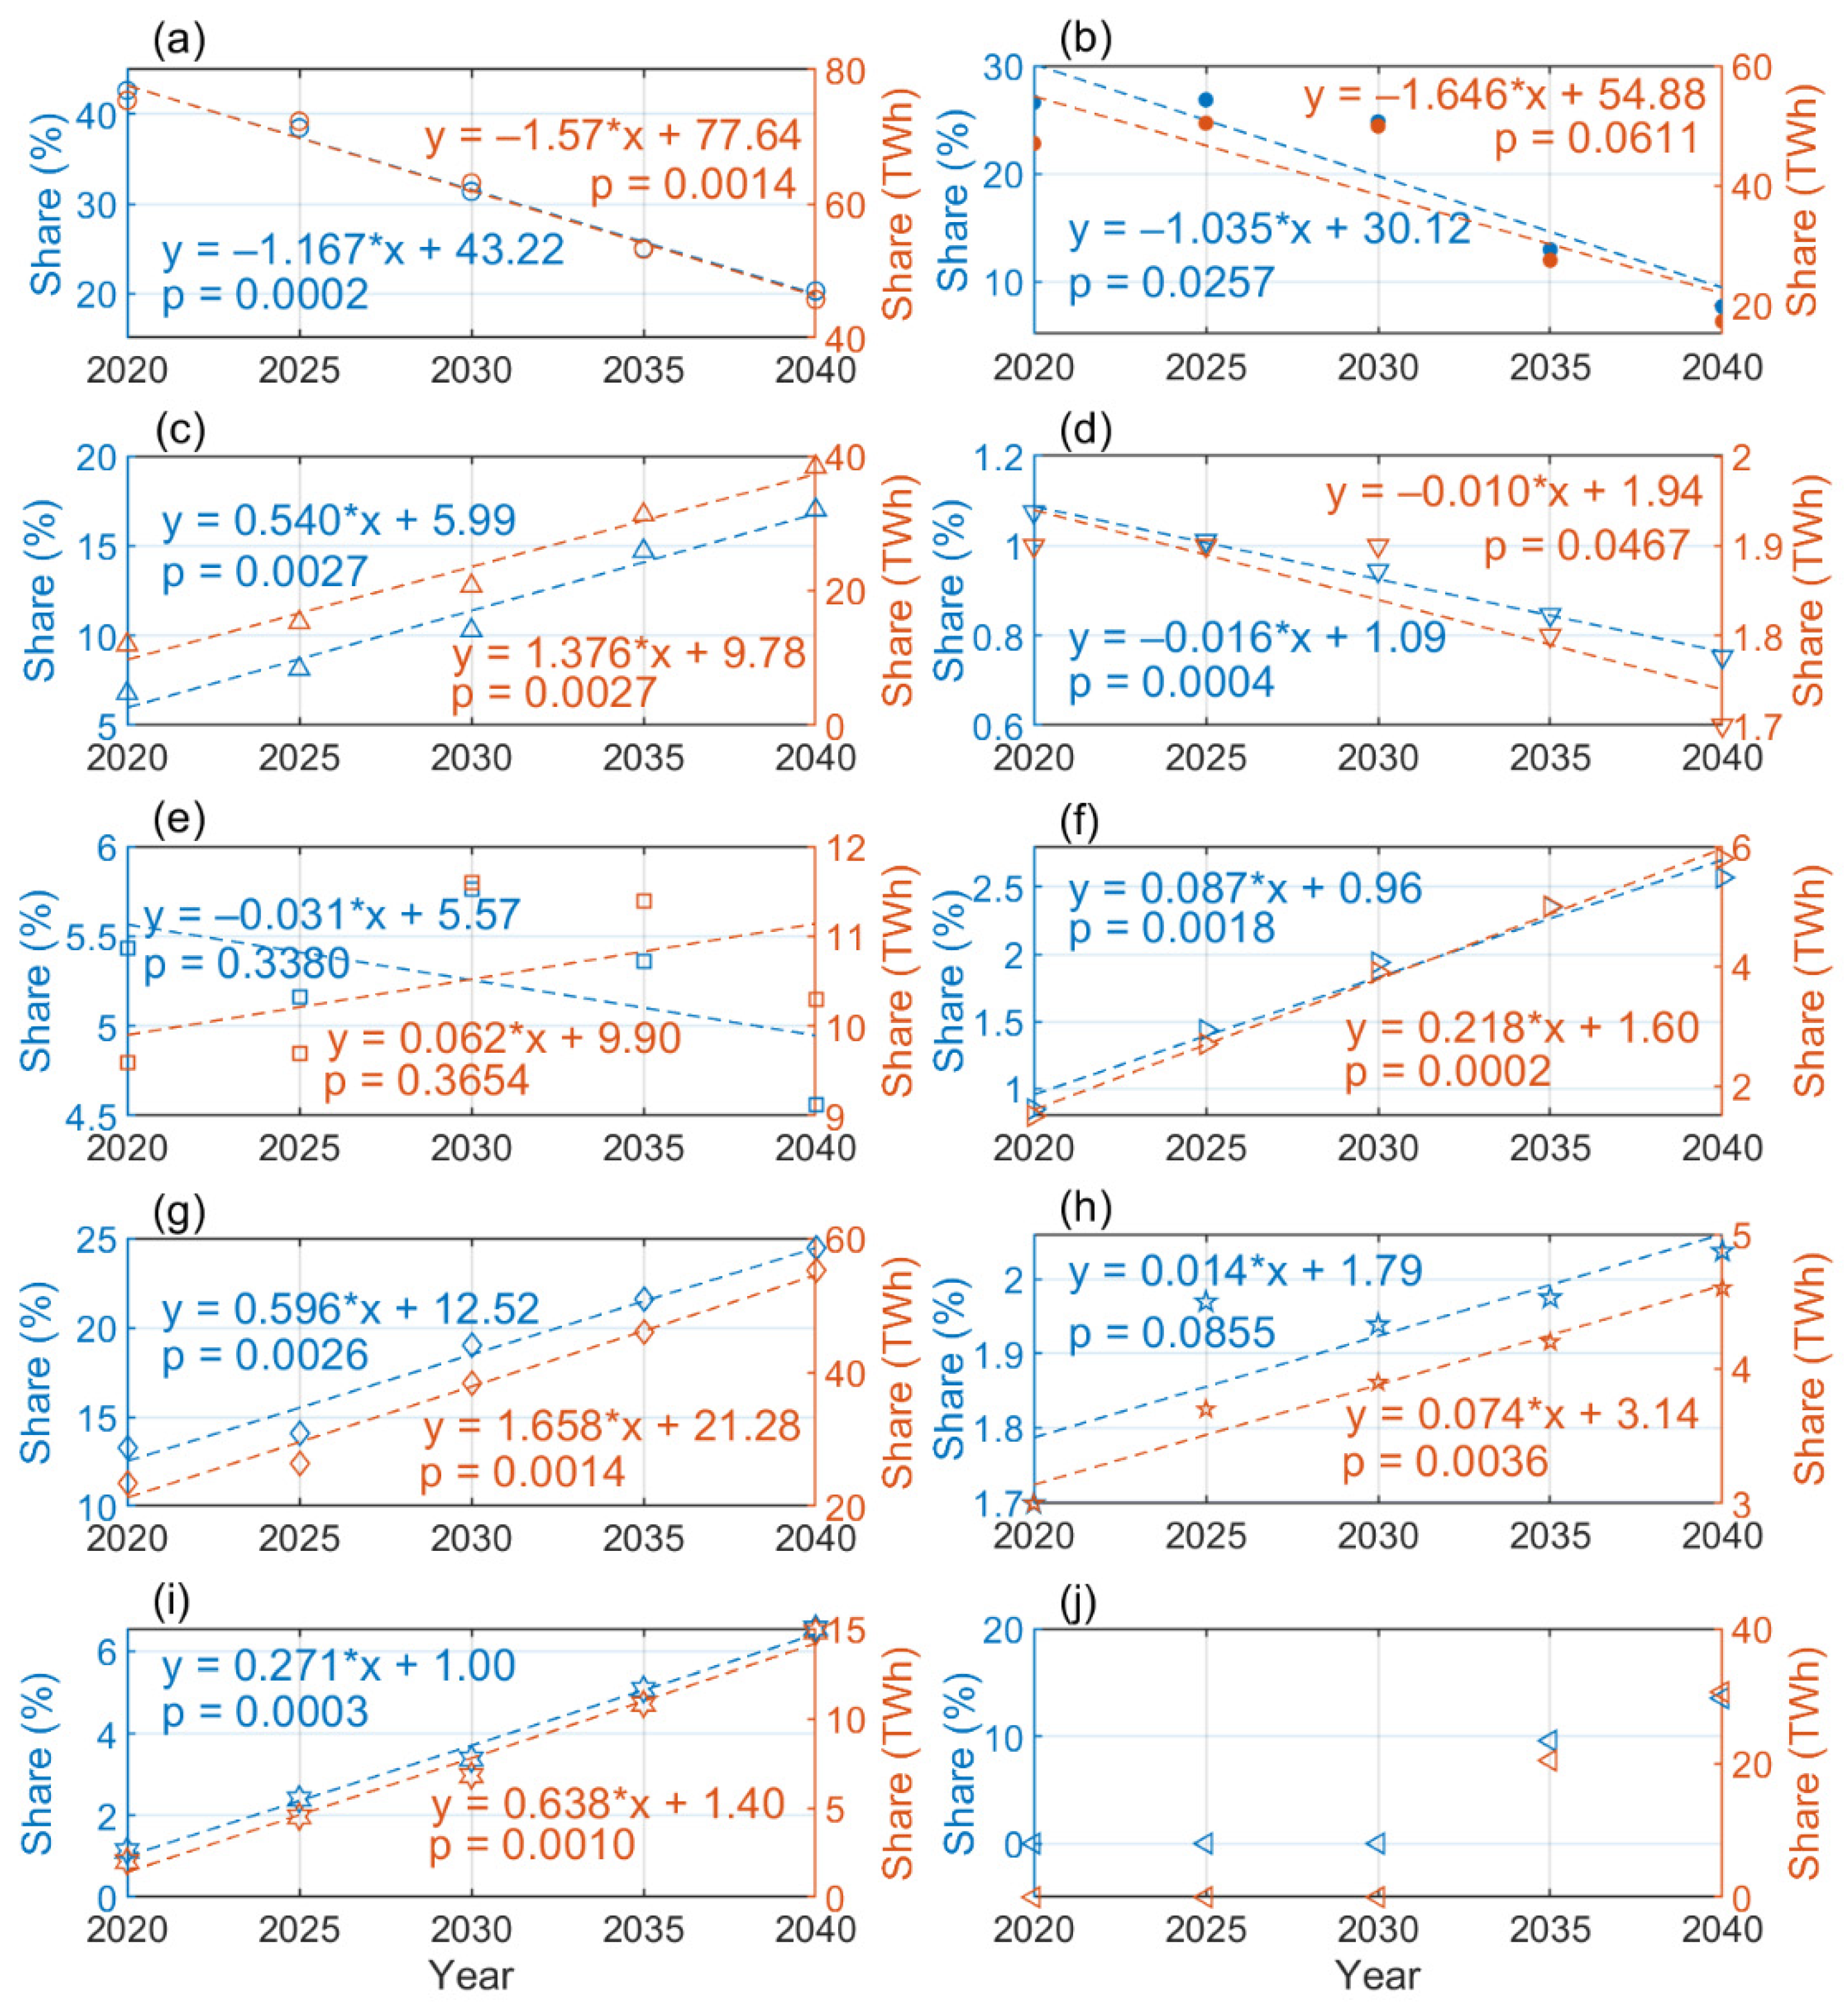
As shown in Figure 9a, the share of hard coal, including coke oven and blast furnace gas, in the total gross electricity production in Poland will gradually decrease from 42.7% (75.4 TWh) in 2020 to 31.4% (63.1 TWh) in 2030, to 20.2% (45.7 TWh) in 2040, with a significant (p < 0.01) downward trend of 1.17% (1.57 TWh) annually. Starting from 26.6% (47.0 TWh) in 2020, a marked decrease in the share of lignite is expected only in 2031–2040, from 24.8% (49.9 TWh) in 2030 to 12.9% (27.5 TWh) in 2035, to 7.7% (17.3 TWh) in 2040, with a significant (p < 0.05) downward trend of 1.04% per year for 2020–2040 (Figure 9b). The share of gaseous fuels, including high-methane and nitrogen-rich natural gas, gas from demethylation of mines, and gas accompanying crude oil, will gradually increase from 6.8% (12.0 TWh) in 2020 to 10.3% (20.7 TWh) in 2030, to 17.0% (38.4 TWh) in 2040, with a significant (p < 0.01) upward trend of 0.54% (1.38 TWh) annually (Figure 9c). The share of fuel oil will gradually decrease from 1.1% (1.9 TWh) in 2020 to 0.9% (1.9 TWh) in 2030, to 0.8% (1.7 TWh) in 2040, with a significant (p < 0.05) downward trend of 0.02% (0.01 TWh) annually (Figure 9d). The share of solid biofuels in electricity production in Poland is expected to be 5.4% (9.6 TWh) in 2020, 5.8% (11.6 TWh) in 2030, and 4.6% (10.3 TWh) in 2040, without a significant trend (Figure 9e), while the share of biogases will gradually increase from 0.9% (1.5 TWh) in 2020 to 1.9% (3.9 TWh) in 2030 to 2.6% (5.8 TWh) in 2040, with a significant (p < 0.01) upward trend of 0.09% (0.22 TWh) annually (Figure 9f). Among the main renewables, the share of wind energy (onshore and offshore) in electricity production in Poland will continue to grow from 13.3% (23.5 TWh) in 2020 to 19.0% (38.3 TWh) in 2030 to 24.5% (55.2 TWh) in 2040, with a significant (p < 0.01) upward trend of 0.60% (1.66 TWh) in 2020–2040 (Figure 9g), while the share of hydropower is to increase from 1.7% (3.0 TWh) in 2020 to 1.9% (3.9 TWh) in 2030 to 2.0% (4.6 TWh) in 2040, with a significant (p < 0.01) upward trend of 0.07 TWh per year (Figure 9h). In addition, the share of solar photovoltaic will gradually increase from 1.1% (2.0 TWh) in 2020 to 3.4% (6.8 TWh) in 2030 to 6.6% (14.8 TWh) in 2040, with a significant (p < 0.01) upward trend of 0.27% (0.64 TWh) annually (Figure 9i). The development of nuclear power in Poland is also expected; its share in the total gross electricity production may amount to 9.6% (20.4 TWh) in 2035 and 13.6% (30.6 TWh) in 2040 (Figure 9j).
4. Discussion
According to Eurostat data, Poland in the European Union (EU-27) has relatively small surface freshwater resources per capita (1583 m3) per year, similarly to Czechia (1575 m3) and Romania (1779 m3). In turn, the top three countries in the ranking, Croatia, Finland, and Sweden, have 12 to 18 times greater freshwater resources per capita than Poland. Apparently, the smaller the water resources, the greater the challenge of proper management of these resources to meet the current and future needs of society and the environment. However, according to the results of the 2019 EU water status assessment [30], nearly 70% of Polish surface water bodies (i.e., 68.4% of rivers and 65.6% of lakes) are below good ecological status; diffuse agricultural pressure affected 62% of lakes and 8% of river water bodies, while the most significant pressure on rivers, affecting 50% of river water bodies, is anthropogenic pressure classified as ‘unknown’. This indicates the need to better identify and minimize existing anthropogenic pressures in order to increase the protection of Polish freshwater resources and achieve their good ecological status, in accordance with the EU Water Framework Directive [24].
Undoubtedly, cooling water—water used for cooling in industrial or manufacturing processes and then returned to the local water body (lake, river) at elevated temperature—is a common cause of thermal pollution, which contributes to the deterioration of the ecological status of water resources and the health of aquatic organisms [21,22,23]. Heated discharges into a stream or lake may drastically change the ecology of the water system; therefore, the ecological effects are generally deleterious [21]. The key problem with cooling water is its elevated temperature; the higher the temperature, the more extensive the impact on the aquatic environment, as every 10 °C increase in water temperature is usually accompanied by a doubling of the rate of chemical reactions [31] and the rate of metabolism of aquatic biota [32]. In Poland, the Regulation of the Minister of the Environment of 4 October 2002 on the requirements to be met by inland waters which are habitats for fish in natural conditions [33] required that the water temperature measured below the point of introduction of thermal pollution (at the edge of the mixing zone) may not differ from the temperature independent of this pollution by more than 1.5 and 3 °C, respectively, and may not exceed 21.5 and 28 °C for waters which are habitats for salmonids and cyprinids, respectively. Unfortunately, this regulation was repealed on 1 January 2018. Instead, the Act of 20 July 2017—Water Law (Dz.U. 2017, poz. 1566 [34]), which entered into force on 1 January 2018, provides for fees for 1000 m3 of water from the cooling circuits of power plants or combined heat and power (CHP) plants, if the cooling water temperature is: above 26 to 32 °C—fee PLN 0.68, above 32 to 35 °C—fee PLN 1.36, and above 35 °C—fee PLN 4.24. However, the fee is not required if the cooling water temperature does not exceed 26 °C or the difference between the temperature of waters abstracted and discharged into surface waters is lower than 11 °C [34]. This means that the current Polish Water Law [34] does not specify the upper limit of the temperature of the cooling water that is returned to the aquatic environment from power plants or CHP plants, and thus does not protect aquatic organisms, including salmonids and cyprinids, from too high cooling water temperatures; this seems to contradict the concept of sustainable development. Moreover, the current Polish Water Law [34] requires the use of measuring devices/systems to measure: (1) the amount of abstracted water, and (2) temperature at the inlet to the water intake and at the outlet to the receiver for water from cooling systems of power plants or CHP plants. However, no other cooling water quality control is required.
The results of this analysis indicate that in the years 2000–2019, the annual total abstraction of surface waters in Poland amounted to 15.8% of surface water resources, of which 74.6% were used for cooling in the production of electricity. This means that nearly 75% of surface waters abstracted in Poland from 2000–2019 were cooling waters for electricity production, while at the same time in Czechia and Romania, with the total abstraction at a comparable level (10.7% and 15.8%), cooling waters accounted for 39.1% and 34.2% of the total abstraction from surface waters, respectively. In other words, in the years 2000–2019, cooling water for electricity production in Poland accounted for an average of 11.8% of surface water resources, while in Czechia and Romania it accounted for 4.2% and 5.4%, respectively, which is more than half as much. In addition, since 2018, there has been no upper limit for the temperature of cooling water from the power plant or CHP plant discharged to rivers, and when the difference between the temperature of the abstracted and returned water is less than 11 °C, there is no fee [34]. Overall, this causes an uncontrolled, negative impact on surface water resources and may constitute the ‘unknown’ anthropogenic pressure indicated in the 2019 EU water status assessment [30]. A more detailed assessment of the impact of cooling water on the state of surface water resources in Poland requires consideration of specific cases and appropriate data (the temperature and volume of cooling water, river water temperature range, and the volume of water flowing at a given moment) and is beyond the scope of this analysis. However, as indicated in the Strategic Environmental Impact Assessment—Appendix 3 to EPP2040 [35], in the case of open-loop systems in Poland, streams of hot and cold water are formed in rivers below the discharge point of heated water, stretching for 30–70 km in summer and 13–30 km in winter, while the impact of the closed-loop systems on the environment, depending on the technology used, may manifest in reducing water resources in the region, affecting the microclimate and noise intensity and discharging wastewater with high salinity [35].
In the analyzed period (2000–2019) in Poland, a desirable, statistically significant trend can be observed, associated with a gradual decrease (by 54.5 million m3 annually) of cooling water abstracted for electricity production, which contributes to a gradual reduction of the total amount of water abstracted from surface resources (by 67.9 million m3 annually), as the dynamics of water used for cooling in electricity production and the total surface water abstraction is strongly linearly correlated (r = 0.9667). In addition, there was also a gradual decrease in the abstraction of surface water for public purposes (by 13.1 million m3 annually), but in 2015–2019 at the expense of increased abstraction of groundwater (not shown). Furthermore, in the dynamics of abstraction of surface water for the needs of agriculture and the manufacturing industry there was a significant downward trend of 6.1 and 6.7 million m3 per year, respectively. This means a smaller depletion of surface water resources from year to year and a smaller load of these resources with cooling waters in the last two decades (2000–2019), despite a significant increase in electricity production. It is worth emphasizing that the observed decrease in the abstraction of cooling water for electricity production in Poland was related to significant changes in the structure of electricity production, as well as to the fact that in newly built power plants and power units closed-loop systems are used instead of open-loop [36].
A largely similar situation is observed in Czechia, where in the years 2000–2019 there was a downward trend in the total water abstraction from surface resources, which can be associated with a downward trend in the abstraction of cooling water for electricity production, as well as water abstracted for the needs of the manufacturing industry and public purposes. In contrast, at the same time in Romania, the total amount of water abstracted from surface resources remained at the same level, with the opposite direction of changes in the dynamics of water abstraction for agriculture (increasing trend) and for public purposes (declining trend), and since 2010, the reduction in the amount of water abstracted for cooling in electricity production was accompanied by an increase in the amount of water abstracted for the manufacturing industry.
In Poland, in the 2010–2019 decade, an average of 5273.1 and 3159.4 million m3 of water was abstracted from the Vistula and Oder River Basins, respectively, which corresponds to 62.6% and 37.3% of the total gross abstraction from surface fresh waters. Moreover, in 2010–2019, a statistically significant increase in water abstraction from the Vistula Basin (by 0.95% annually) was accompanied by a similar decrease in water abstraction from the Oder Basin. Such trends seem justified when we compare the surface water resources in these two river basins (on average 65.24% and 34.76% of water in the Vistula and Oder Basins, respectively) in relation to the volume of water abstraction (62.6% and 37.3%, respectively).
With regard to Poland’s future policy in the electricity sector until 2040 as set out in EPP2040, the results of this analysis indicate that the important trends in the share of the main energy sources in total gross electricity production are largely in line with the trends observed over the last two decades (2000–2019). According to forecasts, from 2020–2040 a further decrease in the share of hard coal (to 20.2% in 2040) and fuel oil will be accompanied by a decrease in the share of lignite (to 7.7% in 2040), while a further increase in the share of gaseous fuels (to 17.0% in 2040) will be accompanied by a further increase in the share of renewables (to 33.0% in 2040), mainly wind power (to 24.5% in 2040) and solar photovoltaic (from 1.1% in 2020 to 6.6% in 2040). If the forecasts [29] turn out to be true and the trends observed in 2000–2019 continue, this should result in a further decrease in cooling water abstraction for electricity production, as PV and wind power systems do not need cooling water [16]. An increase in wind power includes offshore wind farms (with the predicted share of 13.6% in 2040); their construction is a strategic decision, allowing for economic growth [37]. The ranking of prospective RES technologies shows that offshore wind farms are the preferred technology, with the greatest development opportunities in Poland [37]. In addition, 2020 was the best year in the history of photovoltaic development in Poland [38], and Poland is at the forefront in the EU in terms of increasing installed PV capacity [39]. It is also clear that renewable energy sources make an important contribution to improving energy efficiency [5].
Additionally, the results of the modeling study [11] show that in the United States (US), by 2050, water abstraction at the national level will be likely to decrease steadily. The reduction in water abstraction will be largely due to the retirement of once-through cooled thermal generation and the construction of new facilities using recirculating cooling technologies, in addition to the high penetration of renewable technologies with minimal water requirements and improved energy efficiency [11]. A similar situation can be expected in Poland [29].
The major unknown in EPP2040 is the planned introduction of nuclear power as an energy source. Although the decrease in water abstraction from surface waters and the decrease in the amount of cooling water used in the production of electricity, observed in the last 20 years, is an important sign of positive changes, it should be remembered that the introduction of nuclear fuel as an energy source [25,40] may significantly change the situation. A nuclear power plant with an electrical capacity of up to 3750 MW will be built in Poland, based on the proven American AP1000 reactor technology [40]. The first unit of the power plant will be built by 2033 [40]. The power plant will be located in northern Poland [40]. Initial decisions regarding the construction of the first nuclear power plant indicate a seaside location (Lubiatowo-Kopalino) [41], which means the use of mainly sea water (from the Baltic Sea) for cooling systems [42]; it would therefore not place an additional burden on surface water resources. On the other hand, preliminary proposals for the location of further nuclear power plants point to places located in the interior of the country, in the central part of Poland (near Bełchatów or Pątnów) [25]. Moreover, the technology used in nuclear plants has a decisive influence on the amount of cooling water abstracted. For example, nuclear plants in the UK use open loop cooling with abstraction in the order of 65 m3·s−1 per reactor [15] and 72 m3·s−1 and 57 m3·s−1 for EPR and AP1000 reactors, respectively [43], while smaller microreactors, Advanced Small Modular Reactors (SMRs), are currently being developed in the US; SMR designs can use light water, gas, liquid metal, or molten salt as coolant [44]. The implementation of SMRs is considered as a likely solution for future nuclear energy in Poland [45].
In its December 2021 report [46], the European Environmental Agency (EEA) indicated that many parts of Europe are already experiencing water stress, understood as a situation where there is not enough water of sufficient quality to meet the demands of people and the environment. The current assessment describes water stress in Europe as significant; it affects 20% of the European territory and 30% of Europeans on average every year [46]. In addition, water stress in Europe is expected to increase in the future as a result of climate change (projected increase in frequency and magnitude of droughts) and socio-economic development, despite the fact that water use efficiency has increased in agriculture, electricity production, industry, mining, public water supply, and tourism [46].
Undoubtedly, the projected increase in the frequency and magnitude of droughts [46] will mean less water in streams and rivers, at least temporarily. In Poland, the most important region in terms of surface water abundance is the Carpathian region. It is in this region that the Vistula originates, the basin of which covers more than half of Poland’s territory. While the Carpathian part of the Vistula Basin constitutes only 11% of the entire basin, its share in the annual runoff volume is 40% [47], which significantly affects the amount of river flow across Poland. In terms of observed changes in hydroclimatic conditions in the Carpathian catchments, the study [48] showed that, over the last 30 years (1986–2015), compared to the previous 30-year period (1956–1985), there were changes in the annual precipitation profile, while the mean annual precipitation did not change significantly. Largely similar results were obtained in [49], indicating a significant decrease in precipitation (and river flow) in the summer, offset by significant increases in precipitation in the spring and autumn over the last 30 years (1985–2014) compared to the previous 30 years. However, trends in the flow of Polish Carpathian rivers are often statistically insignificant, especially on an annual basis [50,51,52,53], while differences in the magnitude and/or direction of trends depend on the interaction of large number of factors affecting mountain river catchments [54], including human activity (e.g., land cover transition [55,56,57], dam reservoir construction [58], urbanization, road construction). The study [59] of baseflow trends for midsize Carpathian catchments in Poland and Slovakia showed that the most evident changes (decreases) were identified in the summer and autumn, especially in foothill catchments; these results indicate the increasing problem of groundwater depletion in the summer and autumn, mainly in foothill catchments.
In a changing climate with a warming trend in air temperature, river water temperature increases [60,61,62,63,64] as a result of heat exchange with the atmosphere. Obviously, river water temperatures are higher during lower flows [65]. Regional climate warming [66], with the strongest increases in river water temperature in summer and autumn (0.75–1.17 and 0.51–1.08 °C per decade, respectively) in the Carpathians catchments [67], may intensify the adverse effects of thermal pollution on the aquatic environment. In the climate change context, the required solution is to prevent thermal pollution of surface water resources by limiting the release of cooling water to the aquatic environment.
5. Conclusions and Future Directions
The results of this analysis support the following conclusions:
- Poland in the EU-27 has relatively small surface freshwater resources per capita (1583 m3) per year, similarly to Czechia (1575 m3) and Romania (1779 m3);
- In 2000–2019, the annual abstraction of surface water in Poland amounted to 16% of surface water resources, of which nearly 75% was used for cooling in the production of electricity;
- In 2000–2019, the dynamics of the total water abstraction and cooling water in electricity production in Poland showed a clear downward trend (of 67.9 and 54.5 million m3 annually), which is an important signal of positive changes;
- In 2010–2019, an average of 5273.1 and 3159.4 million m3 of water was abstracted from the Vistula and Oder River Basins, respectively, which corresponds to 62.6% and 37.3% of the total gross abstraction from surface fresh waters, respectively;
- In 2010–2019, an increase in water abstraction from the Vistula Basin (by 0.95% annually) was accompanied by a similar decrease in water abstraction from the Oder Basin;
- In 2000–2019, the population in Poland decreased significantly (by an average of 16.7 thousand people per year), while total gross electricity production increased significantly (by an average of 1174.3 GWh per year);
- The increase in electricity production was accompanied by a decrease in cooling water abstraction for electricity production due to significant changes in the structure of electricity production, as well as to the fact that in newly built power plants closed-loop systems are used instead of open-loop [36];
- In the future electricity policy of Poland until 2040 [25], the significant trends in the share of the main energy sources in total gross electricity production largely coincide with the trends observed over the last two decades (2000–2019);
- If the forecasts turn out to be true and the trends observed in 2000–2019 continue, this should result in a further decrease in cooling water abstraction for electricity production;
In the climate change context (projected increase in the frequency and magnitude of droughts [46]; higher river water temperature during lower flows [65]), the required solution is to prevent thermal pollution of surface water resources by limiting the release of cooling water to the aquatic environment. A promising direction in this respect is the further increase in the share of renewables, mainly offshore wind energy, in the electricity sector.
Funding
This work was financed under R&D funds of Department of Geoengineering and Water Management, Cracow University of Technology.
Data Availability Statement
The analysis is based on publicly available data from the Eurostat database (https://ec.europa.eu/eurostat/data/database (accessed on 27 January 2022)), as well as the data from Table 22 in the Appendix 2 [29] to the EPP2040 (https://www.gov.pl/web/climate/energy-policy-of-poland-until-2040-epp2040 (accessed on 14 January 2023)).
Acknowledgments
This paper is the result of research carried out within statutory research in the Department of Geoengineering and Water Management, Faculty of Environmental Engineering and Energy, Cracow University of Technology, Poland.
Conflicts of Interest
The author declares no conflict of interest.
References
- UNCCD (United Nations Convention to Combat Desertification). Land Degradation Neutrality. Resilience at Local, National and Regional Levels. 2015. Available online: http://catalogue.unccd.int/858_V2_UNCCD_BRO_.pdf (accessed on 14 January 2023).
- Pakulska, T. Green energy in Central and Eastern European countries: New challenges on the path to sustainable development. Energies 2021, 14, 884. [Google Scholar] [CrossRef]
- Impacts of Renewable Energy Facilities. Available online: https://climate.law.columbia.edu/content/impacts-renewable-energy-facilities (accessed on 14 January 2023).
- Renewable Energy Poses Challenge For Wildlife Conservation. Available online: https://cnr.ncsu.edu/news/2019/11/renewable-energy-poses-challenge-for-wildlife-conservation/ (accessed on 14 January 2023).
- Stec, M.; Grzebyk, M. Statistical analysis of the level of development of renewable energy sources in the countries of the European Union. Energies 2022, 15, 8278. [Google Scholar] [CrossRef]
- Bennun, L.; van Bochove, J.; Ng, C.; Fletcher, C.; Wilson, D.; Phair, N.; Carbone, G. Mitigating Biodiversity Impacts Associated with Solar and Wind Energy Development; IUNC: Cambridge, UK; The Biodiversity Consultancy: Cambridge, UK, 2021; Available online: https://portals.iucn.org/library/node/49283 (accessed on 14 January 2023).
- World Energy Outlook 2019. Available online: https://www.iea.org/reports/world-energy-outlook-2019/electricity (accessed on 14 January 2023).
- Enerdata. Available online: https://eneroutlook.enerdata.net/forecast-world-electricity-consumption.html (accessed on 14 January 2023).
- Global Electricity Review 2022. Available online: https://ember-climate.org/insights/research/global-electricity-review-2022/ (accessed on 30 January 2023).
- Gleick, P.H. Water and energy. Annu. Rev. Energy Environ. 1994, 19, 267–299. [Google Scholar] [CrossRef]
- Macknick, J.; Sattler, S.; Averyt, K.; Clemmer, S.; Rogers, J. The water implications of generating electricity: Water use across the Unites States based on different electricity pathways through 2050. Environ. Res. Lett. 2012, 7, 045803. [Google Scholar] [CrossRef]
- Van Vliet, M.T.H.; Wiberg, D.; LeDuc, S.; Riahi, K. Power-generation system vulnerability and adaptation to changes in climate and water resources. Nat. Clim. Chang. 2016, 6, 375–380. [Google Scholar] [CrossRef]
- DOE/NETL-2011/1523. Estimating Freshwater Needs to Meet Future Thermoelectric Generation Requirements. 2011. Available online: https://www.netl.doe.gov/projects/files/FY12_EstimatingFreshwaterNeedstoMeetFutureThermoelectricGenReqs2011Update_100111.pdf (accessed on 31 January 2023).
- Fricko, O.; Parkinson, S.C.; Johnson, N.; Strubegger, M.; van Vliet, M.T.H.; Riahi, K. Energy sector water use implications of a 2 °C climate policy. Environ. Res. Lett. 2016, 11, 034011. [Google Scholar] [CrossRef]
- Byers, E.A.; Hall, J.W.; Amezaga, J.M. Electricity generation and cooling water use: UK pathways to 2050. Glob. Environ. Change 2014, 25, 16–30. [Google Scholar] [CrossRef] [Green Version]
- Macknick, J.; Newmark, R.; Heath, G.; Hallett, K.C. Operational water consumption and withdrawal factors for electricity generating technologies: A review of existing literature. Environ. Res. Lett. 2012, 7, 045802. [Google Scholar] [CrossRef]
- Bunn, S.E.; Arthington, A.H. Basic principles and ecological consequences of altered flow regimes for aquatic biodiversity. Environ. Manage. 2002, 30, 492–507. [Google Scholar] [CrossRef] [Green Version]
- Caissie, D. The thermal regime of rivers: A review. Freshw. Biol. 2006, 51, 1389–1406. [Google Scholar] [CrossRef]
- Hawkins, C.P.; Hogue, J.N.; Decker, L.M.; Feminella, J.W. Channel morphology, water temperature, and assemblage structure of stream insects. J. N. Am. Benthol. Soc. 1997, 16, 728–749. [Google Scholar] [CrossRef]
- Coutant, C.C. Thermal preference: When does an asset become a liability? Environ. Biol. Fishes 1987, 18, 161–172. [Google Scholar] [CrossRef]
- Speight, J.G. Natural Water Remediation: Chemistry and Technology, 1st ed.; Butterworth-Heinemann: Burlington, MA, USA, 2019; pp. 165–198. [Google Scholar]
- Vallero, D.A. Thermal pollution. In Waste, 2nd ed.; Letcher, T.M., Vallero, D.A., Eds.; Academic Press: Cambridge, MA, USA, 2019; Chapter 20; pp. 381–404. [Google Scholar] [CrossRef]
- Logan, L.H.; Stillwell, A.S. Probabilistic assessment of aquatic species risk from thermoelectric power plant effluent: Incorporating biology into the energy-water nexus. Appl. Energy 2018, 210, 434–450. [Google Scholar] [CrossRef]
- Directive 2000/60/EC of the European Parliament and of the Council Establishing a Framework for Community Action in the Field of Water Policy. 2000. Available online: https://eur-lex.europa.eu/legal-content/en/ALL/?uri=CELEX%3A32000L0060 (accessed on 14 January 2023).
- Ministry of Climate and Environment. Energy Policy of Poland until 2040 (EPP2040). 2021; pp. 1–102. Available online: https://www.gov.pl/web/climate/energy-policy-of-poland-until-2040-epp2040 (accessed on 14 January 2023).
- Regulation No 223/2009 of the European Parliament on European statistics. Available online: https://eur-lex.europa.eu/legal-content/EN/TXT/?qid=1435820363605&uri=CELEX:02009R0223-20150608 (accessed on 17 February 2023).
- Eurostat Co-Ordination Role of Statistical Activities. Available online: https://ec.europa.eu/eurostat/web/main/about-us/policies/co-ordination-role (accessed on 17 February 2023).
- Helsel, D.R.; Hirsch, R.M. Statistical Methods in Water Resources; United States Geological Survey: Reston, VA, USA, 2002; Book 4, Chapter A3. Available online: https://pubs.usgs.gov/twri/twri4a3/twri4a3.pdf (accessed on 18 February 2023).
- Appendix_2 Conclusions from Forecast Analyses for the Energy Sector. Available online: https://www.gov.pl/web/climate/energy-policy-of-poland-until-2040-epp2040 (accessed on 14 January 2023).
- European Commission, The EU Environmental Implementation Review 2019, Country Report—Poland, Brussels. 2019. Available online: https://ec.europa.eu/environment/eir/pdf/report_pl_en.pdf (accessed on 14 January 2023).
- Delpla, I.; Jung, A.V.; Baures, E.; Clement, M.; Thomas, O. Impacts of climate change on surface water quality in relation to drinking water production. Environ. Int. 2009, 35, 1225–1233. [Google Scholar] [CrossRef] [PubMed]
- Regier, H.A.; Holmes, J.A.; Pauly, D. Influence of temperature change on aquatic ecosystems: An interpretation of empirical data. Trans. Am. Fish. Soc. 1990, 119, 374–389. [Google Scholar] [CrossRef]
- ISAP. Dz.U. 2002 nr 176 poz. 1455. Available online: https://isap.sejm.gov.pl/isap.nsf/DocDetails.xsp?id=wdu20021761455 (accessed on 18 January 2023).
- ISAP. Dz.U. 2017 poz. 1566. Available online: https://isap.sejm.gov.pl/isap.nsf/DocDetails.xsp?id=WDU20170001566 (accessed on 18 January 2023).
- Appendix 3 to EPP2040. Available online: https://www.gov.pl/web/klimat/polityka-energetyczna-polski (accessed on 20 February 2023). (In Polish)
- Appendix 1 to EPP2040. Available online: https://www.gov.pl/web/klimat/polityka-energetyczna-polski (accessed on 20 February 2023). (In Polish)
- Lenarczyk, A.; Jaskólski, M.; Bućko, P. The application of a multi-criteria decision-making for indication of directions of the development of renewable energy sources in the context of energy policy. Energies 2022, 15, 9629. [Google Scholar] [CrossRef]
- Rataj, M.; Berniak-Woźny, J.; Plebańska, M. Poland as the EU leader in terms of photovoltaic market growth dynamics-behind the scenes. Energies 2021, 14, 6987. [Google Scholar] [CrossRef]
- Piwowar, A.; Dzikuć, M. Water energy in Poland in the context of sustainable development. Energies 2022, 15, 7840. [Google Scholar] [CrossRef]
- Resolution on the Construction of Large-Scale Nuclear Power plants in the Republic of Poland of November 2. 2022. Available online: https://www.gov.pl/web/premier/uchwala-w-sprawie-budowy-wielkoskalowych-elektrowni-jadrowych-w-rzeczypospolitej-polskiej (accessed on 17 February 2023). (In Polish)
- Polish Nuclear Power Plants. A Large Increase in Support for the Construction of a Nuclear Power Plant in the Place of the Planned Investment in Pomerania. Available online: https://ppej.pl/aktualnosci/duzy-wzrost-poparcia-dla-budowy-elektrowni-jadrowej-w-miejscu-planowanej-inwestycji-na-pomorzu (accessed on 17 February 2023). (In Polish).
- Polish Nuclear Power Plants. Environmental Impact Assessment (EIA) Report for Poland’s First Nuclear Power Plant. Available online: https://ppej.pl/en/environment-and-consultations/environmental-impact-assessment-report (accessed on 17 February 2023).
- EA. Cooling Water Options for the New Generation of Nuclear Power Stations in the UK. Environment Agency, Department for Environment, Food & Rural Affairs, UK. 2010. Available online: https://assets.publishing.service.gov.uk/government/uploads/system/uploads/attachment_data/file/291077/scho0610bsot-e-e.pdf (accessed on 18 January 2023).
- Office of Nuclear Energy. Advanced Small Modular Reactors (SMRs). Available online: https://www.energy.gov/ne/advanced-small-modular-reactors-smrs (accessed on 28 January 2023).
- KGHM has Signed a Contract with NuScale. Available online: https://media.kghm.com/en/news-and-press-releases/the-first-small-nuclear-reactors-in-poland-as-early-as-2029-kghm-has-signed-a-contract-with-nuscale (accessed on 17 February 2023).
- EEA Report. Water Resources Across Europe—Confronting Water Stress: An Updated Assessment. No 12/2021. Available online: https://www.eea.europa.eu/publications/water-resources-across-europe-confronting (accessed on 18 January 2023).
- Chełmicki, W.; Skąpski, R.; Soja, R. The flow regime of Poland‘s Carpathian rivers. In Hydrologia Karpacka z Perspektywy Końca XX Wieku; Chełmicki, W., Soja, R., Eds.; PAN: Cracow, Poland, 1999; pp. 67–80, (In Polish with English Summary). [Google Scholar]
- Kędra, M. Altered precipitation and flow patterns in the Dunajec River Basin. Water 2017, 9, 22. [Google Scholar] [CrossRef] [Green Version]
- Kędra, M. Altered precipitation characteristics in the Polish Carpathian basins with implications for water resources. Clim. Res. 2017, 72, 1474–1483. [Google Scholar] [CrossRef]
- Mostowik, K.; Siwek, J.; Kisiel, M.; Kowalik, K.; Krzysik, M.; Plenzler, J.; Rzonca, B. Runoff trends in a changing climate in the Eastern Carpathians (Bieszczady Mountains, Poland). CATENA 2019, 182, 104174. [Google Scholar] [CrossRef]
- Kędra, M. Sensitivity of mountain catchments to global warming: A case study of the San Basin, Poland. Water Environ. J. 2020, 34, 648–660. [Google Scholar] [CrossRef]
- Kubiak-Wójcicka, K. Variability of air temperature, precipitation and outflows in the Vistula Basin (Poland). Resources 2020, 9, 103. [Google Scholar] [CrossRef]
- Piniewski, M.; Marcinkowski, P.; Kundzewicz, Z.W. Trend detection in river flow indices in Poland. Acta Geophys. 2018, 66, 347–360. [Google Scholar] [CrossRef] [Green Version]
- Kubiak-Wójcicka, K.; Nagy, P.; Pilarska, A.; Zeleňáková, M. Trend analysis of selected hydroclimatic variables for the Hornad catchment (Slovakia). Water 2023, 15, 471. [Google Scholar] [CrossRef]
- Kędra, M.; Szczepanek, R. Land cover transitions and changing climate conditions in the Polish Carpathians: Assessment and management implications. Land Degrad. Dev. 2019, 30, 1040–1051. [Google Scholar] [CrossRef]
- Pokhrel, B.K. Impact of land use change on flow and sediment yields in the Khokana outlet of the Bagmati River, Kathmandu, Nepal. Hydrology 2018, 5, 22. [Google Scholar] [CrossRef] [Green Version]
- Yang, L.; Feng, Q.; Yin, Z.; Wen, X.; Si, J.; Li, C.; Deo, R.C. Identifying separate impacts of climate and land use/cover change on hydrological processes in upper stream of Heihe River, Northwest China. Hydrol. Process. 2017, 31, 1100–1112. [Google Scholar] [CrossRef]
- Kędra, M. Dam-induced changes in river flow dynamics revealed by RQA. Eur. Phys. J. Spec. Top. 2023, 232, 209–215. [Google Scholar] [CrossRef]
- Siwek, J.; Mostowik, K.; Liova, S.; Rzonca, B.; Wacławczyk, P. Baseflow trends for midsize Carpathian catchments in Poland and Slovakia in 1970–2019. Water 2023, 15, 109. [Google Scholar] [CrossRef]
- Kelleher, C.A.; Golden, H.E.; Archfield, S. Monthly river temperature trends across the US confound annual changes. Environ. Res. Lett. 2021, 16, 104006. [Google Scholar] [CrossRef] [PubMed]
- Fuso, F.; Stucchi, L.; Bonacina, L.; Fornaroli, R.; Bocchiola, D. Evaluation of water temperature under changing climate and its effect on river habitat in a regulated Alpine catchment. J. Hydrol. 2023, 616, 128816. [Google Scholar] [CrossRef]
- Shrestha, R.R.; Pesklevits, J.C. Modelling spatial and temporal variability of water temperature across six rivers in Western Canada. River Res. Appl. 2023, 39, 200–213. [Google Scholar] [CrossRef]
- Graf, R.; Wrzesiński, D. Detecting patterns of changes in river water temperature in Poland. Water 2020, 12, 1327. [Google Scholar] [CrossRef]
- Gizińska, J.; Sojka, M. How climate change affects river and lake water temperature in central-west Poland—A case study of the Warta River catchment. Atmosphere 2023, 14, 330. [Google Scholar] [CrossRef]
- Booker, D.J.; Whitehead, A.L. River water temperatures are higher during lower flows after accounting for meteorological variability. River Res. Appl. 2022, 38, 3–22. [Google Scholar] [CrossRef]
- Spinoni, J.; Szalai, S.; Szentimrey, T.; Lakatos, M.; Bihari, Z.; Nagy, A.; Nemeth, A.; Kovacs, T.; Mihic, D.; Dacic, M.; et al. Climate of the Carpathian Region in the period 1961–2010: Climatologies and trends of 10 variables. Int. J. Climatol. 2015, 35, 1322–1341. [Google Scholar] [CrossRef] [Green Version]
- Kędra, M. Regional response to global warming: Water temperature trends in semi-natural mountain river systems. Water 2020, 12, 283. [Google Scholar] [CrossRef] [Green Version]
Figure 1.
Renewable surface freshwater resources in Poland, as well as in Romania and Czechia, in the last two decades (2000–2019). Linear trends shown as dashed black lines are not significant at α = 0.05.
Figure 1.
Renewable surface freshwater resources in Poland, as well as in Romania and Czechia, in the last two decades (2000–2019). Linear trends shown as dashed black lines are not significant at α = 0.05.

Figure 2.
The mean annual total gross abstraction from surface fresh waters in Poland in 2000–2019 for different purposes.
Figure 2.
The mean annual total gross abstraction from surface fresh waters in Poland in 2000–2019 for different purposes.

Figure 3.
The dynamics of surface freshwater abstraction in Poland in the years 2000–2019: (a) total gross abstraction and water used for cooling in electricity production; (b) water used for agriculture, public supply, and for manufacturing industry. Linear trends shown as dashed black lines are all significant at p < 0.05.

Figure 4.
Surface freshwater abstraction (%) in Poland in the years 2010–2019 at the river basin scale. Linear trends shown as dashed black lines are significant at p < 0.001.
Figure 4.
Surface freshwater abstraction (%) in Poland in the years 2010–2019 at the river basin scale. Linear trends shown as dashed black lines are significant at p < 0.001.

Figure 5.
The dynamics of surface freshwater abstraction in Czechia in the years 2000–2019: (a) total gross abstraction and water used for cooling in electricity production; (b) water used for agriculture, public supply, and for manufacturing industry. Linear trends shown as dashed black lines are significant when p < 0.05.

Figure 6.
The dynamics of surface freshwater abstraction in Romania in the years 2000–2019: (a) total gross abstraction, as well as water used for cooling in electricity production and for manufacturing industry; (b) water used for agriculture and public supply. Linear trends shown as dashed black lines are significant when p < 0.05.

Figure 7.
(a) Population in Poland in the years 2000–2019; (b) total gross electricity production in Gigawatt hours (GWh) in Poland in the years 2000–2019. Both linear trends shown as dashed black lines are significant at p < 0.0001.
Figure 7.
(a) Population in Poland in the years 2000–2019; (b) total gross electricity production in Gigawatt hours (GWh) in Poland in the years 2000–2019. Both linear trends shown as dashed black lines are significant at p < 0.0001.

Figure 8.
The dynamics of the percentage share of the main energy sources in the total gross electricity production in Poland in 2000–2019: (a) hard coal and lignite; (b) natural gas; (c) fuel oil; (d) solid biofuels; (e) wind power; and (f) hydropower. All linear trends shown as dashed black lines are significant at p < 0.0001.

Figure 9.
Prediction of the share of the main energy sources in the total gross electricity production in Poland in 2020–2040: (a) hard coal, including coke oven gas and blast furnace gas; (b) lignite; (c) gaseous fuels: high-methane and nitrogen-rich natural gas, gas from demethylation of mines, and gas accompanying crude oil; (d) fuel oil; (e) solid biofuels; (f) biogases; (g) wind power; (h) hydropower; (i) solar photovoltaic; and (j) nuclear fuels. Left Y axis—percentage share; right Y axis—share in TWh (1 TWh = 1000 GWh). Linear trends shown as dashed lines are significant when p < 0.05. The prediction is based on the data from Table 22 in Appendix 2 [29] to the EPP2040.

Disclaimer/Publisher’s Note: The statements, opinions and data contained in all publications are solely those of the individual author(s) and contributor(s) and not of MDPI and/or the editor(s). MDPI and/or the editor(s) disclaim responsibility for any injury to people or property resulting from any ideas, methods, instructions or products referred to in the content. |
© 2023 by the author. Licensee MDPI, Basel, Switzerland. This article is an open access article distributed under the terms and conditions of the Creative Commons Attribution (CC BY) license (https://creativecommons.org/licenses/by/4.0/).
Share and Cite
MDPI and ACS Style
Kędra, M. Cooling Water for Electricity Production in Poland: Assessment and New Perspectives. Energies 2023, 16, 2822. https://0-doi-org.brum.beds.ac.uk/10.3390/en16062822
AMA Style
Kędra M. Cooling Water for Electricity Production in Poland: Assessment and New Perspectives. Energies. 2023; 16(6):2822. https://0-doi-org.brum.beds.ac.uk/10.3390/en16062822
Chicago/Turabian StyleKędra, Mariola. 2023. "Cooling Water for Electricity Production in Poland: Assessment and New Perspectives" Energies 16, no. 6: 2822. https://0-doi-org.brum.beds.ac.uk/10.3390/en16062822
Note that from the first issue of 2016, this journal uses article numbers instead of page numbers. See further details here.