

Influence of Changes in Stiffness and Damping of Tyre Wheels on the Outcome of the Condition Assessment of Motor Vehicle Shock Absorbers

1
Department of Automotive Engineering and Transport, Faculty of Mechatronics and Mechanical Engineering, Kielce University of Technology, Avenue Tysiąclecia Państwa Polskiego 7, 25-314 Kielce, Poland
2
Department of Mechanical Engineering, Institute of Vehicles and Transportation, Military University of Technology (WAT), StreetGen. SylwestraKaliskiego 2, 00-908 Warsaw, Poland
*
Author to whom correspondence should be addressed.
Energies 2023, 16(9), 3876; https://0-doi-org.brum.beds.ac.uk/10.3390/en16093876
Submission received: 24 March 2023
/
Revised: 16 April 2023
/
Accepted: 1 May 2023
/
Published: 3 May 2023
(This article belongs to the Special Issue Simulation and Optimization of Vehicle Dynamics System)
Abstract
:This article deals with the influence of the elastic-damping properties (energy losses) of tired wheels on the results of the evaluation of the technical condition (dynamic properties) of automotive suspensions carried out on the diagnostic line. The purpose of this paper is to point out the inadequacies of test stands for assessing the technical condition of vehicle suspensions. The diagnostic line used in the testing featured two testing stations. The test object was a passenger car with hydro-pneumatic suspension. This enabled the conducting of suspension tests for two settings (comfort and dynamic positions). The tests were conducted for four different air pressures in the tyres of tired wheels. This made it possible to determine, for each wheel, four graphs of the load versus tyre deflection (radial stiffness characteristics). These graphs were used to determine the values of the stiffness coefficients, energy loss, and damping characteristics as well as to identify the correlation between the directional coefficient of the regression line of the elastic and damping characteristics of the tyres and the indices characterising the damping properties of the suspension of the test car. This paper shows that the result of the shock absorber condition assessment is significantly influenced by the elastic and damping properties of the tired wheels, caused by changes in tyre pressure.
1. Introduction
A car’s suspension is made up of a number of interconnected components that connect the chassis of the motor vehicle to the wheels. These components include leading, guiding, spring and damping elements.
The role of the suspension system in the design of a vehicle is crucial, as it performs many tasks and its operational requirements are often contradictory. This system should ensure that the vehicle’s tyres are in contact with the road surface and, at the same time, isolate the vehicle body from vibrations generated by road irregularities [1].
For the vast majority of vehicle users, the deterioration of the suspension system and its components is practically imperceptible. The technical condition of these components determines the comfort of travel and the proper interaction of the wheel with the road surface (the correct level of vertical, longitudinal and lateral forces) affecting the vehicle’s handling, braking distances, and the correct operation of many systems, such as ABS and ESP.
Car vibrations are mainly generated by the unevenness of the roads on which the cars travel. The tyre wheels and shock absorbers have the greatest influence on the damping of vibrations generated by the road surface. Shock absorbers are strong damping components and their performance characteristics are mostly asymmetrical. Magnetorheological (MR) fluid devices are an example of dampers with variable damping characteristics [1].
Routine checks of the condition of shock absorbers are extremely important for the safety of motor vehicle users, as they make it possible to detect shock absorber malfunctions at an early stage. According to statistics, the most common symptoms of shock absorber failure are oil leakage and abnormal (excessive) noise [2,3].
The evaluation of the damping performance of shock absorbers can be carried out using several methods. These methods are divided into two basic groups. The first group includes tests of shock absorbers removed from the vehicle, while the second group includes tests of shock absorbers installed in the vehicle (non-assembly methods). Testing of dismounted shock absorbers is carried out on special test benches. They are mainly conducted in the field of shock absorber characteristics in order to assess its damping properties, identify possible malfunctions and assess durability. Many researchers from different countries have carried out research into the characteristics of hydraulic shock absorbers. Some of them [4], for example, have studied the effect of low temperatures and others [5,6,7,8,9,10,11,12,13,14,15,16,17,18], in turn, of high temperatures on their damping characteristics. The effect of low temperatures and technical conditions on the characteristics of a hydraulic damper was studied by Z. Hryciow [19]. Z. Hryciow and others [4] showed that the temperature of a hydraulic shock absorber has a significant effect on the values of the determined damping coefficients. This influence increases as the temperature of the tested shock absorber decreases. It was also found that as the temperature decreases, the energy loss per shock absorber cycle decreases linearly. Nikolay [11] analysed the effect of temperature (low and high) on the damping properties of a shock absorber. He used the results obtained for simulation studies of driving comfort (vibration levels).
Diagnosing shock absorber malfunctions using non-demounting methods is difficult, as the test results using these methods can be influenced by other parameters of the vehicle and its components. The test result is affected by, among other things, tyre pressure, sprung mass, and friction force in the suspension [20,21]. However, the ease and speed of measurement by these methods have meant that they are now widely used in car diagnostics. Testing of shock absorbers fitted to a car can be carried out using a variety of methods. In the literature, these methods are usually divided into two main groups, among which there are free vibration and forced vibration methods.
The most common forced vibration methods are tests carried out according to BOGE, EUSAMA, THETA and their derivatives [20,21,22,23,24,25,26,27,28,29,30,31,32,33,34,35,36,37]. In these methods, vertical vibration generators are used that cause vibrations in the plates on which the wheel of the test car is placed during the test. Vibration generation is carried out in three stages: acceleration of the stand plate to a frequency higher than the resonant frequency of the suspension system, excitation of the suspension system at a constant frequency, deactivation of the generator and extinction of the vibrations as a result of damping realised by shock absorbers, suspension system components, and tyres [38].
The shortcomings of the aforementioned methods have been addressed by [36,37,38] among others. The authors [35] carried out a simulation study of the effect of the inertia of the vibrating tester plate on the EUSAMA test results. The analysis of the results of the simulation study was carried out in both the time and frequency domains. The results obtained by the authors show that the inertia of the vibration-generating plate can distort the results of tests carried out according to EUSAMA recommendations. In the authors’ opinion, it is possible to eliminate these errors by performing an additional measurement during which the vertical acceleration of the vibrating plate of the stand is recorded.
As the tyres contribute to the dynamic loads on the car, both the elastic-damping properties of the tyres and suspension and their interaction are important in studies of the car’s movement dynamics, comfort, and energy consumption [39,40,41]. Insufficient air pressure in the tyre increases the deformation of the tyre, increasing its energy intensity and durability. An analysis of the above-mentioned literature indicates that tyre pressure influences suspension deflection and body acceleration.
Parczewski [40] showed that a change in tyre pressure causes a change in the radial and lateral stiffness of the tyre wheel. A reduction in the radial stiffness of a tyre wheel causes a change in the vertical equivalent stiffness resulting from the stiffness of the tyres and wheel suspension; an increase in the braking distance of a vehicle travelling both straight and round a curve; and an increase in the understeer of the vehicle. In addition, the author [40] has shown that a reduction in the lateral stiffness of the rubber wheel causes, among other things, a change in the trajectory of a car travelling on a curved road. In order to maintain the same trajectory of the car, the steering angle of a car with tyres with lower radial stiffness should be greater than that of a car with tyres with higher radial stiffness.
The reduction in radial stiffness also reduces the vertical accelerations generated by the unevenness of the road surface. Reducing these accelerations has the beneficial effect of increasing the vibration comfort of the car’s occupants [42,43,44].
In [38,45], the effect of tyre pressure of selected passenger cars on the vibration-damping performance of their suspension systems was analysed. In these articles, it was shown that an increase in the tyre pressure of the test vehicles resulted in a decrease in the EUSAMA index value. Furthermore, it was found that the EUSAMA index value also depended on the static wheel load of the tested suspension.
The aim of the article was to identify the inadequacies of test stands for assessing the technical condition(dynamic properties) of motor vehicle suspensions. Developing the presented problem, the paper assesses the influence of the tyre’s characteristics (caused by a change in tyre pressure) on the result of the evaluation of the damping properties of the suspensions (shock absorbers) of motor vehicles. The experiment planned and presented in the article was carried out in three stages, which were implemented as follows:
- The influence of tyre pressure on the elastic and damping properties of the tyre was investigated by determining the stiffness coefficient, damping, and energy loss.
- The influence of tyre pressure on the result of the evaluation of the damping properties of a motor vehicle suspension was investigated.
- The correlation coefficients between the determined coefficients (stiffness, damping, and energy loss) of the tyres and the results of the evaluation of the damping properties of the suspension of the tested car were determined.
The article consists of five sections and is structured as follows. Section 2 describes the test object, the test stands, and the test methodology and process. Section 3 presents the results of the wheel tired and suspension tests on the test vehicle. The test results are analysed in Section 4. The conclusions are presented in Section 5.
2. Research Methodology
2.1. Test Vehicle
This paper presents and analyses the results of a study of the wheels and suspension of a passenger car with hydro-pneumatic suspension. The vehicle was fitted with wheels with tubeless tires. Their degree of wear did not exceed 10%. The tires were 255 mm wide and 140.25 mm high. Their seating diameter on the rim was 19 inches. Basic information on the research object is presented in Table 1.
2.2. Measuring Apparatus
The tired wheel tests were conducted on a station made from MTS subassemblies (Figure 1). The station consisted of the following:
- Electrohydraulic pulse generator model 244.12 and servo valve model 244.12.
- Hydraulic power system model Silent Flow 505.20 (MTS Systems Corporation 14000 Technology Drive Eden Prairie, MN, USA. 55344-2247).
- Steering system as well as force and displacement recording system.
- Wheel mounting system.
The station enables the generation of kinematic and dynamic inputs in the frequency range of 0 to 100 Hz. The technical parameters of the station’s operation are presented in Table 2 and Figure 2. The wheel mounting was carried out using a universal structure mounted on service slabs along with the electrohydraulic pulse generator.
The suspensions (shock absorbers installed in the car) were tested on the Bosch Beissbarth diagnostic line (Figure 3). The line was equipped with two damping effectiveness testing stations SAT690 and SA640, operating based on the THETA (Table 3) and EUSAMA (Table 4) methods [46,47].
The EUSAMA method involves tired wheel excitation in terms of vertical vibration with an amplitude of 3 mm and frequency from 25 Hz to zero. In this method, the evaluation of the damping effectiveness is based on the ratio (WE) expressed by Formula (1) [25,26,27].
where:
Nst—contact force between the wheel and the station’s car ramp in static conditions,
Nmin—minimum contact force between the wheel and the station’s car ramp.
In this method, the criterion for the shock absorbers’ damping evaluation is as follows: 0–20%—poor technical condition of shock absorbers (insufficient damping), 21–40%—acceptable damping—the shock absorber must be tested on the station after being removed from the car, 41–60%—good damping, >60%—very good damping.
Differences in the EUSAMA ratio of 20–30% between vehicle sides indicate that the shock absorber is ineffective.
The damping properties of shock absorbers are evaluated with the use of forced vibration in the THETA method. The testing station’s engine causes vertical vibration of the car ramp with a frequency of 10 Hz. The vibration in the station is free when the drive unit is turned off. In this method, the evaluation of the damping effectiveness is based on the dimensionless vibration ratio (D) expressed by Formula (2) [25,26,27].
where:
D—damping degree.
d—shock absorbers damping constant, kg/s.
c—spring constant, N/m.
m—mass of the car’s quarter, kg.
2.3. Testing Procedure
The tests carried out as part of the experiment were conducted in two stages. In the first stage, for each of the four different tyre air pressures (0.36, 0.31, 0.24, and 0.15 MPa), the radial stiffness characteristics of the tested tyre wheel were determined. The adopted research methodology was based on many years of experimental research and a literature review [48]. During the experiment, the road wheel was mounted on a test bench (Figure 1). Before each of the four measurement tests, the tyre air pressure was checked and adjusted. The wheel was then pre-loaded with a radial force that corresponded to the weight of the car per wheel under test (5787 N). According to the adopted methodology, radial loading and unloading were performed using an actuator (electrohydraulic pulser), which generated a sinus-type kinematic excitation with a constant amplitude of 0.018 m and a frequency of 0.5 Hz (Table 5). During each test, the normal load acting at the wheel axis and the tyre deflection of the tested tyre were recorded. The elasticity and damping components were then extracted from the obtained characteristics (working diagrams), from which the stiffness and damping coefficients of the test wheel were determined.
In the second stage of the experiment, the damping properties of the test car’s suspension were tested on the diagnostic line. During the testing, the car was equipped with wheels for which the stiffness and damping indices were designated in the first stage. The diagnostic line testing involved four series. Prior to each series, the wheels’ pressure was checked and adjusted. The pressure values were identical to the ones used in the first stage of the experiment and amounted to 0.36, 0.31, 0.24, and 0.15 MPa.
THETA shock absorber test
During the initial phase of the shock absorber test, the car wheel rests on a stationary test bench plate. The excitation system is then activated. The plate reaches a vibration frequency of 10 Hz. When the excitation system is switched off, the test stand can operate freely (vibrations are damped). During the test (over the entire vibration frequency range), the test stand measurement system measures the displacement of the test stand plate and the mass of the car per wheel placed on the plate.
EUSAMA shock absorber test
In the initial stage, testing the shock absorbers, the wheel of the car rests on a stationary plate and a static measurement is made of the force of the wheel on the bench plate. In this case, the WE value is 100%. The forcing system is then activated. The plate reaches a vibration with an amplitude of 3 mm and a frequency of about 25 Hz. When the override is switched off, at a frequency of 16 Hz, the minimum force of the wheel on the bench plate is measured. If the wheel pulls away from the plate during the test at this frequency, the WE value is 0%.
3. Test Results and Analysis
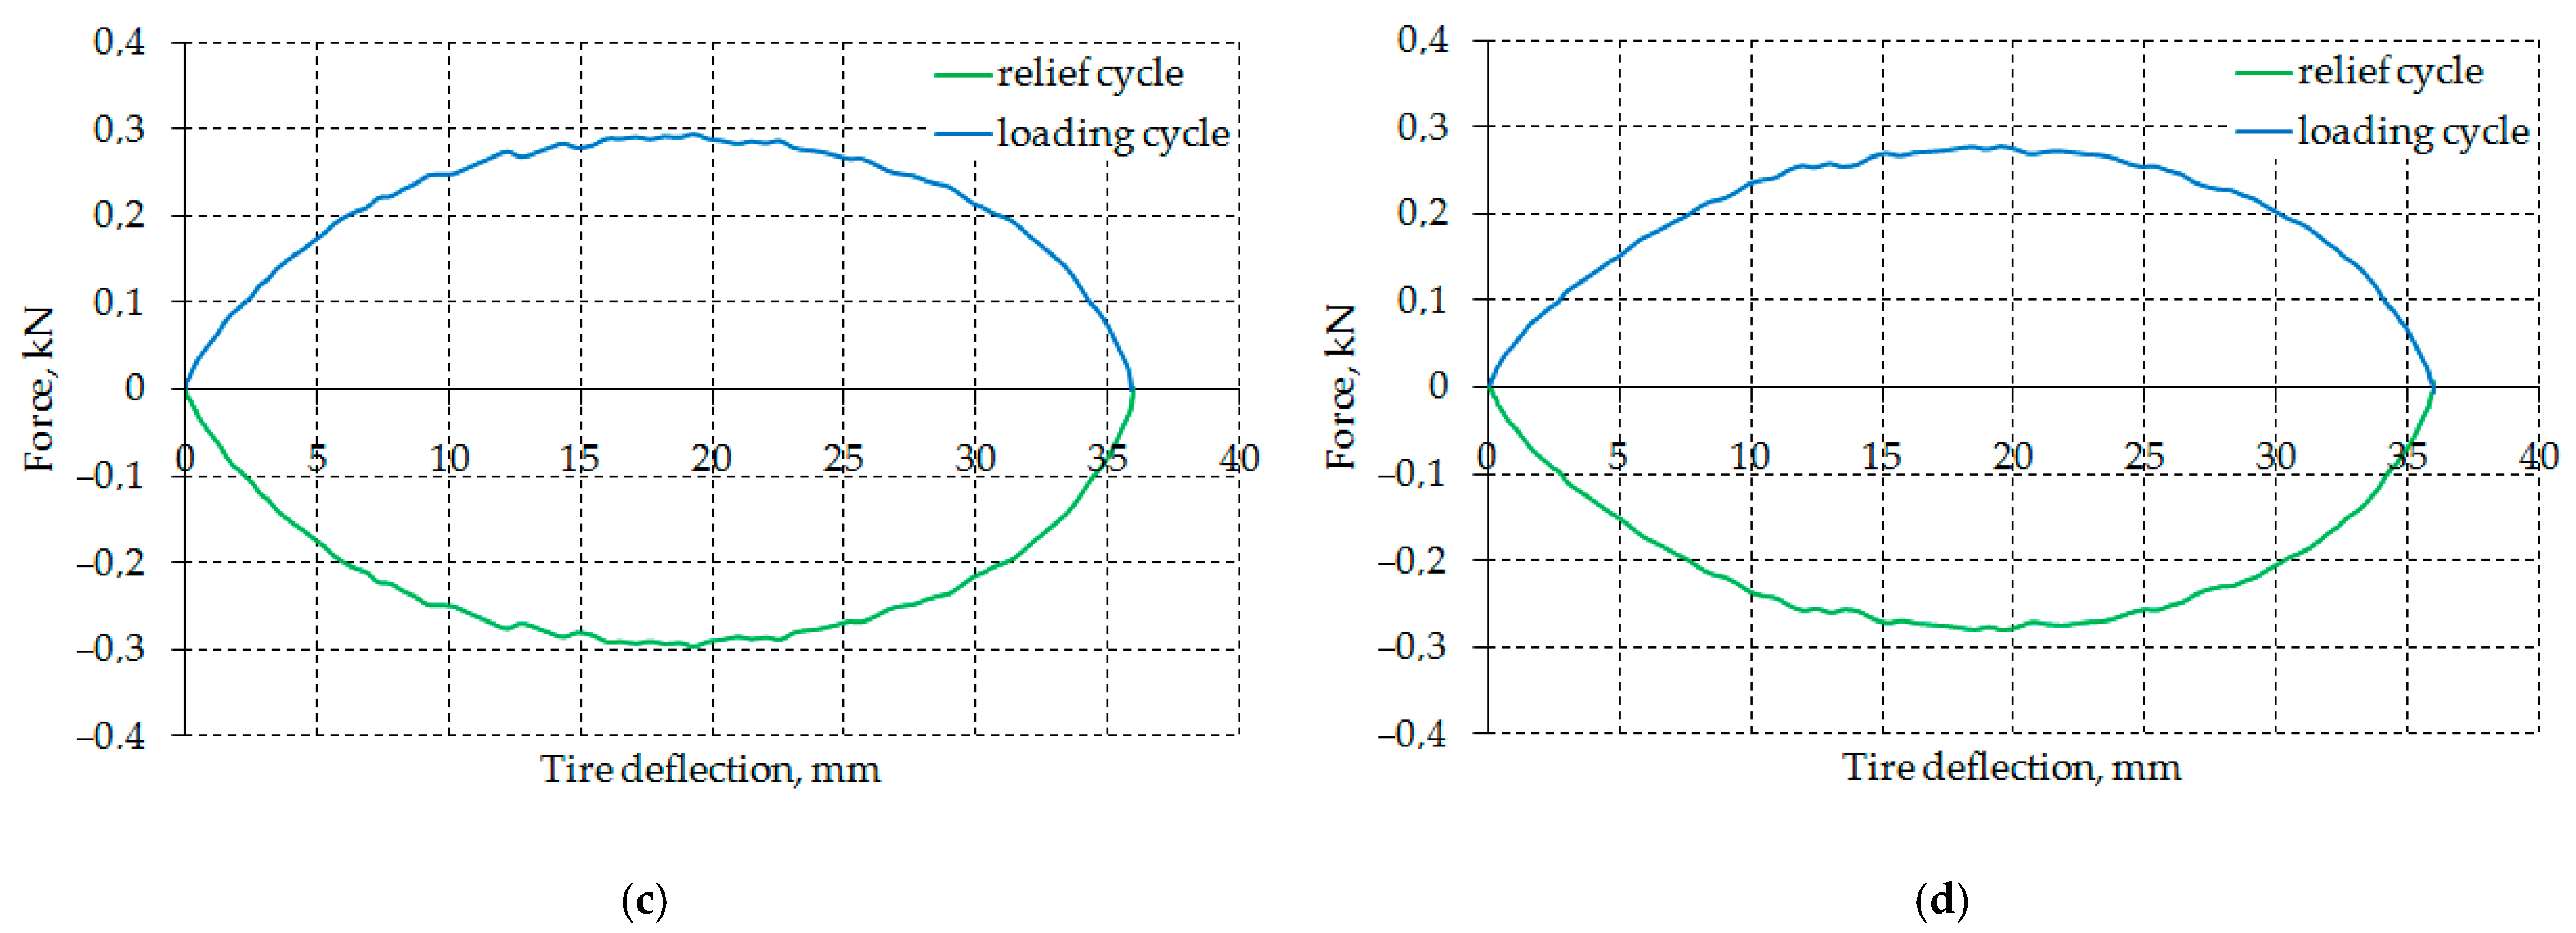
As part of the first stage of the experiment, four radial characteristics were determined for each tire on the front axle of the test vehicle (Figure 4), from which the stiffness, damping, and hysteresis coefficients were identified.
Each of the characteristics obtained, in the form of a hysteresis loop can be expressed as the sum of the elastic and damping components.
When designating the top branch of the hysteresis loop obtained in the loading cycle as , and the loop’s bottom branch (obtained in the relief cycle) as , the elastic component (Figure 5) (midline) of Equation (3) was designated from Formula (4).
Considering the small, even negligible, non-linearity of the designated midline, its form was assumed to be linear. Then, from the course of the tangent to the midline at the point of normal static load (Zstat), the value of the radial stiffness coefficient (k) was determined, which is the derivative of the wheel load in relation to the tire deflection [39] (Figure 6).
where:
dZ—change in load around static load.
dλ—tire deflection for dZ.
Figure 6.
Method of determining the radial stiffness coefficient of the tyre (k).

In addition, the tire structure’s energy consumption was estimated based on the hysteresis loop’s waveform. The difference between the work involved in loading the tire (LU) (field hatched vertically) and relieving the load (LO) (green field) expresses the value of energy lost to vertical deformation of the tire (Figure 7).
Therefore, the energy losses can be demonstrated using the following hysteresis index [39]:
The bottom and top branches of the work (pure damping loop) diagram (Figure 8) are designated by subtracting (midline in the diagram) from and
Due to the fact that the wheel loading rate is known for each point of the work diagrams (Figure 8), it is possible to designate the damping profile (Figure 9) for each of the diagrams.
For the damping characteristics, in turn, the midline was determined and for them the coefficients of the regression lines. The directional coefficients of the regression lines for the speed interval from 0.01 to 0.056 m/s are the damping coefficients of the tested tire. The values of the determined stiffness coefficients (k), hysteresis coefficient (WH), and damping (c) of the tire are summarized in Table 6.
The second stage featured an evaluation of the damping properties of the suspension of a car equipped with tired wheels, with the stiffness and damping properties that were designated in the first stage. The testing was conducted using the EUSAMA and THETA methods. The evaluation of the suspensions’ damping properties was conducted for two different suspension positions. The first position was the comfort position, while the second was the dynamic position. Testing with the aforementioned settings was conducted for four tyre air pressures:
- 0.31 MPa—rated pressure.
- 0.36 MPa—pressure increased by 15% in relation to the rated pressure.
- 0.24 MPa—pressure increased by 25% in relation to the rated pressure.
- 0.15 MPa—pressure increased by 50% in relation to the rated pressure.
4. Discussion
When analysing the results, it is possible to state that the increase in the tyre’s air pressure is accompanied by a clear increase in the stiffness index (k) as well as a decrease in the hysteresis (WH), and damping (c) indices. At the rated tyre air pressure (0.31 MPa), the stiffness index (k) was equal to 297 N/m, the hysteresis index (WH) amounted to 0.081, while the damping index (c) for loading and relief was equal to 5583 N × s/m and 5621 N × s/m respectively. An increase in the tyre’s air pressure of 15% caused an 11% increase in the stiffness index, a 7% decrease in the hysteresis index, and a 4% decrease in the damping index for loading and relief. A 25% and 50% tyre air pressure reduction in relation to rated pressure caused a 17% and 39% reduction in the stiffness index as well as a marked increase in hysteresis coefficient values by about 25% and 50%, respectively, and damping for both loading and relief by about 3–4%. The correlation between the tyre’s air pressure and the tyre’s stiffness index was positive and equal to 1. This points to a very high correlation and strong dependency. The correlation ratio between the tyre’s air pressure and the hysteresis and damping indices designated for the tyre loading and relief cycles amounted to −0.99, −0.95, and 0.91, respectively. The correlation ratio of −0.99, −0.95, and 0.91 points to a very high correlation and very certain dependency. A negative correlation ratio means that the values of one data group increase along with the reduction in another group’s values.
When analysing the above results, it is possible to note that the EUSAMA ratio values are inversely proportional to the tyre’s air pressure. The EUSAMA ratio is increasing along with the reduction in air pressure. This regularity applies to both the suspension’s comfort and dynamic positions. The EUSAMA ratio for rated tyre air pressure is within the range of 63% and 64%. According to the criterion adopted for the EUSAMA method, this value means that the suspension is in a very good technical condition in terms of its damping properties. For tyre air pressures lower than the rated air pressure, the EUSAMA ratio is within the range of 70 to 83% and also points to very good damping. The analysed ratio was below 61% only when the air pressure increased by 15%; nevertheless, the suspension’s damping properties were good.
The evaluation of the shock absorbers using the THETA method generated positive results in each of the analysed cases. The dimensionless THETA ratio is within the range of 0.20 to 0.27. According to the method’s criterion, these values point to very good damping properties of the suspension. The tyre’s air pressure did not have a substantial impact on the result of the test conducted using the THETA method. It is possible to note that the THETA ratio for suspension in its dynamic position was slightly higher than the THETA ratio designated for suspension in its comfort position.
The further part of this elaboration features an analysis of the correlation between the tyre’s damping and stiffness indices, and the results of the evaluation of the suspension’s damping properties (Table 9 and Table 10).
The correlation ratio between the tired wheel’s stiffness index, hysteresis index, and damping index, and the EUSAMA ratio designated for suspension set in the comfort position was very high. The ratio was equal to −1, 0.99, 0.94, and 0.91, respectively. This points to a very high correlation and very strong dependency. The correlation ratio between the tired wheel’s stiffness index, hysteresis index and damping index, and the THETA ratio was slightly lower. It was equal to 0.78, −0.70, −0.89, and −0.90, respectively. This points to a high correlation and substantial dependency. Negative values point to a negative correlation. This means that the values of one data group increase along with the reduction in another group’s values.
The correlation ratios between the tired wheel’s stiffness index, hysteresis index, and damping index, and the EUSAMA and THETA ratios designated for suspension set in the dynamic position were very high. This points to a very high correlation and very strong dependency. The correlation ratios between the damping index and the EUSAMA ratio were also high. The ratios were equal to 0.96 for the loading cycle and 0.93 for the relief cycle. The correlation ratios between the THETA ratio and the tired wheel’s damping index for the loading and relief cycles were slightly lower and amounted to −0.89 and −0.84, respectively (high correlation, substantial dependency).
5. Conclusions
The paper’s authors attempted to determine the effects of the elastic and damping properties of a car’s tired wheel on the evaluation of the damping properties of the car’s suspension. The tired wheel’s elastic and damping properties were changed by manner of changing the tested car’s tyre air pressure. The tired wheel’s stiffness index turned out to be strongly correlated with the tyre’s air pressure. The dependency between the tyre’s air pressure and the tired wheel’s stiffness index must be assessed as very certain. The hysteresis index and damping index also turned out to be very highly correlated with the tyre’s air pressure. The dependency between the tyre’s air pressure and the hysteresis index and damping index points to a very certain dependency.
The experiment allowed the authors to demonstrate the following:
- Changes in the tired wheels’ elastic and damping properties, caused by changes in the tyres’ air pressure, affect both the EUSAMA ratio and the THETA ratio.
- As the stiffness coefficient of the test vehicle’s tyre wheel increases (due to an increase in tyre pressure), the EUSAMA values for the test vehicle’s suspension systems decrease. A 15% increase in the tyre’s air pressure caused a reduction in the EUSAMA ratio, which in turn changed the shock absorbers’ technical condition evaluation by one rating from very good to good. A 25% and 50% reduction in the tyre’s air pressure caused an increase in the EUSAMA ratio, but did not affect the evaluation of the suspension’s damping properties.
- The obtained THETA ratios are within the range of 0.20 to 0.27, thereby pointing to very good damping properties of the tested car’s suspension. Neither the 15% pressure increase nor the 25% and 50% pressure decrease affected the suspension’s final evaluation performed using the THETA method.
It is expected that diagnostic devices intended to evaluate the damping properties of suspension elements will continue to be developed and verified experimentally to a greater extent.
Author Contributions
Conceptualization, A.Z. and J.J.; methodology, A.Z. and J.J.; software, A.Z.; validation, A.Z.; formal analysis, A.Z.; investigation, A.Z. and J.J.; resources, A.Z.; data curation, A.Z.; writing—original draft preparation, A.Z.; writing—review and editing, A.Z. and J.J.; visualization, A.Z.; supervision, J.J. All authors have read and agreed to the published version of the manuscript.
Funding
This work was financed/co-financed by the Military University of Technology under research project UGB831/2023.
Institutional Review Board Statement
Not applicable.
Informed Consent Statement
Not applicable.
Data Availability Statement
Not applicable.
Conflicts of Interest
The authors declare no conflict of interest.
References
- D’Andrea, D.; Risitano, G.; Scappaticci, L. Performance Analysis of a Magnetorheological Shock Absorber Prototype Designed According to a Quasi-Static No-Slip Model. Actuators 2021, 10, 13. [Google Scholar] [CrossRef]
- Sun, L.; Yang, Z. Competing in the automotive aftermarketshock absorber articles. Auto Driv. Serv. 2012, 48, 109–113. [Google Scholar]
- Mu, Z.; Cao, H.; Xu, H. Discussion on oil leakage of motorcycle front shock absorber. Modern Manufactur. Technol. Equip. 2017, 243, 133–134. [Google Scholar]
- Hryciów, Z.; Rybak, P.; Gieleta, R. The influence of temperature on the damping characteristic of hydraulic shock absorbers. Eksploat. Niezawodn.—Maint. Reliab. 2021, 23, 346–351. [Google Scholar] [CrossRef]
- He, Q.; Zhang, G.; Ling, Q.; Yu, L. Influence of temperature variation on the performance of hydraulic shock absorber. Mach. Tool Hydraul. 2002, 30, 108–110. [Google Scholar]
- Yang, P. Research on the Mechanism of the Vehicle Hydraulic Shock Absorber. Master’s Thesis, Tongji University, Shanghai, China, 2004. [Google Scholar]
- Zhang, L.; Yu, Z.; Yang, P.; Yin, D. Theoretic investigation on thermodynamics of the vehicle hydraulic shock absorber. J. Vib. Shock 2006, 25, 95–98. [Google Scholar]
- Sorniotti, A. Shock Absorber Thermal Model: Basic Principles and Experimental Validation; SAE Technical Paper 2008-01-0344; SAE International: Warrendale, PA, USA, 2008. [Google Scholar] [CrossRef]
- Singh, A.; Bera, T.K. Bond Graph aided thermal, modeling of twin-tube shock absorber. Int. J. Model. Simul. 2016, 36, 183–192. [Google Scholar] [CrossRef]
- Demić, M.D.; Diligenski, Đ.M. Numerical simulation of shock absorbers heat load for semi-active vehicle suspension system. Therm. Sci. 2016, 20, 1725–1739. [Google Scholar] [CrossRef]
- Nikolay, P. Influence of shock absorber temperature on vehicle ride comfort and road holding. MATEC Web Conf. 2017, 133, 02006. [Google Scholar]
- Zhang, R.; Wang, X.; Liu, Z. A novel regenerative shock absorber with a speed doubling mechanism and its Monte Carlo simulation. J. Sound Vib. 2017, 417, 260–276. [Google Scholar] [CrossRef]
- Qiu, L.; Jingwei, S.; Xu, H.U. External characteristics simulation of high-speed rail anti-snake shock absorber. In Proceedings of the 2018 Annual Meeting of China Automotive Engineering Society, Beijing, China, 1 September 2018. [Google Scholar]
- Xin, D.K.; Nie, S.L.; Ji, H.; Yin, F.-L. Characteristics, optimal design, and performance analyses of MRF damper. Shock Vibrat. 2018, 2018, 1–17. [Google Scholar]
- Rana, J.; Gajjar, S.; Patel, A. Experimental Analysis and Heat Transfer Study of Damping Fluid in Shock Absorber Operation. Int. J. Eng. Dev. Res. 2014, 2, 2939–2947. [Google Scholar]
- Liang, L.; Tian, L.; Zhang, Y.Q.; Zhang, J. Twin Tube Shock Absorber Thermo-Mechanical Coupling Simulation. Adv. Mater. Res. 2012, 566, 669–675. [Google Scholar] [CrossRef]
- Pracny, V.; Meywerk, M.; Lion, A. Full vehicle simulation using thermomechanically coupled hybrid neural network shock absorber model. Veh. Syst. Dyn. 2008, 46, 229–238. [Google Scholar] [CrossRef]
- Xie, F.; Cao, J.; Ding, E.; Wan, K.; Yu, X.; Ke, J.; Gao, K. Temperature rise characteristics of the valve-controlled adjustable damping shock absorber. Mech. Ind. 2020, 21, 111. [Google Scholar] [CrossRef]
- Hryciów, Z. An Investigation of the Influence of Temperature and Technical Condition on the Hydraulic Shock Absorber Characteristics. Appl. Sci. 2022, 12, 12765. [Google Scholar] [CrossRef]
- Zdanowicz, P. Problematyka Oceny Stanu Amortyzatorów na Stanowisku EUSAMA. Available online: https://www.logistyka.net.pl/bank-wiedzy/item/download/76824_57a460289d19d01d0f5b95cf0d2e4638 (accessed on 15 January 2023).
- Stańczyk, T.L.; Strachowski, P. Analizaporównawczabadaniaamortyzatorówmetodami BOGE i EUSAMA. In Materiały X Konferencji „DiagnostykaMaszyniPojazdów”; cz. II. Wyd.; ATR: Bydgoszcz, Poland, 1999. [Google Scholar]
- Kupiec, J.; Ślaski, G. Błędy w oceniezdolnościtłumieniaamortyzatorówprzybadaniu z wykorzystaniemwskaźnika EUSAMA. Diagnostyka 2004, 30, 301–304. [Google Scholar]
- Bocheński, C.; Lozia, Z.; Mikołajczuk, J. Próbaobiektywnejocenymetodybadańamortyzatorówzamontowanych w pojeździe, zalecanejprzezZrzeszenie EUSAMA. In Materiały X Konferencji „DiagnostykaMaszyniPojazdów”; cz. I. Wyd.; ATR: Bydgoszcz, Poland, 1999; pp. 59–70. [Google Scholar]
- Stańczyk, T.L.; Strachowski, P. O możliwościulepszeniametodybadaniaamortyzatorówwgzaleceń EUSAMA. Zesz. Nauk. Politech. ŚwiętokrzyskiejSer. Mech. 2000, 71, 235–240. [Google Scholar]
- Lozia, Z. Assessment of the usability of EUSAMA and the phase angle method in examining the con-dition of shock absorbers installed in a vehicle. WUT J. Transp. Eng. 2021, 132, 61–79. [Google Scholar] [CrossRef]
- Gardulski, J. Metodybadańamortyzatorówsamochodówosobowych. Diagnostyka 2009, 3, 93–100. [Google Scholar]
- Stańczyk, T.L.; Jurecki, R. Analizaporównawczametodbadaniaamortyzatorówhydraulicznych. Zesz. Nauk. Inst. Pojazdów 2014, 4, 25–45. [Google Scholar]
- Klapka, M.; Mazůrek, I.; Macháček, O.; Kubìk, M. Twilight of the EUSAMA diagnostic method-ology. Meccanica 2017, 52, 2023–2034. [Google Scholar] [CrossRef]
- Klapka, M.; Mazůrek, I.; Kubìk, M.; Macháček, O. Reinvention of the EUSAMA diagnostic meth-odology. Int. J. Veh. Des. 2017, 74, 304–318. [Google Scholar] [CrossRef]
- Gniłka, J.; Mężyk, A. Experimental identification and selection of dynamic properties of a high-speed tracked vehicle suspension system. Eksploat. Niezawodn.—Maint. Reliab. 2017, 19, 108–113. [Google Scholar] [CrossRef]
- Gobbi, M.; Mastinu, G.; Pennati, M. Indoor testing of road vehicle suspensions. Meccanica 2008, 43, 173–184. [Google Scholar] [CrossRef]
- Konieczny, Ł.; Burdzik, R. Comparison of characteristics of the components used in mechanical and non-conventional automotive suspensions. Solid State Phenom. 2014, 210, 21026–21031. [Google Scholar] [CrossRef]
- Markuszewski, D.; Wądołowski, M.; Gorzym, M.; Bielak, M. Concept of a composite frame of a martian vehicle. Adv. Sci. Technol. Res. J. 2021, 15, 222–230. [Google Scholar] [CrossRef]
- Czop, P.; Sławik, D.; Włodarczyk, T.H.; Wojtyczka, M.; Wszołek, G. Six Sigma methodology applied to minimizing damping lag in hydraulic shock absorbers. J. Achiev. Mater. Manuf. Eng. 2011, 49, 243–250. [Google Scholar]
- Czop, P.; Sławik, D. A high-frequency first-principle model of a shock absorber and servo-hydraulic tester. Mech. Syst. Signal Process. 2011, 25, 1937–1955. [Google Scholar] [CrossRef]
- Konieczny, Ł.; Filipczyk, J. Analysis of the possibility of using the phase angle in the Eusama method as an additional diagnostic parameter in the assessment of the technical condition of the vehicle suspension system. Diagnostyka 2022, 23, 2022414. [Google Scholar] [CrossRef]
- Lozia, Z.; Zdanowicz, P. Simulation assessment of the impact of inertia of the vibration plate of a diagnostic suspension tester on results of the EUSAMA test of shock absorbers mounted in a vehicle. IOP Conf. Ser. Mater. Sci. Eng. 2018, 421, 1–10. [Google Scholar] [CrossRef]
- Jurecki, R.; Jaśkiewicz, M.; Wdowski, T. Badaniewpływuobciążeniapojazduiciśnienia w ogumieniunawartośćtłumieniaamortyzatorówokreślanąmetodą EUSAMA. In Proceedings of the MateriałyKonferencyjne IX International Science Technical Conference, Automotive Safety 2014, Rajeckie Teplice, Slovakia, 8–10 April 2014; pp. 166–171. [Google Scholar]
- Jackowski, J.; Wieczorek, M.; Żmuda, M. Energy consumption estimation of non-pneumatic tire and pneumatic tire during rolling. J. KONES Powertrain Transp. 2018, 25, 159–168. [Google Scholar]
- Parczewski, K. Effect of tyre inflation preassure on the vehicle dynamics during braking manouvre. Eksploat. Niezawodn.—Maint. Reliab. 2013, 15, 134–139. [Google Scholar]
- Kasprzyk, T.; Prochowski, L. Teoria samochodu. In ObciążeniaDynamiczneZawieszeń; WKŁ: Warszawa, Poland, 1990. [Google Scholar]
- Zuska, A.; Stańczyk, T.L. Analysis of the impact of selected anthropometric parameters on the propagation of vertical vibration in the body of a seated person (driver). JVE Int. Ltd. J. Vibroeng. 2015, 17, 3936–3948. [Google Scholar]
- Zuska, A.; Stańczyk, T.L. Application of Anthropodynamic Dummies for Evaluating the Impact of Vehicle Seat Vibrations Upon Human Body. J. Theor. Appl. Mech. 2015, 53, 1029–1039. [Google Scholar] [CrossRef]
- Zuska, A.; Frej, D.; Jackowski, J.; Zmuda, M. Research and Analysis of the Propagation of Vertical Vibrations in the Arrangement of a Vehicle Seat—A Child’s Seat. Sensors 2021, 21, 8230. [Google Scholar] [CrossRef]
- Filipiak, R.; Jósko, M. Badaniawpływuciśnienia w oponachpojazdówsamochodowychnaskutecznośćtłumienia ich układuzawieszenia. J. Res. Appl. Agric. Eng. 2009, 54, 42–47. [Google Scholar]
- Available online: https://www.beissbarth-online.com/produkte/475438-bremsenpruefung-pkw/476424-fahrwerktester-sat-690-theta-230v (accessed on 16 March 2023).
- Available online: https://www.beissbarth-online.com/produkte/475438-bremsenpruefung-pkw/477159-fahrwerktester-sa-640-230-v-eusama (accessed on 16 March 2023).
- Jackowski, J.; Levulyte, L.; Wieczorek, M.; Zmuda, M. Research of influence of obstacles shape on the radial characteristics of the pneumatic wheel. In Transport Means—Proceedings of the International Conference, Trakai, Lithuania, 3–5 October 2018; Kaunas University of Technology: Kaunas, Lithuaniapp, 2018; pp. 1110–1116. [Google Scholar]
Figure 1.
Tired wheels testing station: (a) View of test bed, (b) View of test object (tyre wheel).

Figure 2.
Pulse generator characteristics.

Figure 3.
Beissbarth diagnostic line: (a) THETA SAT690 device, (b) EUSAMA SA640 device.

Figure 4.
Characteristics of the radial stiffness of the tire for a pressure value of (a) 0.15 MPa, (b) 0.24 MPa, (c) 0.31 MPa, and (d) 0.36 MPa.
Figure 4.
Characteristics of the radial stiffness of the tire for a pressure value of (a) 0.15 MPa, (b) 0.24 MPa, (c) 0.31 MPa, and (d) 0.36 MPa.

Figure 5.
Wheel elasticity profile for pressure.

Figure 7.
Tyre energy losses.

Figure 8.
Diagram of tire work without the elasticity element for pressure values: (a) 0.15 MPa, (b) 0.24 MPa, (c) 0.31 MPa, (d) 0.36 MPa.
Figure 8.
Diagram of tire work without the elasticity element for pressure values: (a) 0.15 MPa, (b) 0.24 MPa, (c) 0.31 MPa, (d) 0.36 MPa.


Figure 9.
Tyre damping profile for pressure values: (a) 0.15 MPa, (b) 0.24 MPa, (c) 0.31 MPa, (d) 36 MPa.
Figure 9.
Tyre damping profile for pressure values: (a) 0.15 MPa, (b) 0.24 MPa, (c) 0.31 MPa, (d) 36 MPa.


Table 1.
Basic information on the research object (tyre).
| Parameter | Values |
|---|---|
| Seating diameter on the rim, min | 19 |
| Height, mm | 140.25 |
| Width, mm | 255 |
| Maximum speed, km/h | 300 |
| Maximum load, kg | 690 |
| Tread | 5 plies (1 rayon + 2 steel + 2 nylon) |
| Sidewall | 1 ply rayon |
| Parameter | Values |
|---|---|
| Maximum frequency of generated signal, Hz | 100 |
| Maximum piston rod stroke, mm | −75 to 75 |
| Maximum piston rod load, kN | −25 to 25 |
Table 3.
Basic parameters of the THETA SAT 690 station [46].
Table 3.
Basic parameters of the THETA SAT 690 station [46].
| Parameters | Values |
|---|---|
| Maximum mass per the tested car’s axis, kg | 2200 |
| Vibration amplitude, mm | 3.25 |
| Measurement frequency, Hz | 10 |
| Range of indications | 0.02–0.3 |
| Accuracy of indications, % | ±2 |
| Engine power, kW | 2 × 1.1 |
Table 4.
Basic parameters of the EUSAMA SA 640 station [47].
Table 4.
Basic parameters of the EUSAMA SA 640 station [47].
| Parameters | Values |
|---|---|
| Maximum mass per the tested car’s axis, kg | 2000 |
| Vibration amplitude, mm | 3 |
| Measurement frequency, Hz | 0–24 |
| Traction, % | 0–100 |
| Engine power, kW | 2 × 2.5 |
Table 5.
Parameters for which the tired wheel’s profile was designated.
| Tyre Pressure, MPa | Preliminary Load Force, N | Kinematic Input Amplitude, mm | Input Frequency, Hz | Sampling Frequency, Hz |
|---|---|---|---|---|
| 0.36 | 5787 | 18 | 0.5 | 100 |
| 0.31 | ||||
| 0.24 | ||||
| 0.15 |
Table 6.
Stiffness (k), (WH) hysteresis and damping (c) indices.
| Air Pressure in Tyre, MPa | Stiffness Index (k), kN/m | Hysteresis Index (WH) | Damping Index (c), kn × s/m | |
|---|---|---|---|---|
| Loading | Relief | |||
| 0.15 | 0.182 | 0.127 | 5.766 | 5.773 |
| 0.24 | 0.246 | 0.099 | 5.680 | 5.690 |
| 0.31 | 0.297 | 0.081 | 5.583 | 5.621 |
| 0.36 | 0.329 | 0.075 | 5.386 | 5.384 |
| Correlation ratio | 1 | −0.99 | −0.95 | −0.91 |
| Determination ratio | 1 | 0.98 | 0.89 | 0.83 |
Table 7.
Breakdown of results of the evaluation of the shock absorbers’ technical condition conducted using the EUSAMA method.
Table 7.
Breakdown of results of the evaluation of the shock absorbers’ technical condition conducted using the EUSAMA method.
| Air Pressure in Tyre, MPa | Car Suspension Position | EUSAMA Ratio, % | |
|---|---|---|---|
| Left Wheel | Right Wheel | ||
| 0.36 | comfort | 58 | 57 |
| dynamic | 57 | 57 | |
| 0.31 | comfort | 64 | 63 |
| dynamic | 64 | 64 | |
| 0.24 | comfort | 72 | 70 |
| dynamic | 74 | 71 | |
| 0.15 | comfort | 82 | 81 |
| dynamic | 83 | 82 | |
Table 8.
Breakdown of results of the evaluation of the shock absorbers’ technical condition conducted using the THETA method.
Table 8.
Breakdown of results of the evaluation of the shock absorbers’ technical condition conducted using the THETA method.
| Air Pressure in Tyre, MPa | Car Suspension Position | Theta Index, % | |
|---|---|---|---|
| Left Wheel | Right Wheel | ||
| 0.36 | comfort | 0.23 | 0.26 |
| dynamic | 0.26 | 0.27 | |
| 0.31 | comfort | 0.21 | 0.22 |
| dynamic | 0.26 | 0.26 | |
| 0.24 | comfort | 0.2 | 0.2 |
| dynamic | 0.21 | 0.22 | |
| 0.15 | comfort | 0.2 | 0.2 |
| dynamic | 0.2 | 0.2 | |
Table 9.
Correlation between the tired wheel’s stiffness and damping indices and the results of the evaluation of suspension in its comfort position.
Table 9.
Correlation between the tired wheel’s stiffness and damping indices and the results of the evaluation of suspension in its comfort position.
| EUSAMA Ratio | Theta Ratio | ||
|---|---|---|---|
| Stiffness index | −1 | 0.78 | |
| Hysteresis index | 0.99 | −0.70 | |
| Damping index | loading | 0.94 | −0.89 |
| relief | 0.91 | −0.90 | |
Table 10.
Correlation between the tired wheel’s stiffness and damping indices and the results of the evaluation of the suspension set in the dynamic position.
Table 10.
Correlation between the tired wheel’s stiffness and damping indices and the results of the evaluation of the suspension set in the dynamic position.
| EUSAMA Ratio | Theta Ratio | ||
|---|---|---|---|
| Stiffness index | −0.99 | 0.95 | |
| Hysteresis index | 0.98 | −0.94 | |
| Damping index | loading | 0.96 | −0.89 |
| relief | 0.93 | −0.84 | |
Disclaimer/Publisher’s Note: The statements, opinions and data contained in all publications are solely those of the individual author(s) and contributor(s) and not of MDPI and/or the editor(s). MDPI and/or the editor(s) disclaim responsibility for any injury to people or property resulting from any ideas, methods, instructions or products referred to in the content. |
© 2023 by the authors. Licensee MDPI, Basel, Switzerland. This article is an open access article distributed under the terms and conditions of the Creative Commons Attribution (CC BY) license (https://creativecommons.org/licenses/by/4.0/).
Share and Cite
MDPI and ACS Style
Zuska, A.; Jackowski, J. Influence of Changes in Stiffness and Damping of Tyre Wheels on the Outcome of the Condition Assessment of Motor Vehicle Shock Absorbers. Energies 2023, 16, 3876. https://0-doi-org.brum.beds.ac.uk/10.3390/en16093876
AMA Style
Zuska A, Jackowski J. Influence of Changes in Stiffness and Damping of Tyre Wheels on the Outcome of the Condition Assessment of Motor Vehicle Shock Absorbers. Energies. 2023; 16(9):3876. https://0-doi-org.brum.beds.ac.uk/10.3390/en16093876
Chicago/Turabian StyleZuska, Andrzej, and Jerzy Jackowski. 2023. "Influence of Changes in Stiffness and Damping of Tyre Wheels on the Outcome of the Condition Assessment of Motor Vehicle Shock Absorbers" Energies 16, no. 9: 3876. https://0-doi-org.brum.beds.ac.uk/10.3390/en16093876
Note that from the first issue of 2016, this journal uses article numbers instead of page numbers. See further details here.