
Experimental Analysis and Simulation of Mixed Storage with Lithium-Ion Batteries and Supercapacitors for a PHEV


1
Department of Astronautics, Electrical and Energy Engineering, Sapienza University of Rome, 00184 Rome, Italy
2
Faculty of Engineering, Sapienza University of Rome, 00184 Rome, Italy
*
Author to whom correspondence should be addressed.
Energies 2023, 16(9), 3882; https://0-doi-org.brum.beds.ac.uk/10.3390/en16093882
Submission received: 29 March 2023
/
Revised: 14 April 2023
/
Accepted: 27 April 2023
/
Published: 4 May 2023
(This article belongs to the Special Issue Optimization for Charging and Discharging of Electric Vehicles)
Abstract
:This work focuses on the simulation and testing of an innovative storage system for a PHEV vehicle, investigating the possibility of replacing the car’s original storage system with a mixed-storage system with lithium-ion batteries and supercapacitors connected in direct parallel without the use of an intermediate DC/DC converter. The aim is to evaluate the behavior of the supercapacitors’ branch compared with that of the Li-ion cells, both in the discharge/charge transients and over an entire WLTP cycle (Worldwide harmonized Light vehicles Test Procedure). The analysis started with the definition of the digital models of a lithium cell and a supercapacitor. The parameters of the models were tuned through experimental characterization of the two storage cells, Li-ion and supercapacitor. Subsequently, the overall models of the branch with the lithium cells and the branch with the supercapacitors were constructed and connected. The overall storage system was sized for application to a PHEV, and a reduced-scale storage system was realized and tested. Finally, the results obtained from the simulations were validated and compared with experimental tests.
1. Introduction
Most hybrid and full-electric vehicles use lithium-ion batteries, characterized by a high energy density and a low or medium power density; this means that in response to important input or output power requests, respectively due to regenerative braking and acceleration, the accumulator is subjected to high current loads with consequent thermal stress, reduced performance, and reduction of the life cycle [1,2].
To overcome this issue, it is possible to contemplate the simultaneous use of supercapacitors; i.e., accumulators with low energy density, high power density, and the ability to undergo rapid charge/discharge cycles [3,4]. These devices are useful for satisfying the demand that would otherwise weigh only on the battery pack and would lead it to work less efficiently, with consequent mechanical, thermal, and electrical stress.
Several scientific papers can be found in the literature concerning this possible technological solution, but most of the proposed schemes involve the use of a DC/DC converter designed specifically for this type of application. The use of a DC/DC converter is particularly problematic and expensive due to the high currents circulating in the battery–supercapacitor parallel, both between the two branches of the parallel and toward the traction motor inverter. This forces the use of a DC/DC converter with the same power as the traction drive. Up until 2021, only one manufacturer on the market was offering a DC/DC converter with adequate power for this type of application, but at a very high cost (40,000 EUR). In the event of a hypothetical industrial production of this type of device, a cost comparable to that of a traction drive inverter is conceivable, i.e., thousands of euros, which would make the technological solution uncompetitive on a large scale.
Instead, here a simpler and more economical solution is investigated, consisting of a direct electrical coupling between the branch with the lithium battery and the branch with the supercapacitors. This solution undoubtedly has disadvantages, mainly related to electrical constraints on the sizing of the supercapacitor branch, but it has a clear advantage in terms of the cost and reliability of the storage system.
Thus, a direct parallel is created for our test: the lower impedance of the supercapacitor allows it to have a faster dynamic behavior when high power pulses are required; on the contrary, the battery supplies the energy required in the long term. The advantage of this configuration lies in the simplicity of its implementation and cost-effectiveness, both due to the lack of a complex control system or converter [5].
The main purpose of this study is to evaluate the actual contribution of the supercapacitor with respect to the mixed-storage system, subjecting it to single discharges and to the WLTP cycle in full-electric mode.
2. Simulation Models for Li-Ion Batteries and Supercapacitors
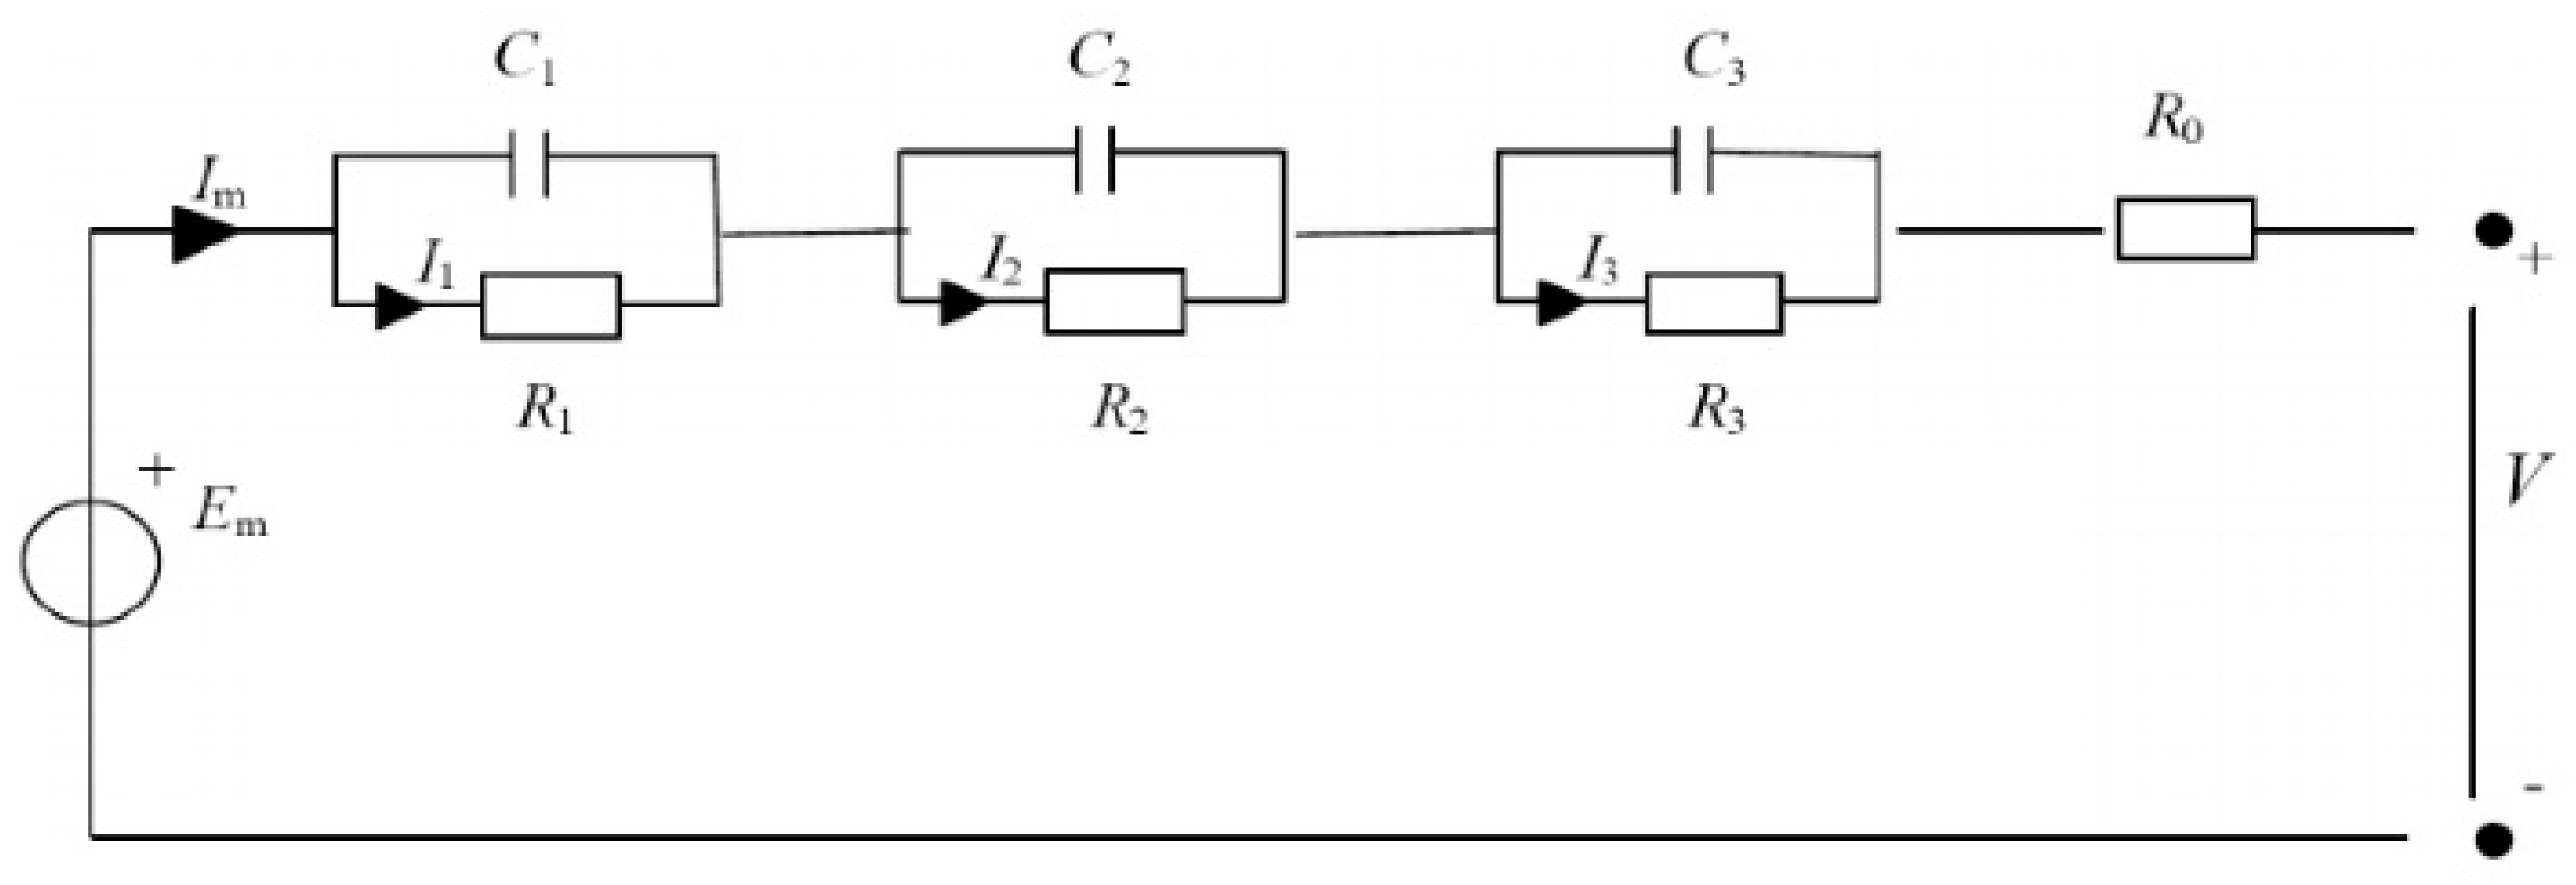
Li-ion batteries show intense nonlinear and time-varying characteristics because of their complex electrochemical reaction processes. Thevenin models essentially are composed of a voltage source to simulate the open-circuit voltage of the battery, a resistor for an instantaneous voltage-drop effect when a load is connected across the battery terminals, and several RC blocks to describe the polarization characteristics of the cell. By increasing the number of RC networks, a better estimation of the battery’s internal behavior can be obtained. Theoretically, the number of RC branches can be increased to obtain the exact model of the battery; the downside to this is the increased computational time required and a more complex characterization procedure.
A model with three RC elements shows good accuracy both in terms of predicting the runtime and in modeling fast and slow dynamics, due to the presence of three different scaled time constants (Figure 1) [6,7,8].
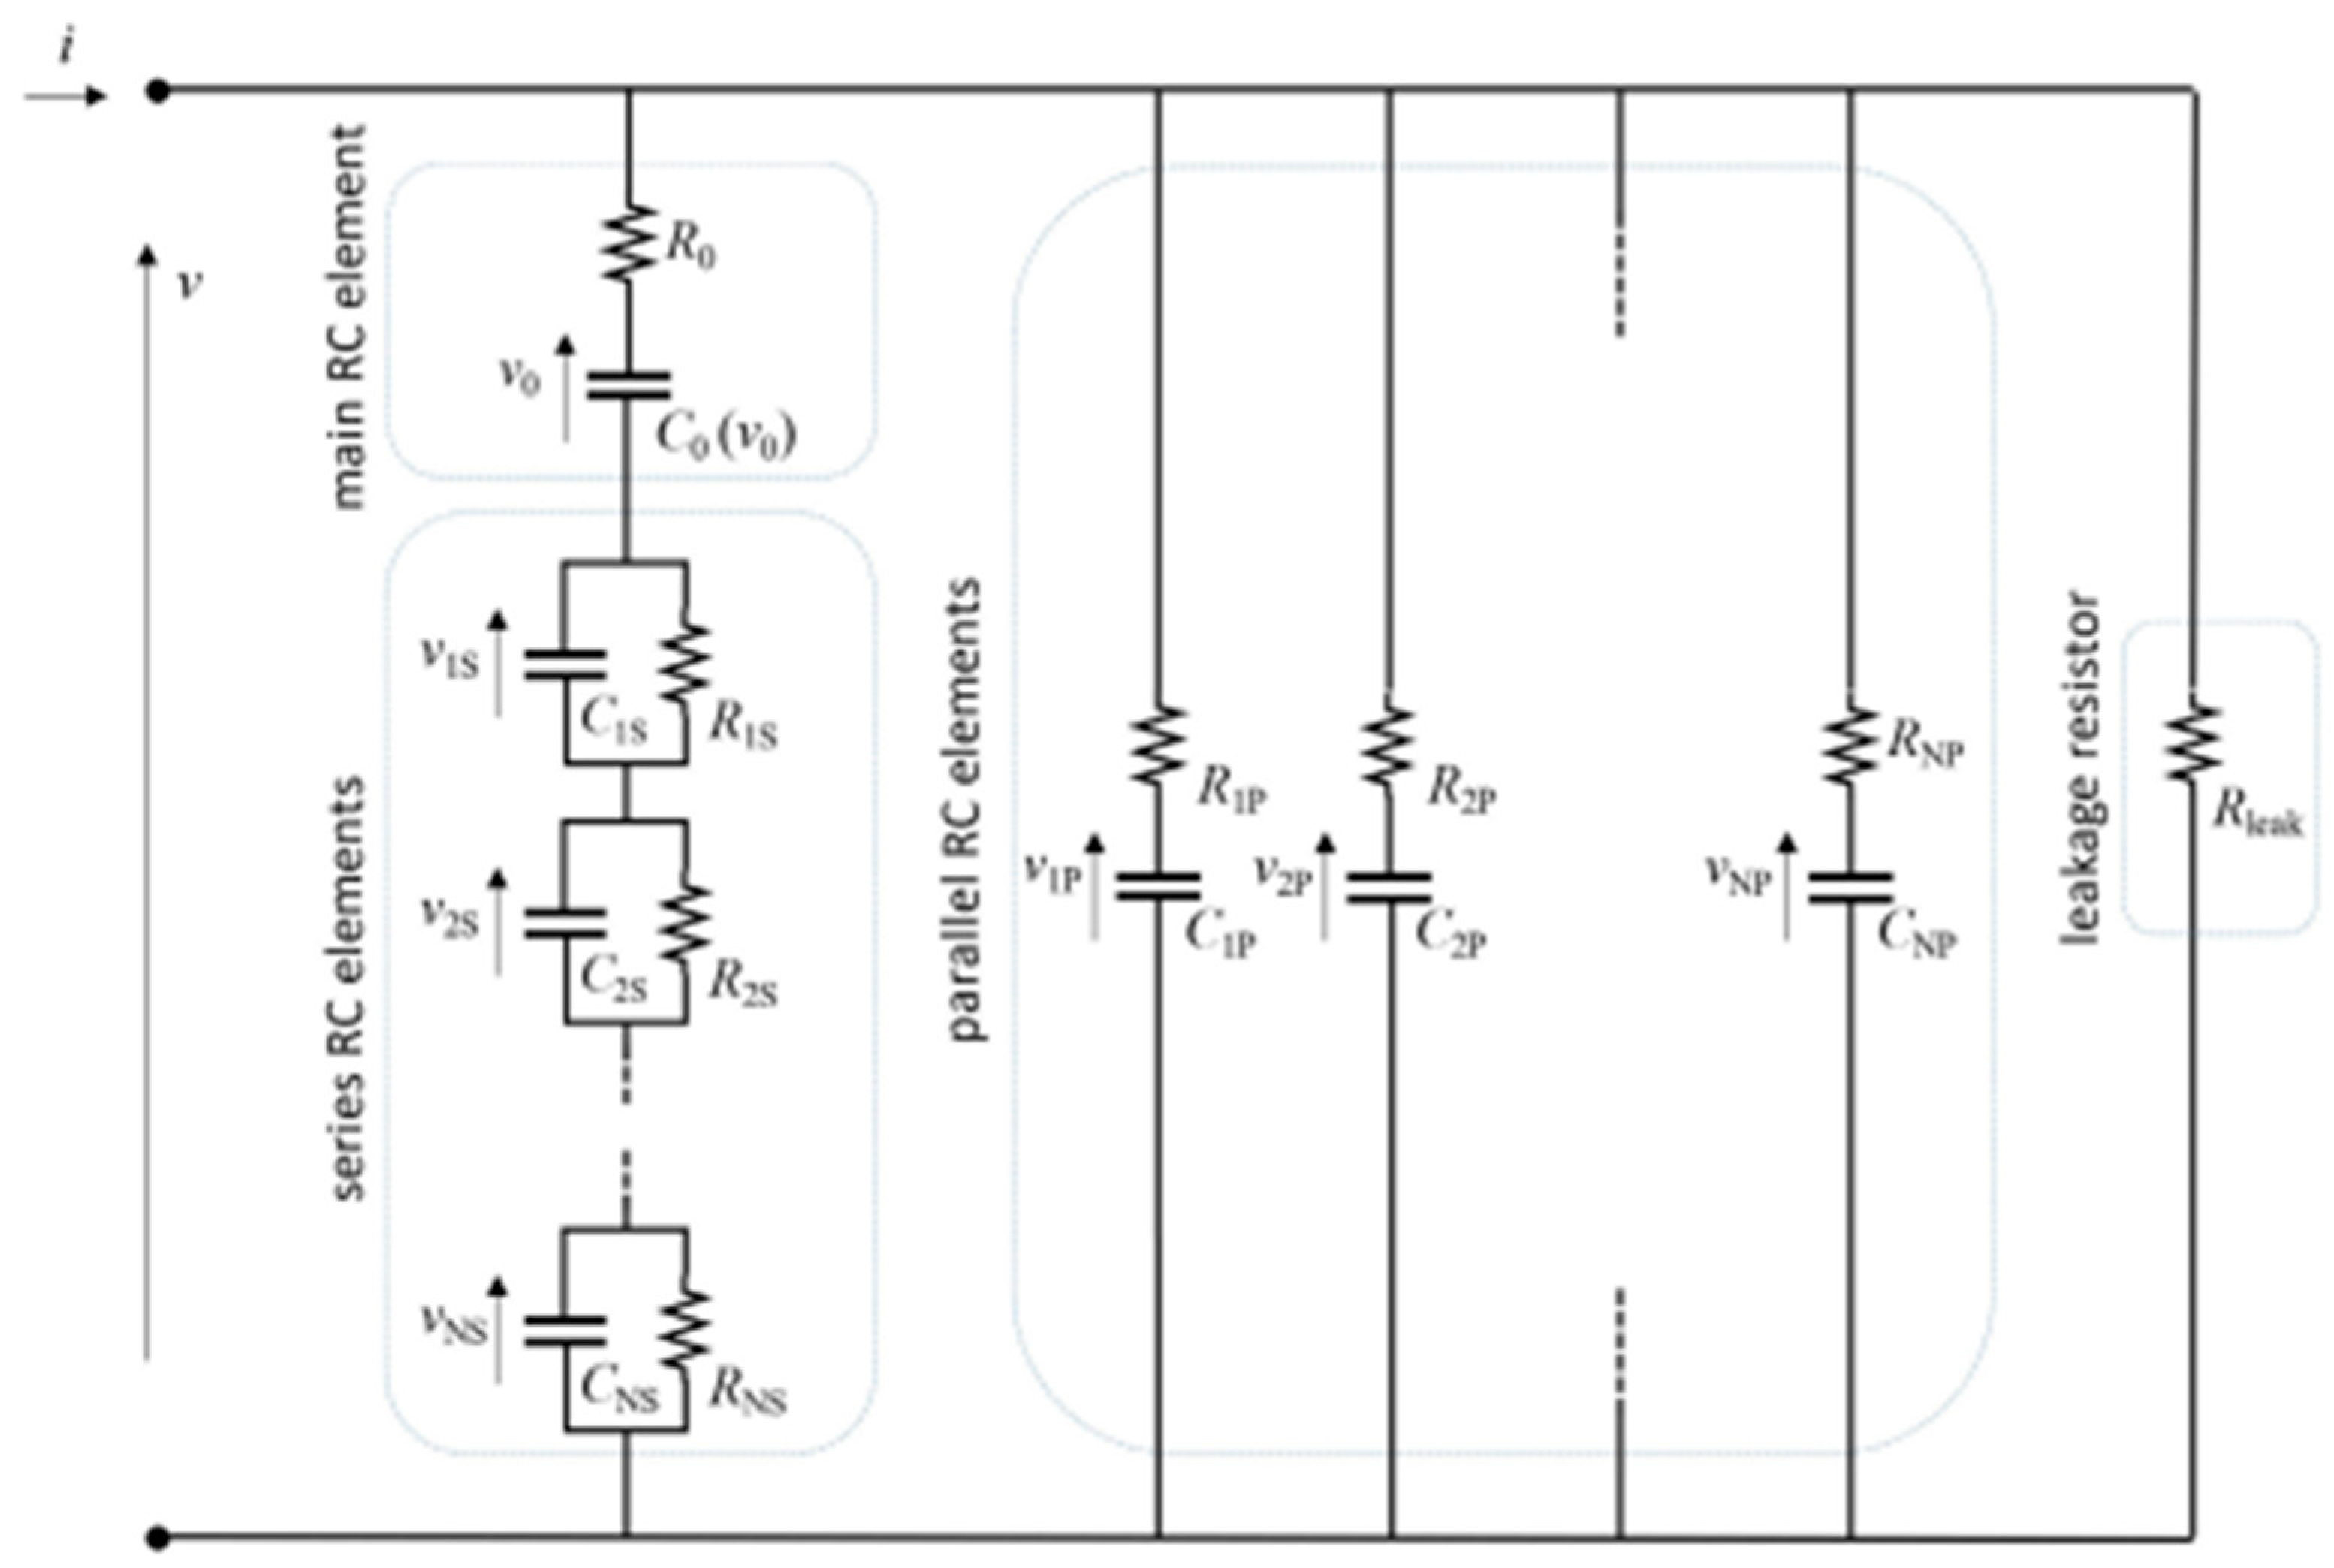
With regard to the supercap, most of the models proposed in the literature rely on the equivalent circuit shown in Figure 2 as a result of the combination of several models, including that of Zubieta and Bonert. The circuit consists of the following elements [9]:
- -
- The main RC element is an RC series element capable of capturing the main phenomenology of the cell; that is, the capacitive behavior and the strong voltage drop that corresponds to a power cut.
- -
- The capacitance C0 varies as a function of the voltage, assuming a nonlinear trend and described by the following expression:with Vr representing the nominal cell voltage and kv the slope of the capacitance, C0.
- -
- Series RC elements are RC elements connected in series with the main element that are able to produce fast current transients crucial to reproducing the rapid variation in the cell voltage. They also take into account the dependence of the equivalent resistance on the frequency. The greater the number of RC elements placed in series to R0C0, the greater the accuracy with which the transients are reproduced on a short time scale.
- -
- Parallel RC elements are RC elements arranged in parallel with respect to the first branch that are useful for acquiring slow transients and the non-ideal coulomb behavior of the cell. They have a negligible impact on high-frequency behaviors but a substantial impact on the short-term self-discharge behavior.
- -
- The leakage resistor is an element necessary to take into account the self-discharge behavior of the cell that occurs on a time scale of the order of weeks. In other words, it affects the long-term self-discharge characteristic without affecting the dynamic behavior of the cell.
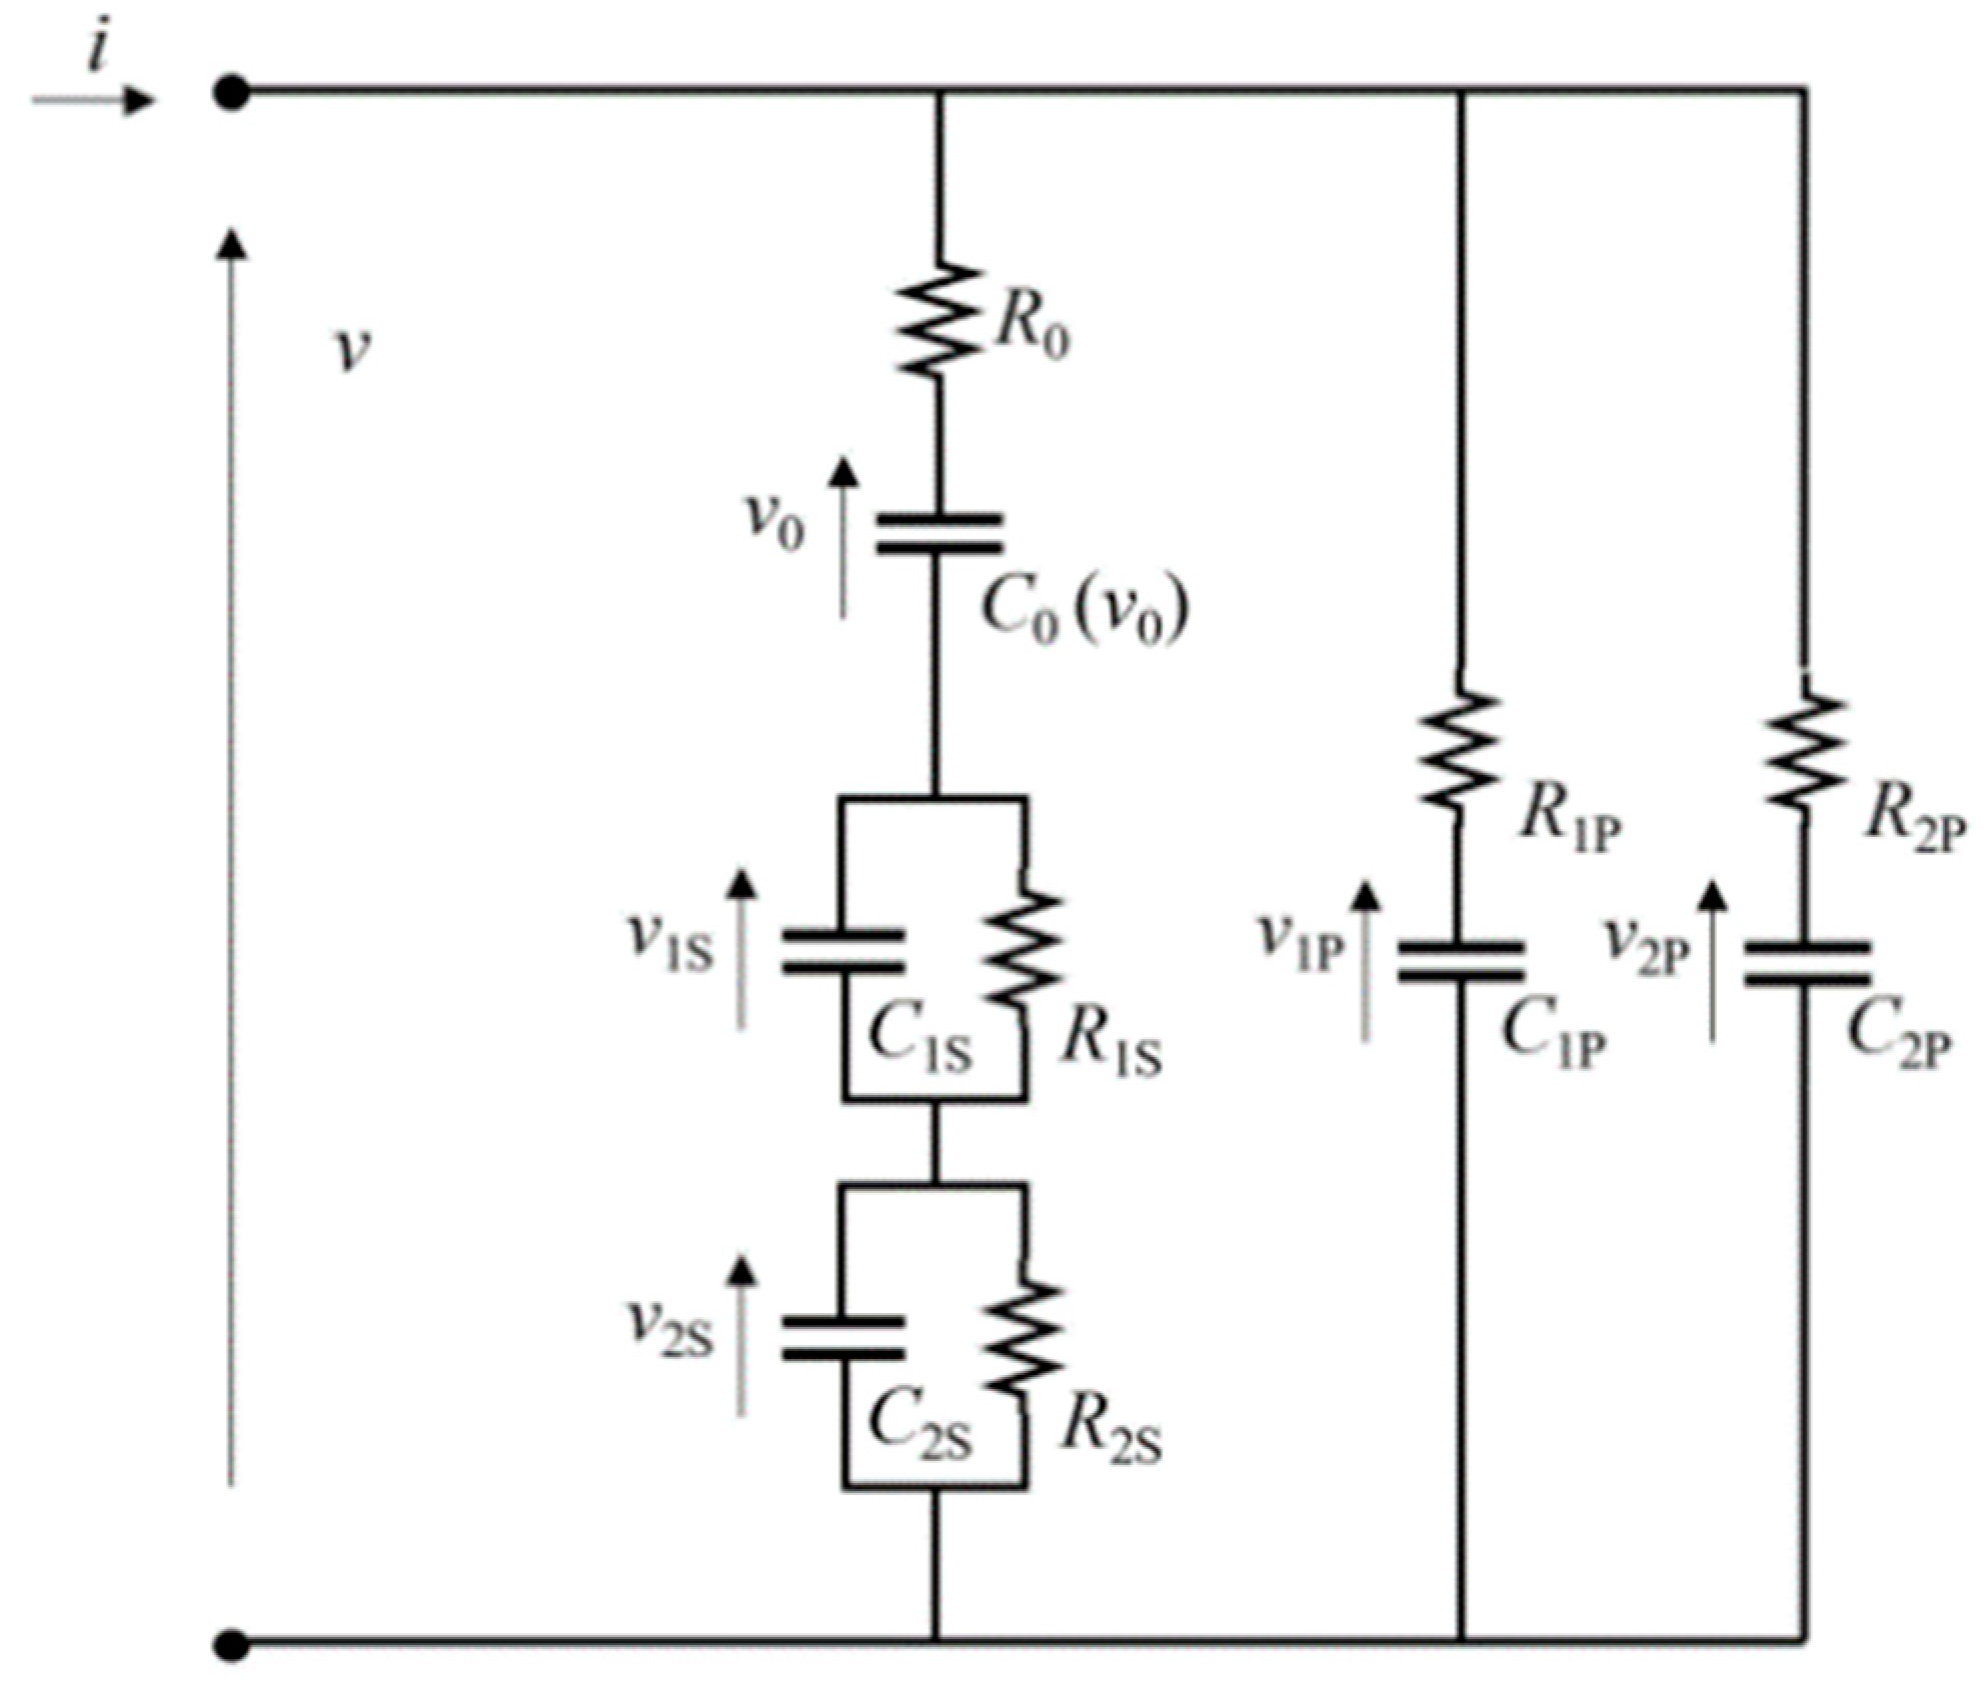
It is important to remember that a greater number of elements is useful for a greater accuracy of the simulated results compared with the experimental ones, but it makes the computational process more difficult; for this reason, a smaller number of elements was considered, obtaining a simplified equivalent circuit (Figure 3). In this circuit the leakage resistor is not taken into consideration because, in the specific case, the long-term behaviors can be neglected.
For the experimental characterization of the specific Li-ion cell considered, the following procedure was used [10]: first, the cell was charged at maximum voltage, then ten discharges at 1C-rate current (2.6 A) were performed for a time of 6 min each, followed by 1 h relaxation. For every relaxation, each element of the 3-RC equivalent model chosen for the simulation was empirically estimated. They were then entered into a Simulink model consisting of three modules:
- -
- A module for importing the parameters into the RC elements of the electrical circuit through 1D lookup tables;
- -
- A module for the comparison of the experimental and simulated voltage;
- -
- A module for estimating the state of charge of the cell. For its estimation the Coulomb counting method was used; it is quick, but not very accurate, and is based on the following expression:
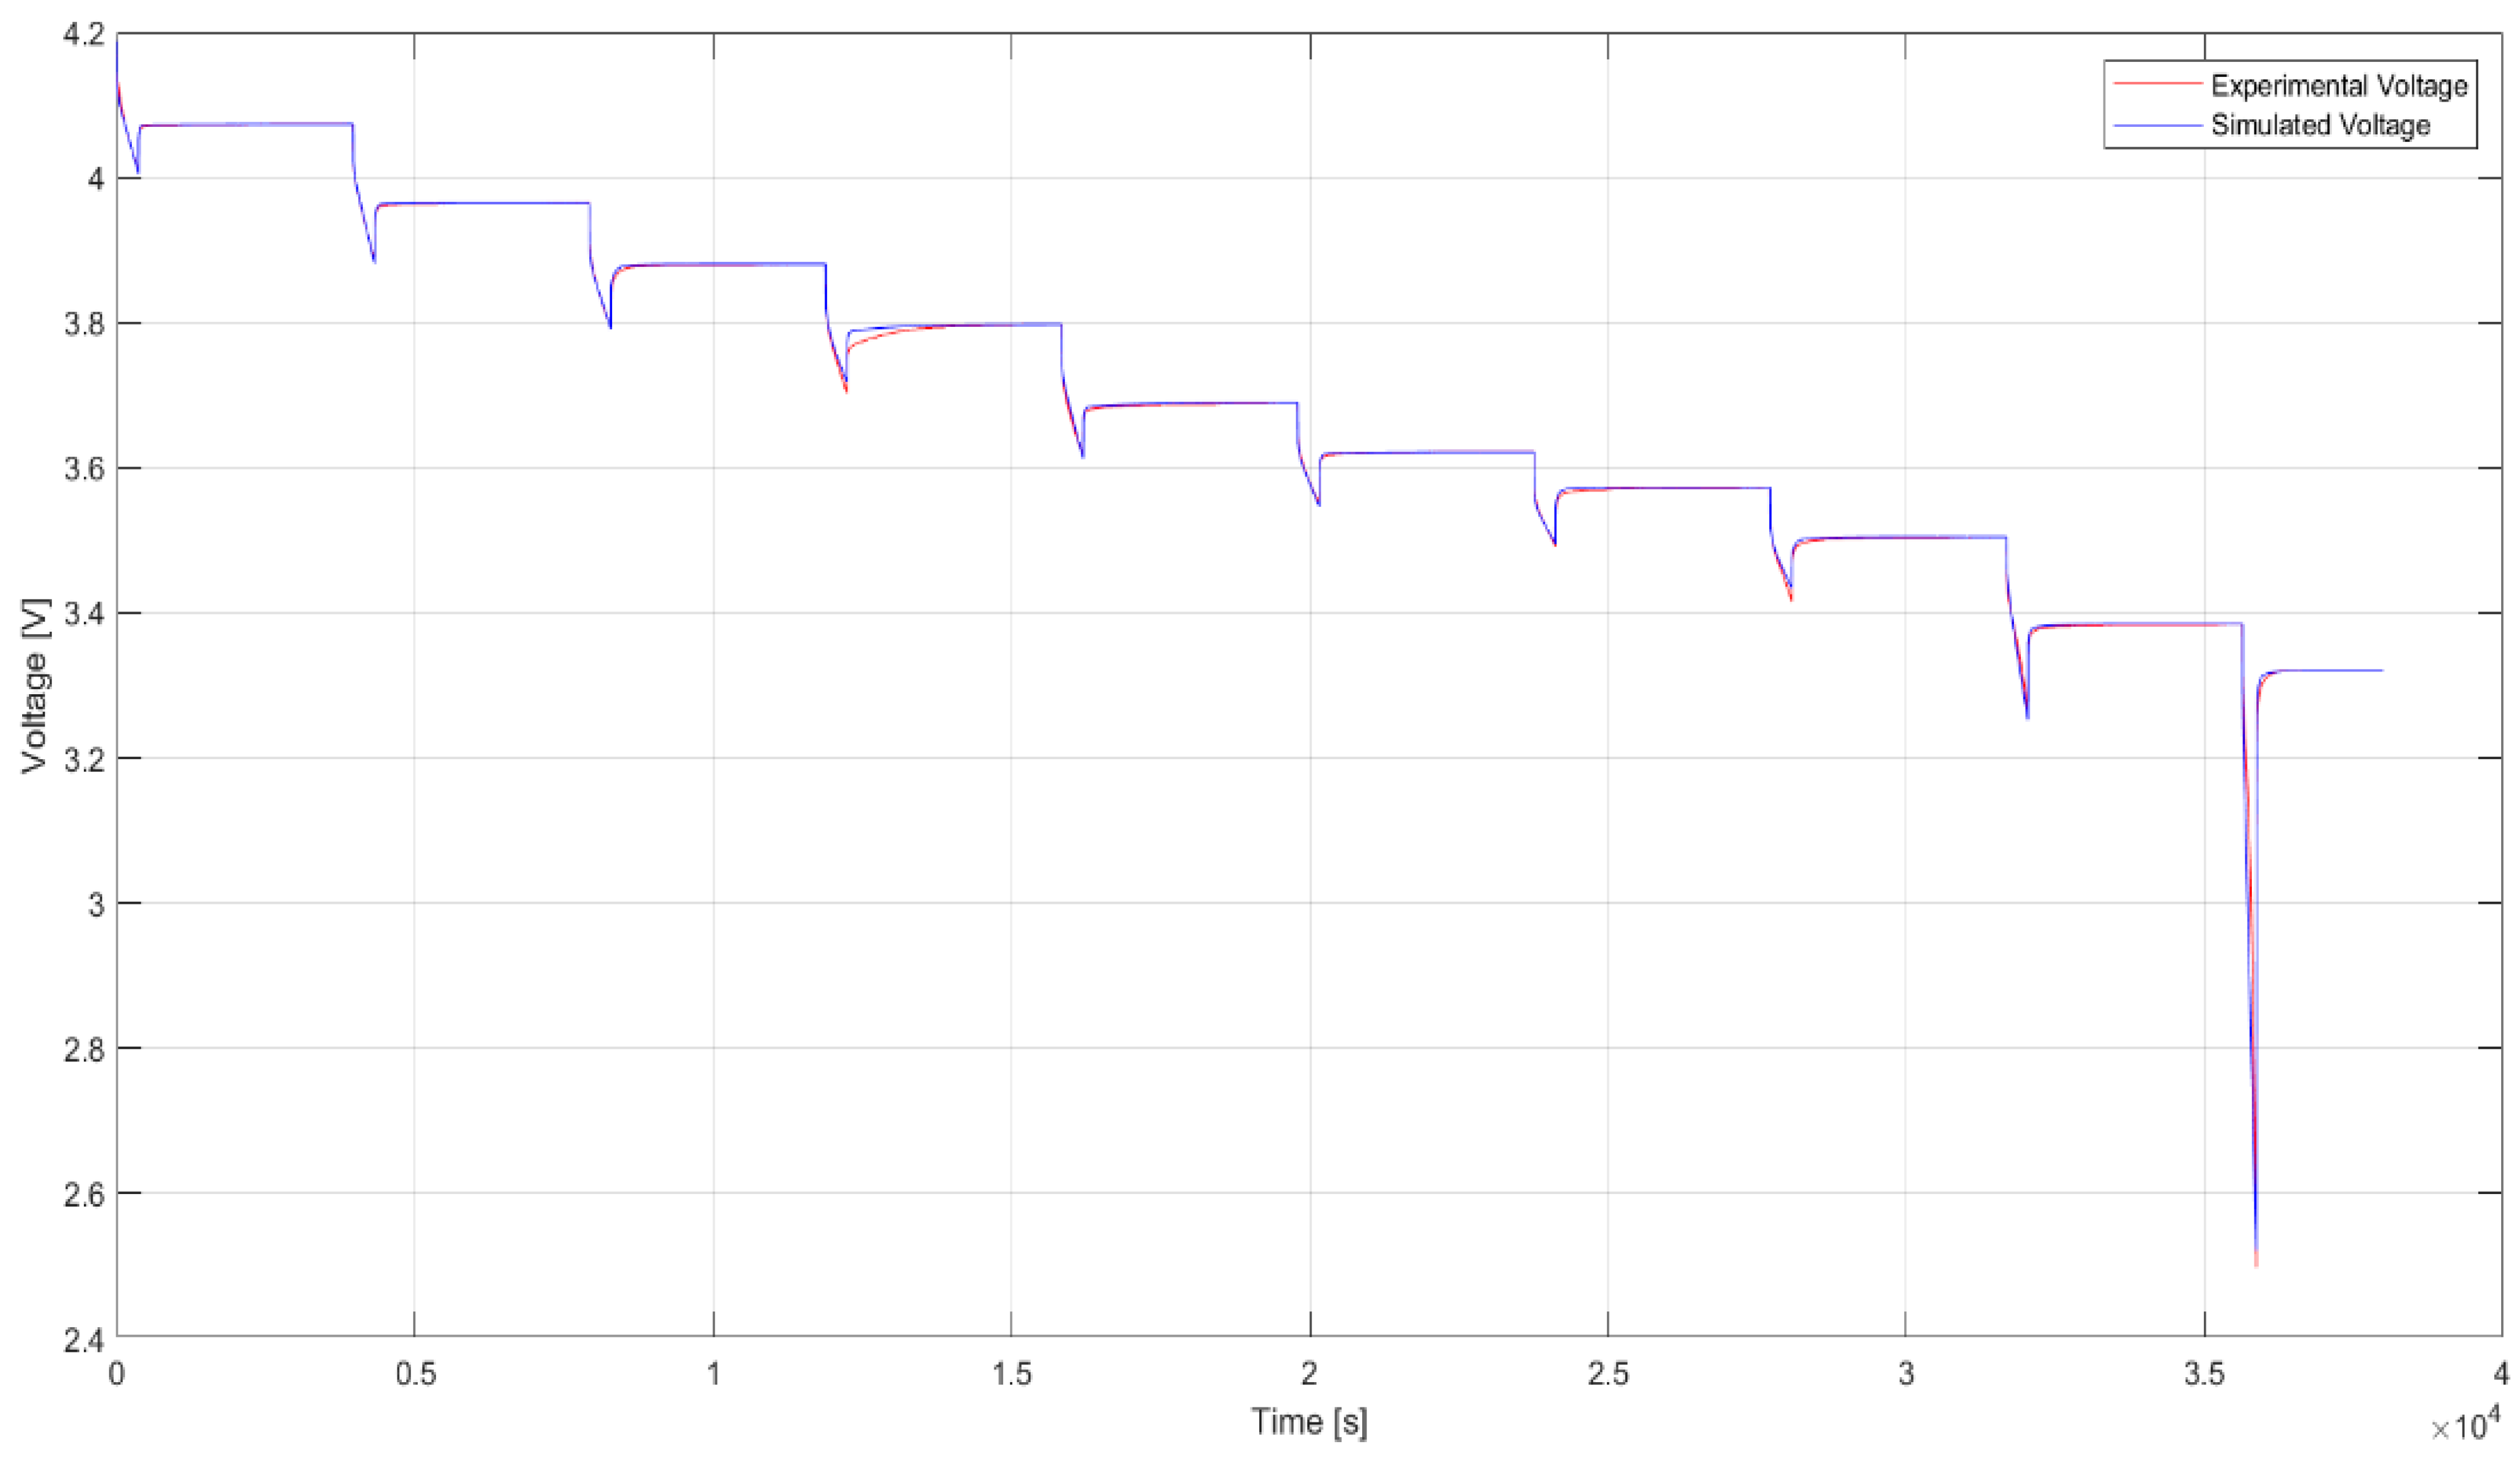
In general, the estimated parameters allowed us to accurately simulate the behavior of the cell both in discharge and in relaxation. The last discharge peak represents the end of the discharge, with the SOC near zero (Figure 4).
Unlike the procedure for the lithium cells, with regard to the equivalent electrical circuit for the supercapacitors, the parameters in the model were provided by the manufacturer.
3. Sizing and Assembly of the Mixed Storage
The vehicle considered for the Li-ion+supercap storage system under study is a plug-in vehicle with a front-mounted 1.5 L turbocharged spark ignition engine and hub-mounted electric engine in the rear. The combustion engine has 147 kW of maximum power and 320 Nm of maximum torque, while the 400 V electric drives can produce 90 kW each and 1250 Nm of maximum torque. In the actual prototype of the vehicle, the electric drives are supplied by a conventional Li-ion storage system with 9 kWh of energy; the work described here aims to investigate the possibility of replacing the car’s original storage system with a mixed-storage system with lithium-ion batteries and supercapacitors connected in direct parallel without the use of an intermediate DC/DC converter.
The choices for the sizing of the mixed lithium-ion battery and supercapacitor storage system were inspired first and foremost by the voltage and power compatibility of the new system with the original storage system of the vehicle in question; thus, 400 V as the nominal voltage and at least 180 kW as the maximum power.
As a further dimensioning criterion, it was decided to have an amount of energy equal to about half of the original storage system, in order to put more stress on the system during high-power charges and discharges. In this way, for the propulsion system considered, the specific power potential of the supercapacitors could be emphasized to a great extent. Thus, the innovative storage system studied had an energy of about 5 kWh and a nominal voltage of 400 V.
It is necessary, at this point, to define an initial hypothesis regarding the two parallel branches of which the system is composed; i.e., the one with lithium-ion batteries and the one with supercapacitors. In this first study, it was decided to choose an energy ratio between the two branches of 9:1. This choice was made on the basis of the supercapacitors available for the study, but it is obviously a parameter of fundamental importance, and other values of this parameter will be analyzed in subsequent works. It must be considered that, in both a PHEV and a fully electric vehicle, this parameter is also strongly influenced by the constraints of space, weight, and cost of the storage system.
Concerning the voltage of the two branches of the storage system, it must be considered that the absence of the DC/DC converter on one of the two branches (the lithium-ion batteries or supercapacitors) makes it essential to size the two branches with the same maximum voltage, in order not to risk an overvoltage condition on either the supercapacitors or the lithium-ion batteries.
For the final dimensioning of the storage system, the elementary cells with which to build the lithium-ion battery branch and the supercapacitor branch were identified. The chosen lithium-ion cell is made by the manufacturer E-One Moli Energy Corp, specifically the model INR-18650-P26A [11]; it is a cylindrical cell with good performance in terms of power (more than 10 C rate achievable) and good specific energy (190 Wh/kg). The chosen supercapacitor is made by SPSCAP, model 2R7STA [12]; it is a standard product with high power performance and very low internal resistance. In Table 1 some of their characteristics are reported.
The mixed-storage system with lithium-ion batteries and supercapacitors consists of a branch with supercapacitors in direct parallel with a branch with lithium-ion batteries. The supercapacitor branch uses the 2R7STA model and consists of 152 supercapacitors in series, and thus in a 152s1p configuration, and has a maximum voltage of 433 V (a single supercapacitor has a maximum voltage of 2.85 V) and a total energy of 460 Wh. The branch with the lithium-ion cells, in order to meet the same maximum voltage value as the supercapacitor branch, is composed of 102 elements in series, while the elements in parallel are defined on the basis of the previously defined assumption of maintaining a ratio of 9:1 between the energies of the two branches; a parallel of five cells is therefore obtained for the 2.6 Ah P26A cells, for a final configuration of the lithium-ion branch of 102s5p. The branch with the lithium-ion cells therefore has a maximum voltage of 428 V (a single cell has a maximum voltage of 4.2 V) and a total energy of 4770 Wh. In Table 2, the main specifications of the proposed storage system for the PHEV are reported.
It was decided, at this point, to experiment in the laboratory with a scaled-down storage system, compared with the one just defined, to be tested experimentally with a bidirectional electronic load with a high current (±450 A max.) and low voltage (max. 80 V) output, to allow high-current tests compatible with the available laboratory facilities. The number of cells in series was reduced, maintaining the same ratio (9:1) between the energies of the two branches of the storage system. On the basis of the available accumulators, it was decided to create the parallel of a lithium-ion cell pack in 2s4p configuration and a supercap pack in 3s1p configuration, with the following energy results (Table 3):
By calculating the internal resistances for several configurations, it was possible to confirm the assumed sizing; in fact, the ratio for the 2s4p case is equal to 11.5:1, rather close to the claimed target. The resistance values used in the calculation are 20 mΩ for the battery and 0.29 mΩ for the supercap, respectively.
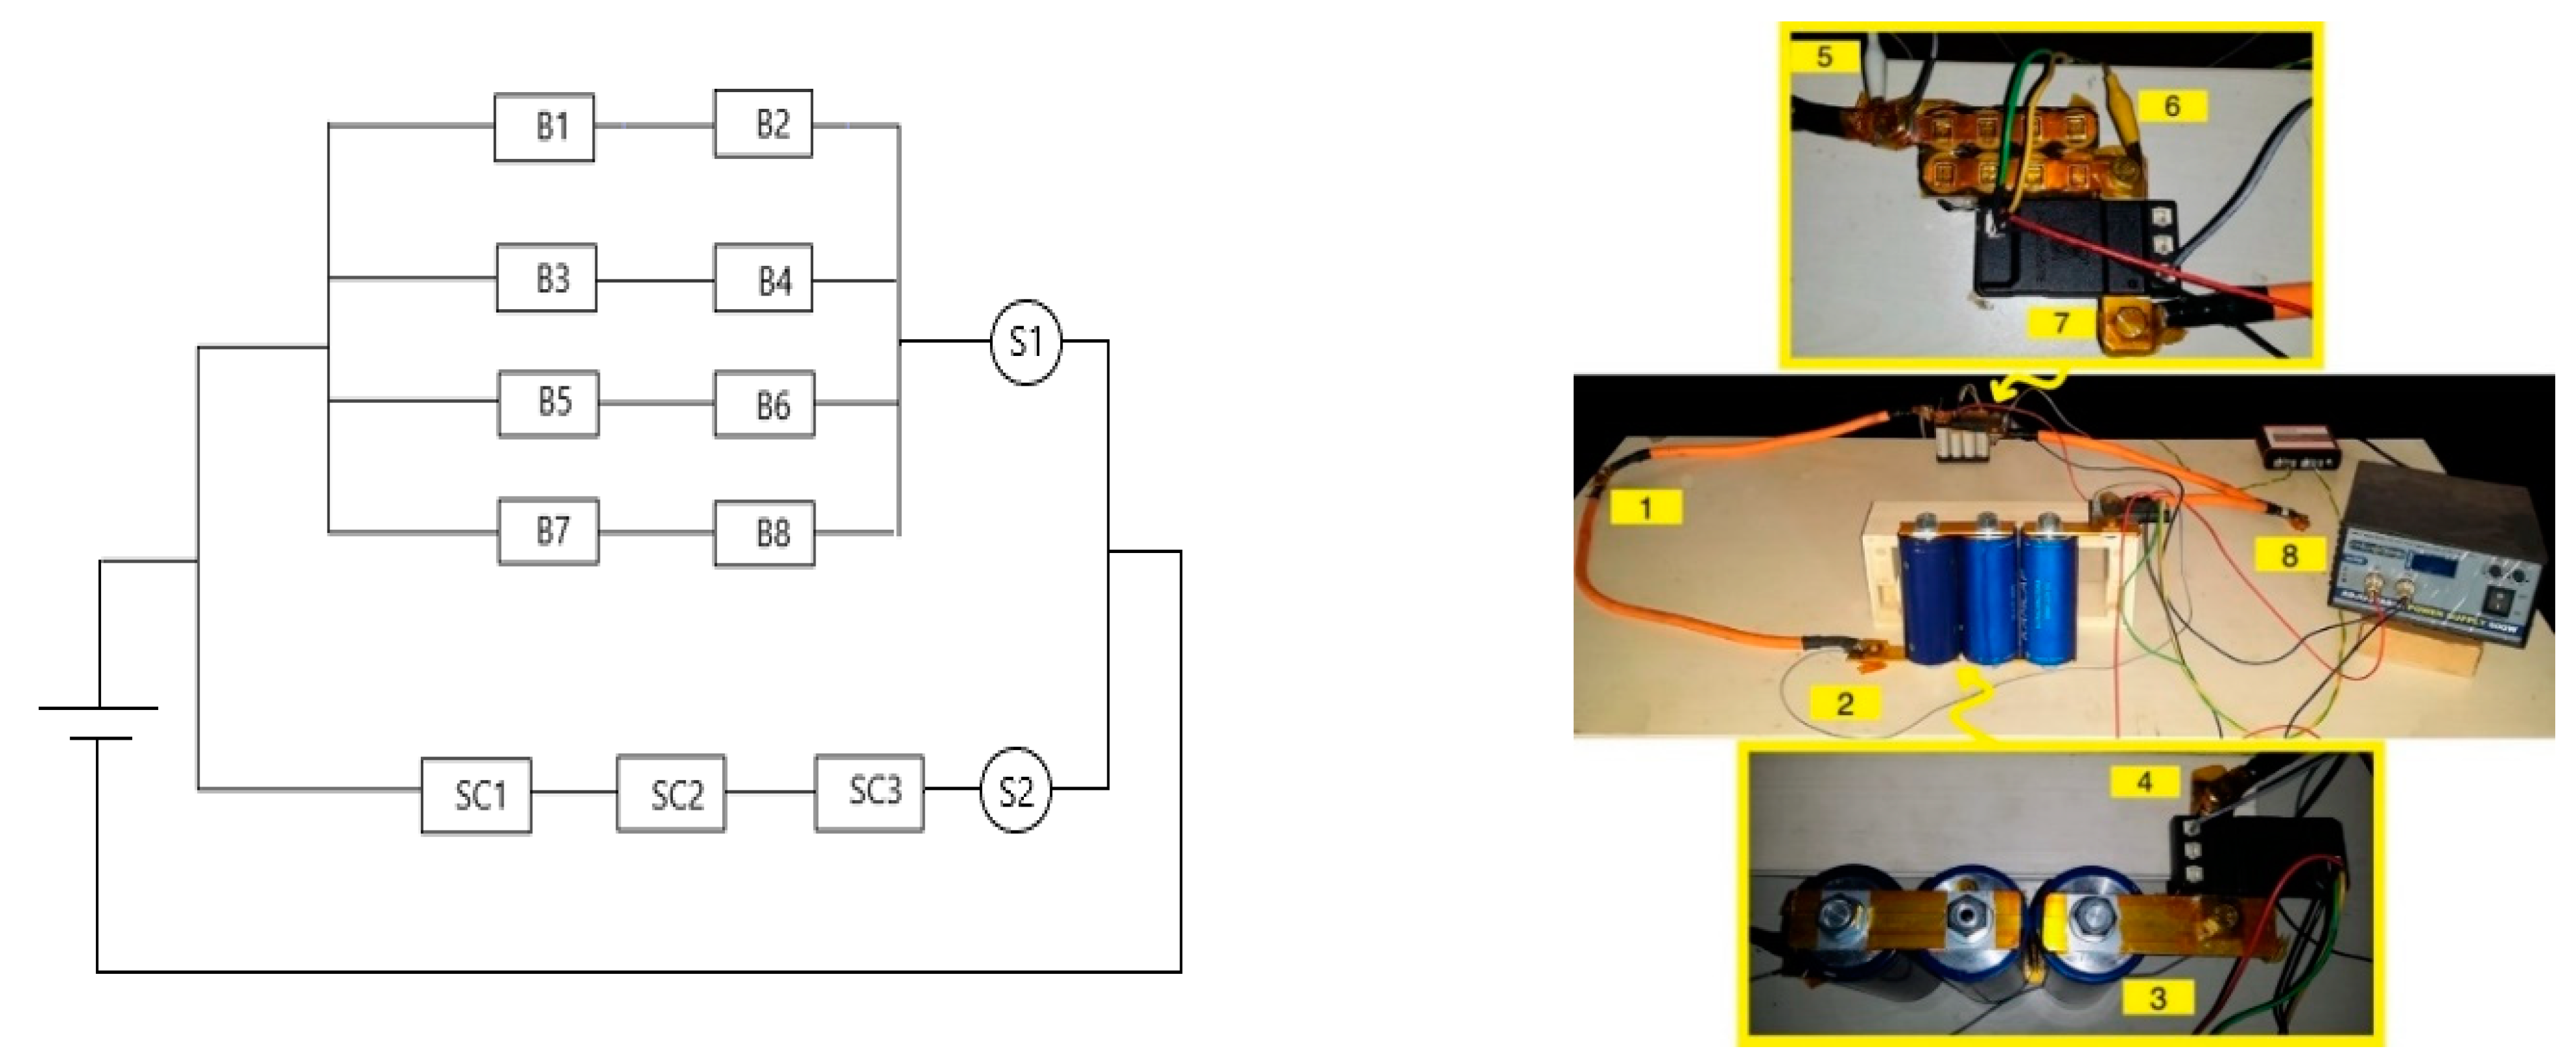
The assembly can be summarized through the following points, shown in Figure 5:
- Positive pole of the electric parallel, obtained by overlaying the power cables at the input of the two packs and the input of the load (1 in Figure 5).
- Connection of the power cable with the positive pole of the SC series (2 in Figure 5).
- Fixing of the positive pole of the shunt with the negative pole of the SC series and of the negative pole of the shunt with the power cable that closes the first branch of the electrical parallel (3, 4 in Figure 5).
- Junction of the power cable with the positive pole of the battery pack (5 in Figure 5).
- Anchoring of the positive pole of the shunt with the negative pole of the battery pack and of the negative pole of the shunt with the power cable that closes the other branch of the electrical parallel (6, 7 in Figure 5).
- Negative pole of the parallel, obtained by superimposing the power cables coming out of the two packs and that of the load (8 in Figure 5).
Shunt-based measurement devices were chosen to acquire current and voltage measurements and were placed downstream of each pack.
4. Mixed-Storage Model and Simulation Results
A simulation model of the direct parallel between the lithium-ion cells, arranged according to the 2s4p scheme, and the supercaps, arranged according to the 3s1p scheme, has been realised; this was used for both single discharge and cycle simulations, each time sending a different current profile as input.
This Simulink model consists of several modules:
- -
- A main circuit, mirroring the scheme assumed in the experimental test, with current and voltage sensors downstream of the two packs. A 0.5 10−4 Ω resistor is interposed between the cells to model the energy losses related to the several junctions.
- -
- A series of “Scopes” and “ToWorkspace” for the comparison of experimental and simulated currents/voltages/powers both on Simulink and on different MATLAB scripts.
- -
- A module for estimating the state of charge of the lithium-ion cell.
Based on the battery parameters evaluated using the Simulink model presented in Figure 3, current discharges of −50 A, −100 A, and −140 A for very short time intervals (1, 3, and 5 s) were performed with the mixed-storage simulation model in order to evaluate the distribution of current in the branches; in other words, the percentage of current delivered by the individual packs both in the initial discharge transient and in the subsequent instants were calculated with the simulation model. Later, experimental tests were used to validate these simulations.
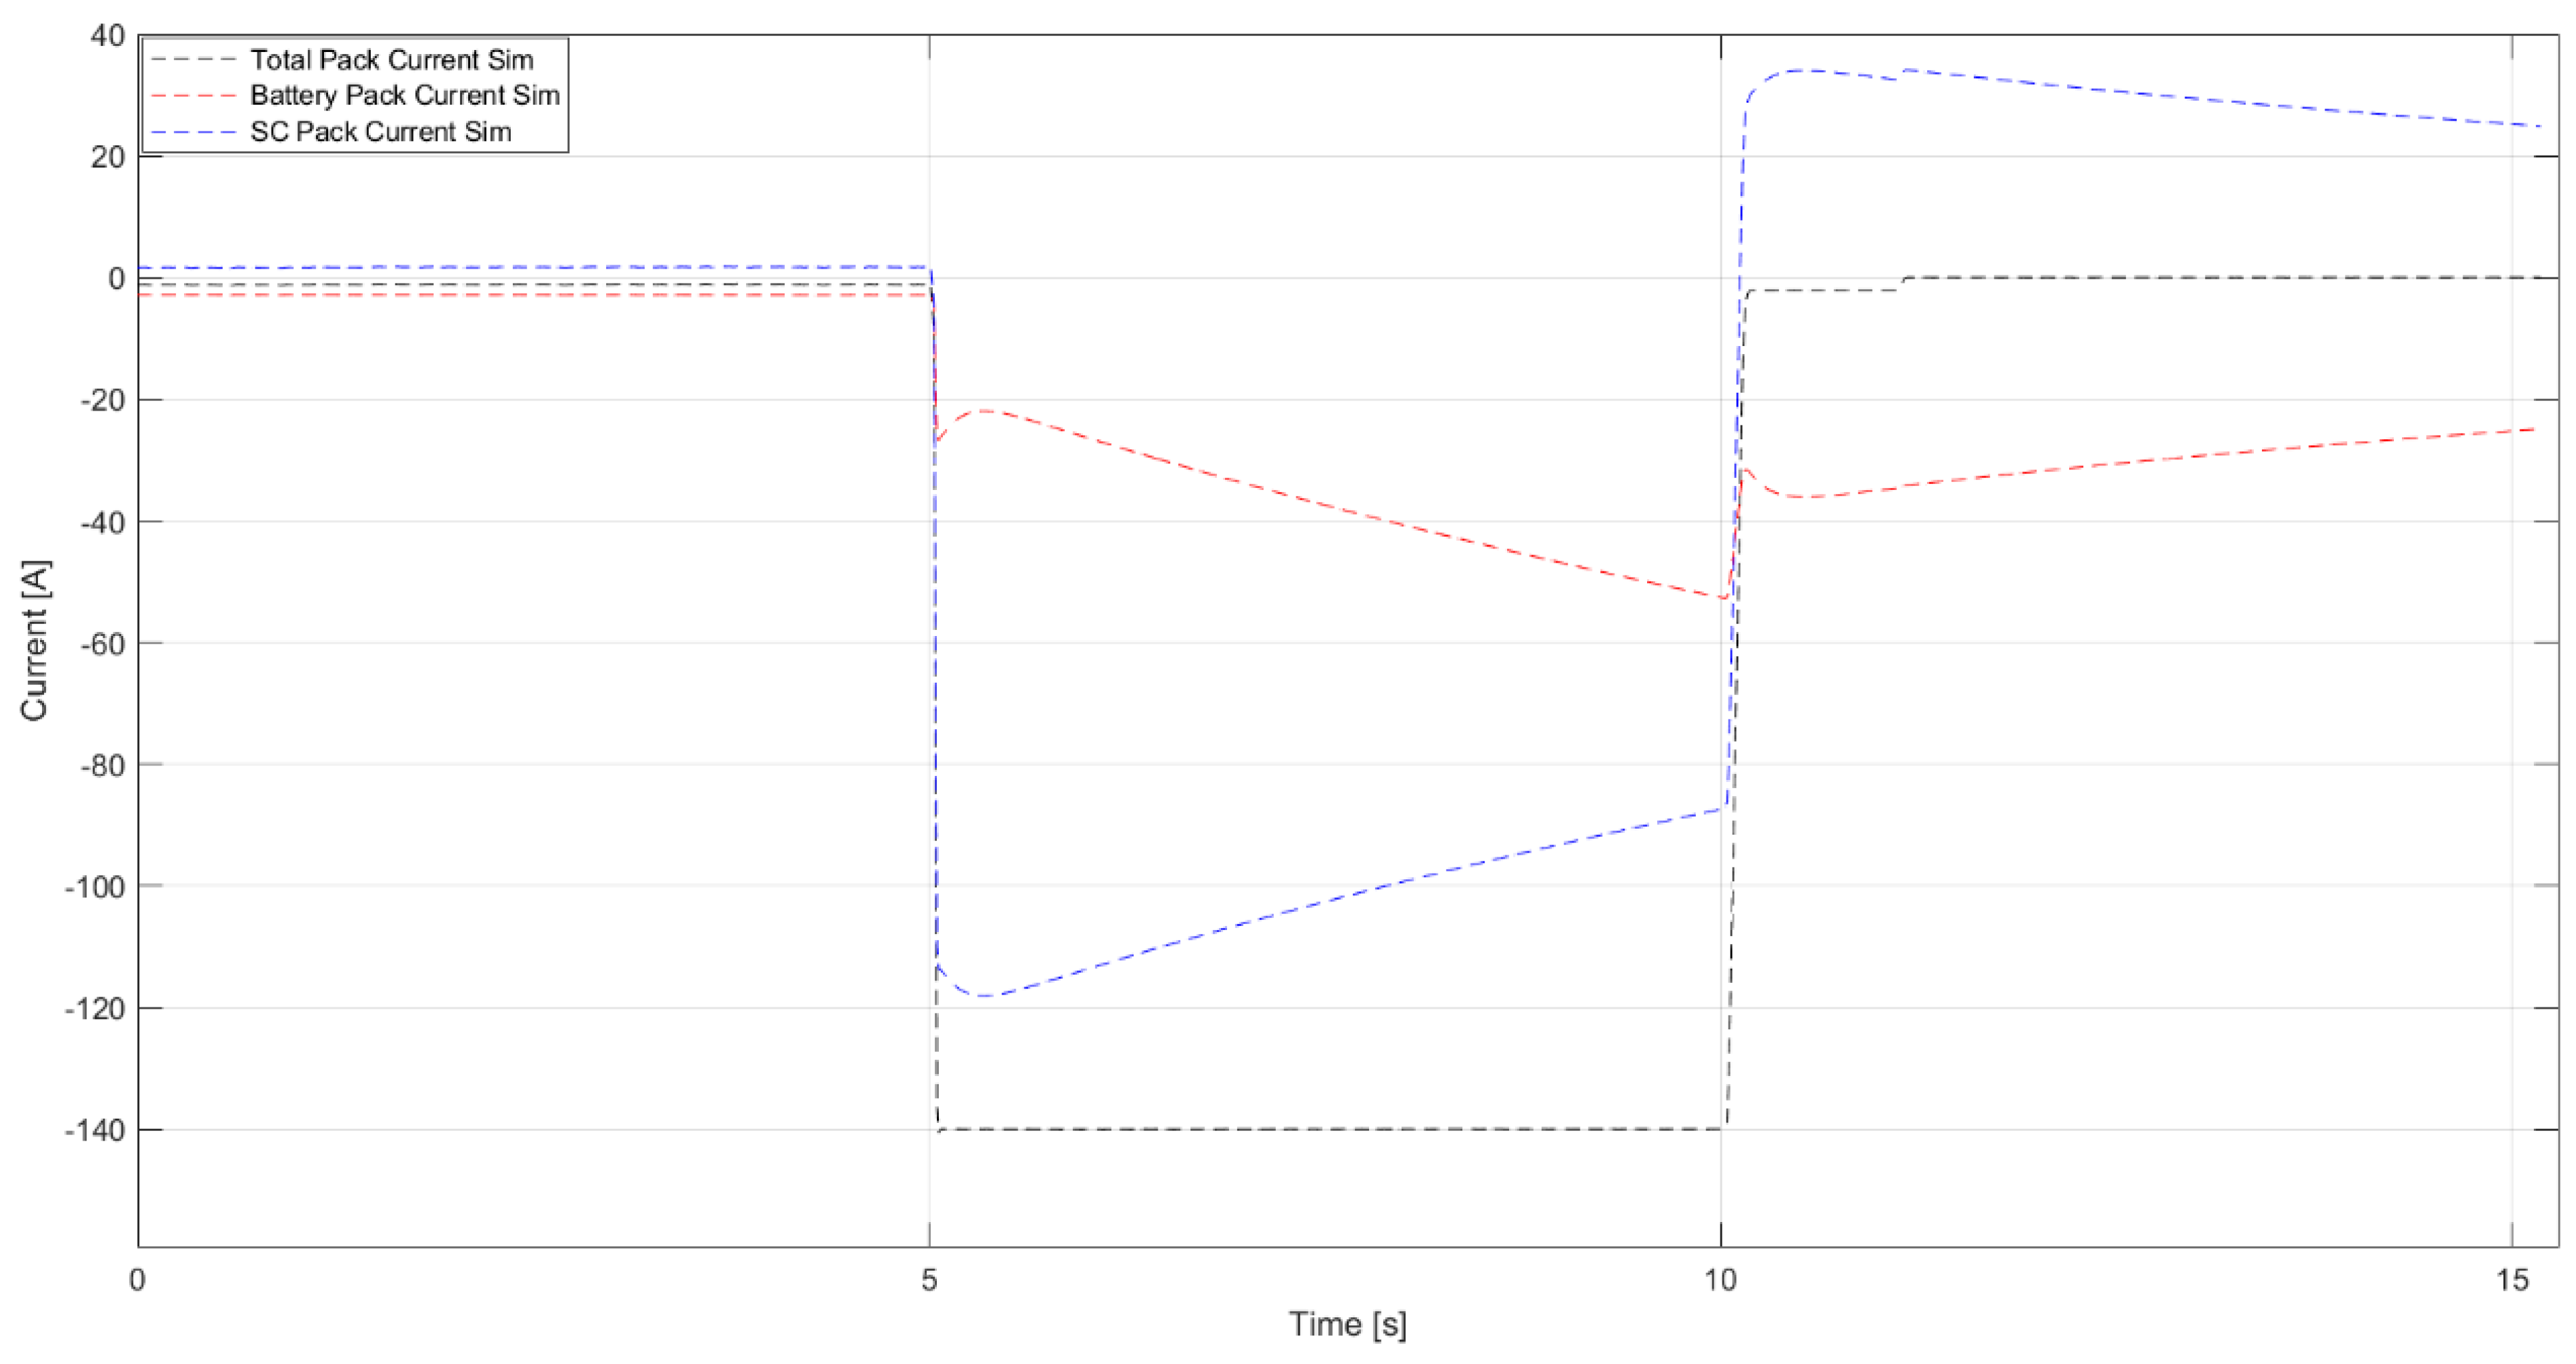
These first tests allowed us to evaluate the behavior of the storage in favor of safety; in fact, assuming that all the current was supplied by the Li-ion cells, the limit of −35 A per cell would not be exceeded (that is, −140 A overall). In Figure 6 and Figure 7 are shown the current and voltage trends for the single-discharge simulation test at −140 A for 5 s, considering that the results obtained in the other tests show similar behavior and that the theoretical current limit assumed for the battery pack is precisely the one entered in the model through a signal builder block.
At the beginning of the discharge, the current distribution is −113 A on the SC (81%) and −26 A on the cells (19%), while at the end it becomes −86 A (62%) and −53 A (38%), respectively. This means that the −140 A limit of the lithium-ion cells is far away and it is possible to repeat the test with higher currents.
It should be noted that, in both the initial part and the final part of the discharge transient, the current profile of the battery pack shows a discontinuous trend; i.e., it reaches an initial maximum value (in module), then instantly decreases, and finally assumes a linear decreasing trend. This behavior, as discussed in Section 5, is not present in the experimental results, where the linear decreasing trend starts immediately. This could be attributed to the resistance of the power cables, busbars, shunts, and various assemblies, for which the real resistance and capacitance values to be included in the model were not evaluated. Moreover, the chosen discharge time does not allow us to observe it, but in the long run, current trends would have reversed, meaning a higher supply from the battery pack.
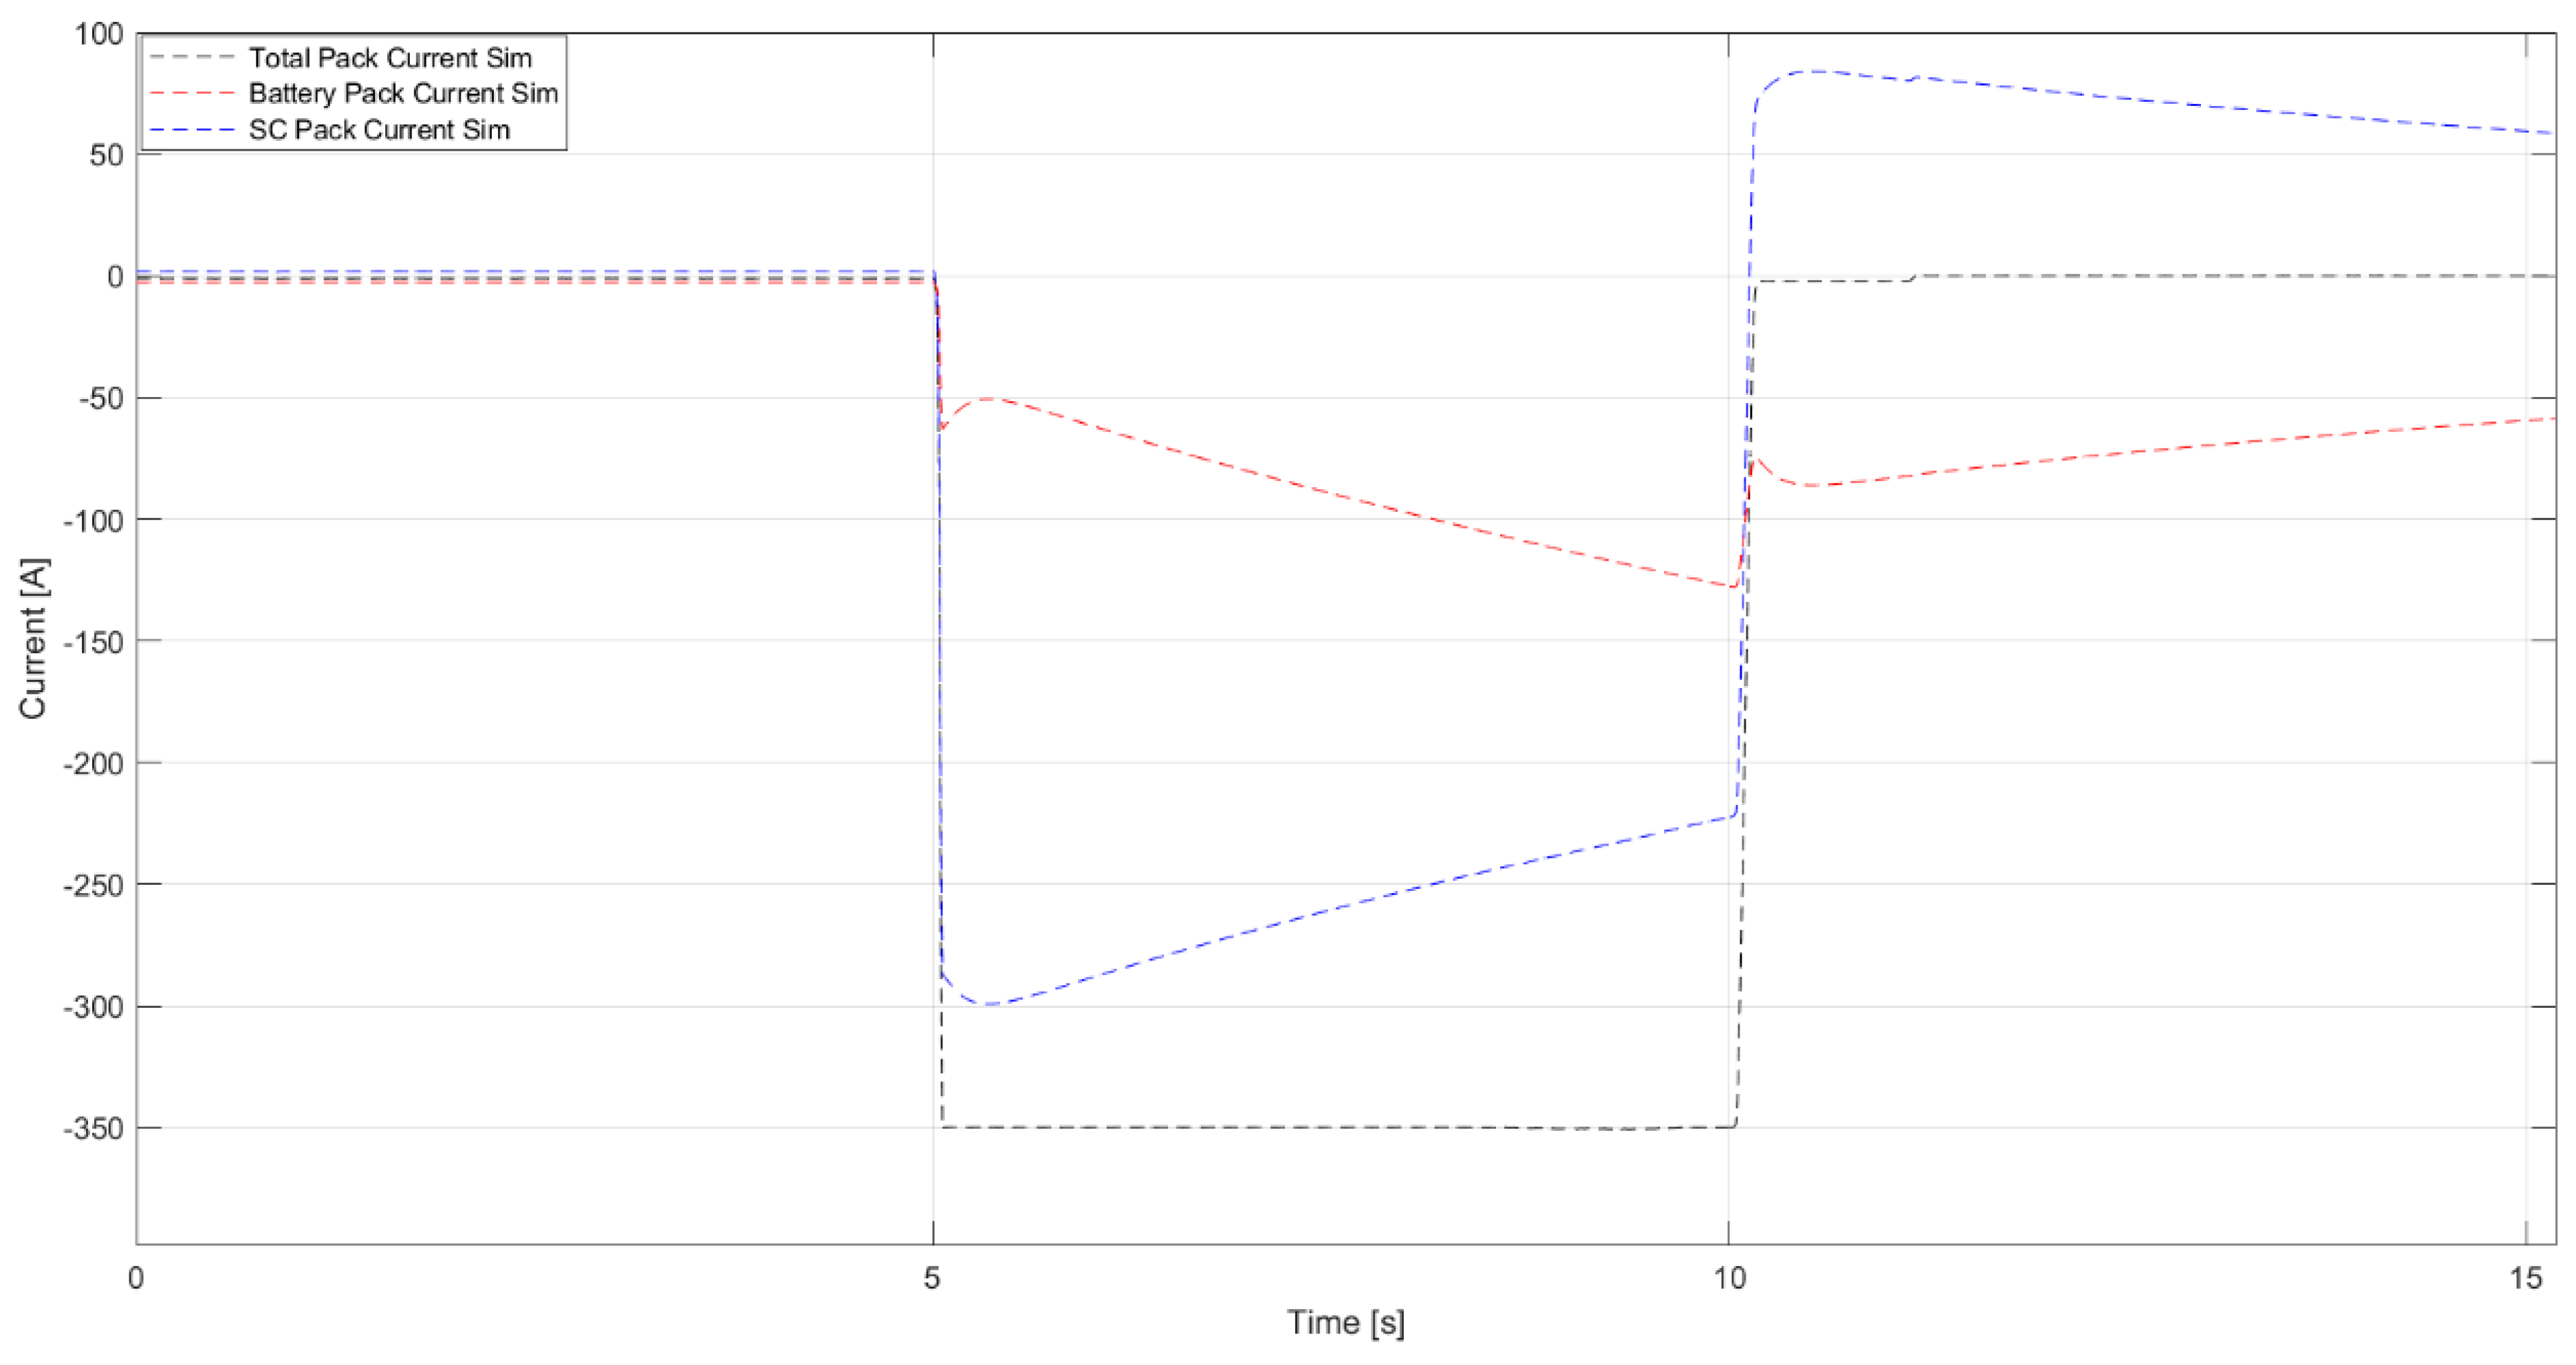
The simulated current profile of the −350 A, 5 s test is shown in Figure 7; it is possible to observe that, regardless of the test current intensity, at the start of the discharge the current delivered by the SCs oscillates between 81 and 82% and, consequently, the battery cells deliver the remaining 18–19%, a current distribution that is a direct consequence of the resistance of the two branches.
The next phase of the analysis consisted of simulating the behavior of both the mixed storage and the isolated battery pack with a current profile calculated for the driving cycle, the WLTP, with the necessary reduction in scale.
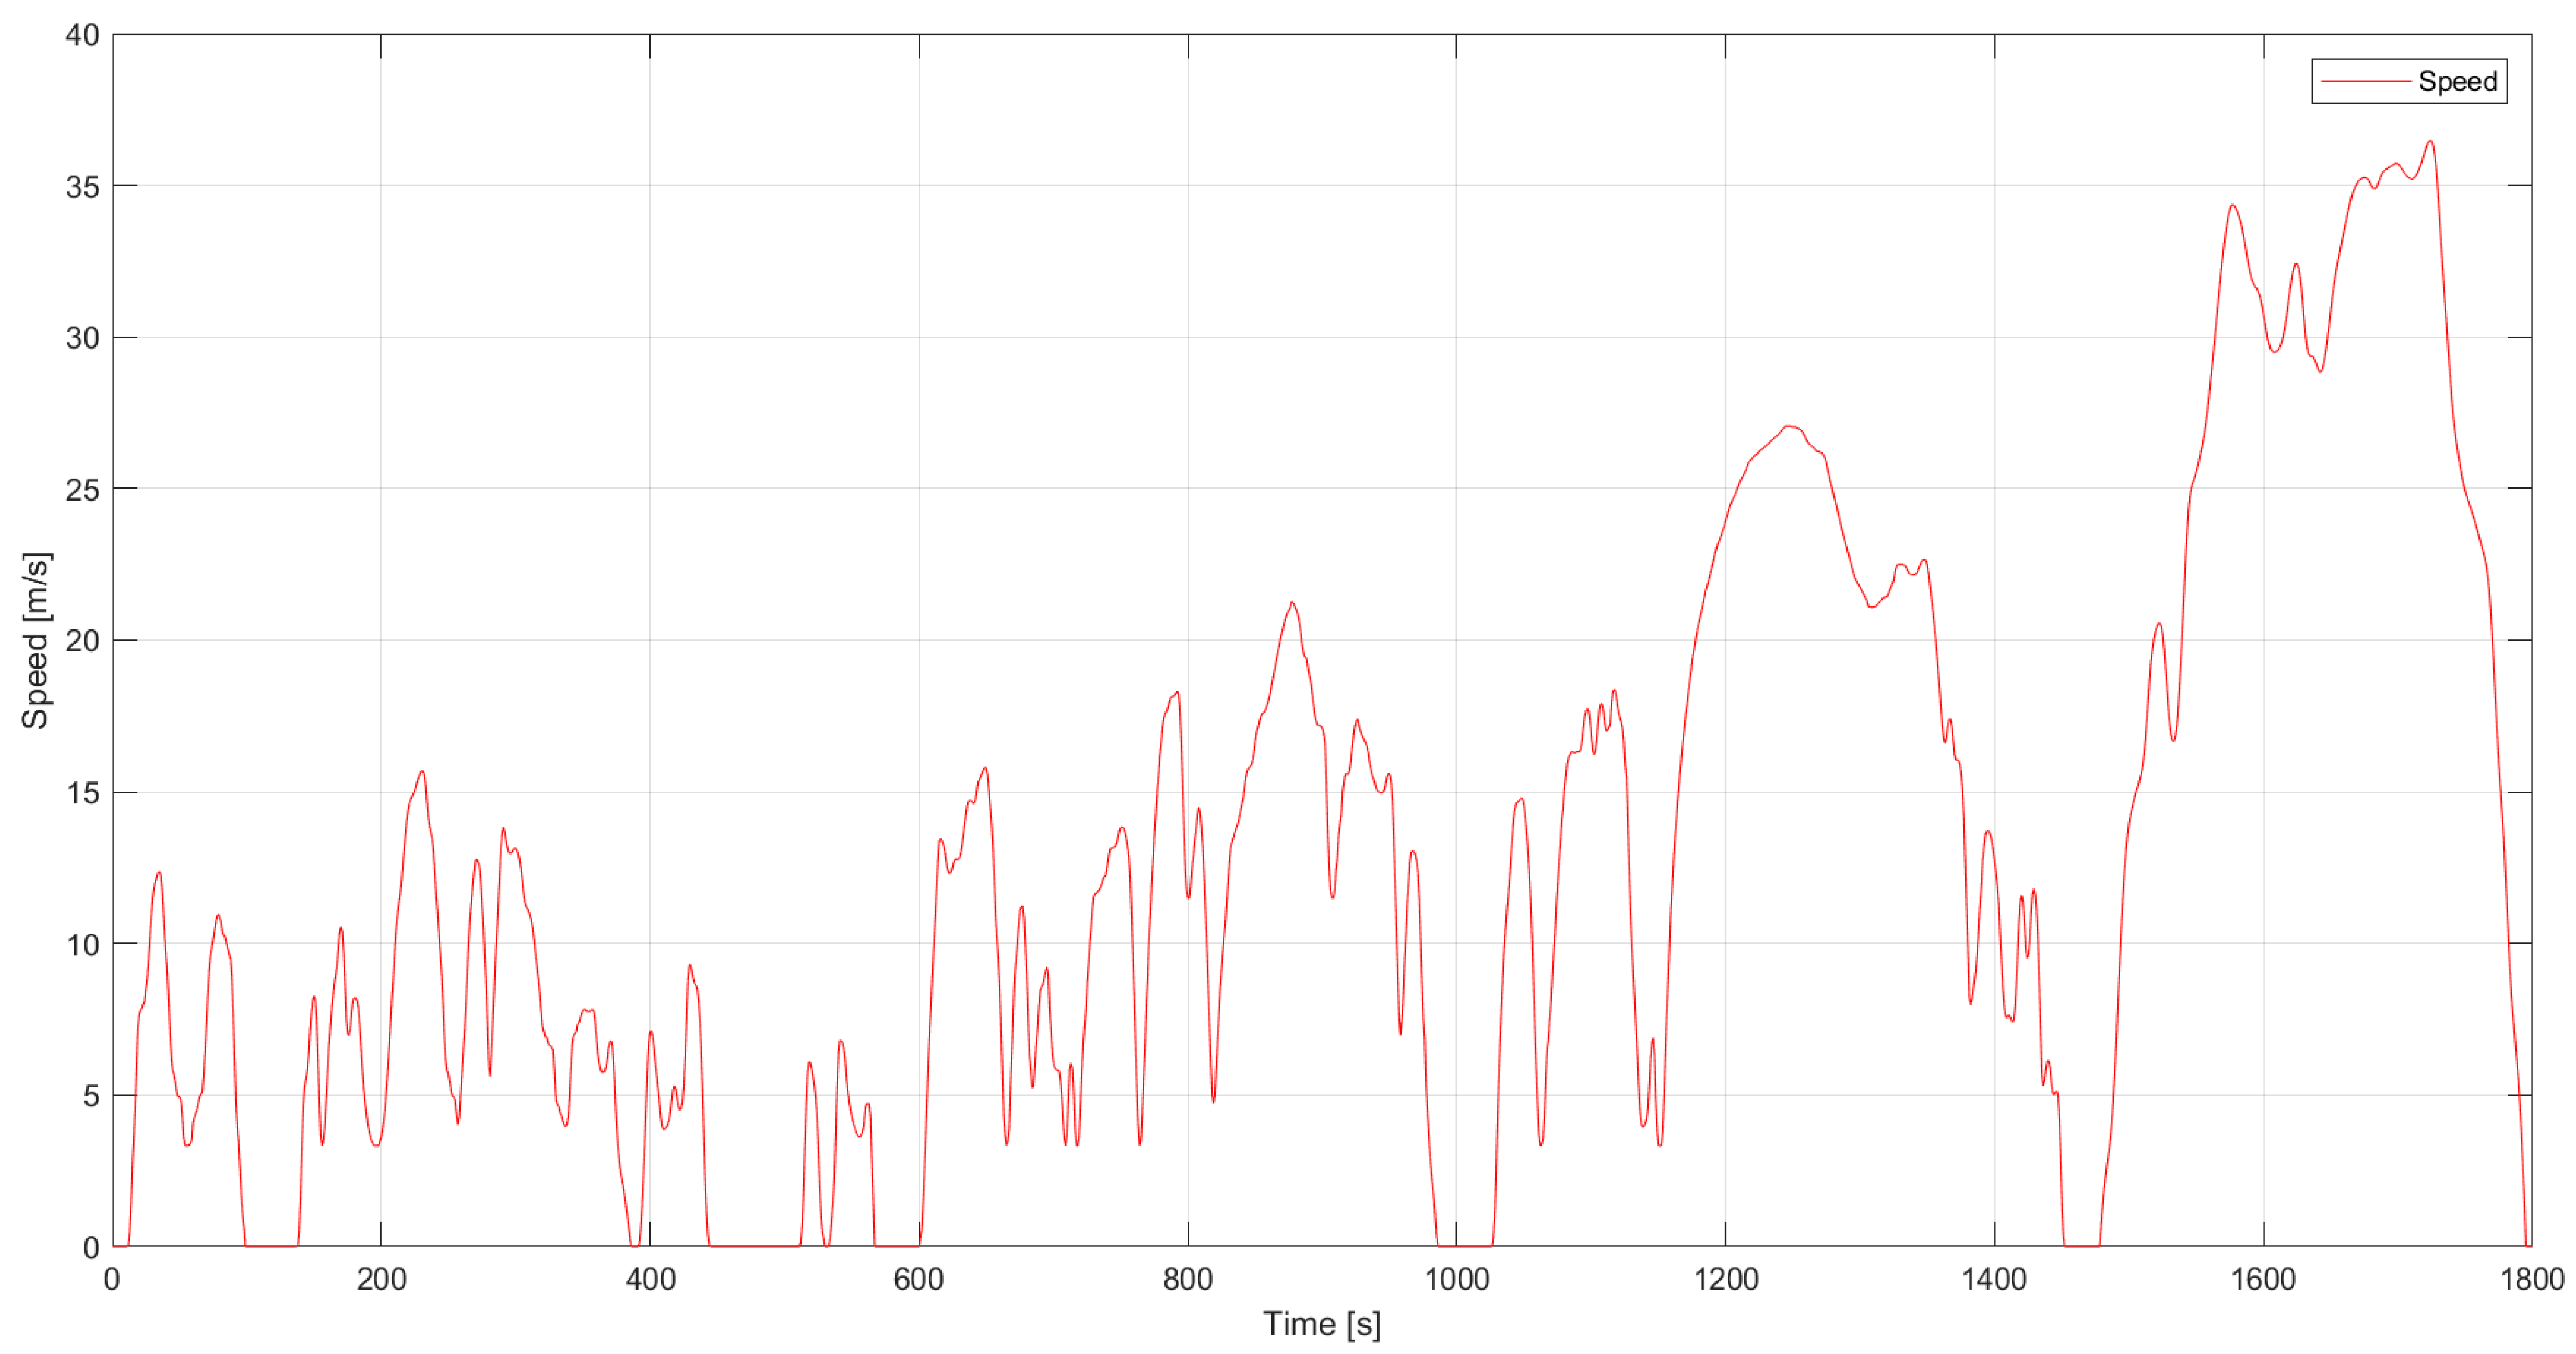
Concerning the WLTP cycle, we can distinguish three different types of tests. Having defined the power (kW) of the vehicle and its mass (tons), we can express their ratio (PWr) and select the belonging class:
- Class 1: PWr ≤ 22;
- Class 2: 22 ≤ PWr ≤ 34;
- Class 3: PWr > 34.
The vehicle used in this work belongs to Class 3, and the speed profile is reported in Figure 8.
The instantaneous propulsive power needed by the vehicle for traction on the drive wheels includes rolling resistance, aerodynamic drag, acceleration inertial force, and slope resistance, and can be expressed as:
- M = 1280 kg, vehicle mass
- v, speed [m/s]
- g, gravity acceleration [m/s2]
- fr = 0.015, rolling factor
- ρa = 1.225 kg/m3, air density
- Cd = 0.28, drag coefficient
- Af = 2 m2, frontal area of the vehicle
- δ = 0.01, rotational inertia factor
- dv/dt, acceleration [m/s2]
- i = 0, slope (assuming no slope)
The maximum power reached during the cycle was about 43 kW, while the average power was equal to 5.4 kW and the total energy deployed was 2.7 kWh, knowing that the cycle lasts 30 min. The mixed storage was sized with respect to the battery pack alone because the test was repeated twice: a first run, in which the two packs were arranged in parallel, and a second run, in which the supercap pack was not present, all to evaluate the range of current reached in the two tests and how much the presence of the supercaps benefitted the battery pack.
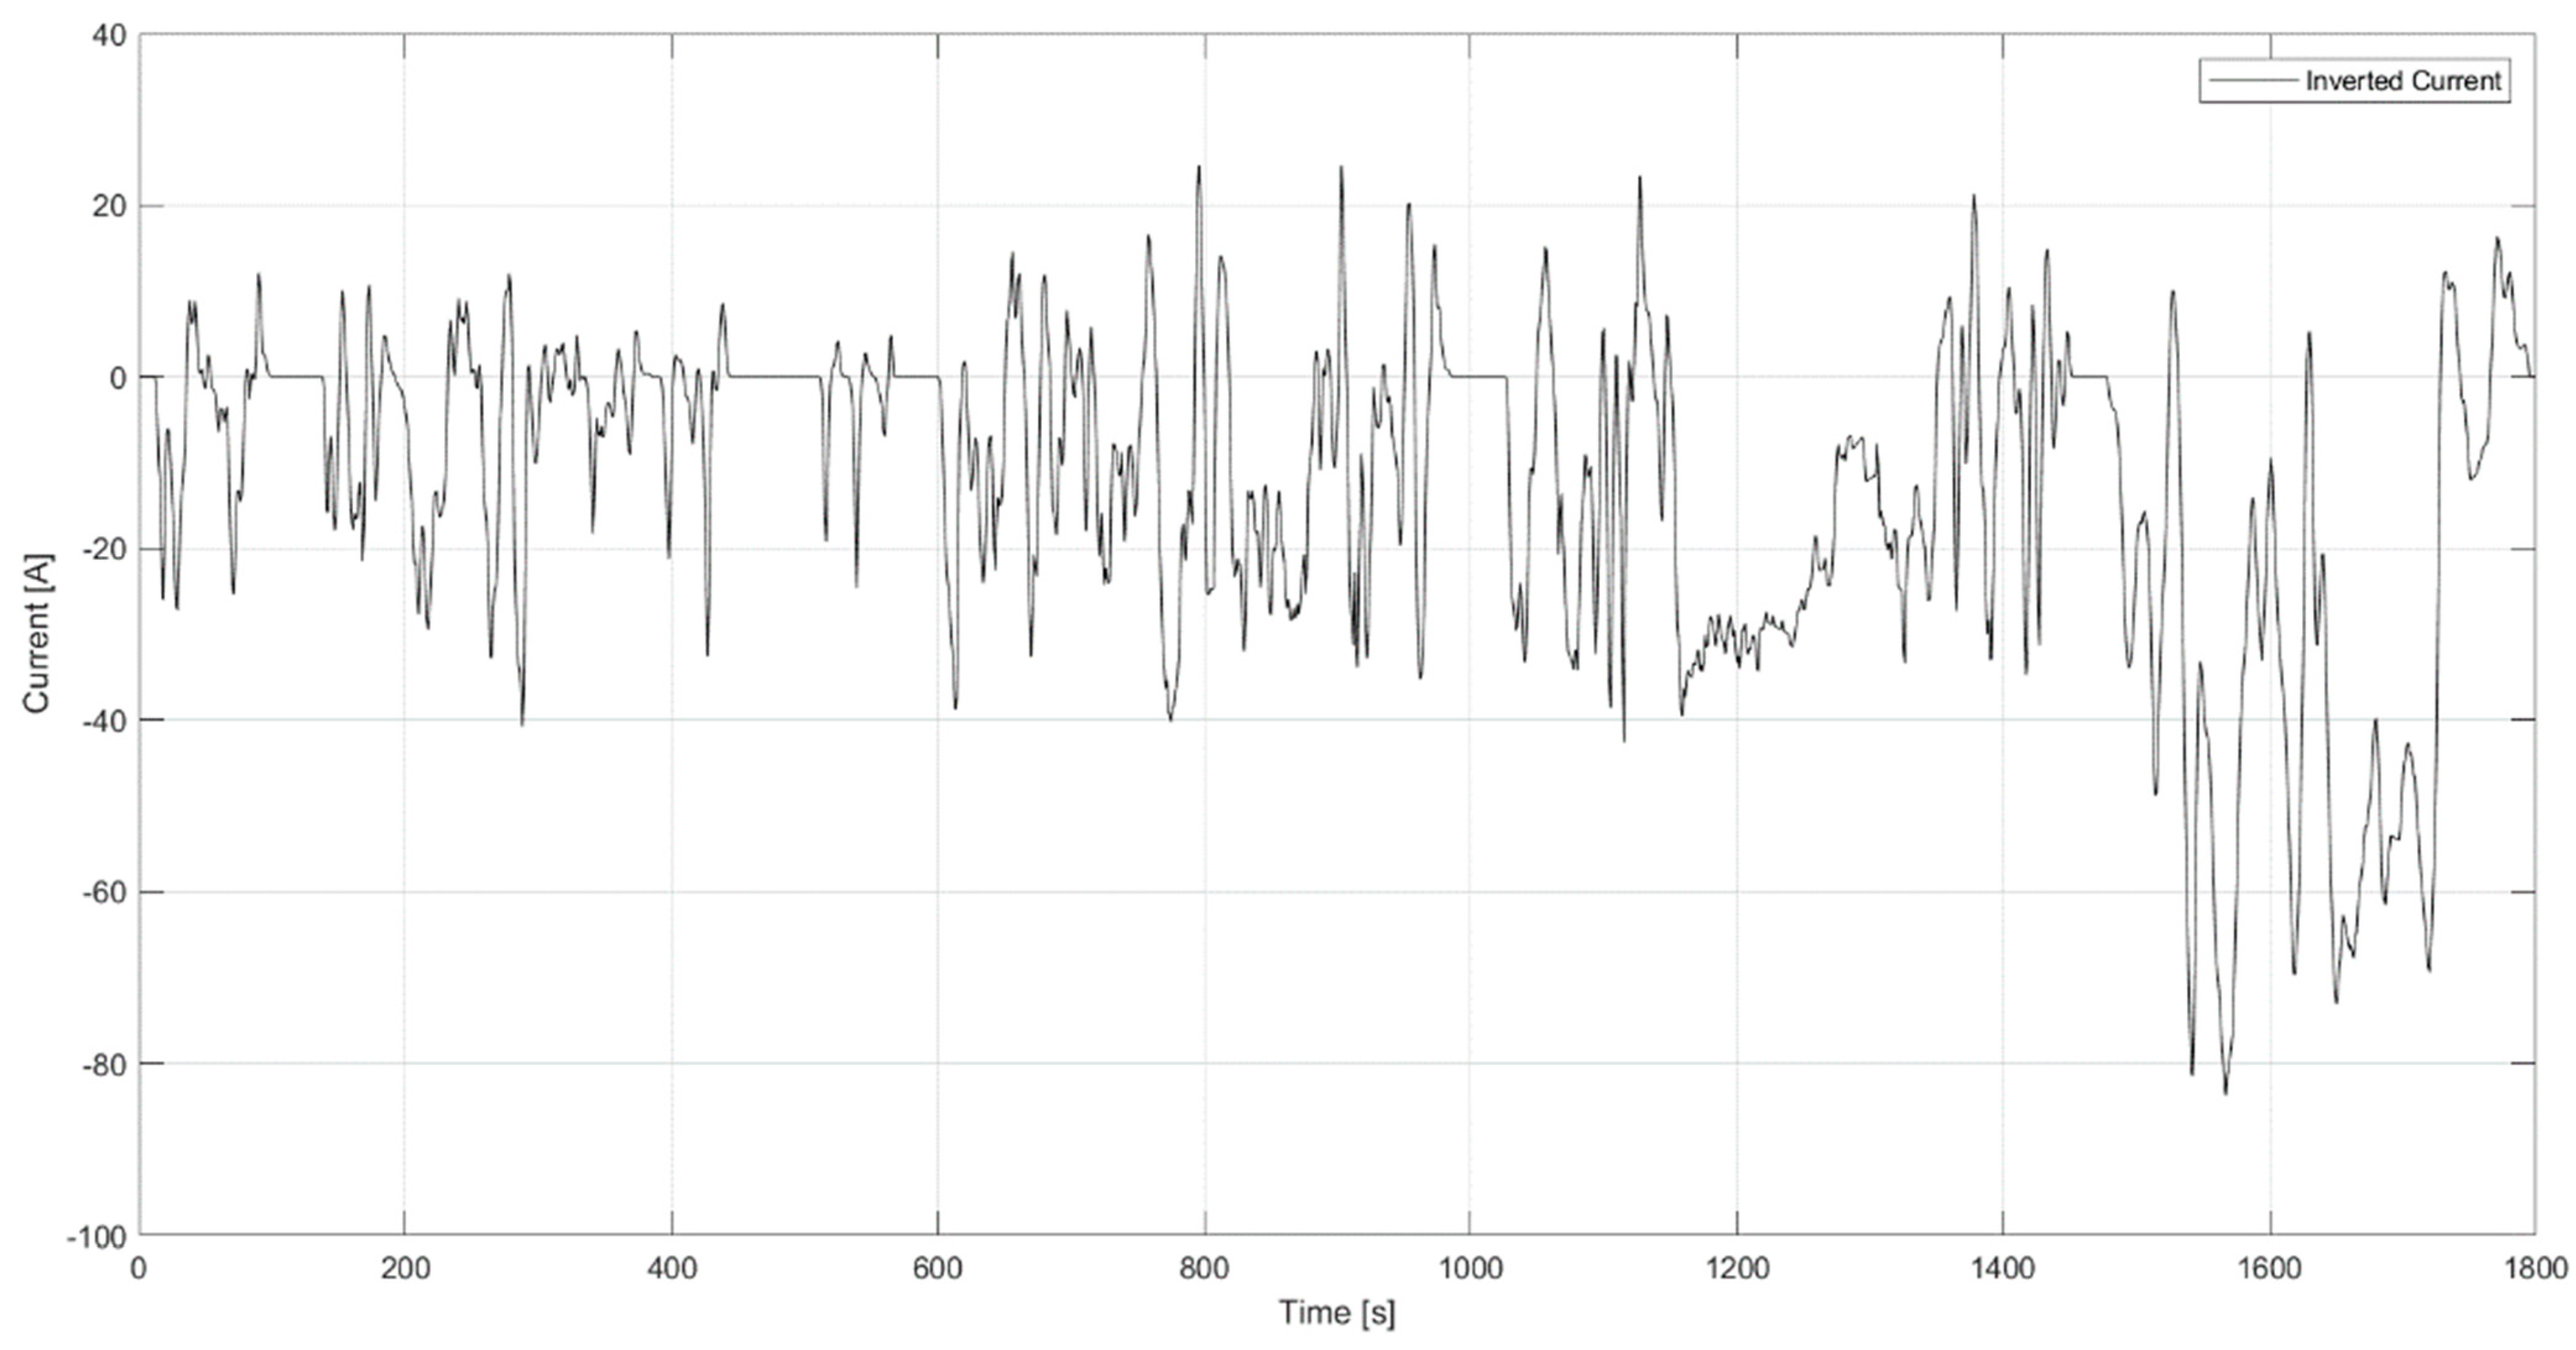
To proceed both with the simulations and with the experimental tests, it was therefore necessary to scale the current profile of the WLTP cycle while maintaining the scale factor already decided for the storage system. It should be remembered that the car’s battery pack has 5230 Wh, while the smaller-scale pack has 85 Wh. Based on this reduction in scale, a current profile is therefore obtained, which must be supplied by the storage system on a reduced scale. Knowing that, the real power and current cycles were reduced to satisfy these constraints. Thus was obtained a profile with 90 W of average power and 45 Wh of total energy (<75 Wh of the battery pack alone) and a maximum current of +24 A in charge and −83 A in discharge (Figure 9).
From now on, the positive half-plane indicates absorbed current/power (charge/regen) and the negative one supplied (discharge).
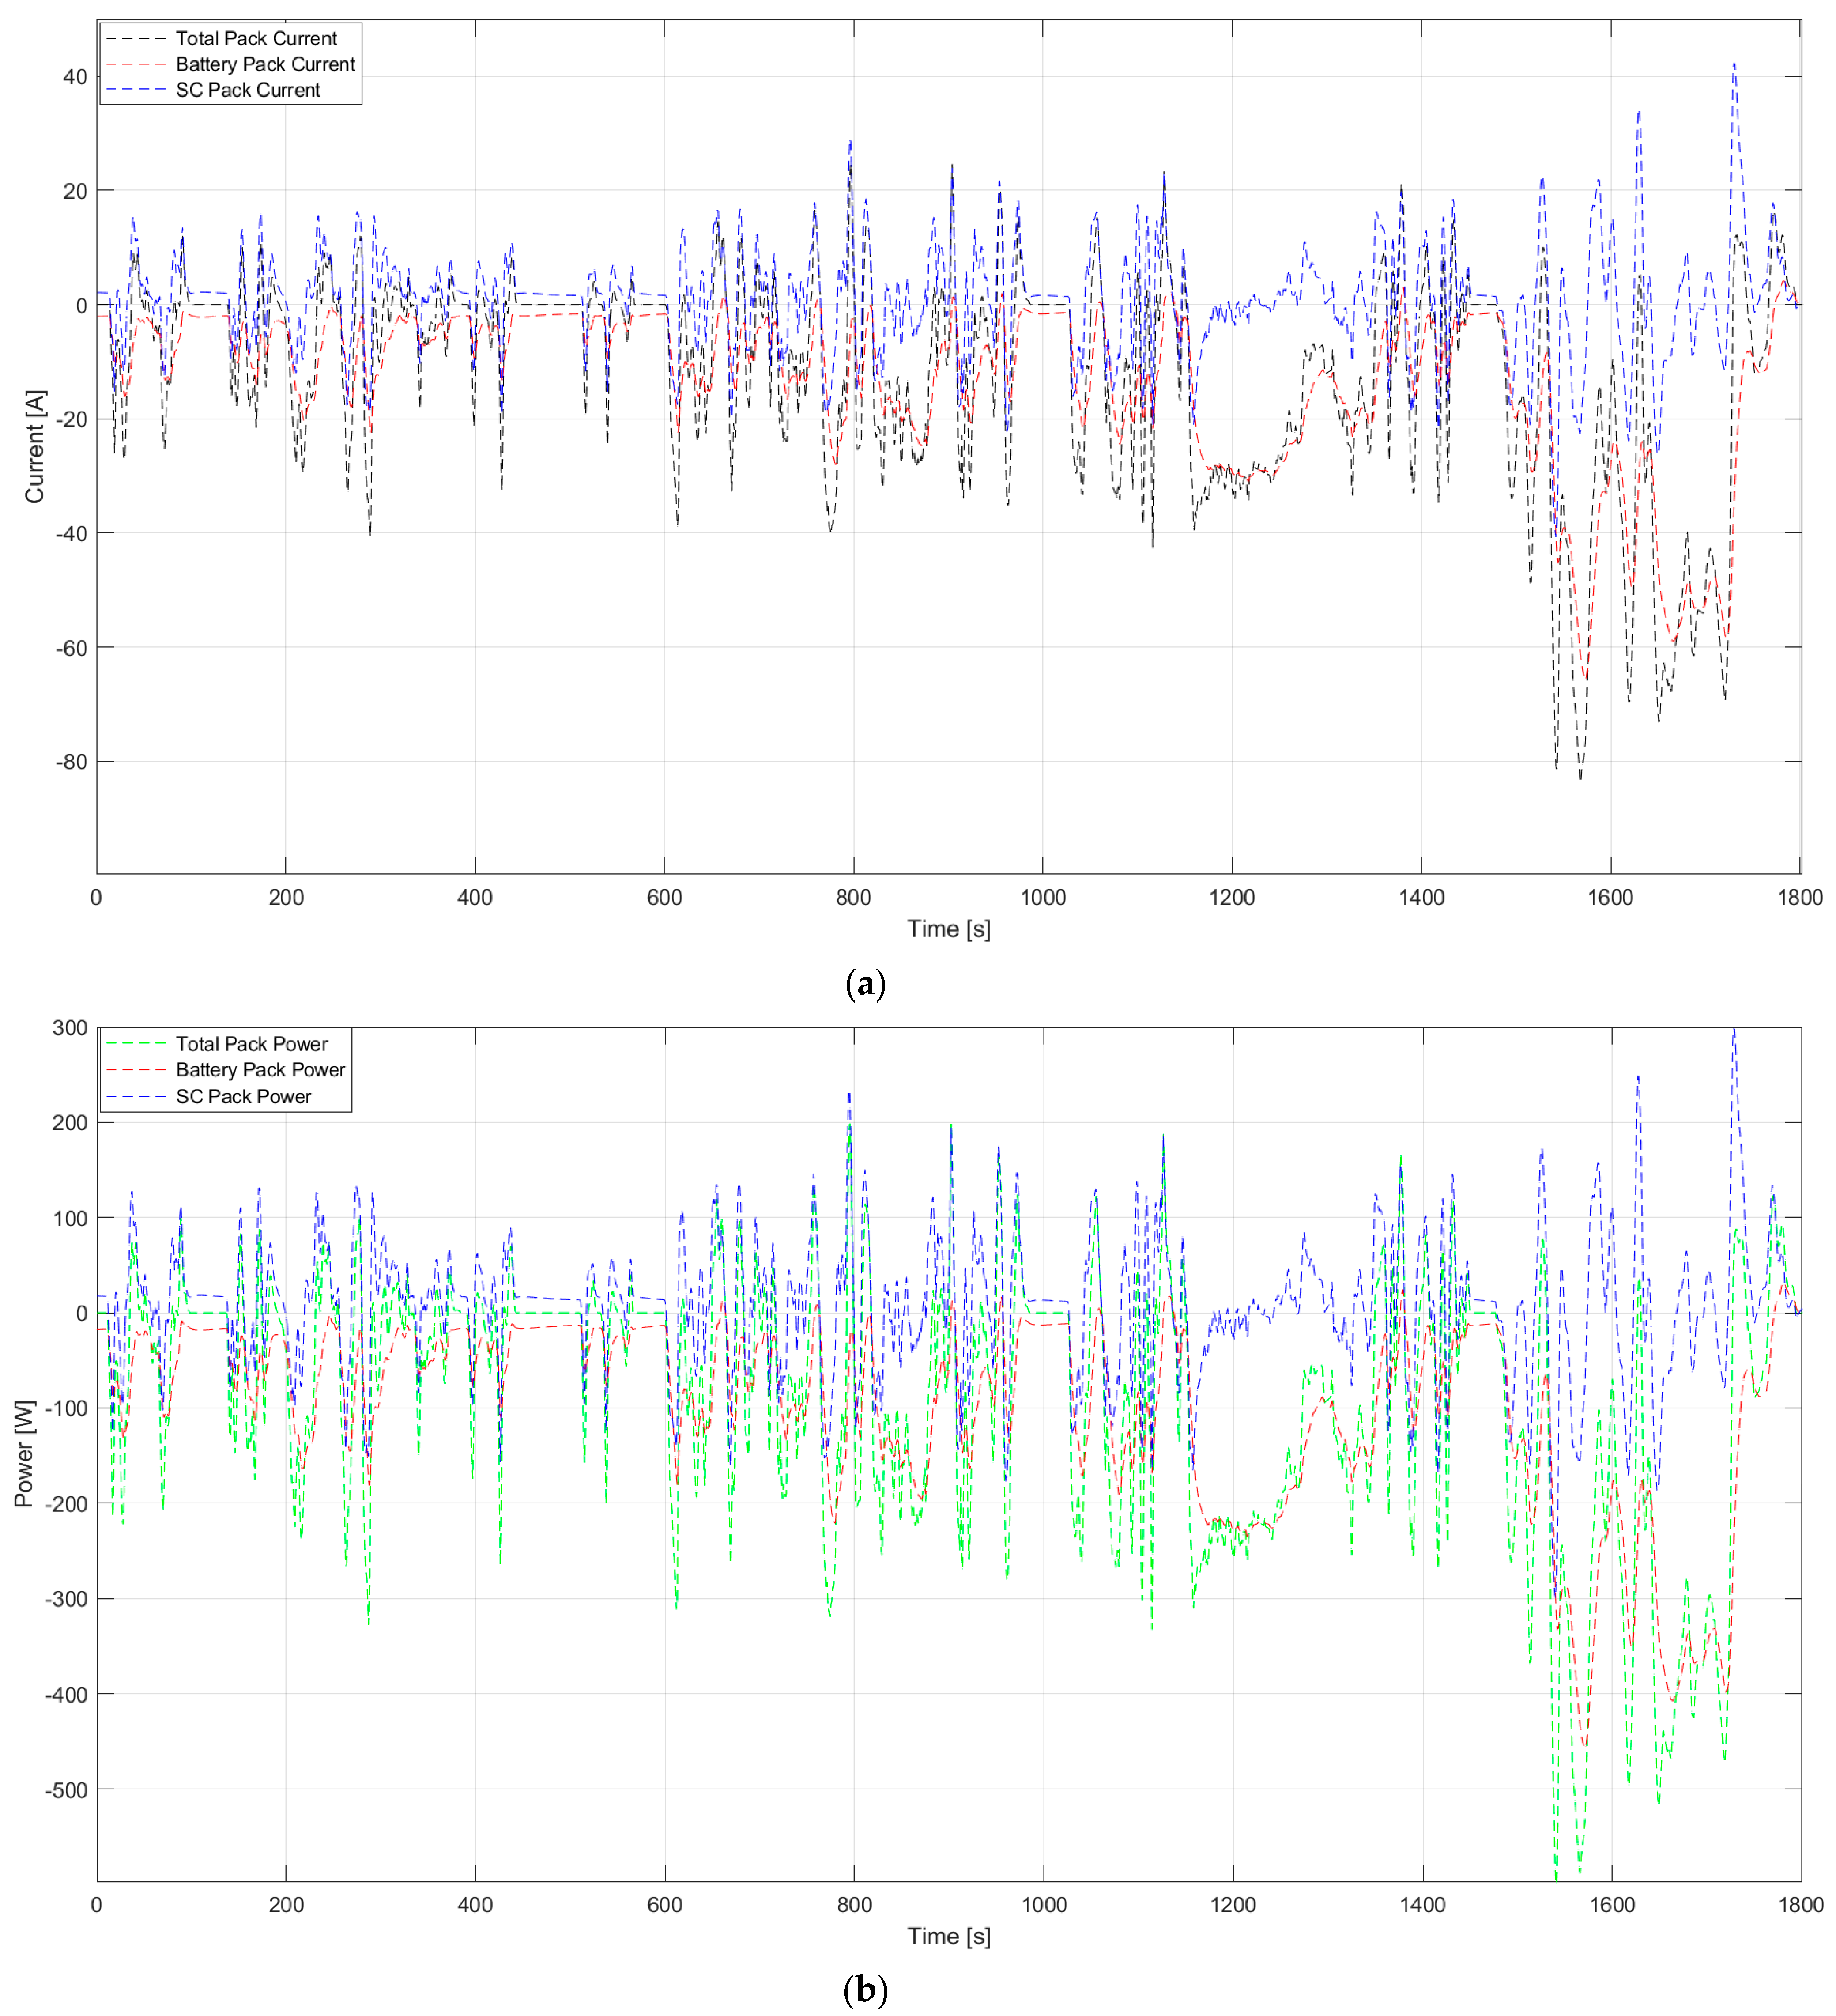
Once the current profile was loaded into the Simulink model, it was possible to analyze the current/power distribution of the two packs (Figure 10a,b).
From the first simulation, it is possible to note that up to 1150 s the supercapacitor branch is always ready in the initial transients of each discharge; in fact, in this interval, there are no discharge processes long enough to lead to a reversal of the trends. Furthermore, it should be noted that the regeneration current and power are absorbed almost completely by the supercapacitor branch; this is not sufficient to recharge it, to the point that the battery pack remains in a discharged condition to facilitate its recovery. The second interval is characterized by longer discharge periods; therefore, the contribution of the supercapacitor branch is maximum in the initial transients and then decreases. Here, the inversion of the current/power profiles is quickly achieved; nevertheless, the battery pack never remains alone to supply the entire request.
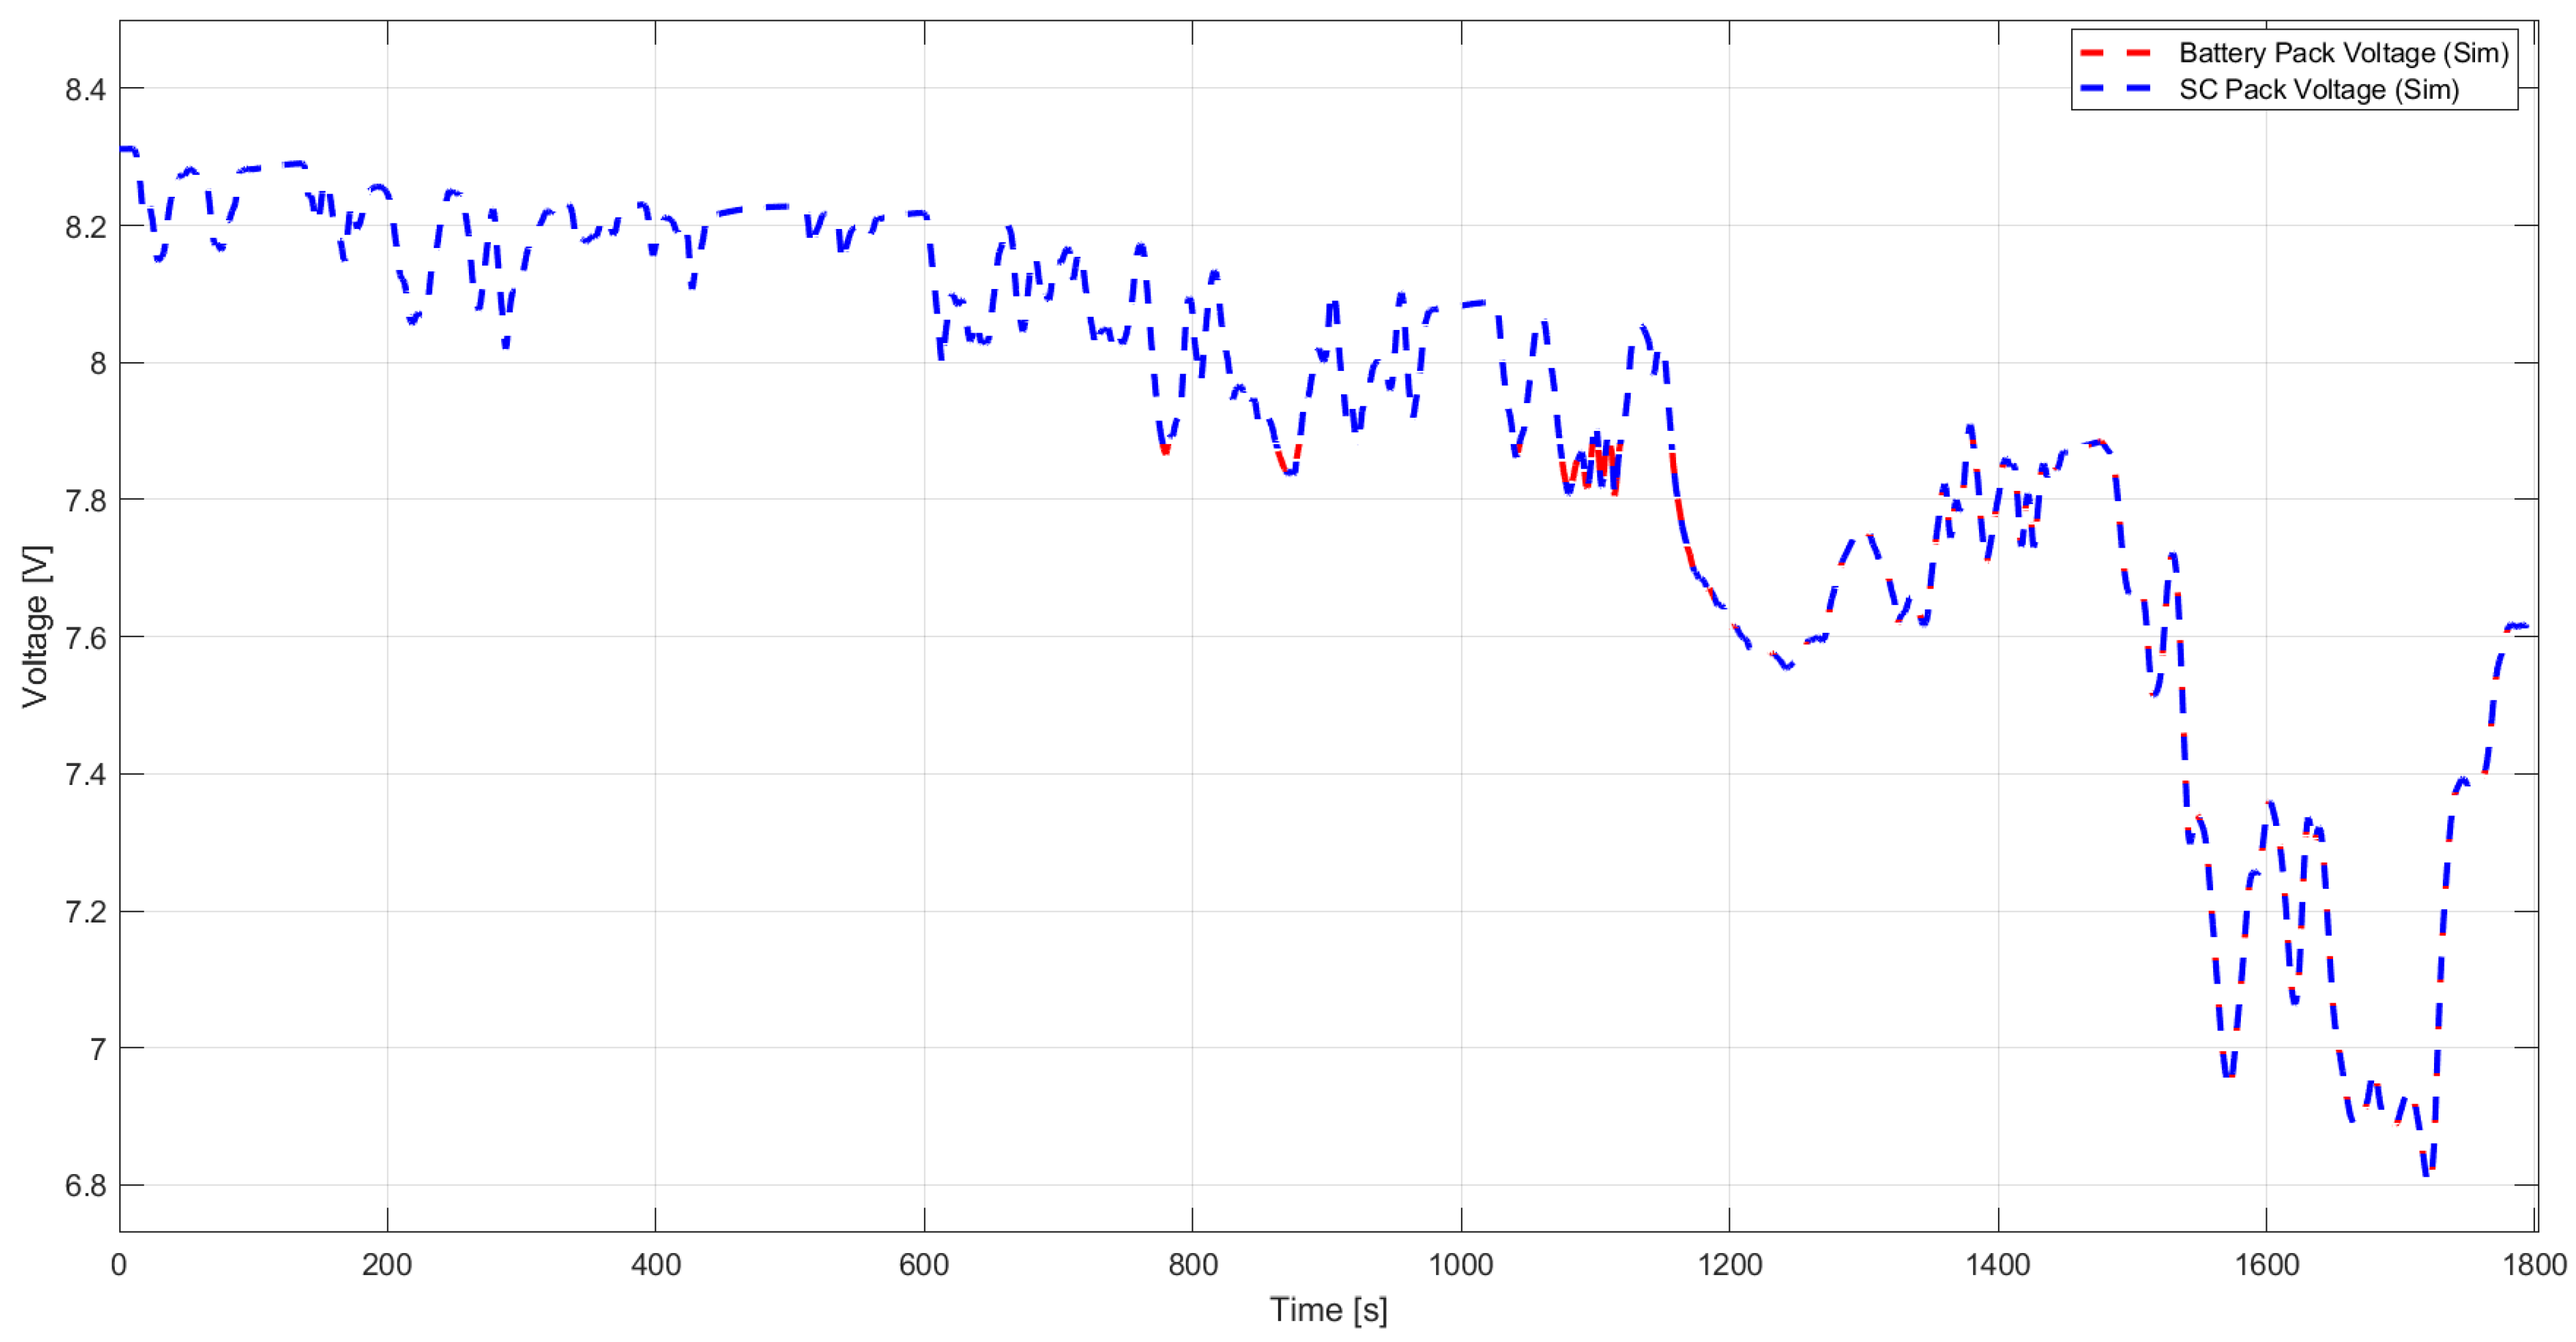
In Figure 11 we show the voltage graph in which, as seen in previous simulations, the profiles of the Li-ion cell branch and the supercapacitor branch are coincident.
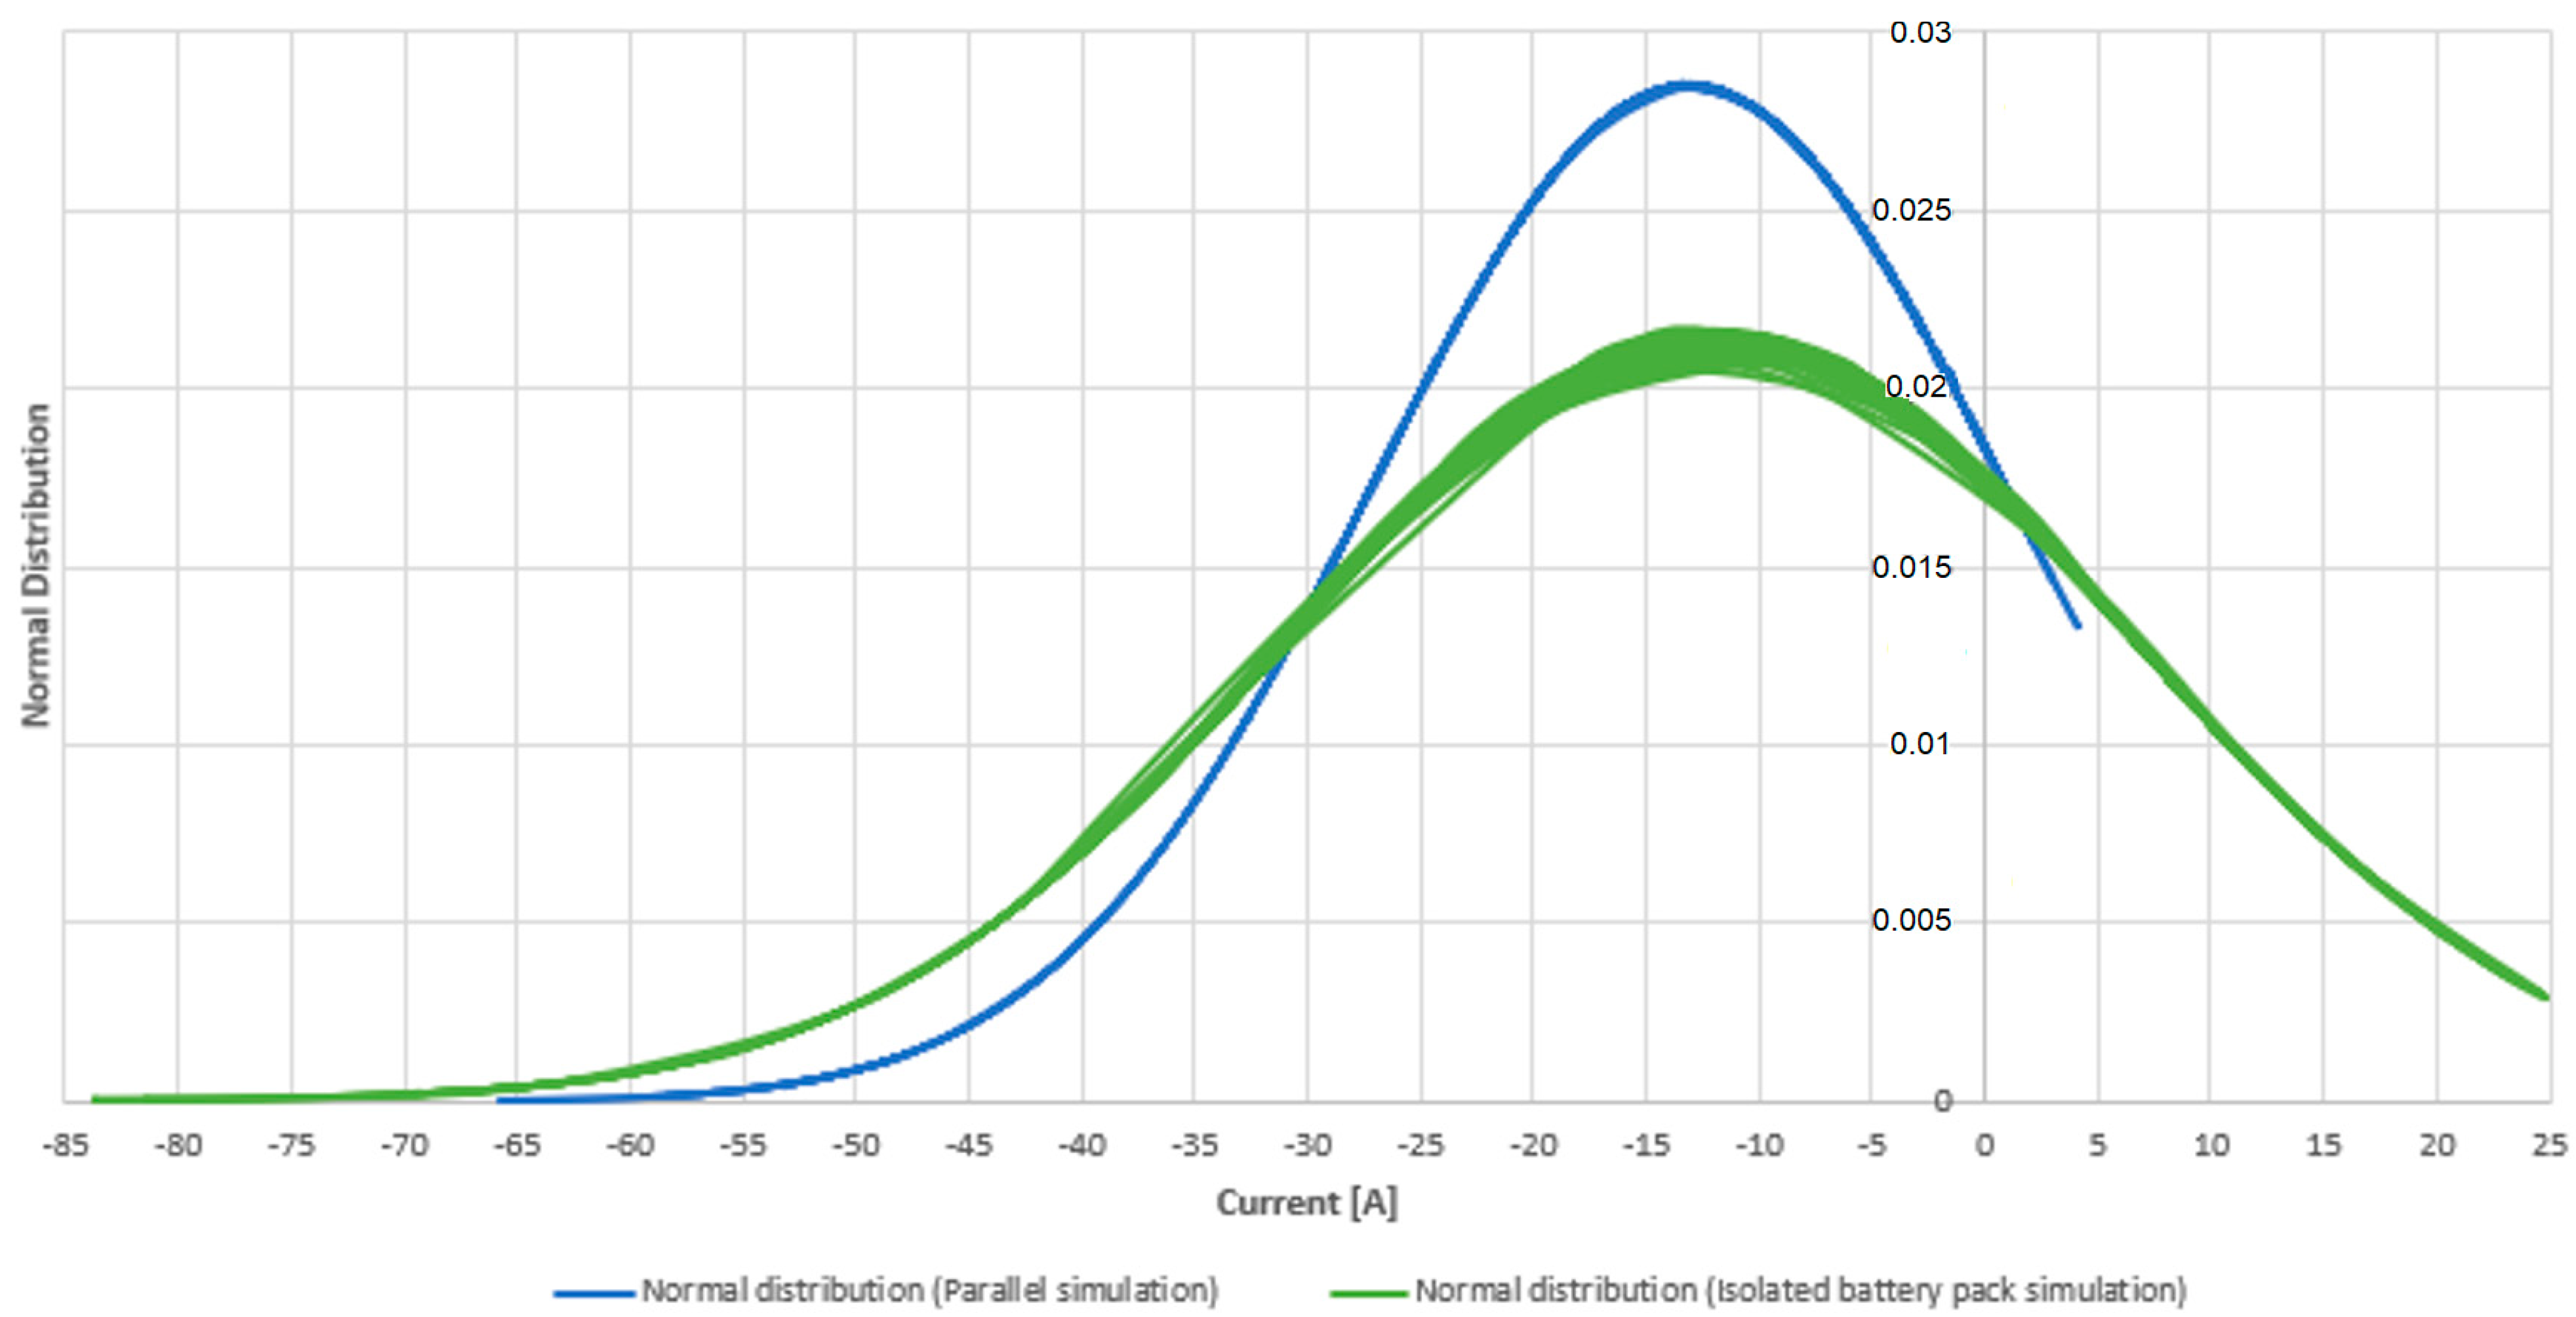
In the absence of the SC pack, the entire demand had to be satisfied by the batteries, so we expected the maximum punctual values to be increased. To complete the analysis of the involvement of the battery pack alongside the punctual values (Table 4), Gaussian distributions of current and power values are added for the battery pack in the two configurations (Figure 12). The standard deviation in the Li-ion + supercap scheme is lower, indicating a higher curve and less dispersion of the observed values. Furthermore, the maximum currents supplied/absorbed by the battery pack in the parallel scheme are lower due to the presence of the supercapacitor branch.
5. Experimental Results and Comparison
For the experimental validation of the previously described simulation models, the current profile obtained from the scaling of the WLTP cycle and reported in Figure 10 was used with the storage system of Table 3 and the test bench described in Figure 5.
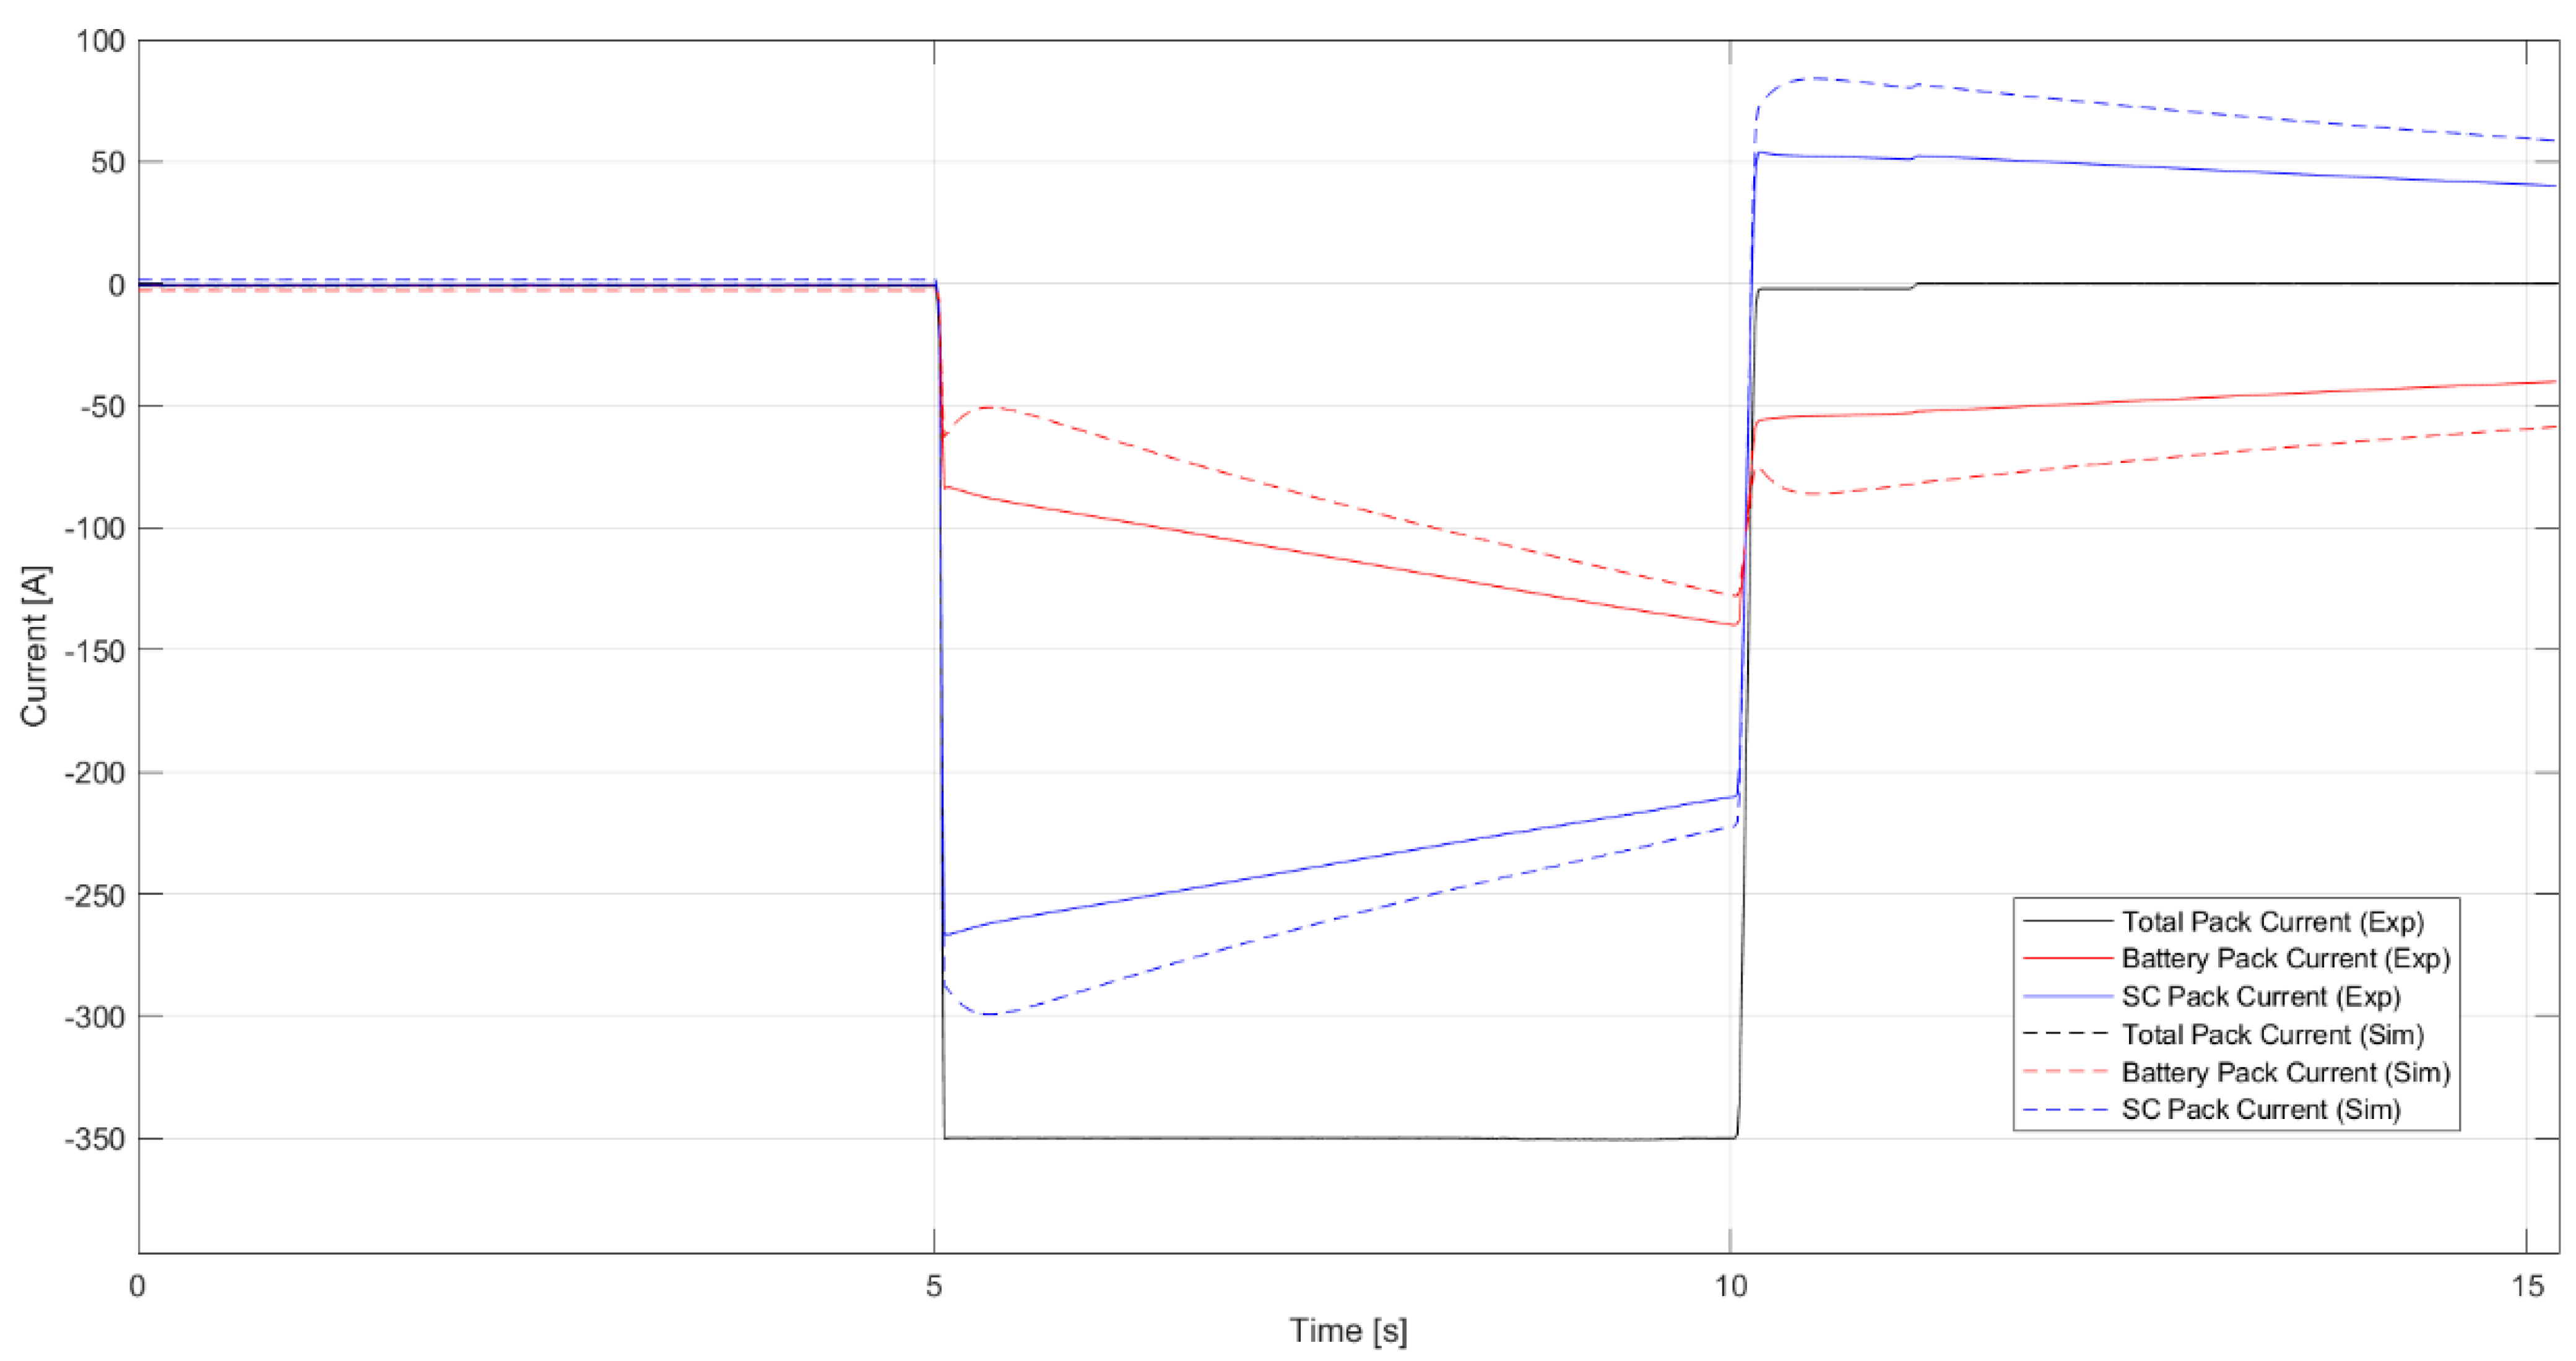
First, the 350 A for 5 s discharge test (see Figure 7) is reported in Figure 13, overlapping both the experimental and simulation results.
In the simulation test, at the end of the 5 s discharge, the discharge current on the Li-ion battery branch reaches the value of −128 A, while the measured current at the end of the experimental test reaches a value of −139.9 A, with a difference lower than 10%.
This simulation, like all the others, differs from the experimental test both during the discharge, showing a larger current ratio, and at the end, as a consequence of the previous consideration (Table 5). In fact, having recorded a higher discharge current in the initial transient, in the subsequent rest period the package SC shows a higher recharge current. As mentioned, these differences may be related to the lack of an accurate definition of the resistances and capacities of the junction elements.
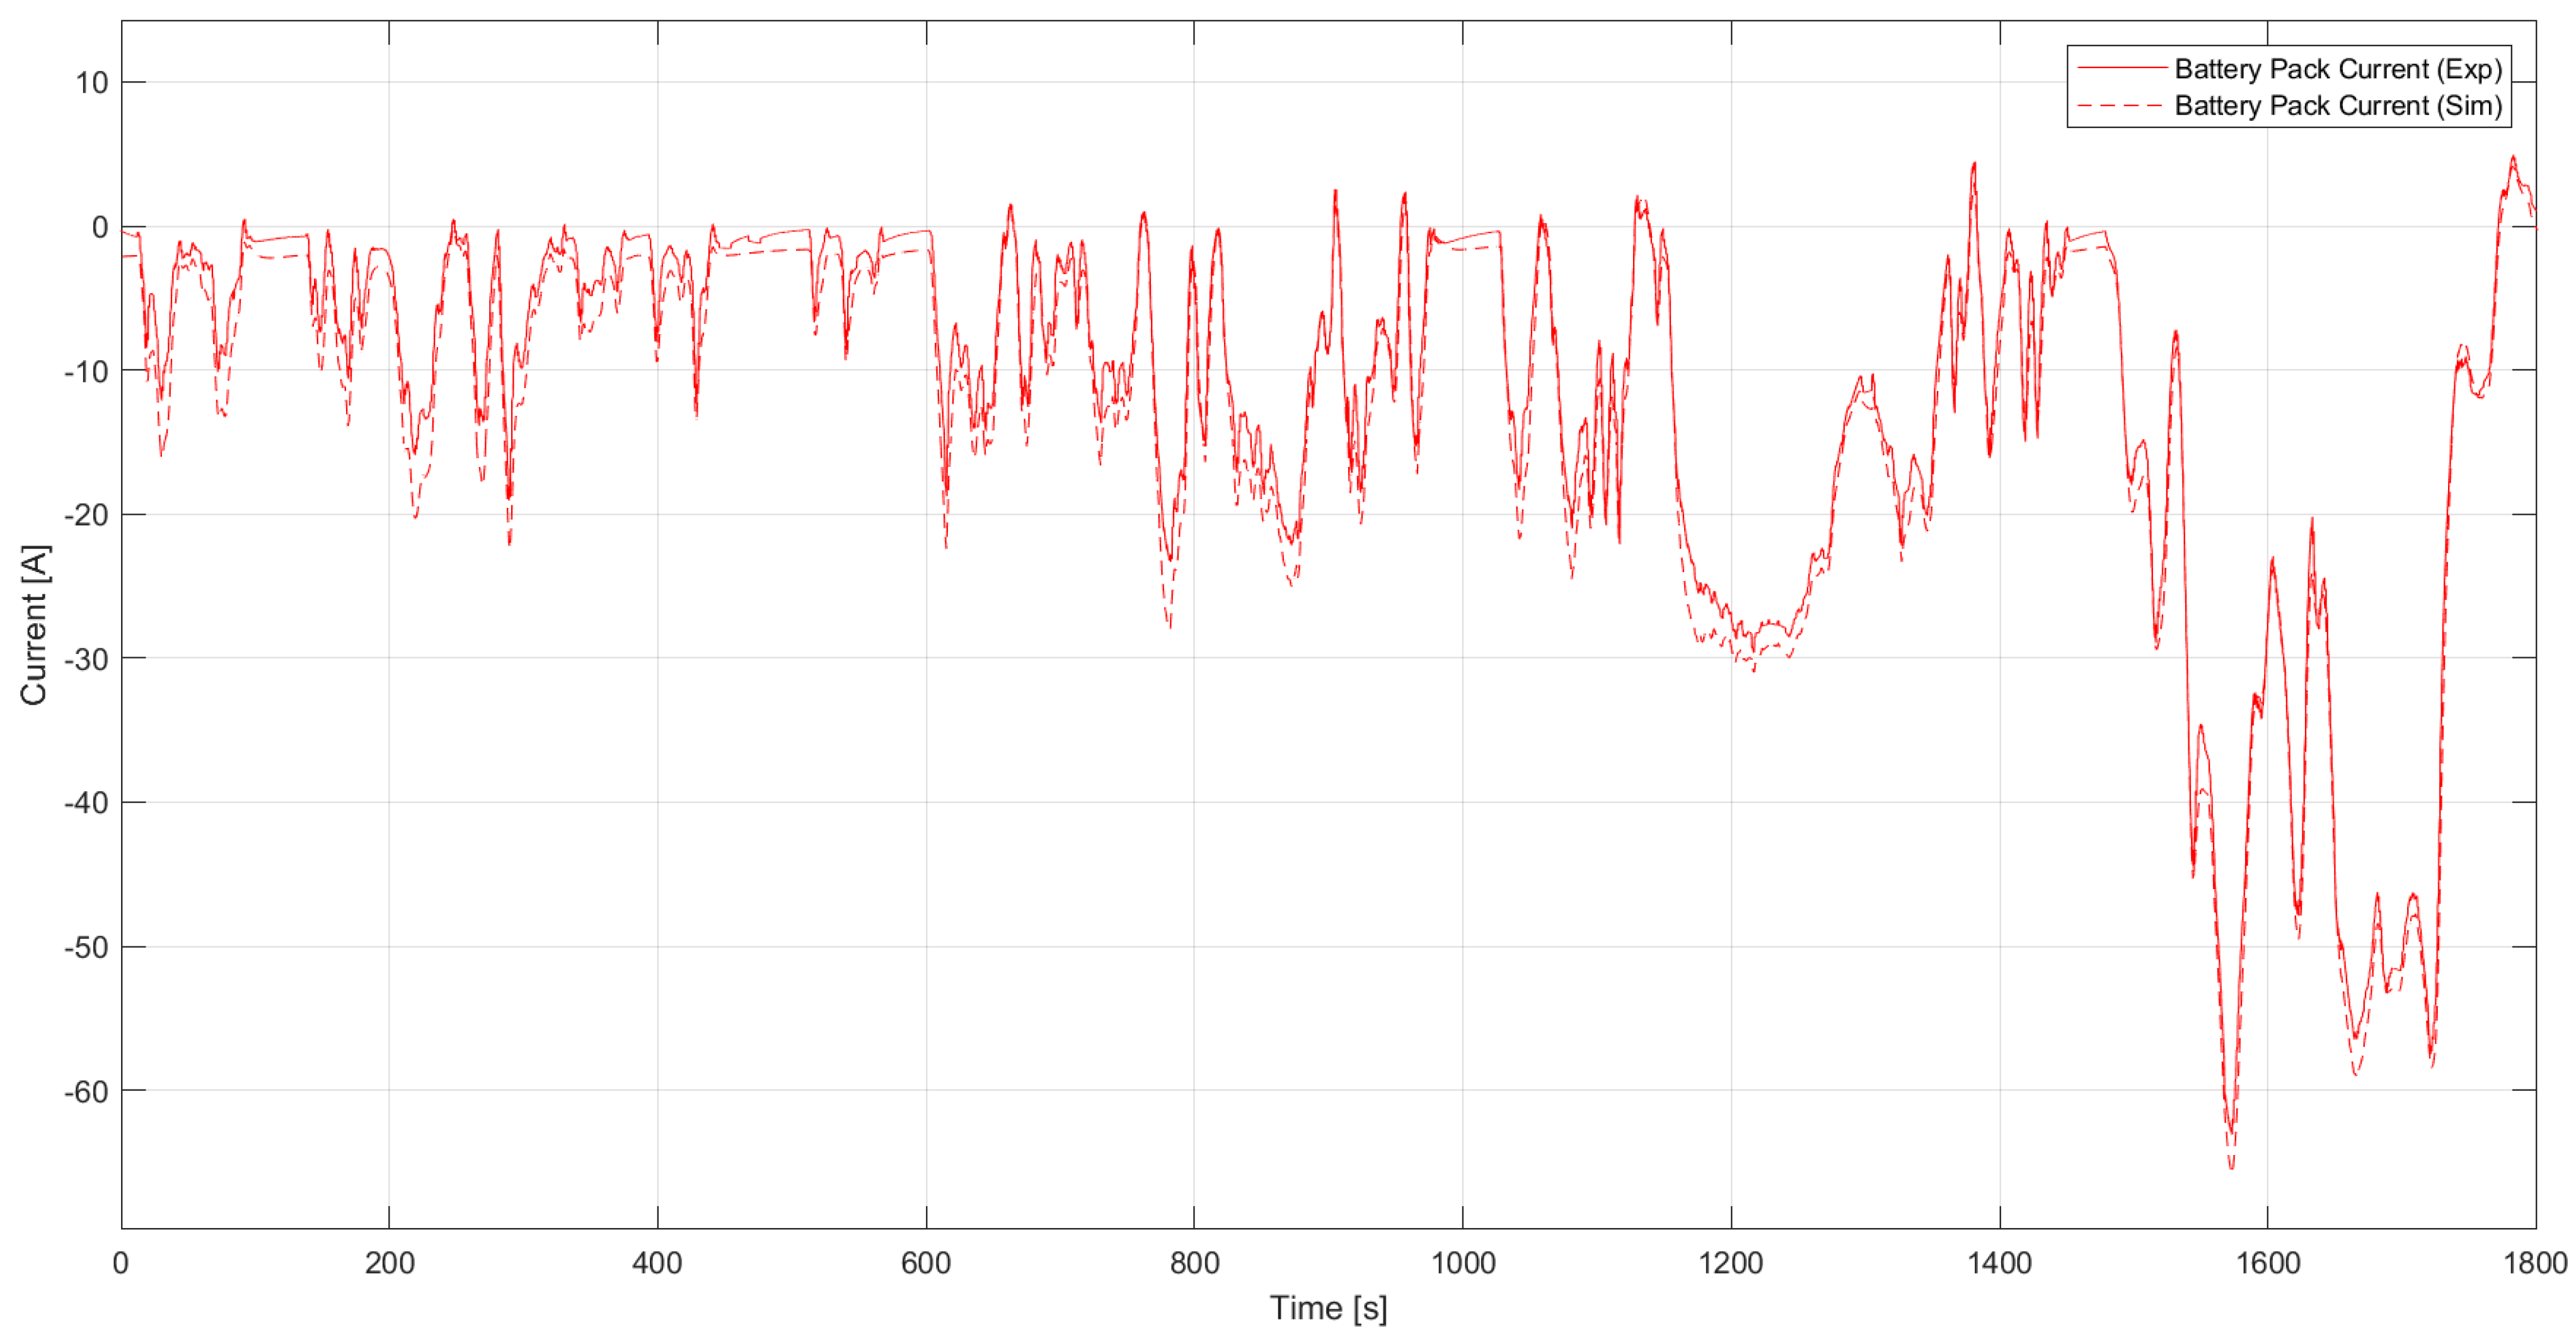
Considering now the experimental test of the WLTP cycle (scaled down), in Figure 14 is presented the comparison between the experiment and simulation current for the battery branch in the storage system with the supercapacitor branch in parallel with the Li-ion battery. The simulated one is slightly offset, and this is due to an imperfect balance of the pack voltages at the start of the test: specifically, the current of the battery pack begins the cycle from a discharge situation in favor of the supercapacitor branch, and this condition is maintained throughout the entire cycle. The overall behavior of the simulation model therefore proves to be sufficiently reliable during the WLTP cycle, which significantly represents a typical driving cycle for automotive applications.
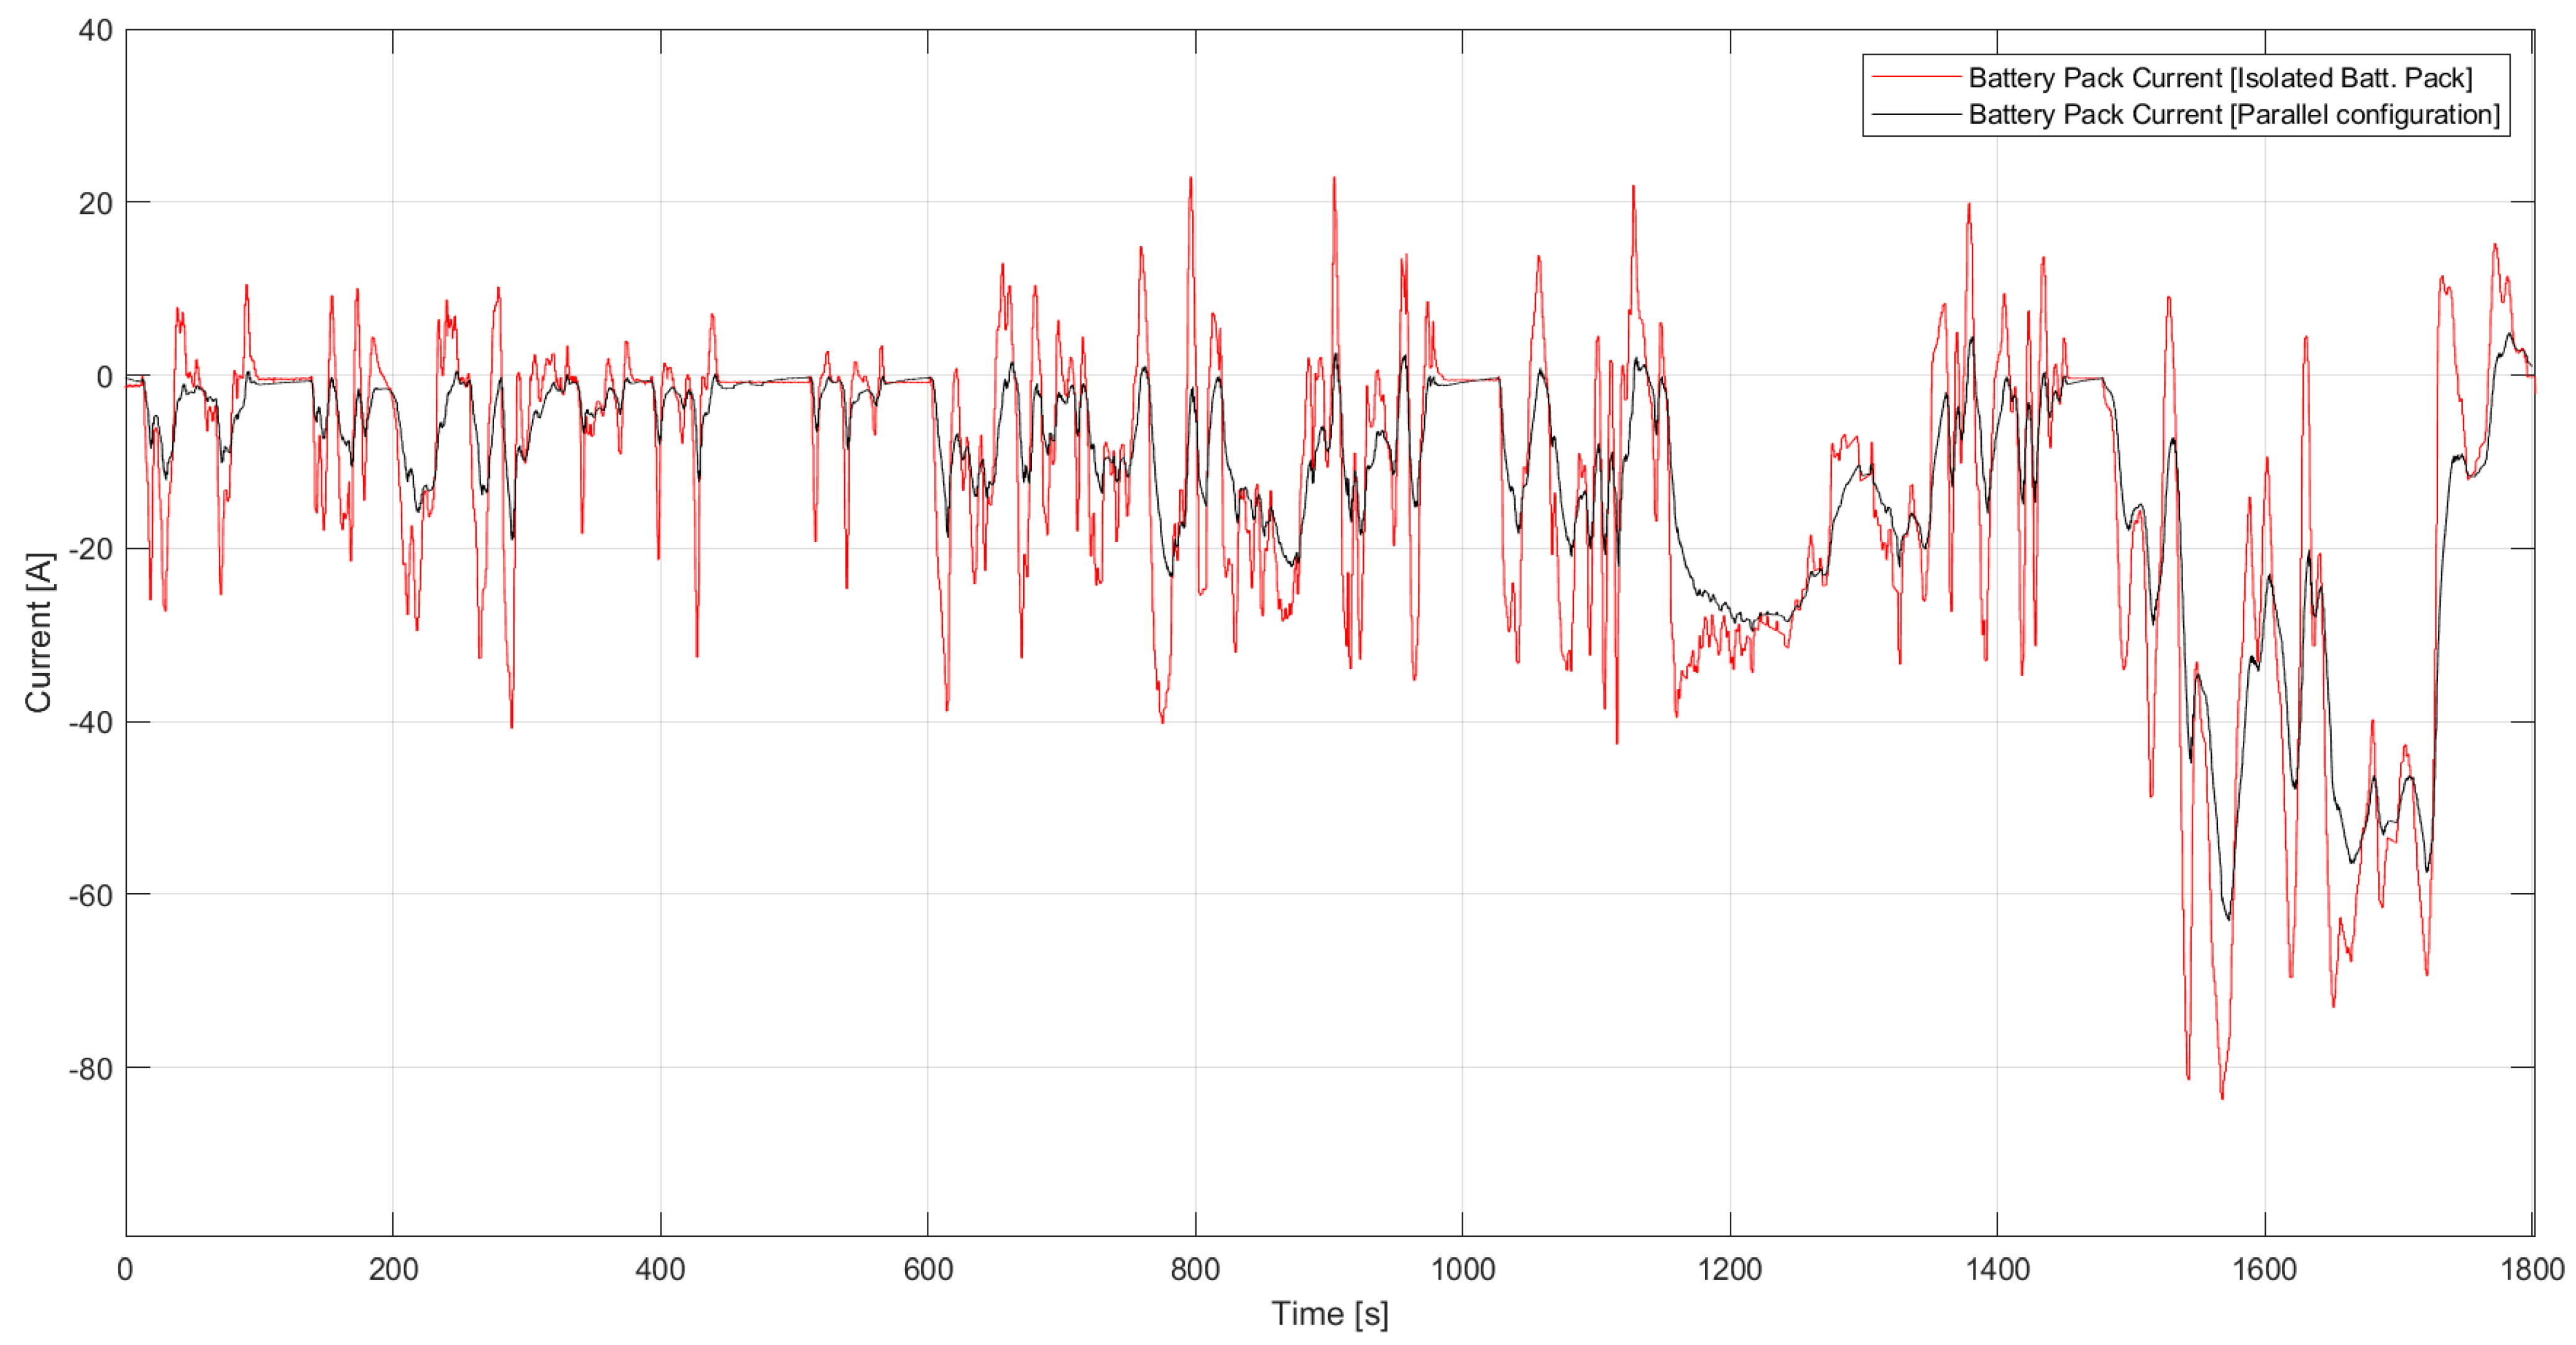
The graph of Figure 15 is very interesting; here, the trends of the battery pack current without the supercapacitor branch, and of the branch current with the Li-ion cells in the configuration of the storage system with the supercapacitors in parallel with the batteries, are reported and compared. This graph effectively summarizes the benefit provided by the presence of the supercapacitors, highlighting how the branch being in parallel with the supercapacitors significantly reduces the electrical stress on the branch with the Li-ion cells.
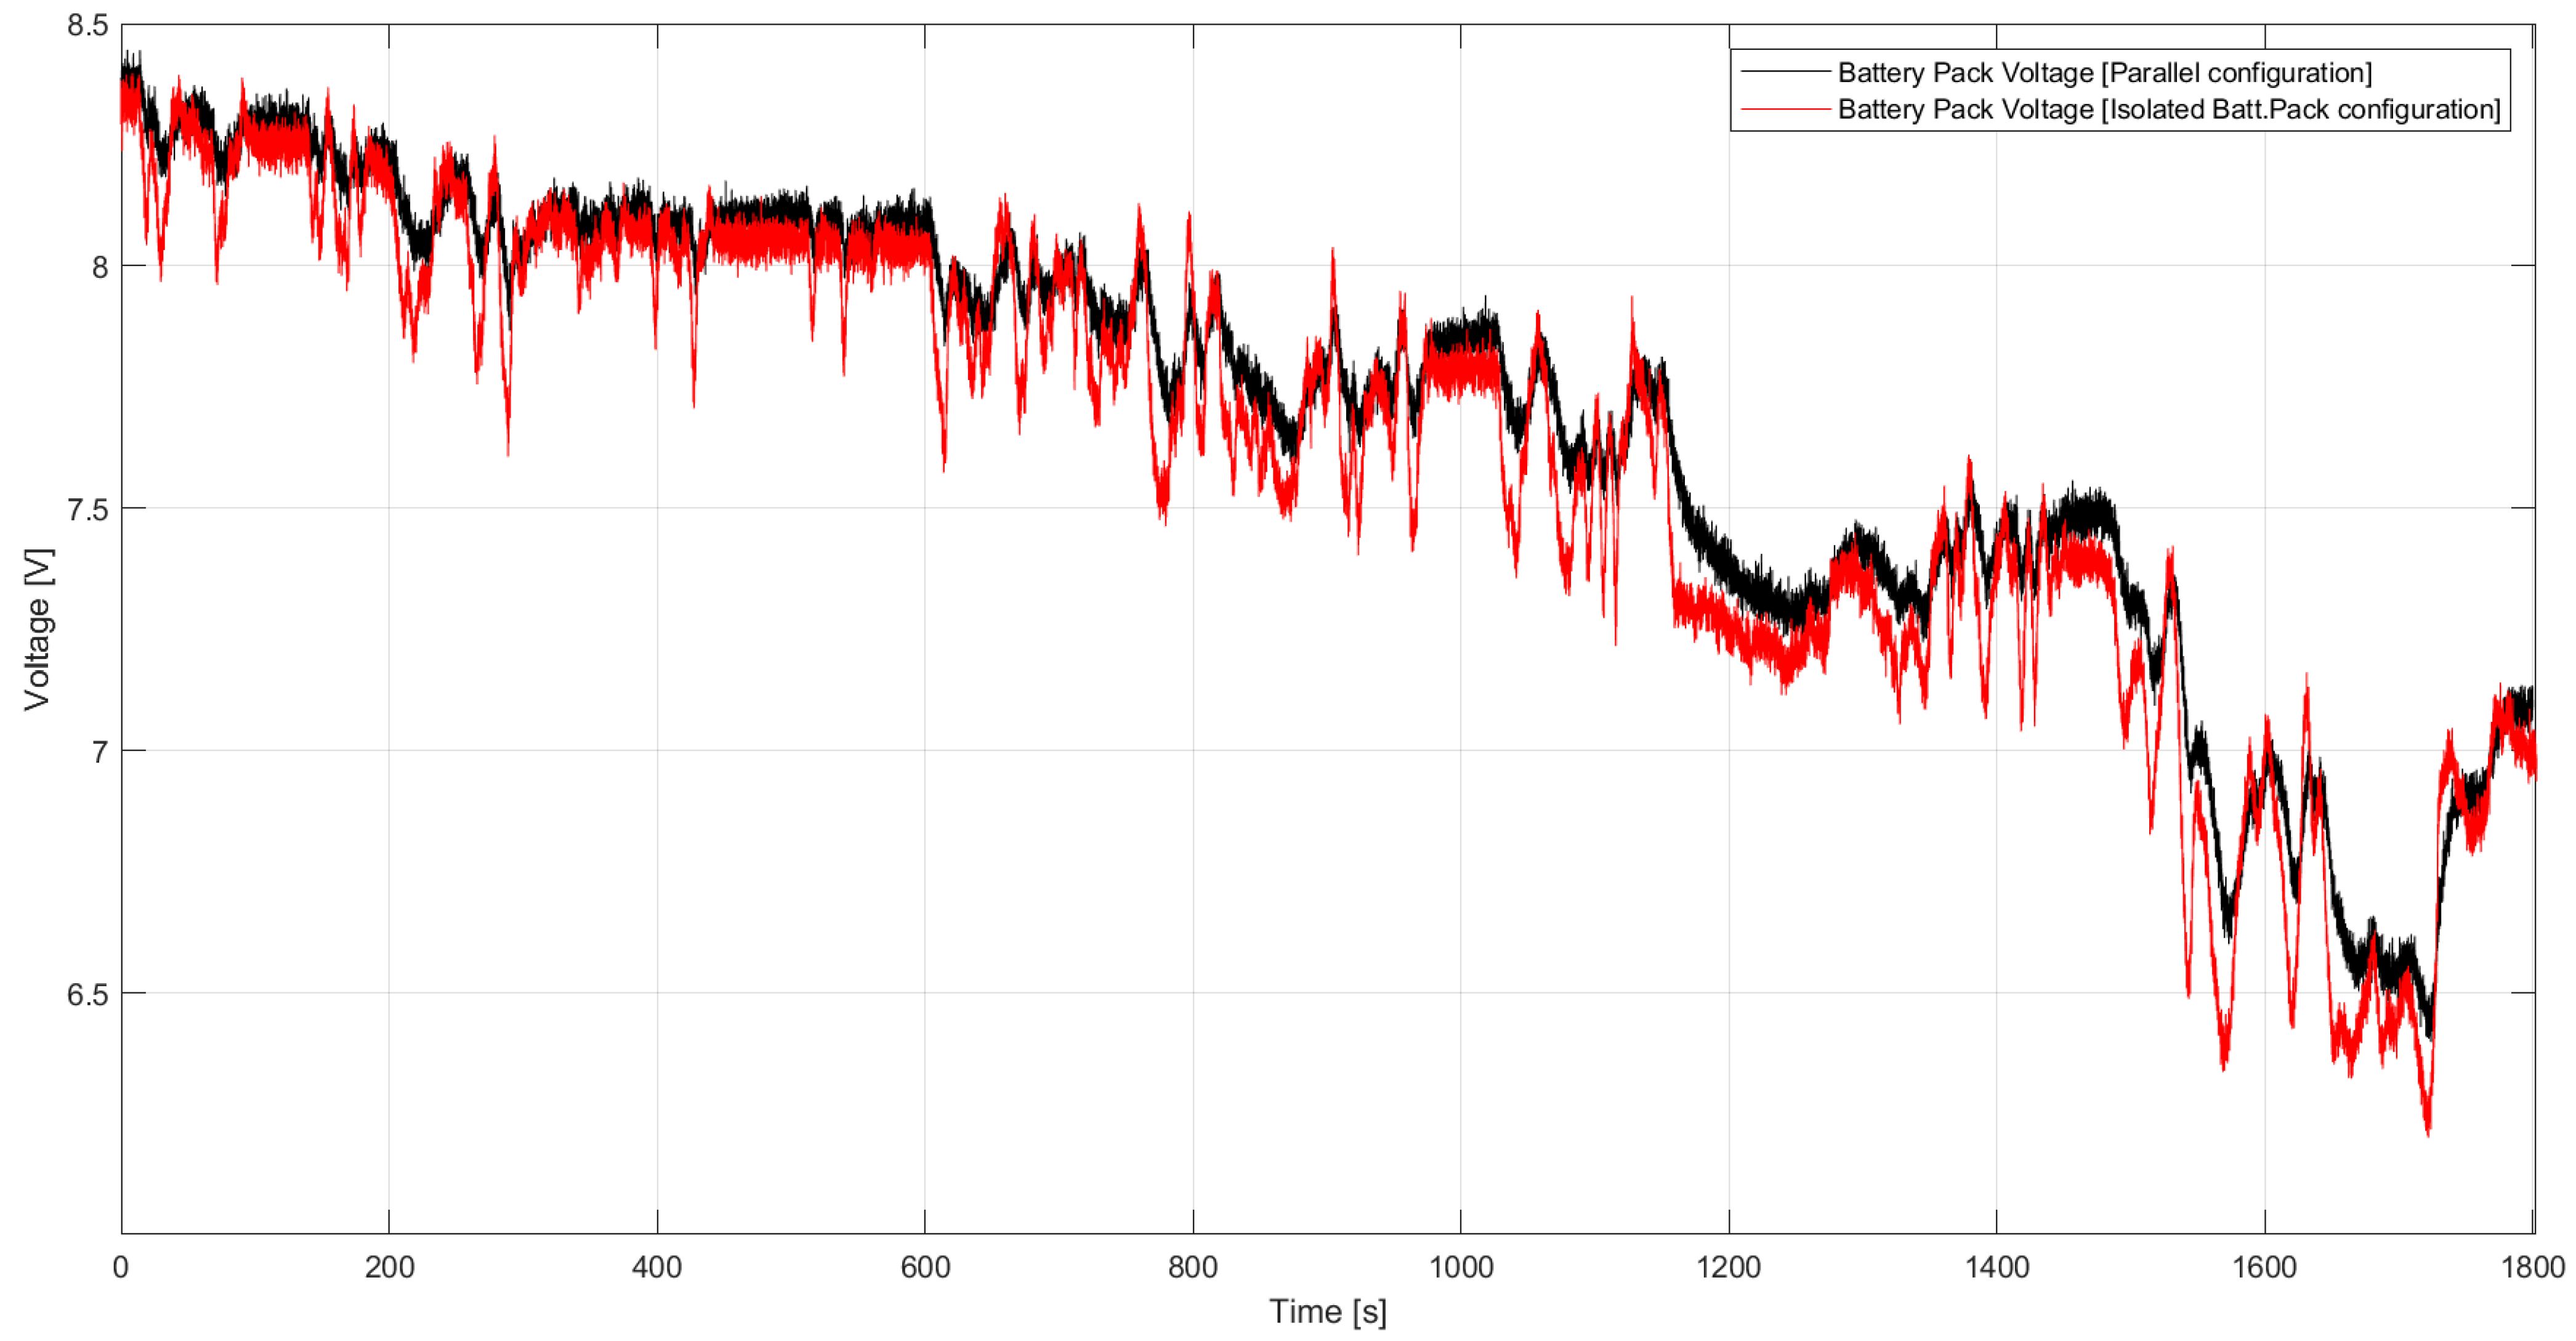
Figure 15 shows how the battery pack in the parallel configuration is subjected to lower currents and how the regenerative current is absorbed almost in its totality by the supercapacitor branch. At the same time, in Figure 16, where the voltage trends are reported for the same comparison, it can be seen how the battery pack in the isolated configuration is subjected to greater drops as well as violent and rapid voltage increases.
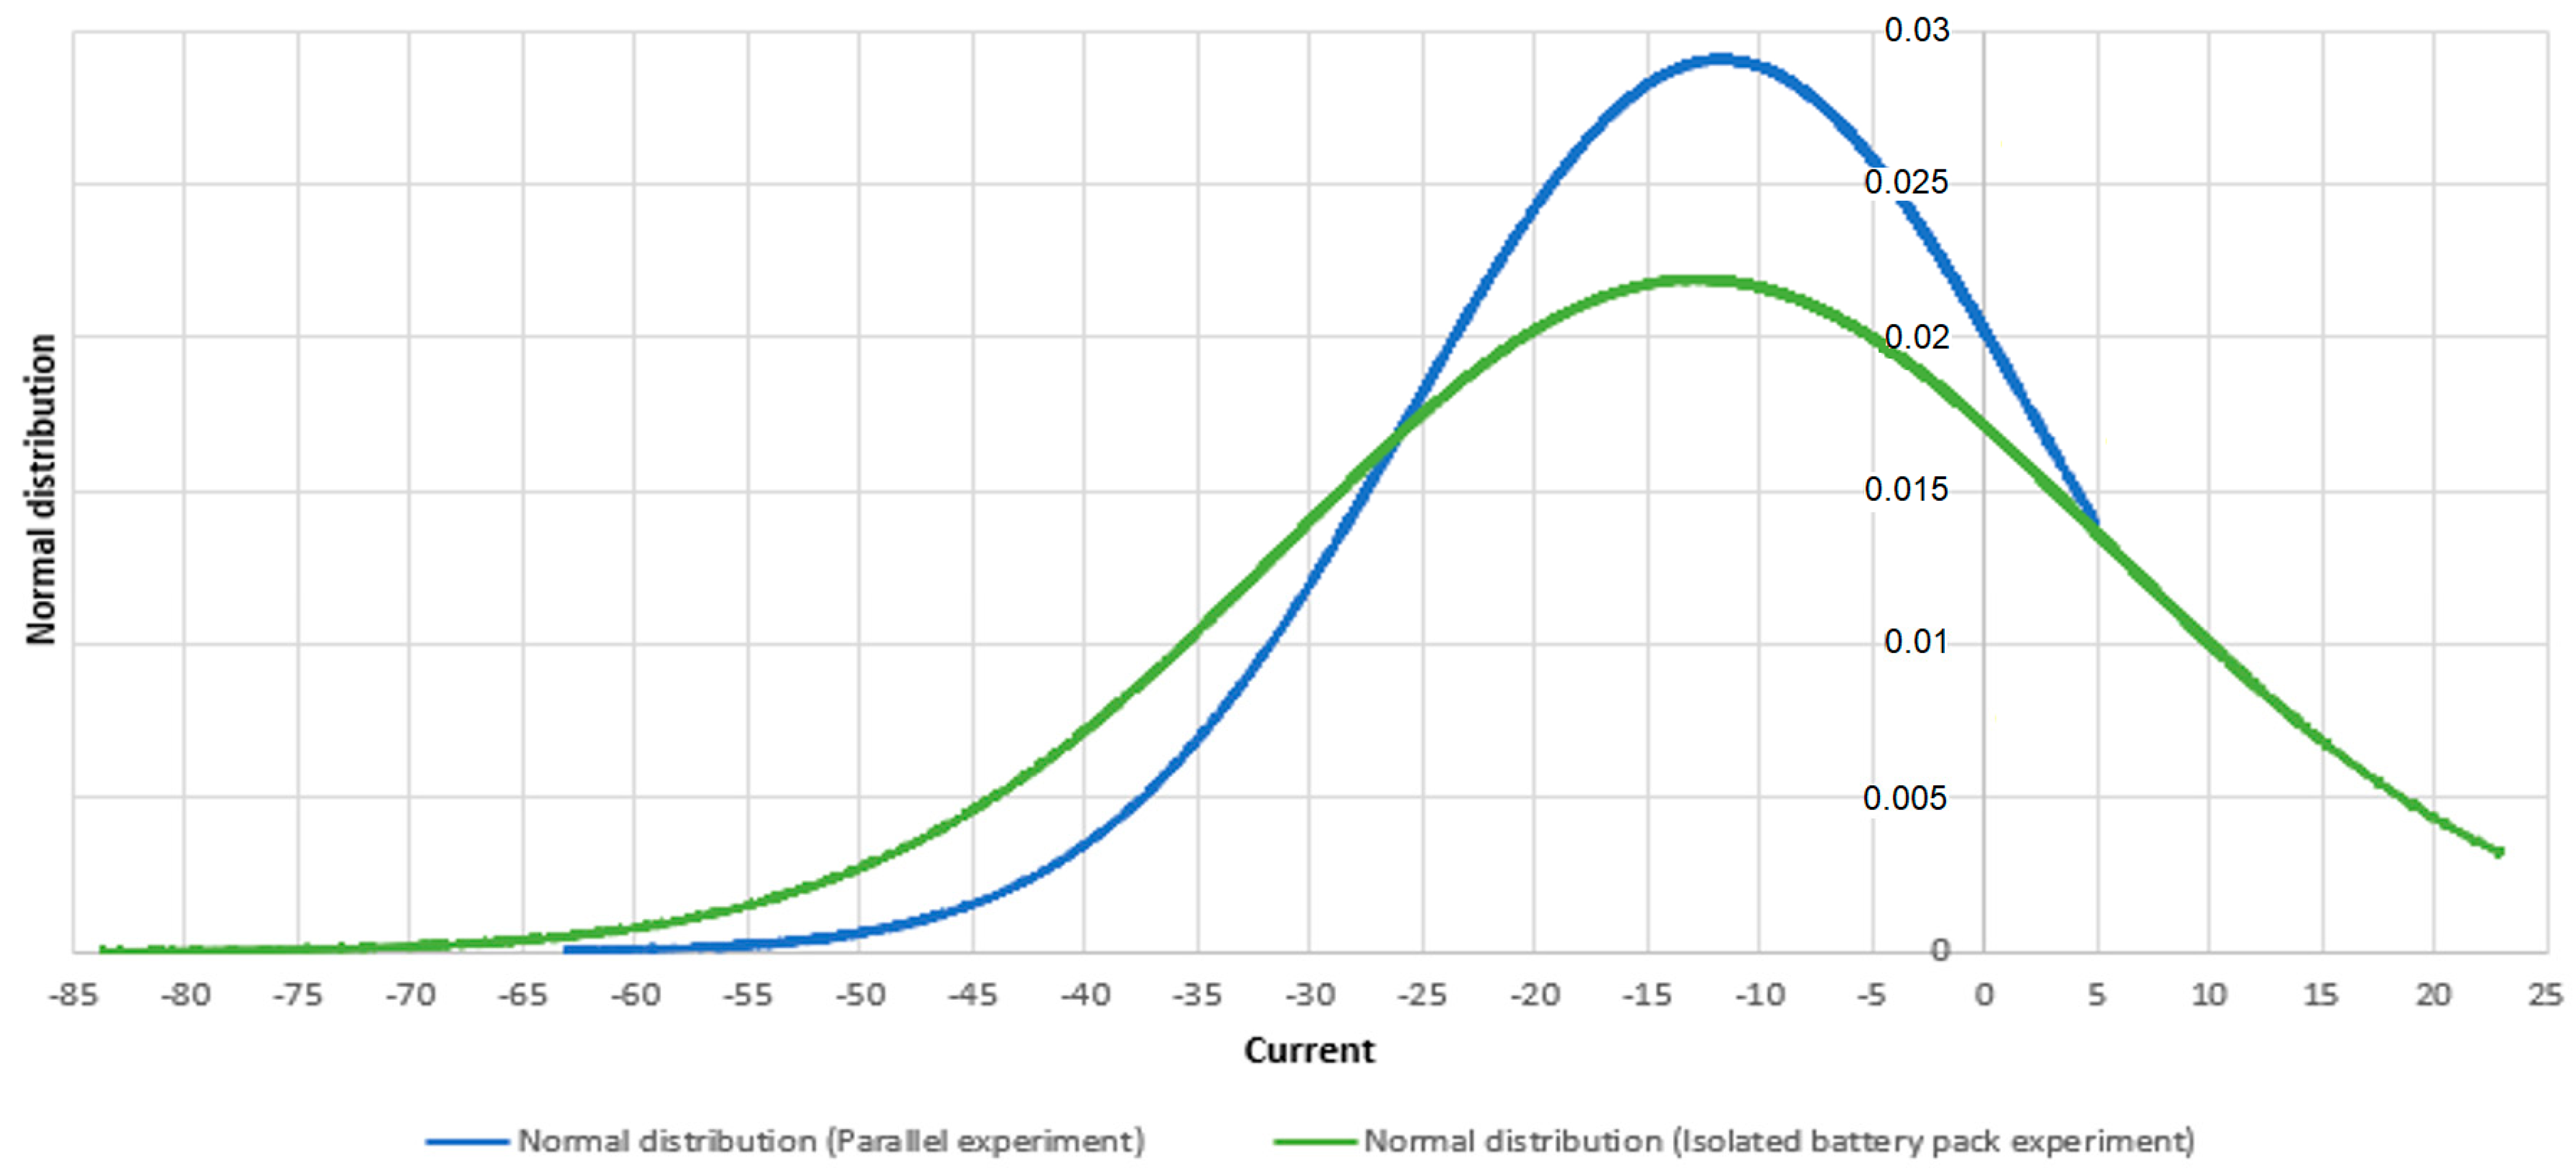
Performing a numerical analysis of these results, it is possible to collect also, for the experimental results, punctual values (Table 6) and Gaussian distributions. In Figure 17, the standard deviations of the battery pack current without the supercapacitor branch, and of the branch current with the Li-ion cells in the configuration of the storage system with supercapacitors in parallel with the batteries, are reported and compared. The parallel scheme is confirmed to have a much more favorable behavior, with lower maximum currents, operation of the cells much closer to the nominal conditions, and a drastic reduction of the peaks both in charge and in discharge. As foreseen and already demonstrated in the simulations, the presence of the supercapacitor branch significantly reduces the average current supplied by the cells; therefore, the production of heat due to the Joule effect is significantly reduced, to the full advantage of the cooling of the accumulation system and of the predictable useful life cycles.
The results achieved by the experimental tests, first of all, confirmed the usefulness and efficacy of the simulation models. We can summarize some general considerations that emerged from the tests carried out: regardless of the test, at the start of the discharge, the current delivered by the supercapacitor branch fluctuated between 72% and 77% and, consequently, the battery cells delivered the remaining 28 to 23%. Moreover, at the end of the 1 s discharges, the cells delivered between 26.7% and 29%; at the end of the 3 s discharges, they delivered between 32.5% and 33.9%; and at the end of the 5 s discharges, they delivered between 37.3% and 40%. It is interesting to note how the distribution of the supplied current remains approximately constant with respect to the chosen discharge intervals.
These results are in line with those obtained through simulation. The parameter that conditions this behavior is basically the ratio between the internal resistances of the two branches of the storage system; i.e., the string of supercapacitors and the string of Li-ion cells. This represents useful information for sizing storage systems with this configuration. More work on this topic will follow, related to fully electric vehicle storage systems.
6. Conclusions
The study was focused on the realization and experimentation of a battery–supercapacitor mixed storage, which was designed starting from defined constraint conditions. The analysis was divided by evaluating, in the first case, the intervention capacity of the supercapacitor pack in the initial transients of numerous single discharges with different current intensities and time intervals, and in the second case, the contribution of the same in a scaled WLTP cycle.
These results indicate that the presence of the supercapacitor branch in parallel limits the current and power demand to the battery branch. This behavior solves positively one of the criticalities of a hybrid or purely electric vehicle; namely, the high stress and consequent reduction in the lifespan of the battery pack.
The second analysis not only confirmed the ability to intervene in the initial transients but allowed us to observe the trend reversal on longer-duration discharges. On these occasions, the contribution of the supercapacitors, even if minimal, never failed.
These results were complemented with experimental tests, which confirmed the current profiles obtained by the simulations. The inconsistencies found in the analyses just discussed may be attributed to the resistance of the power cables, busbars, shunts, and various assemblies made, for which the real resistance and capacitance values to be included in the model were not evaluated.
In conclusion, it is possible to affirm that the contribution of the supercapacitors to the system is dual: supercapacitors have the ability to intervene both in the initial transients by limiting the current/power required (or supplied) from (or to) the battery pack, and in the energy calculation by reducing the expense to be borne by the battery pack. In other words, they intervene where the battery pack would work at lower efficiency with consequent mechanical, thermal, and electrical stress.
Author Contributions
Conceptualization, L.M. and R.C.; Data curation, L.M. and M.D.; Formal analysis, M.D.; Investigation, L.M.; Methodology, L.M. and R.C.; Resources, L.M.; Software, L.M.; Supervision, L.M.; Validation, L.M. and M.D.; Writing—original draft, L.M.; Writing—review and editing, L.M. and R.C. All authors have read and agreed to the published version of the manuscript.
Funding
This research received no external funding.
Data Availability Statement
The data presented in this study are available on request from the corresponding author. The data are not publicly available due to industrial privacy constrains.
Conflicts of Interest
The authors declare no conflict of interest.
Abbreviations
| PHEV | Plug-in Hybrid Electric Vehicle |
| WLTP | Worldwide harmonized Light vehicles Test Procedure |
| RC | Resistance Capacitance |
References
- Conway, G.; Joshi, A.; Leach, F.; García, A.; Senecal, P.K. A review of current and future powertrain technologies and trends in 2020. Transp. Eng. 2021, 5, 100080. [Google Scholar] [CrossRef]
- Cardoso, D.S.; Fael, P.O.; Espirito-Santo, A. A review of micro and mild hybrid systems. Energy Rep. 2019, 6, 385–390. [Google Scholar] [CrossRef]
- Nitta, N.; Wu, F.; Lee, J.T.; Yushin, G. Li-ion battery materials: Present and future. Mater. Today 2015, 18, 252–264. [Google Scholar] [CrossRef]
- Raghavendra, K.V.G.; Vinoth, R.; Zeb, K.; Gopi, C.V.V.M.; Sambasivam, S.; Kummara, M.R.; Obaidat, I.M.; Kim, H.J. An intuitive review of supercapacitors with recent progress and novel device Applications. J. Energy Storage 2020, 31, 101652. [Google Scholar] [CrossRef]
- Conte, M.; Pede, G.; Rossi, E.; Vellucci, F. Supercapacitors Research and Applications at ENEA; ENEA (Agenzia Nazionale per le Nuove Tecnologie, l’Energia e lo Sviluppo Economico Sostenibile): Kista, Sweden, 2016; pp. 2–6. [Google Scholar]
- Farmann, A.; Sauer, D.U. Comparative study of reduced order equivalent circuit models for on-board state-of-available-power prediction of lithium-ion batteries in electric vehicles. Appl. Energy 2018, 225, 1102–1122. [Google Scholar] [CrossRef]
- Hinz, H. Comparison of Lithium-Ion Battery Models for Simulating Storage Systems in Distributed Power Generation. Inventions 2019, 4, 41. [Google Scholar] [CrossRef]
- Mehta, C.; Sant, A.; Sharma, P. Selection of three RC Branches in Equivalent Circuit Model of Lithium-ion Batteries for Improved Accuracy. Turk. J. Comput. Math. Educ. 2021, 12, 1478–1489. [Google Scholar]
- Morandi, A.; Lampasi, A.; Cocchi, A.; Gherdovich, F.; Melaccio, U.; Ribani, P.L.; Rossi, C.; Soavi, F. Characterization and Model Parameters of Large Commercial Supercapacitor Cells. IEEE Access 2021, 9, 20376–20390. [Google Scholar] [CrossRef]
- Johnson, V.H. Battery performance models in ADVISOR. J. Power Sources 2002, 110, 321–329. [Google Scholar] [CrossRef]
- Available online: https://www.molicel.com/wp-content/uploads/INR18650P26A-V2-80087.pdf (accessed on 26 April 2023).
- Available online: https://www.spscap.com/Data-Sheet/Data-Sheet_SCP-STA-Series_2017-2_EN-.pdf (accessed on 26 April 2023).
Figure 1.
3RC Equivalent model for the Li-ion cell.

Figure 2.
Complete equivalent circuit of an SC cell [9].
Figure 2.
Complete equivalent circuit of an SC cell [9].

Figure 3.
Simplified equivalent circuit of an SC cell [9].
Figure 3.
Simplified equivalent circuit of an SC cell [9].

Figure 4.
Comparison between simulated and experimental voltages.

Figure 5.
Experimental setup: B1…B8 Li-ion cells, SC1…SC3 supercapacitor, S1, S2 current sensors.

Figure 6.
Current trend in the two branches during a discharge of −140 A for 5 s.

Figure 7.
Current trend in the two branches during a discharge of −350 A for 5 s.

Figure 8.
Speed profile associated with Class 3 vehicles.

Figure 9.
Current profile used for the simulation model and the experimental test.

Figure 10.
(a) Current distribution—scaled WLTP Cycle—Simulation result. (b) Power distribution—scaled WLTP Cycle—Simulation result.
Figure 10.
(a) Current distribution—scaled WLTP Cycle—Simulation result. (b) Power distribution—scaled WLTP Cycle—Simulation result.

Figure 11.
Voltage profiles—scaled WLTP Cycle—Simulation result.

Figure 12.
Current distribution in both the configurations—Simulation results.

Figure 13.
Current profiles (experimental test, simulation) for −350 A, 5 s test.

Figure 14.
Battery branch current profile, experimental test, and simulation in parallel configuration.
Figure 14.
Battery branch current profile, experimental test, and simulation in parallel configuration.

Figure 15.
Comparison of the current absorbed/delivered by the battery pack in the two tested configurations—WLTP Cycle—Experimental results.
Figure 15.
Comparison of the current absorbed/delivered by the battery pack in the two tested configurations—WLTP Cycle—Experimental results.

Figure 16.
Voltage comparison—WLTP Cycle—Experimental results.

Figure 17.
Battery Pack Gaussian distribution in both the configs—Current—Experimental results.


| Molicel INR-18650-P26A (a) | |
| Nominal capacity | 2600 mAh |
| Nominal voltage | 3.6 V |
| End of charge voltage | 4.2 V |
| End of discharge voltage | 2.5 V |
| Rated charging current | 2.6 A |
| Nominal charging time | 1.5 h |
| Max cont. charge current | 6 A |
| Max cont. discharge current | 35 A |
| Volumetric energy density | 535 Wh/l |
| Typical impedance AC (1 kHz) | 20 mΩ |
| Shape | Cylinder |
| Weight | 50 g |
 | |
| SPSCAP 2R7STA-model (b) | |
| Nominal voltage | 2.7 V |
| Max voltage | 2.85 V |
| Nominal capacity | 3000 F |
| Accumulable energy | 3.04 Wh |
| ESR | 0.29 mΩ |
| Nominal cont. current for ΔT = 15 °C | 128 A |
| Self discharge rate | <5%/month |
| Diameter | 60.7 mm |
 | |
Table 2.
Main specifications of the Li-ion+supercap storage system.
| Maximum Voltage | 430 V |
| Nominal Voltage | 367 V |
| Nominal Energy | 5.23 kWh |
| Nominal Energy of Li-ion Branch | 4.77 kWh (91% of total) |
| Nominal Energy of Supercap Branch | 0.46 kWh (9% of total) |
| Li-ion Cells Weight | 25.5 kg |
| Supercap Weight | 76 kg |
Table 3.
Experimental test setup.
| Maximum Voltage | 8.5 V |
| Nominal Voltage | 7.2 V |
| Nominal Energy | 85.1 Wh |
| Nominal Energy of Li-ion Branch | 76.0 Wh (89.3% of total) |
| Nominal Energy of Supercap Branch | 9.1 kWh (10.7% of total) |
Table 4.
Comparison of the current/power simulation values, referring to the storage system in both the configurations.
Table 4.
Comparison of the current/power simulation values, referring to the storage system in both the configurations.
| Battery Pack without Supercap Branch | Battery Pack with Supercap Branch | ||
|---|---|---|---|
| Max Current Absorbed—Batt [A] | 24.6 | Max Current Absorbed—Batt [A] | 4.2 |
| Max Current Delivered—Batt [A] | −83.7 | Max Current Delivered—Batt [A] | −65.9 |
| Standard Deviation (Current [A]) | 18.5 | Standard Deviation (Current [A]) | 14.0 |
| Average Current—Batt [A] | −12.2 | Average Current—Batt [A] | −13.2 |
| Max Power Absorbed—Batt [W] | 207.1 | Max Power Absorbed—Batt [W] | 31.6 |
| Max Power Delivered—Batt [W] | −568.3 | Max Power Delivered—Batt [W] | −457.7 |
| Average Power—Batt [W] | −91.1 | Average Power—Batt [W] | −99.6 |
| Standard Deviation (Power [W]) | 135.4 | Standard Deviation (Power [W]) | 99.5 |
Table 5.
Current at the beginning and at the end of the discharge period for the −350 A, 5 s test.
| Experiment | Simulation | |
|---|---|---|
| Start discharge | 76% SC–24% Battery | 82% SC–18% Battery |
| End discharge | 60% SC–40% Battery | 63% SC–37% Battery |
Table 6.
Comparison of current and power experimental values referring to the battery pack only in both the configurations.
Table 6.
Comparison of current and power experimental values referring to the battery pack only in both the configurations.
| Battery Pack without Supercap Branch | Battery Pack with Supercap Branch | ||
|---|---|---|---|
| Max Current Absorbed—Batt [A] | 22.9 | Max Current Absorbed—Batt [A] | 4.9 |
| Max Current Delivered—Batt [A] | −83.7 | Max Current Delivered—Batt [A] | −63.1 |
| Average Current—Batt [A] | −12.7 | Average Current—Batt [A] | −11.6 |
| Max Power Absorbed—Batt [W] | 185.4 | Max Power Absorbed—Batt [W] | 34.9 |
| Max Power Delivered—Batt [W] | −539.8 | Max Power Delivered—Batt [W] | −421.6 |
| Average Power—Batt [W] | −90.1 | Average Power—Batt [W] | −84.2 |
Disclaimer/Publisher’s Note: The statements, opinions and data contained in all publications are solely those of the individual author(s) and contributor(s) and not of MDPI and/or the editor(s). MDPI and/or the editor(s) disclaim responsibility for any injury to people or property resulting from any ideas, methods, instructions or products referred to in the content. |
© 2023 by the authors. Licensee MDPI, Basel, Switzerland. This article is an open access article distributed under the terms and conditions of the Creative Commons Attribution (CC BY) license (https://creativecommons.org/licenses/by/4.0/).
Share and Cite
MDPI and ACS Style
Martellucci, L.; Dell’Aria, M.; Capata, R. Experimental Analysis and Simulation of Mixed Storage with Lithium-Ion Batteries and Supercapacitors for a PHEV. Energies 2023, 16, 3882. https://0-doi-org.brum.beds.ac.uk/10.3390/en16093882
AMA Style
Martellucci L, Dell’Aria M, Capata R. Experimental Analysis and Simulation of Mixed Storage with Lithium-Ion Batteries and Supercapacitors for a PHEV. Energies. 2023; 16(9):3882. https://0-doi-org.brum.beds.ac.uk/10.3390/en16093882
Chicago/Turabian StyleMartellucci, Leone, Mirko Dell’Aria, and Roberto Capata. 2023. "Experimental Analysis and Simulation of Mixed Storage with Lithium-Ion Batteries and Supercapacitors for a PHEV" Energies 16, no. 9: 3882. https://0-doi-org.brum.beds.ac.uk/10.3390/en16093882
Note that from the first issue of 2016, this journal uses article numbers instead of page numbers. See further details here.