

Multi-Power System Electrical Source Fault Review
by
 , , ,
, , ,
Mariem Hadj Salem
1,
Karim Mansouri
2,3,
Eric Chauveau
2,3,*,
Yemna Ben Salem
1 and
Mohamed Naceur Abdelkrim
1 1
MACS LR16ES22, University of Gabès, Gabès 6072, Tunisia
2
ESEO-Tech, 49107 Angers, France
3
Institut de Recherche en Énergie Électrique de Nantes Atlantique, IREENA, Nantes Université, UR 4642, 44600 Saint-Nazaire, France
*
Author to whom correspondence should be addressed.
Energies 2024, 17(5), 1187; https://0-doi-org.brum.beds.ac.uk/10.3390/en17051187
Submission received: 3 April 2023
/
Revised: 28 June 2023
/
Accepted: 14 August 2023
/
Published: 1 March 2024
(This article belongs to the Special Issue Power System Fault Diagnosis and Maintenance)
Abstract
:The phrase “Multi-Power System (MPS)” refers to an application that combines different energy conversion technologies to meet a specific energy need. These integrated power systems are rapidly being lauded as essential for future decarbonized grids to achieve optimum efficiency and cost reduction. The fact that MPSs multiply several sources also multiplies their advantages to be environmentally friendly and increases the possibility of energy autonomy as they do not depend on a single source. Consequently, this increases the reliability and reduces the production costs and the size of the storage system. However, the main disadvantages of such a system are the complexity of its architecture and the difficulty in managing the power level, which leads the system to face many faults and sometimes failure. In this case, a fault-tolerant control (FTC) system can automatically adapt to component malfunctions while maintaining closed-loop system stability to achieve acceptable performance. However, on the way to build efficient FTC, one first needs to study the faults that may occur in the system in order to tolerate them. This review paper presents the faults of the MPS electrical sources used in a hybrid system, including a photovoltaic generator and a diesel generator, plus a lead–acid battery as a storage device. Only the most-encountered faults are treated.
1. Introduction
Faced with the depletion of fossil fuels and global warming and also faced with global growth in energy demand, the development of clean energy sources seems increasingly necessary. In particular, renewable energy is an interesting alternative for the electrification of isolated or hard-to-reach sites that do not allow connection to an electrical grid [1,2] since fuel usage is intimately linked to greenhouse gasses and pollution emission. Unlike conventional energy sources, e.g., fossil or nuclear, renewable primary energies are inexhaustible in the very long term because they come directly from natural phenomena related to the sun, wind, hydraulic flows or the natural heat of the earth [3]. The conversion processes are pollution-free, and their availability is free [4]. In addition, fossil fuels are expensive, especially in remote areas where the cost of delivering the fuel to the site must be factored in. Fuel oil must be stored in many isolated areas, typically for the whole winter, reducing the quantity of fuel that can be used in order to limit storage expenses [5].
However, renewable energies sources (RESs) are intermittent in character. As a result, power fluctuations may be smoothed out by storing energy during periods of excess supply and returning it to the grid when need arises [2].
Due to the very uncertain nature and the non-tractable behavior of RESs, the combination of these sources to make a hybrid system is becoming more and more common. The latter is a set of electrical supplies provided by the coupling of two (or more) sources of different natures from both renewable and conventional sources: usually diesel generators, fuel cells and storage systems such as batteries [6]. The hybridization of sources allows rationing the use of the main source or providing a power supplement when the latter reaches its saturation power and to store the surplus power; it can especially introduce an additional degree of freedom in order to better manage the power by improving the global efficiency of the system [7]. This is called a multi-power system. However, we combine renewable energy sources with conventional energy sources to ensure the availability of electricity generation since renewable sources do not deliver constant power.
In this context, using several energy sources to build MPSs with an energy storage system necessitates an energy management system (EMS) to achieve the lowest MPS cost and the best balance of energy generation and consumption. This EMS is a mechanism for achieving optimal energy production while also meeting load demand in a cost-effective manner.
In recent years, analysis has shown a growing interest in the use of hybrid wind electrical phenomena with PV systems that give higher performance compared to the employment of only one of the parts thanks to complementary meeting of electricity demand [4]. The main goal of an MPS is to provide the energy required by the load and, if possible, to produce the maximum amount of energy from renewable energy sources while maintaining the quality of the energy supplied. These numerous components give these systems a complicated character and make them tough to research: it is difficult to choose and size subsystems and to manage the power level.
The creation of a multi-source system is therefore feasible in a number of complementary combinations. The study of [8] presents several architectures of multi-source systems. Let us give some examples of combinations mentioned in [8]. An Egyptian desalination unit was powered by a multi-source system including solar panels, wind turbines, a diesel generator and batteries as energy storage [9]. In a similar vein, a small remote town in Palestine was powered by a hybrid system consisting of solar panels, wind turbines and batteries [10]. The energy mix can also be used to power areas with higher electrical demand, such as entire islands. An MPS consisting of a marine turbine controlled by a permanent-magnet synchronous generator, a proton exchange membrane fuel cell system and a battery system was used by the authors in [11] to meet the electrical energy needs of residential loads on an island. In [12], the studied MPS is composed of photovoltaic panels, a diesel generator, batteries and a supercapacitor bank.
Due to the increasing demand for reliability and safety in MPSs, it is essential to detect and identify all types of anomalies and potential faults as early as possible in order to implement fault-tolerant control (FTC) or to minimize performance degradation and avoid dangerous situations that may create system downtime.
In order to maximize the energy production during the whole life of the MPS and achieve good FTC, it is important to be able to recognize when a fault occurs and identify its potential to cause significant damage to the MPS, risk to human health or life, and/or when the output power is reduced. FTC has the ability to maintain a certain level of acceptable, or degraded, performance after the failure occurs. In other words, for an MPS, FTC is able to change its mode of operation in case of failure of one of the sources and uses the stock of non-faulty sources and makes the decision according to the state of the MPS. As FTC works under the hypothesis that these faults are known in advance, it assumes that the identification and localization are already available and reliable.
It can be difficult to track mode changes with complex systems due to a variety of reasons:
- Faults produce unknown changes in a system, making it difficult to track mode transitions in the presence of faults;
- It may be difficult to distinguish between a fault and a mode transition in the presence of faults.
Furthermore, directly extending continuous system diagnostics by pre-enumerating all of the system’s operating modes and creating residuals for each mode to track and locate problems is computationally difficult [13]. Some of the methodologies that researchers have developed to solve the problem of fault detection and isolation in MPSs include state estimation [14], parity equations [15] and fault signatures based on temporal causal graphs [16]; further, model-based FDI techniques for complex systems have been designed extensively using the MSO methodology [13].
Hence, here is the interest of this paper, through which we present an overview of the state-of-the-art knowledge on the reliability of MPSs as well as on the degradation factors that influence its electrical sources in general. This paper is intended to provide a short and current introduction to this problem for the general reader, especially those who need to develop FTC for such a system in order to take defects into account. In the context of this review article, we find the literature that deals only with faults and their impacts for each of the considered electrical sources.
We can therefore notice that no study has been made to deal with the defects in the sources of the MPSs and their impact on the performance of the system, even with different architectures. References [17,18,19,20,21,22] presents various faults/aging mechanisms that occur in photovoltaic modules and their cause–effect relationships, such as discoloration, delamination, bubbles, AR coating degradation, corrosion, cracks in the cells, ribbon and solder bond degradation and broken interconnections, dust and soiling, PID, junction-box and bypass diode effects, localized heating phenomena and frame detachment, and the authors suggest several methods to diagnose most of these faults.
Throughout their service lifetimes, all batteries have performance losses that include a gradual reduction in capacity (loss of autonomy) and a rise in internal resistance, resulting in voltage decay and power loss. Battery aging occurs at varied rates based on storage or usage settings (temperature, charge/discharge rates, and voltage operation limitations), and each battery chemistry has its own aging characteristics. Several authors have attributed in their works the causes and effects of many faults occurring during the life of different batteries, such as lead–acid, lithium, nickel, etc. [23,24,25,26,27,28].
Rotating machines are vulnerable to many faults because they operate in a harsh environment, which can cause machines to break down and reduce service performance, such as manufacturing quality and operation safety. Much research [29,30,31] has been conducted in order to better understand the faulty processes of electrical machines and to develop techniques for detecting early failures. Depending on the fundamental cause of failures, electrical or mechanical problems in electrical machines can be categorized on a wide level. Aside from the standard vibration, current and voltage analysis, power, speed, flux and other factors are all of importance. Offline/online, with/without additional sensors, model-based, signal-based and other methods are all being investigated in great depth.
Converters, which have been considered as the core of many key applications such as electrical cars, data centers, aircraft power systems and hybrid systems, have lately attracted more and more attention as the power interface between energy storage devices and the DC link of microgrids. Fault detection and tolerance control in converters are becoming more important for ensuring a stable and resilient power system, particularly for sensitive applications where a sudden stoppage, loss of functionality or deterioration of performance might result in a disaster. Many publications analyze the key failure locations and mechanisms in converters, encompassing catastrophic and parametric faults from components to systems [32,33,34,35,36,37].
This review article present the different faults in the above-mentioned sources that can affect the electrical characteristics of each of them. Indeed, they also affect the current and voltage of the load. The configuration of this paper is arranged as follows: The second section presents the faulty modes of lead–acid batteries. Photovoltaic faults are the subject of the third section. Then, Section 4 is about the faults of electrical machines. A synthesis of whole hybrid systems is presented in the fifth section, and we finish with a conclusion.
2. Lead–Acid Battery Faults
Lead–acid battery technology has been effectively fulfilling a variety of energy needs, ranging from classic car industry requirements to current plug-in hybrid electric vehicle requirements [38] through any stationary system. Depending on the operating conditions, the battery can be affected in many ways. The same deterioration mechanisms affect all types of lead–acid batteries but to varying degrees. Two electrodes with the aqueous electrolyte (sulfuric acid) and the terminals are the main components of a lead–acid battery. A grid and the active material— as the positive active material and as the negative active material—make up the electrodes [39].
There are two types of lead–acid batteries:
- Open lead batteries with a sulfuric acid electrolyte diluted with distilled water: They have the particularity of being reliable accumulators whose technology is well-known since the 19th century and is mastered. They have the disadvantage of being strongly influenced by the ambient temperature, which strongly reduces their capacity. Moreover, they require regular maintenance (refilling with distilled water), as their electrolyte evaporates over time.
- Closed lead batteries with a gelled electrolyte: They have the advantage of being maintenance-free and easy to handle (no leakage) with stability perfectly controlled by the manufacturer. They have the disadvantages of being more expensive and having a shorter lifespan.
Corrosion, sulfating of the electrodes, stratification and loss of electrolyte and AM softening/shedding are the key lead–acid battery faults, which result in gradual loss of performance and eventually the end of the service life [40]. Stratification only concerns liquid electrolyte batteries: AGM and gel batteries are not affected by this phenomenon [41].
2.1. Corrosion
The creation and accumulation of a passive corrosion layer at the interface between the active material and the grid material of the positive plate is one of the key faults in LAB technology. This process has a substantial impact on battery functioning since the electrons created at the positive active material must overcome higher resistances to pass through the positive grid material and reach the external circuit [38]. Creep, stress corrosion and electrochemical attack all occur as the grid ages. Specially, corrosion accelerates the deterioration of the grid, making the positive plate expand in size. On the other hand, corrosion causes the grid latticework to weaken or disintegrate, eventually preventing the plate from transporting current to the load [42]. This is due to the internal resistance, which is affected by corrosion. As the corrosion layer thickens, the internal resistance rises; also, available capacity is influenced by corrosion [43]. Corrosion is due to a number of causes, but the three most important are battery voltage, the concentration of acid and temperature. Generally, increased voltages and higher acid concentrations accelerate corrosion significantly. High temperatures also play for an important role in corrosion: the greater the temperature is, the faster the corrosion is [42,43]. This affects the lead–acid battery’s charge/discharge mechanism [44]. In general, two forms of LAB corrosion have been recorded in the literature [45]:
- The growth of a layer between the alloy and the AM in deep discharge circumstances. Because of ’s weak electrical conductivity, recharging the active mass is difficult if not impossible in some situations.
- The oxidation of lead into at high anodic potential: This type of corrosion causes the irreversible oxidation of metal by generating enormous pits, which can cause the grids to break mechanically. This phenomenon happens during overcharging, particularly during high-current charging, which is sometimes known as boost charging.
With grids composed of lead–calcium alloys, a special issue occurs: namely, batteries might experience a fast walk down in deep-discharge capacity during cycling. This performance loss is more severe than that seen in batteries with lead–antimony alloys having > 1 wt percent and has been dubbed the antimony-free effect [46]. The mechanical characteristics, micro-structure, electrochemical behavior of active materials and corrosion layers on the – electrode are all affected by the antimony concentration [47,48]. Also, corrosion changes the current/voltage properties of the battery [49].
2.2. Non-Cohesion of Active Material
A prominent aging component in batteries subjected to cycle regimes is the loss of cohesion between individual particles of the PAM. Softening and shedding faults create the non-cohesion of active material; this presents flaws in electronic contact between the AM and the grid [50,51]. Because of the difference in substance volume, the conversion of active material to causes expansion and contraction of positive electrode volume during charging and discharging, resulting in softening and shedding of active substance over time [52]. Shedding occurs when the active material from the plates falls to the bottom of the battery and gathers. It eventually drives battery cell shorting [53] if sufficient material builds up at the bottom casing to generate an electrical short. It also can be a result of overcharging the battery (as gassing bubbles can separate the AM from the electrodes), frequent cycling and expansion of the positive plate [50]. The softening of active material is seen after the battery has been used for a while. It manifests itself as a rapid loss of capacity due to a decrease in AM density below a threshold value. When the AM touches the electrolyte, the ions of the latter flow into the particles and agglomerates, modifying the ratio between the crystal and gel zones and causing the particles to amorphize [43]. This causes a drop in AM density below a critical value and, as a result, softens the AM, resulting in rapid capacity loss; as a consequence, the battery’s cycle life is reduced [54].
2.3. Sulfating of the Electrode
In sulfuric acid, lead sulfate is sparingly soluble and accumulates as particles on active materials during discharge. This sulfate crystal forms on both the negative and positive plates. If the battery is left discharged or undercharged for a long time, it turns into a high-resistance coating. In other words, if the LAB is not working properly, this sulfate grows, and big sulfate crystals are formed [55,56]. Because the latter do not dissolve easily during the charging process, irreversible sulfate is formed [53,57]. This leads to battery failure because active materials are depleted, and the formation of sulfate increases the battery’s resistance while also reducing the area available for charge transfer processes [58]. The crystallized lead sulfate not only does not participate in the process, but it also adsorbs on the electrode plate’s surface, increasing the battery’s internal resistance and affecting the battery’s charge and discharge performance as well as capacity [40,59]. The consequence is the formation of an insulating electric layer, which slows the acid diffusion. In AGM/VRLA batteries, reversing sulfation is not practical due to the fact that the specified sulfation-reversal voltage is sufficient to motivate out-gassing through the battery’s stress-relief valves [42,53], resulting in battery degradation due to electrolyte loss. Sulfated AGM/VRLA batteries need to be replaced [42]. The results of the effects of sulfation are [60,61,62]:
- Loss of capacity;
- Loss of voltage;
- Increase in internal resistance;
- Decrease in sulfuric acid concentration.
These effects are also demonstrated in [39,62,63]; the authors of these references investigated the structure and recrystallization of hard crystalline lead sulfate in depth and obtained a good grasp of it using a different experiences; they highlight the following points: Lead sulfate crystals are produced and expand over time when a lead plate with lead oxide on the surface comes into contact with sulfuric acid. Thus, the charge/discharge reactions of the battery do not proceed in the same way, and as a result of the decreased reaction site area per unit volume, the current is reduced.
2.4. Temperature’s Influence on LABs
A battery’s optimal working temperature is 25 °C. In general, the battery performs best when the electrolyte temperature is kept at a reasonable level [55]. Temperature has a significant impact on battery aging. LABs have bad low-temperature overall performance due to the rate of the electrochemical reaction of AM and the ionic diffusion velocity decreasing at low temperatures [43,55]. Further, low temperatures suppress the electrochemical charge–discharge reaction process, resulting in capacity loss; moreover, this range of temperatures facilitate the formation of an irreversible passivation layer on the negative electrode [43], leading to irreversible sulfation and battery failure. This irreversible sulfation can be eliminated by high temperatures; however, when the temperature rises, grid corrosion and hydrogen evaporation at the electrodes—causing water loss (overcharging or self-discharge)—also increase. In other words, sulfation occurs when a battery is charged at too low a voltage (undercharging). Excess battery gassing, electrolyte loss and rapid grid corrosion result from charging at too high a voltage (overcharging), deformation and erosion of the plates as well as overheating [49]. As shown in Figure 1, excess gassing in AGM/VRLA batteries causes battery dry-out, which leads to failure.
To analyze the impacts of those faults on the electrical components of LABs, we present in Figure 2 a simplified electric circuit of a battery.
Where:
- is the total potential of the battery (, are the potentials of the positive and negative electrodes, respectively). This potential depends on the electrolyte used because it determines the number of electrons that are released when the metal is dissolved. So its variation means that an electrolyte fault has appeared.
- is the battery’s internal resistance and is the sum of the connector resistances , and the resistance of the electrolyte . Fluctuation of this resistance demonstrates the presence of the stratification or the mechanical degradation of the electrodes.
- , is the double-layer capacitance on each electrode. This capacitance is due to a distribution of the charge between the electrode and the electrolyte.
- , is the resistance of charge transfer representing the charge transfer phenomenon. Corrosion of the grid occurs as a result of this fluctuation over the battery’s life cycle; more precisely, if , with .
- , corresponds to the diffusion phenomenon. This is obtained by the concentration degree of the electrolyte close to the electrode. Its deviation from the maximum value () expresses that the LAB is sulfated.
During the LAB’s cycle life, obviously these parameters change, including an increase in the internal impedance and an increase in the voltage drop of charge transfer and diffusion during discharge. Because grid corrosion, PAM softening, shedding or sulfation and other faulty states are all linked to battery charging, the charge regime has a significant impact on the cycle life of the LAB [64].
In addition to lead–acid batteries, we find nickel-based batteries: there are batteries that have almost replaced batteries, which have cadmium recycling problems. batteries have a high energy density and can be completely discharged without affecting their lifespan. They have the disadvantage of being of low capacity, which makes these batteries rather intended to feed portable devices where the autonomy rarely exceeds a few hours.
The third type of batteries is lithium-based, which are divided into:
- Lithium metal: dangerous and explosive;
- Lithium ion: stable, with the highest energy density on the market;
- Lithium polymer: promising dry technology.
Their high discharge capacity (six times better than sealed lead) is their great interest, but their price is still prohibitive.
Due to the different materials and strategies used in each in each of these batteries, they do not share the same faults and the same effects. However, corrosion in lithium batteries—observed in lithium-powder-based electrodes (Lip-electrodes)—affects the delivered capacity of Lip-electrodes and increases the overvoltage of the lithium electro-dissolution process [65]; this can be observed in the aluminum electrolyte in Li-ion batteries [58,66]. This phenomenon in lithium batteries is the result of volume changes that occur during the conversion of hydrogen solid solution to the hydride phase during cycling [67,68,69]. Cobalt, nickel and lithium suffer from sulfate leachate of cathode scrap, which occurs during the processing of Li-ion batteries [70,71] and deals with the selective recovery of nickel and lithium from sulfate leachate using extractive separation.
3. Photovoltaic System Faults
Photovoltaic panels are composed of solar cells interconnected to each other and protected from the environment by a transparent material on the front side and by another material on the backside. Two main families of photovoltaic panels are available on the market: the first family includes crystalline silicon modules including mono/poly-crystalline, and the second family includes thin-film panels [72]. There are also amorphous silicon (), copper indium selenium (CIS) and cadmium telluride panels (). All these technologies use a single junction and have a low efficiency below .
In order to improve this efficiency, a new technology for PVs has been built, called multi-junction concentrated solar panels. Multi-junction solar cells are used in concentrated photovoltaic systems. This type of photovoltaic system is particularly suitable for regions with high levels of sunshine and uses a Fresnel lens to concentrate the sun’s rays and thus minimize photon losses and maximize the amount of electricity produced. These cells have a very high efficiency potential of up to but are very expensive.
PV systems are subject to various types of faults. These can be related to many factors, such as material interactions (connector corrosion, yellowing, browning of encapsulation material, discoloration of bus bars, etc.) and environmental factors such as soiling and shading. Soiling refers to the accumulation of snow, dirt, dust, leaves, pollen and bird droppings on the PV panels [73,74]. PV modules are the power-generating subsystem, and any fault related to their operation impacts the PV system’s overall performance [75].
3.1. PV Shading Fault
Shading can be caused by soiling or by obstacles such as trees, buildings or chimneys or other rooftop structures. In this case, it is called dynamic shading. On the other hand, bird droppings, leaves and accumulated dirt are examples of things that have attached to the glass surface of the PV modules, causing static partial shadowing [76,77,78]. Thus, there are two categories of shading: total shading affects all cells, and partial shading affects only some cells. Because of the electrical properties of the interconnected solar cells in the array, the shadow effect is more evident in photovoltaic systems than in thermal ones. Furthermore, and for the same reason, the shape and change of the shadow during the day can have a significant impact on the performance of a solar system [79]. In most PV systems with conventional silicon panels, shading has a disproportionate effect on the system’s performance. The main consequence of shading is a reduction in the power generated by the solar system [80] through two mechanisms:
- By reducing the energy input to the cell;
- By increasing energy losses in the shaded cells [81].
The amount of power loss depends on the size of the shadow and the reduction of light intensity falling on the PV modules [80,82]. Solar module manufacturers typically incorporate one or more bypass diodes into their modules; these are usually located in the module’s junction box. Since the bypass diode short circuits the partially shaded section, reducing its operating voltage to zero, the total operating voltage of the PV string is reduced accordingly. Shading leads to a distortion of the I-V and P-V curves of PV modules. Figure 3 depicts an example of these curves’ response for a solar module with various percentages of shadows cast on different cells with different irradiation. When the string voltage surpasses the bypass diode’s transmission voltage, it becomes active and short circuits the shaded PV cells. When shading occurs, even if only a few cells are shaded, these cells are forced to carry the same current as other cells receiving sunlight. Therefore, the shaded cells may receive a reverse bias. In this case, the shaded cells behave like loads and draw current from the fully illuminated cells [77,83,84,85]. Since the reverse-biased diode brings high resistance that consumes power, this results in an important reduction in the load current [81].
We can find the same result of these curves in [77,78,84,87,88,89,90]. Irradiance is greatly reduced when shading arises, such as on a very overcast day. The PV array open circuit voltage may be substantial after irradiance approaches the minimum necessary level. Thus, even if the output current is extremely low or even zero under a shading state, the system is not dormant. A high voltage might still be generated by the PV array [78], as presented in Figure 3. At higher voltages, shading causes a reduction in the operating current and MPP of the system. Yet under specific operating conditions, both local and global maxima in the PV characteristic curves can occur (Figure 4). Symptoms observed during shading include [91]:
- A reduction in the maximum power point;
- The open circuit voltage decreases for a very low transmission coefficient;
- An inflection point;
- Reduction in the short circuit current .
We remark that under shaded conditions, the I-V curve exhibits several peaks, which depend on the particular type of shading applied. These peaks prove the deterioration of the PV system efficiency under shading conditions, as the maximum power generated is reduced. Due to the electrical properties of solar cells, the power losses are not proportional to the shaded areas; rather, they are larger [92]. Therefore, even a few shaded areas can drastically reduce the performance of the entire PV system. In addition to the power losses, backward shading can cause the solar cell to overheat. If the PV module is not protected, hotspots can occur; in extreme cases, this leads to permanent damaged [80].
Figure 4.
I-V/P-V general form under shadow [93].
Figure 4.
I-V/P-V general form under shadow [93].

These results are confirmed also in [73]: the authors propose a very simple, robust and low-cost fault detection and classification technique for PV shading problems based on real electrical measurements (I-V). They demonstrated that in shaded situations, all I-V curves have multiple peaks that may be explained by the status of the bypass diodes in relation to the number of the shadowed cells, resulting in system efficiency loss as its maximum output power is lowered. The worst-case shading rates for ordinary silicon cells are predicted to be in the region of 20–. If no bypass diode is present, the particular shading rate increases with the number of cells in the sub-string until it reaches [94].
The effects of partial shadowing on the performance of poly-crystalline and mono-crystalline photovoltaic modules are investigated in [88]. Significant variation in performance between the two PV typologies is not noticed. According to the findings, when adjusting the shade profile from 0–, the produced current decreases. Half-shading () of a single PV cell reduces the PV module’s power output by more than , which leads to the high importance of the bypass diodes. These diodes allow each module to be divided into many portions, decreasing the production loss caused by shadowing circumstances.
3.2. Bypass Diode Faults
PV modules have bypass diodes placed to limit the maximum reverse voltage that can occur if certain strings on the cells are shaded or fail [87,95]. Each diode is reverse-biased under normal conditions with no shadowing, and all cells generate power. When a cell is shaded, it stops generating, becomes high-resistance, and is reverse-biased by the other cells, enabling the diode across the cell to conduct and bypass the shaded cell [87,96]. As a result, solar cells in a PV module linked to a faulty bypass diode have a short circuit [97]. If a cell is reversed at a greater voltage than it was designed for, hotspots can form, resulting in browning, burn scars or, in the worst-case scenario, fire [17,98]. In terms of PV performance, security and reliability, bypass diode flaws have the greatest risk level of all types of faults. In reality, malfunctioning bypass diodes are frequently the source of the highest PV module power loss [99].
In good conditions, when the sum of the voltages of the cells that the BP diode protects is negative, it is On, and it is blocked in the contrary case [100]. This protection is no longer guaranteed in a faulty state due to the electrical faults connected with this diode, which are a shorted diode (Figure 5) and an open circuit diode (Figure 6) [101]. A flaw in the shunted mode can short circuit the sub-cells of the module that it is supposed to protect, and one-third of power is lost in a 60-cell module with three bypass diodes [99,102]. According to the curve analysis and to [97,103], the consequences of this fault are:
- Reduction in the maximum power point;
- The short circuit current does not change;
- The open circuit voltage is reduced according to the number of shorted diodes.
When bypass diodes fail in an open circuit, it means that the conductor carrying the current is accidentally disconnected, causing a reverse current to flow across the cells and modules of a series-connected string [99,102,104]. An open circuited bypass diode is the same as having no bypass diode across the solar cell string.
- The open circuit voltage is unchanged;
- The short circuit current decrease sharply with the number of shaded cells;
- Slope deviates from the normal curve.
The last scenario is when all PV module bypass diodes are open circuit due to heavy shadowing. The decrease in the is acquired from the beginning of the I-V curve. This loss of current has a substantial impact on the PV module’s output power [89].
To conclude, in shorted bypass diode faults, the PV array’s maximum power and drop dramatically, yet the short circuit current remains the same as other regular strings, but otherwise, for an open circuit fault, it is the which decrease leading to a power loss also. Short circuit diode faults result in a considerable loss of power in the module, making them simpler to identify. Open circuit faults do not result in a dramatically loss of power and are thus difficult to detect; nonetheless, they can result in fire dangers owing to the creation of hotspots [101,102]. This is due to the fact that an open circuited bypass diode cannot prevent larger reverse voltage from being applied across the cells [102].
3.3. Hotspot Problem
We can divide the light that heats the PV modules into the normal part of thermal energy and the abnormal heat that causes the hotspot. The latter is defined as a condition in which a portion of a cell or PV module is hotter than its surroundings. When the operational current of a PV module exceeds the short circuit current of a shaded or faulty cell in a cell string, hotspot heating occurs [94,105,106]. In other words, when the current capacity of one or more cells in a PV module is less than the operational current of the cell string, hotspots form [75]. Forcing the cell to become reverse biased due to reverse polarity, this shaded/defective cell could overheat and cause a fire or electrical danger; as a result, solder and silicon melt and the encapsulant and backsheet deteriorate [106,107,108]. In both thin-film and modules, hotspot faults are known to cause reliability issues [109]. The operating temperature of a shaded cell is determined by the leakage current distribution and current density in the cell area. Even if there is no junction breakdown, overheating can result in encapsulant or back insulation melting, soldering joint fracturing or glass breaking [17]. The test results in [92,110] illustrate that the I-V and P-V curves with hotspots have various characteristics based on the distribution of the hotspot. Hotspot faults can be classified into two types: step-type and non-step-type, as shown in Figure 7.
The figure shows I-V and P-V curves of non-step-type/step-type hotspot modules. On this subject, the authors in [92] detect the linearity of the AB line by using Point A and Point B to establish a linear equation (as shown in Figure 7: Magnification of A–B interval) and calculate the distance between the current–voltage curve and the linear equation to identify the type of hotspot.
Based on these illustrations, we can see that the I-V curve has a significant variation relative to normal operation, which results in a remarkable decrease in the maximum power point. We can conclude also from these figures that in the non-step-type hotspot fault, we find variation to the , while the is almost the same. In the second type of hotspot failure, the I-V curve has the same shape as in the shading fault: it presents two peaks, leading the to decrease more and resulting in a significant decrease in the maximum power. This non-linearity in the I-V curve is also presented in [111]. Here, the authors suggest a detection method for PV hotspot faults based on the study of 2580 PV modules impacted by various forms of hotspots located across the UK and operating under varied climatic circumstances. A 20-year field investigation in [112,113] discovers that hotspots are a significant driver of damage during the lifespan of a PV system. Based on the test results, the most-interesting finding is that throughout the first 11 years, the mean recorded maximum power gradually declined , and then it declined an additional over the remaining 9 years. This totaled a decrease over 20 years. showed the least change over the last two decades, implying that the power loss in the modules is mostly due to a decline in the modules’ current. According to the findings of [114,115], the worst-conceivable scenario of hotspot heating occurs when the power dissipation of partly shaded cells surpasses the MPP of the remaining bypassed cells when a large fraction of the cell area is shaded.
3.4. EVA Discoloration
Encapsulation is the physical technique that protects solar cells from environmental/weather effects such as moisture, rain, UV radiation, mild mechanical stresses like twisting or bending and low-energy impacts (hail, projectiles, etc.). As a result, an encapsulant material is used to encapsulate and preserve PV modules [116]. The color of the material used for the photovoltaic module’s encapsulation, which is usually EVA, or the adhesive material between the glass and the cells changes as a result of ultraviolet rays combined with water at exposure temperatures above 50 °C, causing a change in the chemical structure of the polymer. The encapsulating material may yellow or brown [74,117,118]. This affects the transmittance of the encapsulant to the cells, resulting in a reduction in the power provided by the module. Discoloration typically leads to lower performance but not necessarily to failure [119].
Although discoloration may appear before module current (and hence power generation) is verified to be decreasing, EVA discoloration is predicted to contribute of the deterioration that is usual for Si-modules [17]. Jordan [120] found that the main driver of long-term power loss for crystalline silicon PV modules was a drop in the short circuit current due to the discoloration of the encapsulant with negligible loss in the fill factor in a recent survey evaluating field data. The analysis is based on two facts: (1) discoloration is known to produce a steady drop in power generation, and (2) discoloration is known to increase at higher temperatures, which is consistent with the greatest degradation observed in the desert. These results are also supported by numerous studies [120,121,122,123,124] mentioning the discoloration effect of EVA.
The effect of EVA yellowing/browning on electrical performance and efficiency was investigated in [80] using crystal-Si reference cells with and without a degraded EVA sample superimposed. The measured open circuit voltage (), short circuit current density (), maximum power () and calculated loss percentage for the clear and the degraded yellow–brown EVA films shows that when the Si cell is covered with a clear EVA film, it loses about 6.7% of and 0.8% of . However, with the yellow–brown EVA films, the loss increased to 12–14% for and 14–16% for . The loss of was relatively small. The Si cell efficiency of 11.6% changed to 10.7% with the clear EVA and to 9.7% with the yellow–brown EVA; this represents a net loss of 9.3% of the original efficiency when the EVA color changes from clear to yellow–brown.
These results are also demonstrated through the study of Ralini [125], which presents the behavior of a 21-year-old photovoltaic plant sited on the roof of the Scuola Universitaria Professionale della Svizzera Italiana. Through this study, different types of color changes affected ASI 16-2300 modules, such as yellowing of the encapsulant and yellowing/browning. The correlation between the electrical properties and the discoloration of the encapsulant material showed that completely yellowed modules have a higher loss (10–13% below nominal) than white or partially yellowed modules (6–8% below nominal). The I-V characteristics of the same two modules are compared in Figure 8.
The effect of PV browning/yellowing on module performance degradation is less accurately quantifiable due to the presence of additional faults that could affect module efficiency. The authors of [126] summarize the results of studies on the degradation processes of Melouka central PV modules in the Adrar area of Algeria after 28 years of exposure to the Saharan environment. Visual inspection of PV modules revealed the following main deterioration modes: encapsulant discoloration, cracked and abraded glass, delamination, discoloration, cell hotspots, oxidation of front grid fingers and thermal shocks. Experimental results of dark-brown discoloration of EVA led to a performance loss in , , and FF of 32.74%, 23.64%, 0.1% and 14.95%, respectively, reducing the I-V curve. , on the other hand, did not degrade. The authors mentioned that the enhanced reflection of light in the affected zone is the main cause of greater degradation. For this module, oxidation of the front grid, changes to the anti-reflective coating and corrosion in the junction box were noticed. Even though the structures of the panels change from mono-crystalline to poly-crystalline, thin-film and other types, there are common faults in all technologies, especially faults caused by the external environment, such as shading, which can be a consequence of dust, buildings, clouds, etc., or hotspot problems and the degradation of the bypass diode as a result of these two faults.
4. Defaults in Electrical Machines
The essential purpose of electrical machines is the transformation of energy from one form into another, with at least one of these forms being electrical and the other being either electrical or mechanical. Electrical machines that produce electrical energy from mechanical energy are commonly called generators, dynamos or alternators depending on the technology used. Electrical machines producing mechanical energy from electrical energy are called motors. However, faults in rotating machines are the same because they have the same strategy and the same main components, including stators, rotors, collectors, etc. The origins of faults in these machines are multiple. They can come from manufacturing problems, electrical insulation, motor overheating, aging of components, humid environments or other sources. Machine failure can be ascribed to a variety of faults, including drive inverter faults, stator winding insulation breakdown, bearing issues, and air gap eccentricity, to name a few [127,128].
- Electrical faults on the rotor, including an opening or short circuit on the coils for wound rotor machines or a shorting bar and/or ring or cracks for squirrel cage machines;
- A phase opening or a short circuit manifests electrical faults on the stator within the same phase, between two phases, or between a phase and the stator frame;
- Mechanical faults on the stator core or rotor, such as bearing, eccentricity and alignment faults.
Due to the symmetry of electrical machines, any fault induces a level of distortion of the magnetic field rotating in the air gap of the machine. This causes the appearance of harmonics on the measured signals that characterize these faults. The relevant measurement signals can be electrical or mechanical and can include current, voltage, flux, torque and speed. Coils constitute the stator and the rotor of both the DC motor and the SG, so we address the faults in the winding, which are: inter-coil short circuits, short circuits between two phases, or short circuits between a phase and the stator frame. However, the impact of these faults is different on each machine. The mechanical faults are also the same for both machines. We note that bearings (40–50%) and stator insulation (30–40%) are the most-common motor failures according to [129]. There is also a demagnetization fault that presents in machines that consist of a rotor equipped with permanent magnets, such as PMSM, etc. Under normal conditions, this magnet produce constant rotor flux. However, this flux can vary for many reasons: high temperature can reduce the remnant induction of magnets and cracks can form in the magnets during their manufacture and can lead to their disintegration and thus their deterioration [130]. We can also find faults of sensors and actuators in electrical machines, as in [131,132,133]. The authors diagnose speed sensor faults in a PMSM using several FTC methods such as backstepping an active fault-tolerant approach and fault diagnosis with sliding-mode control and fuzzy logic control.
4.1. Mechanical Faults
Mechanical faults can be grouped into several categories: the most common faults for electrical machines are bearing and eccentricity faults.
- Bearing faults: The two basic types of faults in bearings are single-point/localized faults and generalized roughness/distributed faults. The former commonly manifests itself as pits, spalls or fractures on a raceway or rolling component, while the second one includes waviness, off-size rolling elements, surface roughness and misaligned races [134,135]. Contamination, material fatigue, severe environments, corrosion, and other factors cause this type of fault; however, insufficient lubrication and incorrect fabrication with respect to the material’s size are the primary reasons for bearing faults [136,137,138]. Ball bearings are the most-prevalent type of bearing used in industry, including the machines that we use. Single-point faults are common in this type of bearing. Bearing-related problems do not cause instant failure; instead, they develop over time until the equipment fails catastrophically. These failures, however, result in both costly repairs and downtime [137].There are three types of single-point faults in ball bearings: (1) a fault in the outer race (ORF), (2) a fault in the inner race (IRF), or (3) a ball bearing fault (BBF) [136,137], as shown in Figure 9. Because of such faults, the geometric precision of the rolling contact surfaces begin to worsen and the bearing performance gradually deteriorates, resulting in increased deflection, friction, temperature, and vibration. All the mentioned problems cause a harmonic in the motor output torque. This also affects the damping coefficient, which changes both the armature current and speed and lastly the bearing vibration pattern itself, the fault frequency of which is exactly proportionate to the motor speed [127,136,139]. Bearing problems might introduce additional components into the current of the stator [140]. According to [141], an equation can be used to predict some of these components. This equation is based on the idea that the machine vibration’s typical fault frequencies are reflected in the stator current. Based on the fact that the rotor is supported by rolling-element bearings, a bearing problem causes fluctuations in the machine’s air gap length. The current in the stator fluctuates as a result of these differences.Furthermore, unlike other motor faults, which may be properly diagnosed by electric signals (stator inter-turn, broken rotor bar, etc.), the peculiarity of a bearing fault rests in its multi-physics character. The aberrant electric signal is initiated by the main mechanical vibration caused by the bearing fault [127]. Much research [142,143,144,145,146] has been carried out to understand the mechanisms of bearing vibration and noise production. Due to varied compliance or the existence of faults in bearings, they operate as a source of vibration and noise.
- Eccentricity fault: In theory, the combination of a stator and a rotor is perfectly concentric. However, during the assembly process of the rotor and then the operation, eccentricities can appear at the air gap [127,147,148]. An air gap eccentricity of up to 10% is permitted in practice [149]. Around 80% of mechanical faults lead to eccentricity, while the direct occurrence of such a problem is also possible [150,151]. Circuit inductance fluctuates with the presence of air gap eccentricity, resulting in asymmetrical air gap flux distribution. The stator and rotor are subjected to electromagnetic forces as a result of this imbalance. This electromagnetic force is determined by the eccentric rotor motion in terms of angular velocity and the movement of the rotor axis away from the stator axis. Winding arrangements, loading and slotting all have significant influence [127]. Eccentricity faults are divided into three types [137,149,150,151,152,153,154,155,156] as shown in Figure 10:
- Static eccentricity faults are generally caused by a misalignment of the rotor’s axis of rotation with respect to the stator axis: in other words, the center of the rotor is fixed but is not coincident with the center of the stator. The most-frequent cause is a centering fault of the flange.
- Dynamic eccentricity can be caused by bent shafts, mechanical resonances at critical speeds and bearing wear. It is considered dynamic when the rotor center does not coincide with the axis of rotation.
- Mixed eccentricity is a combination of static and dynamic eccentricity. Both the rotor and rotation axes are displaced from the stator axis in this state, resulting in a more-difficult geometry condition.
Figure 10.
Eccentricity faults: (a) centric rotor, (b) static type and (c) dynamic type [157].
Figure 10.
Eccentricity faults: (a) centric rotor, (b) static type and (c) dynamic type [157].

Eccentricity faults have certain impacts on the machine, including accelerated bearing wear, unwanted and potentially harmful vibration, increased losses, reduced efficiency and excessive heating. If left unresolved, this fault tends to cause rotor–stator friction and eventually destruction of the core and stator winding. The authors of [147] treated eccentricity faults for a salient pole SG using the theory of the modified winding function method (MWFM) to simulate and model the static, dynamic and mixed eccentricities. Using this approach, they managed to calculate and analyze the air gap permeance so that the machine inductances were calculated properly. The results show that eccentricity faults increase the magnitude of, distort the distribution of, and alter machine inductances. The stator current spectrum was also determined in a healthy state and in a fault generator; this demonstrated that eccentricity causes the amplitude of harmonic components to rise, which may be utilized as an appropriate index to distinguish eccentricity occurrence and diagnose its degree. The authors of [148,149] analyzed eccentricity faults in a DC motor. They used the winding function theory to model a DC motor with an eccentric rotor fault and performed simulation using a non-symmetric air gap function. They propose a new equation to characterize the DC motor’s rotor slot harmonics. They demonstrated that the armature itself and the mutual inductances are affected by a non-symmetric air gap, resulting in additional harmonics in the armature current.
Radial unbalanced magnetic pull (UMP) between the inner stator and the outer rotor circumference is caused by eccentricity faults. These imbalanced radial forces might cause the stator and rotor to rub, causing damage to both the stator and the rotor [158,159,160,161]. Since the eccentricity faults change the air gap, the flux connections relocate. The less flux that penetrates the rotor, the higher the eccentricity [152].
4.2. Electrical Faults
Short circuit faults usually start with a localized short circuit between several turns of the same winding (inter-turn short circuit) due to degradation of the insulating material covering the conductors. This type of phenomenon can also degenerate into generalized short circuits, such as short circuits between phases or between a phase and ground [129,162,163]. Short circuits between turns of the same phase can occur either at the winding heads or in the slots, which leads to a reduction in the number of effective turns of the winding [156,163]. This increases the affected phase stator currents. A slight variation in the amplitude of the other phases changes the power factor and amplifies the currents in the rotor circuit. This results in an increase in the winding temperature. As a result, accelerated degradation of the insulators can cause a cascade fault (appearance of a second short circuit) [162,164]. On the other hand, the average electromagnetic torque delivered by the machine remains substantially the same except for an increase in oscillations proportional to the fault [164].
According to simulation and experiment results in [165], after an inter-turn short circuit of the field winding in a synchronous generator, unbalanced branch currents occur inside the stator phase windings. These currents contain some fractional or even harmonic currents in addition to the fundamental and other odd ones, and a series of harmonic components, including the even ones, will appear in the field current.
Inter-phase short circuits occur preferentially in the coil heads since it is in these parts that the phase conductors of different phases meet.
The occurrence of a short circuit close to the supply between phases induces very high currents that will lead to the fusion of the supply conductors and/or to disjunction by protection systems [156,164]. On the other hand, a short circuit close to the neutral between two phases generates an imbalance without causing the fusion of the conductors [164].
A short circuit between the winding and the frame is of no material significance. Except for capacitive effects, the frame takes the potential of the winding in the place of the short circuit. On the other hand, in terms of personal safety, this type of fault can be very dangerous. It is then necessary to install protective devices (differential circuit breakers). In the presence of this type of fault, the voltage of the concerned phase does not change. However, the current flowing in this phase increases with the reduction in the resistance and the inductance [162]. This increase in current results in an increase in temperature that can lead to insulation faults in the winding [166]. Measurement of the leakage current can allow the detection of this type of fault.
The faulty modes associated with the winding mostly involve a topological modification of the stator circuit of the machine under consideration with the appearance of short circuit loops. They can appear at different locations depending on the topology of the winding.
Generally, following a short circuit, vibrations and torque oscillations appear; these are synonymous with the presence of new components in the electromagnetic torque and, consequently, in the stator currents [162].
As described in [167], multi-sensor data were used to diagnose and detect a winding short circuit in a DC motor. By intentionally shorting two windings of the stator coil, an abnormality in the electromagnetic commutation was induced. Due to this fault, considerable heat was created at the stator coil at first. Later, the DC motor began to degrade, resulting in irregular noise and vibration over time.
Most of the synchronous machine’s problems occurred in the rotor and stator windings owing to insulation degradation or an excessive temperature rise. Furthermore, the rotor of a synchronous generator is more susceptible to short circuit faults caused by harmonics from power electronic sources than from the stator winding, which conducts sinusoidal current [52]. In the study [168], the authors used several indices (current, voltage and air gap magnetic flux) based on electrical approaches for detecting rotor short circuit faults in big synchronous generators. They discussed the effects of short circuit faults on the MMF. Since the current flow in the shorted turn is in the opposite direction of the usual current flow, this generates MMF in the opposite direction of the main mmf component.
The magnetic field and MMF of a two-pole salient pole synchronous generator is also estimated in [169]. The authors demonstrate that the mmf decreased in the first and third poles and increased in the fourth pole due to the short circuit fault. In [153,154], the effects of short and open circuit armature coils are investigated using a mathematical model. Experimental results present that voltages, currents (such as excitation current or armature current), electromagnetic torque and rotor velocity are all affected by shorted and damaged rotor coils and suggest that armature coil short circuits can be detected using field current harmonics.
The authors of [155] investigate the consequences of various fault modes during an early stage in their development of a brushed DC machine. The scenarios that were considered include: field winding short circuit, armature winding faults, brush resistance increase (uneven wear), commutator bar short circuit, etc. Simulation of a shorted field winding presents that less armature voltage is generated in relation to the field current magnitude, which affects the motor speed since the armature voltage is speed-dependent. Faults to armature windings were then simulated, including short and open circuit faults. When compared to healthy performance, there was a significant increase in field current at the pole-passing frequency in both cases.
These types of faults do not only occur in synchronous and DC machines: they can also appear in all rotating machines, such as asynchronous, induction, etc. The following flowchart as illustrated in Figure 11 summarizes the electrical and mechanical faults of rotating machines discussed and not discussed in this article.
5. From Low-Level Fault to High-Level Effect
In this section, we try to analyze the effects of source faults on the continuity and degradation of a hybrid system. In Figure 12 below, we try to synthesize all the faults explained in the previous sections.
From a general point of view, most of the mentioned faults influence the power generated by degraded sources. In the case where only the battery is faulted, this may not cause a problem in the hybrid system’s reliability because if the PV cannot feed the demand of the load, the diesel generator will compensate for the difference. Otherwise, when the power generated by the PV exceeds the load demand, the battery should charge to store the excess power. Since the battery is in a faulty state—and all the fault types of the LAB affect its SOC—the battery will take one of two cases: overcharging or over-discharging. In the first case, overcharging means that the electrolyte solution can overheat, producing hydrogen and oxygen gasses in the case of a battery and raising pressure, which may lead to battery death.
In the over-discharging case—for example, when the battery has a weak charge for a long period or when a lead–acid battery is discharged below the manufacturer’s claimed end-of-life discharge voltage—the polarity of some of the weaker cells is reversed. This damages the cells permanently and prevents the battery from ever being recharged. Because in this case the battery includes distilled water instead of acid, it becomes difficult to charge it because distilled water does not conduct electricity. In other words, the depth of discharge of the LAB affects it capacity. The quicker a LAB is discharged, the less capacity it has.
This degrades the hybrid system considerably since each source works as feedback for the other source(s), and it may lead to system shutdown.
When a PV fault occurs, according to the type of the fault and which characteristic it affects, it finally degrades the power supplied by the PV array. This means that the MPPT algorithm will never reach the maximum power needed, which also means that the PV never covers the load demand, forcing the battery to reach the over-discharging case, and the missing power of the load will always be generated by the diesel generator. When using a real diesel generator, this leads to other problems because of fuel expense and generated greenhouse gasses such as carbon dioxide. In our case, all these considerations lead to electrical machines that always run to produce the missing power and, after a while, will fail also.
A failure in these machines does not cause a problem when the PV–battery system is in good condition. When the PV cannot cover the load demand, the diesel generator is not needed. But even in a good state, the PV generator is influenced by climatic variations, so it cannot always ensure the desired maximum power.
As mentioned below, most turning machines’ faults affect the quality of its measured values, such as the currents, torque and speed. Such faults lead to variation in stator currents, which increase in amplitude, with oscillations causing mechanical vibrations. Such erroneous quantities are transmitted to the algorithm-controlled converter. A well-working algorithm can handle oscillations, but the changes to the amplitude affect the converter output value, which is the constant expected voltage of the DC bus. A short circuit in the machine causes an absolute shutdown. In this case, if the battery is charging, it will be immediately discharged. Maintaining this situation causes the battery to discharge deeply and go into a state of failure.
It is not only source faults that degrade the operation of a hybrid system. Power converters have a very important role in the system to manage energy flow. Faults and failures in converters can come from electric architecture or from control algorithms and can affect energy conversion quality to the load.
The converters’ power side is mainly constituted by controlled switches like MOSFET or IGBT, which are associated with capacitors, coils and diodes. These electronic components are subject to degradation and aging mechanisms linked to operating or environmental conditions. According to field experience, electrolytic capacitors and power-switching devices in power electronic converters are the most-vulnerable components [170,171]. Because the majority of power electronic converters do not have redundancy, any fault presenting in components or subsystems causes the operation to be disrupted. Degradation to the control and command algorithms can be caused by defects in ECUs, sensors, acquisition devices, converters, actuators, interfacing electronics, etc. When completing the system, it is also important to consider the interconnecting bus between the sources and the load, even if acting in DC (direct current) or AC (alternating current), which can be susceptible to various faults, with the most-common being a short circuit [172].
6. Conclusions
This paper presents a review study of the faults that can affect different electric energy sources such as solar panels, lead–acid batteries and electrical machines used in our MPSs. First, we present each considered type of source. Then, we detail the faulty modes of each of theses sources, presenting their causes and effects on the source itself and finally try to analyze the impact of these faults on the operation mode of the MPS. After identifying and locating the faults, the user has to find a quick solution to avoid the downtime of the system, which can cause economic damage and a decrease in electricity production or quality. Therefore, FTC is becoming possible if such a fault is correctly diagnosed and located in complex systems based on the identification results.
In this article, we focus on the detailed presentation of faults of three source types. In future work, we will complete our study by adding other sources such as supercapacitors and fuel cells. We will also present a review of faults affecting the function of an MPS through its other components, including power electronic converters, the interconnection bus and failures in the EMS. Other perspectives of this work will concern the modeling and the simulation of these faults in our application system to go on to study fault identification and localization methods.
Author Contributions
Conceptualization, E.C., K.M., Y.B.S. and M.H.S.; methodology, K.M. and M.H.S.; formal analysis, M.H.S.; investigation, M.H.S.; resources, M.H.S.; writing—original draft preparation, M.H.S.; writing—review and editing, M.H.S. and E.C.; visualization, M.H.S. and E.C.; supervision, E.C., K.M., Y.B.S. and M.N.A.; project administration, E.C., Y.B.S. and M.N.A.; funding acquisition, E.C., K.M. and Y.B.S. All authors have read and agreed to the published version of the manuscript.
Funding
This research was funded by Pays de la Loire County, France, grant number 2015-02376.
Data Availability Statement
Data are contained within the article.
Acknowledgments
This research was supported by the WISE program, Pays de la Loire County, France.
Conflicts of Interest
The authors declare no conflict of interest.
Abbreviations
The following abbreviations are used in this manuscript:
| AGM | Absorbed Glass Mat |
| VRLA | Valve-Regulated Lead–Acid battery |
| AM | Active Material |
| c-Si | Crystalline Silicon |
| EMS | Energy Management System |
| EVA | Ethylene Vinyl Acetate |
| FDI | Fault Detection and Isolation |
| FF | Fill Factor |
| FTC | Fault-Tolerant Control |
| ECU | Electronic Control Unit |
| IGBT | Insulated Gate Bipolar Transistor |
| Isc | Shorted Circuit Current |
| LAB | Lead–Acid Battery |
| LiFePO4 | Lithium Iron Phosphate |
| MOSFET | Metal-Oxide Field-Effect Transistor |
| MMF | MagnetoMotive Force |
| MPP | Maximum Power Point |
| MPS | Multi-Source Power System |
| MPPT | Maximum Power Point Tracking |
| MSO | Minimal Structural Over-Determined |
| NiCd | Nickel Cadmium |
| NiMH | Nickel Metal Hydride |
| PV | PhotoVoltaic |
| RES | Renewable Energy Sources |
| SG | Synchronous Generator |
| Voc | Open Circuit Voltage |
References
- Croci, L. Gestion de l’énergie dans un Système Multi-Sources Photovoltaïque et éolien avec Stockage Hybride Batteries/Supercondensateurs. Ph.D. Thesis, Université de Poitiers, Poitiers, France, 2013. [Google Scholar]
- Tabanjat, A. Modelling, Control and Supervision of Multi-Source System Connected to the Network with a Buffer Storage of Electrical Energy via Hydrogen Vector. Ph.D. Thesis, Université de Technologie de Belfort-Montbeliard, Belfort-Montbeliard, France, 2015. [Google Scholar]
- Collard, F. Les énergies renouvelables. Courr. Hebd. Cris. 2015, 2252–2253, 5–72. [Google Scholar] [CrossRef]
- Mazzeo, D.; Matera, N.; De Luca, P.; Baglivo, C.; Congedo, P.M.; Oliveti, G. A literature review and statistical analysis of photovoltaic-wind hybrid renewable system research by considering the most relevant 550 articles: An upgradable matrix literature database. J. Clean. Prod. 2021, 295, 126070. [Google Scholar] [CrossRef]
- Manwell, J. Hybrid energy systems. Encycl. Energy 2004, 3, 215–229. [Google Scholar]
- Bi, B.E.B.; Koua, K.B.; Gbaha, P.; Koffi, E.P.M. Étude d’un système hybride de production d’énergie. Afr. Sci. 2020, 16, 203–217. [Google Scholar]
- Chalal, L. Coordination de Systémes Multisources Pour Favoriser la Production d’énergie électrique Renouvelable. Ph.D. Thesis, Université Lille, Sciences et Technologies, Lille, France, 2013. [Google Scholar]
- Saidi, R. Développement d’un Outil de Dimensionnement et de Gestion énergétique Optimisés de systèmes Multisources: Application à une Installation de Production électrique Autonome. Ph.D. Thesis, Nantes University, Nantes, France, 2019. [Google Scholar]
- Tawfik, T.; Badr, M.; El-Kady, E.; Abdellatif, O. Optimization and energy management of hybrid standalone energy system: A case study. Renew. Energy Focus 2018, 25, 48–56. [Google Scholar] [CrossRef]
- Ismail, M.S.; Moghavvemi, M.; Mahlia, T. Design of an optimized photovoltaic and microturbine hybrid power system for a remote small community: Case study of Palestine. Energy Convers. Manag. 2013, 75, 271–281. [Google Scholar] [CrossRef]
- Barakat, M. Development of Models for Inegrating Renewables and Energy Storage Components in Smart Grid Applications. Ph.D. Thesis, Normandie Université, Normandy, France, 2018. [Google Scholar]
- Yin, C.; Wu, H.; Locment, F.; Sechilariu, M. Energy management of DC microgrid based on photovoltaic combined with diesel generator and supercapacitor. Energy Convers. Manag. 2017, 132, 14–27. [Google Scholar] [CrossRef]
- Khorasgani, H.; Biswas, G. Structural fault detection and isolation in hybrid systems. IEEE Trans. Autom. Sci. Eng. 2017, 15, 1585–1599. [Google Scholar] [CrossRef]
- Hofbaur, M.; Williams, B. Hybrid estimation of complex systems. IEEE Trans. Syst. Man, Cybern. Part (Cybernetics) 2004, 34, 2178–2191. [Google Scholar] [CrossRef] [PubMed]
- Cocquempot, V.; El Mezyani, T.; Staroswiecki, M. Fault detection and isolation for hybrid systems using structured parity residuals. In Proceedings of the 2004 5th Asian Control Conference (IEEE Cat. No.04EX904), Melbourne, Australia, 20–23 July 2004; Volume 2, pp. 1204–1212. [Google Scholar]
- Narasimhan, S.; Biswas, G. Model-based diagnosis of hybrid systems. IEEE Trans. Syst. Man.-Cybern.-Part Syst. Humans 2007, 37, 348–361. [Google Scholar] [CrossRef]
- Köntges, M.; Kurtz, S.; Packard, C.; Jahn, U.; Berger, K.A.; Kato, K.; Friesen, T.; Liu, H.; Van Iseghem, M.; Wohlgemuth, J.; et al. Review of Failures of Photovoltaic Modules; Report; IEA International Energy Agency: Paris, France, 2014. [Google Scholar]
- Aghaei, M.; Fairbrother, A.; Gok, A.; Ahmad, S.; Kazim, S.; Lobato, K.; Oreski, G.; Reinders, A.; Schmitz, J.; Theelen, M.; et al. Review of degradation and failure phenomena in photovoltaic modules. Renew. Sustain. Energy Rev. 2022, 159, 112160. [Google Scholar] [CrossRef]
- Manganiello, P.; Balato, M.; Vitelli, M. A survey on mismatching and aging of PV modules: The closed loop. IEEE Trans. Ind. Electron. 2015, 62, 7276–7286. [Google Scholar] [CrossRef]
- Mellit, A.; Tina, G.M.; Kalogirou, S.A. Fault detection and diagnosis methods for photovoltaic systems: A review. Renew. Sustain. Energy Rev. 2018, 91, 1–17. [Google Scholar] [CrossRef]
- AbdulMawjood, K.; Refaat, S.S.; Morsi, W.G. Detection and prediction of faults in photovoltaic arrays: A review. In Proceedings of the 2018 IEEE 12th International Conference on Compatibility, Power Electronics and Power Engineering (CPE-POWERENG 2018), Doha, Qatar, 10–12 April 2018; IEEE: Piscataway, NJ, USA, 2018; pp. 1–8. [Google Scholar]
- Pillai, D.S.; Rajasekar, N. A comprehensive review on protection challenges and fault diagnosis in PV systems. Renew. Sustain. Energy Rev. 2018, 91, 18–40. [Google Scholar] [CrossRef]
- Tran, M.K.; Fowler, M. A review of lithium-ion battery fault diagnostic algorithms: Current progress and future challenges. Algorithms 2020, 13, 62. [Google Scholar] [CrossRef]
- Wu, C.; Zhu, C.; Ge, Y.; Zhao, Y. A review on fault mechanism and diagnosis approach for Li-ion batteries. J. Nanomater. 2015, 2015, 631263. [Google Scholar] [CrossRef]
- Young, K.h.; Yasuoka, S. Capacity degradation mechanisms in nickel/metal hydride batteries. Batteries 2016, 2, 3. [Google Scholar] [CrossRef]
- Xiong, R.; Sun, W.; Yu, Q.; Sun, F. Research progress, challenges and prospects of fault diagnosis on battery system of electric vehicles. Appl. Energy 2020, 279, 115855. [Google Scholar] [CrossRef]
- Pei, P.; Wang, K.; Ma, Z. Technologies for extending zinc–air battery’s cyclelife: A review. Appl. Energy 2014, 128, 315–324. [Google Scholar] [CrossRef]
- Palacín, M.R.; de Guibert, A. Why do batteries fail? Science 2016, 351, 1253292. [Google Scholar] [CrossRef]
- Nandi, S.; Toliyat, H.A. Fault diagnosis of electrical machines-a review. In Proceedings of the IEEE International Electric Machines and Drives Conference. IEMDC’99. Proceedings (Cat. No. 99EX272), Seattle, WA, USA, 9–12 May 1999; IEEE: Piscataway, NJ, USA, 1999; pp. 219–221. [Google Scholar]
- Basak, D.; Tiwari, A.; Das, S. Fault diagnosis and condition monitoring of electrical machines-A Review. In Proceedings of the 2006 IEEE International Conference on Industrial Technology, Mumbai, India, 15–17 December 2006; IEEE: Piscataway, NJ, USA, 2006; pp. 3061–3066. [Google Scholar]
- Edwards, S.; Lees, A.W.; Friswell, M.I. Fault diagnosis of rotating machinery. Shock Vib. Dig. 1998, 30, 4–13. [Google Scholar] [CrossRef]
- Ondel, O. Diagnostic par Reconnaissance des Formes: Application à un Ensemble Convertisseur-Machine Asynchrone. Ph.D. Thesis, Ecole Centrale de Lyon, Lyon, France, 2006. [Google Scholar]
- He, J.; Yang, Q.; Wang, Z. On-line fault diagnosis and fault-tolerant operation of modular multilevel converters—A comprehensive review. Ces Trans. Electr. Mach. Syst. 2020, 4, 360–372. [Google Scholar] [CrossRef]
- Kumar, G.K.; Elangovan, D. Review on fault-diagnosis and fault-tolerance for DC–DC converters. IET Power Electron. 2020, 13, 1–13. [Google Scholar] [CrossRef]
- Costa, L.F.; Liserre, M. Failure analysis of the DC-DC converter: A comprehensive survey of faults and solutions for improving reliability. IEEE Power Electron. Mag. 2018, 5, 42–51. [Google Scholar] [CrossRef]
- Guilbert, D.; Gaillard, A.; N’diaye, A.; Djerdir, A. Diagnostic de défauts d’un convertisseur DC/DC boost entrelacé pour véhicules électriques à pile à combustible. In Proceedings of the Electrical Engineering Symposium (SGE’14): EF-EPF-MGE, Cachan, France, 8–9 July 2014; pp. 8–10. [Google Scholar]
- Khan, S.S.; Wen, H. A Comprehensive Review of Fault Diagnosis and Tolerant Control in DC-DC Converters for DC Microgrids. IEEE Access 2021, 9, 80100–80127. [Google Scholar] [CrossRef]
- Boovaragavan, V.; Methakar, R.N.; Ramadesigan, V.; Subramanian, V.R. A mathematical model of the lead-acid battery to address the effect of corrosion. J. Electrochem. Soc. 2009, 156, A854. [Google Scholar] [CrossRef]
- Takehara, Z.I. Dissolution and precipitation reactions of lead sulfate in positive and negative electrodes in lead acid battery. J. Power Source 2000, 85, 29–37. [Google Scholar] [CrossRef]
- Shi, Y.; Ferone, C.A.; Rahn, C.D. Identification and remediation of sulfation in lead-acid batteries using cell voltage and pressure sensing. J. Power Source 2013, 221, 177–185. [Google Scholar] [CrossRef]
- Romaissa, H. Etude de l’effet de l’étain sur la Qualité du Plomb pour les Batteries de Démarrage. Master’s Thesis, Université Mohamed El Bachir El Ibrahimi de Bordj Bou Arréridj, El Anceur, Algeria, 2020. [Google Scholar]
- Kaewert, W.F. Genset Starting Education Module#3: Solutions to Leading Causes of Battery Failure in Gensets; SENS Stored Energy Systems LLC: Longmont, CO, USA, 2013. [Google Scholar]
- Yang, J.; Hu, C.; Wang, H.; Yang, K.; Liu, J.B.; Yan, H. Review on the research of failure modes and mechanism for lead–acid batteries. Int. J. Energy Res. 2017, 41, 336–352. [Google Scholar] [CrossRef]
- Osório, W.R.; Aoki, C.S.; Garcia, A. Hot corrosion resistance of a Pb–Sb alloy for lead acid battery grids. J. Power Source 2008, 185, 1471–1477. [Google Scholar] [CrossRef]
- Rocca, E.; Bourguignon, G.; Steinmetz, J. Corrosion management of PbCaSn alloys in lead-acid batteries: Effect of composition, metallographic state and voltage conditions. J. Power Source 2006, 161, 666–675. [Google Scholar] [CrossRef]
- Culpin, B.; Rand, D. Failure modes of lead/acid batteries. J. Power Source 1991, 36, 415–438. [Google Scholar] [CrossRef]
- Rosa, D.M.; Spinelli, J.E.; Osório, W.R.; Garcia, A. Effects of cell size and macrosegregation on the corrosion behavior of a dilute Pb–Sb alloy. J. Power Source 2006, 162, 696–705. [Google Scholar] [CrossRef]
- Osório, W.R.; Rosa, D.M.; Garcia, A. The roles of cellular and dendritic microstructural morphologies on the corrosion resistance of Pb–Sb alloys for lead acid battery grids. J. Power Source 2008, 175, 595–603. [Google Scholar] [CrossRef]
- Achaïbou, N.; Malek, A.; Bacha, N. Modèle de Vieillissement des Batteries Plomb-Acide dans les Systèmes PV. Rev. Des Énerg. Renouvelables 2000, 61–66. [Google Scholar]
- Zuckerbrod, D. Program to Analyze the Failure Mode of Lead-Acid Batteries; Technical Report; Westinghouse Research and Development Center: Pittsburgh, PA, USA, 1986. [Google Scholar]
- Ruetschi, P. Aging mechanisms and service life of lead–acid batteries. J. Power Source 2004, 127, 33–44. [Google Scholar] [CrossRef]
- Qiu, L.; Liu, Z.; Zhang, W.; Gong, A.; Liu, Y. An Optimized Preparation Procedure of Tetrabasic Lead Sulfate for Lead-Acid Batteries. J. Electrochem. Soc. 2021, 168, 090531. [Google Scholar] [CrossRef]
- AMMAR, I. The Fault tree analysis of the lead acid Systems battery’s degradation. J. Electr. Syst. 2008, 4, 1–12. [Google Scholar]
- Lailler, P.; Zaninotto, F.; Nivet, S.; Torcheux, L.; Sarrau, J.F.; Vaurijoux, J.P.; Devilliers, D. Study of the softening of the positive active-mass in valve-regulated lead-acid batteries for electric-vehicle applications. J. Power Source 1999, 78, 204–213. [Google Scholar] [CrossRef]
- Liu, X.; Teng, T. Failure Causes and Effective Repair Methods of Lead-acid Battery. Iop Conf. Ser. Earth Environ. Sci. 2021, 859, 012083. [Google Scholar] [CrossRef]
- Gandhi, K. Modeling of sulfation in a flooded lead-acid battery and prediction of its cycle life. J. Electrochem. Soc. 2020, 167, 013538. [Google Scholar] [CrossRef]
- Singh, A.; Karandikar, P.; Kulkarni, N. Mitigation of sulfation in lead acid battery towards life time extension using ultra capacitor in hybrid electric vehicle. J. Energy Storage 2021, 34, 102219. [Google Scholar] [CrossRef]
- Ma, T.; Xu, G.L.; Li, Y.; Wang, L.; He, X.; Zheng, J.; Liu, J.; Engelhard, M.H.; Zapol, P.; Curtiss, L.A.; et al. Revisiting the corrosion of the aluminum current collector in lithium-ion batteries. J. Phys. Chem. Lett. 2017, 8, 1072–1077. [Google Scholar] [CrossRef] [PubMed]
- Puzakov, A.V.; Smirnov, D.A. Physical simulation of the faults of starter batteries. Iop Conf. Ser. Mater. Sci. Eng. 2020, 971, 052066. [Google Scholar] [CrossRef]
- Catherino, H.A.; Feres, F.F.; Trinidad, F. Sulfation in lead–acid batteries. J. Power Source 2004, 129, 113–120. [Google Scholar] [CrossRef]
- Franke, M.; Kowal, J. Empirical sulfation model for valve-regulated lead-acid batteries under cycling operation. J. Power Source 2018, 380, 76–82. [Google Scholar] [CrossRef]
- Gibson, I.; Peters, K. Sulphation in discharged lead-acid batteries. J. Power Source 1982, 8, 143–157. [Google Scholar] [CrossRef]
- Yamaguchi, Y.; Shiota, M.; Nakayama, Y.; Hirai, N.; Hara, S. In situ analysis of electrochemical reactions at a lead surface in sulfuric acid solution. J. Power Source 2000, 85, 22–28. [Google Scholar] [CrossRef]
- Guo, Y.; Tang, S.; Meng, G.; Yang, S. Failure modes of valve-regulated lead-acid batteries for electric bicycle applications in deep discharge. J. Power Source 2009, 191, 127–133. [Google Scholar] [CrossRef]
- Kolesnikov, A.; Kolek, M.; Dohmann, J.F.; Horsthemke, F.; Börner, M.; Bieker, P.; Winter, M.; Stan, M.C. Galvanic corrosion of lithium-powder-based electrodes. Adv. Energy Mater. 2020, 10, 2000017. [Google Scholar] [CrossRef]
- Zhang, S.; Jow, T. Aluminum corrosion in electrolyte of Li-ion battery. J. Power Source 2002, 109, 458–464. [Google Scholar] [CrossRef]
- Maurel, F.; Leblanc, P.; Knosp, B.; Backhaus-Ricoult, M. Effect of yttrium on the corrosion of AB5-type alloys for nickel–metal hydride batteries. J. Alloys Compd. 2000, 309, 88–94. [Google Scholar] [CrossRef]
- Pourabdollah, K. Fouling and corrosion of electrode plates in nickel cadmium batteries. Eng. Fail. Anal. 2021, 130, 105797. [Google Scholar] [CrossRef]
- Bernard, P. Effects on the Positive Electrode of the Corrosion of AB 5 Alloys in Nickel-Metal-Hydride Batteries. J. Electrochem. Soc. 1998, 145, 456. [Google Scholar] [CrossRef]
- Nguyen, V.T.; Lee, J.c.; Jeong, J.; Kim, B.S.; Pandey, B. The separation and recovery of nickel and lithium from the sulfate leach liquor of spent lithium ion batteries using PC-88A. Korean Chem. Eng. Res. 2015, 53, 137–144. [Google Scholar] [CrossRef]
- Nguyen, V.T.; Lee, J.c.; Jeong, J.; Kim, B.S.; Pandey, B. Selective recovery of cobalt, nickel and lithium from sulfate leachate of cathode scrap of Li-ion batteries using liquid-liquid extraction. Met. Mater. Int. 2014, 20, 357–365. [Google Scholar] [CrossRef]
- Alazard, R.; Chaintreuil, N.; Moine, G. Maîtriser le Risque lié aux Installations Photovoltaïques; Direction de la Défense et de la Sécurité Civiles: Asnières sur Seine, France, 2013. [Google Scholar]
- Fadhel, S.; Delpha, C.; Diallo, D.; Bahri, I.; Migan, A.; Trabelsi, M.; Mimouni, M.F. PV shading fault detection and classification based on IV curve using principal component analysis: Application to isolated PV system. Sol. Energy 2019, 179, 1–10. [Google Scholar] [CrossRef]
- Ferrara, C.; Philipp, D. Why do PV modules fail? Energy Procedia 2012, 15, 379–387. [Google Scholar] [CrossRef]
- Cristaldi, L.; Faifer, M.; Lazzaroni, M.; Khalil, A.; Catelani, M.; Ciani, L. Failure modes analysis and diagnostic architecture for photovoltaic plants. In Proceedings of the 13th IMEKO TC10 Workshop on Technical Diagnostics Advanced Measurement Tools in Technical Diagnostics for Systems’ Reliability and Safety, Warsaw, Poland, 26–27 June 2014; pp. 206–211. [Google Scholar]
- Hariharan, R.; Chakkarapani, M.; Ilango, G.S.; Nagamani, C. A Method to Detect Photovoltaic Array Faults and Partial Shading in PV Systems. IEEE J. Photovoltaics 2016, 6, 1278–1285. [Google Scholar] [CrossRef]
- Khaing, H.H.; Liang, Y.J.; Htay, N.N.M.; Fan, J. Characteristics of different solar PV modules under partial shading. Int. J. Energy Power Eng. 2014, 8, 1418–1422. [Google Scholar]
- Bulanyi, P.; Zhang, R. Shading analysis & improvement for distributed residential grid-connected photovoltaics systems. In Proceedings of the 52nd Annual Conference of the Australian Solar Council, Boulder, CO, USA, 8–11 August 2014. [Google Scholar]
- Bany, J.; Appelbaum, J. The effect of shading on the design of a field of solar collectors. Sol. Cells 1987, 20, 201–228. [Google Scholar] [CrossRef]
- Vieira, R.G.; de Araújo, F.M.; Dhimish, M.; Guerra, M.I. A comprehensive review on bypass diode application on photovoltaic modules. Energies 2020, 13, 2472. [Google Scholar] [CrossRef]
- Ramabadran, R.; Mathur, B. Effect of shading on series and parallel connected solar PV modules. Mod. Appl. Sci. 2009, 3, 32–41. [Google Scholar] [CrossRef]
- Kaushika, N.; Rai, A.K. An investigation of mismatch losses in solar photovoltaic cell networks. Energy 2007, 32, 755–759. [Google Scholar] [CrossRef]
- Pern, F.; Czanderna, A.; Emery, K.; Dhere, R. Weathering degradation of EVA encapsulant and the effect of its yellowing on solar cell efficiency. In Proceedings of the Conference Record of the 22nd IEEE Photovoltaic Specialists Conference-1991, Las Vegas, NV, USA, 7–11 October 1991; IEEE: Piscataway, NJ, USA, 1991; Volume 1, pp. 557–561. [Google Scholar]
- Hasyim, E.S.; Wenham, S.; Green, M. Shadow tolerance of modules incorporating integral bypass diode solar cells. Sol. Cells 1986, 19, 109–122. [Google Scholar] [CrossRef]
- Silvestre, S.; Chouder, A. Effects of shadowing on photovoltaic module performance. Prog. Photovoltaics Res. Appl. 2008, 16, 141–149. [Google Scholar] [CrossRef]
- Sabbaghpur Arani, M.; Hejazi, M.A. The comprehensive study of electrical faults in PV arrays. J. Electr. Comput. Eng. 2016, 2016, 8712960. [Google Scholar] [CrossRef]
- Masoum, A.S.; Padovan, F.; Masoum, M.A. Impact of partial shading on voltage-and current-based maximum power point tracking of solar modules. In Proceedings of the IEEE PES General Meeting, Minneapolis, MN, USA, 25–29 July 2010; IEEE: Piscataway, NJ, USA, 2010; pp. 1–5. [Google Scholar]
- Dolara, A.; Lazaroiu, G.C.; Leva, S.; Manzolini, G. Experimental investigation of partial shading scenarios on PV (photovoltaic) modules. Energy 2013, 55, 466–475. [Google Scholar] [CrossRef]
- Dhimish, M.; Holmes, V.; Mehrdadi, B.; Dales, M.; Mather, P. Detecting defective bypass diodes in photovoltaic modules using Mamdani fuzzy logic system. Glob. J. Res. Eng. F Electr. Electron. Eng. 2017, 33–44. [Google Scholar]
- Sarikh, S.; Raoufi, M.; Bennouna, A.; Benlarabi, A.; Ikken, B. Implementation of a plug and play IV curve tracer dedicated to characterization and diagnosis of PV modules under real operating conditions. Energy Convers. Manag. 2020, 209, 112613. [Google Scholar] [CrossRef]
- Sera, D.; Baghzouz, Y. On the impact of partial shading on PV output power. In Proceedings of the RES’08, Wilderness, South Africa, 6–8 October 2008. [Google Scholar]
- Ping, Y.; Yuzheng, L.; Heng, L.; Zhixiang, Z. Analysis and diagnosis of hot spot failure in c-Si PV module. IOP Conf. Ser. Earth Environ. Sci. 2019, 332, 042011. [Google Scholar] [CrossRef]
- Deline, C.; Marion, B.; Granata, J.; Gonzalez, S. Performance and Economic Analysis of Distributed Power Electronics in Photovoltaic Systems; Technical Report; National Renewable Energy Lab. (NREL): Golden, CO, USA, 2011. [Google Scholar]
- Herrmann, W.; Wiesner, W.; Vaassen, W. Hot spot investigations on PV modules-new concepts for a test standard and consequences for module design with respect to bypass diodes. In Proceedings of the Conference Record of the 26th IEEE Photovoltaic Specialists Conference-1997, Anaheim, CA, USA, 29 September–3 October 1997; IEEE: Piscataway, NJ, USA, 1997; pp. 1129–1132. [Google Scholar]
- Guerriero, P.; Tricoli, P.; Daliento, S. A bypass circuit for avoiding the hot spot in PV modules. Sol. Energy 2019, 181, 430–438. [Google Scholar] [CrossRef]
- Haeberlin, H.; Kaempfer, M. Measurement of damages at bypass diodes by induced voltages and currents in PV modules caused by nearby lightning currents with standard waveform. In Proceedings of the 23rd European Photovoltaic Solar Energy Conference, Valencia, Spain, 1–5 September 2008. [Google Scholar]
- Lee, C.G.; Shin, W.G.; Lim, J.R.; Kang, G.H.; Ju, Y.C.; Hwang, H.M.; Chang, H.S.; Ko, S.W. Analysis of electrical and thermal characteristics of PV array under mismatching conditions caused by partial shading and short circuit failure of bypass diodes. Energy 2021, 218, 119480. [Google Scholar] [CrossRef]
- Zhang, Z.; Wohlgemuth, J.; Kurtz, S. Thermal Reliability Study of Bypass Diodes in Photovoltaic Modules (Poster); Technical Report; National Renewable Energy Lab. (NREL): Golden, CO, USA, 2013. [Google Scholar]
- Xiao, C.; Hacke, P.; Johnston, S.; Sulas-Kern, D.B.; Jiang, C.S.; Al-Jassim, M. Failure analysis of field-failed bypass diodes. Prog. Photovoltaics Res. Appl. 2020, 28, 909–918. [Google Scholar] [CrossRef]
- Ardjouna, C. Etude d’Identification et Localisation des défauts d’un générateur Photovoltaïque. Master’s Thesis, Universite de Mohamed Boudiaf M’sila Faculte de Technologie, M’sila, Algeria, 2016. [Google Scholar]
- Shiradkar, N.S.; Schneller, E.; Dhere, N.G.; Gade, V. Predicting thermal runaway in bypass diodes in photovoltaic modules. In Proceedings of the 2014 IEEE 40th Photovoltaic Specialist Conference (PVSC), Denver, CO, USA, 8–13 June 2014; IEEE: Piscataway, NJ, USA, 2014; pp. 3585–3588. [Google Scholar]
- Dhere, N.G.; Shiradkar, N.; Schneller, E.; Gade, V. The reliability of bypass diodes in PV modules. In Proceedings of the Reliability of Photovoltaic Cells, Modules, Components, and Systems VI, San Diego, CA, USA, 26–29 August 2013; SPIE: Wallisellen, Switerland, 2013; Volume 8825, pp. 110–117. [Google Scholar]
- Ko, S.W.; Ju, Y.C.; Hwang, H.M.; So, J.H.; Jung, Y.S.; Song, H.J.; Song, H.e.; Kim, S.H.; Kang, G.H. Electric and thermal characteristics of photovoltaic modules under partial shading and with a damaged bypass diode. Energy 2017, 128, 232–243. [Google Scholar] [CrossRef]
- Dhimish, M.; Chen, Z. Novel open-circuit photovoltaic bypass diode fault detection algorithm. IEEE J. Photovoltaics 2019, 9, 1819–1827. [Google Scholar] [CrossRef]
- Mathew, J.K.; Kuitche, J.; TamizhMani, G. Test-to-failure of pv modules: Hotspot testing. In Proceedings of the 2010 35th IEEE Photovoltaic Specialists Conference, Honolulu, HI, USA, 20–25 June 2010; IEEE: Piscataway, NJ, USA, 2010; pp. 002839–002843. [Google Scholar]
- Wohlgemuth, J.; Herrmann, W. Hot spot tests for crystalline silicon modules. In Proceedings of the Conference Record of the Thirty-First IEEE Photovoltaic Specialists Conference, Lake Buena Vista, FL, USA, 3–7 January 2005; IEEE: Piscataway, NJ, USA, 2005; pp. 1062–1063. [Google Scholar]
- Kim, K.A.; Krein, P.T. Hot spotting and second breakdown effects on reverse IV characteristics for mono-crystalline Si photovoltaics. In Proceedings of the 2013 IEEE Energy Conversion Congress and Exposition, Denver, CO, USA, 15–19 September 2013; IEEE: Piscataway, NJ, USA, 2013; pp. 1007–1014. [Google Scholar]
- Zhang, Q.; Li, Q. Temperature and reverse voltage across a partially shaded Si PV cell under hot spot test condition. In Proceedings of the 2012 38th IEEE Photovoltaic Specialists Conference, Austin, TX, USA, 3–8 June 2012; IEEE: Piscataway, NJ, USA, 2012; pp. 001344–001347. [Google Scholar]
- Gallon, J.; Horner, G.; Hudson, J.; Vasilyev, L.; Lu, K. PV Module Hotspot Detection; Tau Science Corporation: Hillsboro, OR, USA, 2015. [Google Scholar]
- Ma, M.; Liu, H.; Zhang, Z.; Yun, P.; Liu, F. Rapid diagnosis of hot spot failure of crystalline silicon PV module based on IV curve. Microelectron. Reliab. 2019, 100, 113402. [Google Scholar] [CrossRef]
- Dhimish, M.; Badran, G. Photovoltaic hot-spots fault detection algorithm using fuzzy systems. IEEE Trans. Device Mater. Reliab. 2019, 19, 671–679. [Google Scholar] [CrossRef]
- Chamberlin, C.E.; Rocheleau, M.; Marshall, M.W.; Reis, A.; Coleman, N.; Lehman, P. Comparison of PV module performance before and after 11 and 20 years of field exposure. In Proceedings of the 2011 37th IEEE Photovoltaic Specialists Conference, Seattle, WA, USA, 19–24 June 2011; IEEE: Piscataway, NJ, USA, 2011; pp. 101–105. [Google Scholar]
- Kaplanis, S.; Kaplani, E. Energy performance and degradation over 20 years performance of BP c-Si PV modules. Simul. Model. Pract. Theory 2011, 19, 1201–1211. [Google Scholar] [CrossRef]
- Danner, M.; Bucher, K. Reverse characteristics of commercial silicon solar cells-impact on hot spot temperatures and module integrity. In Proceedings of the Conference Record of the Twenty Sixth IEEE Photovoltaic Specialists Conference, Anaheim, CA, USA, 29 September–3 October 1997; IEEE: Piscataway, NJ, USA, 1997; pp. 1137–1140. [Google Scholar]
- Molenbroek, E.; Waddington, D.; Emery, K. Hot spot susceptibility and testing of PV modules. In Proceedings of the Photovoltaic Specialists Conference, Las Vegas, NV, USA, 7–11 October 1991; Volume 1, pp. 547–552. [Google Scholar]
- de Oliveira, M.C.C.; Cardoso, A.S.A.D.; Viana, M.M.; Lins, V.d.F.C. The causes and effects of degradation of encapsulant ethylene vinyl acetate copolymer (EVA) in crystalline silicon photovoltaic modules: A review. Renew. Sustain. Energy Rev. 2018, 81, 2299–2317. [Google Scholar] [CrossRef]
- Dunn, L.; Gostein, M.; Stueve, B. Literature review of the effects of UV exposure on PV modules. In Proceedings of the NREL PV Module Reliability Workshop, Golden, CO, USA, 26–27 February 2013; NREL: Golden, CO, USA, 2013; Volume 16. [Google Scholar]
- Bouaichi, A.; Merrouni, A.A.; El Hassani, A.; Naimi, Z.; Ikken, B.; Ghennioui, A.; Benazzouz, A.; El Amrani, A.; Messaoudi, C. Experimental evaluation of the discoloration effect on PV-modules performance drop. Energy Procedia 2017, 119, 818–827. [Google Scholar] [CrossRef]
- Jordan, D.C.; Silverman, T.J.; Sekulic, B.; Kurtz, S.R. PV degradation curves: Non-linearities and failure modes. Prog. Photovoltaics: Res. Appl. 2017, 25, 583–591. [Google Scholar] [CrossRef]
- Jordan, D.C.; Wohlgemuth, J.H.; Kurtz, S.R. Technology and Climate Trends in PV Module Degradation; Technical Report; National Renewable Energy Lab. (NREL): Golden, CO, USA, 2012. [Google Scholar]
- Sánchez-Friera, P.; Piliougine, M.; Peláez, J.; Carretero, J.; Sidrach de Cardona, M. Analysis of degradation mechanisms of crystalline silicon PV modules after 12 years of operation in Southern Europe. Prog. Photovoltaics Res. Appl. 2011, 19, 658–666. [Google Scholar] [CrossRef]
- Reis, A.M.; Coleman, N.T.; Marshall, M.W.; Lehman, P.A.; Chamberlin, C.E. Comparison of PV module performance before and after 11-years of field exposure. In Proceedings of the Conference Record of the Twenty-Ninth IEEE Photovoltaic Specialists Conference, New Orleans, LA, USA, 19–24 May 2002; IEEE: Piscataway, NJ, USA, 2002; pp. 1432–1435. [Google Scholar]
- Berman, D.; Biryukov, S.; Faiman, D. EVA laminate browning after 5 years in a grid-connected, mirror-assisted, photovoltaic system in the Negev desert: Effect on module efficiency. Sol. Energy Mater. Sol. Cells 1995, 36, 421–432. [Google Scholar] [CrossRef]
- Smith, R.M.; Jordan, D.C.; Kurtz, S.R. Outdoor PV Module Degradation of Current-Voltage Parameters; Technical Report; National Renewable Energy Lab. (NREL): Golden, CO, USA, 2012. [Google Scholar]
- Realini, A. Mean Time before Failure of Photovoltaic Modules; Final Report (MTBF Project); Federal Office for Education and Science Technology Representative; BBW: Canobbio, Switzerland, 2003; Volume 99. [Google Scholar]
- Bandou, F.; Arab, A.H.; Belkaid, M.S.; Logerais, P.O.; Riou, O.; Charki, A. Evaluation performance of photovoltaic modules after a long time operation in Saharan environment. Int. J. Hydrogen Energy 2015, 40, 13839–13848. [Google Scholar] [CrossRef]
- Zhang, S.; Zhang, S.; Wang, B.; Habetler, T.G. Deep learning algorithms for bearing fault diagnostics—A comprehensive review. IEEE Access 2020, 8, 29857–29881. [Google Scholar] [CrossRef]
- Nandi, S.; Toliyat, H.A. Condition monitoring and fault diagnosis of electrical machines-a review. In Proceedings of the Conference Record of the 1999 IEEE Industry Applications Conference. 34th IAS Annual Meeting (Cat. No. 99CH36370), New York, NY, USA, 3 October 1999; IEEE: Piscataway, NJ, USA, 1999; Volume 1, pp. 197–204. [Google Scholar]
- Kliman, G.; Premerlani, W.; Koegl, R.; Hoeweler, D. A new approach to on-line turn fault detection in AC motors. In Proceedings of the IAS’96. Conference Record of the 1996 IEEE Industry Applications Conference Thirty-First IAS Annual Meeting, San Diego, CA, USA, 6–10 October 1996; IEEE: Piscataway, NJ, USA, 1996; Volume 1, pp. 687–693. [Google Scholar]
- Alameh, K. Contribution au Diagnostic et a l’analyse de défauts d’une machine Synchrone à Aimants Permanents. Ph.D. Thesis, Normandie Université, Normandie, France, 2017. [Google Scholar]
- Bensalem, Y.; Abbassi, A.; Abbassi, R.; Jerbi, H.; Alturki, M.; Albaker, A.; Kouzou, A.; Abdelkrim, M. Speed tracking control design of a five-phase PMSM-based electric vehicle: A backstepping active fault-tolerant approach. Electr. Eng. 2022, 104, 2155–2171. [Google Scholar] [CrossRef]
- Bensalem, Y.; Kouzou, A.; Abbassi, R.; Jerbi, H.; Kennel, R.; Abdelrahem, M. Sliding-Mode-Based Current and Speed Sensors Fault Diagnosis for Five-Phase PMSM. Energies 2021, 15, 71. [Google Scholar] [CrossRef]
- Bensalem, Y.; Abbassi, R.; Jerbi, H. Fuzzy logic based-active fault tolerant control of speed sensor failure for five-phase PMSM. J. Electr. Eng. Technol. 2021, 16, 287–299. [Google Scholar] [CrossRef]
- Ojaghi, M.; Sabouri, M.; Faiz, J. Analytic model for induction motors under localized bearing faults. IEEE Trans. Energy Convers. 2017, 33, 617–626. [Google Scholar] [CrossRef]
- Tandon, N.; Choudhury, A. A review of vibration and acoustic measurement methods for the detection of defects in rolling element bearings. Tribol. Int. 1999, 32, 469–480. [Google Scholar] [CrossRef]
- Zandi, O.; Poshtan, J. Brushless DC motor bearing fault detection using Hall effect sensors and a two-stage wavelet transform. In Proceedings of the Electrical Engineering (ICEE), Iranian Conference on Electrical Engineering, Mashhad, Iran, 8–10 May 2018; IEEE: Piscataway, NJ, USA, 2018; pp. 827–833. [Google Scholar]
- Gong, X.; Qiao, W. Bearing fault diagnosis for direct-drive wind turbines via current-demodulated signals. IEEE Trans. Ind. Electron. 2013, 60, 3419–3428. [Google Scholar] [CrossRef]
- Khadersab, A.; Shivakumar, S. Vibration analysis techniques for rotating machinery and its effect on bearing faults. Procedia Manuf. 2018, 20, 247–252. [Google Scholar] [CrossRef]
- Abed, W.; Sharma, S.; Sutton, R. Diagnosis of bearing fault of brushless DC motor based on dynamic neural network and orthogonal fuzzy neighborhood discriminant analysis. In Proceedings of the 2014 UKACC International Conference on Control (CONTROL), Loughborough, UK, 9–11 July 2014; IEEE: Piscataway, NJ, USA, 2014; pp. 378–383. [Google Scholar]
- Stack, J.R.; Habetler, T.G.; Harley, R.G. Bearing fault detection via autoregressive stator current modeling. IEEE Trans. Ind. Appl. 2004, 40, 740–747. [Google Scholar] [CrossRef]
- Schoen, R.R.; Habetler, T.G.; Kamran, F.; Bartfield, R. Motor bearing damage detection using stator current monitoring. IEEE Trans. Ind. Appl. 1995, 31, 1274–1279. [Google Scholar] [CrossRef]
- Sunnersjö, C. Varying compliance vibrations of rolling bearings. J. Sound Vib. 1978, 58, 363–373. [Google Scholar] [CrossRef]
- Tallian, T.; Gustafsson, O. Progress in rolling bearing vibration research and control. ASLE Trans. 1965, 8, 195–207. [Google Scholar] [CrossRef]
- Meyer, L.; Ahlgren, F.; Weichbrodt, B. An analytic model for ball bearing vibrations to predict vibration response to distributed defects. J. Mech. Des. 1980, 102, 205–210. [Google Scholar] [CrossRef]
- Choudhury, A.; Tandon, N. A theoretical model to predict vibration response of rolling bearings to distributed defects under radial load. J. Vib. Acoust. 1998, 120, 214–220. [Google Scholar] [CrossRef]
- Sunnersjö, C. Rolling bearing vibrations—The effects of geometrical imperfections and wear. J. Sound Vib. 1985, 98, 455–474. [Google Scholar] [CrossRef]
- Faiz, J.; Ebrahimi, B.; Valavi, M.; Toliyat, H.A. Mixed eccentricity fault diagnosis in salient-pole synchronous generator using modified winding function method. Prog. Electromagn. Res. 2009, 11, 155–172. [Google Scholar] [CrossRef]
- Hajiaghajani, M.; Toliyat, H.A.; Panahi, I.M. Advanced fault diagnosis of a DC motor. IEEE Trans. Energy Convers. 2004, 19, 60–65. [Google Scholar] [CrossRef]
- Haji, M.; Toliyat, H.A. Rotor eccentricity fault detection of a DC motor. In Proceedings of the IECON’01. 27th Annual Conference of the IEEE Industrial Electronics Society (Cat. No. 37243), Denver, CO, USA, 29 November–2 December 2001; IEEE: Piscataway, NJ, USA, 2001; Volume 1, pp. 591–596. [Google Scholar]
- Faiz, J.; Ebrahimi, B.M.; Akin, B.; Toliyat, H.A. Comprehensive eccentricity fault diagnosis in induction motors using finite element method. IEEE Trans. Magn. 2009, 45, 1764–1767. [Google Scholar] [CrossRef]
- Faiz, J.; Ebrahimi, B.; Sharifian, M. Finite element transient analysis of an on-load three-phase squirrel-cage induction motor with static eccentricity. Electromagnetics 2007, 27, 207–227. [Google Scholar] [CrossRef]
- Rosero, J.; Romeral, J.; Cusido, J.; Ortega, J.; Garcia, A. Fault detection of eccentricity and bearing damage in a PMSM by means of wavelet transforms decomposition of the stator current. In Proceedings of the 2008 23rd Annual IEEE Applied Power Electronics Conference and Exposition, Austin, TX, USA, 24–28 February 2008; IEEE: Piscataway, NJ, USA, 2008; pp. 111–116. [Google Scholar]
- Glowacz, Z.; Zdrojewski, A. Mathematical modelling of commutator DC motor in failure conditions. In Proceedings of the 2005 5th IEEE International Symposium on Diagnostics for Electric Machines, Power Electronics and Drives, Vienna, Austria, 7–9 September 2005; IEEE: Piscataway, NJ, USA, 2005; pp. 1–5. [Google Scholar]
- Glowacz, Z.; Zdrojewski, A. Diagnostics of commutator DC motor basing on spectral analysis of signals. In Proceedings of the 2007 IEEE International Symposium on Diagnostics for Electric Machines, Power Electronics and Drives, Cracow, Poland, 6–8 September 2007; IEEE: Piscataway, NJ, USA, 2007; pp. 497–500. [Google Scholar]
- Batzel, T.D.; Becker, N.C.; Comanescu, M. Analysis of brushed DC machinery faults with coupled finite element method and equivalent circuit model. IJME 2011, 11, 5–13. [Google Scholar]
- Trigeassou, J.C. Diagnostic des Machines électriques; Lavoisier: Paris, France, 2011. [Google Scholar]
- Iamamura, B.; Le Menach, Y.; Tounzi, A.; Sadowski, N.; Guillot, E. Study of static and dynamic eccentricities of a synchronous generator using 3-D FEM. IEEE Trans. Magn. 2010, 46, 3516–3519. [Google Scholar] [CrossRef]
- Ruiz, J.R.R.; Rosero, J.A.; Espinosa, A.G.; Romeral, L. Detection of demagnetization faults in permanent-magnet synchronous motors under nonstationary conditions. IEEE Trans. Magn. 2009, 45, 2961–2969. [Google Scholar] [CrossRef]
- Faiz, J.; Ojaghi, M. Different indexes for eccentricity faults diagnosis in three-phase squirrel-cage induction motors: A review. Mechatronics 2009, 19, 2–13. [Google Scholar] [CrossRef]
- Rajagopalan, S.; Roux, W.l.; Habetler, T.G.; Harley, R.G. Dynamic Eccentricity and Demagnetized Rotor Magnet Detection in Trapezoidal Flux (Brushless DC) Motors Operating Under Different Load Conditions. IEEE Trans. Power Electron. 2007, 22, 2061–2069. [Google Scholar] [CrossRef]
- le Roux, W.G.; Harley, R.G.; Habetler, T.G. Detecting Rotor Faults in Low Power Permanent Magnet Synchronous Machines. IEEE Trans. Power Electron. 2007, 22, 322–328. [Google Scholar] [CrossRef]
- Vaseghi, B. Contribution a L’etude des Machines Electriques en Presence de Defaut Entre-Spires Modélisation–Réduction du courant de défaut. Ph.D. Thesis, Institut National Polytechnique de Lorraine—INPL, Lorraine, France, 2009. [Google Scholar]
- Ibrahim, A. Contribution au Diagnostic de Machines électromécaniques: Exploitation des Signaux électriques et de la Vitesse Instantanée. Ph.D. Thesis, Université Jean Monnet, Saint-Etienne, France, 2009. [Google Scholar]
- Chahmi, A. Identification Paramétrique de la Machine Asynchrone dédiée au Diagnostic. Ph.D. Thesis, Université des Sciences et Technologie d‘Oran-MB, Bir El Djir, Algeriam, 2017. [Google Scholar]
- Hao, L.; Sun, Y.; Qiu, A.; Wang, X. Steady-state calculation and online monitoring of interturn short circuit of field windings in synchronous machines. IEEE Trans. Energy Convers. 2011, 27, 128–138. [Google Scholar] [CrossRef]
- Ammar, M. Surveillance et Diagnostic des défauts des Machines électriques: Applications aux Moteurs Asynchrones. Ph.D. Thesis, Université du 20 Août 1955, Skikda, Algeria, 2012. [Google Scholar]
- Shifat, T.A.; Hur, J.W. An effective stator fault diagnosis framework of BLDC motor based on vibration and current signals. IEEE Access 2020, 8, 106968–106981. [Google Scholar] [CrossRef]
- Sadeghi, I.; Ehya, H.; Faiz, J.; Akmal, A.A.S. Online condition monitoring of large synchronous generator under short circuit fault—A review. In Proceedings of the 2018 IEEE international conference on industrial technology (ICIT), Lyon, France, 20–22 February 2018; IEEE: Piscataway, NJ, USA, 2018; pp. 1843–1848. [Google Scholar]
- Elez, A.; Tomcic, B.; Petrinic, M. Detection of inter-coil short circuits in coils of salient pole synchronous generator field winding on the basis of analysis of magnetic field in the machine. In Proceedings of the ICREPQ 2010, Granada, Spain, 23–25 March 2010. [Google Scholar]
- Darbas, C. Commande décentralisée et Modulaire des Convertisseurs MMC intégrée au Coeur des Gate-Drivers. Ph.D. Thesis, Nantes Université, Nantes, France, 2022. [Google Scholar]
- Zhang, W.; Xu, D.; Enjeti, P.N.; Li, H.; Hawke, J.T.; Krishnamoorthy, H.S. Survey on fault-tolerant techniques for power electronic converters. IEEE Trans. Power Electron. 2014, 29, 6319–6331. [Google Scholar] [CrossRef]
- Radu, P.V.; Lewandowski, M.; Szelag, A.; Steczek, M. Short-Circuit Fault Current Modeling of a DC Light Rail System with a Wayside Energy Storage Device. Energies 2022, 15, 3527. [Google Scholar] [CrossRef]
Figure 1.
Temperature-compensated charging voltage in a lead–acid starting battery [42].
Figure 1.
Temperature-compensated charging voltage in a lead–acid starting battery [42].

Figure 2.
Equivalent electrical circuit of a battery [53].
Figure 2.
Equivalent electrical circuit of a battery [53].

Figure 3.
Shaded cells with I-V/P-V curve response [86].
Figure 3.
Shaded cells with I-V/P-V curve response [86].

Figure 5.
I-V and P-V curve responses when bypass is shunted [86]. (a) Current–voltage curve; (b) Power–voltage curve.
Figure 5.
I-V and P-V curve responses when bypass is shunted [86]. (a) Current–voltage curve; (b) Power–voltage curve.

Figure 6.
I-V and P-V curve responses when bypass is in open circuit [86]. (a) Current–voltage curve; (b) Power–voltage curve.
Figure 6.
I-V and P-V curve responses when bypass is in open circuit [86]. (a) Current–voltage curve; (b) Power–voltage curve.

Figure 7.
Current–voltage and voltage–power curve response in hotspot fault [92]. (a) I-V and V-P curves of non-step-type hotspot module. (b) I-V and V-P curves of step-type hotspot module.
Figure 7.
Current–voltage and voltage–power curve response in hotspot fault [92]. (a) I-V and V-P curves of non-step-type hotspot module. (b) I-V and V-P curves of step-type hotspot module.

Figure 8.
Cell discoloration and I-V characteristics in yellowing case [125].
Figure 8.
Cell discoloration and I-V characteristics in yellowing case [125].


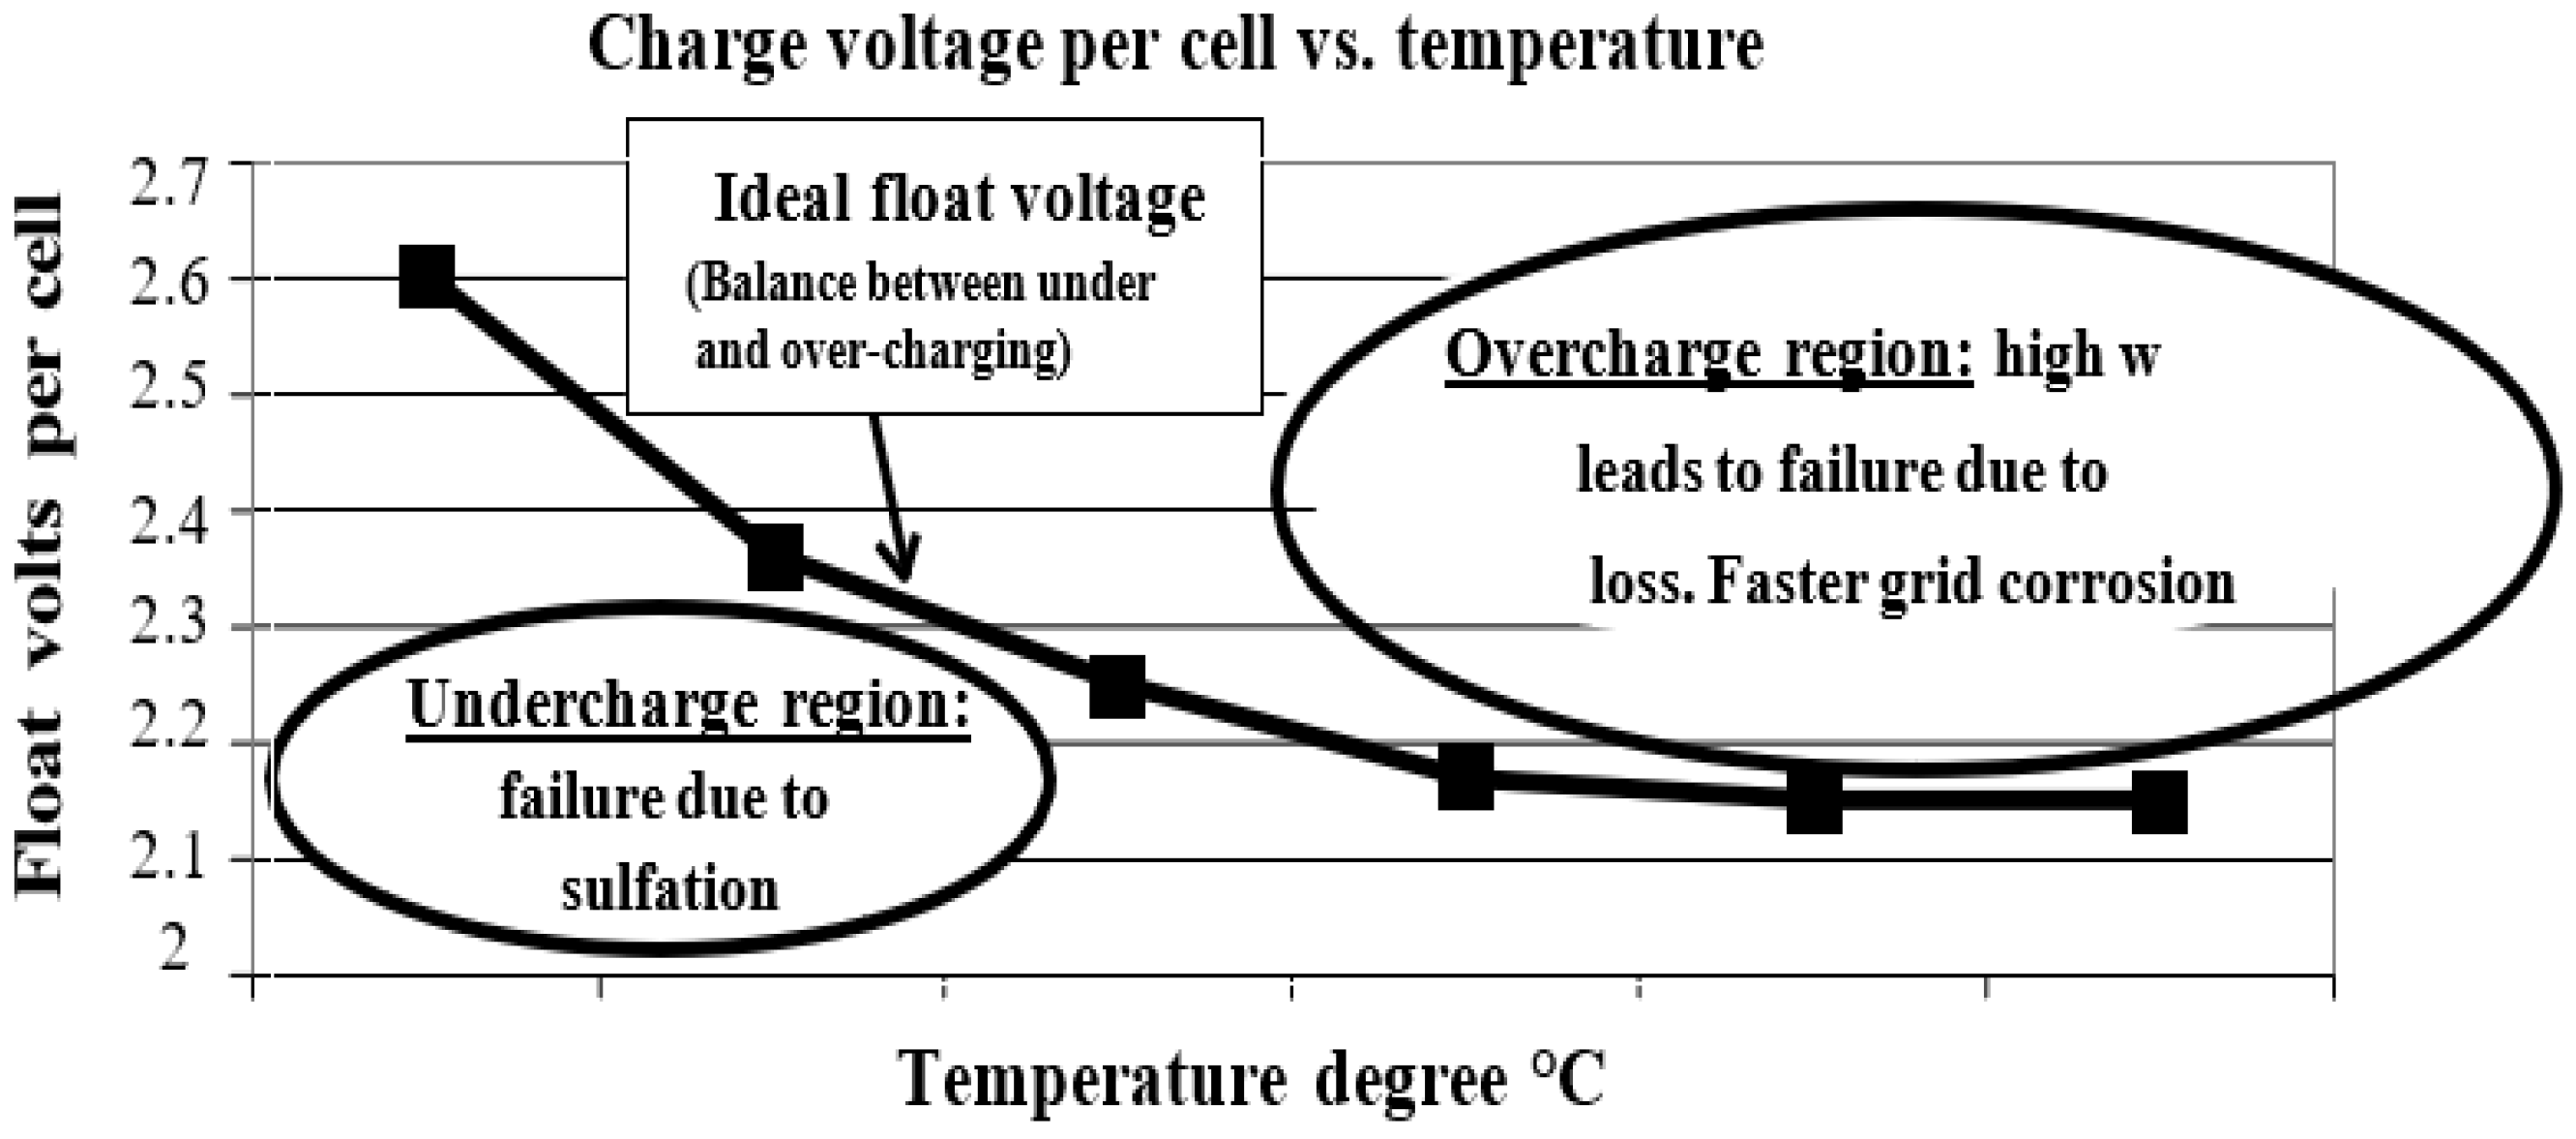
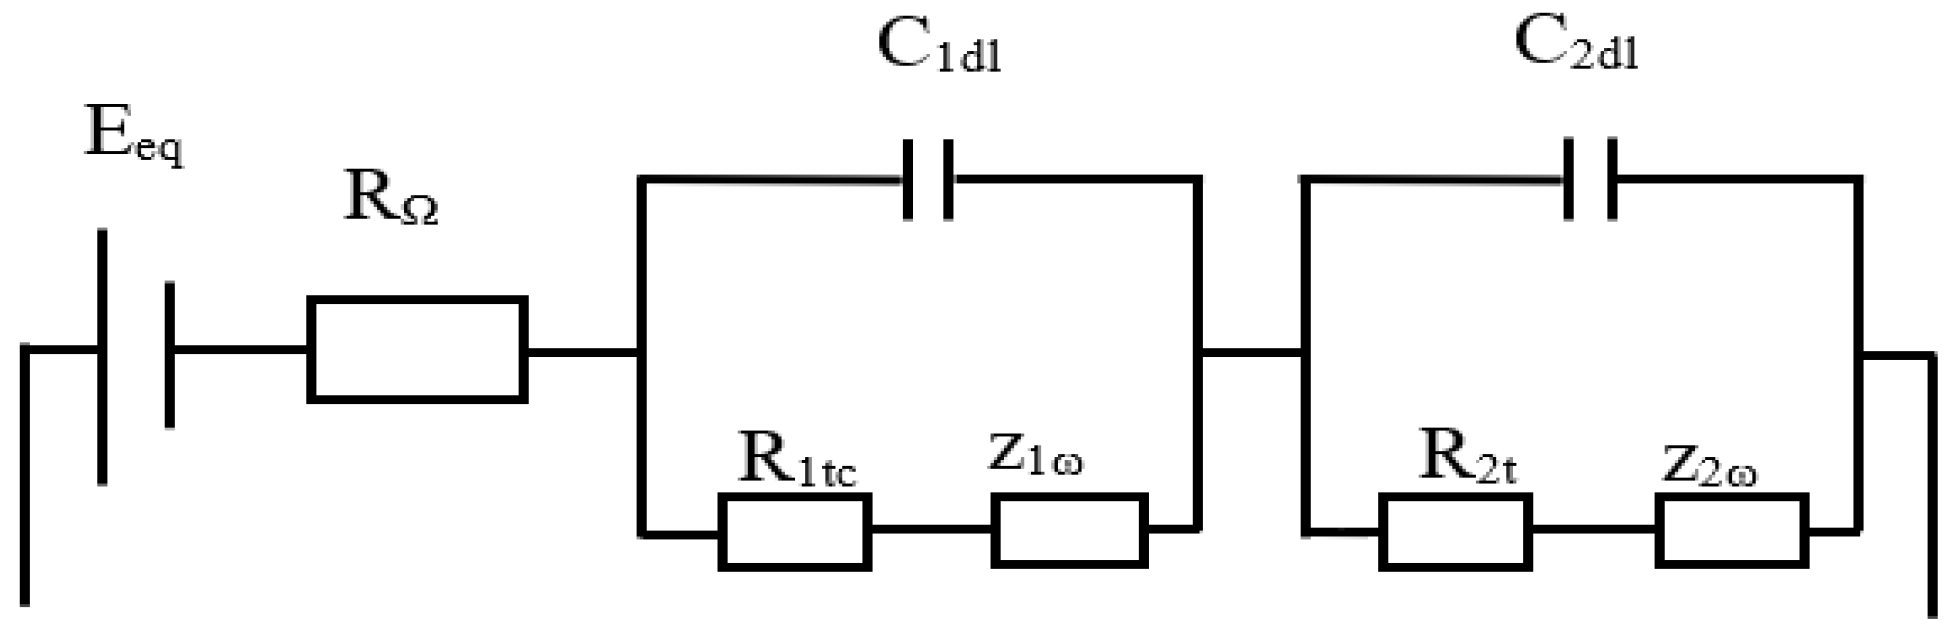
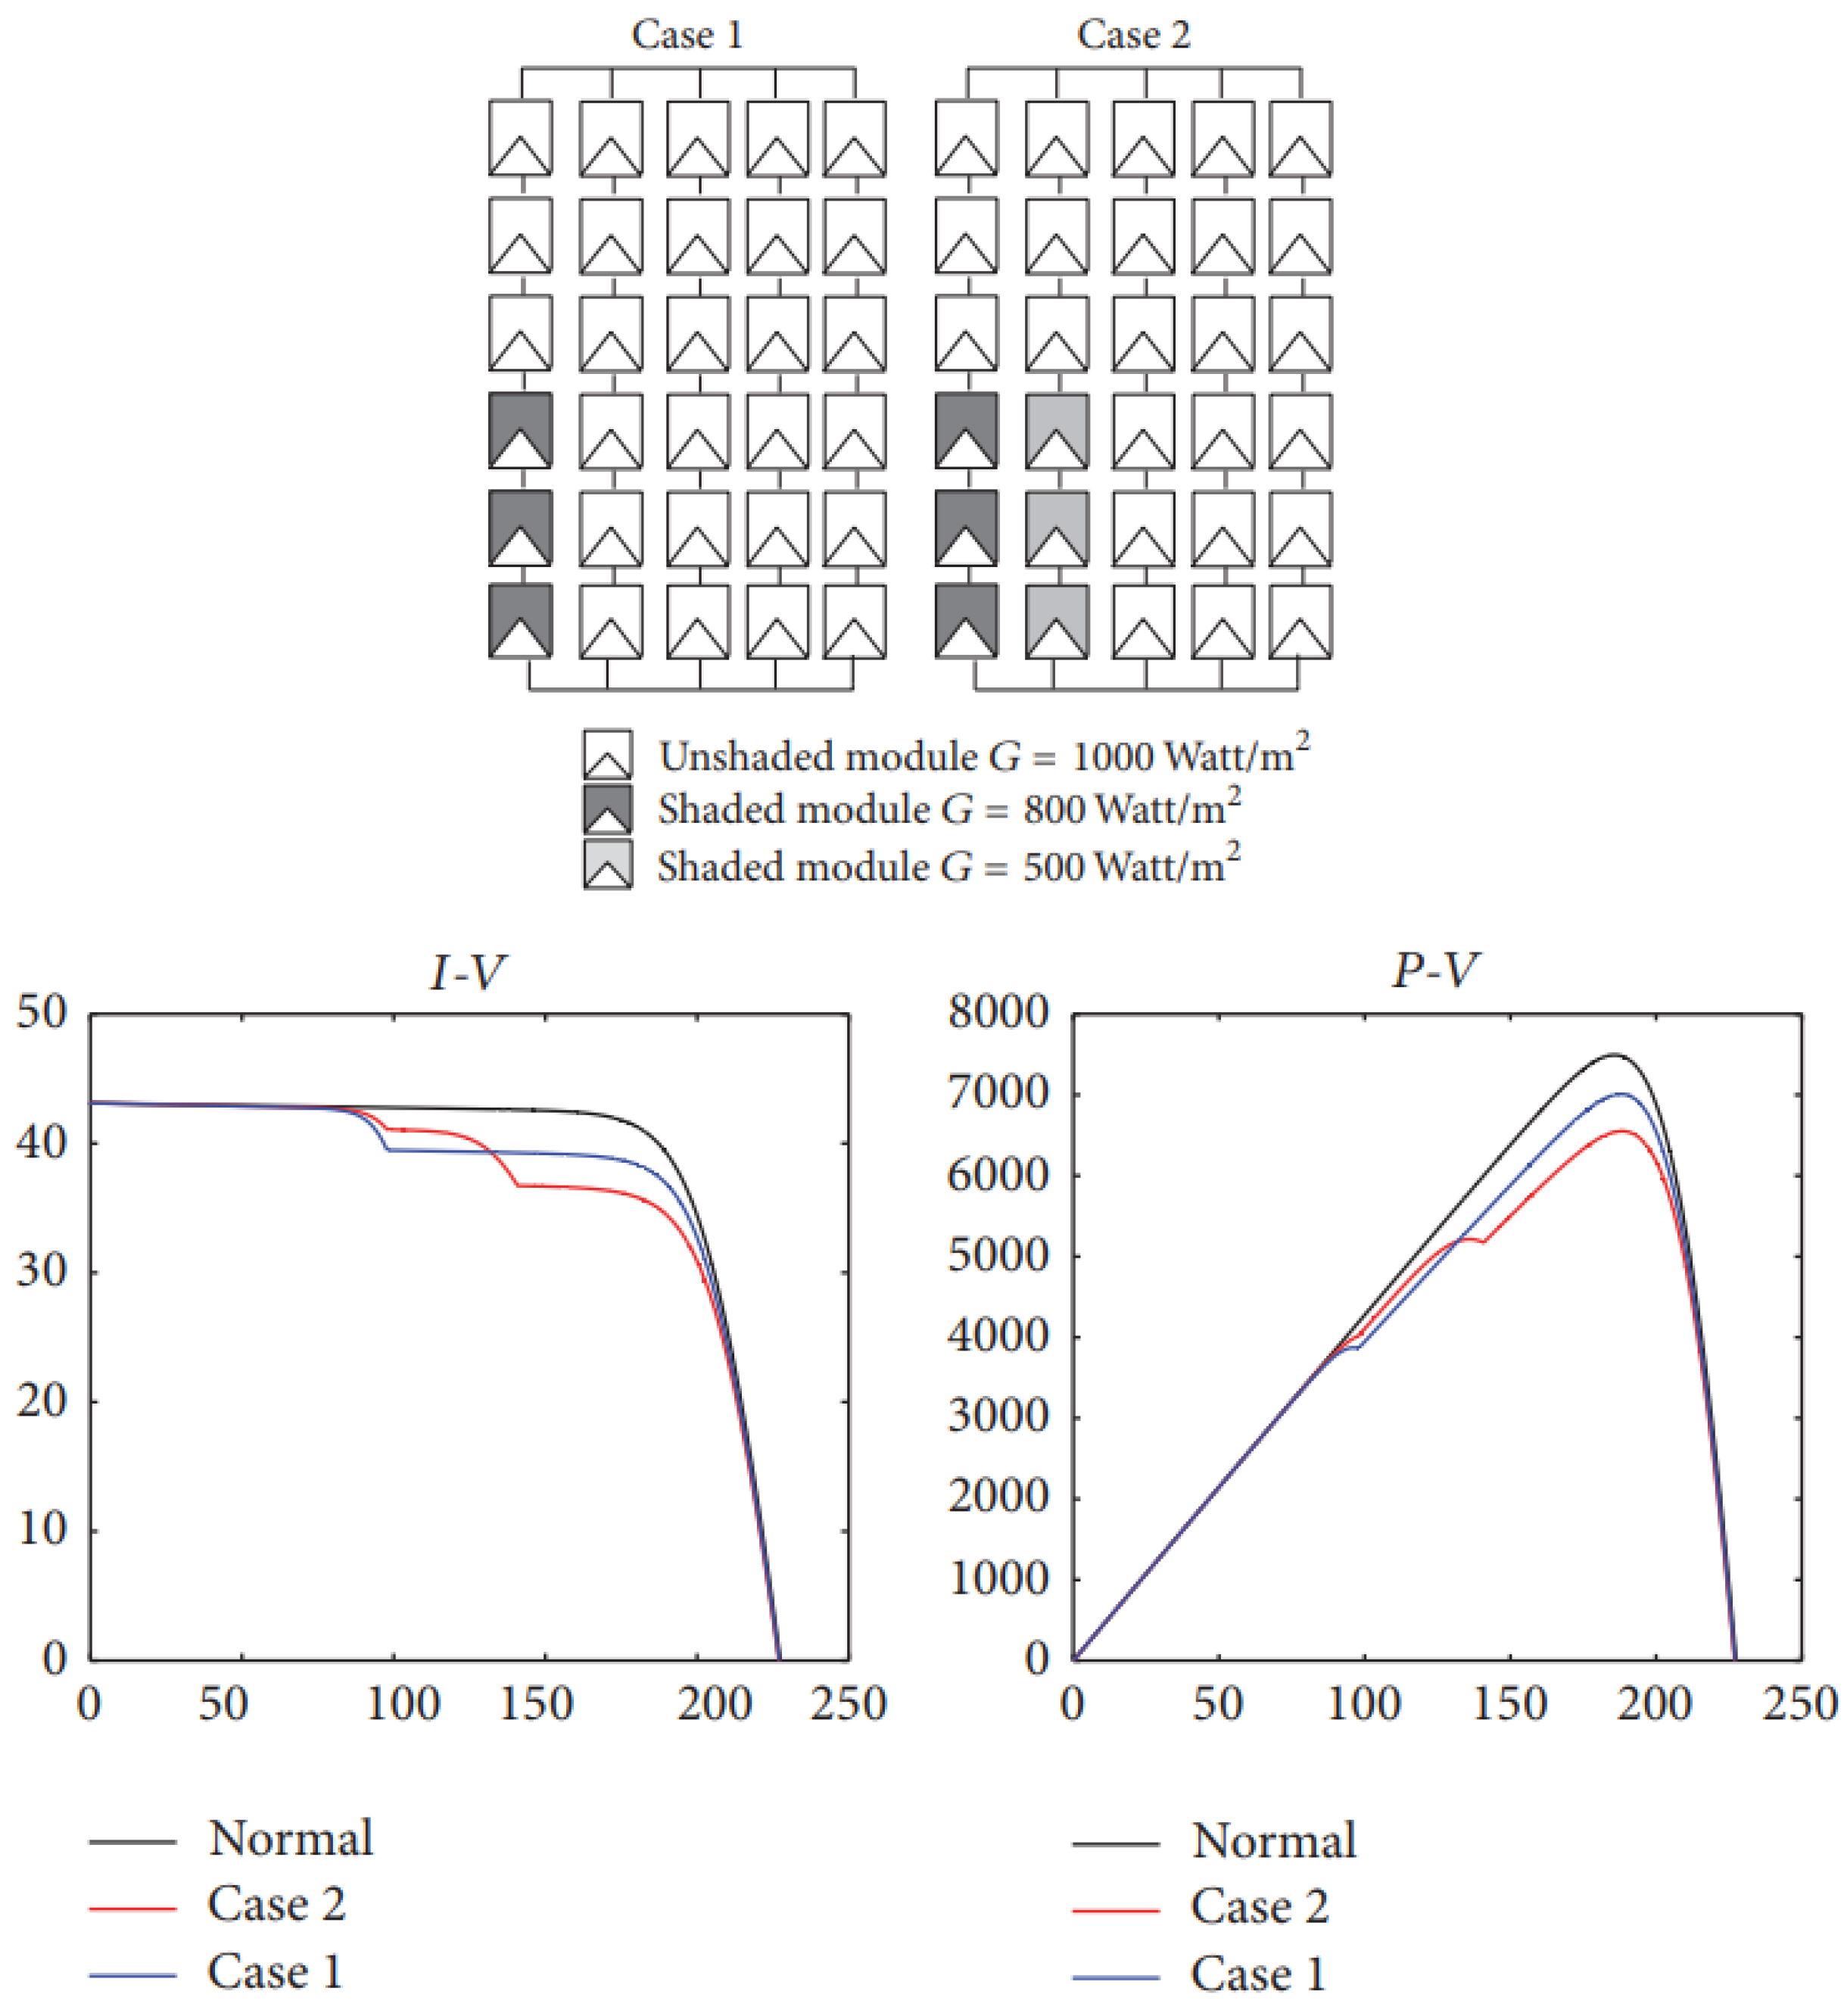
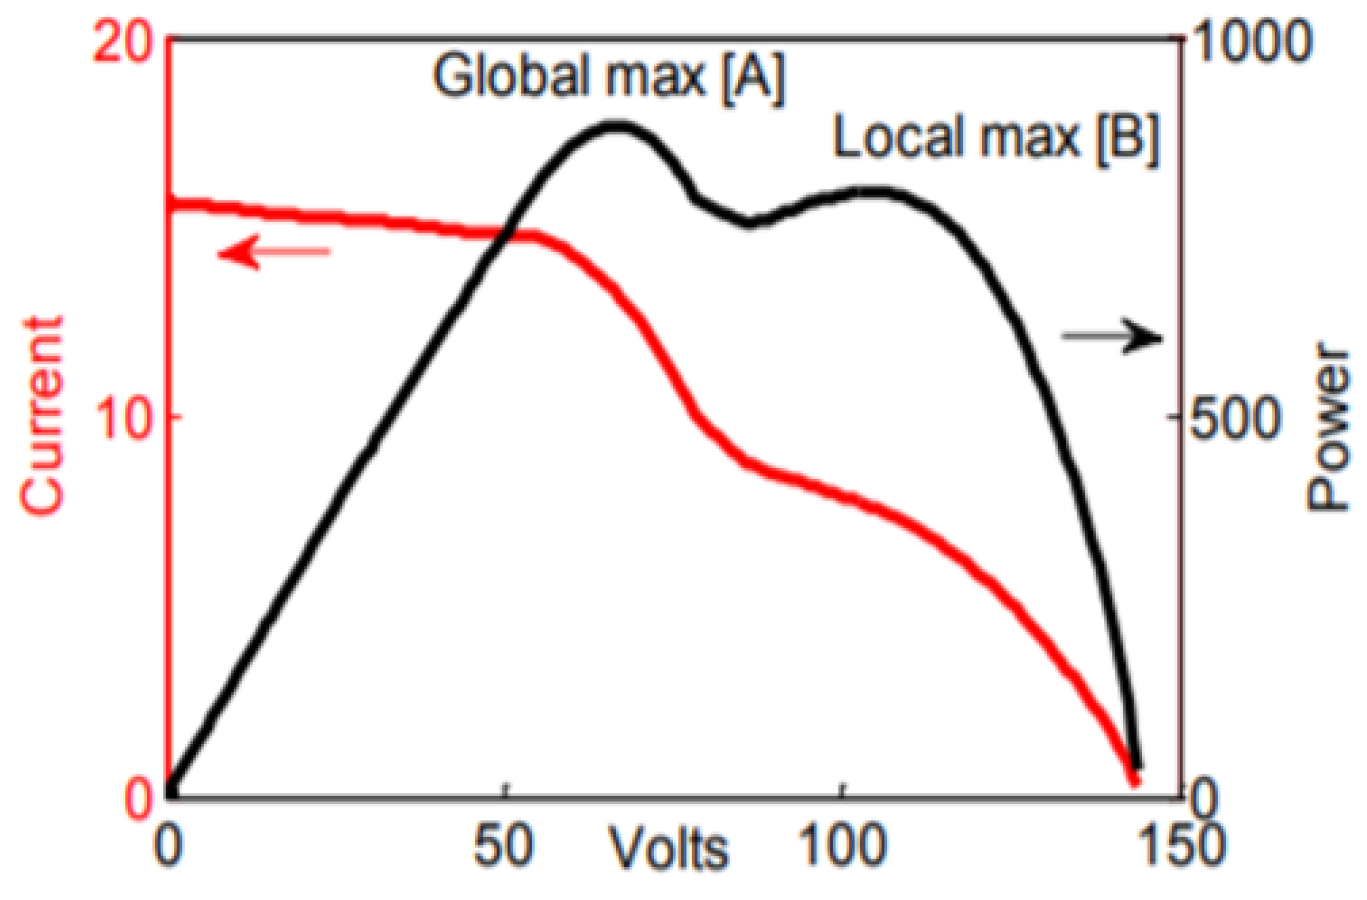
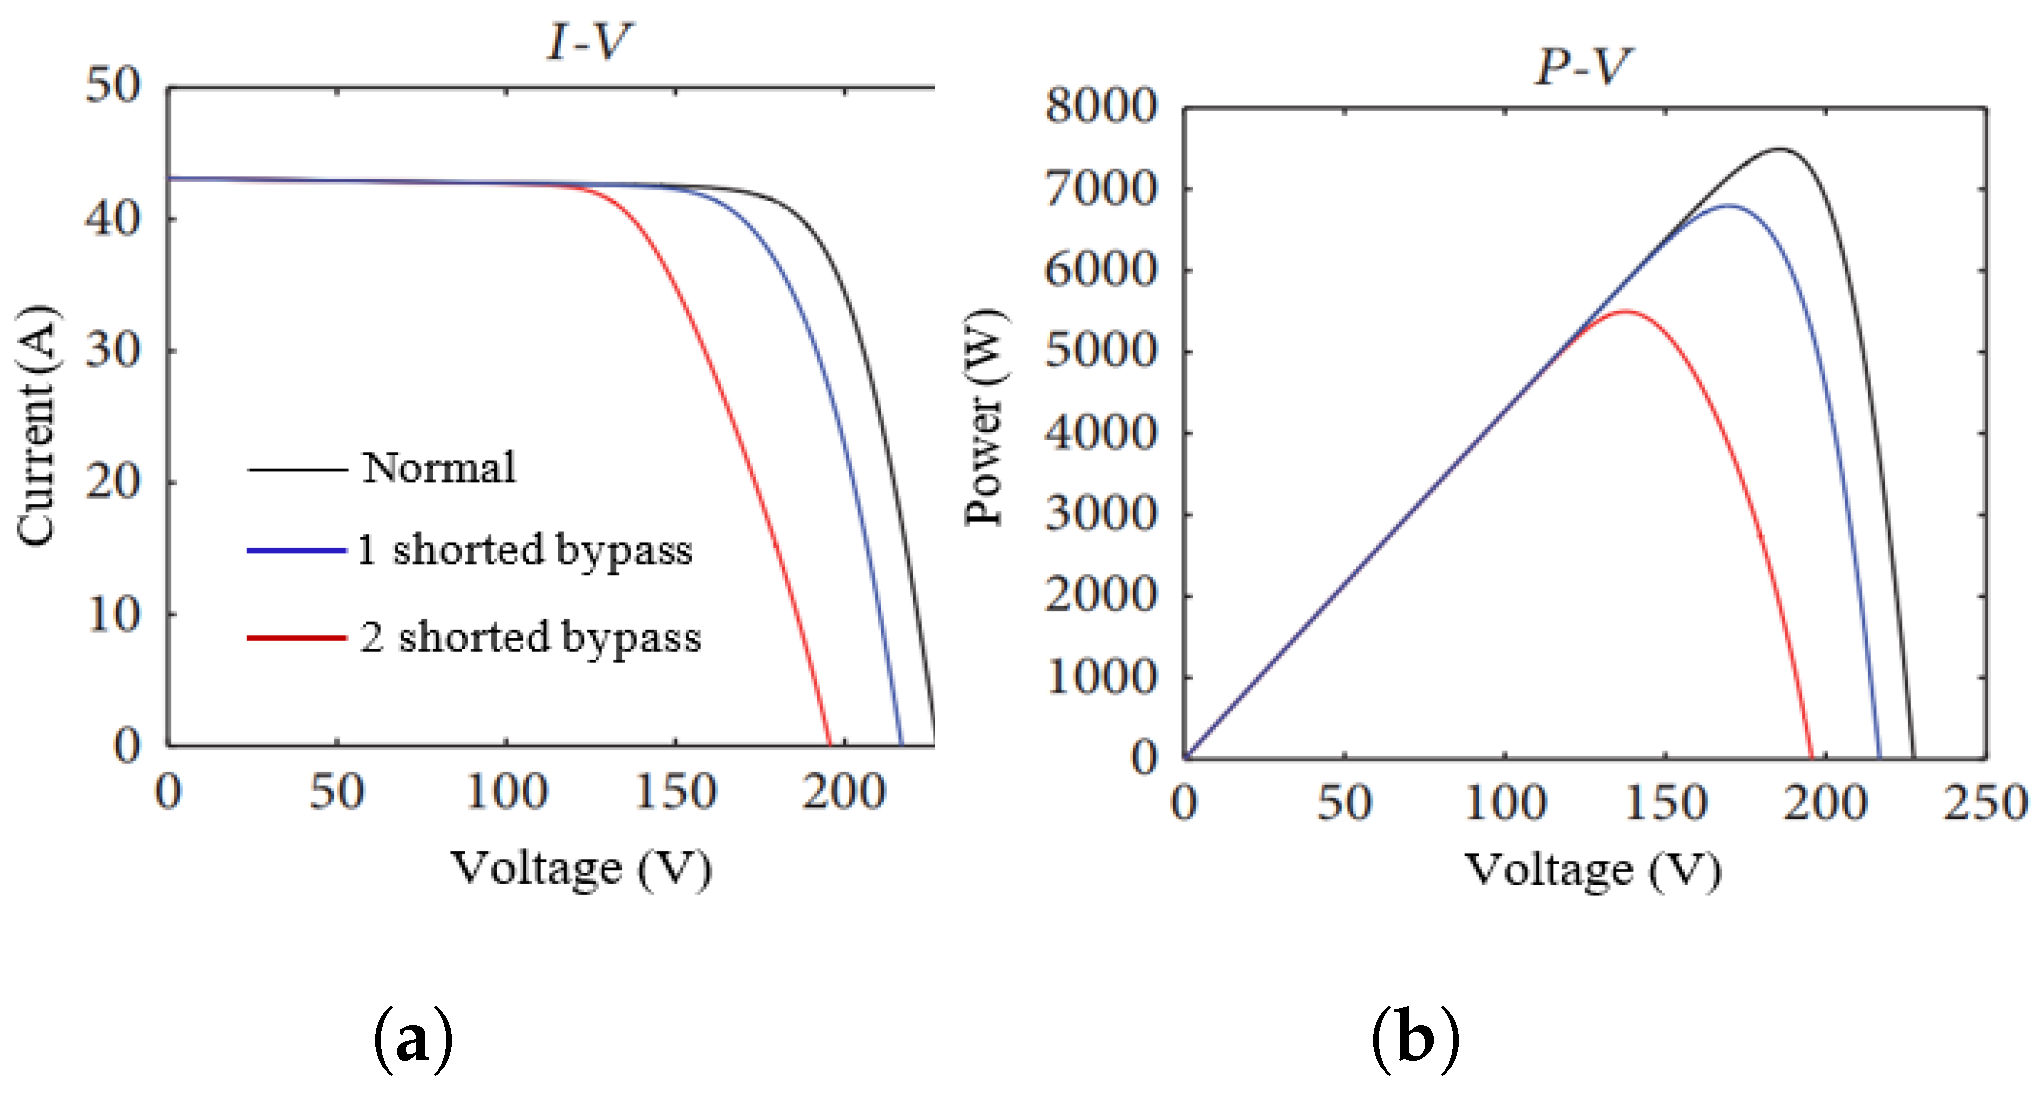
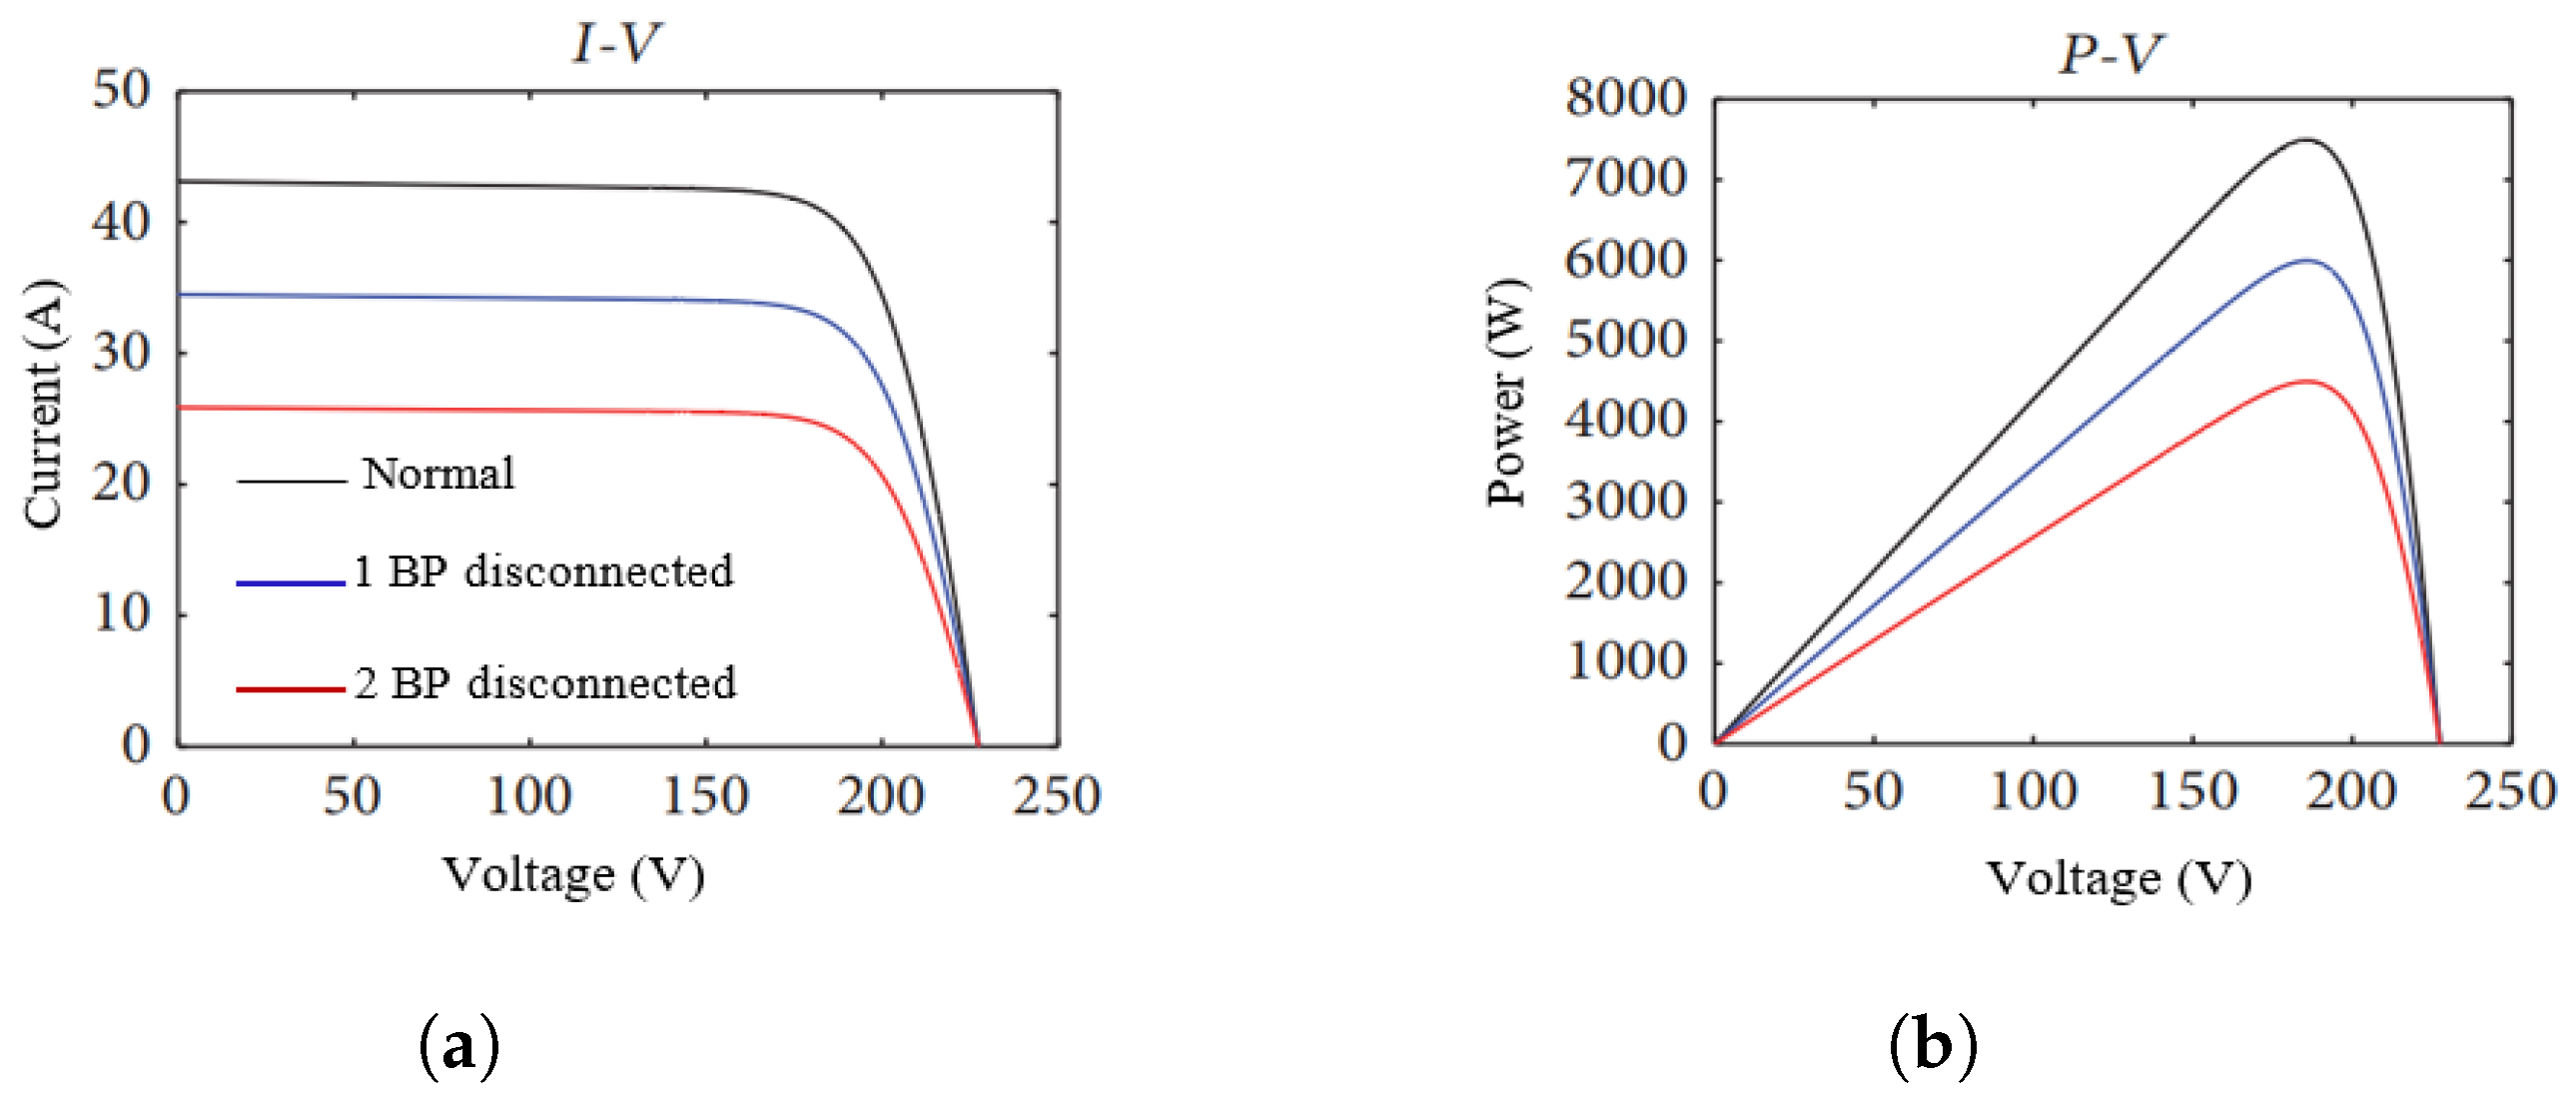
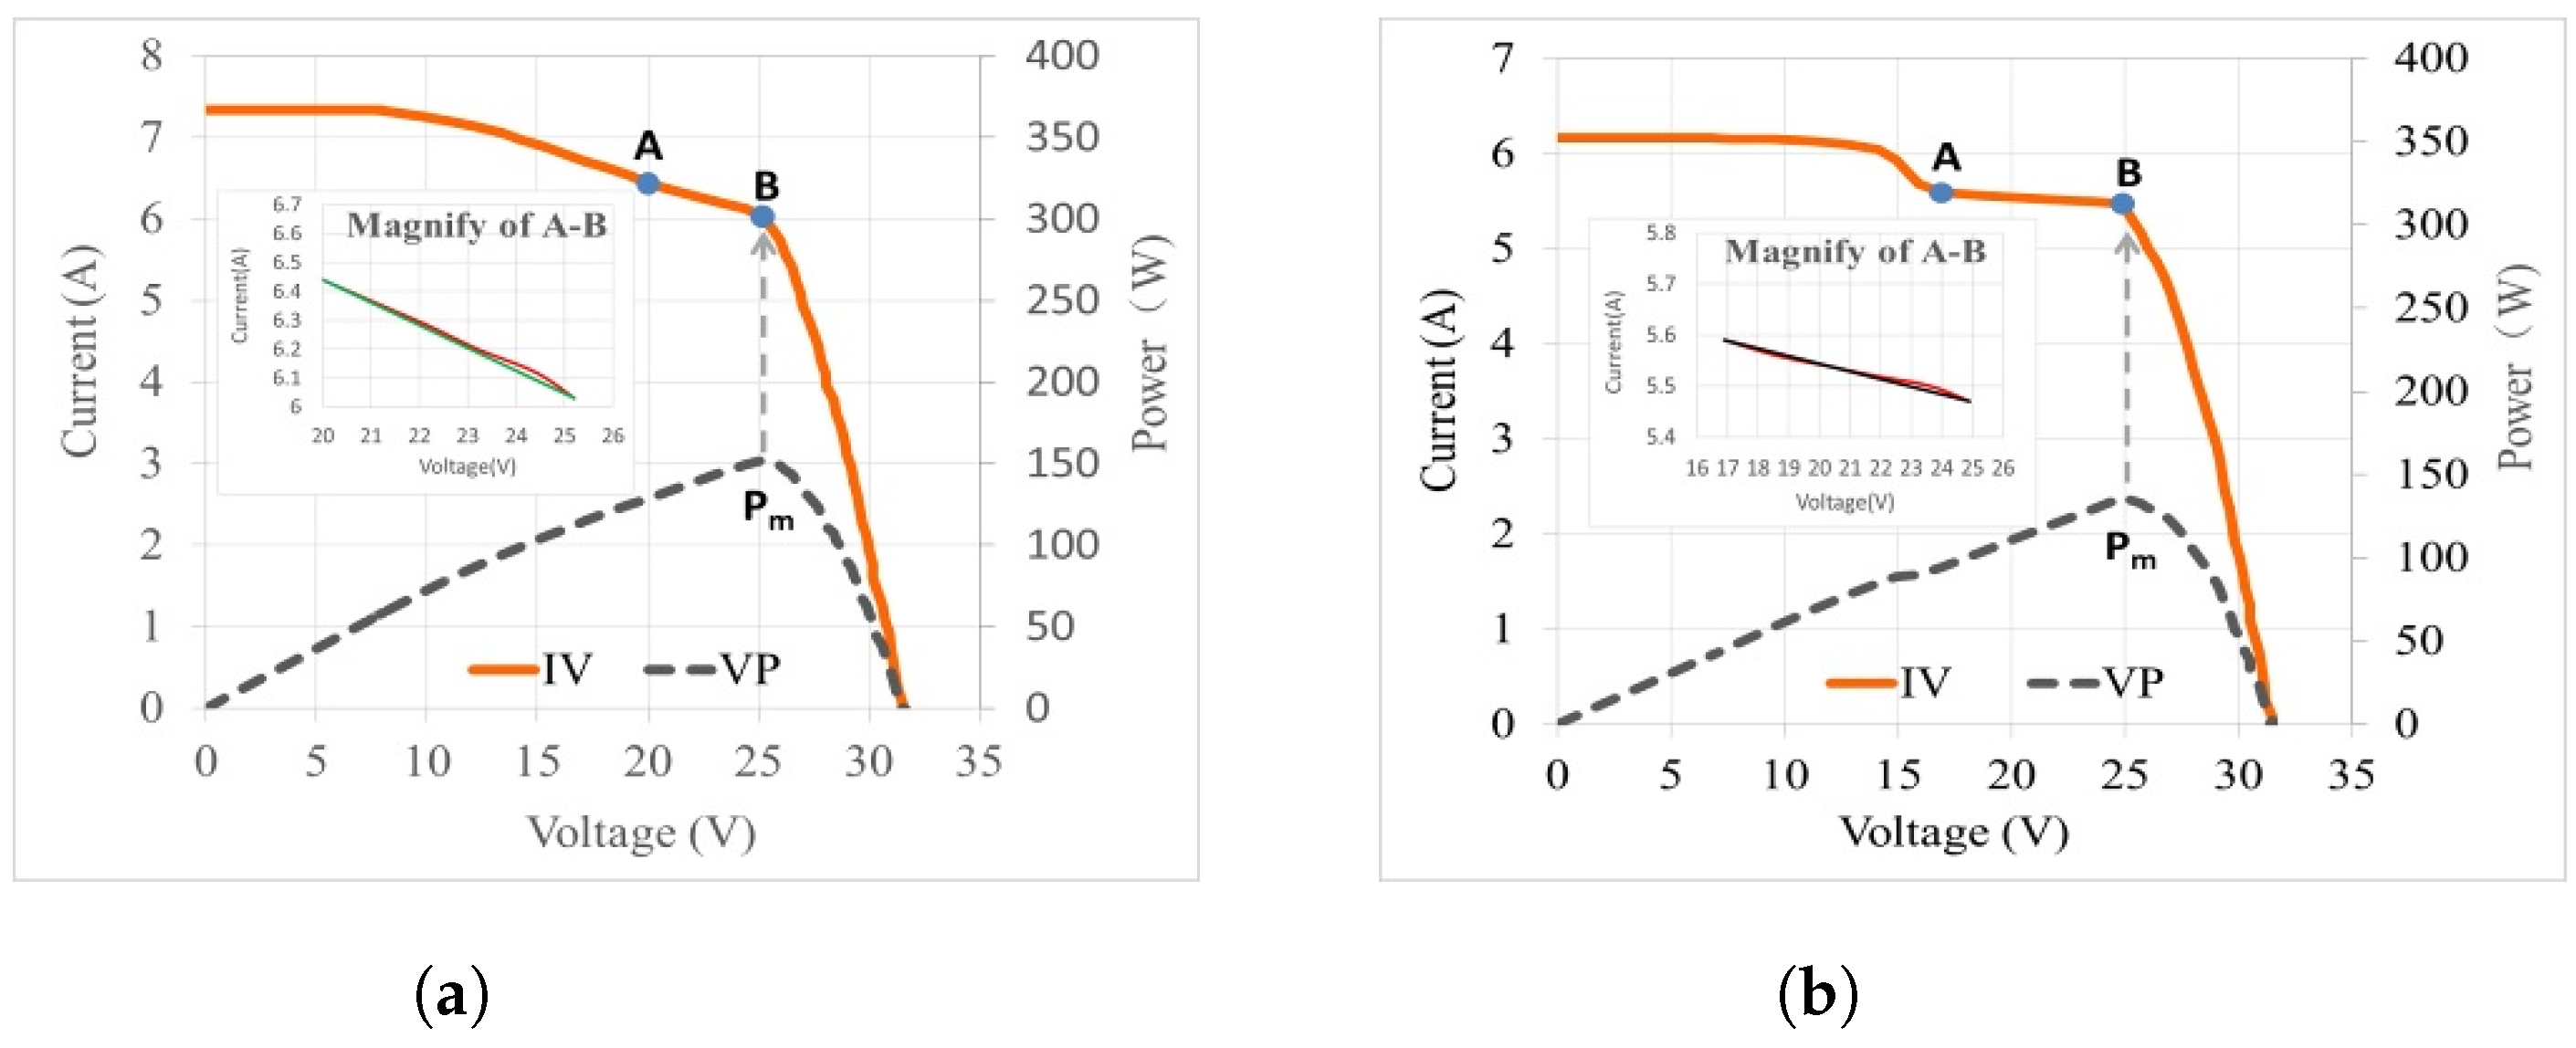
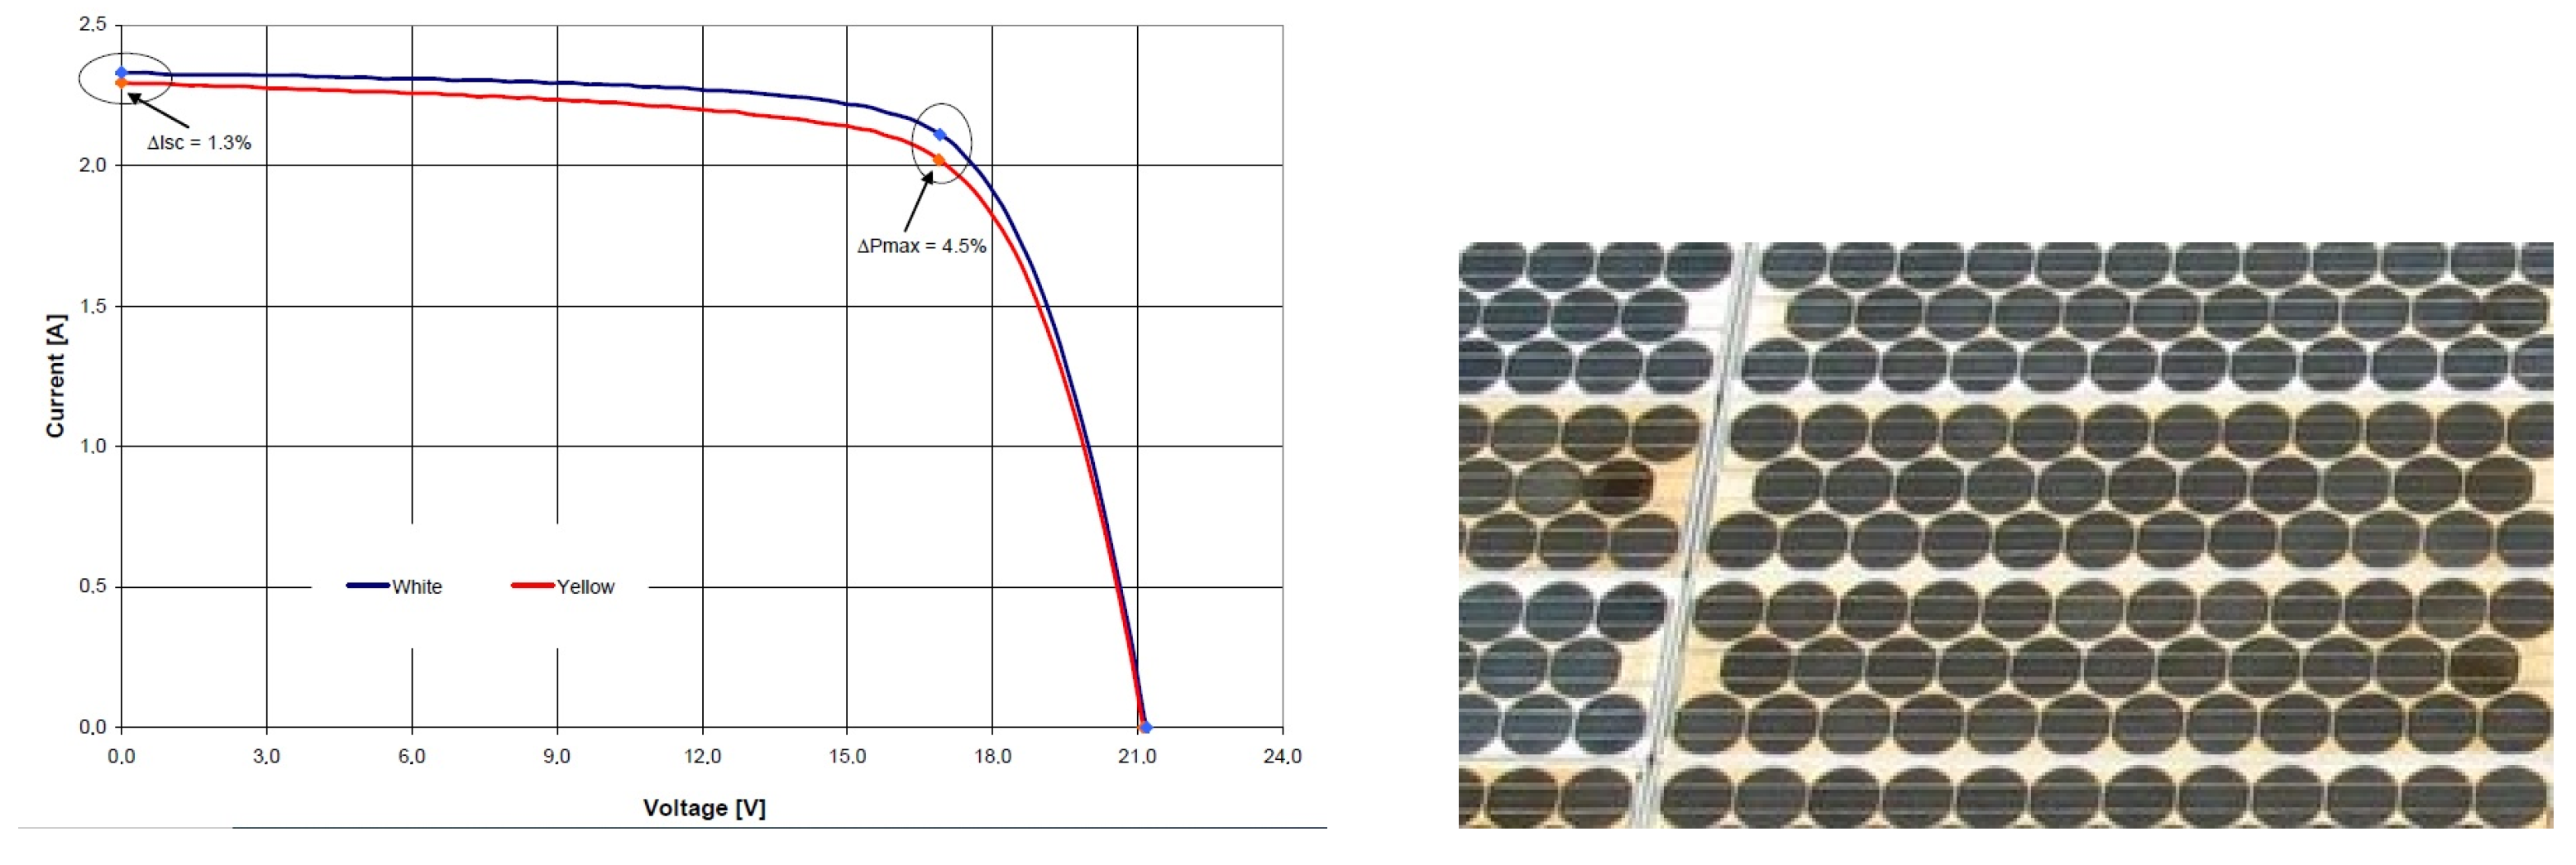
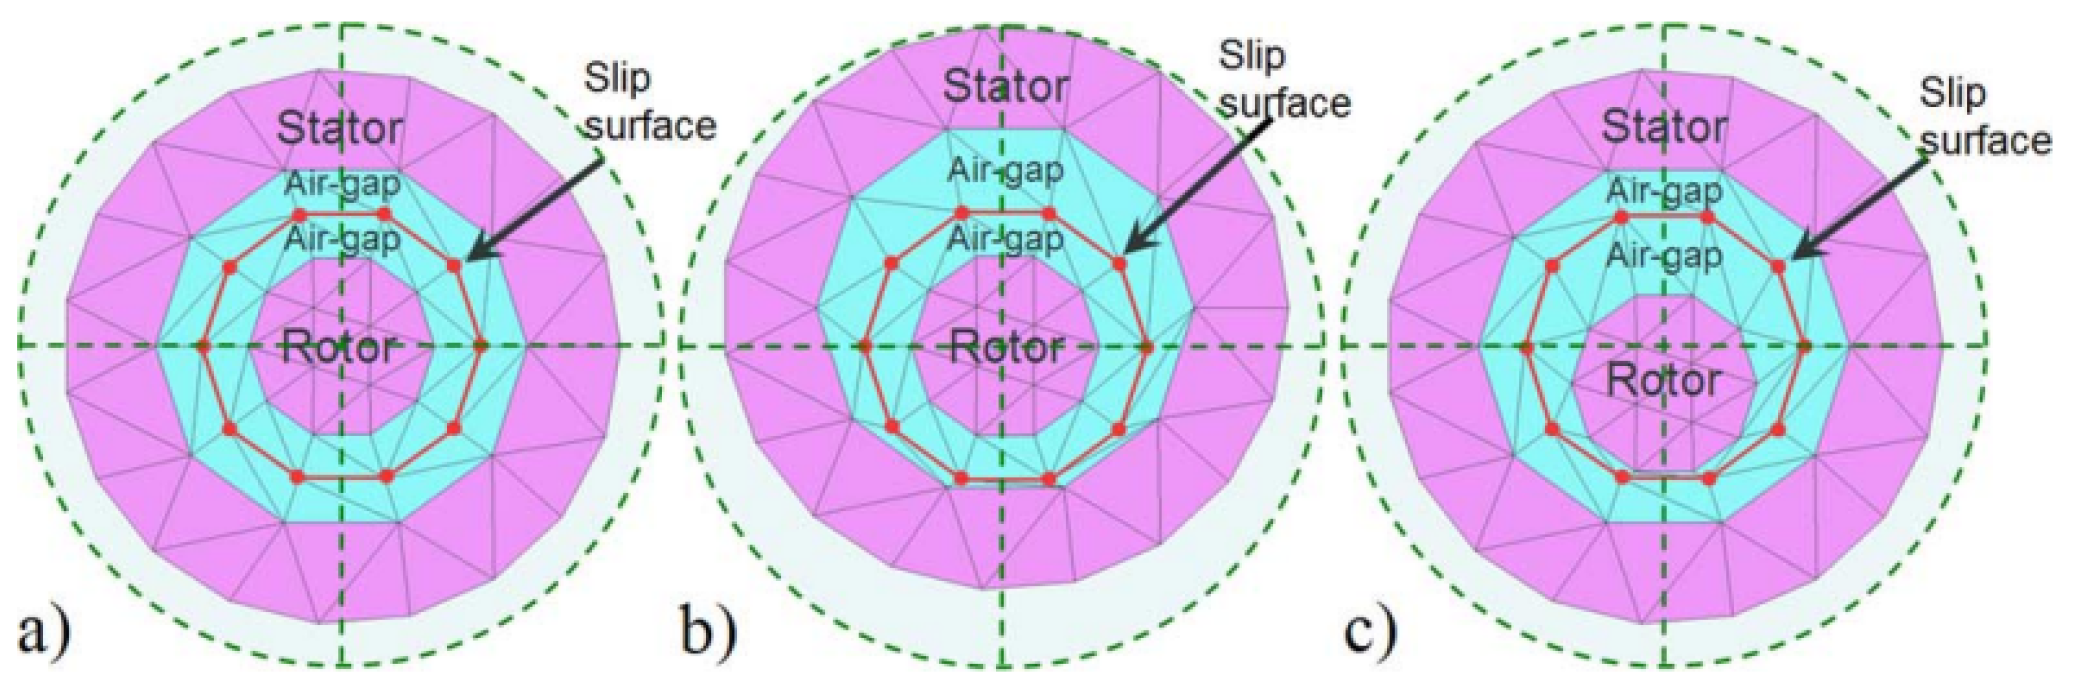
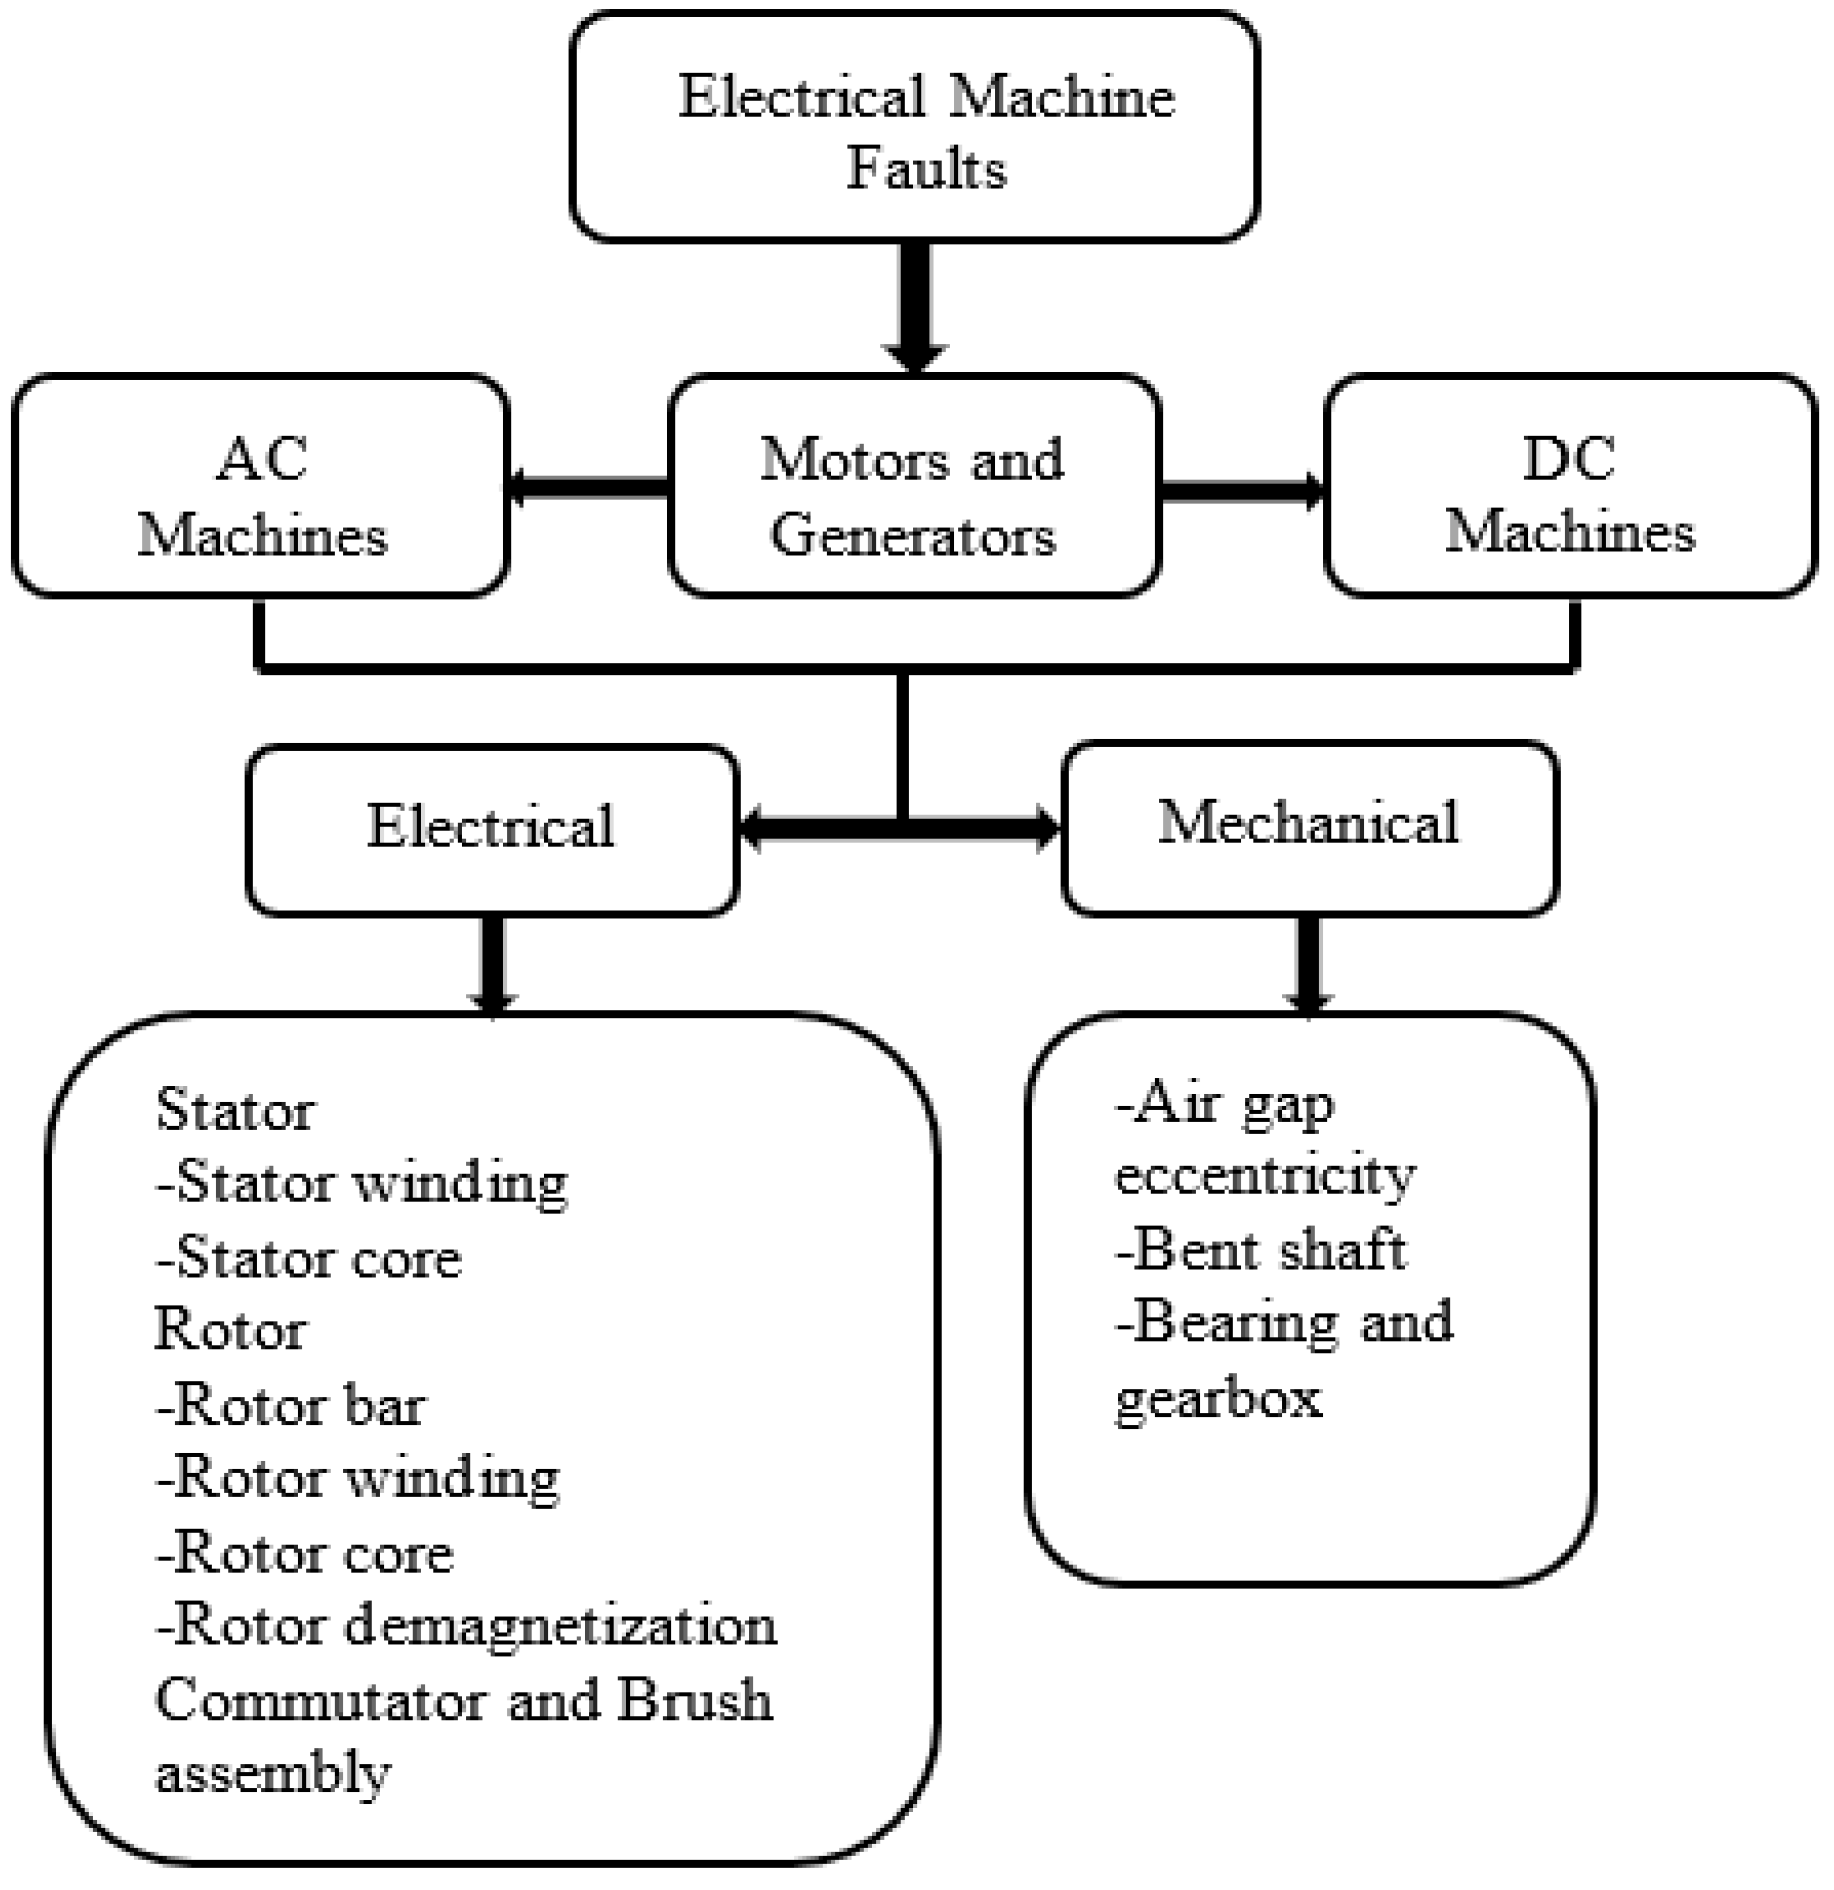
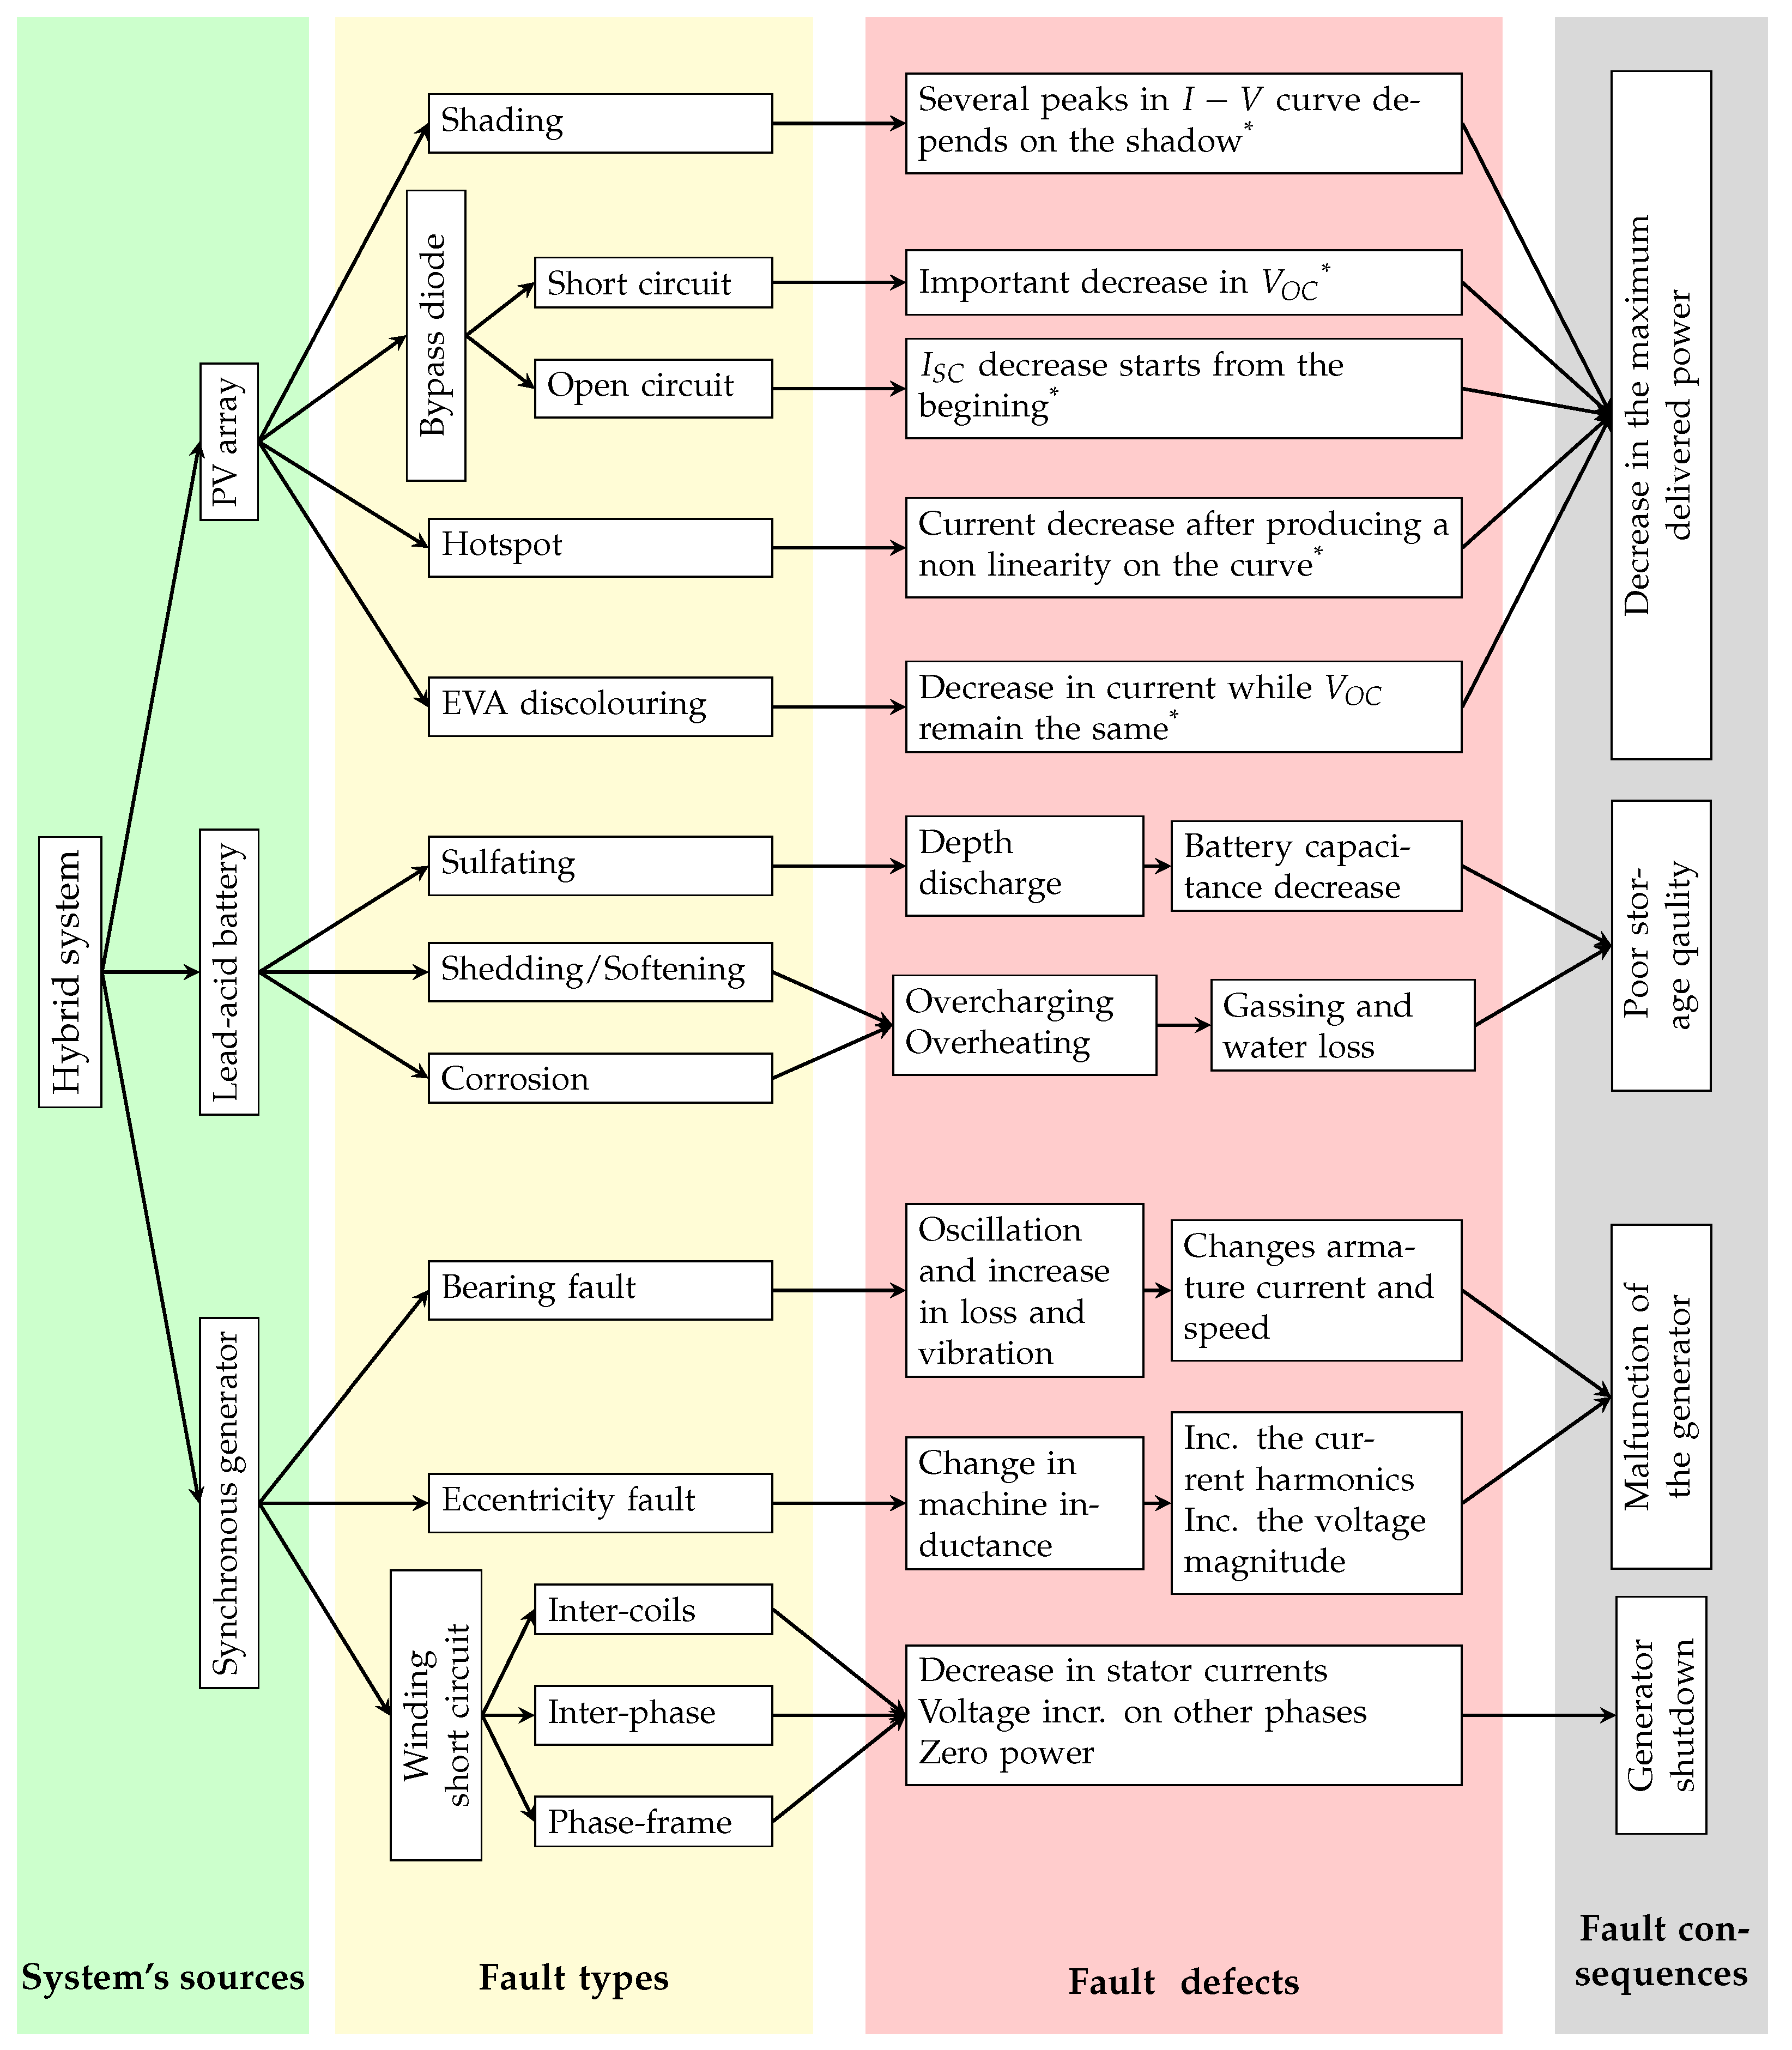
Figure 11.
Various faults in electrical machines.

Figure 12.
Fault types and consequences. * For more details on the shape of the I-V curves, please refers to the third section: “Photovoltaic System Faults”.
Figure 12.
Fault types and consequences. * For more details on the shape of the I-V curves, please refers to the third section: “Photovoltaic System Faults”.

Disclaimer/Publisher’s Note: The statements, opinions and data contained in all publications are solely those of the individual author(s) and contributor(s) and not of MDPI and/or the editor(s). MDPI and/or the editor(s) disclaim responsibility for any injury to people or property resulting from any ideas, methods, instructions or products referred to in the content. |
© 2024 by the authors. Licensee MDPI, Basel, Switzerland. This article is an open access article distributed under the terms and conditions of the Creative Commons Attribution (CC BY) license (https://creativecommons.org/licenses/by/4.0/).
Share and Cite
MDPI and ACS Style
Hadj Salem, M.; Mansouri, K.; Chauveau, E.; Ben Salem, Y.; Abdelkrim, M.N. Multi-Power System Electrical Source Fault Review. Energies 2024, 17, 1187. https://0-doi-org.brum.beds.ac.uk/10.3390/en17051187
AMA Style
Hadj Salem M, Mansouri K, Chauveau E, Ben Salem Y, Abdelkrim MN. Multi-Power System Electrical Source Fault Review. Energies. 2024; 17(5):1187. https://0-doi-org.brum.beds.ac.uk/10.3390/en17051187
Chicago/Turabian StyleHadj Salem, Mariem, Karim Mansouri, Eric Chauveau, Yemna Ben Salem, and Mohamed Naceur Abdelkrim. 2024. "Multi-Power System Electrical Source Fault Review" Energies 17, no. 5: 1187. https://0-doi-org.brum.beds.ac.uk/10.3390/en17051187
Note that from the first issue of 2016, this journal uses article numbers instead of page numbers. See further details here.