
A Novel Layout for Combined Heat and Power Production for a Hospital Based on a Solid Oxide Fuel Cell †

 , , , and
Abstract
:1. Introduction
Aim of the Paper
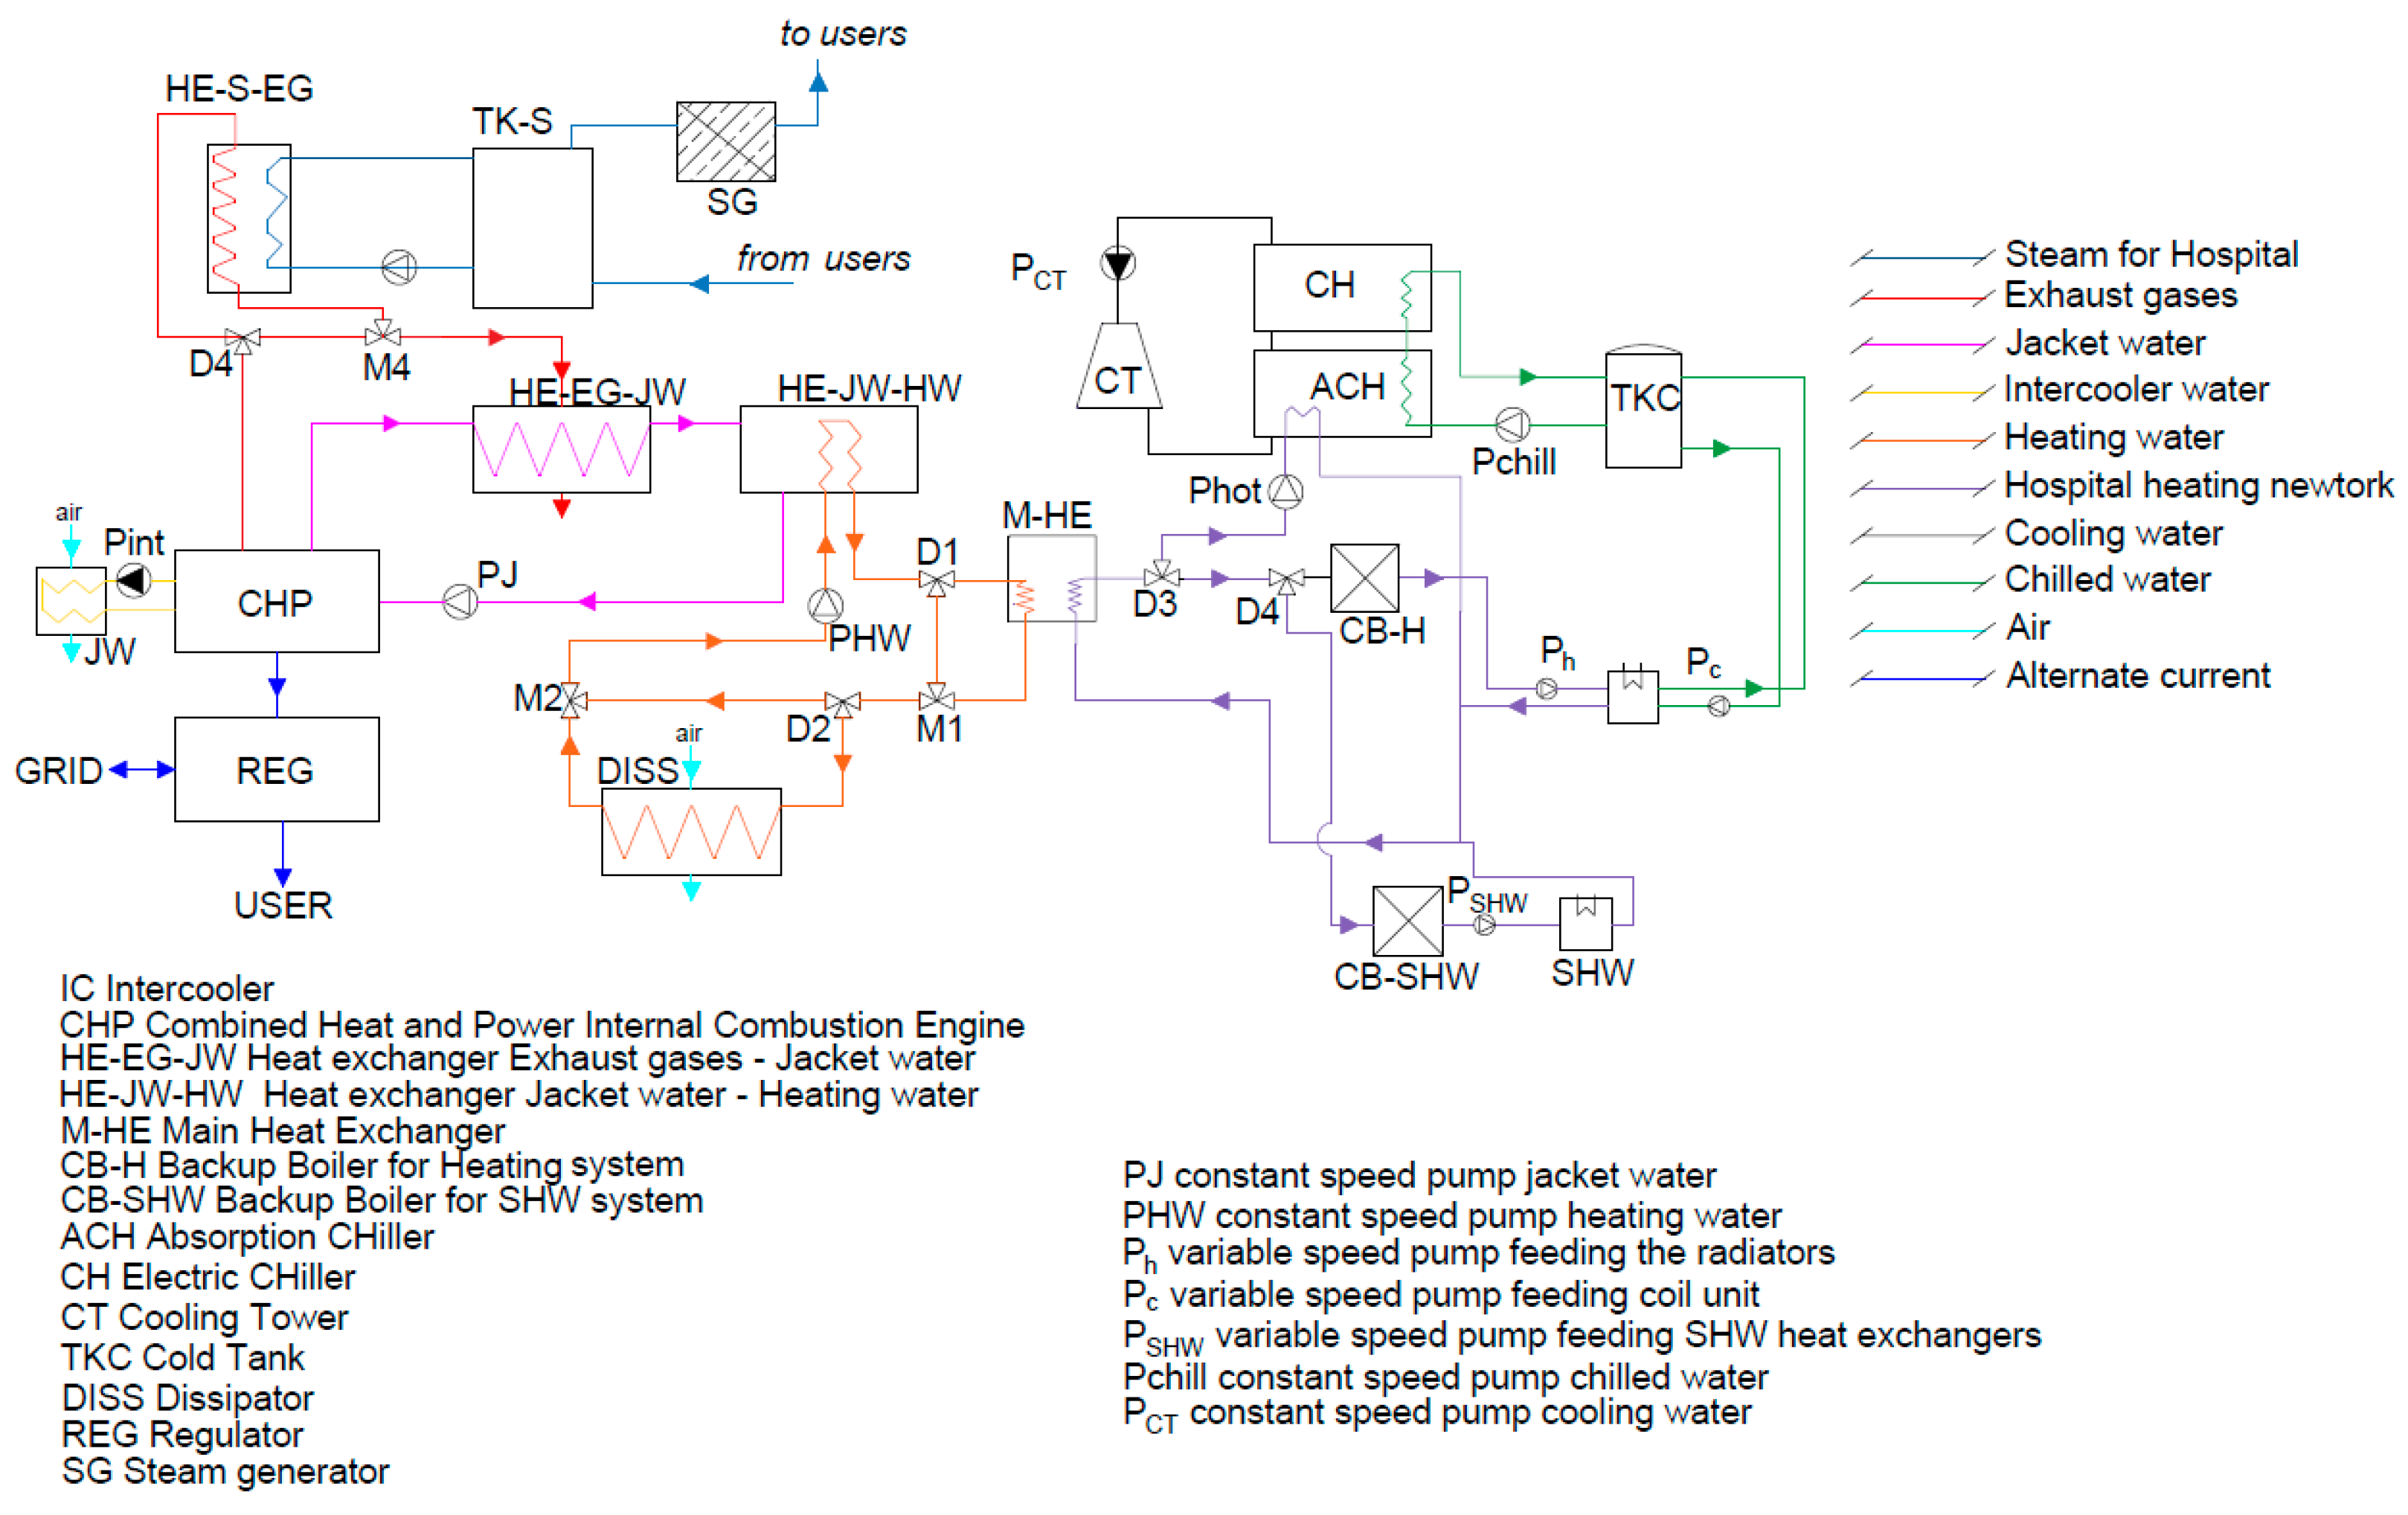
2. System Layout4
- HE-GA-A, where this exhaust stream heats up the fresh air entering the plant;
- HE-EG-CH, where the exhaust stream supplies thermal energy to the methane entering the plant;
- HRSG-3, where the exhaust stream produces steam.
3. System Model
Thermoeconomic Model
4. Case Study
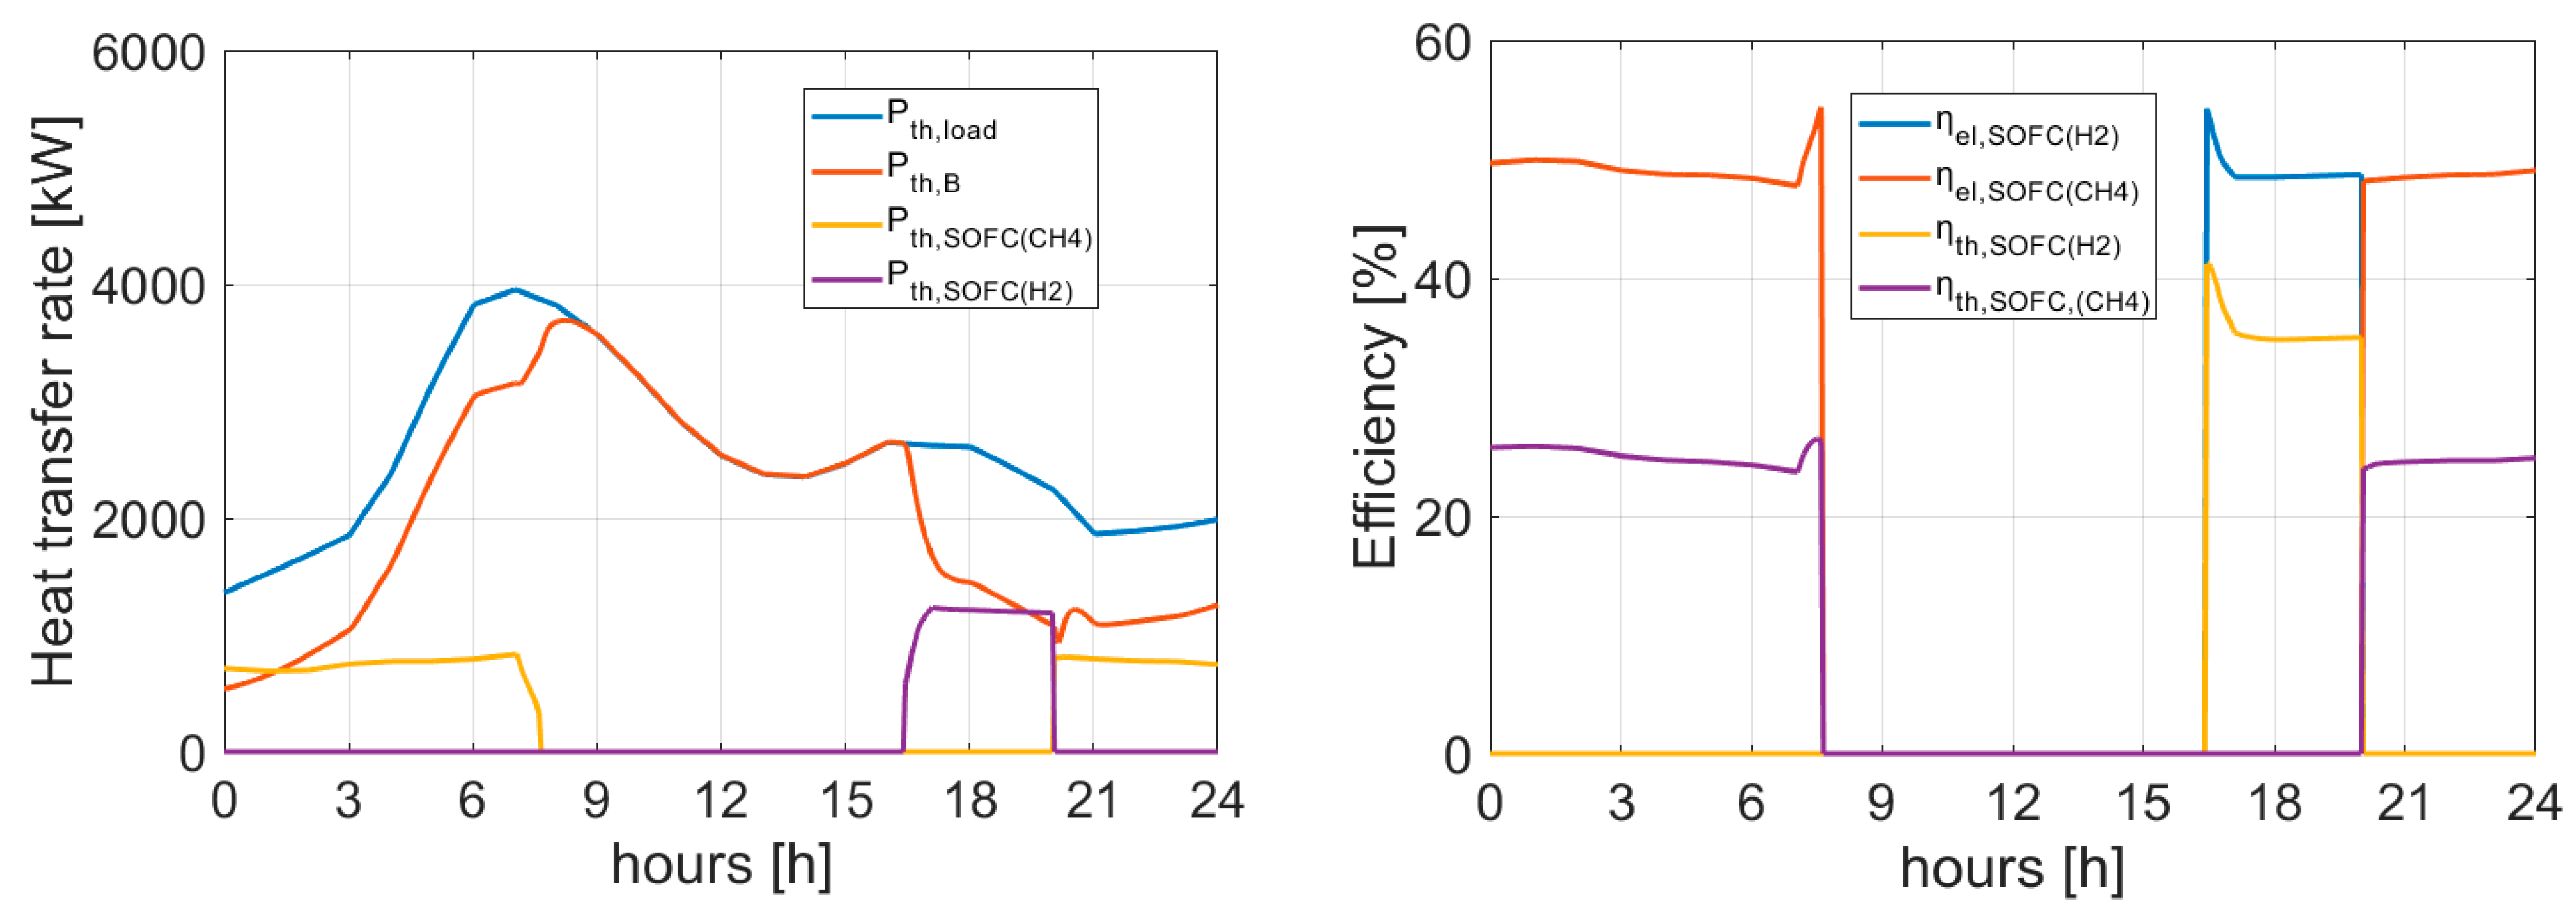
5. Results
Sensitivity Analysis
6. Conclusions
- The proposed layout is extremely promising, as it was able to reduce the natural gas consumption of the hospital by almost 30%.
- The proposed system achieves a primary energy savings of 32%.
- From an economic point of view, despite the remarkable capital cost of EUR 17.7 M, the proposed plant achieves an interesting simple payback of 6.5 years.
- The PV field capacity should be equal to 9.00 MW to maximize the economic performance of the proposed plant.
Author Contributions
Funding
Data Availability Statement
Acknowledgments
Conflicts of Interest
Nomenclature
| AEC | Alkaline electrolyzer cell |
| AFC | Alkaline fuel cell |
| A-SH | Auxiliary steam heater |
| ASR | Area specific resistance (w/cm2) |
| C | Cost (EUR) |
| CHP | Cogeneration of heat and power |
| CCHPO | Combined cooling, heating, power, and oxygen system |
| E | Energy (kWh) or (MWh) |
| F | Faraday’s constant (C/mol) |
| GHG | Greenhouse gases |
| HE | Heat exchanger |
| HSS | Hydrogen storage system |
| i | Current density (mA/cm2) |
| LCOE | Levelized cost of energy (EUR) |
| n | Molar flow rate (mol/s) |
| NPV | Net present value (kEUR) |
| OLR | Organic loading rate (kgCOD/(L d)) |
| p | Pressure (bar) |
| P | Power (kW) |
| PE | Primary energy (MWh) |
| PEM | Proton exchange membrane |
| PES | Primary energy saving (%) |
| PI | Profit index (%) |
| PV | Photovoltaic |
| R | Gas constant (J/mol K) |
| RES | Renewable energy system |
| rSOFC | Reversible solid oxide fuel cell |
| SMR | Steam methane reforming |
| SOEC | Solid oxide electrolyzer cell |
| SOFC | Solid oxide fuel cell |
| SPB | Simple pay back (years) |
| T | Temperature (°C) or (K) |
| V | Volume (m3) |
| Subscripts | |
| aux | Auxiliary |
| EE | Electric energy |
| fromGRID | Referred to electricity withdrawn from the electric grid |
| NG | Natural gas |
| toGRID | Referred to electricity exported to the electric grid |
| Greek symbols | |
| β | Compression factor |
| η | Efficiency (adim.) |
References
- Zhang, S.-C.; Yang, X.-Y.; Xu, W.; Fu, Y.-J. Contribution of nearly-zero energy buildings standards enforcement to achieve carbon neutral in urban area by 2060. Adv. Clim. Change Res. 2021, 12, 734–743. [Google Scholar] [CrossRef]
- Gaspard, A.; Chateau, L.; Laruelle, C.; Lafitte, B.; Léonardon, P.; Minier, Q.; Motamedi, K.; Ougier, L.; Pineau, A.; Thiriot, S. Introducing sufficiency in the building sector in net-zero scenarios for France. Energy Build. 2023, 278, 112590. [Google Scholar] [CrossRef]
- Wang, T.; Li, X.; Liao, P.-C.; Fang, D. Building energy efficiency for public hospitals and healthcare facilities in China: Barriers and drivers. Energy 2016, 103, 588–597. [Google Scholar] [CrossRef]
- CADDET; IEA; OECD. Saving Energy with Energy Efficiency in Hospitals; CADDET: Sittard, The Netherlands, 2005. [Google Scholar]
- García-Sanz-Calcedo, J.; Al-Kassir, A.; Yusaf, T. Economic and Environmental Impact of Energy Saving in Healthcare Buildings. Appl. Sci. 2018, 8, 440. [Google Scholar] [CrossRef]
- Mohd Daud, A.K.; Ahmad, E.Z.; Razak, T.R.; Jarimi, H. Expertise-based systematic guidelines for chiller retrofitting in healthcare facilities. J. Build. Eng. 2023, 74, 106708. [Google Scholar] [CrossRef]
- Shen, C.; Zhao, K.; Ge, J.; Zhou, Q. Analysis of Building Energy Consumption in a Hospital in the Hot Summer and Cold Winter Area. Energy Procedia 2019, 158, 3735–3740. [Google Scholar] [CrossRef]
- Chung, M.; Park, H.-C. Comparison of building energy demand for hotels, hospitals, and offices in Korea. Energy 2015, 92, 383–393. [Google Scholar] [CrossRef]
- Atienza-Márquez, A.; Domínguez Muñoz, F.; Fernández Hernández, F.; Cejudo López, J.M. Domestic hot water production system in a hospital: Energy audit and evaluation of measures to boost the solar contribution. Energy 2022, 261, 125275. [Google Scholar] [CrossRef]
- Balali, A.; Valipour, A. Prioritization of passive measures for energy optimization designing of sustainable hospitals and health centres. J. Build. Eng. 2021, 35, 101992. [Google Scholar] [CrossRef]
- Short, C.A.; Lomas, K.J.; Giridharan, R.; Fair, A.J. Building resilience to overheating into 1960’s UK hospital buildings within the constraint of the national carbon reduction target: Adaptive strategies. Build. Environ. 2012, 55, 73–95. [Google Scholar] [CrossRef]
- Kim, S.H.; Augenbroe, G. Decision support for choosing ventilation operation strategy in hospital isolation rooms: A multi-criterion assessment under uncertainty. Build. Environ. 2013, 60, 305–318. [Google Scholar] [CrossRef]
- As, M.; Bilir, T. Enhancing energy efficiency and cost-effectiveness while reducing CO2 emissions in a hospital building. J. Build. Eng. 2023, 78, 107792. [Google Scholar] [CrossRef]
- Koirala, B.; Hers, S.; Morales-España, G.; Özdemir, Ö.; Sijm, J.; Weeda, M. Integrated electricity, hydrogen and methane system modelling framework: Application to the Dutch Infrastructure Outlook 2050. Appl. Energy 2021, 289, 116713. [Google Scholar] [CrossRef]
- Cappiello, F.L.; Erhart, T.G. Modular cogeneration for hospitals: A novel control strategy and optimal design. Energy Convers. Manag. 2021, 237, 114131. [Google Scholar] [CrossRef]
- Biglia, A.; Caredda, F.V.; Fabrizio, E.; Filippi, M.; Mandas, N. Technical-economic feasibility of CHP systems in large hospitals through the Energy Hub method: The case of Cagliari AOB. Energy Build. 2017, 147, 101–112. [Google Scholar] [CrossRef]
- Isa, N.M.; Tan, C.W.; Yatim, A. A comprehensive review of cogeneration system in a microgrid: A perspective from architecture and operating system. Renew. Sustain. Energy Rev. 2018, 81, 2236–2263. [Google Scholar] [CrossRef]
- Evins, R.; Orehounig, K.; Dorer, V.; Carmeliet, J. New formulations of the ‘energy hub’model to address operational constraints. Energy 2014, 73, 387–398. [Google Scholar] [CrossRef]
- Calise, F.; Cappiello, F.L.; Cimmino, L.; Dentice d’Accadia, M.; Vicidomini, M. Dynamic Simulation and Thermoeconomic Analysis of a Hybrid Renewable System Based on PV and Fuel Cell Coupled with Hydrogen Storage. Energies 2021, 14, 7657. [Google Scholar] [CrossRef]
- Renedo, C.J.; Ortiz, A.; Mañana, M.; Silió, D.; Pérez, S. Study of different cogeneration alternatives for a Spanish hospital center. Energy Build. 2006, 38, 484–490. [Google Scholar] [CrossRef]
- Alexis, G.; Liakos, P. A case study of a cogeneration system for a hospital in Greece. Economic and environmental impacts. Appl. Therm. Eng. 2013, 54, 488–496. [Google Scholar] [CrossRef]
- Gimelli, A.; Muccillo, M. Optimization criteria for cogeneration systems: Multi-objective approach and application in an hospital facility. Appl. Energy 2013, 104, 910–923. [Google Scholar] [CrossRef]
- Ghoreishinejad, M.; Deymi-Dashtebayaz, M.; Norani, M. Proposal and multi-objective optimization of a CCHP system based on heat recovery from oxygen generator in hospitals: A case study. J. Clean. Prod. 2023, 421, 138549. [Google Scholar] [CrossRef]
- Chen, X.; Chen, Y.; Zhang, M.; Jiang, S.; Gou, H.; Pang, Z.; Shen, B. Hospital-oriented quad-generation (HOQG)—A combined cooling, heating, power and gas (CCHPG) system. Appl. Energy 2021, 300, 117382. [Google Scholar] [CrossRef]
- Calise, F.; Cappiello, F.L.; Dentice d’Accadia, M.; Libertini, L.; Vicidomini, M. Dynamic simulation and thermoeconomic analysis of a trigeneration system in a hospital application. Energies 2020, 13, 3558. [Google Scholar] [CrossRef]
- Izzeldin, M.; Muradoğlu, Y.G.; Pappas, V.; Petropoulou, A.; Sivaprasad, S. The impact of the Russian-Ukrainian war on global financial markets. Int. Rev. Financ. Anal. 2023, 87, 102598. [Google Scholar] [CrossRef]
- Lo, G.-D.; Marcelin, I.; Bassène, T.; Sène, B. The Russo-Ukrainian war and financial markets: The role of dependence on Russian commodities. Financ. Res. Lett. 2022, 50, 103194. [Google Scholar] [CrossRef]
- Szafranek, K.; Papież, M.; Rubaszek, M.; Śmiech, S. How immune is the connectedness of European natural gas markets to exceptional shocks? Resour. Policy 2023, 85, 103917. [Google Scholar] [CrossRef]
- Zhou, E.; Wang, X. Dynamics of systemic risk in European gas and oil markets under the Russia–Ukraine conflict: A quantile regression neural network approach. Energy Rep. 2023, 9, 3956–3966. [Google Scholar] [CrossRef]
- European Commission. REPowerEU. Available online: https://commission.europa.eu/strategy-and-policy/priorities-2019-2024/european-green-deal/repowereu-affordable-secure-and-sustainable-energy-europe_it (accessed on 15 May 2020).
- Lamioni, R.; Bronzoni, C.; Folli, M.; Tognotti, L.; Galletti, C. Impact of H2-enriched natural gas on pollutant emissions from domestic condensing boilers: Numerical simulations of the combustion chamber. Int. J. Hydrogen Energy 2023, 48, 19686–19699. [Google Scholar] [CrossRef]
- de Miranda, P.E.V. Hydrogen Energy: Sustainable and Perennial. In Science and Engineering of Hydrogen-Based Energy Technologies; Elsevier: Amsterdam, The Netherlands, 2019; pp. 1–38. [Google Scholar]
- Calise, F.; Cappiello, F.L.; Vicidomini, M. Chapter 9—Applications of Solar PV Systems in Hydrogen Production. In Photovoltaic Solar Energy Conversion; Gorjian, S., Shukla, A., Eds.; Academic Press: Cambridge, MA, USA, 2020; pp. 275–312. [Google Scholar] [CrossRef]
- Harichandan, S.; Kar, S.K.; Bansal, R.; Mishra, S.K. Achieving sustainable development goals through adoption of hydrogen fuel cell vehicles in India: An empirical analysis. Int. J. Hydrogen Energy 2023, 48, 4845–4859. [Google Scholar] [CrossRef]
- Ahmad, M.Z.; Ahmad, S.H.; Chen, R.S.; Ismail, A.F.; Hazan, R.; Baharuddin, N.A. Review on recent advancement in cathode material for lower and intermediate temperature solid oxide fuel cells application. Int. J. Hydrogen Energy 2022, 47, 1103–1120. [Google Scholar] [CrossRef]
- Mehr, A.; Lanzini, A.; Santarelli, M.; Rosen, M.A. Polygeneration systems based on high temperature fuel cell (MCFC and SOFC) technology: System design, fuel types, modeling and analysis approaches. Energy 2021, 228, 120613. [Google Scholar] [CrossRef]
- Peters, R.; Deja, R.; Engelbracht, M.; Frank, M.; Nguyen, V.N.; Blum, L.; Stolten, D. Efficiency analysis of a hydrogen-fueled solid oxide fuel cell system with anode off-gas recirculation. J. Power Sources 2016, 328, 105–113. [Google Scholar] [CrossRef]
- Calise, F.; Cappiello, F.L.; Cimmino, L.; Vicidomini, M. Dynamic simulation modelling of reversible solid oxide fuel cells for energy storage purpose. Energy 2022, 260, 124893. [Google Scholar] [CrossRef]
- Sun, L.; Wang, X.; Hua, Q.; Lee, K.Y. Energy scheduling of a fuel cell based residential cogeneration system using stochastic dynamic programming. Process Saf. Environ. Prot. 2023, 175, 272–279. [Google Scholar] [CrossRef]
- Bhogilla, S.; Pandoh, A.; Singh, U.R. Cogeneration system combining reversible PEM fuel cell, and metal hydride hydrogen storage enabling renewable energy storage: Thermodynamic performance assessment. Int. J. Hydrogen Energy 2024, 52, 1147–1155. [Google Scholar] [CrossRef]
- Tariq, A.H. Optimal sizing of photovoltaic/fuel cell-based energy system with autonomous oxygen production for hospitals in four climatic zones of Pakistan: An economic-energy-environmental feasibility analysis. Renew. Energy Focus 2023, 47, 100494. [Google Scholar] [CrossRef]
- Isa, N.M.; Das, H.S.; Tan, C.W.; Yatim, A.H.M.; Lau, K.Y. A techno-economic assessment of a combined heat and power photovoltaic/fuel cell/battery energy system in Malaysia hospital. Energy 2016, 112, 75–90. [Google Scholar] [CrossRef]
- Zhang, M.; Chen, X.; Chen, Y.; Jiang, S.; Shen, B. Combined cooling, heating, power and oxygen for hospital buildings employing photovoltaic power and liquefied methane. Energy Rep. 2022, 8, 815–821. [Google Scholar] [CrossRef]
- Sleiti, A.K.; Al-Ammari, W.A.; Arshad, R.; El Mekkawy, T. Energetic, economic, and environmental analysis of solid oxide fuel cell-based combined cooling, heating, and power system for cancer care hospital. Build. Simul. 2022, 15, 1437–1454. [Google Scholar] [CrossRef]
- Ghimire, R.; Niroula, S.; Pandey, B.; Subedi, A.; Thapa, B.S. Techno-economic assessment of fuel cell-based power backup system as an alternative to diesel generators in Nepal: A case study for hospital applications. Int. J. Hydrogen Energy 2024, 56, 289–301. [Google Scholar] [CrossRef]
- Calise, F.; Cappiello, F.L.; Cimmino, L.; Dentice d’Accadia, M.; Vicidomini, M. Renewable smart energy network: A thermoeconomic comparison between conventional lithium-ion batteries and reversible solid oxide fuel cells. Renew. Energy 2023, 214, 74–95. [Google Scholar] [CrossRef]
- Buonomano, A.; Palombo, A. Building energy performance analysis by an in-house developed dynamic simulation code: An investigation for different case studies. Appl. Energy 2014, 113, 788–807. [Google Scholar] [CrossRef]
- Buonomano, A.; Calise, F.; Ferruzzi, G. Thermoeconomic analysis of storage systems for solar heating and cooling systems: A comparison between variable-volume and fixed-volume tanks. Energy 2013, 59, 600–616. [Google Scholar] [CrossRef]
- Cui, Z.; Kang, L.; Li, L.; Wang, L.; Wang, K. A hybrid neural network model with improved input for state of charge estimation of lithium-ion battery at low temperatures. Renew. Energy 2022, 198, 1328–1340. [Google Scholar] [CrossRef]
- Rashad, M.; Żabnieńska-Góra, A.; Norman, L.; Jouhara, H. Analysis of energy demand in a residential building using TRNSYS. Energy 2022, 254, 124357. [Google Scholar] [CrossRef]
- Sornek, K.; Wiercioch, J.; Kurczyna, D.; Figaj, R.; Wójcik, B.; Borowicz, M.; Wieliński, M. Development of a solar-powered small autonomous surface vehicle for environmental measurements. Energy Convers. Manag. 2022, 267, 115953. [Google Scholar] [CrossRef]
- Calise, F.; Cappiello, F.L.; Dentice d’Accadia, M.; Petrakopoulou, F.; Vicidomini, M. A solar-driven 5th generation district heating and cooling network with ground-source heat pumps: A thermo-economic analysis. Sustain. Cities Soc. 2022, 76, 103438. [Google Scholar] [CrossRef]
- Calise, F.; Cappiello, F.L.; Dentice d’Accadia, M.; Vicidomini, M. A novel smart energy network paradigm integrating combined heat and power, photovoltaic and electric vehicles. Energy Convers. Manag. 2022, 260, 115599. [Google Scholar] [CrossRef]
- Karacavus, B.; Aydın, K. Hydrogen production and storage analysis of a system by using TRNSYS. Int. J. Hydrogen Energy 2020, 45, 34608–34619. [Google Scholar] [CrossRef]
- Jani, D.B. Chapter 4—Performance Assessment of Solar Powered Hybrid Solid Desiccant and Dehumidification Integrated Thermally Cooling System Using TRNSYS. In Advances in Clean Energy Technologies; Azad, A.K., Ed.; Academic Press: Cambridge, MA, USA, 2021; pp. 171–203. [Google Scholar] [CrossRef]
- Ma, Y.; Xi, J.; Cai, J.; Gu, Z. TRNSYS simulation study of the operational energy characteristics of a hot water supply system for the integrated design of solar coupled air source heat pumps. Chemosphere 2023, 338, 139453. [Google Scholar] [CrossRef] [PubMed]
- Buonomano, A.; Calise, F.; Ferruzzi, G.; Palombo, A. Dynamic energy performance analysis: Case study for energy efficiency retrofits of hospital buildings. Energy 2014, 78, 555–572. [Google Scholar] [CrossRef]
- Voit, P.; Lechner, T.; Schuler, M. Common EC validation procedure for dynamic building simulation programs–application with TRNSYS. In Proceedings of the Conference of International Simulation Societies, Zurich, Switzerland, 22–25 August 1994. [Google Scholar]
- Guercio, A.; Curto, D.; Franzitta, V.; Frascati, M.; Milone, D.; Martorana, P.; Mantegna, M. Energy Analyses and Optimization Proposals for Hotels in Sicily: A Case Study. Sustainability 2024, 16, 146. [Google Scholar] [CrossRef]
- Palaić, D.; Štajduhar, I.; Ljubic, S.; Wolf, I. Development, Calibration, and Validation of a Simulation Model for Indoor Temperature Prediction and HVAC System Fault Detection. Buildings 2023, 13, 1388. [Google Scholar] [CrossRef]
- Rezaei, E.; Dzuryk, S. Techno-economic comparison of reverse water gas shift reaction to steam and dry methane reforming reactions for syngas production. Chem. Eng. Res. Des. 2019, 144, 354–369. [Google Scholar] [CrossRef]
- Kumar, R.; Kumar, A.; Pal, A. Simulation modelling of hydrogen production from steam reforming of methane and biogas. Fuel 2024, 362, 130742. [Google Scholar] [CrossRef]
- Perry, R.H.; Green, D.W.; Maloney, J.O. (Eds.) Perry’s Chemical Engineers’ Handbook, 6th ed.; McGraw-Hill: New York, NY, USA, 1984. [Google Scholar]
- Maggio, G.; Squadrito, G.; Nicita, A. Hydrogen and medical oxygen by renewable energy based electrolysis: A green and economically viable route. Appl. Energy 2022, 306, 117993. [Google Scholar] [CrossRef]
- Nicita, A.; Maggio, G.; Andaloro, A.P.F.; Squadrito, G. Green hydrogen as feedstock: Financial analysis of a photovoltaic-powered electrolysis plant. Int. J. Hydrogen Energy 2020, 45, 11395–11408. [Google Scholar] [CrossRef]
- Koumi Ngoh, S.; Bakehe, J.F.; Edouma Fils, P. Green electricity and medical electrolytic oxygen from solar energy—A sustainable solution for rural hospitals. Sci. Afr. 2022, 17, e01389. [Google Scholar] [CrossRef]
- Squadrito, G.; Nicita, A.; Maggio, G. A size-dependent financial evaluation of green hydrogen-oxygen co-production. Renew. Energy 2021, 163, 2165–2177. [Google Scholar] [CrossRef]
- Katebah, M.; Al-Rawashdeh, M.m.; Linke, P. Analysis of hydrogen production costs in Steam-Methane Reforming considering integration with electrolysis and CO2 capture. Clean. Eng. Technol. 2022, 10, 100552. [Google Scholar] [CrossRef]
- Böhm, H.; Zauner, A.; Rosenfeld, D.C.; Tichler, R. Projecting cost development for future large-scale power-to-gas implementations by scaling effects. Appl. Energy 2020, 264, 114780. [Google Scholar] [CrossRef]
- Carr, S.; Premier, G.C.; Guwy, A.J.; Dinsdale, R.M.; Maddy, J. Hydrogen storage and demand to increase wind power onto electricity distribution networks. Int. J. Hydrogen Energy 2014, 39, 10195–10207. [Google Scholar] [CrossRef]
- Luyben, W.L. Capital cost of compressors for conceptual design. Chem. Eng. Process.-Process Intensif. 2018, 126, 206–209. [Google Scholar] [CrossRef]
- Calise, F.; Cappiello, F.L.; Dentice d’Accadia, M.; Vicidomini, M. Smart grid energy district based on the integration of electric vehicles and combined heat and power generation. Energy Convers. Manag. 2021, 234, 113932. [Google Scholar] [CrossRef]
- Calise, F.; Dentice d’Accadia, M.; Piacentino, A. A novel solar trigeneration system integrating PVT (photovoltaic/thermal collectors) and SW (seawater) desalination: Dynamic simulation and economic assessment. Energy 2014, 67, 129–148. [Google Scholar] [CrossRef]
- Musharavati, F.; Khanmohammadi, S. Performance improvement of a heat recovery system combined with fuel cell and thermoelectric generator: 4E analysis. Int. J. Hydrogen Energy 2021, 47, 26701–26714. [Google Scholar] [CrossRef]
- Nadir, M.; Ghenaiet, A.; Carcasci, C. Thermo-economic optimization of heat recovery steam generator for a range of gas turbine exhaust temperatures. Appl. Therm. Eng. 2016, 106, 811–826. [Google Scholar] [CrossRef]
- Zhai, H.; Rubin, E.S. Performance and cost of wet and dry cooling systems for pulverized coal power plants with and without carbon capture and storage. Energy Policy 2010, 38, 5653–5660. [Google Scholar] [CrossRef]
- Available online: https://eshop.czechminibreweries.com/ (accessed on 15 May 2020).
- Jenbacher-Werke. 2019. Available online: https://www.innio.com/en/products/jenbacher (accessed on 15 May 2020).
- Kupecki, J.; Motylinski, K.; Jagielski, S.; Wierzbicki, M.; Brouwer, J.; Naumovich, Y.; Skrzypkiewicz, M. Energy analysis of a 10 kW-class power-to-gas system based on a solid oxide electrolyzer (SOE). Energy Convers. Manag. 2019, 199, 111934. [Google Scholar] [CrossRef]
- Sanz-Bermejo, J.; Muñoz-Antón, J.; Gonzalez-Aguilar, J.; Romero, M. Part load operation of a solid oxide electrolysis system for integration with renewable energy sources. Int. J. Hydrogen Energy 2015, 40, 8291–8303. [Google Scholar] [CrossRef]
- Stempien, J.P.; Sun, Q.; Chan, S.H. Solid Oxide Electrolyzer Cell Modeling: A Review. J. Power Technol. 2013, 93, 216–246. [Google Scholar]


| Parameter | Description | Value | Unit |
|---|---|---|---|
| jel,fromGRID | Electricity purchasing cost | 0.23 | EUR/kWh |
| jel,toGRID | Electricity energy exporting cost | 0.06 | EUR/kWh |
| jNG | Natural gas purchasing price | 1.30 | EUR/Sm3 |
| jO2 | Oxygen purchasing price | 2.00 [64,65,66,67] | EUR/kg |
| LHVH2 | Hydrogen lower heating value | 3.00 | kWh/Sm3 |
| 120.00 | MJ/kg | ||
| LHVCH4 | Natural gas lower heating value | 9.59 | kWh/Sm3 |
| JPV | PV cost | 1000 [15] | EUR/kW |
| JREF | External steam methane reformer capital cost | 259.0 [68] | M EUR/MWNG |
| JSOCF | r-SOFC cost | 3000 [69] | EUR/kW |
| JTK-H2 | Hydrogen tank cost | 500 [70] | EUR/kg |
| Ic | Compressor capital cost | [71] | EUR/compr |
| IHE | Heat exchanger capital cost | [72] | EUR/HE |
| ITK-SW | Superheated water capital cost | [73] | EUR |
| JHRSG | Heat recovery steam generator | 0.368 [74,75] | M EUR/HRSG |
| JdryC | Dry cooler specific cost | 200 [76] | EUR/kW |
| JA-SH | Auxiliary steam heater specific cost | 125 [77] | EUR/kW |
| ηel | Conventional thermo-electric power plant efficiency | 46 | % |
| ηB | Boiler efficiency | 75 | % |
| ηSG | Steam generator efficiency | 98 | % |
| ηA-SH | Steam heater efficiency | 98 | % |
| ηinv | District inverter efficiency | 95 | % |
| Component | Parameter | Description | Value | Unit |
|---|---|---|---|---|
| CBH | Pth,CBH | Rated capacity of CBH | 6.20 | MWth |
| Tset,CB | Set point temperature for CBH | 80 | °C | |
| ηCBDHW | CBH efficiency | 86 | % | |
| CBSHW | Pth,CBSHW | Rated CB for SHW thermal flow rate | 0.70 | MWth |
| Tset,CBSHW | Set point temperature for CBSHW | 80 | °C | |
| ηCBDHW | CBSHW efficiecy | 0.86 | % | |
| SG | Pth,SG | Rated capacity steam generator | 6880 | |
| ηSG | SG efficiency | 90 | % | |
| Cogenerator [78] | - | Model Name | JMS-612-GS-N.L. | |
| - | Manufacturer | GE Jenbacher GmbH & Co OHG (Austria) | ||
| Pth,CHP | Rated thermal capacity | 1.90 | MW | |
| Pel,CHP | Rated electrical capacity | 2.00 | ||
| Pth,input | Rated fuel input | 4.42 | ||
| ηel | Rated electrical efficiency | 45.2 | % | |
| ηth | Rated thermal efficiency | 43.0 | ||
| η | Global rated efficiency | 88.3 | ||
| ACH | Prated | Rated cooling capacity | 0.77 | MWth |
| COP | Rated coefficient of performance | 0.75 | - | |
| CH | Pth,CH | Rated cooling capacity | 9.00 | MWth |
| COP | Rated coefficient of performance | 5.95 | - | |
| CT | Pth,CT | Rated thermal capacity of CT | 1.79 | MWth |
| Nf,CT | Number of fans of CT | 2 | - | |
| Pel,fan,CT | Fan power of CT | 15 | kW | |
| PV | ηPV | Module efficiency | 0.20 | - |
| Prated,PV | PV panel rated power | 6.00 | MW | |
| Atot | PV field area | 30,000 | m2 | |
| r-SOFC | Presscell | Cell operative pressure | 1 | |
| NSOFC,cell | Number of cells in series | 8 | ||
| NSOFC,par | Number of stacks in parallel | 4166 | ||
| Pel,SOFC | Rated fuel cell/electrolyzer capacity | 2.00 | MW | |
| Reformer | PressRef | Reformer operative pressure | 1 | bar |
| Trated | Rated fuel feeding temperature | 450 | °C | |
| Φ | Rated enthalpy flow of fuel | 3.63 | MW | |
| Tank TK-H2 | VTK-H2 | Tank Volume | 28 | m3 |
| PressTK-H2 | Max tank pressure | 200 | bar | |
| Compressor C-H2 | ηcompressor | Compressor isentropic efficiency | 80 | % |
| Nstages | Number of stages | 4 | - | |
| β | Compression ratio | 3.75 | - | |
| Press | Rated pressure | 200 | bar | |
| Compressor C-O2 | ηcompressor | Compressor isentropic efficiency | 80 | % |
| Nstages | Number of stages | 4 | - | |
| β | Compression ratio | 3.65 | - | |
| Press | Rated pressure | 150 | bar | |
| Parameter | Value | Unit |
|---|---|---|
| Eth,heat | 7.33 | GWhth/y |
| Eth,SG | 8.61 | GWhth/y |
| Eth,SHW | 0.47 | GWhth/y |
| Eth,cool | 9.71 | GWhth/y |
| Eel,LOAD | 16.36 | GWhel/y |
| PE | 46.41 | GWh/y |
| C | 6.21 | M EUR/y |
| CO2 | 8388 | tCO2/y |
| Parameter | Unit | RS | PS |
|---|---|---|---|
| PECHP | GWh/year | 35.62 | 17.46 |
| Eel,load | GWh/year | 16.89 | 18.26 |
| Eel,CHP | GWh/year | 15.03 | - |
| Eel,PV | GWh/year | - | 10.20 |
| Eel,SOEC | GWh/year | - | 2.08 |
| Eel,SOFC(H2) | GWh/year | - | 0.98 |
| Eel,SOFC(CH4) | GWh/year | - | 8.58 |
| Eel,fromGRID | GWh/year | 1.85 | 1.06 |
| Eel,toGRID | GWh/year | 0.00 | 0.48 |
| Eel,self | GWh/year | 15.03 | 17.19 |
| Eth,B | GWh/year | 2.60 | 3.77 |
| Eth,SG | GWh/year | 3.39 | 8.61 |
| Eth,CHP2Steam | GWh/year | 5.22 | 0.00 |
| Eth,CHP2M-HE | GWh/year | 7.30 | 5.01 |
| Eth,SOFC(H2)2M-HE | GWh/year | - | 4.29 |
| Eth,SOFC(CH4)2M-HE | GWh/year | - | 0.72 |
| Eth,M-HE2ACH | GWh/year | 2.96 | 1.05 |
| Eth,ACH | GWh/year | 2.10 | 0.78 |
| Eth,CH | GWh/year | 9.48 | 10.49 |
| Eel,CH | GWh/year | 1.57 | 1.71 |
| PEtot | GWh/year | 46.41 | 30.74 |
| ΔPE | GWh/year | - | 15.67 |
| PES | % | - | 29.64 |
| Rrenew | % | - | 27.33 |
| VNG,CHP | Sm3/year | 3.71 × 10⁶ | |
| VNG,SOFC | Sm3/year | 1.82 × 10⁶ | |
| VNG,aux | Sm3/year | 0.71 × 10⁶ | 1.45 × 10⁶ |
| VNG | Sm3/year | 4.42 × 10⁶ | 3.27 × 10⁶ |
| ΔMx | t/year | - | 2561.57 |
| ΔMx | % | - | 30.53 |
| ΔC | M EUR/year | - | 2.72 |
| C | M EUR | - | 12.84 |
| SPB | years | - | 4.71 |
| PI | - | 0.69 | |
| NPV | M EUR/year | - | 8.71 |
Disclaimer/Publisher’s Note: The statements, opinions and data contained in all publications are solely those of the individual author(s) and contributor(s) and not of MDPI and/or the editor(s). MDPI and/or the editor(s) disclaim responsibility for any injury to people or property resulting from any ideas, methods, instructions or products referred to in the content. |
© 2024 by the authors. Licensee MDPI, Basel, Switzerland. This article is an open access article distributed under the terms and conditions of the Creative Commons Attribution (CC BY) license (https://creativecommons.org/licenses/by/4.0/).
Share and Cite
Calise, F.; Cappiello, F.L.; Cimmino, L.; Dentice d’Accadia, M.; Vicidomini, M. A Novel Layout for Combined Heat and Power Production for a Hospital Based on a Solid Oxide Fuel Cell. Energies 2024, 17, 979. https://0-doi-org.brum.beds.ac.uk/10.3390/en17050979
Calise F, Cappiello FL, Cimmino L, Dentice d’Accadia M, Vicidomini M. A Novel Layout for Combined Heat and Power Production for a Hospital Based on a Solid Oxide Fuel Cell. Energies. 2024; 17(5):979. https://0-doi-org.brum.beds.ac.uk/10.3390/en17050979
Chicago/Turabian StyleCalise, Francesco, Francesco Liberato Cappiello, Luca Cimmino, Massimo Dentice d’Accadia, and Maria Vicidomini. 2024. "A Novel Layout for Combined Heat and Power Production for a Hospital Based on a Solid Oxide Fuel Cell" Energies 17, no. 5: 979. https://0-doi-org.brum.beds.ac.uk/10.3390/en17050979