Article

Analysis of the Economic Soundness and Viability of Migrating from Net Billing to Net Metering Using Energy Cooperatives

by
Jakub Jasiński
1,*,
Mariusz Kozakiewicz
2 and
Maciej Sołtysik
3
1
Institute of Rural and Agricultural Development, Polish Academy of Sciences, 72 Nowy Świat St., 00-330 Warsaw, Poland
2
Collegium of Economic Analysis, Warsaw School of Economics, Madalińskiego 6/8 St., 02-513 Warsaw, Poland
3
Faculty of Electrical Engineering, Częstochowa University of Technology, Armii Krajowej St. 17, 42-200 Częstochowa, Poland
*
Author to whom correspondence should be addressed.
Submission received: 5 February 2024 / Revised: 5 March 2024 / Accepted: 7 March 2024 / Published: 10 March 2024
(This article belongs to the Special Issue Energy Sources from Agriculture and Rural Areas II)

Abstract

:
In the European Union, increasing attention is already being paid not only to the development of renewable energy sources, but also to the establishment of solutions to achieve local energy self-sufficiency while increasing the role of citizens in managing the energy they generate. This approach is expected both to have a positive impact on the environment and the reduction of greenhouse gas emissions, and to enhance energy security—both in economic and civic terms by, i.a., combating energy poverty. The development of local energy communities promoted in the EU is supported i.a. by energy cooperatives. These contribute to the efficient harnessing of renewable energy potential in rural and urban-rural areas, and have been developing in Poland for several years now. In their previous studies, the authors of this research paper attempted to verify the generation (number, type and capacity of installed sources) and consumption (energy demand) configurations in which an energy cooperative would be a viable solution for prosumers who might establish it. However, over the past few years, the conditions for prosumers and the method of their accounting with the electricity seller have changed radically in Poland (shift from net metering to net billing). This situation has opened up space for further research and encouraged the authors to revisit the problem of analyzing the viability of establishing energy cooperatives in relation to the rules of operation of individual prosumers. This research was carried out for three scenarios, and the horizon of the analyses conducted and described extends to 2045. The comparative analysis included energy consumers without their own generation sources, prosumers with a photovoltaic generation installation covered by the net billing model, as well as a scenario involving prosumers’ cooperation within an energy cooperative, which by law is settled in the net metering model. Conclusions from the research and simulations made it possible to confirm the claim that, despite changes in the rules of prosumer billing, developing energy independence in the energy community formula results in a significant reduction in the cost of purchasing electricity (even several times lower purchase costs in the timeframe analyzed) and can lead to a reduction in the payback time of investments in generation sources even by a factor of two. The results presented in this research paper open up space for further research. The outcomes allow us to assume that energy cooperatives—in the organizational and institutional model in Poland—are a good tool for reducing the phenomenon of energy poverty on a local scale.

1. Introduction

The involvement of European Union citizens in changes in the energy sector is necessary for Community countries to achieve CO2 emission reduction targets by 2030. The increasing development of institutionalized forms of energy communities [1,2,3] is aimed at supporting citizens and local communities in investing in renewable energy sources [4,5]. The development of local energy communities promoted in the EU is supported i.a. by energy cooperatives [6] as analyzed in this paper, which are developing in many EU countries [7,8], including Poland [9] (other legally regulated forms of energy communities in Poland are: collective prosumers, energy clusters, civic energy communities) [10]. Energy cooperatives are aimed at generating electricity, biogas, biomethane or thermal energy from renewable energy sources for their members. The primary task of such institutions that can be established in rural areas [11] is to meet the needs of the community and to achieve the highest possible level of its energy self-sufficiency. It is the intention of the authors of legal and regulatory solutions that energy cooperatives become a tool to also promote energy autonomy for low-income people through the joint generation of energy using RES installations, which consequently contributes to the reduction in energy poverty by lowering bills (savings) [12]. An additional objective is to increase protection of the local environment and, from a global perspective, reduce greenhouse gases [13].
However, a prerequisite for the development of energy cooperatives is that it is profitable for prosumers to set up cooperatives or join existing ones [14,15]. In their previous studies, the authors of this article attempted to verify the generation (number, type and capacity of installed sources) and consumption (energy demand) configurations in which an energy cooperative would be a viable solution for potential cooperative members. These studies assumed that individual prosumers (potential cooperative members) use a net metering system with a discount ratio of 1:0.8 or 1:0.7 (depending on the installed capacity of the sources) [10], while energy cooperatives operate at a discount ratio of 1:0.6 [11]. The net metering mechanism itself has already been described in detail and the next chapter of this research paper is dedicated to this issue.
However, over the past few years, the conditions for prosumers and the method of their accounting with the network operator have changed radically in Poland [16,17]. This situation has opened up space for further research and encouraged the authors to revisit the problem of analyzing the viability of establishing energy cooperatives in relation to the preferences and rules of operation of individual prosumers (potential cooperative members). Various prosumer billing models were also the focus of research in the past. The analyses and studies of 2018–2021 mainly dealt with the resilience of prosumer support programs, and additionally considered the effect of the COVID-19 pandemic causing huge anomalies in energy demand [18]. The key changes to prosumer billing rules relate to the shift from net metering to net billing [19,20,21], which involves “reselling” surplus energy injected into the grid at market prices [22]. The value of the energy sold reduces the prosumer’s energy bill in the following month, while the cost of distribution is always charged in full and is not deductible. The new prosumer billing rules, as well as the assumptions for scenarios for the migration of prosumers from net billing to an energy cooperative, are presented in detail in Section 2 of this research paper. The migration scenarios themselves and related analyses are presented in Section 3.
Moreover, it must be noted that in 2023 some of the requirements and rules of operation of energy cooperatives themselves also changed as follows [10,23].
  • The limitation on the size of a single cooperative of up to 1000 members has been lifted,
  • members can now also produce biomethane,
  • a rule was introduced, effective until the end of 2025, lowering the requirement to cover the cooperative’s consumption demand from its own RES from 70% to 40%; from 2026 onward, 70% coverage will be required again.
While these changes are not central to the analysis and research described in this article, they may have a positive impact on the number of newly established energy cooperatives. The changes implemented promote the development of such forms of energy associations and demonstrate their importance from the perspective of the strategic goals of the state and the legislator. This in turn makes the authors’ work and research topic even more meaningful, and justifies the need to continuously update knowledge on civic energy development opportunities.
All model types of cooperatives proposed in this paper and researched, and likewise data concerning energy production and consumption in households that are potential members of cooperatives, are anonymized real data from rural areas in Poland.

2. Background: Description of the Net Metering System in Poland

Although the transformation of the power sector in Poland is taking place at different levels and within different market segments [24,25,26], the authors claim that the reconstruction of the system at the local and regional level, implemented through various forms of energy communities, is of particular significance [27,28,29]. In Poland, until 31 March 2022, there was a support mechanism in place in which surplus energy not used in the self-consumption of energy generated in a prosumer renewable energy source was injected into the grid of the local distribution network operator. During periods of deficit in the production of electricity from one’s own source (e.g., night, winter), the prosumer could draw electricity from the grid at no cost, i.e., skipping the electricity and distribution fee, within the limit resulting from the previously produced electricity injected into the grid minus the so-called discount factor. Depending on the installed capacity of the micro-installation, this factor was 0.7 or 0.8. The exception was the billing formula for the energy cooperative, which used to be and still is covered by a mechanism with a factor of 0.6. Thus, the equivalent of 40% of the energy injected into the distribution network is used to cover the costs of supplying energy to the cooperative’s members by the energy seller and distributor. Thanks to its wide range of benefits, the net metering support mechanism has resulted in the dynamic emergence of micro-installations contributing to a significant local destabilization of power system operation [21,30]. In order to reduce and ultimately curb the uncontrolled growth of micro-installations, which are also combined with heat pumps [22], the legislator changed the billing model for individual prosumers, while maintaining the billing model for energy cooperatives as a stimulus for the development of this form of community.
In its underlying assumptions, the settlement model in effect as of 1 April 2022 was intended as a mechanism to offer prosumers the benefits of becoming market participants and reselling surplus energy produced at market prices. During the transition period, this model, referred to as “net billing”, assumed billing for the energy injected at the monthly average real price of energy (RPE) calculated and published by the Transmission System Operator [31]. After the transition period, energy is to be settled at hourly prices [32], with the implementation of the Central Energy Market Information System (CSIRE), a kind of metering database, as the moment preceding the switch to the other billing mechanism. This repository will aggregate all metering and billing data of energy consumers, prosumers and generators, allowing the individualized billing of energy flows and consumption in near real time. The net billing model assumes that the surplus energy resold each time turns into revenue, which is accumulated in the prosumer’s virtual portfolio [10]. The capital accumulated there is used to reduce the prosumer’s liability to the sales company for the sale of electricity in subsequent settlement periods. In other words, the prosumer’s liability towards the seller concerning only the sale of energy is reduced in the next settlement period (month) by the revenue from the resale of surpluses at market prices. At the same time, it should be emphasized that in each case the cost of the distribution of energy drawn from the operator’s grid is borne by the prosumer. Moreover, it should be noted that the prosumer billed under that mechanism is exposed to the risk of negative prices in the wholesale market. A situation in which, in a given hour, the prosumer’s injection of surplus energy into the operator’s grid coincides with the occurrence of a negative price, will result in a loss on the prosumer’s portfolio—for example, negative prices occurred in Poland for several hours on 15 October 2023 (negative prices occurred not only on the balancing market, but also on the spot market of the Polish Power Exchange—both in Fixing I and II) [33]. The legislator provided for the possibility of such situations and in fact secured the prosumer at the level of statutory provisions with the possibility of non-mandatory fitting of their micro-installation with a device that shuts down the operation of the generation source in the situation of expected negative prices. As a rule, the surplus resale is settled by the net billing prosumer on a non-cash basis. The only exception will occur when the market equivalent of the surplus energy sold during the settlement period “n” is not offset by the cost of purchasing energy for the following 12 months. In such a situation, the prosumer will receive in cash 20% of the value of the virtual portfolio corresponding to the settlement period “n”—the equivalent of the remaining part of the resold surplus of unused energy remains at the disposal of the energy sales company.
The scenarios for the migration of prosumers to an energy cooperative were therefore settled on a net billing basis, which became the subject of analyses. The following assumptions were made for the scenario analysis.
  • Data reflecting the actual consumption and generation of consumers and prosumers forming the energy cooperatives described in the article “Determinants of Energy Cooperatives’ Development in Rural Areas—Evidence from Poland” [14] was used for modeling. This approach makes it possible to continue the research of the authors’ team to obtain a complementary spectrum of results that includes new solutions of citizens’ associations operating in market practice.
  • Due to the implementation practice of civic energy development and the most common solutions based on photovoltaic energy sources, the discussion and supply analysis were limited to this type of generation sources.
  • The horizon of the analysis extends to 2045, based on the effective lifespan of the generation technology used, which guarantees a generation efficiency of approx. 80% within 20–25 years of installation. Two scenarios were considered in the analyses. The first assumes a theoretical zero-efficiency loss of photovoltaic modules as a function of time, and the second assumes an efficiency loss of 0.5% per year—which is confirmed by the technical parameters declared by photovoltaic-panel manufacturers [34,35,36,37,38].
  • Selling prices of surplus energy in the wholesale market for the net billing model are the result of a separate modeling process based on fundamental analysis. Price path projections are built on the basis of the bottom-up model [39] mapping the generation structure on a daily hourly basis for each hour of each day of each year in the period analyzed. For each hour, a generation stack is constructed to complete the projected level of power and energy demand. The generation stack reflects all available generation and reduction capacities and cross-border exchanges, and is constructed taking into account the merit order. The construction of the stack therefore reflects the expected actual short-run marginal cost—the level of variable power generation costs for each of the generation technologies in the stack. The generation stack takes into account the existing, planned and constructed coal, gas, RES and nuclear units. It also takes into account generation sources not directly coordinated by the Transmission System Operator (Non-Centrally Dispatched Generating Units), including industrial power and CHP plants, as well as biomass, biogas, RDF sources and the use of demand-side response (DSR). A so-called “uplift” is applied to the mapped generation structure and SRMC (short-run marginal costs)—mapping the historical relationship of the impact of daily hourly power surpluses and deficits on the spot price level on the basis of mathematical models. Taking into account calendar variability, the superposition of both these elements reflects the level of expected prices on an average annual basis and makes it possible to obtain prices and daily hourly profiles for the entire period analyzed, which are presented in Figure 1.
Figure 1. Average forecasted daily electricity prices in the wholesale market in the outlook until 2045.
Energies 17 01330 g001
  • Based on long-term forecasts, it is assumed that the prosumer installation is turned off during the hours of expected negative market prices.
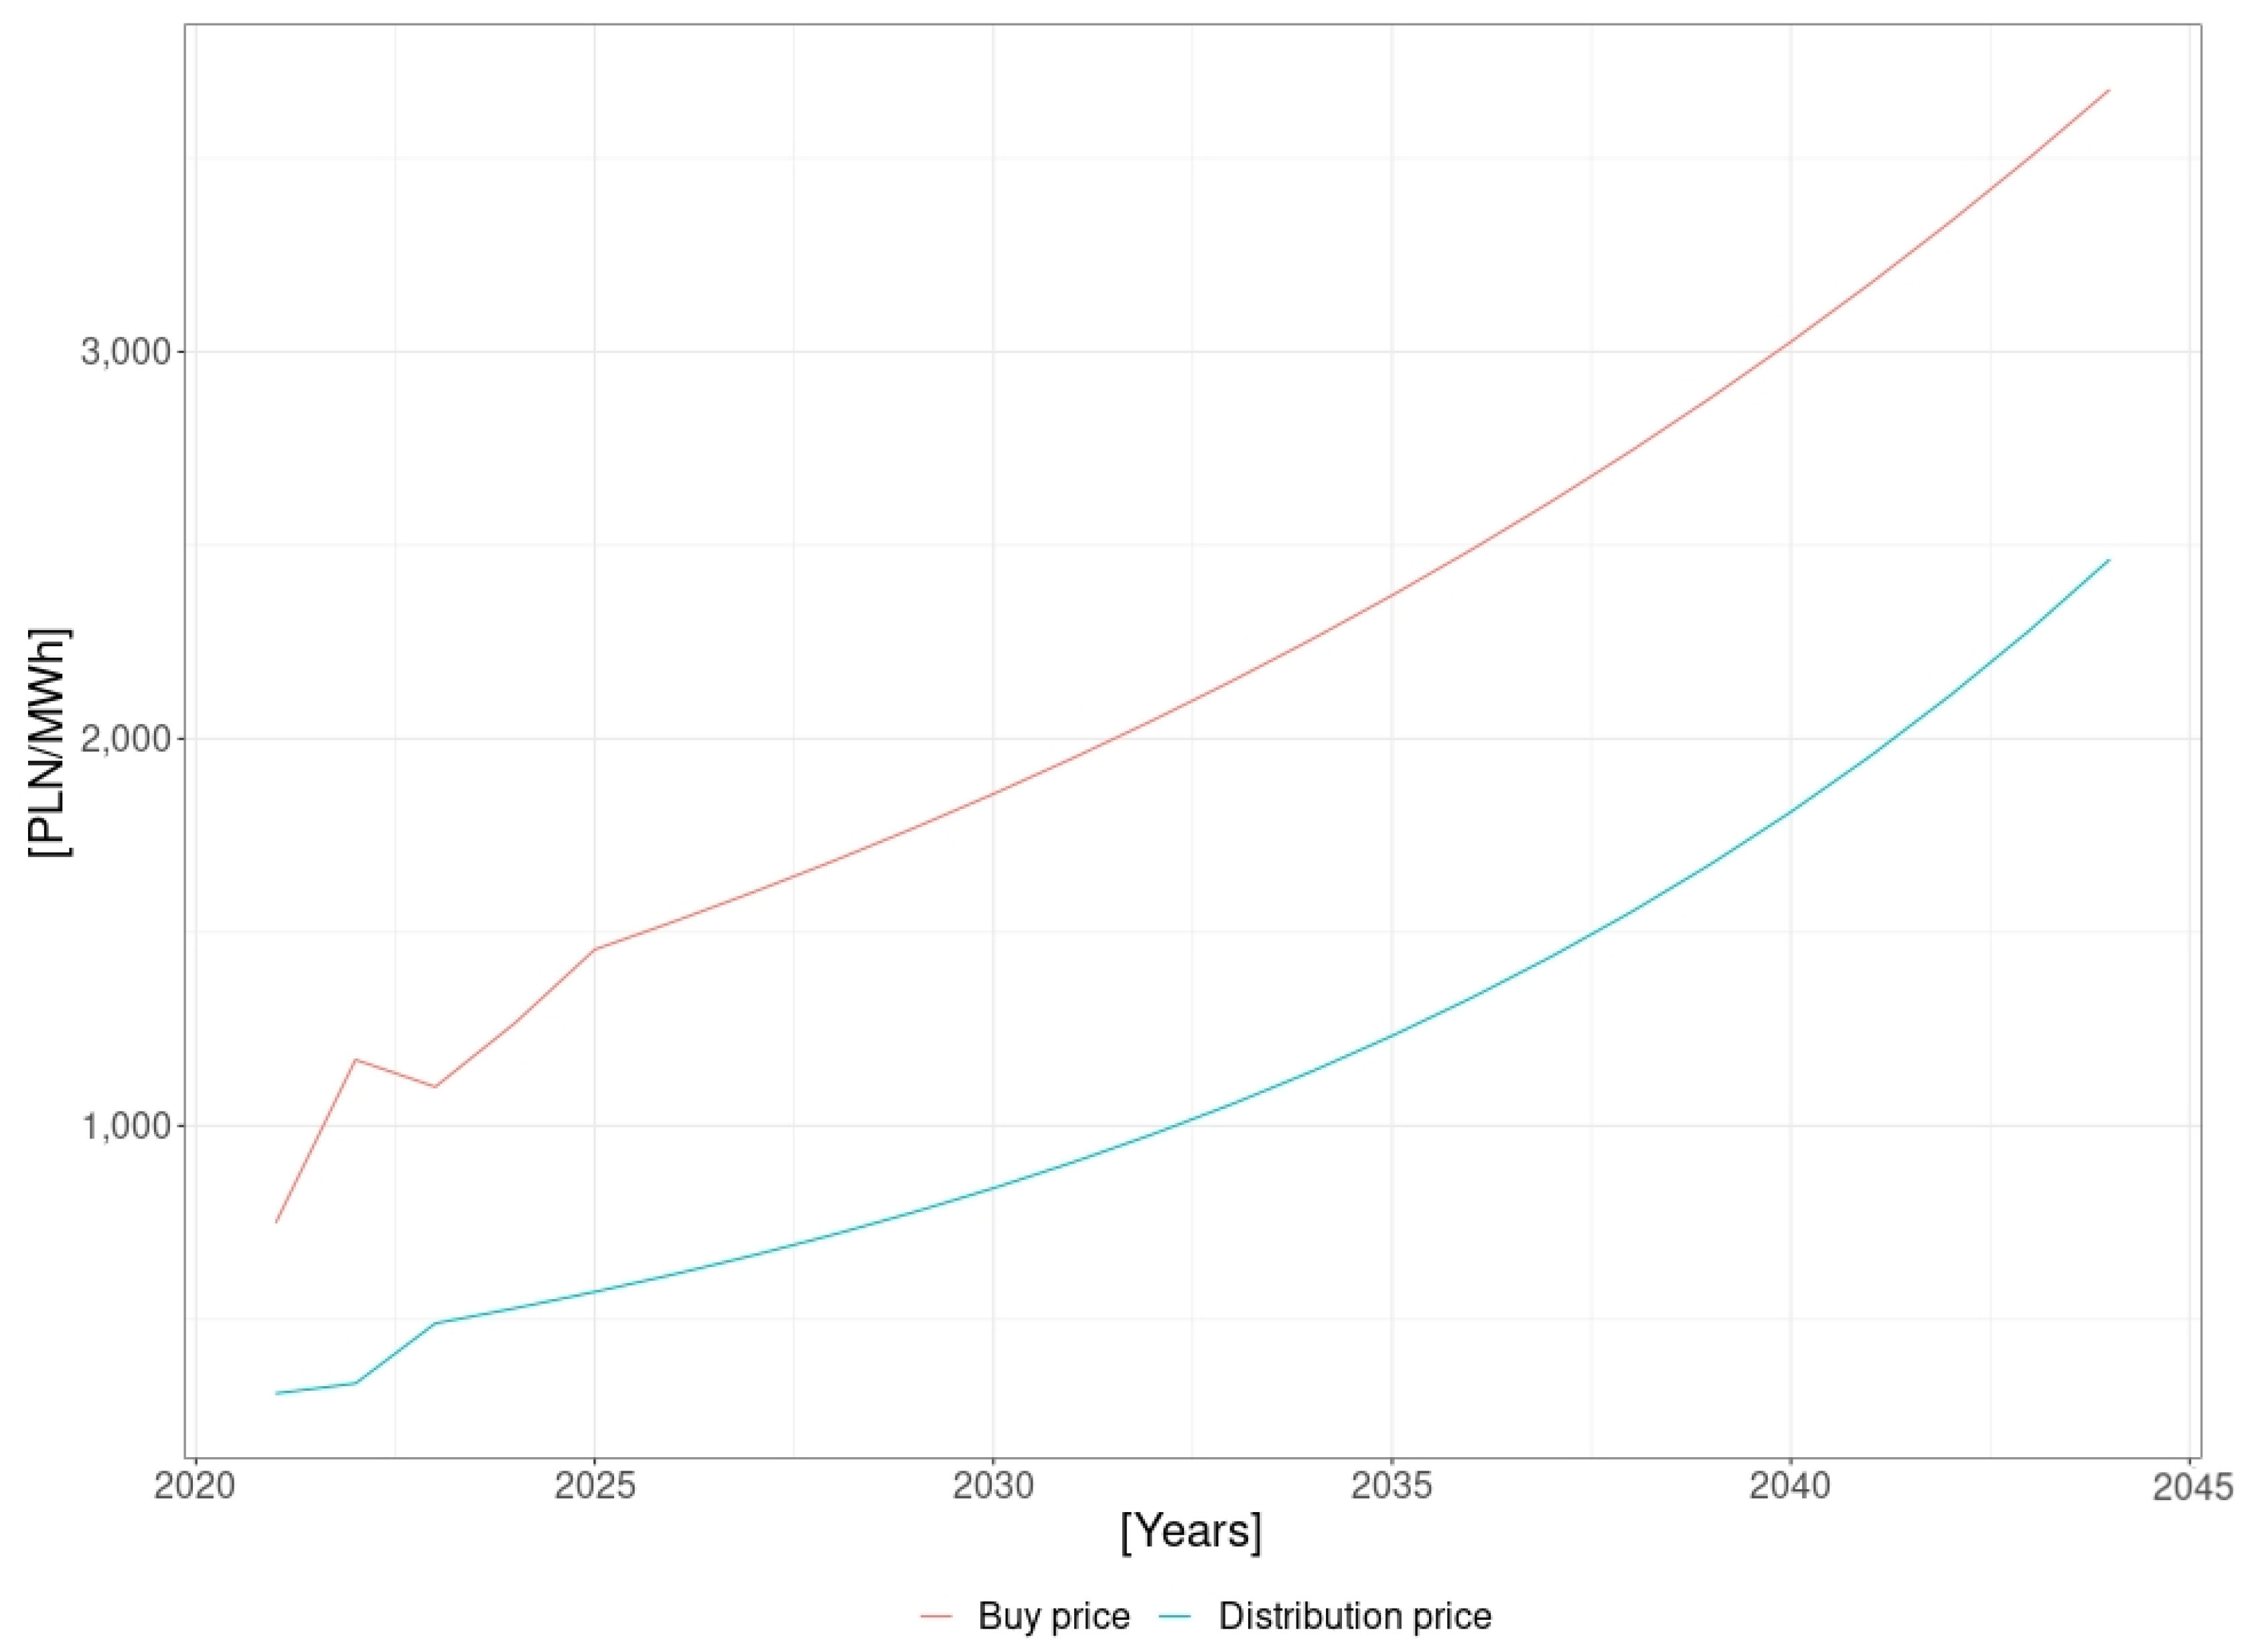
  • The prices of electricity purchase by prosumers settled in the net billing model were determined on the basis of actual, historical, averaged national retail prices specific to the Cxx tariff group. This assumption is based on the fact that electricity prices for households represented by the G tariff group have been distorted as a result of the shielding measures taken by the Polish government and the so-called “Protective Shields,” which froze prices at artificially low levels [40,41]. The (averaged national) price of electricity sales and distribution by trading companies to consumers with comprehensive contracts was: (i) in 2021: PLN 749.18/MWh, of which PLN 440.70 [42]/MWh (energy) + PLN 308.48 [42]/MWh (distribution); (ii) in 2022, a yearly average of: PLN 1170.68/MWh, of which PLN 836.40 [42]/MWh (energy) + PLN 334.28 [42]/MWh (distribution); (iii) in 2023, a quarterly average of: PLN 1100.6/MWh, of which PLN 611.10 [43]/MWh (energy) + PLN 489.50 [43]/MWh (distribution). For the projection of purchase prices, the indexed cost of energy purchase with the distribution service was adopted for the first quarter of 2023, with the cost of the distribution component indexed at 8% year-on-year for the entire analysis period, and the cost of energy was raised by 15% in the years 2024–2025 and by 5% from 2026, respectively. The resulting price dynamics are visualized in Figure 2.
  • The benefits were simulated for 11 prosumer micro-installation power selection scenarios in accordance with the relationship: source-power [kWp] = k × annual_energy_demand [MWh]/1000, where k = {0.5; 0.55; 0.6; 0.65; 0.7; 0.75; 0.8; 0.85; 0.9; 0.95; 1.0}.
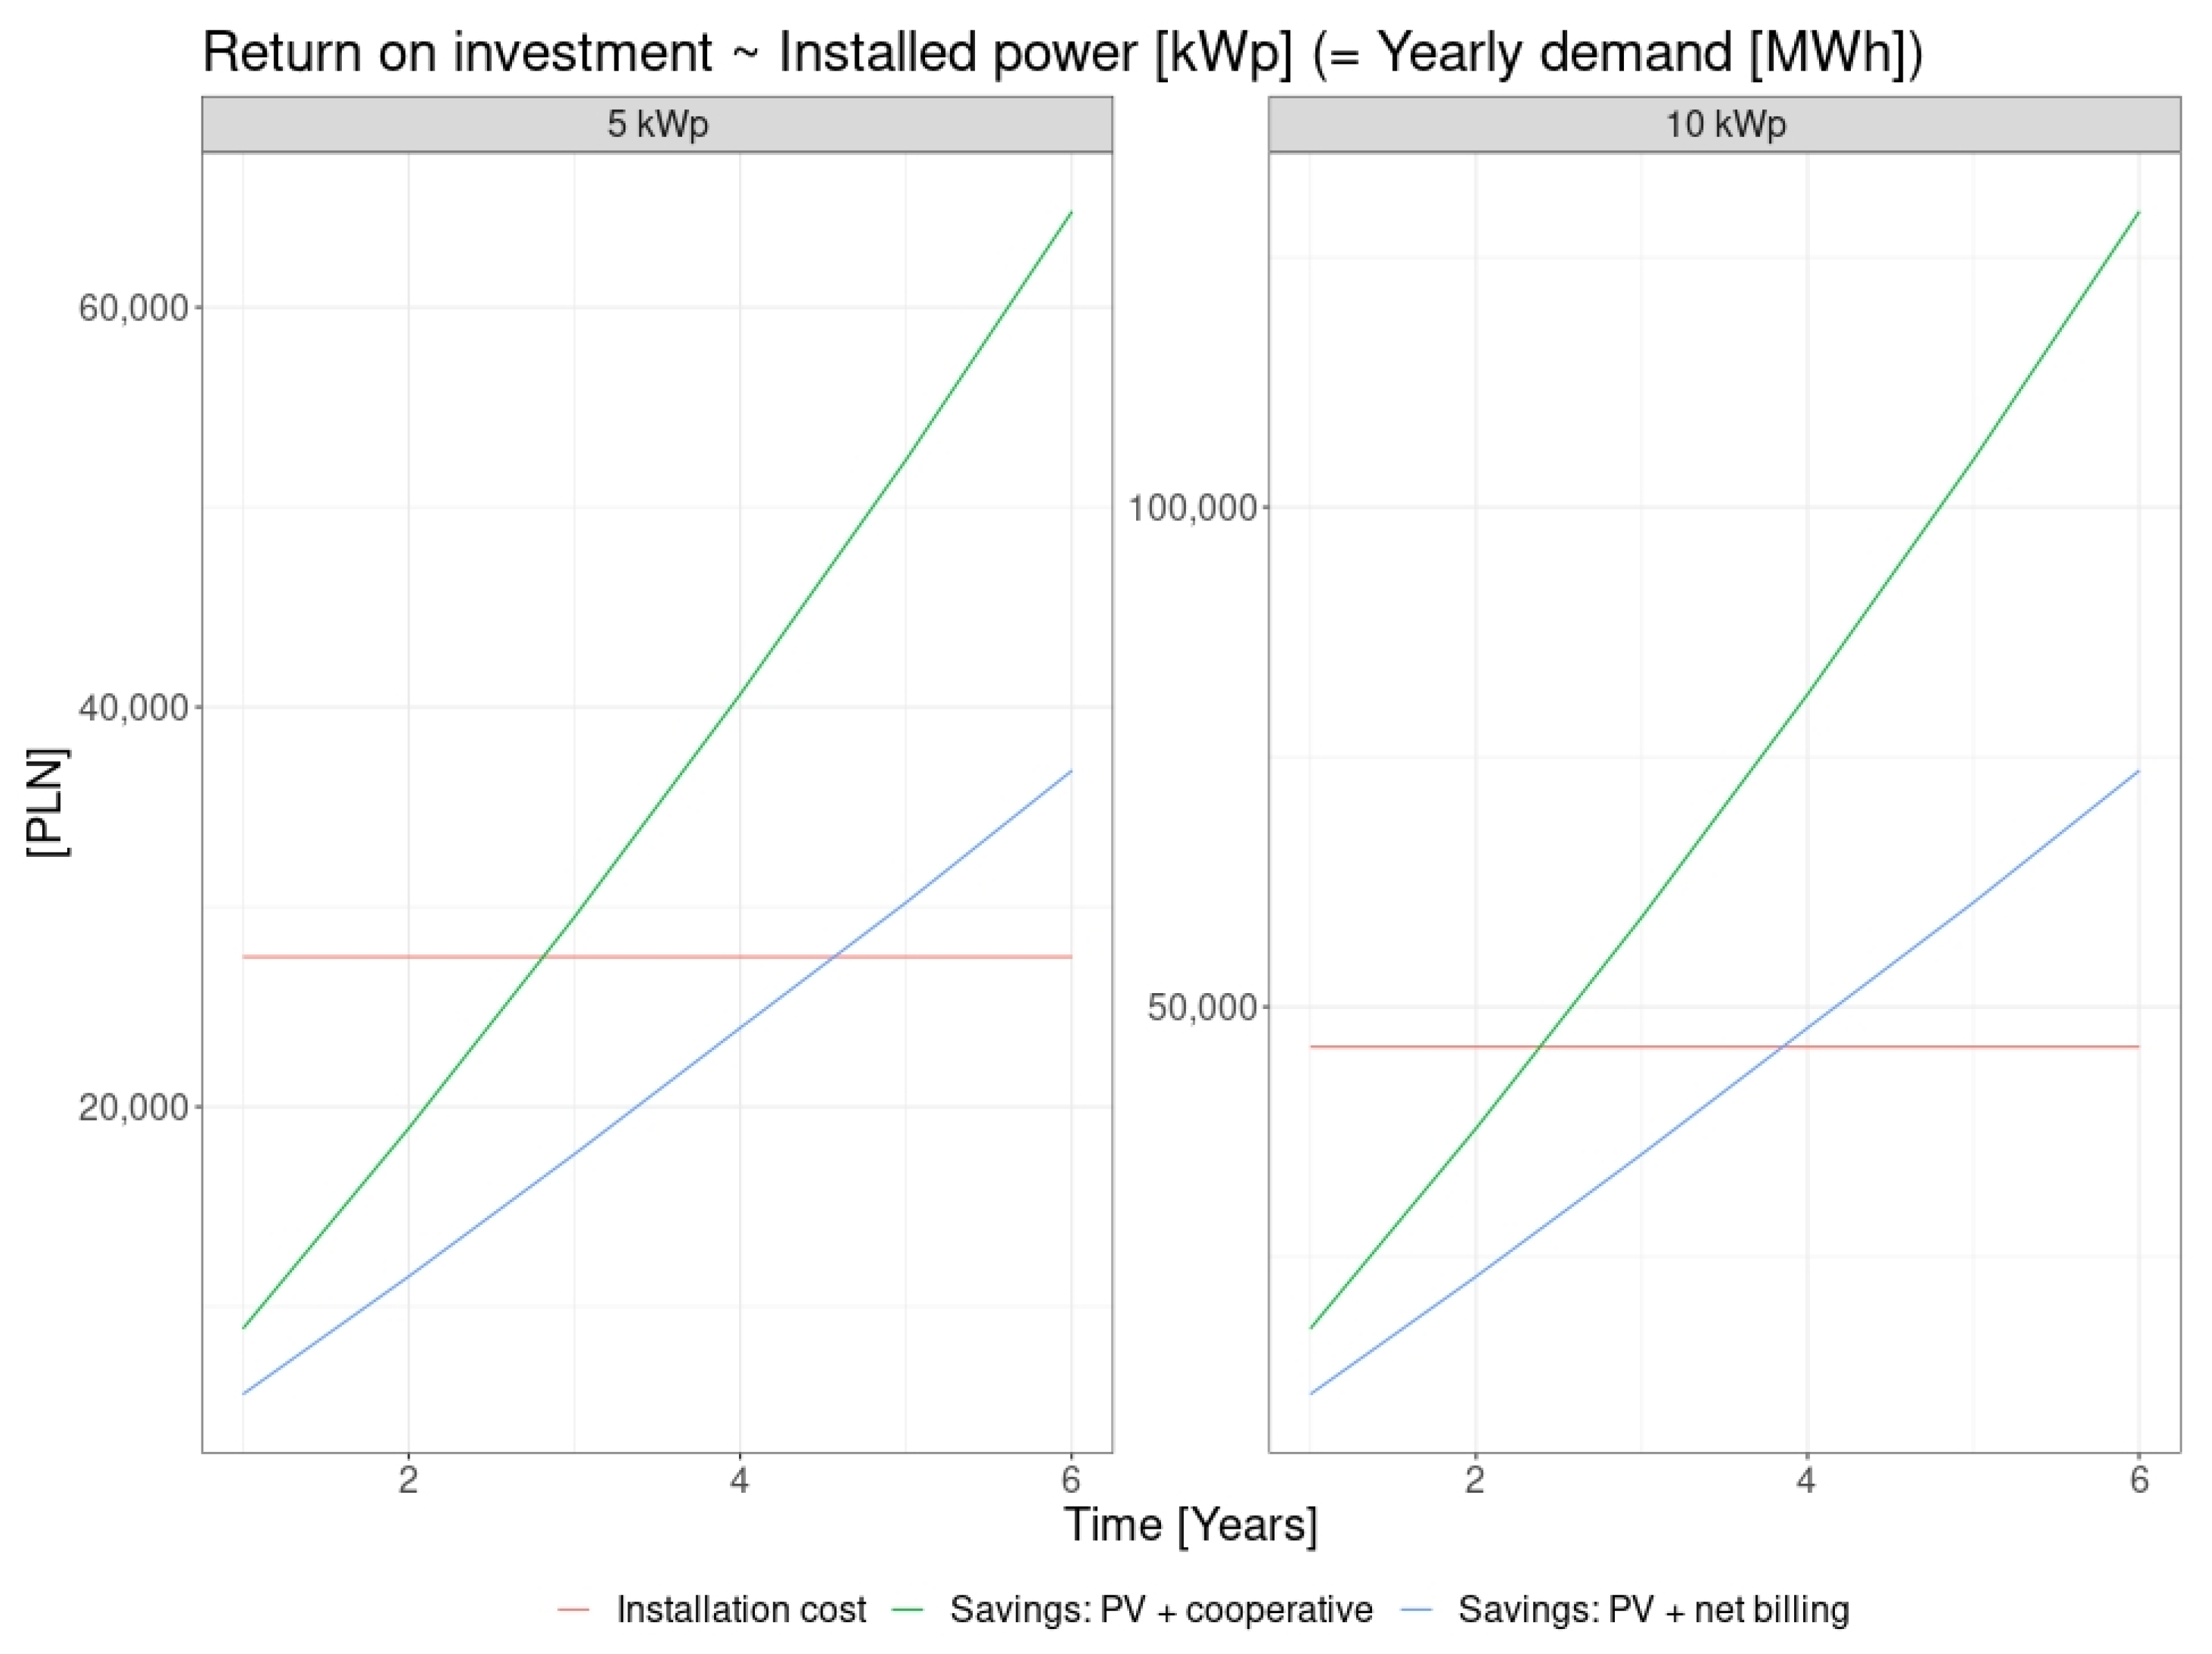
  • The research carried out also included an analysis of the levels of capital expenditure for two typical power sizes of photovoltaic installations (5 kWp and 10 kWp), including an analysis of the investment payback time depending on the installed capacity of the sources.
The results presented below were obtained from simulation calculations performed on a sample of annual data with hourly granularity, from 73 entities (rural farms). The corresponding simulation models were implemented and executed using the R-project computing environment [44,45]. As part of the simulation, three scenarios were simulated for the respective demand and generation profiles replicated for a 22-year horizon and for the pricing variants—assuming hourly balancing—without PV installation, with PV installation and net billing and with PV installation and net metering.

3. Results and Discussion

The research was conducted for three scenarios. The first reflected the original state, where only the data of energy consumers without their own generation sources were analyzed. This is the reference scenario against which the benefits obtained were compared in further work. The second scenario assumed that each customer became a prosumer and had a photovoltaic generation installation covered by the net billing model. Under the third scenario, the migration of prosumers to an energy cooperative, established in the previous step (scenario 2), which by law is based on the net metering model, was analyzed.
Figure 3 presents scenario-simulation results showing the average monthly electricity purchase cost that will be incurred by: (i) the consumer (scenario 1), (ii) the individual prosumer (scenario 2) and (iii) the energy cooperative (scenario 3) assuming unit energy consumption per year, i.e., 1 MWh/year. Each scenario was analyzed for eleven variants of capacity installed in the micro-installation for k, taking values from 0.5 to 1.0, excluding the loss of generation efficiency over time.
Analysis of the research results leads to the following conclusions.
  • The principal conclusion that emerges from the analysis of the results is a clear progressive reduction in the cost of electricity purchase and distribution. The analysis confirms that migration from scenario 1 (consumer), via scenario 2 (net billing prosumer) to scenario 3 (net metering prosumer), results in the generation of tangible benefits in each case.
  • The largest effect equivalent to the lowest cost of energy purchase and distribution to meet unit demand in an energy cooperative is observed in scenario 3. For the entire period analyzed (2025–2045), the cumulative average annual effect for the worst-case scenario (bottom curve in Figure 3) in the option of migration from the “consumer” to the “prosumer net billing” model results in an approx. 42% reduction in the cost of energy purchase from PLN 149/month to PLN 87/month—for 2025.
  • If a cooperative is established on the basis of net billing prosumers, there is a further reduction of approx. 24% in the cost of energy purchase to PLN 66/month.
  • The non-linearity over the period 2025–2045, as illustrated in Figure 3, is derived from forecasts of settlement prices in the wholesale market, at which the surplus energy resale scenario is executed, as well as forecasts of electricity and distribution prices in the retail market for end customers.
Figure 4 and Figure 5 show the average purchase costs of electricity with distribution service for actual consumer profiles and for two different scenarios of installed capacity in PV micro-installations, for k = 1 and k = 0.5, respectively. This reflects the image of actual scenario settlement for actual electricity consumers (scenario 1), individual prosumers (scenario 2) and an energy cooperative (scenario 3) established on their basis.
Analysis of the research results allows for the following conclusions.
  • Irrespective of the scenario, the shapes of the cost profiles regardless of the selected power level in PV micro-installations are very similar.
  • The establishment of an energy cooperative on the basis of individual prosumers, as well as the consequence of the optimum selection of capacity of individual micro-installations participating in the energy cooperative, together with the increased self-consumption within the energy cooperative, clearly have the effect of reducing the electricity purchase and distribution costs. The analyses indicate that some of the energy cooperatives (scenario 3) formed from the aggregation of individual prosumers (scenario 2) throughout the 2025–2045 analysis period would not be exposed to the electricity purchase and distribution cost. In the worst-case scenario and assuming the cooperative’s energy consumption at 1 MWh/year, the monthly cost of comprehensive energy supply was approx. PLN 3.8/month (2025) and PLN 12.3/month (2045). The price difference results from the assumed inflationary increase in distribution fees and the prices of energy purchased from the seller.
  • For the examples analyzed and the worst case of an energy cooperative being set up (scenario 3) from the consolidation of individual prosumers (scenario 2) resulted in an approximate reduction in the electricity purchase and distribution cost by a factor of 17 in 2025 and by a factor of 24 in 2045.
  • Reducing the capacity of the micro-installation to the minimum level analyzed (for k = 0.5) significantly affected the cost level. Similarly, for the worst case of an energy cooperative being set up (scenario 3) from the consolidation of individual prosumers (scenario 2) resulted in an approximate reduction in the electricity purchase and distribution cost by a factor of 2.5 in 2025 and by a factor of 1.4 in 2045.
Under real-world conditions, the PV installation is subject to degradation, with production efficiency decreasing by an average of approx. 0.5% per year. The impact of this effect on costs was analyzed, and averaged results are shown in Figure 6 by analogy with Figure 3.
Analysis of the research results allows for the following conclusions.
  • The loss of generation efficiency translates significantly into an increase in the electricity purchase and distribution cost. Based on the assumed unit annual electricity consumption (1 MWh/year) and the worst-case scenario for micro-installation capacity selection (k = 1), the cost in question for 2045 rises from PLN 3/month (for the no-efficiency-loss scenario) to PLN 44.4/month.
  • For an analogous situation involving only the worst-case scenario for micro-installation capacity selection (k = 0.5), the cost in question for 2045 rises from PLN 227/month (for the no-efficiency-loss scenario) to PLN 251/month.
The final component of the research focused on the assessment of payback time. To this end, the average investment cost was determined for two typical installation sizes (5 kWp and 10 kWp) including a complete catalog of cost components, i.e., PV modules, inverter and all necessary technical equipment, as well as the cost of design and implementation services [46]. Information on the average level of capital expenditure, combined with the cost structure resulting from the purchase of electricity and distribution services as projected and shown in Figure 2, and projections of electricity prices in the wholesale market (Figure 1) at which surplus energy could be sold in the individual prosumer model, were used to analyze the projections of payback times shown in Figure 7.
Analysis of the research results allows for the following conclusions.
  • The payback time for capital expenditure excluding discounting under the assumptions adopted varies between 4 and 5 years for the option of an individual prosumer settled on a net billing basis, and between 2.5 and 3 years for an energy cooperative.
  • While the payback time in both cases appears to be acceptable, the aggregation of individual prosumers into energy cooperative structures guarantees an average reduction in the payback time by half, as well as mitigating the risks of the impact of price volatility in the wholesale market, including the occurrence of negative prices, on the benefits obtained in the net billing formula and the payback time.
  • The profitability of investments can additionally be improved, taking into account the numerous subsidy mechanisms and aid programs.

4. Conclusions

Developing energy autonomy in the prosumer formula results in a real and significant reduction in the electricity purchase costs. This phenomenon is observed both for the option of transition from scenario 1 (consumer) to scenario 2 (individual prosumer settled in the net billing model) and then from scenario 2 to scenario 3 (energy cooperative in the net metering model). The savings that are possible with the purchase of electricity (scenario 2) and the purchase of electricity and distribution (scenario 3)—assuming a loss of generation efficiency as a function of time and two extreme capacity assumptions for the micro-installation (k = 0.5; k = 1)—are illustrated in Figure 8.
It is worth noting that the optimal capacity of generating sources (k = 1) results in a reduction in energy purchase costs for the individual prosumer by as much as 44.29%—with a further potential to reduce these costs by consolidating prosumers into an energy cooperative. Thanks to the effect of increased energy self-consumption and, above all, due to the change in the settlement model to net metering, the total cost of energy purchase and distribution can thus be reduced by another 38.83%. Overall, the total cost for the entire 2025–2045 period is only 5.46% of the cost that community members would incur if they continued as individual consumers. It is also worth noting that if the capacity in generation sources is not optimal (k = 0.5), the balance of power-purchase and distribution costs is substantially eroded, with the dynamics of change becoming more severe for the power cooperative. The total cost will then amount to 47.46% of the costs that would be borne in aggregate by individual consumers. The different cost change dynamics in each scenario are due to different settlement mechanisms and a different approach to the electricity distribution cost.
As research has shown, the establishment of an energy cooperative on the basis of individual prosumers can lead to a reduction in the payback time of investments in generation sources by a factor of two. Making an assumption about the acceptability of the payback time at the original level, i.e., that of the net billing model, may thus result in the allocation of funds saved through the establishment of an energy cooperative for the development of that community. These resources could be allocated to additional generation capacities or energy storage capacities and capabilities. This area seems to be particularly interesting from the perspective of further research work, as it may be aimed at the following.
  • Achieving additional economic effects of the flexibility of community work, or
  • The minimization of electricity exchange with the distributor’s network.
An alternative way to use the funds saved is to allocate them to the construction of electricity generation sources dedicated to reducing the phenomenon of energy poverty. The functional structure of the energy cooperative allows for a significant reduction in the costs related to energy distribution, which is part of the direction of supporting recipients affected by this phenomenon. The search for functional solutions in this area is one of the elements of the continuation of research work conducted by the author’s team. The recently introduced law change, which allows local authorities to be members of cooperatives in Poland, turned out to be helpful in this respect—the involvement of local government institutions mitigates the CAPEX problem in the case of (even if well-organized) poor people.
The pioneering nature of this research carried out deserves special emphasis. As part of the literature review, the author’s team did not find any analyses regarding the benefits that could be obtained by changing the prosumer billing model through aggregation to an energy cooperative. These results are new in the area of prosumerism and models of creating energy independence.

Author Contributions

Conceptualization, J.J., M.K. and M.S.; methodology, M.K.; formal analysis, J.J., M.K. and M.S.; investigation, J.J., M.K. and M.S.; resources, M.S.; writing—original draft preparation, J.J., M.K. and M.S.; writing—review and editing, J.J.; visualization, M.K.; supervision, J.J. and M.S. All authors have read and agreed to the published version of the manuscript.

Funding

This research received no external funding.

Data Availability Statement

Data are available in a publicly accessible repository that does not issue DOIs.

Conflicts of Interest

The authors declare no conflicts of interest.

References

  1. Gruber, L.; Bachhiesl, U.; Wogrin, S. The Current State of Research on Energy Communities. Elektrotech. Inftech. 2021, 138, 515–524. [Google Scholar] [CrossRef]
  2. Dudka, A.; Moratal, N.; Bauwens, T. A Typology of Community-Based Energy Citizenship: An Analysis of the Ownership Structure and Institutional Logics of 164 Energy Communities in France. Energy Policy 2023, 178, 113588. [Google Scholar] [CrossRef]
  3. Sciullo, A.; Gilcrease, G.W.; Perugini, M.; Padovan, D.; Curli, B.; Gregg, J.S.; Arrobbio, O.; Meynaerts, E.; Delvaux, S.; Polo-Alvarez, L.; et al. Exploring Institutional and Socio-Economic Settings for the Development of Energy Communities in Europe. Energies 2022, 15, 1597. [Google Scholar] [CrossRef]
  4. Blasch, J.; Van Der Grijp, N.M.; Petrovics, D.; Palm, J.; Bocken, N.; Darby, S.J.; Barnes, J.; Hansen, P.; Kamin, T.; Golob, U.; et al. New Clean Energy Communities in Polycentric Settings: Four Avenues for Future Research. Energy Res. Soc. Sci. 2021, 82, 102276. [Google Scholar] [CrossRef]
  5. Vernay, A.-L.; Sebi, C. Energy Communities and Their Ecosystems: A Comparison of France and the Netherlands. Technol. Forecast. Soc. Chang. 2020, 158, 120123. [Google Scholar] [CrossRef]
  6. Hufen, J.A.M.; Koppenjan, J.F.M. Local Renewable Energy Cooperatives: Revolution in Disguise? Energy Sustain. Soc. 2015, 5, 18. [Google Scholar] [CrossRef]
  7. Soeiro, S.; Ferreira Dias, M. Energy Cooperatives in Southern European Countries: Are They Relevant for Sustainability Targets? Energy Rep. 2020, 6, 448–453. [Google Scholar] [CrossRef]
  8. Schmid, B.; Meister, T.; Klagge, B.; Seidl, I. Energy Cooperatives and Municipalities in Local Energy Governance Arrangements in Switzerland and Germany. J. Environ. Dev. 2020, 29, 123–146. [Google Scholar] [CrossRef]
  9. National Center for Agricultural Support (Krajowy Ośrodek Wsparcia Rolnictwa) Register of Energy Cooperatives (Wykaz Spółdzielni Energetycznych). Available online: https://www.gov.pl/web/kowr/wykaz-spoldzielni-energetycznych (accessed on 13 December 2023).
  10. Ustawa z Dnia 20 Lutego 2015 r. o Odnawialnych Źródłach Energii (Act of February 20, 2015 on Renewable Energy Sources) (Dz.U. 2020 Poz. 261); 2015.
  11. Ustawa z Dnia 4 Października 2018 r. o Spółdzielniach Rolników (Act of October 4, 2018 on Farmers’ Cooperatives) (Dz. U. 2018 Poz. 2073).
  12. Hoppe, T.; Coenen, F.; Bekendam, M. Renewable Energy Cooperatives as a Stimulating Factor in Household Energy Savings. Energies 2019, 12, 1188. [Google Scholar] [CrossRef]
  13. Ceglia, F.; Esposito, P.; Faraudello, A.; Marrasso, E.; Rossi, P.; Sasso, M. An Energy, Environmental, Management and Economic Analysis of Energy Efficient System towards Renewable Energy Community: The Case Study of Multi-Purpose Energy Community. J. Clean. Prod. 2022, 369, 133269. [Google Scholar] [CrossRef]
  14. Jasiński, J.; Kozakiewicz, M.; Sołtysik, M. Determinants of Energy Cooperatives’ Development in Rural Areas—Evidence from Poland. Energies 2021, 14, 319. [Google Scholar] [CrossRef]
  15. Kostecka-Jurczyk, D.; Marak, K.; Struś, M. Economic Conditions for the Development of Energy Cooperatives in Poland. Energies 2022, 15, 6831. [Google Scholar] [CrossRef]
  16. Olczak, P.; Matuszewska, D.; Lishchenko, A.; Zhydyk, I.; Koval, V.; Iermakova, O. The Economic Efficiency of Photovoltaic Energy for Energy Prosumers. Polityka Energetyczna—Energy Policy J. 2022, 25, 95–114. [Google Scholar] [CrossRef]
  17. Gradziuk, P.; Us, A. Economic effectiveness of the use of energy storage in a prosumer photovoltaic installation. Ann. PAAAE 2023, XXV, 76–91. [Google Scholar] [CrossRef]
  18. Sołtysik, M.; Kozakiewicz, M.; Jasiński, J. Profitability of Prosumers According to Various Business Models—An Analysis in the Light of the COVID-19 Effect. Energies 2021, 14, 8488. [Google Scholar] [CrossRef]
  19. Gjorgievski, V.Z.; Cundeva, S.; Markovska, N.; Georghiou, G.E. Virtual Net-Billing: A Fair Energy Sharing Method for Collective Self-Consumption. Energy 2022, 254, 124246. [Google Scholar] [CrossRef]
  20. Dufo-López, R.; Bernal-Agustín, J.L. A Comparative Assessment of Net Metering and Net Billing Policies. Study Cases for Spain. Energy 2015, 84, 684–694. [Google Scholar] [CrossRef]
  21. Ordóñez, Á.; Sánchez, E.; Rozas, L.; García, R.; Parra-Domínguez, J. Net-Metering and Net-Billing in Photovoltaic Self-Consumption: The Cases of Ecuador and Spain. Sustain. Energy Technol. Assess. 2022, 53, 102434. [Google Scholar] [CrossRef]
  22. Trela, M.; Dubel, A. Net-Metering vs. Net-Billing from the Investors Perspective—Impacts of Changes in RES Financing in Poland on the Profitability of a Joint Photovoltaic Panels and Heat Pump System. Energies 2021, 15, 227. [Google Scholar] [CrossRef]
  23. National Center for Agricultural Support (Krajowy Ośrodek Wsparcia Rolnictwa) Rules for Approval of Energy Cooperatives (Zasady Zatwierdzenie Spółdzielni Energetycznych). Available online: https://www.gov.pl/web/kowr/zatwierdzenie-w-wykazie-spoldzielni-energetycznych (accessed on 13 December 2023).
  24. Hebda, W. Energy Policy of Poland until 2040: The Challenges and Threats to Energy Security in the Next Two Decades. Politeja 2022, 19, 167–186. [Google Scholar] [CrossRef]
  25. Węgrzyn, A.; Spirydowicz, A.; Grebski, W. Dilemmas of the Energy Transformation in Poland 2021/2022. Min. Mach. 2022, 40, 32–42. [Google Scholar] [CrossRef]
  26. Gawlik, L. The Polish Power Industry in Energy Transformation Process. Miner. Econ. 2018, 31, 229–237. [Google Scholar] [CrossRef]
  27. Igliński, B.; Pietrzak, M.B.; Kiełkowska, U.; Skrzatek, M.; Kumar, G.; Piechota, G. The Assessment of Renewable Energy in Poland on the Background of the World Renewable Energy Sector. Energy 2022, 261, 125319. [Google Scholar] [CrossRef]
  28. Siudek, A.; Klepacka, A. Energy clusters in poland—A theoretical approach. Ann. PAAAE 2020, XXII, 192–205. [Google Scholar] [CrossRef]
  29. Mucha-Kuś, K.; Sołtysik, M.; Zamasz, K.; Szczepańska-Woszczyna, K. Coopetitive Nature of Energy Communities—The Energy Transition Context. Energies 2021, 14, 931. [Google Scholar] [CrossRef]
  30. Uddin, M.; Mo, H.; Dong, D.; Elsawah, S.; Zhu, J.; Guerrero, J.M. Microgrids: A Review, Outstanding Issues and Future Trends. Energy Strategy Rev. 2023, 49, 101127. [Google Scholar] [CrossRef]
  31. PSE—Polskie Sieci Elektroenergetyczne (Polish Power Grids) Market Price of Electricity (RCEm)—Monthly Approach (Rynkowa Cena Energii Elektrycznej (RCEm)—Podejście Miesięczne). Available online: https://www.pse.pl/oire/rcem-rynkowa-miesieczna-cena-energii-elektrycznej (accessed on 15 December 2023).
  32. PSE—Polskie Sieci Elektroenergetyczne (Polish Power Grids) Market Price of Electricity—Daily Approach. (Rynkowa Cena Energii Elektrycznej (RCE)—Ujęcie Dobowe). Available online: https://www.pse.pl/dane-systemowe/funkcjonowanie-rb/raporty-dobowe-z-funkcjonowania-rb/podstawowe-wskazniki-cenowe-i-kosztowe/rynkowa-cena-energii-elektrycznej-rce (accessed on 15 December 2023).
  33. Polish Power Grids Market Price of Electricity in Poland—Hourly Indexation per Day. Available online: https://www.pse.pl/dane-systemowe/funkcjonowanie-rb/raporty-dobowe-z-funkcjonowania-rb/podstawowe-wskazniki-cenowe-i-kosztowe/rynkowa-cena-energii-elektrycznej-rce (accessed on 15 October 2023).
  34. Technical Data Sheet for Photovoltaic Panels—Longi Catalogue. Available online: https://sklepsolar.pl/wp-content/uploads/2023/06/Longi-LR5-66HIH-490-510-PL.pdf (accessed on 17 December 2023).
  35. Technical Data Sheet for Photovoltaic Panels—Vaillant Catalogue. Available online: https://www.vaillant.pl/karty-produktowe/fotowoltaika-4/kp-auropower-vpv-p-320-325-1771301.pdf (accessed on 17 December 2023).
  36. Technical Data Sheet for Photovoltaic Panels—MWT Catalogue. Available online: https://freeeco.pl/wp-content/uploads/2020/06/Sunport-karta-katalogowa-SPP320M60B-PL.pdf (accessed on 17 December 2023).
  37. Technical Data Sheet for Photovoltaic Panels—Longi2 Catalogue. Available online: https://freeeco.pl/wp-content/uploads/2020/11/lr6_60hph_315m_bf___karta_katalogowa___pl.pdf (accessed on 17 December 2023).
  38. Technical Data Sheet for Photovoltaic Panels—DasSolar Catalogue. Available online: https://www.das-solar.com/uploads/DAS-DH156NA-EN-610-635&ef&bc&882465-1134-35&ef&bc&89.pdf (accessed on 17 December 2023).
  39. Czopek, P.; Kowalski, S.; Gurbiel, R.; Musiałek, P.; Sołtysik, M.; Wilk, B. Ewolucja Krajowego Systemu Elektroenergetycznego w Polsce w Kierunku Zeroemisyjności. Scenariusze Rozwoju Systemu (Red. Naukowa M.Sołtysik). (EN: Evolution of the National Power System in Poland—Towards Zero Emission. System Development Scenarios (Scientific Editor: M.Sołtysik).); Wydawnictwo Uniwersytetu Ekonomicznego w Krakowie: Kraków, Poland, 2022; ISBN 978-83-89410-63-4. [Google Scholar]
  40. Tariffs for the Sale of Energy—Announcements of the Polish Energy Regulatory Office. Available online: https://www.ure.gov.pl/pl/urzad/informacje-ogolne/aktualnosci/10718,Ile-zaplacimy-za-energie-elektryczna-od-stycznia-2023-roku.html (accessed on 15 December 2023).
  41. The Parliamentary Majority Proposes “Freezing” Energy Prices in 2024; Bankier.pl: Warsaw, Poland, 2023.
  42. Ministerstwo Klimatu i Środowiska; Departament Strategii i Analiz; Agencja Rynku Energii S.A. State of the Art in the Power Industry—Bulletin of Power Industry (PL: Sytuacja w Elektroenergetyce); Agencja Rynku Energii S.A.: Warsaw, Poland, 2022.
  43. Ministerstwo Klimatu i Środowiska; Departament Strategii i Analiz; Agencja Rynku Energii S.A. State of the Art in the Power Industry—Bulletin of Power Industry (PL: Sytuacja w Elektroenergetyce); Agencja Rynku Energii S.A.: Warsaw, Poland, 2023.
  44. The R Project for Statistical Computing. Available online: https://www.r-project.org/ (accessed on 20 April 2021).
  45. COIN-OR/CBC. Available online: https://projects.coin-or.org/Cbc (accessed on 18 November 2020).
  46. Ciuła, R.; Gajkowski, J.; Kowalak, T.; Grochowski, K.; Kalinowski, K.; Krzyżanowska, A.; Sulej, A.; Wiśniewski, K. Rynek Fotowoltaiki w Polsce 2023 (Photovoltaics Market in Poland 2023); Fotowoltaika w Polsce (Photovoltaics in Poland); IEO—Instytut Energetyki Odnawialnej: Warsaw, Poland, 2023. [Google Scholar]
Figure 2. Projected unit cost of electricity purchase and distribution.
Energies 17 01330 g002
Figure 3. Average unit purchase cost [PLN/MWh] of electricity with distribution service for each scenario and the years 2025–2045 for k, taking values from 0.5 to 1.0, excluding the loss of generation efficiency over time.
Energies 17 01330 g003
Figure 4. Average monthly unit purchase cost of electricity with distribution service [PLN/MWh] for each scenario and the years 2025–2045 for k = 1.0.
Energies 17 01330 g004
Figure 5. Average monthly unit purchase cost of electricity with distribution service [PLN/MWh] for each scenario and the years 2025–2045 for k = 0.5.
Energies 17 01330 g005
Figure 6. Average unit purchase cost [PLN/MWh] of electricity with distribution service for each scenario and the years 2025–2045 for k, taking values from 0.5 to 1.0, including the loss of generation efficiency over time.
Energies 17 01330 g006
Figure 7. Payback on micro-installation cost for “individual prosumer” and “energy cooperative” scenarios.
Energies 17 01330 g007
Figure 8. Relative change in the total cost of electricity and distribution purchase combined for the years 2025–2045 for scenario 2 (individual prosumer) and scenario 3 (energy cooperative) relative to the cost borne by the consumer (scenario 1).
Energies 17 01330 g008
Disclaimer/Publisher’s Note: The statements, opinions and data contained in all publications are solely those of the individual author(s) and contributor(s) and not of MDPI and/or the editor(s). MDPI and/or the editor(s) disclaim responsibility for any injury to people or property resulting from any ideas, methods, instructions or products referred to in the content.

