Diesel Consumption of Agriculture in China

Key Laboratory of Ocean Energy Utilization and Energy Conservation of Ministry of Education, Dalian University of Technology, Dalian 116024, China
*
Author to whom correspondence should be addressed.
Energies 2012, 5(12), 5126-5149; https://0-doi-org.brum.beds.ac.uk/10.3390/en5125126
Submission received: 13 August 2012
/
Revised: 29 November 2012
/
Accepted: 29 November 2012
/
Published: 6 December 2012
Abstract
:As agricultural mechanization accelerates the development of agriculture in China, to control the growth of the resulting energy consumption of mechanized agriculture without negatively affecting economic development has become a major challenge. A systematic analysis of the factors (total power, unit diesel consumption, etc.) influencing diesel consumption using the SECA model, combined with simulations on agricultural diesel flows in China between 1996 and 2010 is performed in this work. Seven agricultural subsectors, fifteen categories of agricultural machinery and five farm operations are considered. The results show that farming and transportation are the two largest diesel consumers, accounting for 86.23% of the total diesel consumption in agriculture in 2010. Technological progress has led to a decrease in the unit diesel consumption and an increase in the unit productivity of all machinery, and there is still much potential for future progress. Additionally, the annual average working hours have decreased rapidly for most agricultural machinery, thereby influencing the development of mechanized agriculture.
1. Introduction
The limited supply of traditional fossil fuels and the associated consumption limitations needed for dealing with global climate change have considerably restricted economic development in recent years. This has raised the concern of energy analysts and policy makers regarding the adverse effects of energy overuse. A series of policy measures aimed at reducing energy consumption have been implemented in order to meet the compulsory targets stated in the China government’s Eleventh Five-Year Plan (2006–2010). Agriculture development in China is not an exception. Calculated at constant prices, the average elasticity of energy consumption in agriculture declined from 2.33 (2001–2005) to 0.29 (2006–2010). The rapid growth of energy consumption in agriculture was thus restrained without negatively affecting economic development.
With a gradually increasing level of mechanization, agricultural energy consumption in China has increased from 36.88 million tons of coal equivalent (Mtce) in 1996 to 64.77 Mtce in 2010, which translates to an annual increase of 4.10%. Energy plays a critical role in the development of agriculture as it does in the manufacturing, construction and service industry. This has motivated many researchers to focus on agricultural energy issues, and analysis of energy and exergy efficiency in the agricultural sector has become a research hotspot. Two energy resources, namely diesel for tractors and electricity for pumps are usually the research topics in this area. Such analysis has been applied in Saudi Arabia [1], Turkey [2], Jordan [3], Iran [4] and Malaysia [5]. The relationship between energy inputs and agricultural production outputs is another research hotspot. These energy inputs usually include direct and indirect energy, i.e., human and animal labor, machinery, electricity, diesel oil, fertilizers, seeds, etc. Rijal and Bansal [6] examined the total energy input and output of subsistence agriculture in the rural areas of Nepal. Ozkan and Akcaoz [7] estimated the input-output ratio in the Turkish agricultural sector for the period of 1975–2000, where their output is composed of 36 agricultural commodities. On the other hand, agricultural output in Hatirli and Ozkan [8] comprises 104 agricultural commodities. Alam and Alam [9] evaluated the impact of energy input on agricultural production output in Bangladesh from 1980 to 2000. There are also researches that provided meaningful econometrics methods. Uri [10] quantified the relationship between the energy price and the use of conservation tillage via Granger causality over the period of 1963–1997. A regression analysis of the relationship between energy use and agricultural productivity was done by Karkacier and Gokalp Goktolga [11]. Using co-integration and error correction analysis, Türkekul and Unakıtan [12] estimated the long- and short-run relationship among energy consumption, agricultural GDP, and energy prices from 1970 to 2008 in Turkey’s agriculture.
Based on a bottom-up modeling approach, the model named Save Production simulated the development of energy use in the Dutch industry and agriculture [13]. Baruah and Bora [14] assessed the energy demands in the state of Assam, India. In that study, they considered four strategic scenarios of mechanization that incorporated some proven technologies. Nevertheless, only a few simulation and forecast models were established to study the energy demand of agriculture and little attention has been paid to the relationship between energy consumption and end-use machinery in agriculture, especially in China. In the Twelfth Five-Year Plan, the Chinese government has planned to reduce the energy consumption per unit GDP by 16% during this five year horizon. A special model, Simulation and Analysis of Energy Consumption for Agriculture (SECA), is designed to answer all kinds of questions on how energy was consumed in different agricultural sectors to achieve the new goal. Furthermore it also serves as the foundation for the agricultural energy demand forecasting model. In this study, we identify the factors (total power, unit diesel consumption, etc.) influencing diesel consumption in China and simulate the diesel flows of agriculture of China in detail. Based on availability, our dataset spans the period of 1996–2010.
2. Model Specification and Data
2.1. Overall Structure
This paper uses a generalized definition of the word agriculture to include farming (i.e., agriculture in narrow definition), fishery, forestry, animal husbandry and services supporting agriculture. Fifteen kinds of the agricultural machinery from seven agricultural subsectors are considered. Figure 1 shows the overall structure of SECA. In the Distribution Module, it is assumed that the change in the number of agricultural machinery with different rated powers follows a certain curved distribution. Simulation results of the curved distribution are processed by the Operation Module and transferred into the Unit Consumption Module and the Productivity Module which generate the weighted average of unit consumption and that of unit productivity, respectively. Then the two weighted averages are input into the Main Module along with workload statistics, machinery capacity and load factors, which are obtained from the database in the Operation Module. Finally, technological progress and other effects are considered in the Correction Module to narrow the gap between the empirical statistics and the model calculations. The following subsections describe each module in detail.
Figure 1.
Overall structure of SECA.

2.2. Operation Module
In SECA, all the agricultural machinery are categorized into five farming related operations (o1~o5, Table 1). These operations include mechanized tillage, mechanized sowing, mechanized harvesting, mechanized irrigation and other operations. They are assumed as follows:
- Mechanized tillage (o1) and mechanized sowing (o2) are performed by tractors and associated towing farm machinery. Both the large and medium-sized tractors and the small ones are included.
- Mechanized harvesting (o3) is performed by combine harvesters, swathers and other harvesters.
- Mechanized irrigation (o4) is performed by irrigation machinery.
- Other operations (o5) are performed by rest agricultural machinery, the workload statistics of which are not available.

| Operations | Machinery | Relationships |
|---|---|---|
| o1: Mechanized tillage | m1: Large and medium-sized tractors
m2: Small tractors (and associated towing machinery) | |
| o2: Mechanized sowing | m1: Large and medium-sized tractors
m2: Small tractors (and associated towing machinery) | |
| o3: Mechanized harvesting | m3: Combine harvesters
m4: Swathers m5: Other harvesters | |
| o4: Mechanized irrigation | m6: Irrigation machinery | |
| o5: Other operation | m7~m15: Rest machinery |
Note: T is a generalized symbol which can be replaced by P, L, li, C, etc.
2.3. Main Module
Two kinds of the energy carriers, diesel and electricity, are considered in SECA. The energy required to perform the selected farming operation is estimated using the equation below:
![Energies 05 05126 i001]() wherein the subscript o indicates the farm operations mentioned in the Operation Module (o = o1, o2,…, o5); the subscript y indicates the year (y = 1996, 1997,…, 2010); C refers to the quantity of energy consumption; P is the total power of agricultural machinery; t refers to the average annual working hours of unit machinery; is the weighted average of unit energy consumption (for diesel) or motor efficiency (for electricity).
wherein the subscript o indicates the farm operations mentioned in the Operation Module (o = o1, o2,…, o5); the subscript y indicates the year (y = 1996, 1997,…, 2010); C refers to the quantity of energy consumption; P is the total power of agricultural machinery; t refers to the average annual working hours of unit machinery; is the weighted average of unit energy consumption (for diesel) or motor efficiency (for electricity).

The workload statistics for the four categories of agricultural operations, viz. o1, o2, o3 and o4, can be obtained from specific statistics. Their average annual working hours of unit machinery to,y can be determined from the following equation:
![Energies 05 05126 i002]() wherein AW is the actual workloads of the farming operation; indicates the weighted average of unit productivity; WS refers to the workload statistics; lf is the load factor, which is used for describing the actual work intensity and is assumed to be proportional to the machinery power in unit area; oec is the other effect coefficient obtained from the Correction Module.
wherein AW is the actual workloads of the farming operation; indicates the weighted average of unit productivity; WS refers to the workload statistics; lf is the load factor, which is used for describing the actual work intensity and is assumed to be proportional to the machinery power in unit area; oec is the other effect coefficient obtained from the Correction Module.

Because workload statistics are not available for “other operations” (o5), in this study we assume that its average annual working hours of unit machinery to5 is constant. That constant is determined from the following equation:
![Energies 05 05126 i003]() wherein Cs,y indicates the diesel consumption statistics in year y.
wherein Cs,y indicates the diesel consumption statistics in year y.

2.4. Distribution Module
The mechanization of agriculture is a process of replacing human and animal with agricultural machinery powered by either diesel or electricity. The rated power is an important factor affecting the device performance of agricultural machinery. The rated power of the agricultural machinery is negatively correlated with its unit consumption (or motor efficiency) and is positively correlated with its unit productivity.
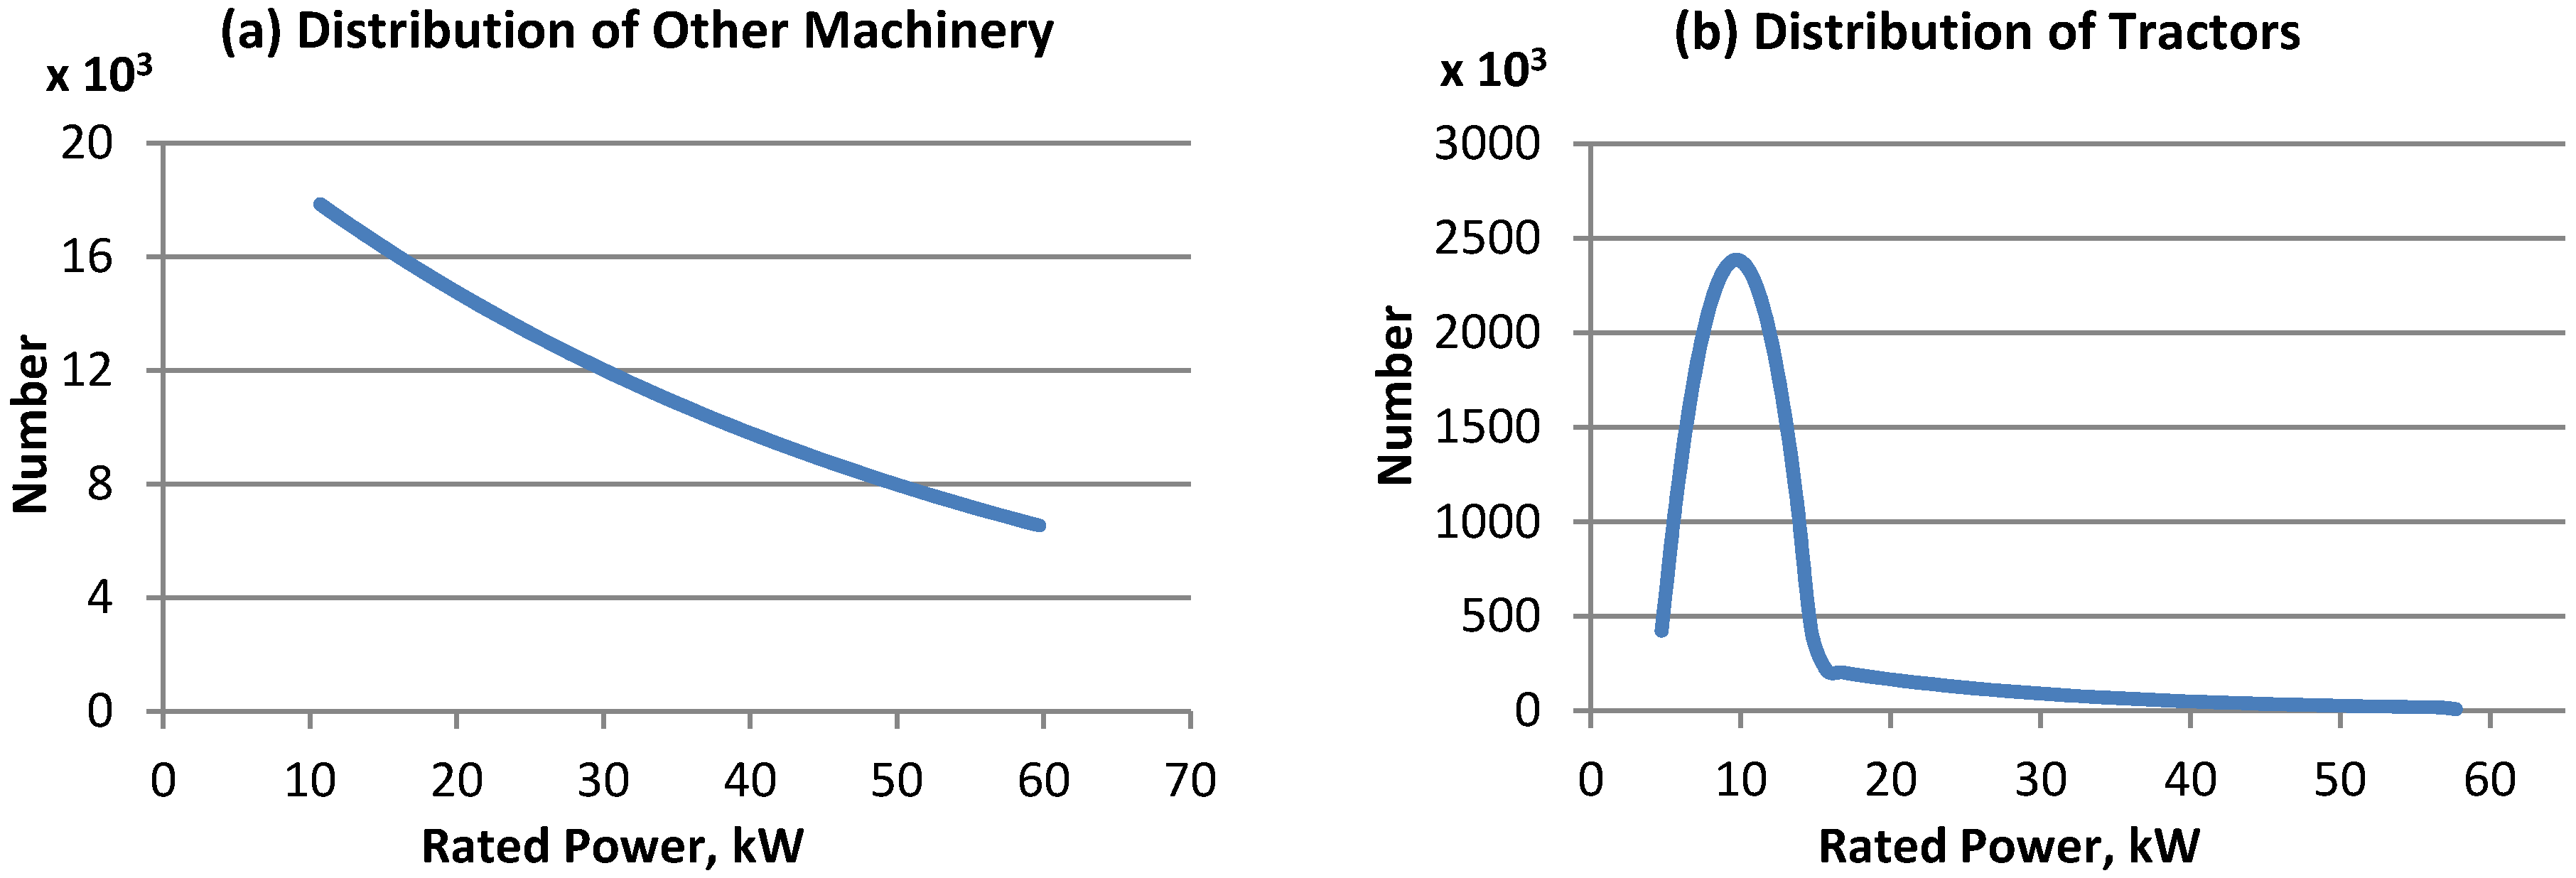
Smaller agricultural machinery are more widely used than larger equipment in China due to reasons such as the high cost of larger machinery and the small amount of arable land per capita. It is assumed that the change in the number li,m,y of agricultural machinery (except tractors) with the representative power pi,m,y of the interval i follows an exponential distribution as shown in Figure 2(a). The equation is expressed below:
wherein m indicates machinery category mentioned in the Distribution Module (m = m3,m4,…,m15); am,y and bm,y are the undetermined parameters.
Figure 2.
Distribution curves of the agricultural machinery with rated power.

In the Distribution Module, the most common power range (pbeginning,m,y, pend,m,y) of machinery is selected on the basis of experience and divided into n intervals. The midpoint of interval i as its representative power pi,m,y can be obtained using the following relationship:
![Energies 05 05126 i004]()

The total number of machinery Lm,y,c and the total power Pm,y,c can be obtained from statistics, so another two equations can be established:
Equations (4)–(7) should be solved simultaneously to estimate parameters am,y and bm,y. Then the number li,m,y of the agricultural machinery (excluding tractors) with the representative power pi,m,y in the interval i can be determined.
Tractors are the most common agricultural machinery and play an important role in mechanized agriculture in China. The number and total power of tractors increased from 9.86 million and 1.08 × 10⁸ kW in 1996 to 21.78 million and 2.84 × 10⁸ kW in 2010, with annual increases of 5.82% and 7.16%, respectively. The rated power of the main tractor models in Chinese market is between 8 and 12 kW, while in China’s Department of Statistics, the rated power for tractors starts from 2.2 kW, so in SECA, it is assumed that the number of large and medium-sized tractors, referring to tractors with power ratings greater than or equal to 14.7 kW, still follows an exponential distribution. On the other hand, the number of small tractors, referring to tractors less than 14.7 kW and greater than 2.2 kW, follows a parabolic distribution [Figure 2(b)]:
![Energies 05 05126 i005]() wherein cm,y is the undetermined parameter.
wherein cm,y is the undetermined parameter.

Another equation is established as follow in order to ensure the continuity of Equations (8) and (9):
Equations (5)–(10) should be solved simultaneously to estimate parameter am,y, bm,y and cm,y. Then the number of tractors with the representative power in the interval i can be determined.
2.5. Unit Consumption Module and Productivity Module
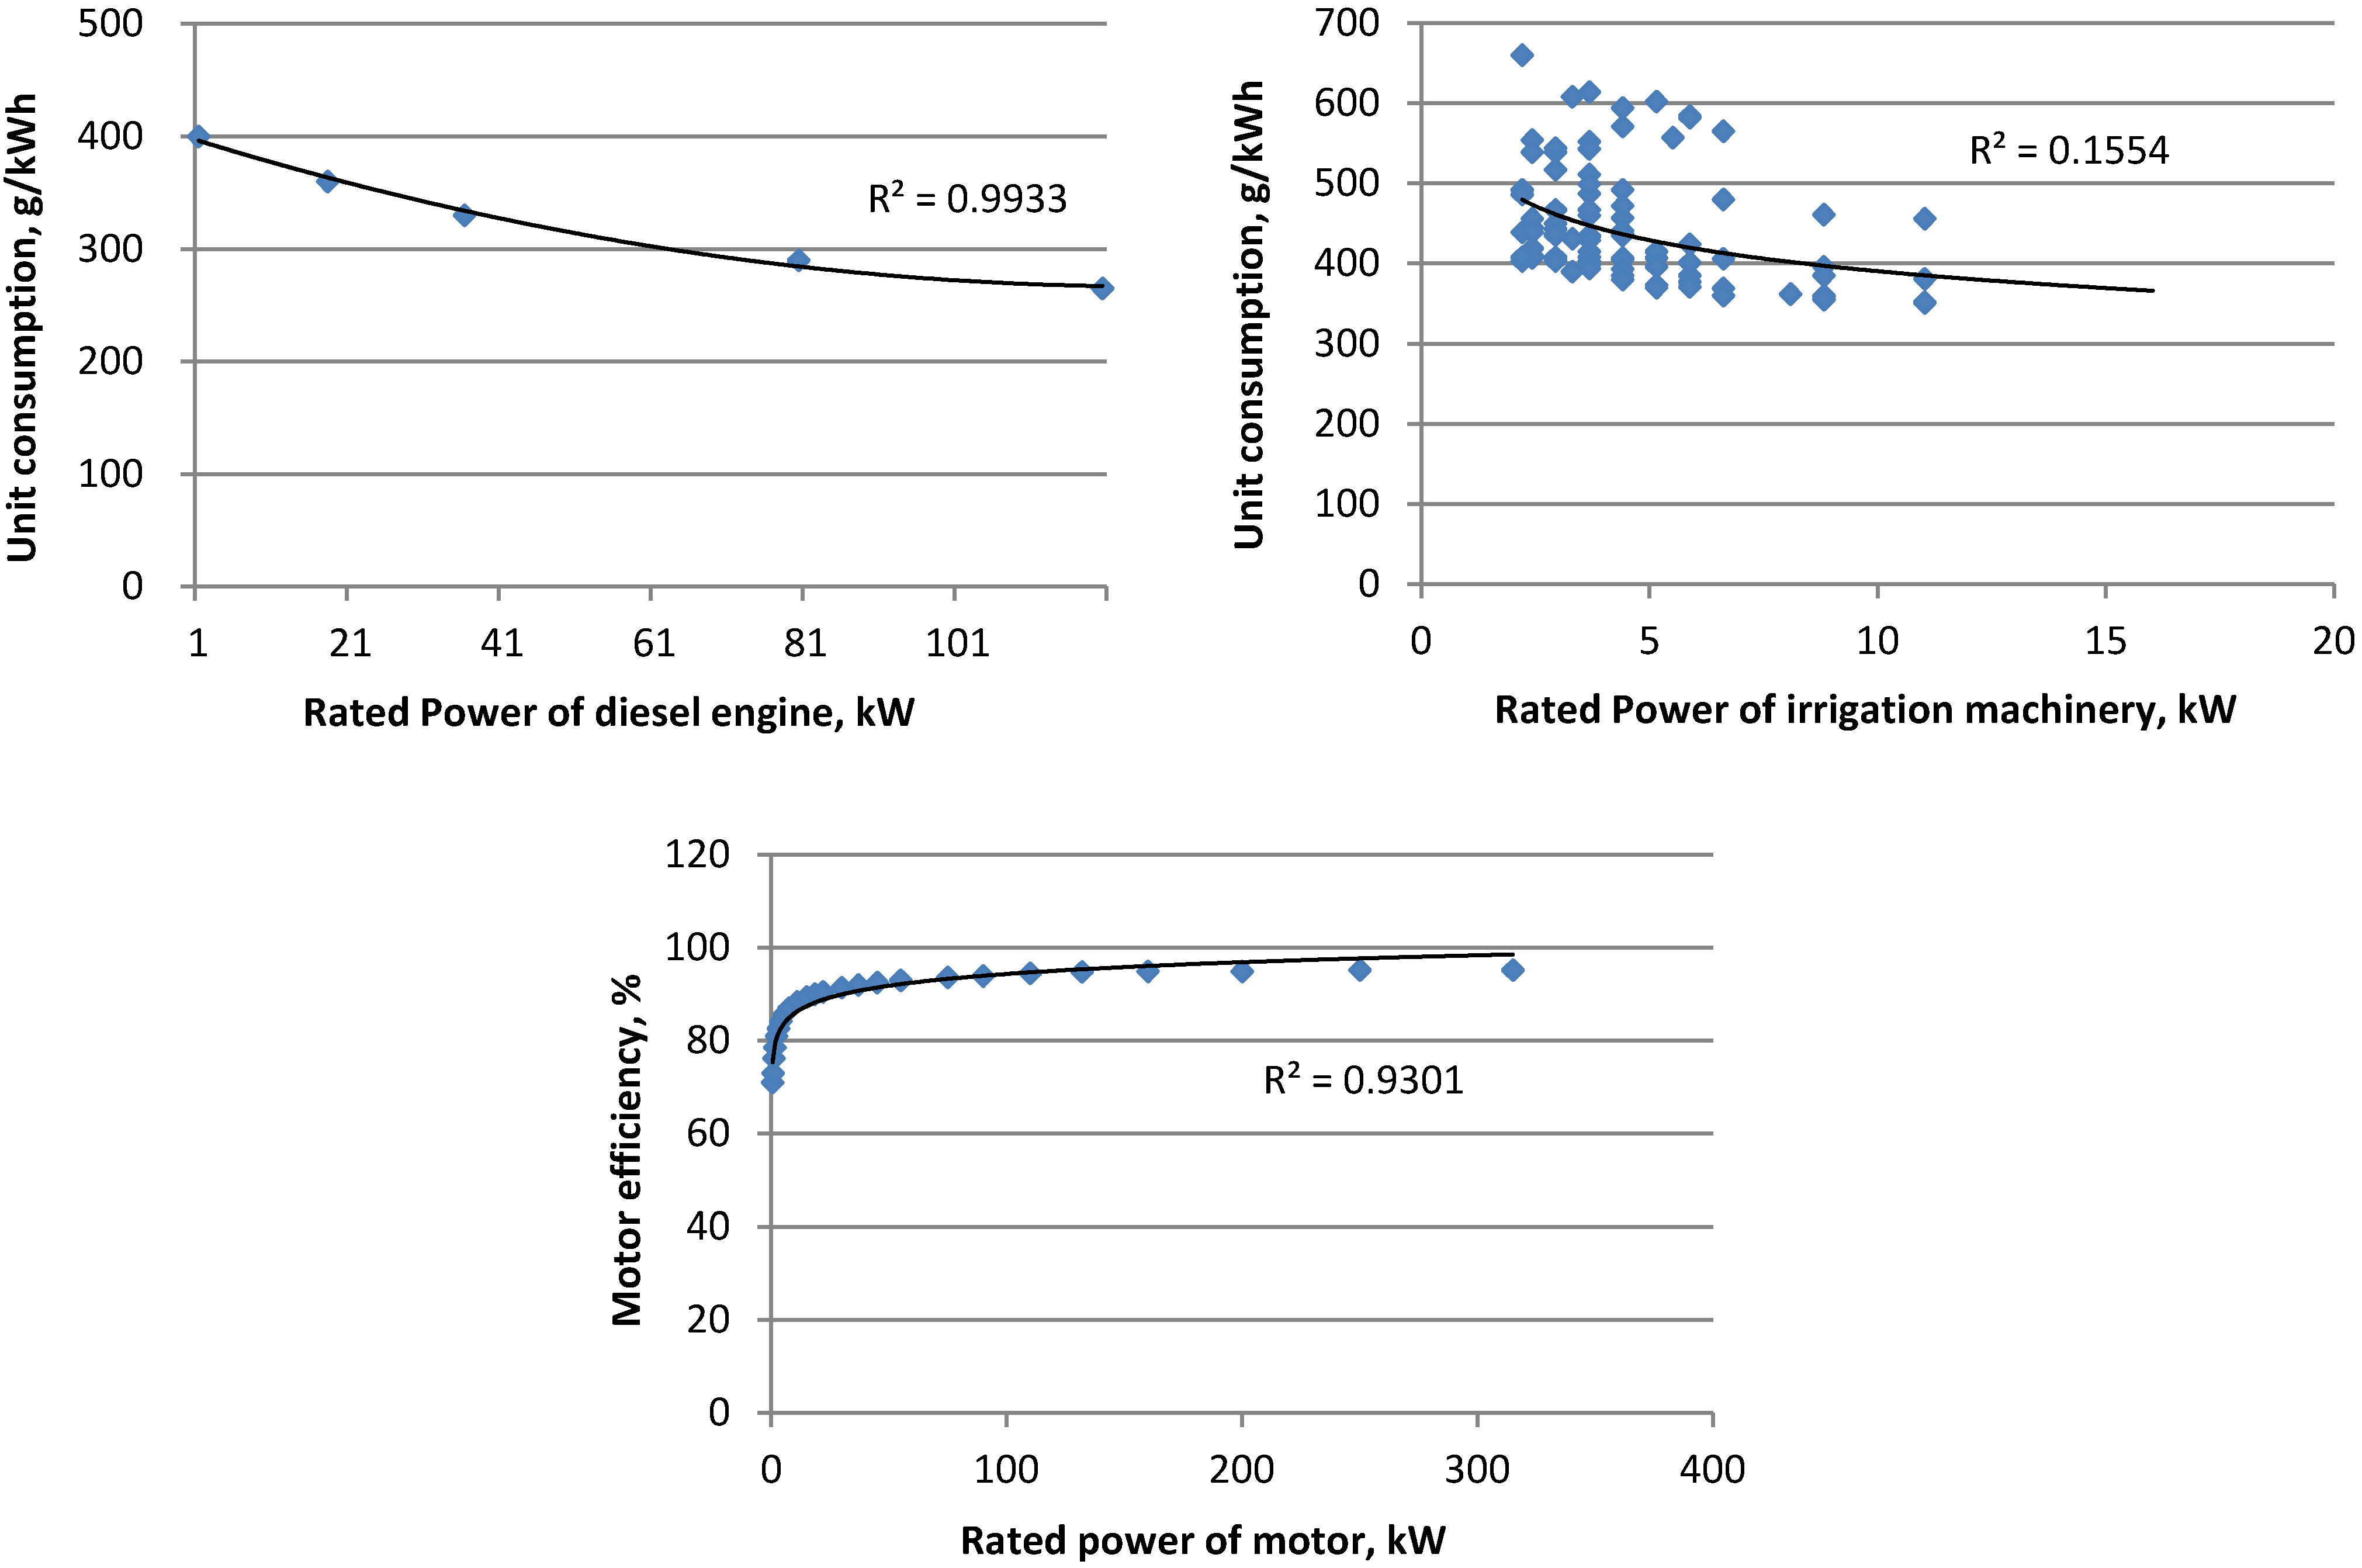
Unit consumption (or motor efficiency) and productivity of agricultural machinery are both functions of the machinery’s rated power. The simulation results from the Distribution Module are processed by the Operation Module and then output into the Unit Consumption Module and the Productivity Module which generate the weighted average of unit consumption and that of productivity. The data describing the relationship between the input and output of the functions are collected from the relevant national standards of China and product manuals of those agricultural machinery [15,16]. They are fitted by the least square method (Figure 3 and Figure 4).
The fitting equation of the unit consumption is as follows:
![Energies 05 05126 i006]()

Figure 3.
Fitting curves of the unit consumption.

The unit productivity for each operation is estimated using the following equations:
![Energies 05 05126 i007]()

Figure 4.
Fitting curves of the unit productivity.

As the output in the Unit Consumption Module and the Productivity, the weighted averages of unit consumption and productivity are obtained according to the following relationships:
![Energies 05 05126 i008]()
![Energies 05 05126 i009]() wherein tpcuc and tpcup are the technological progress coefficients obtained from the Correction Module.
wherein tpcuc and tpcup are the technological progress coefficients obtained from the Correction Module.


2.6. Correction Module
Technological progress and other effects are considered in the Correction Module to narrow the gap between the statistics and the model calculations in the Main Module. The correction coefficient is the correction on the basic assumptions in the other modules of SECA. These assumptions which are either explicit or implicit include:
- In the Unit Consumption Module, the weighted average of unit consumption changes without being affected by the technological progress.
- In the Productivity Module, the weighted average of unit productivity changes without being affected by the technological progress.
- In the Main Module, the load factor is proportional to the machinery power in unit area.
- In the Main Module, the average annual working hours of the other operation is constant the value of which remains unchanged over the year.
The correction coefficient coc can be calculated with the following relationship:
The correction coefficient coc can be divided into two parts: technological progress coefficient tpc and the other effect coefficient oec. The relationship between coc, tpc and oec is assumed to following equation:
Technological progress is typically accompanied with the reduction of the unit consumption and the increase of the unit productivity. The relationship between tpc, tpcuc and tpcup is assumed according to Equation (17):
The other effect coefficient oec mainly works on the load factor lf mentioned in the Main Module. The other effect coefficient oec means that the load factor is not proportional to machinery power in unit area any longer. In short, we can conclude that technological progress leads to the reduction of average unit consumption and changes in working hours result from the changes in unit productivity and load factor.
3. Data Sources
The data related to the agricultural land, machinery and energy consumption in this paper are mainly obtained from the China Statistical Yearbook [17], China Energy Statistical Yearbook [18], China Rural Statistical Yearbook [19] and China Agriculture Statistical Report [20]. The first three data resources are published by the National Bureau of Statistics of China and the last one is published by the Ministry of Agriculture of China.
The data related to land and water resources in this paper are given by the China Land and Resources Bulletin [21] and the China Water Resources Bulletin [22]. The former is published by the Ministry of Land and Resources of China, and its data, especially the farmland area data, are more reliable than the other data sources [23]. The latter is published by the Ministry of Water Resources of China.
Table A1 in the Appendix presents the workload statistics of four operations: i.e., mechanized tillage, mechanized sowing, mechanized harvesting and mechanized irrigation. Considering that parts of the land are repeatedly cultivated in a year, a re-seeding coefficient (the ratio of sowing area to tillage area) is introduced to correct the workload statistic of the mechanized tillage when the data are input into the model. Table A2 presents the number and the total power of the agricultural machinery mentioned in this study.
4. Results and Discussion
4.1. Changes of Correction Coefficient
Figure 5 presents the changes of the correction coefficient. The correction coefficient has declined from 1.37 in 1996 to 0.84 in 2010, with an average annual decline of 3.46%. The decline in the correction coefficient proves that technological progress has been affecting the unit diesel consumption and the unit productivity of the agricultural machinery positively. One also can find that the load factor has not been growing as expected.
Figure 5.
Correction coefficient and diesel consumption statistics.

The curve of the correction coefficient shows a significant linear downward trend. However, there are step changes in the correction coefficient corresponding to the step changes in the diesel consumption from 2004 to 2007. The step changes of the energy consumption statistics are widespread in most sectors during the Eleventh Five-Year period including the diesel consumption in agriculture. According to careful analysis, it is believed that the step changes cannot reflect the real energy consumption, and they probably result from either changes in statistical methodology or artificially adjusted energy consumption numbers. The latter is more likely the main reason due to the existence of the compulsory target for reducing energy consumption stated in the Eleventh Five-Year Plan of China government, so the correction coefficients from 2004 to 2007 are corrected using linear interpolation.
4.2. Changes of Unit Consumption
Table 2 provides the unit diesel consumption of agricultural machinery. The unit diesel consumption generally maintained a steady downward trend from 1996 to 2010.
- For tractors, the unit diesel consumption declined from 407.96 g/kWh in 1996 to 356.93 g/kWh in 2010, an average annual decline of 0.95%.
- For harvesters, it declined from 423.67 g/kWh to 352.70 g/kWh, an annual decline of 1.30%.
- For irrigation machinery, it declined from 450.99 g/kWh to 401.25 g/kWh, an annual decline of 0.83%.
- For primary processing machinery, it declined from 411.91 g/kWh to 364.70 g/kWh, an annual decline of 0.87%.
- For animal husbandry machinery, it declined from 426.16 g/kWh to 375.13 g/kWh, an annual decline of 0.91%.
- For fishery machinery, it declined from 383.17 g/kWh to 328.06 g/kWh, an annual decline of 1.10%.
- For forestry machinery, it declined from 414.97 g/kWh to 370.71 g/kWh, an annual decline of 0.80%.
- For transportation machinery, it declined from 408.68 g/kWh to 352.89 g/kWh, an annual decline of 1.04%.
- For farmland construction machinery, it declined from 338.56 g/kWh to 297.35 g/kWh, an annual decline of 0.92%.
| Year | Tractors | Harvesters | Machinery | ||||||
|---|---|---|---|---|---|---|---|---|---|
| Irrigation | Primary Processing | Animal Husbandry | Fishery | Forestry | Transportation | Farmland Construction | |||
| 1996 | 407.96 | 423.67 | 450.99 | 411.91 | 426.16 | 383.17 | 414.97 | 408.68 | 338.56 |
| 1997 | 405.21 | 419.81 | 446.92 | 408.40 | 422.47 | 374.80 | 412.29 | 404.72 | 344.16 |
| 1998 | 406.88 | 420.81 | 449.53 | 410.07 | 424.14 | 373.89 | 414.53 | 405.75 | 348.48 |
| 1999 | 397.07 | 409.81 | 439.71 | 400.63 | 414.33 | 362.89 | 405.37 | 395.98 | 339.26 |
| 2000 | 389.93 | 402.37 | 432.35 | 393.59 | 406.36 | 358.04 | 397.80 | 388.52 | 330.26 |
| 2001 | 388.29 | 399.76 | 430.27 | 392.30 | 405.35 | 357.19 | 398.05 | 386.61 | 325.88 |
| 2002 | 383.16 | 394.04 | 425.47 | 386.99 | 400.21 | 353.13 | 391.89 | 381.17 | 318.80 |
| 2003 | 382.76 | 391.78 | 425.62 | 386.70 | 399.85 | 350.62 | 394.08 | 380.37 | 315.59 |
| 2004 | 379.09 | 386.31 | 421.85 | 383.29 | 396.51 | 349.70 | 386.81 | 376.77 | 311.79 |
| 2005 | 375.32 | 380.44 | 418.10 | 379.67 | 392.81 | 342.10 | 385.62 | 372.60 | 307.53 |
| 2006 | 371.08 | 373.16 | 414.74 | 376.20 | 389.43 | 340.16 | 382.12 | 369.09 | 318.42 |
| 2007 | 367.09 | 367.66 | 411.02 | 372.58 | 385.57 | 336.61 | 378.09 | 365.04 | 312.34 |
| 2008 | 362.76 | 360.42 | 406.74 | 368.98 | 380.35 | 332.78 | 373.67 | 359.09 | 306.54 |
| 2009 | 359.45 | 355.74 | 403.54 | 366.50 | 377.30 | 330.13 | 372.37 | 355.66 | 301.60 |
| 2010 | 356.93 | 352.70 | 401.25 | 364.70 | 375.13 | 328.06 | 370.71 | 352.89 | 297.35 |
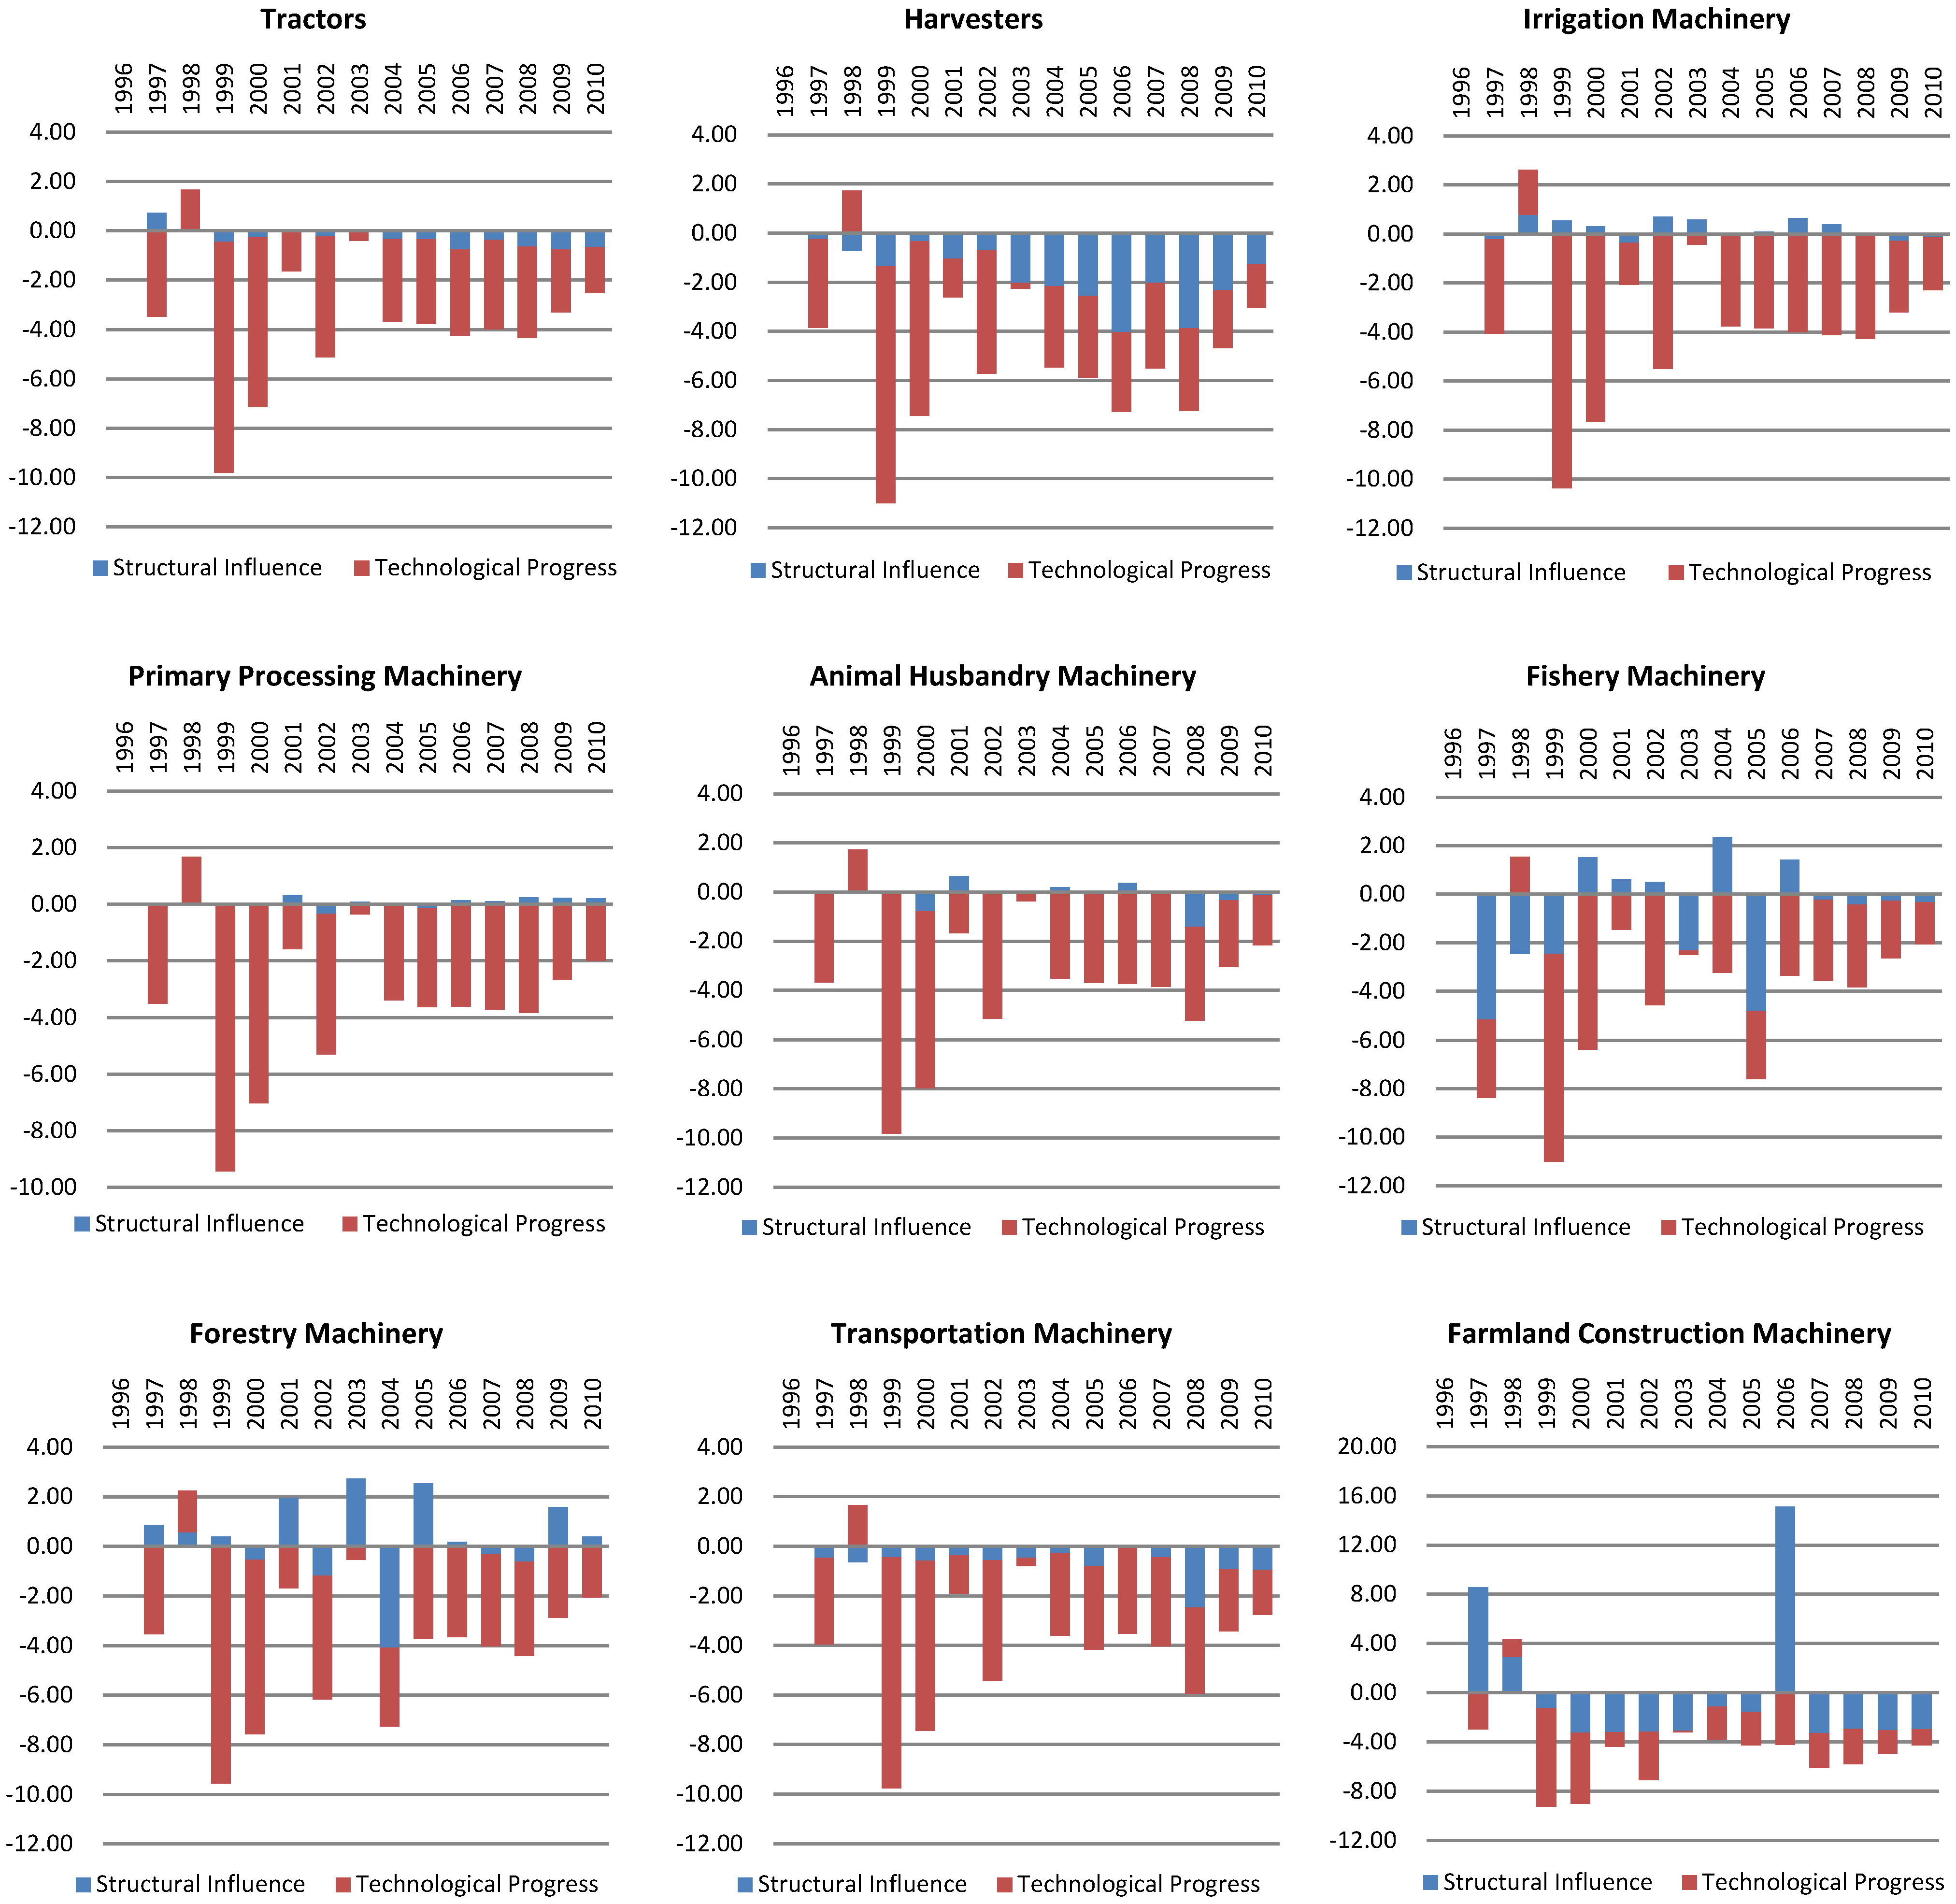
Figure 6 shows the changes in the unit diesel consumption compared with that in the previous year. The red part shows the changes in the unit diesel consumption caused by technological progress. The blue part displays the changes in the unit diesel consumption caused by changes in machinery quantity at different intervals (structural influence). It is obvious that the effect of the technological progress plays a major role in almost all agricultural machinery. It can be predicted that the trend will not change in the foreseeable future. However, the effect of technological progress is no longer significant for some machinery with low unit diesel consumption, such as farmland construction machinery.
Another way to reduce unit diesel consumption is to adjust the structure of the distribution of agricultural machinery. Results show that most of the agricultural machinery, such as tractors, harvesters, animal husbandry machinery, fishery machinery, transportation machinery and farmland construction machinery are becoming larger in size and lower in unit diesel consumption with the development of the agricultural economy. This is not the case for irrigation machinery, primary processing machinery and forestry machinery.
Figure 6.
Changes in unit diesel consumption compared with that in the previous year.

4.3. Changes of Unit Productivity
Table 3 shows the unit productivity of the four mechanized operations. The unit productivity generally maintained a steady upward trend from 1996 to 2010:
- The unit productivity of the mechanized tillage increased from 0.08 ha/h in 1996 to 0.10 ha/h in 2010, an average annual increase of 1.86%.
- The unit productivity of the mechanized sowing increased from 0.25 ha/h to 0.30 ha/h, an average annual increase of 1.27%.
- The unit productivity of the mechanized harvesting increased from 0.06 ha/h to 0.19 ha/h, an average annual increase of 8.13%, which is the largest growth rate in these four operations.
- The unit productivity of the mechanized irrigation increased from 74.41 m3/h to 79.87 m3/h, an average annual increase of 0.51%.
| Year | Mechanized Tillage (ha/h) | Mechanized Sowing (ha/h) | Mechanized Harvesting (ha/h) | Mechanized Irrigation (m3/h) |
|---|---|---|---|---|
| 1996 | 0.08 | 0.25 | 0.06 | 74.41 |
| 1997 | 0.08 | 0.25 | 0.06 | 75.35 |
| 1998 | 0.08 | 0.25 | 0.07 | 74.01 |
| 1999 | 0.08 | 0.26 | 0.07 | 75.03 |
| 2000 | 0.08 | 0.26 | 0.07 | 75.95 |
| 2001 | 0.08 | 0.26 | 0.08 | 76.74 |
| 2002 | 0.08 | 0.27 | 0.08 | 76.77 |
| 2003 | 0.08 | 0.27 | 0.09 | 76.05 |
| 2004 | 0.09 | 0.27 | 0.10 | 76.75 |
| 2005 | 0.09 | 0.28 | 0.12 | 77.33 |
| 2006 | 0.09 | 0.28 | 0.13 | 77.17 |
| 2007 | 0.09 | 0.29 | 0.15 | 77.40 |
| 2008 | 0.09 | 0.29 | 0.17 | 78.30 |
| 2009 | 0.10 | 0.30 | 0.18 | 79.28 |
| 2010 | 0.10 | 0.30 | 0.19 | 79.87 |
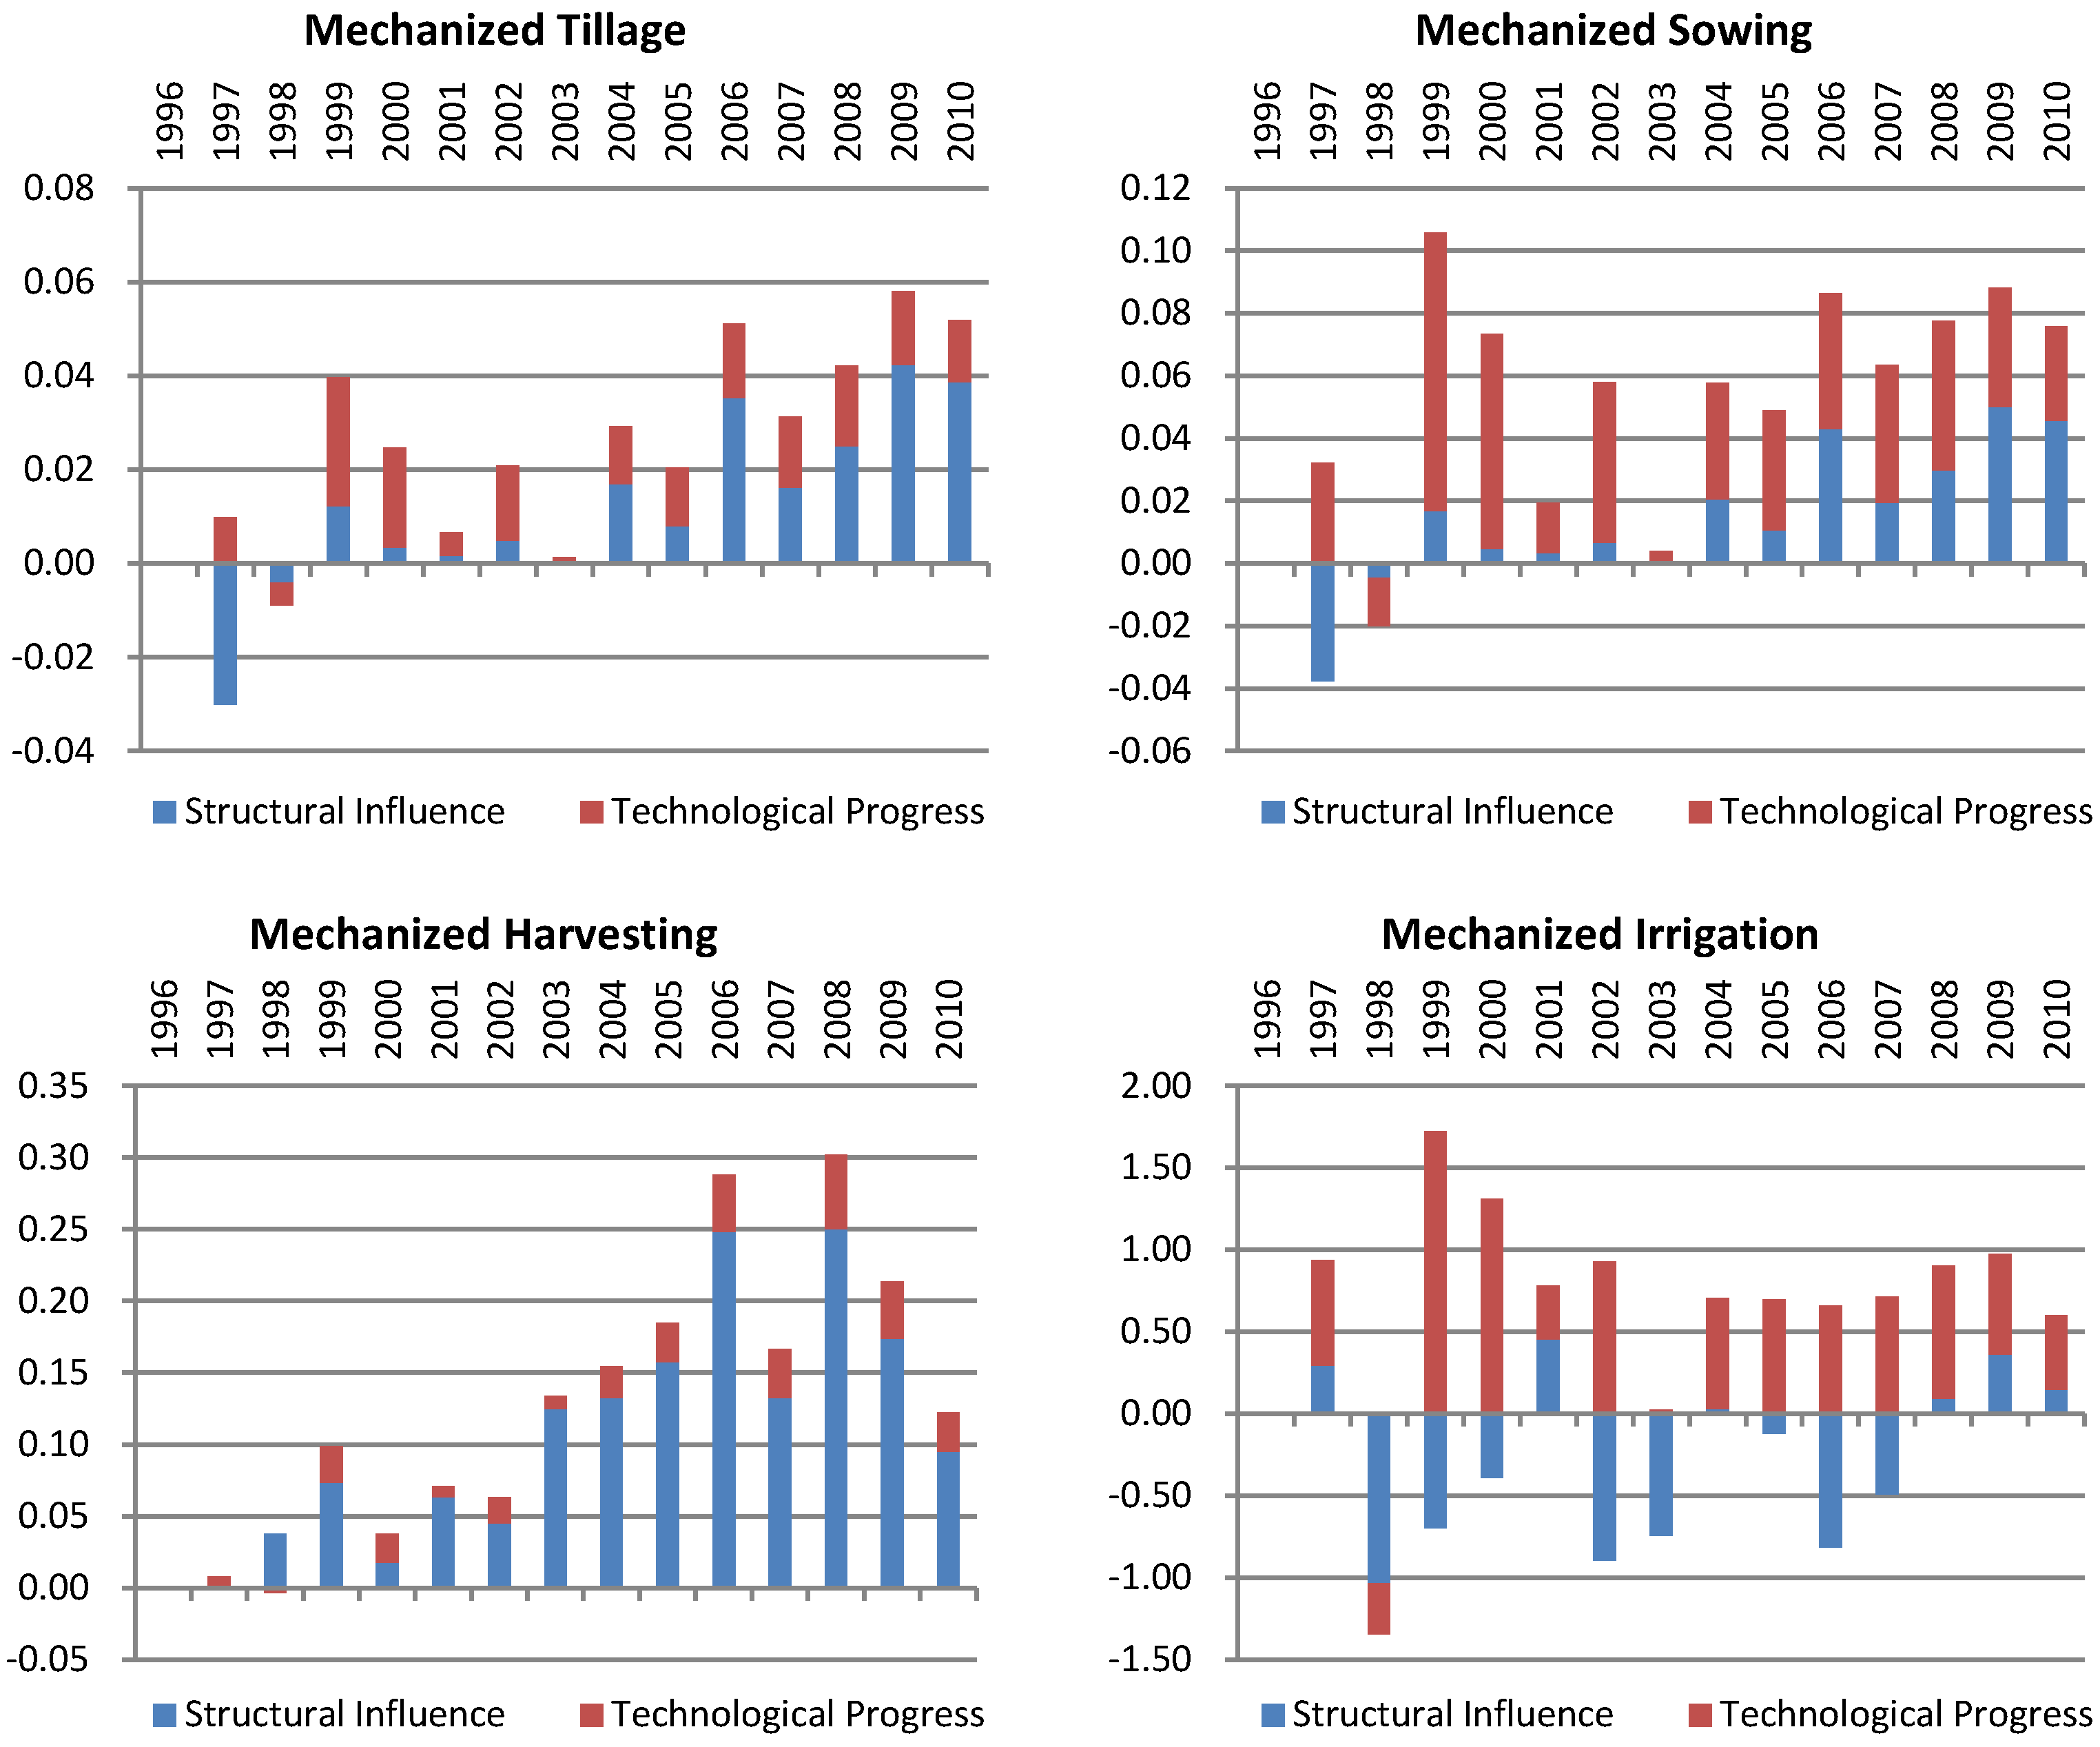
Figure 7 shows the changes in unit productivity compared with that in the previous year. The red part indicates changes in unit productivity caused by technological progress. The blue part indicates changes in unit productivity caused by changes in machinery quantity at different intervals (structural influence).
Basically, technological progress has a positive influence on changes in the unit productivity of four operations. Improvement of unit productivity in mechanized harvesting is less than that in the other operations.
Structural adjustments to the machinery number caused an increase in the unit productivity of mechanized tillage, mechanized sowing and mechanized harvesting. Moreover, it also enables the unit productivity of the mechanized irrigation to decrease gradually with average rated power.
Figure 7.
Changes in the unit productivity compared with that in the previous year.

4.4. Changes of Working Hours
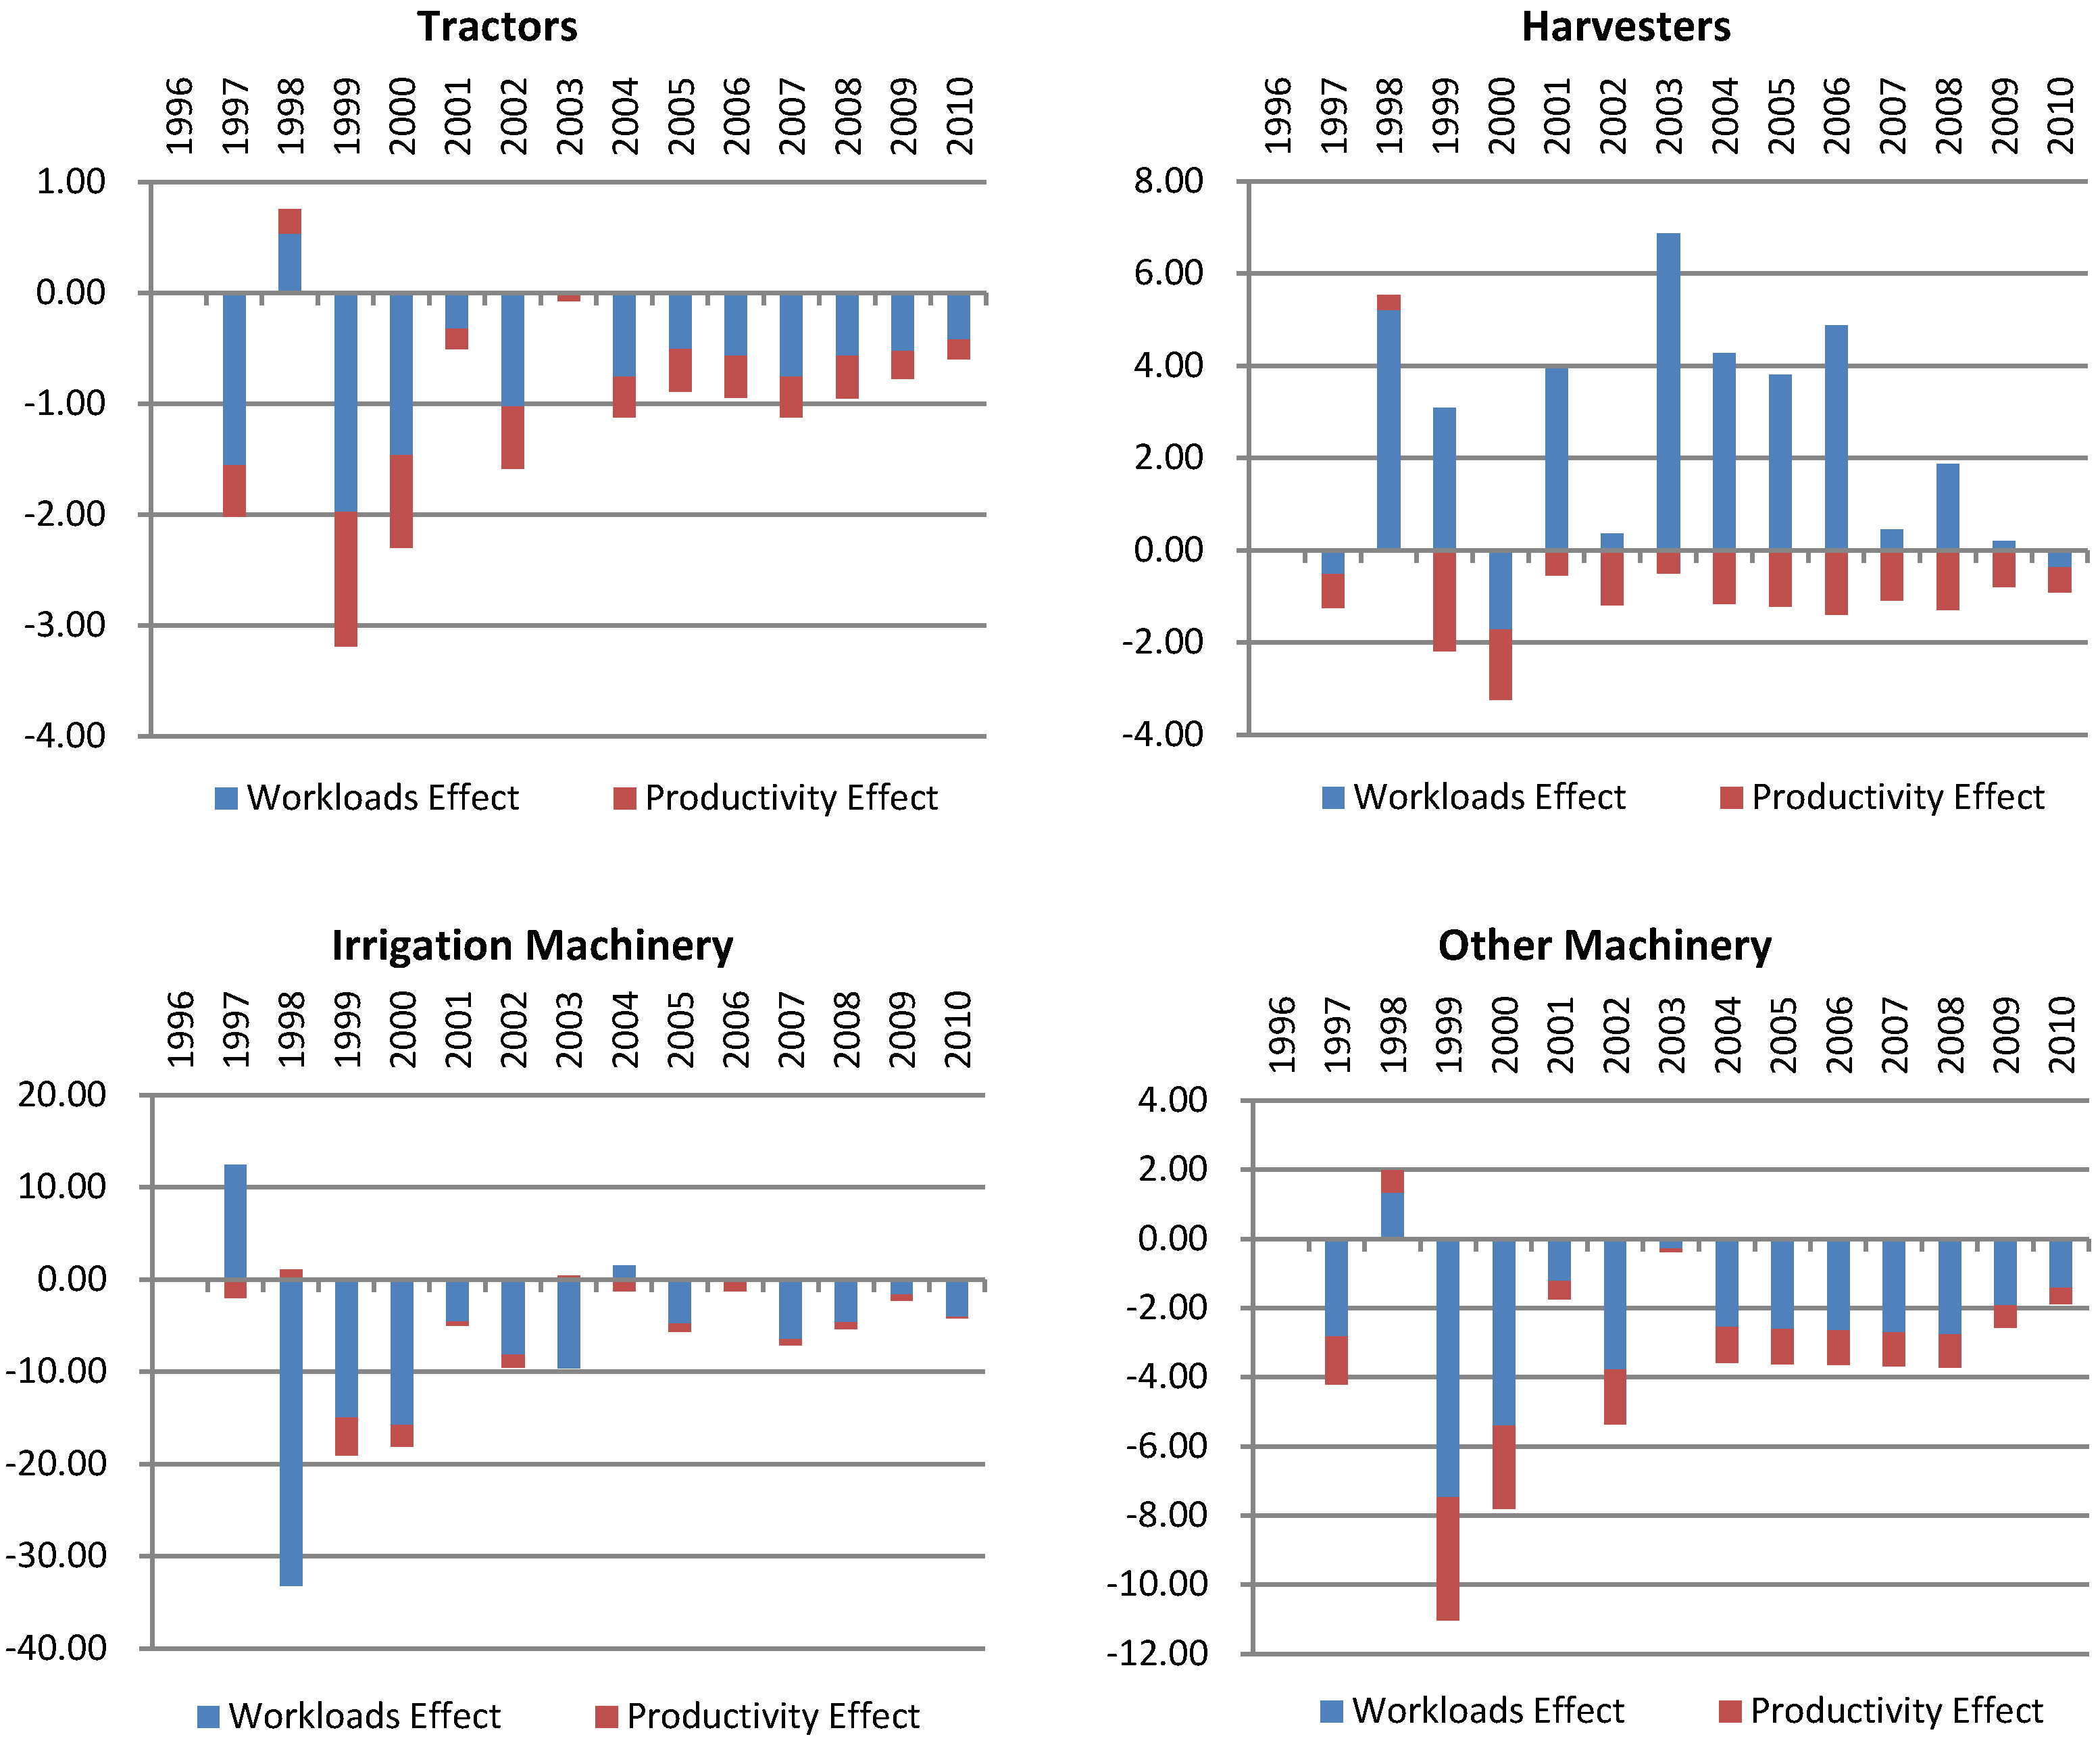
Table 4 shows the average annual working hours of agricultural machinery. Almost all average annual working hours of the agricultural machinery show a decreasing trend from 1996 to 2010, except for harvesters.
- The average annual working hours of the tractors declined from 56.33 h in 1996 to 41.00 h in 2010, an average annual decline of 2.24%.
- The average annual working hours of the harvesters increased from 87.19 h to 105.65 h, an average annual increase of 1.38%.
- The average annual working hours of the irrigation machinery declined from 217.24 h to 109.06 h, an average annual decline of 4.80%.
- The average annual working hours of the other machinery declined from 165.70 h to 114.43 h, an average annual decline of 2.74%.
Figure 8 shows the changes in annual average working hours compared with that in the previous year. The changes in average annual working hours could be caused by changes in actual workloads and changes in the unit productivity. In Figure 8, they are indicated by the red part and the blue part, respectively.
There is no doubt that an increase in unit productivity leads to a reduction in working hours. This is the case for all kinds of agricultural machinery. However, its effect is negligible compared with the effect caused by changes of actual workloads.
| Year | Tractors | Harvesters | Irrigation Machinery | Other Machinery |
|---|---|---|---|---|
| 1996 | 56.33 | 87.19 | 217.24 | 165.70 |
| 1997 | 54.31 | 85.94 | 227.71 | 161.50 |
| 1998 | 55.07 | 91.48 | 195.59 | 163.48 |
| 1999 | 51.88 | 92.38 | 176.55 | 152.45 |
| 2000 | 49.58 | 89.13 | 158.42 | 144.64 |
| 2001 | 49.07 | 92.53 | 153.42 | 142.90 |
| 2002 | 47.49 | 91.69 | 143.85 | 137.53 |
| 2003 | 47.42 | 98.06 | 134.68 | 137.14 |
| 2004 | 46.29 | 101.17 | 134.90 | 133.55 |
| 2005 | 45.40 | 103.76 | 129.25 | 129.93 |
| 2006 | 44.45 | 107.22 | 127.96 | 126.28 |
| 2007 | 43.33 | 106.57 | 120.87 | 122.59 |
| 2008 | 42.38 | 107.16 | 115.53 | 118.86 |
| 2009 | 41.60 | 106.56 | 113.22 | 116.30 |
| 2010 | 41.00 | 105.65 | 109.06 | 114.43 |
Figure 8.
Changes in the annual average working hours compared with that in the previous year.

Due to the effect of actual workloads, working hours of the tractors, irrigation machinery and other machinery continue to decline from 1996 to 2010. The harvesting machinery is the only one whose working hours have increased. This means that the total power of the agricultural machinery (excluding harvesters) grew faster than the actual workloads. Subsidies policy for purchasing agricultural machines upon 2004 results in the massive growth of the agricultural machinery at the expense of the waste of partial production capacity. Furthermore, economic life of most agricultural machinery does not exceed 15 years in China and a large number of scrapped agricultural machinery need to be recycle every year. Chinese energy policy maker should pay attention to this problem. Some materials such as aluminum and steel, are easily recyclable and thus their post-consumer recycling takes much less energy than production of finished materials from virgin feedstocks [24,25].
In addition, the average annual working hours of agricultural machinery powered by electricity is about 500–600 h in China. It is significantly higher than the working hours of machinery powered by diesel. It is believed that instability of the diesel supply and rising prices are the reasons for the low utilization rate of diesel machinery.
4.5. Diesel Flows in Agriculture
Table 5 shows diesel consumption in different sectors of agriculture in China from 1996 to 2010.
- Diesel consumption in four farming operations increased from 652.31 × 10⁴ ton in 1996 to 884.01×10⁴ ton in 2010, with an annual increase of 2.19%. In these four operations, the mechanized harvesting has the largest annual growth rate (i.e., 19.39%) of the diesel consumption. The annual growth rates of mechanized tillage and mechanized sowing are 3.68% and 4.28%, respectively, which are slightly higher than the average level among all farming operations. Slight negative growth in the diesel consumption of mechanized irrigation was witnessed in the past thirteen years.
- Diesel consumption by primary processing increased from 107.88 × 10⁴ ton in 1996 to 111.78 × 10⁴ ton in 2010, with an annual increase of 0.25%.
- Diesel consumption by animal husbandry increased from 8.07 × 10⁴ ton in 1996 to 17.87 × 10⁴ ton in 2010, with an annual increase of 5.84%.
- Diesel consumption by fishery increased from 54.86 × 10⁴ ton in 1996 to 68.35 × 10⁴ ton in 2010, with an annual increase of 1.58%.
- Diesel consumption by forestry increased from 0.31 × 10⁴ ton in 1996 to 3.95 × 10⁴ ton in 2010, with an annual increase of 20.07%.
- Diesel consumption by transportation increased from 238.74 × 10⁴ ton in 1996 to 860.53 × 10⁴ ton in 2010, with an annual increase of 9.59%.
- Diesel consumption by farmland construction increased from 13.94 × 10⁴ ton in 1996 to 76.61 × 10⁴ ton in 2010, with an annual increase of 12.94%.
| Year | Farming | Primary Processing | Animal Husbandry | Fishery | Forestry | Transportation | Farmland Construction | ||||
|---|---|---|---|---|---|---|---|---|---|---|---|
| Total | Mechanized Tillage | Mechanized Sowing | Mechanized Harvesting | Mechanized Irrigation | |||||||
| 1996 | 652.31 | 214.53 | 33.76 | 13.61 | 390.40 | 107.88 | 8.07 | 54.86 | 0.31 | 238.74 | 13.94 |
| 1997 | 713.39 | 225.42 | 34.92 | 16.22 | 436.83 | 110.28 | 8.14 | 65.40 | 0.23 | 317.59 | 14.37 |
| 1998 | 699.85 | 245.02 | 37.87 | 21.38 | 395.58 | 117.83 | 9.49 | 71.79 | 0.21 | 399.54 | 16.00 |
| 1999 | 692.02 | 245.79 | 38.22 | 24.94 | 383.07 | 118.24 | 10.40 | 69.33 | 0.21 | 447.28 | 16.82 |
| 2000 | 672.33 | 248.06 | 38.63 | 27.25 | 358.39 | 120.66 | 11.23 | 69.32 | 0.71 | 508.50 | 22.26 |
| 2001 | 688.59 | 249.97 | 38.95 | 31.32 | 368.36 | 124.17 | 11.26 | 70.42 | 0.74 | 561.88 | 28.25 |
| 2002 | 668.75 | 248.18 | 38.76 | 34.91 | 346.90 | 123.14 | 12.09 | 67.08 | 0.98 | 602.70 | 32.76 |
| 2003 | 663.40 | 255.74 | 39.95 | 47.13 | 320.59 | 126.51 | 12.74 | 68.56 | 1.24 | 663.72 | 38.43 |
| 2004 | 693.71 | 266.36 | 41.98 | 55.06 | 330.32 | 120.78 | 12.89 | 64.65 | 1.59 | 705.20 | 42.67 |
| 2005 | 716.95 | 278.87 | 44.12 | 67.89 | 326.07 | 123.50 | 13.90 | 61.17 | 1.71 | 750.62 | 49.00 |
| 2006 | 747.16 | 290.89 | 46.86 | 83.09 | 326.32 | 121.20 | 13.70 | 64.36 | 1.91 | 743.74 | 57.19 |
| 2007 | 752.66 | 298.75 | 48.51 | 93.26 | 312.14 | 119.74 | 13.98 | 66.24 | 2.28 | 758.98 | 62.37 |
| 2008 | 803.33 | 327.90 | 53.90 | 113.20 | 308.33 | 116.04 | 17.27 | 66.43 | 2.66 | 810.93 | 71.23 |
| 2009 | 847.41 | 341.90 | 57.33 | 137.69 | 310.49 | 113.58 | 17.53 | 67.14 | 3.22 | 835.99 | 75.03 |
| 2010 | 884.01 | 355.64 | 60.69 | 162.68 | 304.99 | 111.78 | 17.87 | 68.35 | 3.95 | 860.53 | 76.61 |
Figure 9 shows the diesel flows of the agriculture in China. It is obvious that farming and transportation are the two largest diesel consumers, while other sectors account for a negligible share. From 1996 to 2010, diesel consumption by farming grew smoothly while diesel consumption by transportation grew sharply. Transportation consumed nearly half of the total diesel in 2010 and its share can be expected to continue to grow in the future.
Figure 9.
Diesel flows of the agriculture in China.

4.6. Diesel Consumption Intensity
| Year | Mechanized Tillage | Mechanized Sowing | Mechanized Harvesting | Mechanized Irrigation |
|---|---|---|---|---|
| 1996 | 33.47 | 10.46 | 7.49 | 598.99 |
| 1997 | 34.16 | 10.19 | 7.90 | 607.62 |
| 1998 | 34.12 | 9.90 | 9.16 | 586.66 |
| 1999 | 32.66 | 9.51 | 9.75 | 567.48 |
| 2000 | 32.53 | 9.61 | 10.22 | 533.29 |
| 2001 | 32.84 | 9.49 | 11.66 | 552.11 |
| 2002 | 32.89 | 9.34 | 12.77 | 517.31 |
| 2003 | 33.89 | 9.79 | 17.19 | 476.54 |
| 2004 | 33.35 | 9.47 | 18.05 | 496.21 |
| 2005 | 33.00 | 9.36 | 19.73 | 483.05 |
| 2006 | 33.74 | 9.38 | 21.70 | 476.45 |
| 2007 | 33.11 | 9.20 | 22.11 | 443.55 |
| 2008 | 33.06 | 9.16 | 23.89 | 420.89 |
| 2009 | 32.72 | 8.82 | 25.83 | 416.73 |
| 2010 | 31.90 | 8.80 | 27.27 | 400.19 |
Table 6 shows diesel consumption intensity in different operations from 1996 to 2010. Little change occurred to the diesel consumption intensity of mechanized tillage and its value remained at around 33 kg/ha. The diesel consumption intensity of mechanized sowing declined slightly from 10.46 kg/ha in 1996 to 8.80 kg/ha. By an annual growth rate of 9.99%, the diesel consumption intensity of mechanized harvesting increased rapidly from 7.49 kg/ha in 1996 to 27.27 kg/ha in 2010. Because of the popularity of irrigation machinery powered by electricity, the diesel consumption intensity of mechanized irrigation which is far more than that of other operations declined from 598.99 kg/ha in 1996 to 400.19 kg/ha in 2010, with an annual decrease of 2.75%.
5. Conclusions
This study is a fundamental research for establishing the agricultural energy demand forecasting model. The simulation results demonstrate that the methodology used in this study is proper and accurate. The conclusions and the relevant policy recommendations are summarized as follows:
- For agriculture in China, farming and transportation are the two largest diesel consumers, accounting for 86.23% of the total diesel consumption in agriculture in 2010, while the other sectors account for a negligible share. Differing from the farming in this respect, more attention should be paid to the fast growth of the diesel consumption in the transportation in the forecasting model.
- Technological progress positively affected unit diesel consumption and the unit productivity of all machinery from 1996 to 2010. However, there is great potential in reducing unit diesel consumption and increasing unit productivity. The Chinese government should continue to promote technological progress and to improve in the field of mechanized agriculture.
- With the development of the agricultural economy, most of the agricultural machinery becomes larger and larger in size, more diesel fuel efficient and productive. However, irrigation machinery has proved to be an exception. Diesel consumption in mechanized agriculture can be reduced by preventing the miniaturization trend of irrigation machinery and raising the proportion of the medium-sized and large-scale agricultural machinery.
- The annual average working hours of the agricultural machinery (except harvesters) continue to decline from 1996 to 2010. Subsidies policy for purchasing agricultural machines upon 2004 leads to the massive growth of the agricultural machinery at the expense of the waste of the partial production capacity. This means that machinery sits idle in the yard for most of the time. Although this may not directly affect diesel fuel consumption, it directs resources to the manufacturing of agricultural machinery and increases the cost of the agricultural production.
- The annual average working hours of the agricultural machinery powered by diesel are about 40–120 h which is much fewer than that of agricultural machinery powered by electricity (i.e., 500–600 h). With an adequate power supply and feasible techniques, it is effective to save energy and improve utilization by replacing diesel machinery with electricity machinery.
Acknowledgments
The authors gratefully acknowledge the financial support from the National Natural Science Foundation of China (No. 70873013 & No. 71273039).
References
- Dincer, I.; Hussain, M.; Al-Zaharnah, I. Energy and exergy utilization in agricultural sector of Saudi Arabia. Energy Policy 2005, 33, 1461–1467. [Google Scholar] [CrossRef]
- Utlu, Z.; Hepbasli, A. Assessment of the energy and exergy utilization efficiencies in the Turkish agricultural sector. Int. J. Energy Res. 2006, 30, 659–670. [Google Scholar] [CrossRef]
- Al-Ghandoor, A.; Jaber, J.O. Analysis of energy and exergy utilisation of Jordan's agricultural sector. Int. J. Exergy 2009, 6, 491–508. [Google Scholar] [CrossRef]
- Avara, A.; Karami, M. Energy and exergy efficiencies in agricultural and utility sectors of Iran compared with other countries. In Proceedings of the 2010 2nd International Conference on Mechanical and Electrical Technology (ICMET), Singapore, 10–12 September 2010; pp. 6–10.
- Ahamed, J.U.; Saidur, R.; Masjuki, H.H.; Mekhilef, S.; Ali, M.B.; Furqon, M.H. An application of energy and exergy analysis in agricultural sector of Malaysia. Energy Policy 2011, 39, 7922–7929. [Google Scholar] [CrossRef]
- Rijal, K.; Bansal, N.; Grover, P. Energy in subsistence agriculture: a case study of Nepal. Int. J. Energy Res. 1991, 15, 109–122. [Google Scholar] [CrossRef]
- Ozkan, B.; Akcaoz, H.; Fert, C. Energy input-output analysis in Turkish agriculture. Renew. Energy 2004, 29, 39–51. [Google Scholar] [CrossRef]
- Hatirli, S.A.; Ozkan, B.; Fert, C. An econometric analysis of energy input–output in Turkish agriculture. Renew. Sustain. Energy Rev. 2005, 9, 608–623. [Google Scholar] [CrossRef]
- Alam, M.; Alam, M.; Islam, K. Energy flow in agriculture: Bangladesh. Am. J. Environ. Sci. 2005, 1, 213–220. [Google Scholar] [CrossRef]
- Uri, N.D. Energy and the use of conservation tillage in US agriculture. Energy Sources 1999, 21, 757–771. [Google Scholar] [CrossRef]
- Karkacier, O.; Gokalp Goktolga, Z.; Cicek, A. A regression analysis of the effect of energy use in agriculture. Energy Policy 2006, 34, 3796–3800. [Google Scholar] [CrossRef]
- Türkekul, B.; Unakıtan, G. A co-integration analysis of the price and income elasticities of energy demand in Turkish agriculture. Energy Policy 2011, 39, 2416–2423. [Google Scholar] [CrossRef]
- Daniėls, B.; Van Dril, A. Save production: A bottom-up energy model for Dutch industry and agriculture. Energy Economics 2007, 29, 847–867. [Google Scholar] [CrossRef]
- Baruah, D.C.; Bora, G.C. Energy demand forecast for mechanized agriculture in rural India. Energy Policy 2008, 36, 2628–2636. [Google Scholar] [CrossRef]
- Feng, L.J.; Shang, X.; Xing, Z. Survey analysis of wheel tractor fuel consumption [in Chinese]. Tractor Farm Transp. 2007, 34, 1–3. [Google Scholar]
- GB/T15370. General Requirement of Agricultural Wheeled Tractors and Crawler Tractors; General Administration of Quality Supervision, Inspection and Quarantine of China, Standardization Administration of China: Beijing, China, 2004. [Google Scholar]
- CSY. China Statistical Yearbook; National Bureau of Statistics of China, National Development and Reform Commission: Beijing, China, 1997–2011.
- CESY. China Energy Statistical Yearbook; National Bureau of Statistics of China, National Development and Reform Commission: Beijing, China, 1997–2011.
- CRSY. China Rural Statistical Yearbook; National Bureau of Statistics of China: Beijing, China, 1997–2011.
- CASR. China Agriculture Statistical Report; Ministry of Agriculture of China: Beijing, China, 1996–2010.
- CLRB. China Land and Resources Bulletin; Ministry of Land and Resources of China: Beijing, China, 1996–2010.
- CWRB. China Water Resources Bulletin; Ministry of Water Resources of China: Beijing, China, 1996–2010.
- Renpu, B. Statistical error analysis of operating level of Chinese agricultural mechanization. Modern Agric. Equip. 2005, Z2, 72–76. [Google Scholar]
- Cheremnykh, E.; Gori, F. Exergy and Extended Exergy Cost Assessment of a Commercial Truck. In Proceedings of the ASME 2010 International Mechanical Engineering Congress and Exposition (IMECE2010), Vancouver, Canada, 12–18 November 2010; Volume 5, pp. 461–468.
- Seckin, C.; Sciubba, E.; Bayulken, A.R. An application of the extended exergy accounting method to the Turkish society, year 2006. Energy 2012, 40, 151–163. [Google Scholar] [CrossRef]
Appendix A
| Year | Tillage | Sowing | Harvesting | Irrigation | ||||
|---|---|---|---|---|---|---|---|---|
| Total area | Mechanized area | Total area | Mechanized area | Total area | Mechanized area | Total water consumption | Mechanized Irrigation | |
| (104 ha) | (104 ha) | (104 ha) | (104 ha) | (104 ha) | (104 ha) | (108 m3) | (108 m3) | |
| 1996 | 13003.92 | 5518.45 | 15242.33 | 3258.81 | 15249.54 | 1834.52 | 3900.00 | 2342.41 |
| 1997 | 12993.33 | 5791.05 | 15398.33 | 3564.71 | 15391.90 | 2134.86 | 3919.72 | 2418.95 |
| 1998 | 12966.70 | 6005.29 | 15548.61 | 3835.84 | 15544.40 | 2342.54 | 3766.46 | 2319.94 |
| 1999 | 12920.00 | 6192.42 | 15605.44 | 3993.43 | 15605.11 | 2542.07 | 3869.00 | 2389.00 |
| 2000 | 12826.70 | 6208.78 | 15629.57 | 3990.23 | 14483.03 | 2644.60 | 3783.54 | 2315.24 |
| 2001 | 12761.58 | 6165.28 | 15572.85 | 4058.29 | 14750.77 | 2653.66 | 3825.73 | 2326.23 |
| 2002 | 12653.30 | 6129.30 | 15467.98 | 4120.67 | 14813.48 | 2715.31 | 3736.18 | 2248.65 |
| 2003 | 12340.00 | 6094.36 | 15243.13 | 4071.44 | 14385.33 | 2736.09 | 3432.81 | 2091.34 |
| 2004 | 12243.92 | 6359.31 | 15352.72 | 4426.19 | 14583.48 | 3045.03 | 3585.70 | 2159.53 |
| 2005 | 12208.27 | 6630.05 | 15548.80 | 4710.17 | 14652.49 | 3437.47 | 3580.00 | 2173.60 |
| 2006 | 12177.59 | 6900.79 | 15214.90 | 4994.15 | 14707.82 | 3829.92 | 3664.45 | 2207.93 |
| 2007 | 12173.52 | 7171.54 | 15330.03 | 5278.13 | 14753.18 | 4222.36 | 3599.51 | 2188.50 |
| 2008 | 12171.60 | 7658.37 | 15793.86 | 5897.43 | 15224.12 | 4748.40 | 3663.46 | 2239.40 |
| 2009 | 12198.50 | 8049.79 | 15864.75 | 6509.31 | 15373.82 | 5340.87 | 3723.11 | 2287.77 |
| 2010 | 12214.58 | 8502.57 | 16068.99 | 6916.09 | 15581.02 | 5984.67 | 3689.10 | 2266.91 |
Table A2.
Number and total power of agricultural machinery.
| Year | Small tractors | Large and medium-sized tractors | Combine harvesters | Swathers | Other harvesters | |||||
|---|---|---|---|---|---|---|---|---|---|---|
| Number | Total power | Number | Total power | Number | Total power | Number | Total power | Number | Total power | |
| (104) | (104 kW) | (104) | (104 kW) | (104) | (104 kW) | (104) | (104 kW) | (104) | (104 kW) | |
| 1996 | 918.92 | 8385.20 | 67.08 | 2415.10 | 9.64 | 301.50 | 78.09 | 30.46 | 10.19 | 12.25 |
| 1997 | 1048.48 | 9337.20 | 68.91 | 2486.50 | 14.13 | 370.60 | 93.00 | 37.20 | 11.21 | 13.88 |
| 1998 | 1122.06 | 10031.50 | 72.52 | 2587.90 | 18.26 | 467.50 | 103.08 | 42.26 | 12.33 | 15.88 |
| 1999 | 1200.25 | 11008.90 | 78.42 | 2772.80 | 22.60 | 570.50 | 100.03 | 42.01 | 13.56 | 18.34 |
| 2000 | 1264.37 | 11663.90 | 97.45 | 3161.10 | 26.26 | 660.90 | 110.69 | 47.81 | 14.92 | 21.38 |
| 2001 | 1305.08 | 12257.90 | 82.99 | 2901.70 | 28.29 | 744.50 | 105.61 | 57.54 | 18.21 | 28.18 |
| 2002 | 1339.39 | 12695.00 | 91.17 | 3073.40 | 31.01 | 855.70 | 112.35 | 57.97 | 18.79 | 32.00 |
| 2003 | 1377.71 | 13060.20 | 98.06 | 3229.80 | 36.50 | 1085.80 | 95.08 | 45.46 | 42.04 | 74.45 |
| 2004 | 1454.93 | 13855.40 | 111.86 | 3713.10 | 41.05 | 1265.60 | 87.91 | 44.30 | 41.90 | 81.61 |
| 2005 | 1526.89 | 14660.90 | 139.60 | 4293.50 | 48.04 | 1549.90 | 82.51 | 47.52 | 47.82 | 112.18 |
| 2006 | 1567.90 | 15229.10 | 171.82 | 5245.30 | 56.56 | 1896.20 | 68.25 | 45.97 | 50.45 | 132.66 |
| 2007 | 1619.11 | 15729.20 | 206.27 | 6101.10 | 63.38 | 2194.50 | 60.89 | 40.25 | 58.79 | 143.17 |
| 2008 | 1722.41 | 16647.70 | 299.52 | 8186.50 | 74.35 | 2707.40 | 49.21 | 46.31 | 69.37 | 189.21 |
| 2009 | 1750.90 | 16922.70 | 351.58 | 9772.60 | 85.84 | 3364.30 | 48.93 | 47.46 | 83.44 | 233.63 |
| 2010 | 1785.79 | 17278.39 | 392.17 | 11166.99 | 99.21 | 4042.30 | 49.85 | 48.85 | 101.29 | 288.68 |
| Year | Irrigation machinery | Primary processing machinery | Animal husbandry machinery | Fishing motorboats | Forestry machinery | Pedicabs | Low-speed trucks | Farmland construction machinery | ||||||||
|---|---|---|---|---|---|---|---|---|---|---|---|---|---|---|---|---|
| Number | Total power | Number | Total power | Number | Total power | Number | Total power | Number | Total power | Number | Total power | Number | Total power | Number | Total power | |
| (104) | (104 kW) | (104) | (104 kW) | (104) | (104 kW) | (104) | (104 kW) | (104) | (104 kW) | (104) | (104 kW) | (104) | (104 kW) | (104) | (104 kW) | |
| 1996 | 509.29 | 3984.90 | 176.81 | 1580.62 | 52.19 | 114.28 | 35.89 | 864.00 | 0.59 | 4.44 | 288.77 | 2482.73 | 43.76 | 1040.48 | 4.52 | 248.45 |
| 1997 | 546.12 | 4292.40 | 187.04 | 1672.03 | 53.88 | 119.35 | 39.88 | 1080.50 | 0.49 | 3.43 | 388.04 | 3412.58 | 60.05 | 1446.40 | 5.37 | 258.61 |
| 1998 | 581.61 | 4499.00 | 196.60 | 1757.55 | 61.10 | 136.92 | 41.13 | 1174.40 | 0.44 | 3.00 | 462.77 | 4160.86 | 76.34 | 1862.41 | 6.12 | 280.84 |
| 1999 | 644.95 | 4934.60 | 216.56 | 1935.98 | 72.62 | 164.59 | 41.74 | 1253.10 | 0.52 | 3.44 | 557.34 | 5120.84 | 92.62 | 2288.50 | 6.95 | 325.29 |
| 2000 | 688.12 | 5232.60 | 236.15 | 2119.58 | 72.58 | 191.00 | 45.99 | 1338.60 | 1.78 | 12.18 | 660.68 | 6219.97 | 112.07 | 2828.87 | 9.44 | 465.94 |
| 2001 | 728.57 | 5580.00 | 250.99 | 2215.04 | 83.36 | 194.35 | 48.01 | 1379.60 | 2.19 | 12.97 | 730.21 | 6996.78 | 124.36 | 3173.99 | 11.68 | 606.59 |
| 2002 | 750.61 | 5667.90 | 257.10 | 2313.68 | 94.27 | 219.58 | 48.57 | 1381.20 | 2.79 | 18.09 | 800.20 | 7830.44 | 142.25 | 3667.05 | 13.72 | 747.23 |
| 2003 | 749.57 | 5592.80 | 266.16 | 2385.51 | 100.12 | 232.38 | 47.81 | 1425.90 | 4.41 | 22.92 | 866.79 | 8622.85 | 155.66 | 4100.84 | 15.57 | 887.88 |
| 2004 | 777.54 | 5804.20 | 263.24 | 2359.40 | 109.07 | 243.47 | 48.69 | 1384.20 | 4.27 | 30.42 | 944.45 | 9608.98 | 169.77 | 4405.82 | 17.69 | 1024.84 |
| 2005 | 809.91 | 6034.00 | 277.15 | 2503.47 | 119.61 | 272.32 | 43.96 | 1376.10 | 5.73 | 33.99 | 1002.39 | 10418.32 | 189.84 | 5086.09 | 20.71 | 1226.35 |
| 2006 | 836.35 | 6148.80 | 284.45 | 2551.20 | 132.29 | 278.58 | 49.21 | 1498.30 | 6.72 | 39.32 | 1026.87 | 10777.86 | 202.85 | 5179.50 | 30.26 | 1422.34 |
| 2007 | 861.50 | 6282.80 | 293.83 | 2621.56 | 139.24 | 295.70 | 52.48 | 1605.30 | 8.16 | 48.92 | 1049.29 | 11205.87 | 235.96 | 5754.34 | 32.87 | 1628.80 |
| 2008 | 898.39 | 6561.70 | 300.41 | 2645.75 | 137.47 | 382.05 | 54.45 | 1679.49 | 9.47 | 59.51 | 1065.97 | 11807.90 | 233.86 | 7190.90 | 37.68 | 1954.85 |
| 2009 | 924.92 | 6795.50 | 306.28 | 2664.62 | 136.30 | 399.52 | 56.40 | 1748.73 | 13.36 | 73.97 | 1078.71 | 12034.09 | 255.51 | 8176.45 | 39.35 | 2139.06 |
| 2010 | 946.25 | 6969.20 | 311.46 | 2678.58 | 138.76 | 416.29 | 58.36 | 1820.82 | 17.36 | 92.88 | 1087.09 | 12341.52 | 271.80 | 8969.50 | 39.64 | 2251.53 |
© 2012 by the authors; licensee MDPI, Basel, Switzerland. This article is an open access article distributed under the terms and conditions of the Creative Commons Attribution license (http://creativecommons.org/licenses/by/3.0/).
Share and Cite
MDPI and ACS Style
Li, N.; Mu, H.; Li, H.; Gui, S. Diesel Consumption of Agriculture in China. Energies 2012, 5, 5126-5149. https://0-doi-org.brum.beds.ac.uk/10.3390/en5125126
AMA Style
Li N, Mu H, Li H, Gui S. Diesel Consumption of Agriculture in China. Energies. 2012; 5(12):5126-5149. https://0-doi-org.brum.beds.ac.uk/10.3390/en5125126
Chicago/Turabian StyleLi, Nan, Hailin Mu, Huanan Li, and Shusen Gui. 2012. "Diesel Consumption of Agriculture in China" Energies 5, no. 12: 5126-5149. https://0-doi-org.brum.beds.ac.uk/10.3390/en5125126