1. Introduction
Both the US and Canada use highly industrialized agriculture and are among the World’s top producers of crops. Combined they produce nearly half of the World’s corn and one third of the World’s wheat exports [
1]. Modern agricultural practices, though very productive from a human labor standpoint, are highly dependent on fossil fuels, especially petroleum. In the years from 1900 to 1970, the shift from entirely human and animal labor to almost entirely mechanized labor changed the ratio of energy outputs to energy inputs (energy return on investment or EROI) of farming. In traditional cultures 5 to 50 kcal of food were obtained for each kcal invested; by 1970 one kcal of food was obtained for every 5–10 kcal of total energy (fossil and human labor) invested [
2]. White [
3] hypothesized that the development of human societies is constrained ultimately by their ability to generate surplus energy (including food). The ability to do so is a function of quality of available energy and energy transformers (technology), and over the long run it is determined by the amount of energy needed to return the next unit of energy. Societies that fail to produce an energy surplus are doomed to failure [
4,
5,
6]. With the widespread introduction of fossil fuels and machinery in agriculture, the situation for modern societies has become more complex than for traditional ones, yet the same premise appears to hold: Increasing fossil fuel dependence and poor energy efficiency has ominous implications for the future success of food production, as a highly inefficient system may encounter greater problems in a future of (probably) more constrained energy than a more energetically efficient system [
7]. The high demand for fossil fuels in agricultural production, combined with rising global demand, especially by developing nations, have led to increased fuel prices and have created a powerful incentive for agronomists to increase the energy efficiency of agriculture [
8,
9]. Thus the energy efficiency of US and Canadian agriculture is of global concern.
The industrial agricultural practices and technologies employed in the US and Canada are increasingly being applied worldwide. Currently, food production, transportation and preparation systems in the United States use about 15–20 percent of all industrial energy [
10,
11].
Per capita energy consumption for food (including all elements of the consumer food chain) increased six times faster than the rate of increase for total domestic energy consumption from 1997 to 2002 in the US [
11]. It is surprising, therefore, that although the use of energy in agriculture has been thoroughly analyzed for different products, agricultural systems in other parts of the World, and in relation to climate change and farm size (see e.g., examples given in [
9]), we have been able to find only a few analyses of the efficiency of North American agriculture at the national level: Steinhart and Steinhart [
2] and Cleveland [
12] undertook analyses of the whole food production system at the farm gate, with Steinhart and Steinhart’s analysis extending to the processing and consumption aspects of the food system. Canning
et al. [
11] performed a meta-analysis of the energy intensity of the U.S. agricultural system from production to household consumption. Oltjen and Beckett [
13] used the term “humanly edible energy” to describe the energy pertinent to human nutrition as opposed to inedible animal feed. They go on to calculate the “humanly edible energy efficiency” of livestock which compares the edible energy of animal feed with the edible content of the resulting animal product, although their analysis differs from the focus of this paper. Several studies of agricultural energy efficiency exist for developing nations. Cao
et al. [
14] found that the energy ratio for agriculture in China decreased 25% from 2:1 in 1978 to 1.5 in 2004, due to increases in fossil fuel use outpacing increased food production. Karkacier
et al. [
15], however, found a positive relation between increasing energy consumption and agricultural output in Turkey, with each additional ton of oil equivalent increasing agricultural output by 0.167 units. Other edible EROI studies have been conducted on national and international levels for specific crops such as rice. Pracha and Volk [
16] performed an analysis of the edible energy return on investment for Pakistani rice and wheat from 1999 to 2009. The authors found that the average EROI was 2.9:1 for the edible portion of wheat and 3.9:1 for rice. Mushtaq
et al. [
17] calculated energy ratios (EROI) for rice for eight nations, and found that the EROI varied from 4:1 to 11:1 (including the embodied energy in straw), and from 1.6:1 to 5:1 when including only the edible portion.
Many neoclassical economists, other technology supporters and some empiricists [
18,
19,
20] argue that technological advancements will allow indefinite growth in agricultural productivity. They postulate that new technology [such as Genetically Modified Organisms (GMOs) or better irrigation systems] will make crop production yields higher and also more efficient. Most economists believe that market incentives such as higher fuel prices should generate greater energy efficiency in agriculture through technical and managerial changes [
12,
21]. These changes could include reducing land in cultivation (hence increasing average quality used), increasing farm size, and reducing rates of energy use through technological improvements. Cleveland [
12] concluded that US agriculture made a “significant increase in energy productivity” from 1978 to 1990 as a response to higher fuel prices through technical and managerial changes, however by 1990, US agricultural energy efficiency had returned to energy efficiencies obtained in 1950.
Global energy resources face an uncertain future in our post-peak oil age [
22]. Real crude oil prices have increased at least four-fold in recent decades [
23]. As we wait on the brink of what is likely a very large change in how humans obtain and use energy, we regard the uncertain future and price hikes as a powerful but possibly insufficient incentive for increasing energy efficiency. We believe it important to determine the energy efficiency of agriculture using an energetic analysis rather than a traditional economic cost-benefit analysis. Our objective was to determine whether the energy efficiency in agriculture has increased substantially in the US and Canada over the past several decades. We chose to focus on human food energy produced by agriculture instead of all energy produced by agriculture, which would include the energy implicit in inedible silage, fiber crops, animal bones and fuels. We also sought to determine the amount of energy (in joules) used by each major agricultural input and compare their individual efficiencies; determine the percentage of output present as crops, meat or feed for livestock; the influence of an increasing amount of crops grown exclusively for the production of biofuels; and compare our results of this study against the results of two extant studies of the energy efficiency in the US.
2. Methods Section
We define the boundaries to the agricultural system as all the land on farms cultivated for crops or growing livestock and the technical and industrial portions of the economy needed to support that system. We determined the energy efficiency of energy used in agricultural production in the US and Canada by dividing the food output,
i.e., the caloric energy of the top 15 crops (including animal products) with the highest tonnage output for each ten or five year interval produced in that year, minus the feed used for animal production, by all energy inputs
i.e., the energy associated with producing the major inputs of the agricultural system: fertilizer, seed, pesticides, fuel, and machinery [Equation (1)]:
This is a variation of the EROI equation used in fuel energy analysis which states that the energy return on investment (the energy efficiency, and in this case the Edible Energy Efficiency, or EEE), is expressed as the ratio of the outputs compared to the inputs of a system [
7]. We used only the top 15 crops and animal products, not the entire crop and animal production for that year—however these 15 products on average make up 95% of total production by weight and >95% in terms of energy content. Our analysis ends at the farm gate. Although much of the food produced in the US and Canada is exported and lost to processing, such considerations are beyond the scope of our study. We sought only to understand how much energy was used to make potentially edible food. An increasing percentage of the US corn crop since 2000 has been diverted from the food stream into ethanol production. In Canada, ethanol production includes both corn and wheat feedstocks, however, significant production from domestic feedstock did not begin until after 2009 [
24]. While this corn (and wheat) is potentially edible, since it is not consumed by humans or domesticated animals we excluded it from the EEE calculations. Thus we must subtract also the energy inputs used to produce the grain for use in ethanol production. To determine the energy inputs for the corn crop, we multiplied the bushels of corn used in ethanol production [
25] by an energy intensity factor derived from Hall, Pimentel and Dale [
26]. We performed a sensitivity analysis to determine how including the corn (and wheat) used for ethanol in the energy output (numerator) and including the energy cost to grow that grain (in the denominator) might change the EEE in the US and Canada.
2.1. Energy Outputs
We determined the output of agriculture by converting the annual yield of a country’s pertinent crops in tons to its caloric energy equivalent. Because the crops were weighed in their rawest, least processed forms, we converted the weights to energy using the USDA calorie conversion data for the most unprocessed forms of the food crop [
27].
To avoid double counting of both animal products and the grain that fed them, we subtract the grain fed to livestock from total crop outputs. The USDA published feed crop production and consumption by livestock from 1976 through 2010 [
28]. Since similar data has not been published in Canada, we derive the ratio of kcal of feed grain to kcal of meat output from the US data for the year of interest. We then multiply the kcal of edible animal product output in Canada by this ratio to estimate the feed grain demand from Canadian livestock. The total feed crops consumed by livestock are then subtracted from the Canadian total crop output. All conversion factors and calculations for the feed subtraction and crop production can be found in the appendices. The ratio of food energy to meat energy varies from 6:1 in 1970 to 3.6:1 by 2010. It’s important to note that the remaining food energy demand from livestock is met through pasturing, grasses, food meals as byproducts of food processing (e.g., soybean meal), silage and other feed not directly consumable by humans.
2.3. Data Sources and Specific Methods for the United States
We assessed the energy efficiency US agricultural production every ten years from 1970 to 2010 because much of the information needed to calculate EEE was collected only in ten year increments. We converted crop production [
1,
27] and livestock feed [
28] into kcal and then petajoules (1 PJ = 10
15 J). We also converted physical quantities of inputs: fuels [
29,
30], pesticides [
31,
32,
33,
34] and fertilizer [
35,
36] to PJ using published estimates of embodied energy. Where physical quantities were not available, e.g., seed expenditures [
37,
38], research and development expenses [
39], and machinery [
40,
41,
42,
43,
44], we converted monetary quantities to PJ of energy. These categories never summed to more than 26% of the total energy used in the inputs. The conversion methodology we used for these variables were summarized in Hall
et al. [
26,
45]. Briefly, we multiply the amount spent (in nominal dollars) on an agricultural input, e.g., seeds, by the energy intensity of the economy (total primary energy consumption divided by the GDP in nominal dollars) for that year. For the US, we define the “machinery” category as the energy used to construct and maintain tractors and other farm equipment such as trucks, and harvesters. This does not include the fuels used by these machines (gasoline, diesel, LP gas, natural gas and electricity), which are categorized separately. The literature provided varying estimates of the embodied energy consumed in the production of fertilizers and pesticides and we do not know which is correct, so for these categories of energy inputs we gathered a low and high estimate and calculated an average estimate. This uncertainty is reflected in the ranges of EEE (
Figure 1) and in our tallies of energy inputs (
Table 1), but all other graphs and data use the average estimates for these two inputs for sake of simplicity. This range of values provides a degree of uncertainty to our final energy efficiency estimates but fertilizer and pesticide inputs play a relatively small role in the analyses in which we use the calculated average that we believe the validity of our calculations is not compromised.
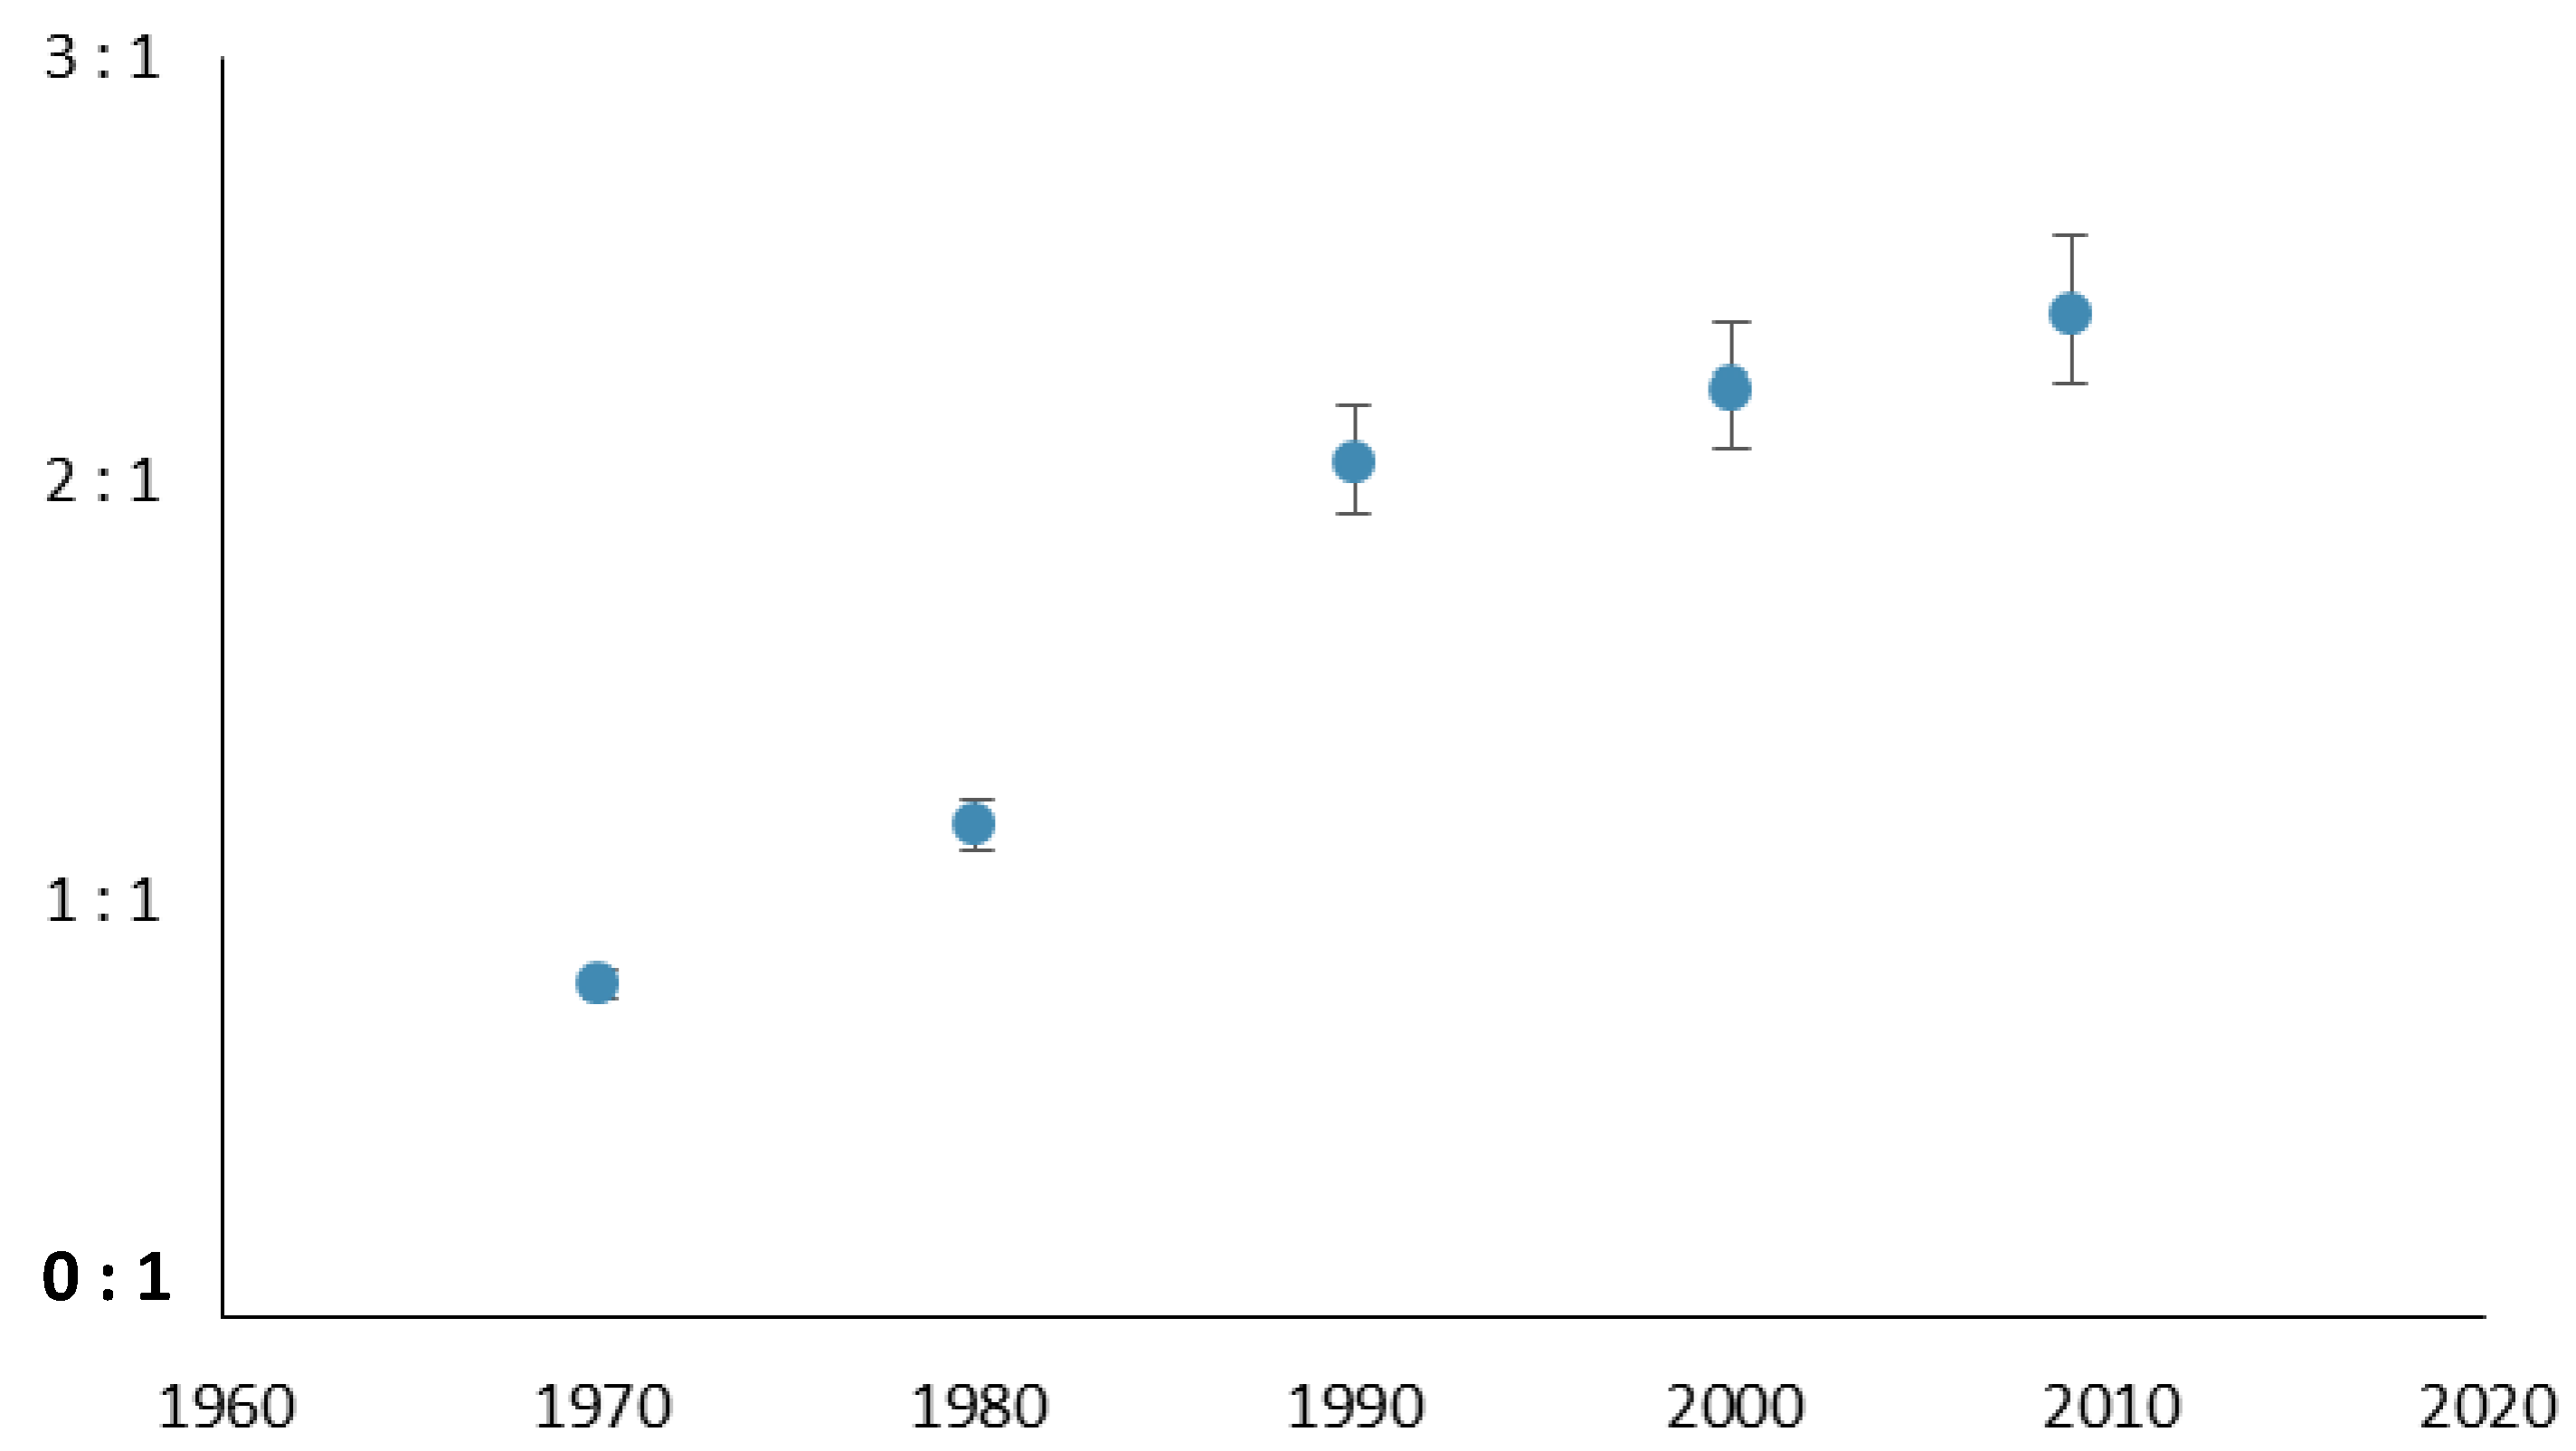
Figure 1.
Edible energy efficiency (EEE) for the United States from 1970 to 2010. The vertical bars represent uncertainty in estimates of the energy intensity of fertilizer and pesticides.
Figure 1.
Edible energy efficiency (EEE) for the United States from 1970 to 2010. The vertical bars represent uncertainty in estimates of the energy intensity of fertilizer and pesticides.
Table 1.
Outputs and inputs of US agriculture in energy units (Petajoules).
Table 1.
Outputs and inputs of US agriculture in energy units (Petajoules).
| Inputs/Outputs | Year | 1970 | 1980 | 1990 | 2000 | 2010 |
|---|
Agricultural Outputs
Edible Crop Production | Crop productiona | 3939 | 5533 | 6388 | 7447 | 8542 |
| Grains | 2484 | 3920 | 4582 | 5014 | 6264 |
| Non-grain veg. | 1100 | 1226 | 1370 | 1892 | 1709 |
| Meat products | 355 | 387 | 435 | 541 | 602 |
| Livestock feeda | 2078 | 2236 | 2078 | 2426 | 2171 |
| Ethanol feedstock | - | 14 | 136 | 245 | 1788 |
| Edible energy output * | 1861 | 3206 | 4091 | 4649 | 4449 |
| Agricultural Inputs High estimates (low estimates in parentheses) | Machinery b | 363 | 521 | 233 | 136 | 141 |
| Fuela | 1297 | 1382 | 1009 | 1152 | 1172 |
| Seeds b | 64 | 95 | 69 | 79 | 117 |
| R&D b | 69 | 83 | 84 | 82 | 81 |
| Pesticides a (low) | 149 (127) | 110 (101) | 93 (86) | 99 (90) | 93 (85) |
| Fertilizers a (low) | 508 (317) | 755 (479) | 715 (461) | 778 (506) | 775 (506) |
| Minus the energy cost of growing corn for ethanol | - | 3 | 25 | 41 | 328 |
| Total Inputs* (low) | 2450 (2237) | 2943 (2661) | 2178 (1917) | 2285 (2004) | 2051 (1773) |
2.4. Data Sources and Specific Methods for Canada
Canadian data was available only for 1981 and later, but in consistent five year intervals, so we took advantage of its availability and calculate Canadian agricultural energy efficiency in approximately five year intervals over that time period. We converted physical measures of crop production [
1,
27] and livestock feed [
17] into kcal and then PJ. We converted physical quantities of fertilizer [
36,
46,
47] and, where available, pesticides [
33,
48,
49] to PJ. Detailed calculations for all categories are included in the appendices. Statistics Canada published the amount overall of primary and secondary energy consumed on farms from 1981 to 2001 [
50]. When necessary, we converted monetary expenditures to energy for: seed [
49] and machinery (repairs and other) [
49]. To do so, we used the used the methods outlined above for converting US dollars to energy, but calculated the Canadian energy inputs using the energy intensity of the Canadian economy for that year [
51,
52]. Data on agricultural research and development was unavailable prior to 2000, and so we extrapolated the spending trend from 2000 to 2010 back to 1981 [
53].
3. Results and Discussion
Our results find that agricultural energy efficiency (EEROI) more than doubled in the US from 1970 to 1990, from 0.8:1 to 2.0:1, then increased more slowly to 2.3:1 by 2009 for a total increase of 2.6 fold (
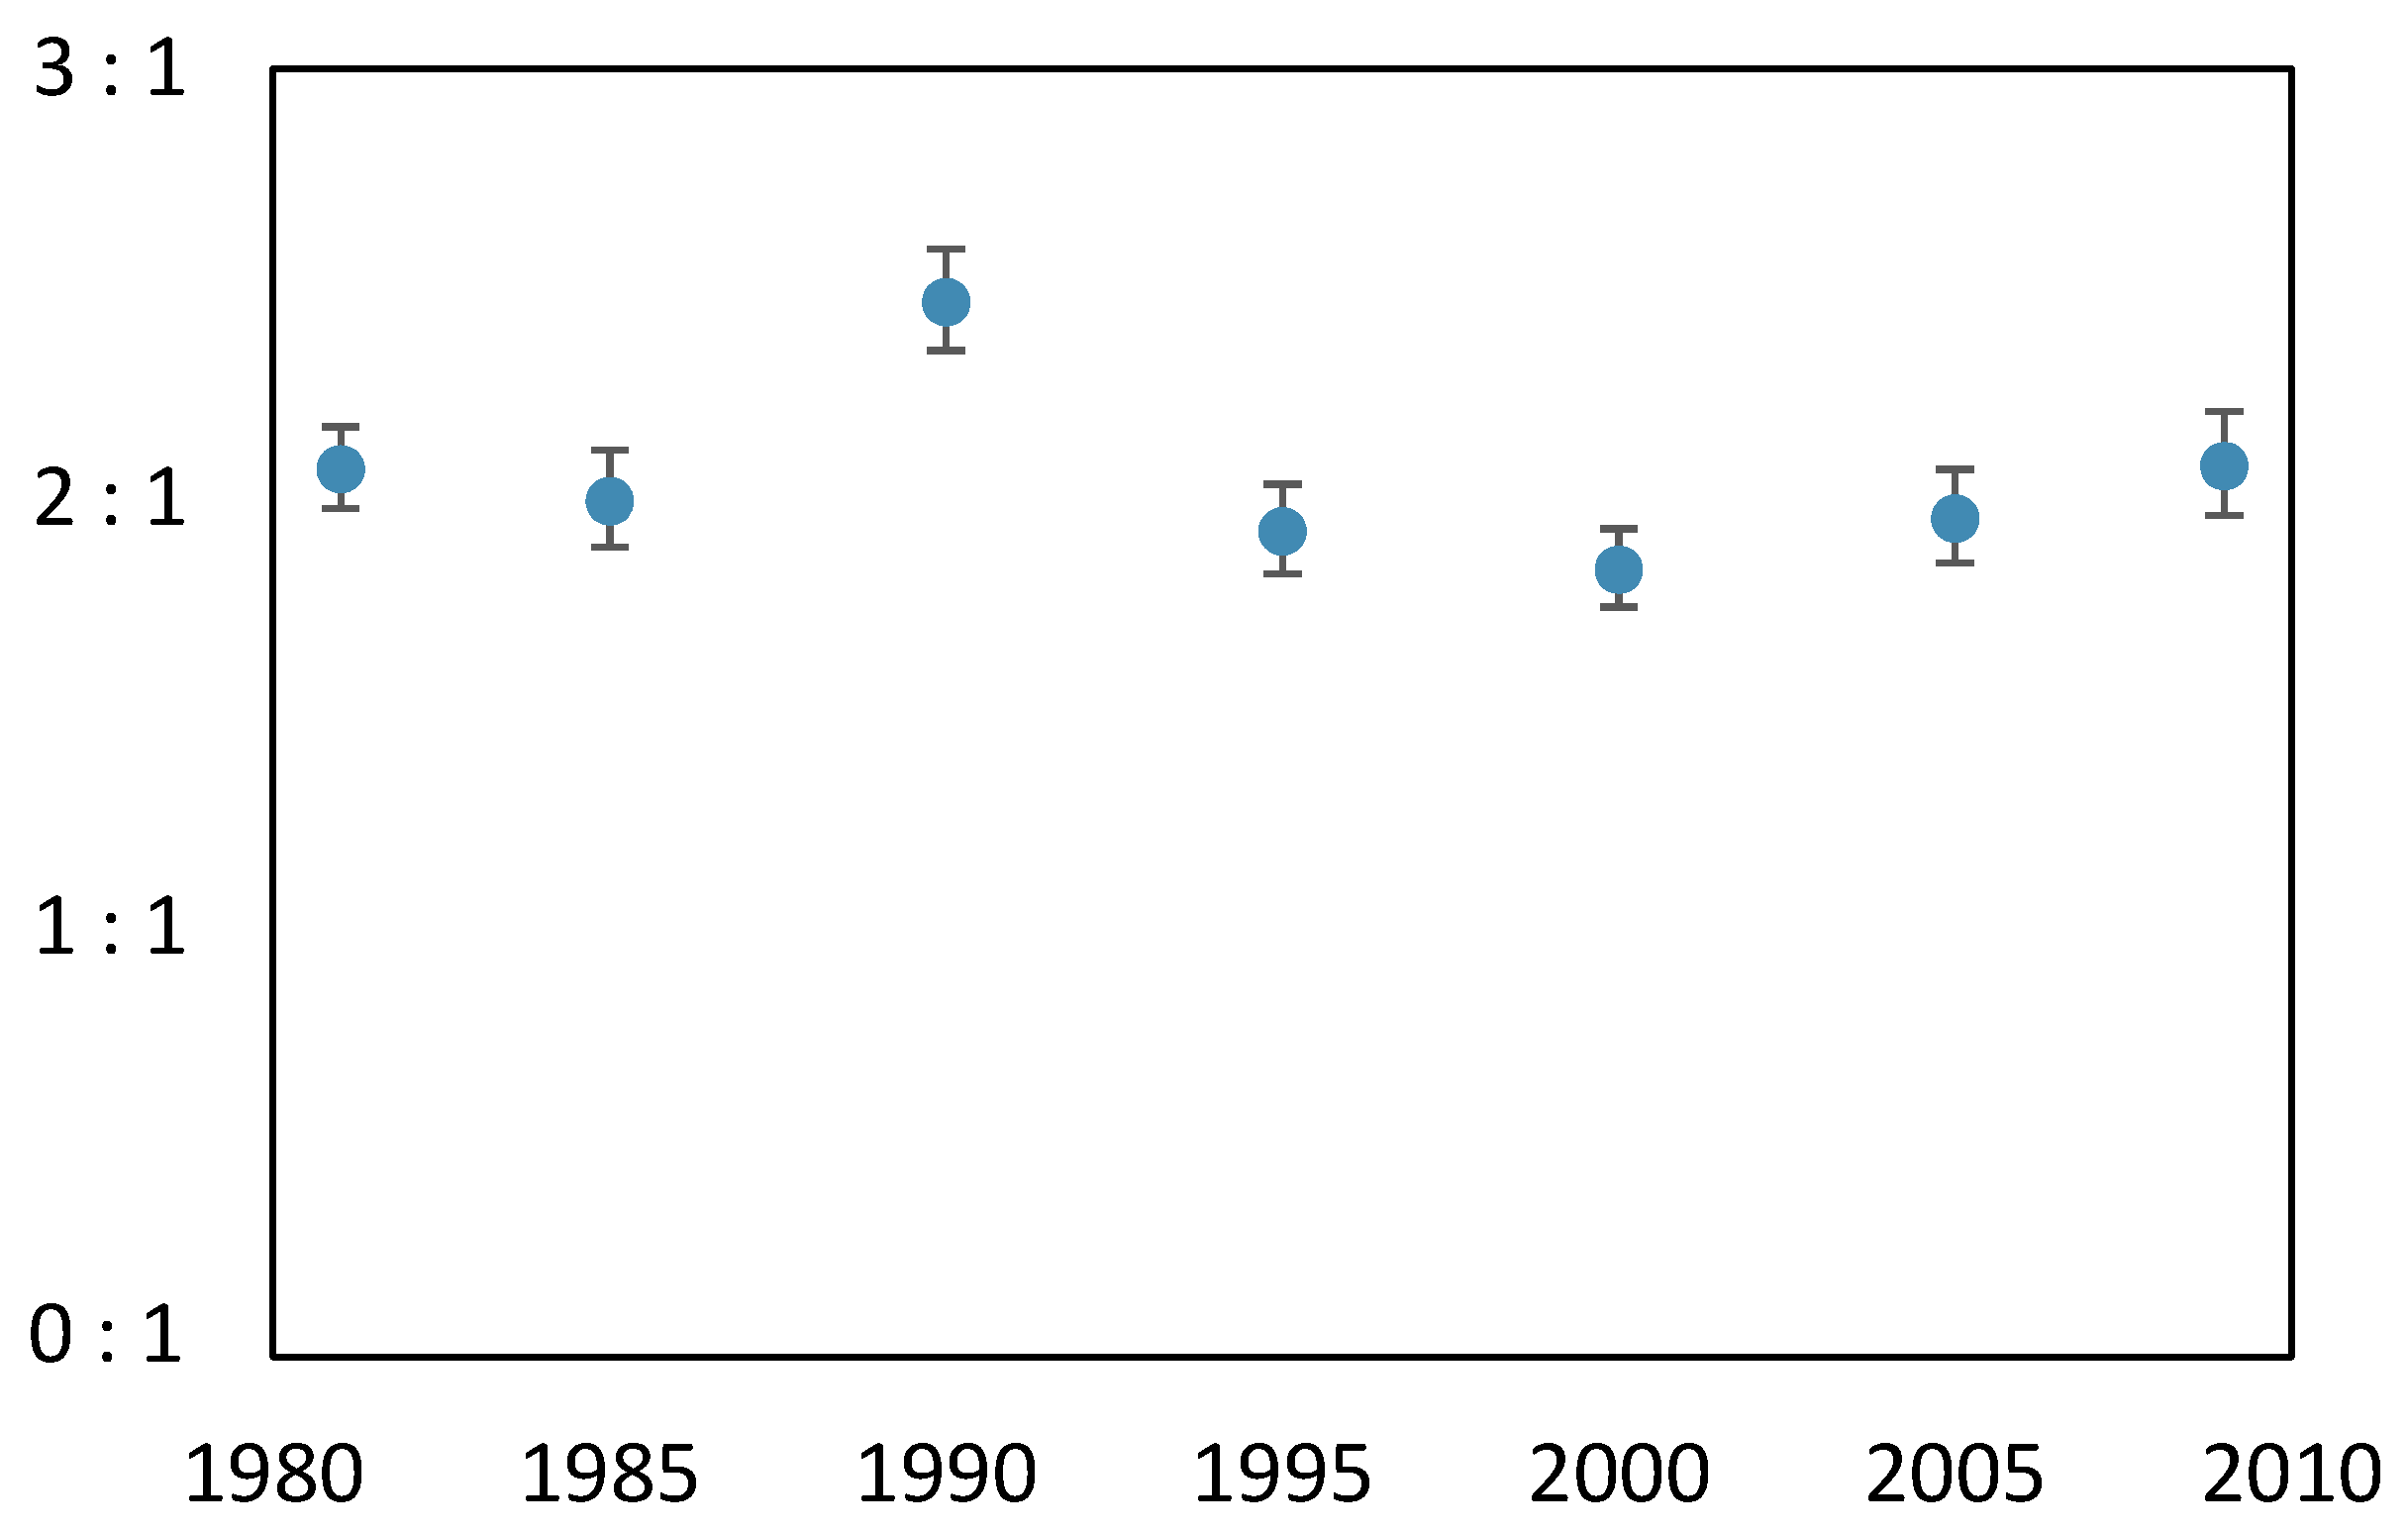
Figure 1). No clear trend exists for Canada, energy efficiency increases in some years while in others it declines. The EEE for Canadian agriculture varies about the mean of 2.0:1 from 1981 to 2009 (
Figure 2).
Figure 2.
Edible energy efficiency (EEE) for Canada from 1981 to 2009. The vertical bars represent uncertainty in estimates of the energy intensity of fertilizer and pesticides.
Figure 2.
Edible energy efficiency (EEE) for Canada from 1981 to 2009. The vertical bars represent uncertainty in estimates of the energy intensity of fertilizer and pesticides.
Gross agricultural production in the US increased 113% from 3939 PJ in 1970 to 8426 PJ in 2009. After accounting for animal feed and ethanol feedstock, the net output increased by 140% over this period, perhaps reflecting a lower edible grain requirement for livestock (perhaps due to the replacement of whole grains by by-products such as soybean meal and distillers dry grains [
25,
28]). Total energetic inputs decreased slightly over this period: from 2450 PJ in 1970 to 2050 PJ in 2009 (
Table 1; high estimates). Average yields for grain crops increased rapidly over this period. Corn e.g., increased from 72.4 bushels × acre
−1 × yr
−1 (28.1 GJ × acre
−1 × yr
−1) in 1970 to 164 bushels × acre
−1 × yr
−1(59.3 GJ × acre
−1 × yr
−1). Gross agricultural output in Canada grew by 25% from 1981 to 2009; or 24% when excluding feed for livestock and ethanol feedstock (
Table 2). Canada’s energy inputs increased by 25% also, driven by increases in fuel and fertilizer inputs (
Table 2).
Table 2.
Outputs and inputs of Canadian agriculture in petajoules.
Table 2.
Outputs and inputs of Canadian agriculture in petajoules.
| Inputs/Outputs | Year | 1981 | 1985 | 1990 | 1995 | 2000 | 2005 | 2009 |
|---|
| Agricultural Outputs Edible Crop Production | Crop production a | 855 | 842 | 973 | 940 | 978 | 1037 | 1067 |
| Livestock Feed a | 247 | 268 | 217 | 269 | 301 | 305 | 270 |
| Ethanol feedstock | - | - | - | - | - | - | 43 |
| Edible energy output | 608 | 574 | 756 | 671 | 676 | 732 | 754 |
| Agricultural Inputs High estimates (low estimates in parentheses) | Machinery b | 30 | 27 | 26 | 28 | 24 | 23 | 20 |
| Fuel a | 188 | 170 | 195 | 209 | 232 | 226 | 210 |
| Seeds b | 9 | 9 | 9 | 10 | 11 | 12 | 13 |
| Fertilizer a (low) | 71 (44) | 88 (56) | 81 (52) | 107 (70) | 105 (70) | 120 (79) | 126 (84) |
| Pesticides a (low) | 2 (1) | 2 (1) | 2 (1) | 2 (2) | 3 (2) | 3 (2) | 4 (3) |
| R&D b | 8 | 9 | 10 | 10 | 11 | 12 | 13 |
| Minus the energy cost of growing corn for ethanol | - | - | - | - | - | - | 8 |
| Total Inputs (low) | 307 (280) | 304 (272) | 322 (293) | 368 (330) | 387 (350) | 396 (354) | 385 (342) |
3.1. Comparison of Trends in Canadian and US Energy Efficiency
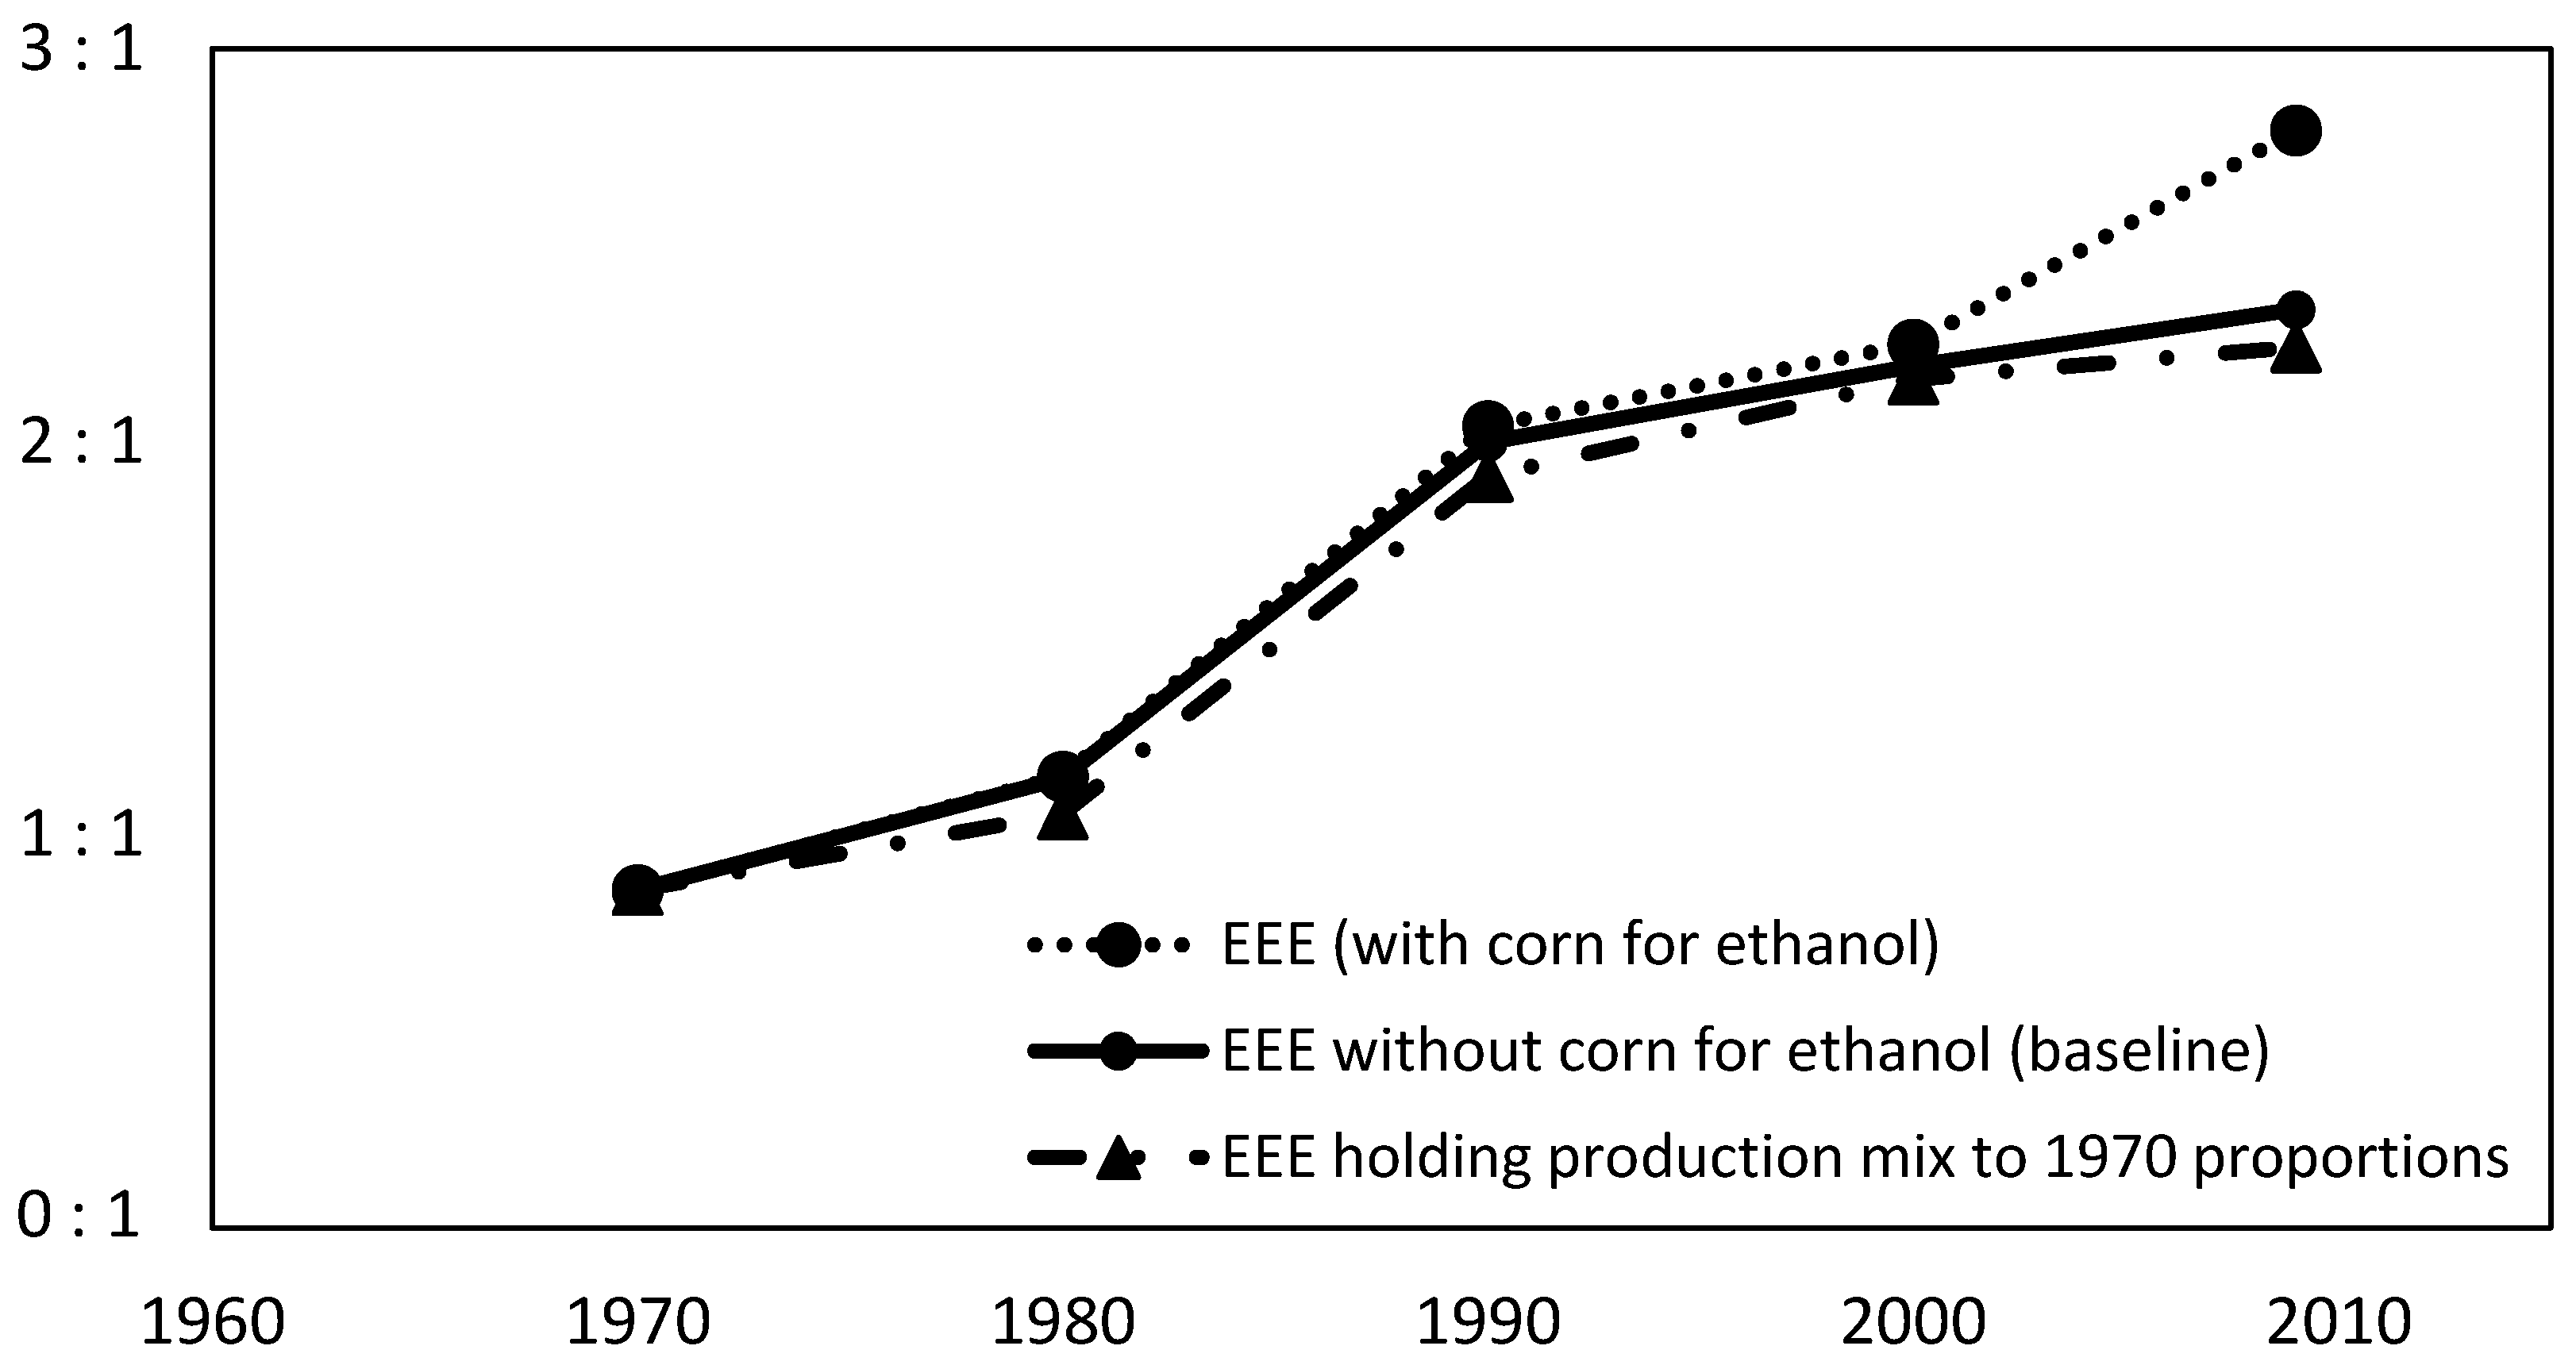
The EEE of US agriculture has increased over the last four decades while that for Canadian agriculture has not. Why? The normal assumption is that technology and/or free markets has generated progress for increasing efficiency. Does that mean that US investigators or markets are better than those for Canada? This may be true. An alternative hypothesis is that the US is increasingly growing energy-efficient grain (maize) compared with non-grain vegetables and animal products. This ratio has changed from 63% grain (by energy content) in 1970 to 73% grain in 2009. If we keep the proportion of grains at 63% and subtract both the increase (as %) of grain and the energy required to grow it, then there is virtually no (0.8% per year) increase in efficiency since 1990 (
Figure 3).
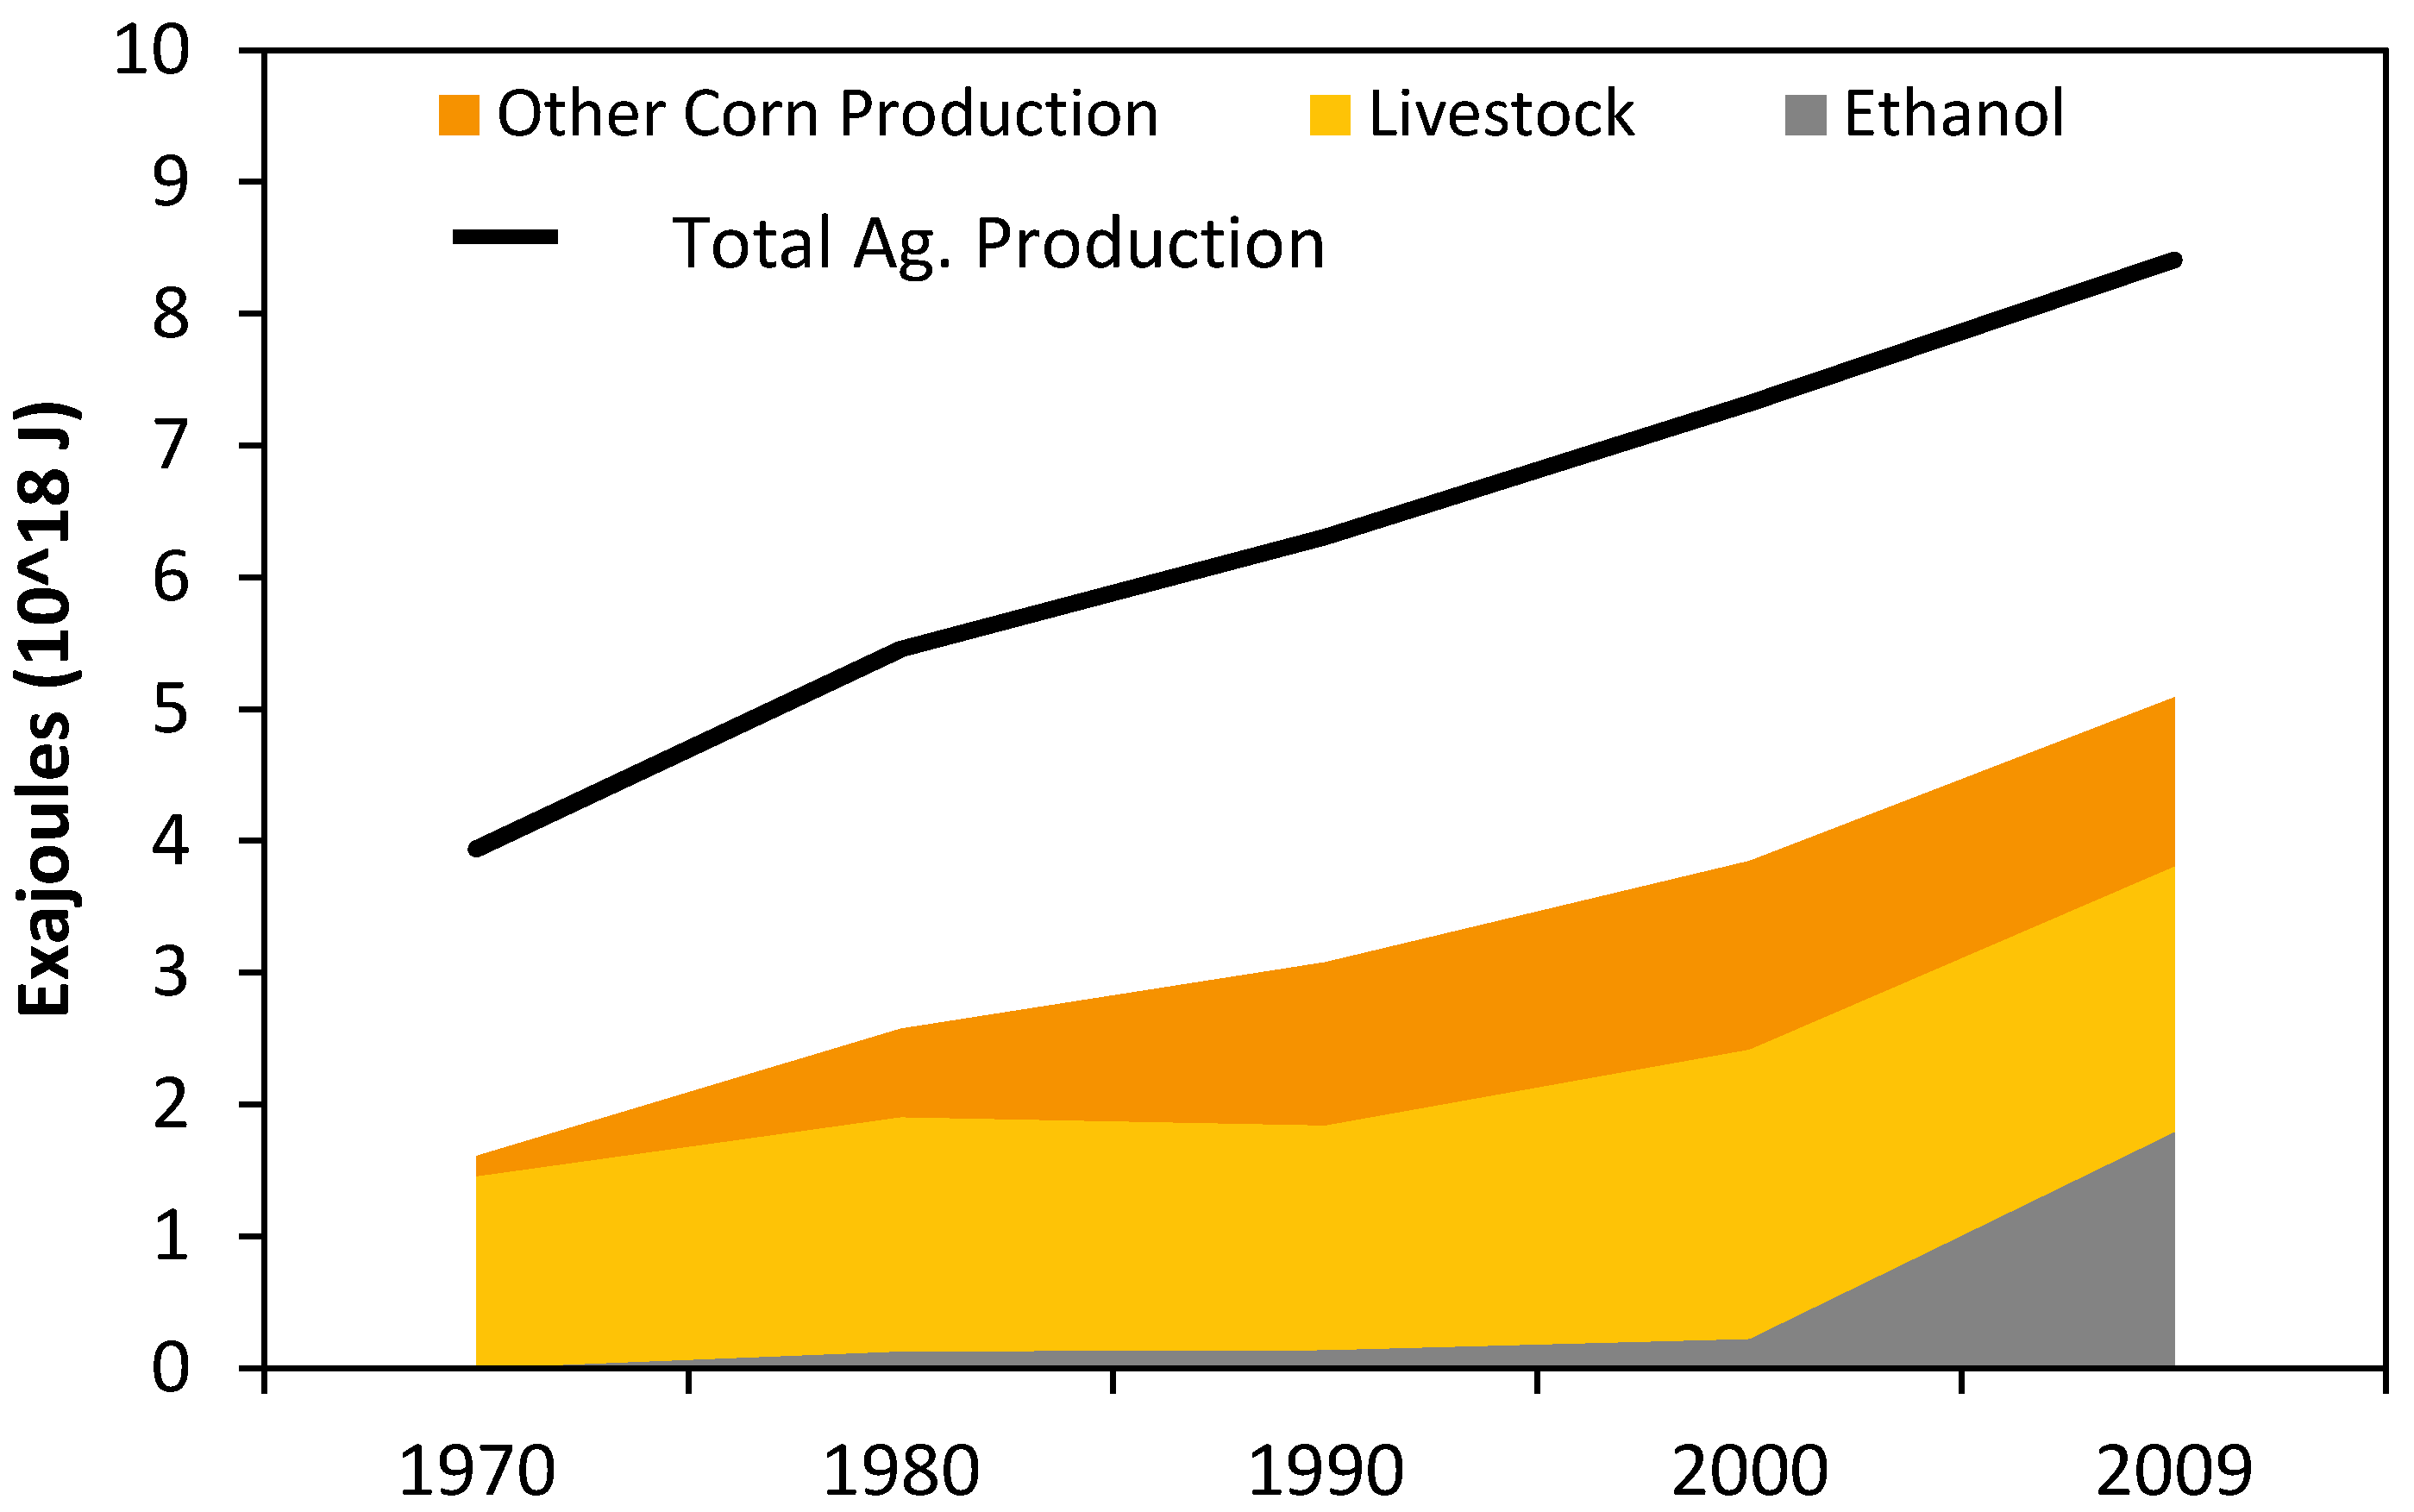
Some 1.6 to 5 EJ (1600 to 5000 PJ) of total US agricultural output is corn (
Figure 4). Of this an increasing proportion of output is for ethanol production, which is technically “edible” but does not enter the US food system. Our basic analysis does not include ethanol corn in the numerator or the energy to grow that grain in the denominator (
Table 1). If we do include this corn as output the efficiency (defined as calories out over calories in) increases, reaching 2.8:1 by 2009 (
Figure 3). While this may look as if the US agricultural system is becoming more efficient in fact what is happening is that we are producing more of an inherently more efficient product—
i.e., grain, which uses only half or a quarter as much energy per ton compared to the amount used if it were turned into meat or if instead vegetables were grown. This makes it difficult to determine as a whole whether US agriculture is becoming more efficient or is just producing a larger proportion of a low energy-intensive product. But since most studies show that corn-based alcohol returns at worst less energy, or at best only 10 to perhaps 60 percent more energy than what is invested into growing and distilling it is not clear that the output should be counted for anything [
54,
55,
56].
Figure 3.
Sensitivity Analysis of US EEE, excluding (solid line), and including (dotted line) corn feedstock for ethanol production in agricultural outputs. The dashed line indicates the EEE if the proportion of grains in the agricultural product mix is held at 1970 levels (63% of energetic output).
Figure 4.
Stacked graph of corn (maize) production in the US in energy units, by end-use, from 1970 to 2009. Total US agricultural production in energy units indicated by the black line.
Figure 4.
Stacked graph of corn (maize) production in the US in energy units, by end-use, from 1970 to 2009. Total US agricultural production in energy units indicated by the black line.
An interpretation of the energy efficiency (EEE) of individual agricultural inputs over time is provided in
Figure 5 and
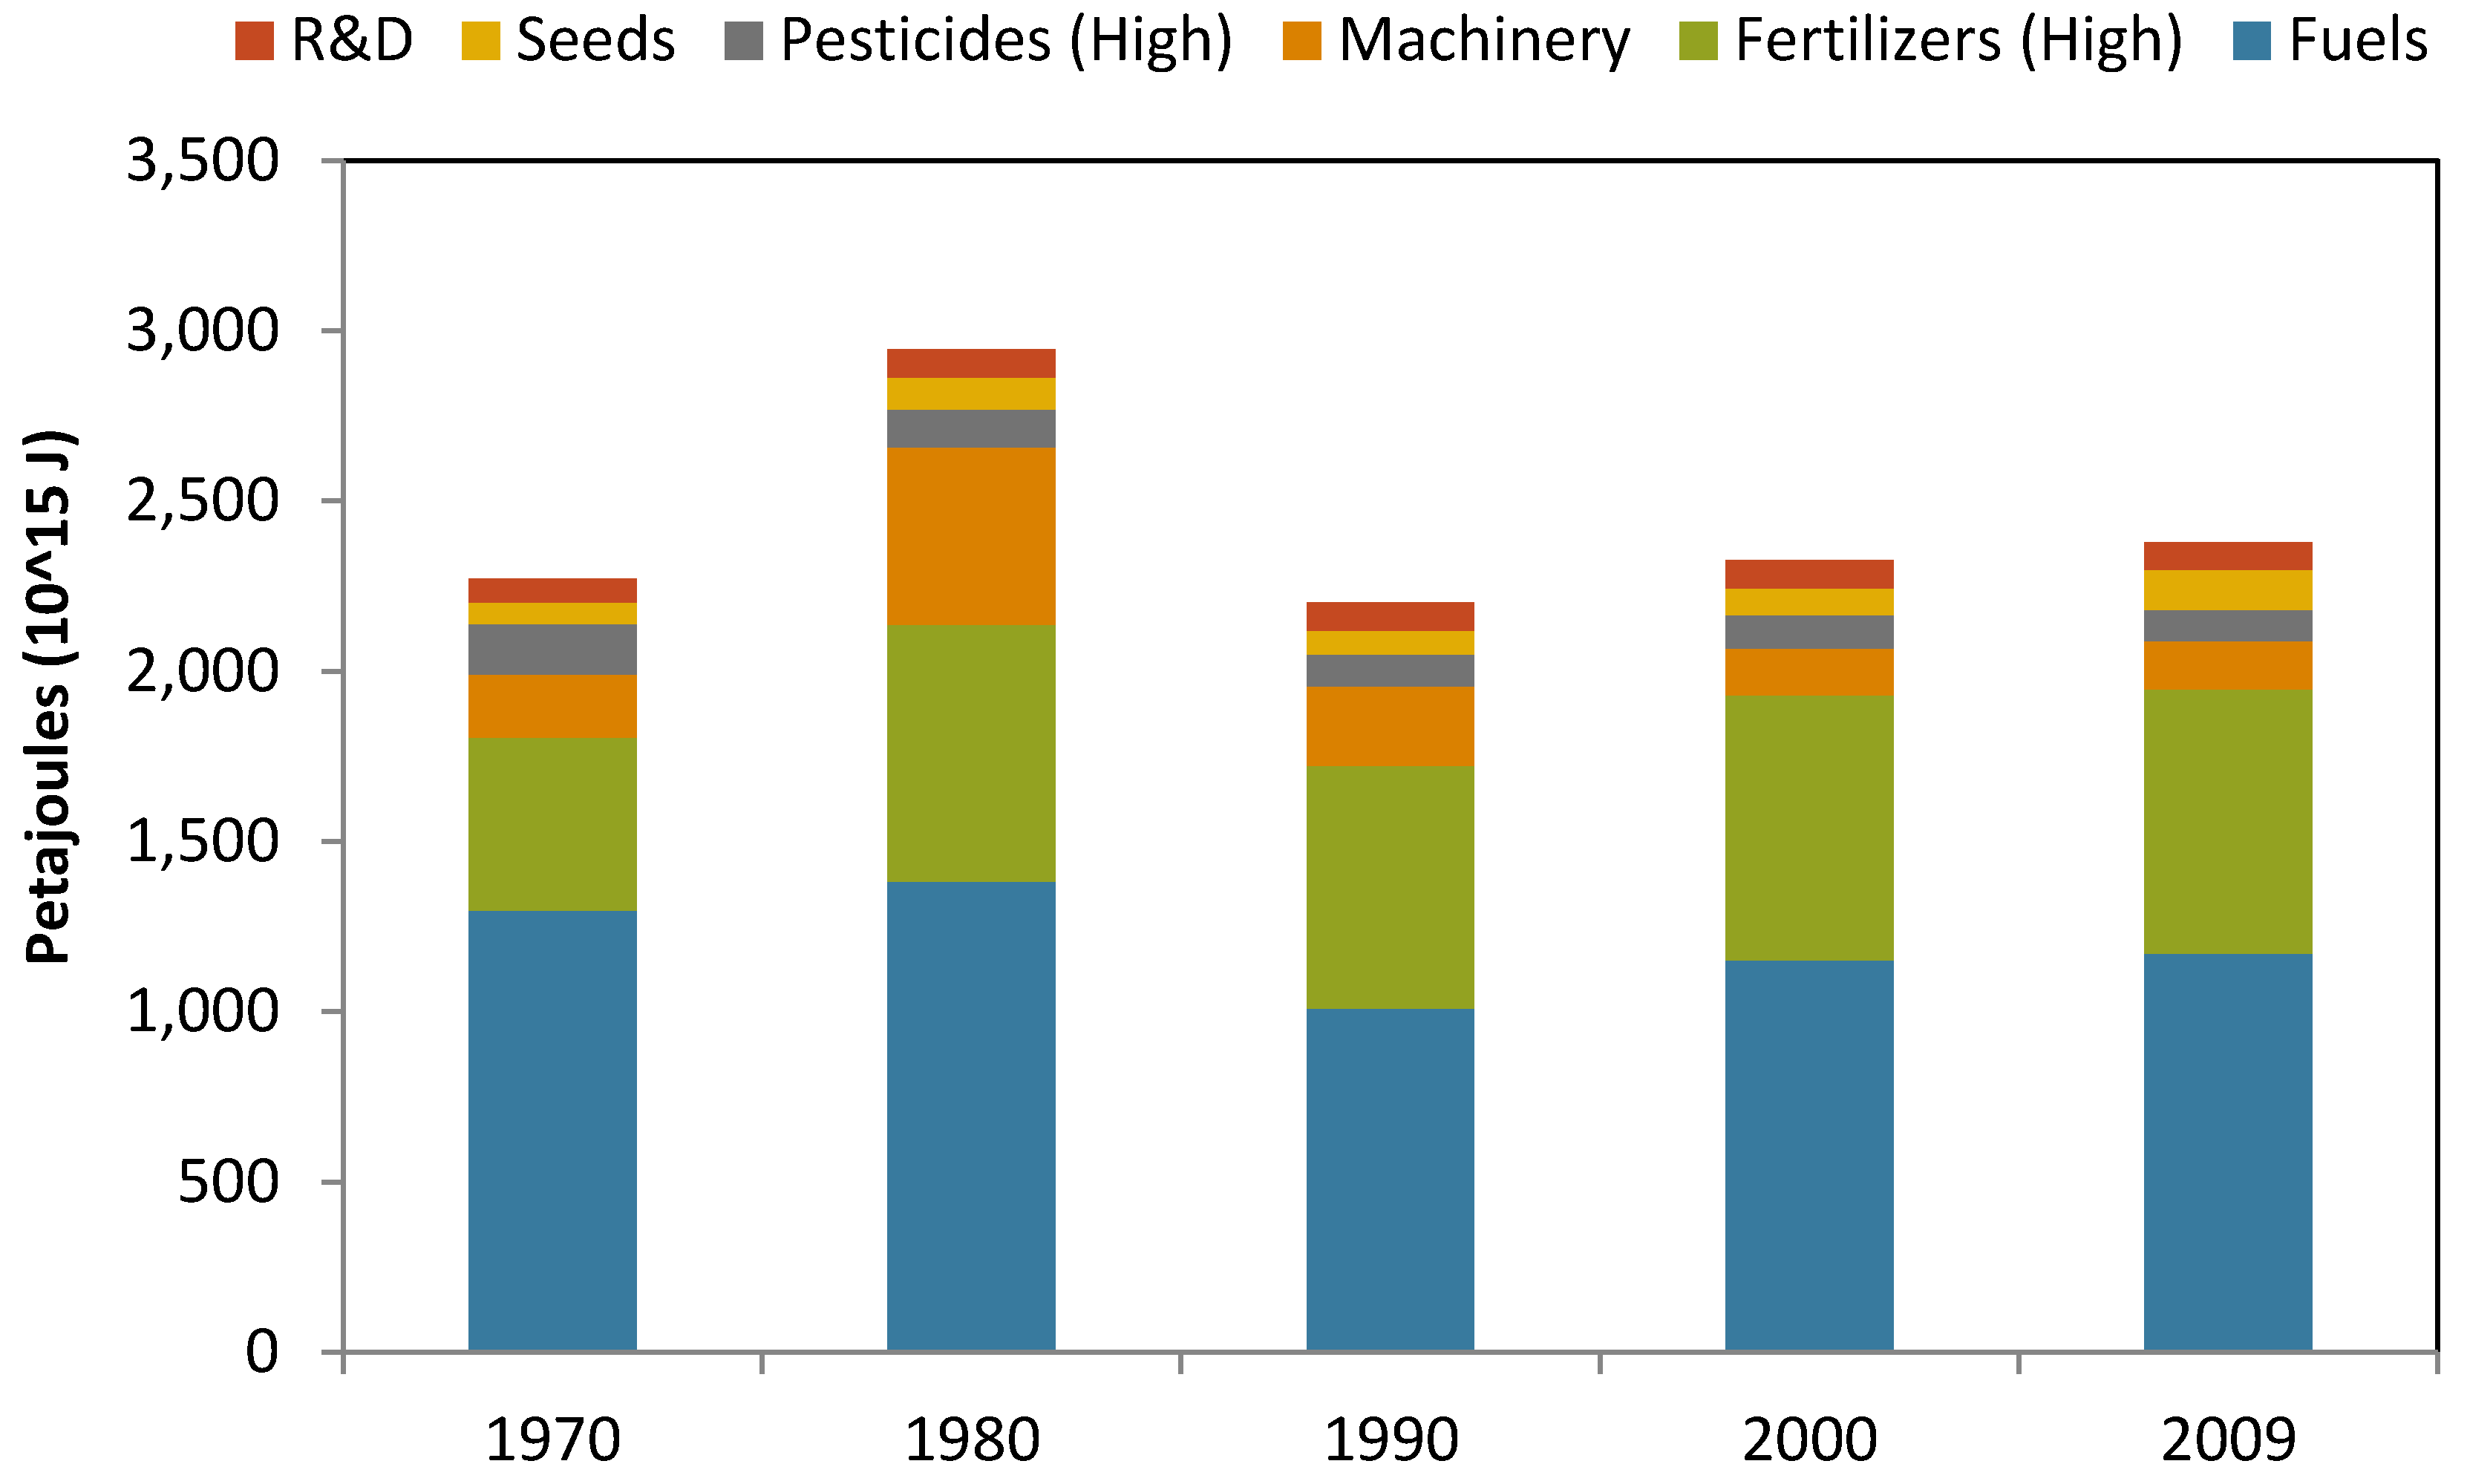
Figure 6. The reasons for the variations in EEE over time can be attributed to various inputs by undertaking an input-by-input breakdown. For example, fuel was and continues to be the largest energy input into the agricultural systems in the US and Canada. Purchases of farm equipment and other machinery increased briefly after the energy crisis of the 1970s (as reflected in the high 1980 data point) and newer machines were larger and more fuel efficient while most switched from gasoline to diesel fuel which led to improved fuel efficiency [
11,
12] (
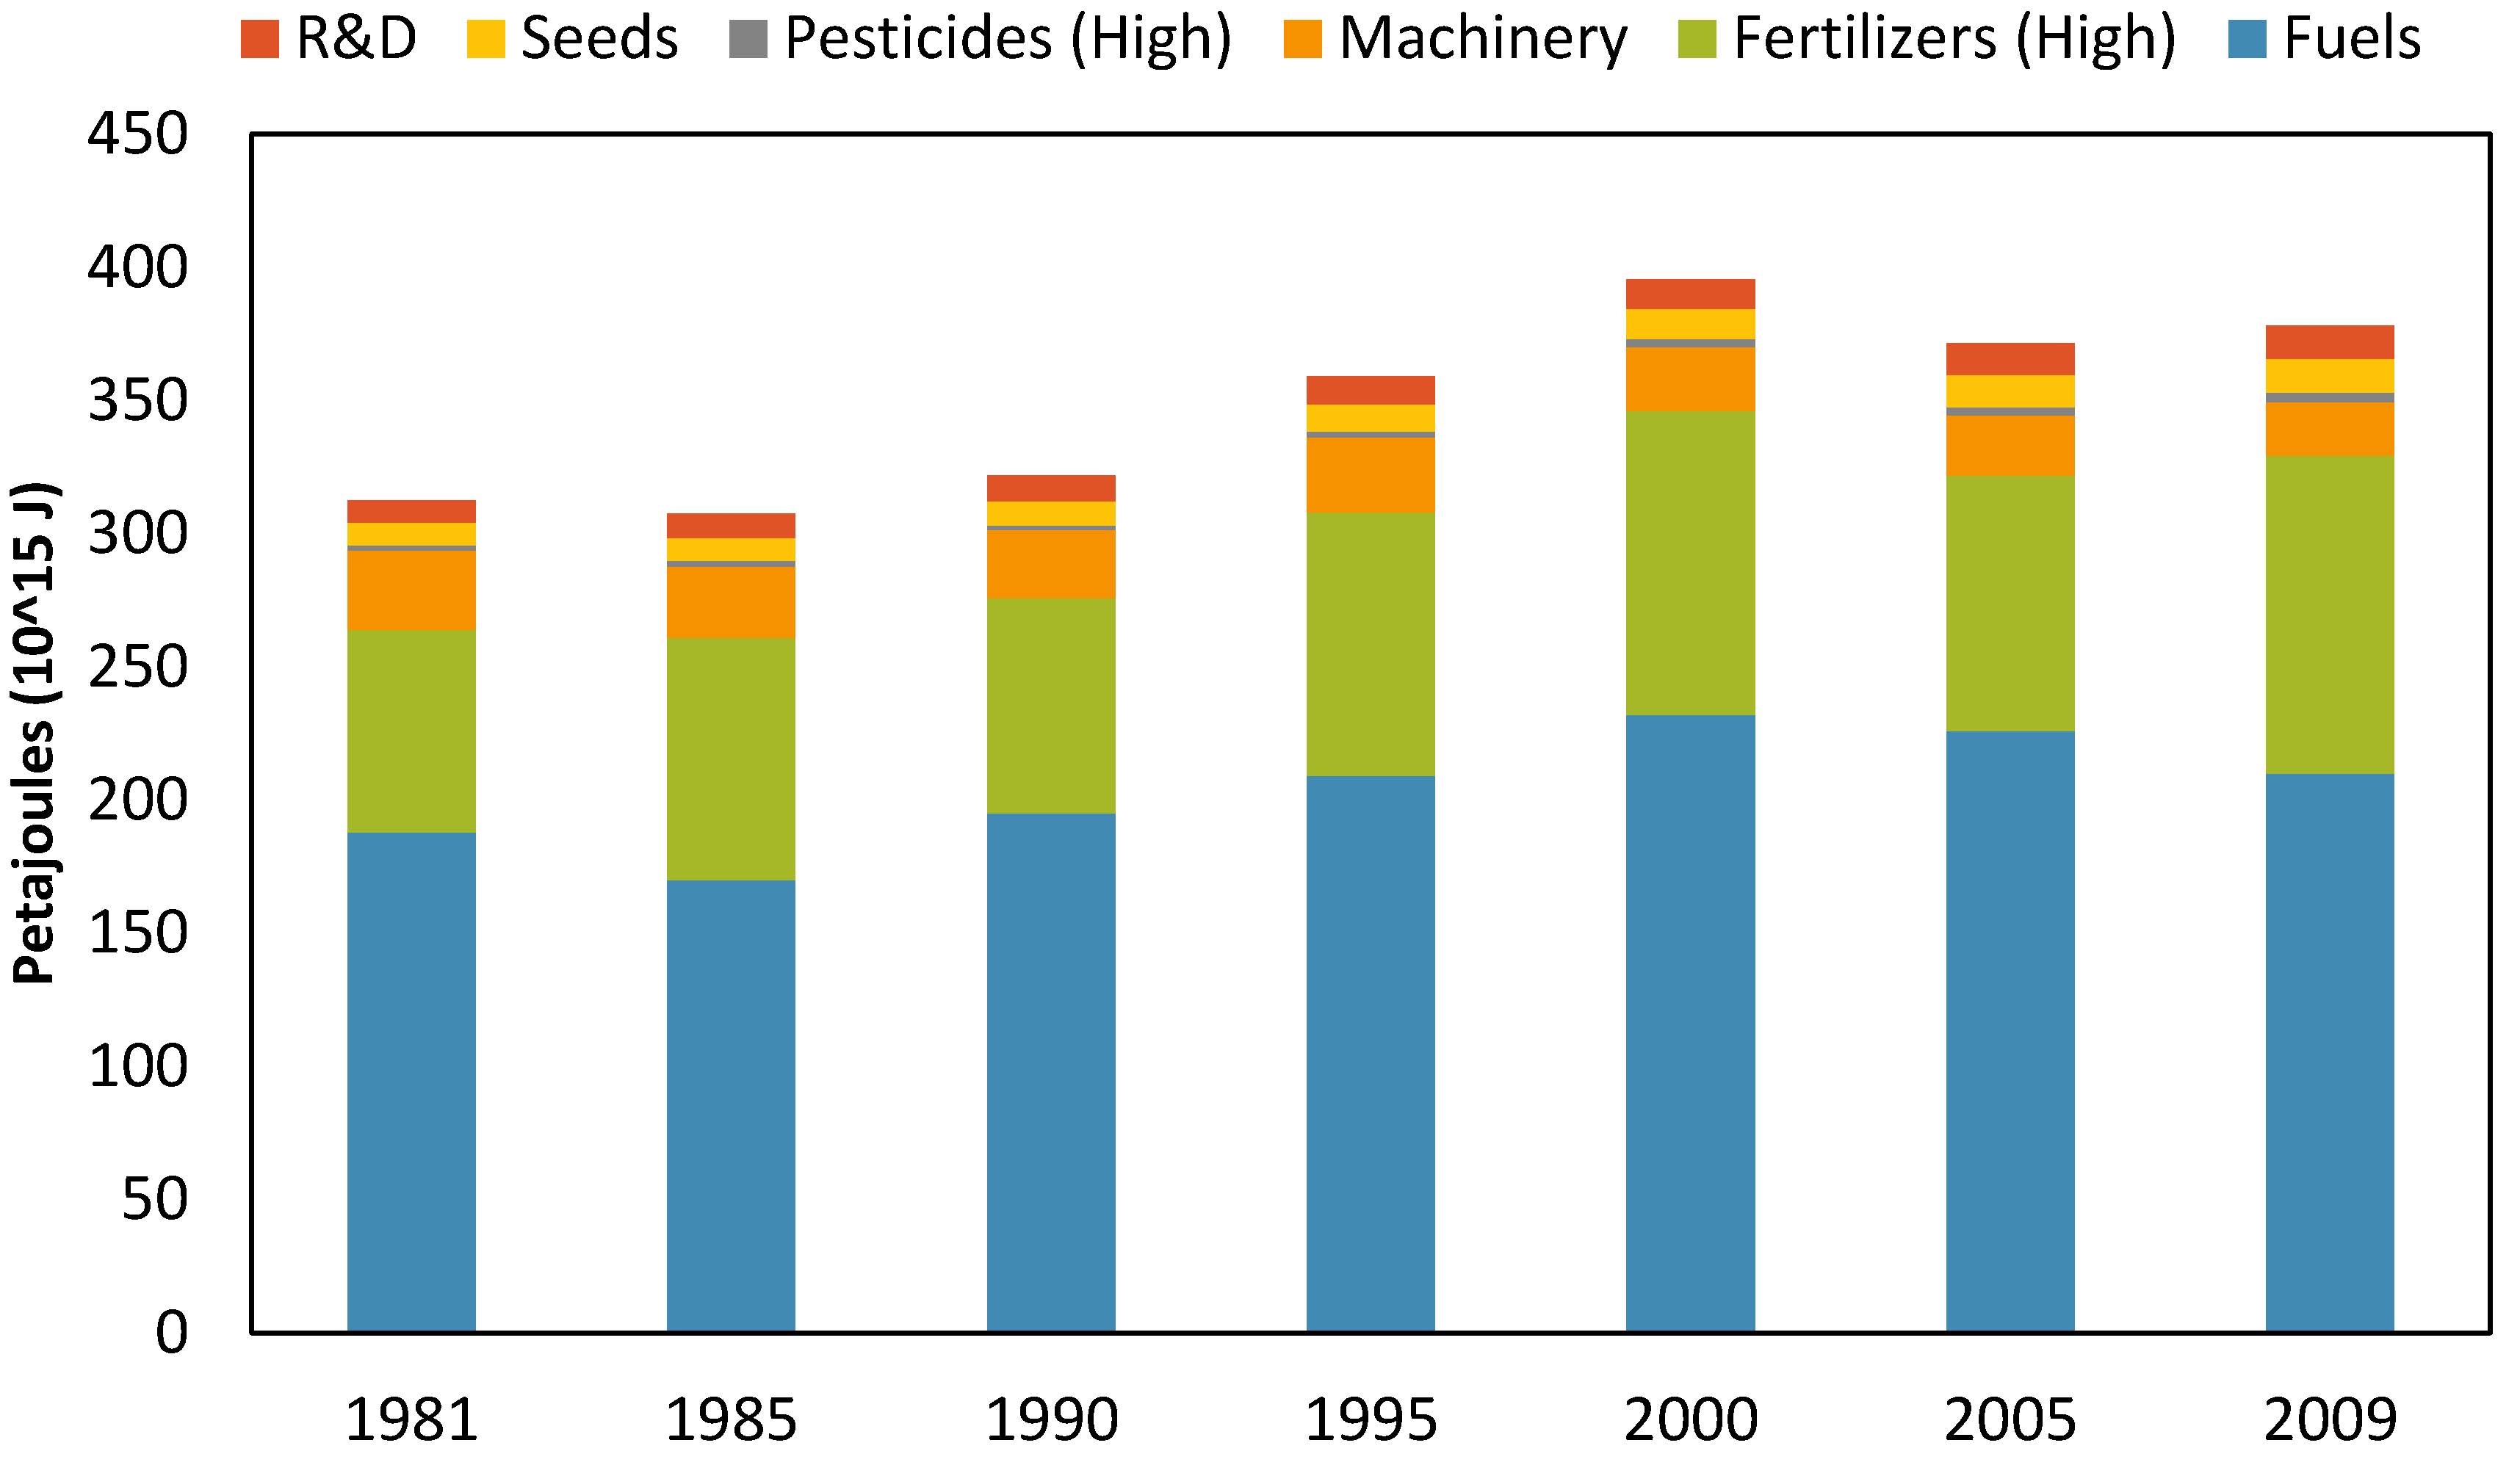
Figure 5). Despite improvements in energy efficiency, direct fuel consumption and fertilizer use continue to comprise approximately 75%–80% of all energy inputs. Fuel efficiency improved remarkably between 1970 and 1990 in the US, while fuel consumption in Canada increased from 1981 to 2000 implying no such increase in efficiency.
Figure 5.
Estimates of energy consumption in US agricultural production inputs by year and sector, 1970 to 2009. High estimates for energy in pesticides and fertilizers are used.
Figure 5.
Estimates of energy consumption in US agricultural production inputs by year and sector, 1970 to 2009. High estimates for energy in pesticides and fertilizers are used.
Figure 6.
Estimates of energy consumption in Canadian agricultural production inputs by year and sector, 1981 to 2009. High estimates for energy in pesticides and fertilizers are used.
Figure 6.
Estimates of energy consumption in Canadian agricultural production inputs by year and sector, 1981 to 2009. High estimates for energy in pesticides and fertilizers are used.
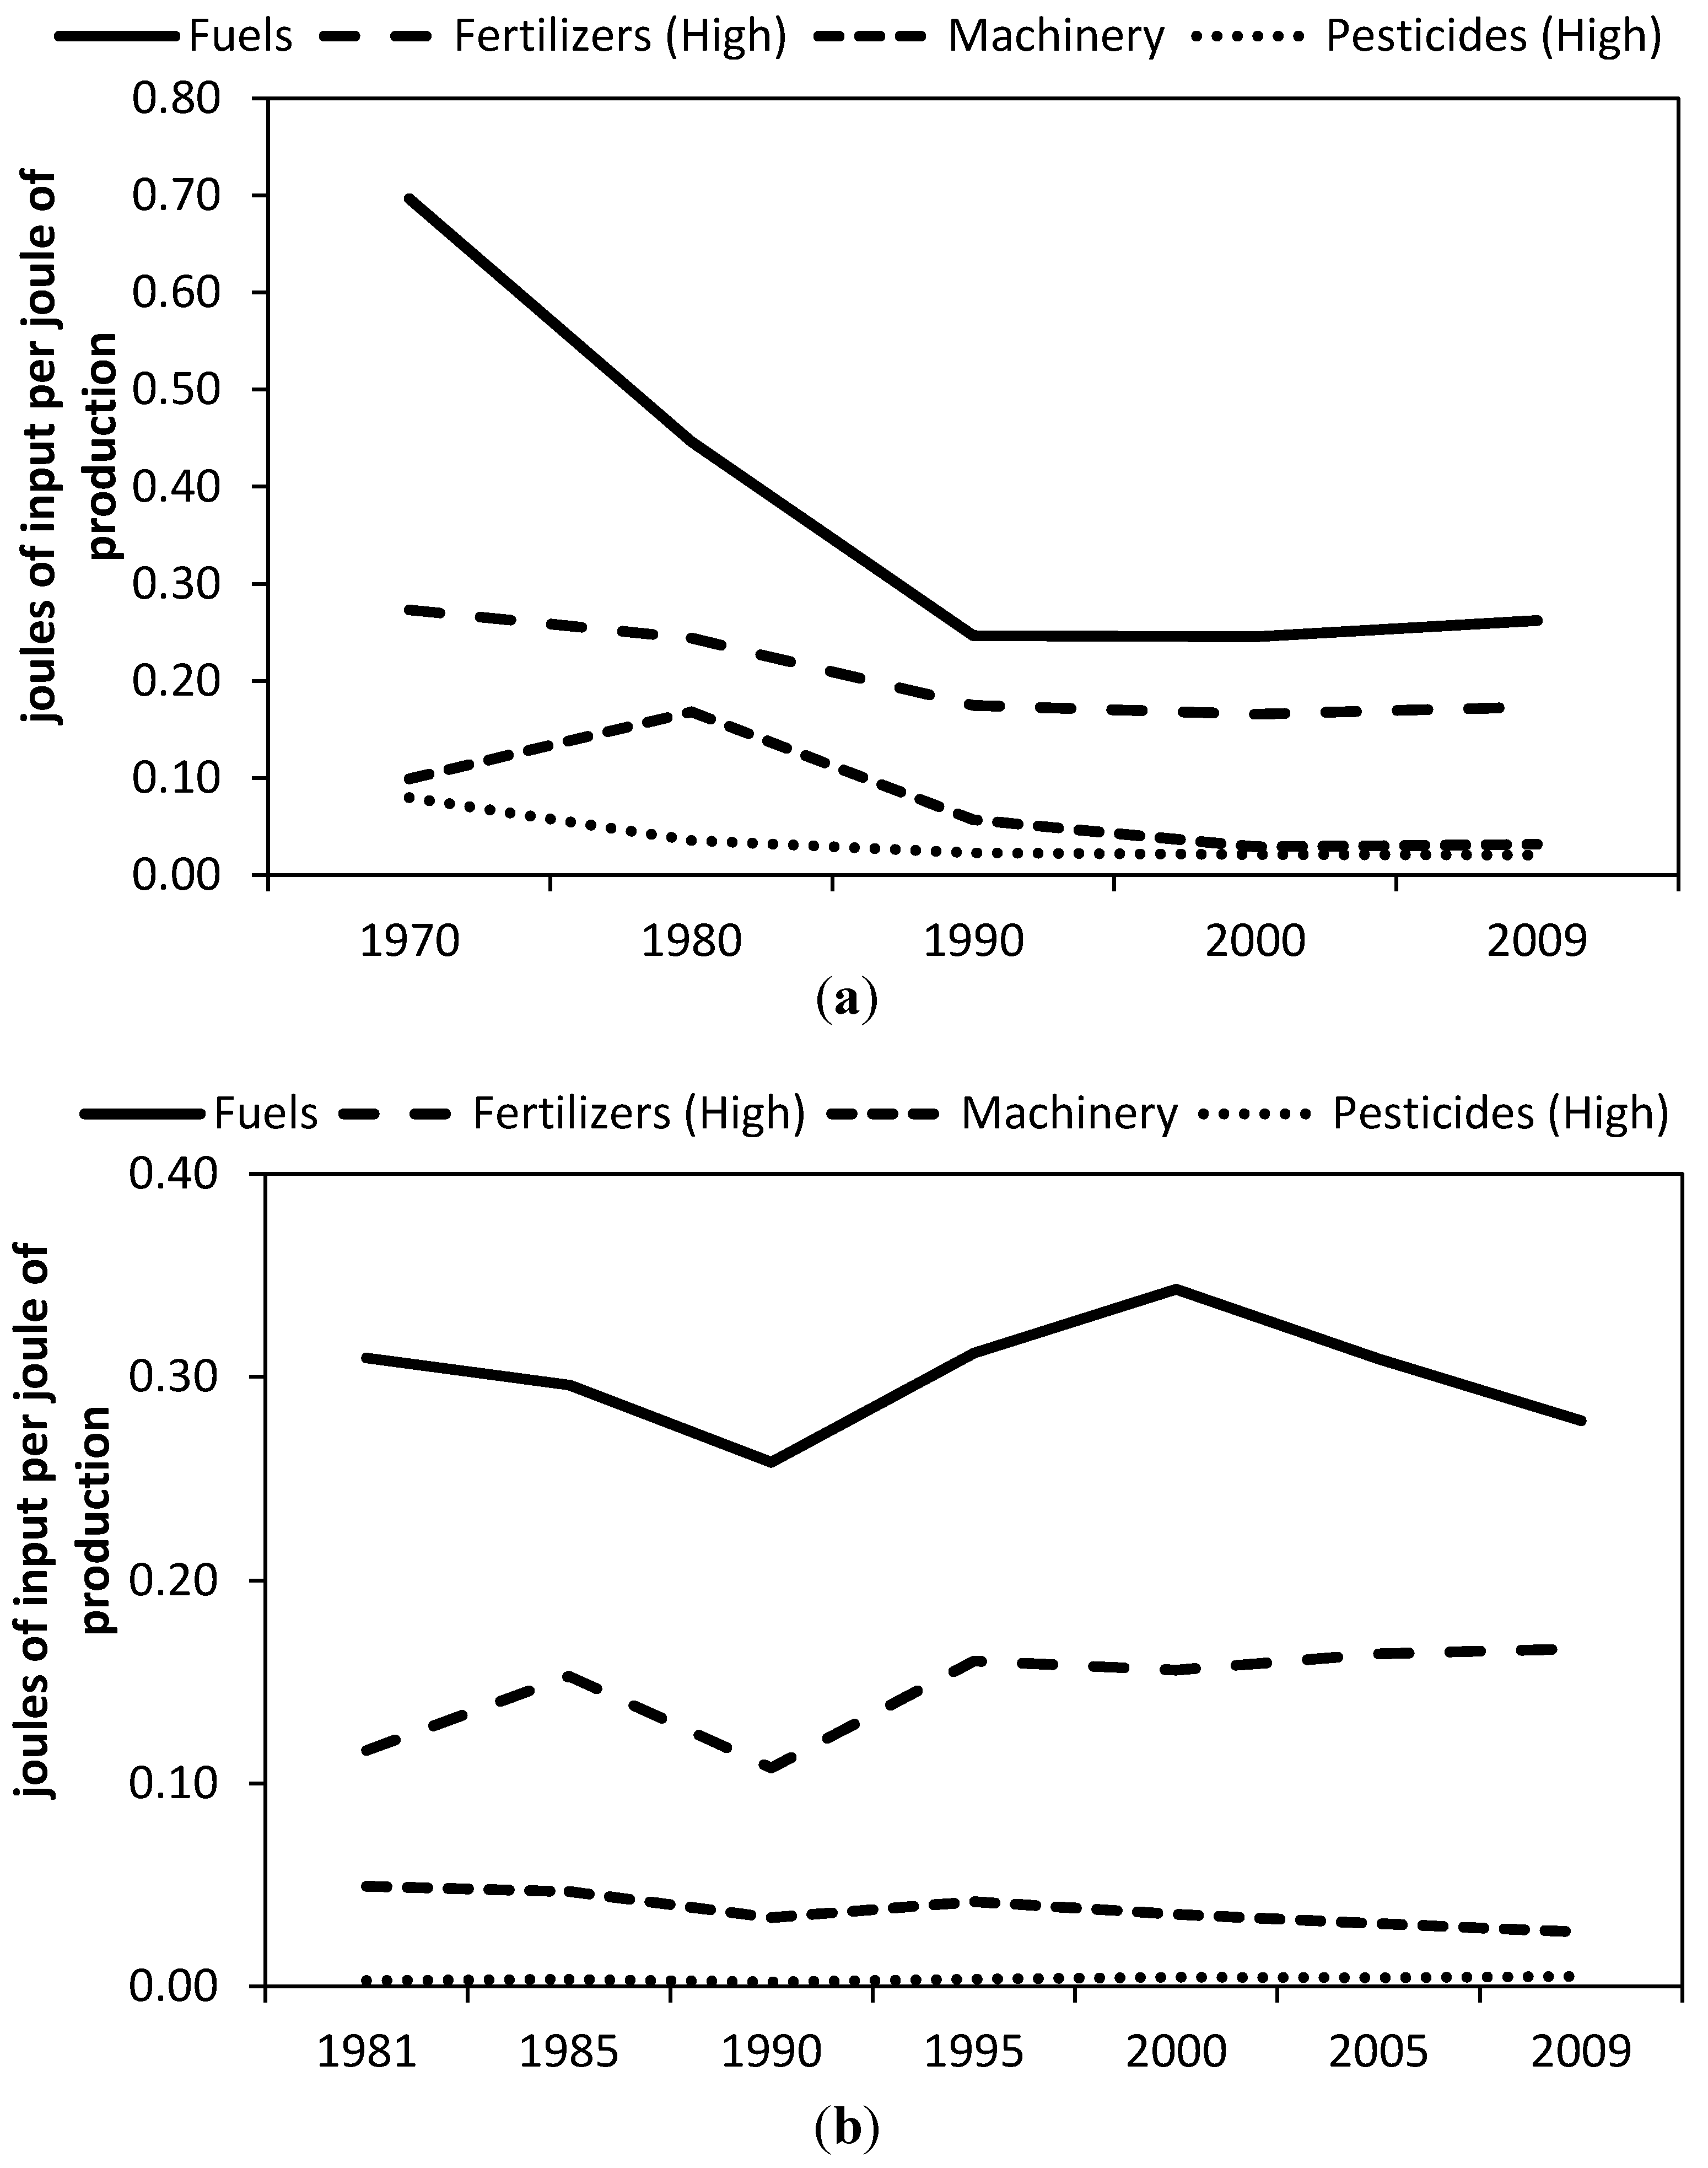
Our results indicate that fuel consumption per unit of output has decreased by more than half for the US since the 1970s to 0.26 per unit, while it has remained near 0.3 units per unit output in Canada (
Figure 7a,b). The Canadian agricultural system required increased energy inputs for pesticides and seeds since 1981, though these make up only a small portion of total energy inputs. Fertilizer consumption per unit of output has increased in Canada, while decreasing in the US.
Figure 7.
Relation of several energy inputs per unit of edible food output in (a) US and (b) Canadian agriculture.
Figure 7.
Relation of several energy inputs per unit of edible food output in (a) US and (b) Canadian agriculture.
3.2. Sensitivity Analysis of the Significance of Animal Production
The amount of grain required to feed livestock is a significant factor in determining a nation’s EEE, that is, the food energy returned per energy invested, or (edible) EROI. Environmental scientists and other environmental advocates have suggested that reducing the consumption of animal products (meat and dairy) and instead consuming grain directly as part of a vegetarian diet would increase greatly the energy efficiency of US or Canadian agriculture and result in decreased energy consumption and carbon emissions [
57,
58]. To test this assumption, we calculate the EEE for the US and Canada, assuming that all output is consumed in its grain or vegetable form, and not fed to animals. Doing so suggests that the EEE for US agriculture would increase from 0.8:1 to 1.7:1 in 1970 and from 2.3:1 to 3.5:1 in 2010. For Canada the improvements in EEE are less substantial—an increase of about 40% in both 1981 and in 2009. The difference between animal-inclusive and exclusive efficiencies is a result of the large amounts of grain needed to produce an energetically smaller amount of product.
The US has reduced the amount of grain fed directly to livestock since 1980, while increasing output. This has been a force contributing to a higher EEE for the US. It appears that this is mainly because farmers have been able to substitute byproducts from the food industry and ethanol production for grain. We performed a sensitivity analysis to determine the additional grain needed to feed livestock if the feed to meat product ratio from 1980 were held constant through 2010. Doing so reduces EEE over the past three decades, especially after 2000 (
Figure 8). Thus one can say that apparently much of the improvement in the efficiency of US agriculture appears due to recycling byproducts (or conceivably using more pasture).
Figure 8.
Results of projected scenario examining the effects of holding the grain to meat product ratio constant on US EEE.
Figure 8.
Results of projected scenario examining the effects of holding the grain to meat product ratio constant on US EEE.
3.3. Discussion of Data Constraints and Other Limitations in Our Research
Converting input expenditure data (in dollars) to energy content (in joules) allowed us to estimate the energy costs for those variables which we do not have data in physical units. We used the energy intensity of the entire economy for the year of interest to estimate the energy investment per US or Canadian dollar spent on various agricultural inputs. However, doing so introduces uncertainty. The actual energy required to produce $1,000 of seed or for $1,000 worth of R&D may differ.
3.4. Comparison with Previous Studies
There were two earlier studies of agricultural energetic efficiency in the US, one conducted by Carol and John Steinhart in 1974 [
2] and one conducted by Cutler Cleveland in 1995 [
12]. Although the methodologies differ slightly among these studies and our own, we are able to compare the energy efficiency calculations and analyze the differences between their studies and ours. Inputs included in the Steinharts’ [
2] study were: direct fuel and electricity use, energy used to create fertilizer, agricultural steel and farm machinery and to run irrigation systems. Steinhart and Steinhart’s analysis covered the energy use in the entire US food system, using physical data from governmental sources, from field to plate (but including farm gate), from 1940 to 1970. Outputs in the Steinhart and Steinhart study were based on the caloric requirements of the US population rather than using actual crop production data and also excluded US food production exports. Steinhart and Steinhart calculated agricultural efficiency in terms of caloric output versus caloric input and concluded that US agricultural energy efficiency declined from 1940 through 1970 to the point where it was getting less than a return of one energy unit of food for one energy unit of fuel, even at the farm gate (and less than one unit of food for three units of fuel at the plate).
We compared Steinhart and Steinhart’s input data with ours using only their farm gate input subtotals instead of their grand total of farm inputs (
Table 3,
Figure 9). EEE was harder to compare: Their study calculated energy efficiency after factoring in the energy to produce, transport, process, and prepare foods and considered food waste. Their estimates for food production were also based upon dietary needs instead of production data [
2]. Thus in order to compare our energy efficiency data to theirs we had to account for a processing and spoilage factor of 27% from our outputs [
59]. The exclusion of food production exports in [
2] artificially reduced EEE estimates as well.
Table 3.
Comparison of calculated US edible energy efficiency (EEE) at the farm gate. This study’s estimates use a mean of the literature values for fertilizer and pesticide energy intensities.
Table 3.
Comparison of calculated US edible energy efficiency (EEE) at the farm gate. This study’s estimates use a mean of the literature values for fertilizer and pesticide energy intensities.
| Year | 1940 | 1950 | 1960 | 1970 | 1980 | 1990 |
|---|
| This study | n/a | n/a | n/a | 0.9 | 1.1 | 2.0 |
| EEE of this study after accounting for 27% waste and processing losses | n/a | n/a | n/a | 0.6 | 0.8 | 1.5 |
| Steinhart EEE | 4.36 | 1.19 | 0.89 | 0.45 | n/a | n/a |
Cleveland’s [
12] methodology differs from our study and that of Steinhart and Steinhart [
2] because Cleveland derived energy inputs and outputs solely from economic data and thus was able to make calculations as far back as 1910. The author derived the energy content of agricultural inputs by converting the dollar value of fossil fuel and electricity consumption, and other farm input expenditures (including pesticides, fertilizers, machinery, energy used to generate electricity, and agricultural services) to physical units at extant prices, and then to energy using a dollar to energy conversion factor for the embodied energy in fuels, or for indirect energy, using energy intensities derived by the energy research group at the University of Illinois [
60,
61]. Cleveland calculated agricultural output using two data sources: first, the USDA index of total agricultural output, which includes dollar estimates of production of crops, fruits and vegetables, and animal products; and secondly the Gross Farm Product, which is the value added in the farm sector in dollars. Cleveland’s outlying 1980 point in
Figure 9 may have to do with high inflation. Cleveland calculated the energy input and energy efficiency of US agriculture at the farm gate from 1900 to 1990 and concluded that energy inputs were shrinking due to improvements in fuel efficiency, conservative irrigation and chemical applications, and other technical improvements.
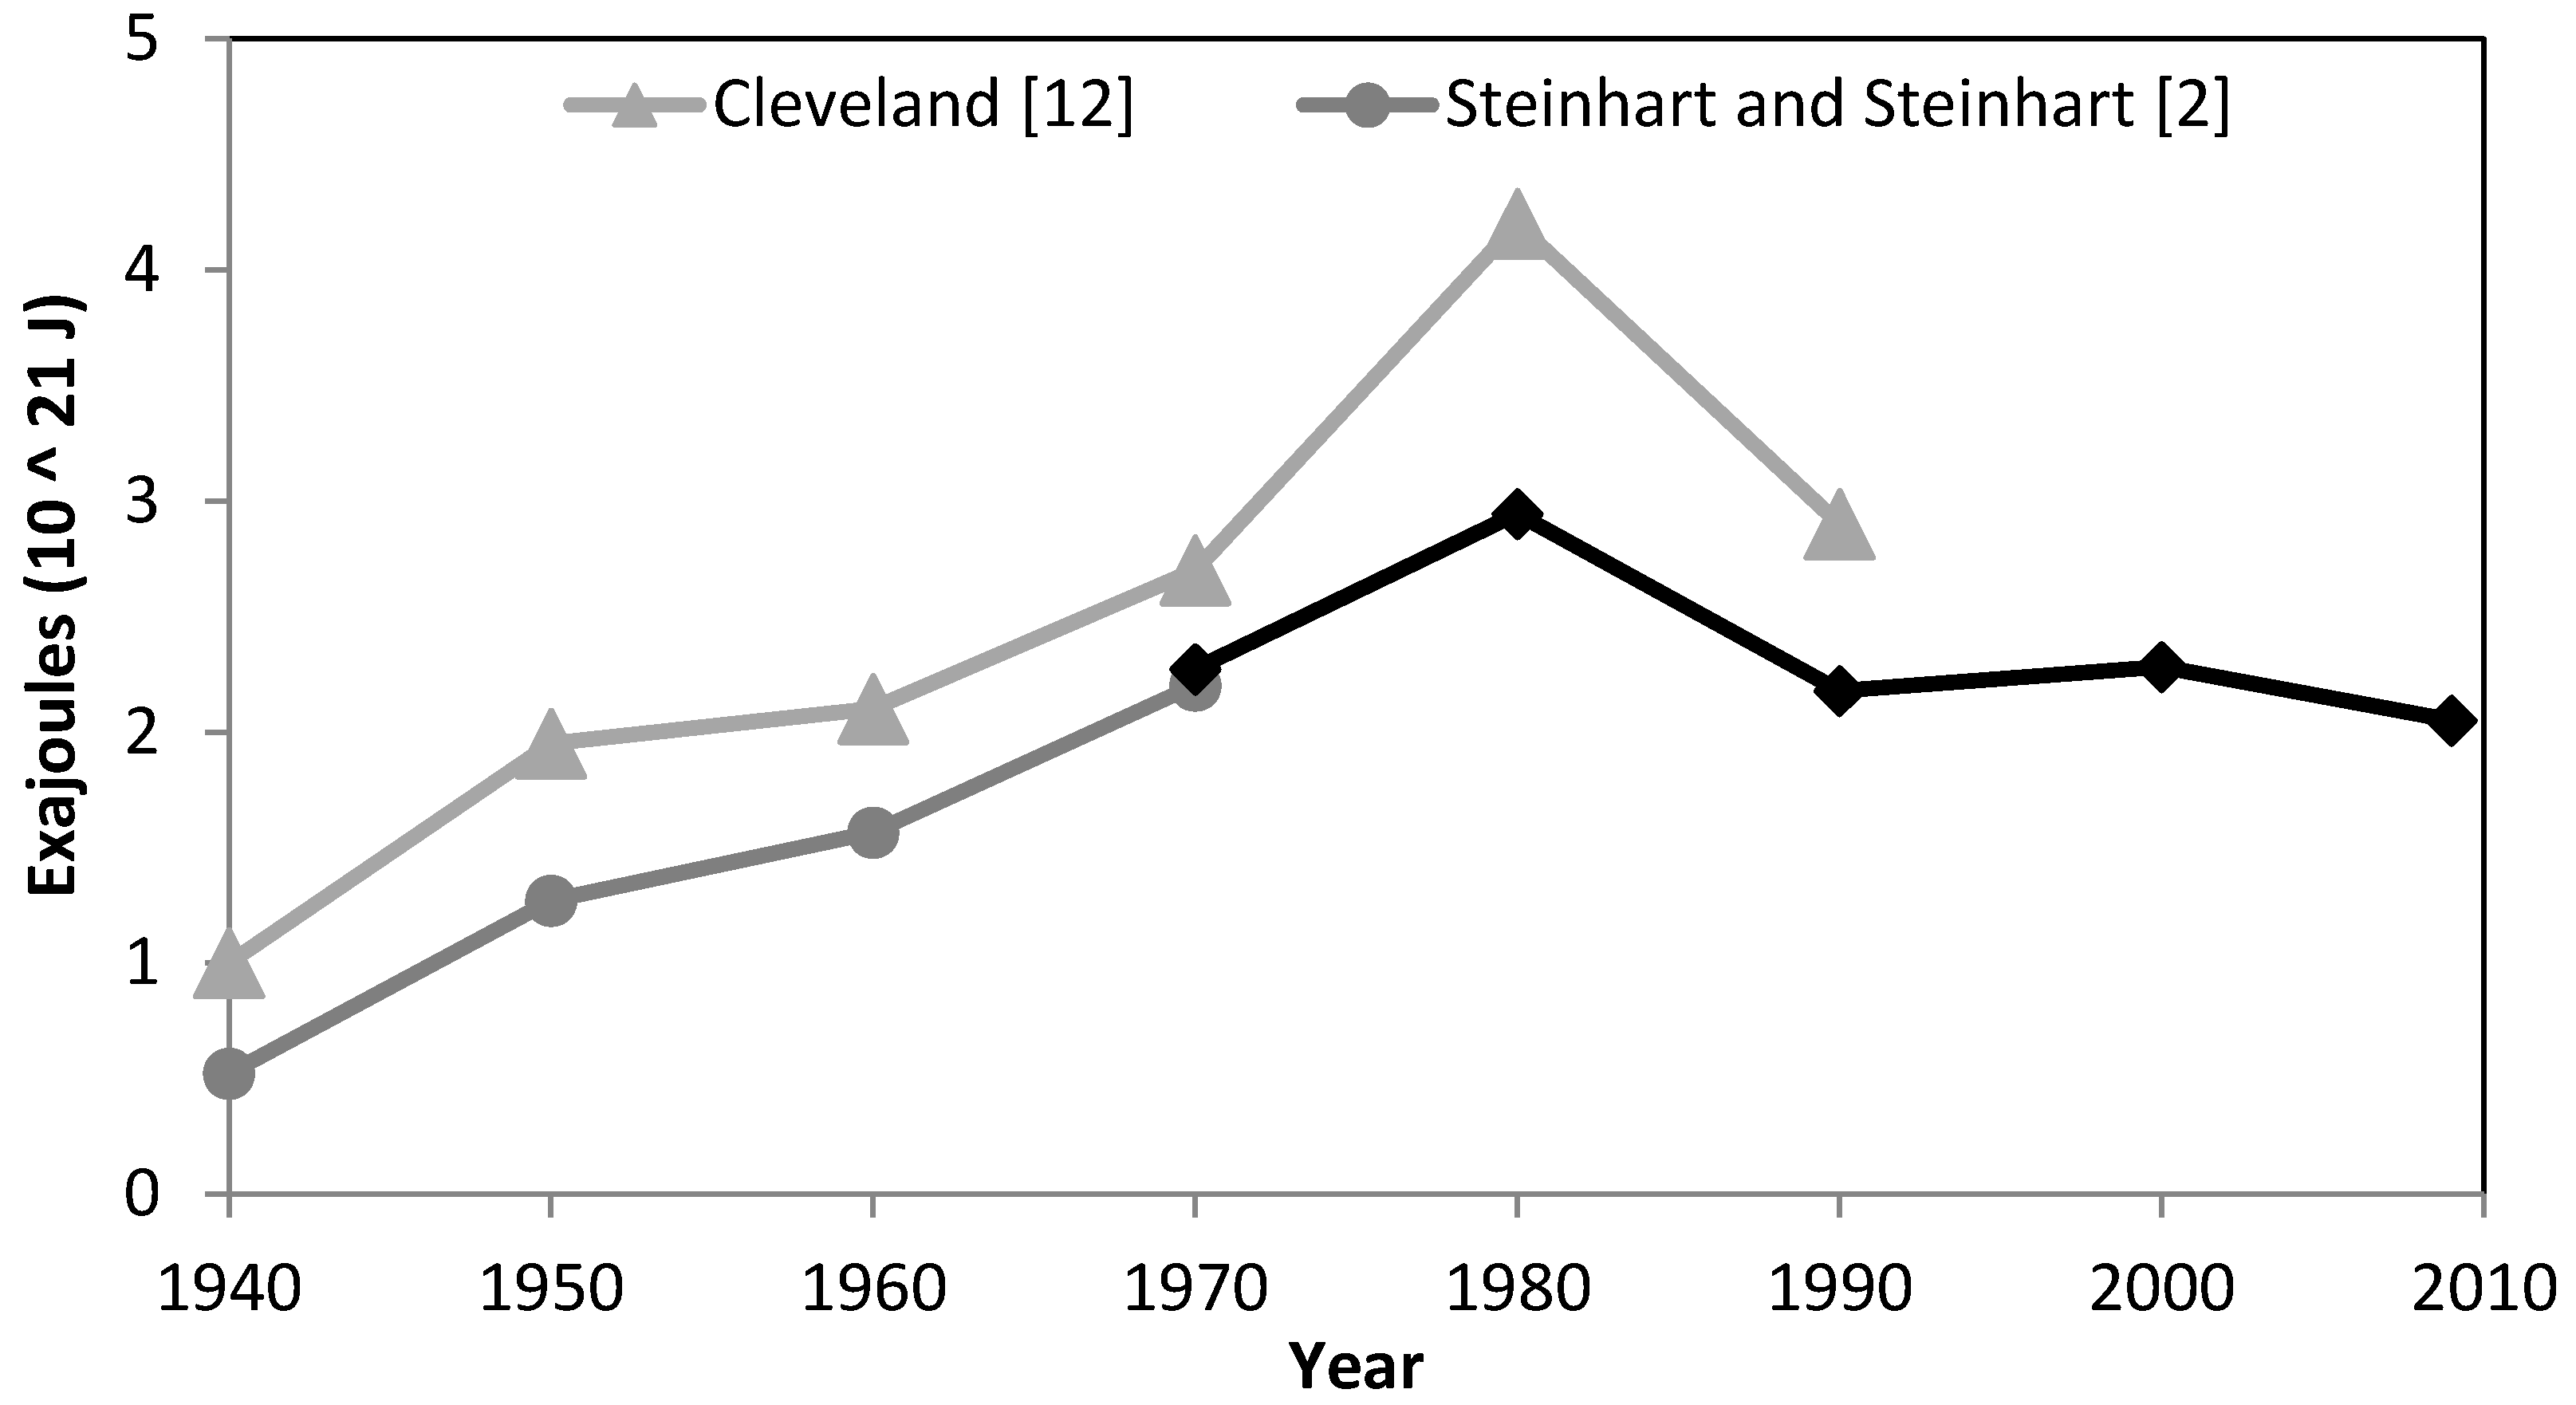
Figure 9.
Comparison of total energy input to US agriculture at the farm gate as calculated by this study, Steinhart & Steinhart [
2], and Cleveland [
12].
Figure 9.
Comparison of total energy input to US agriculture at the farm gate as calculated by this study, Steinhart & Steinhart [
2], and Cleveland [
12].
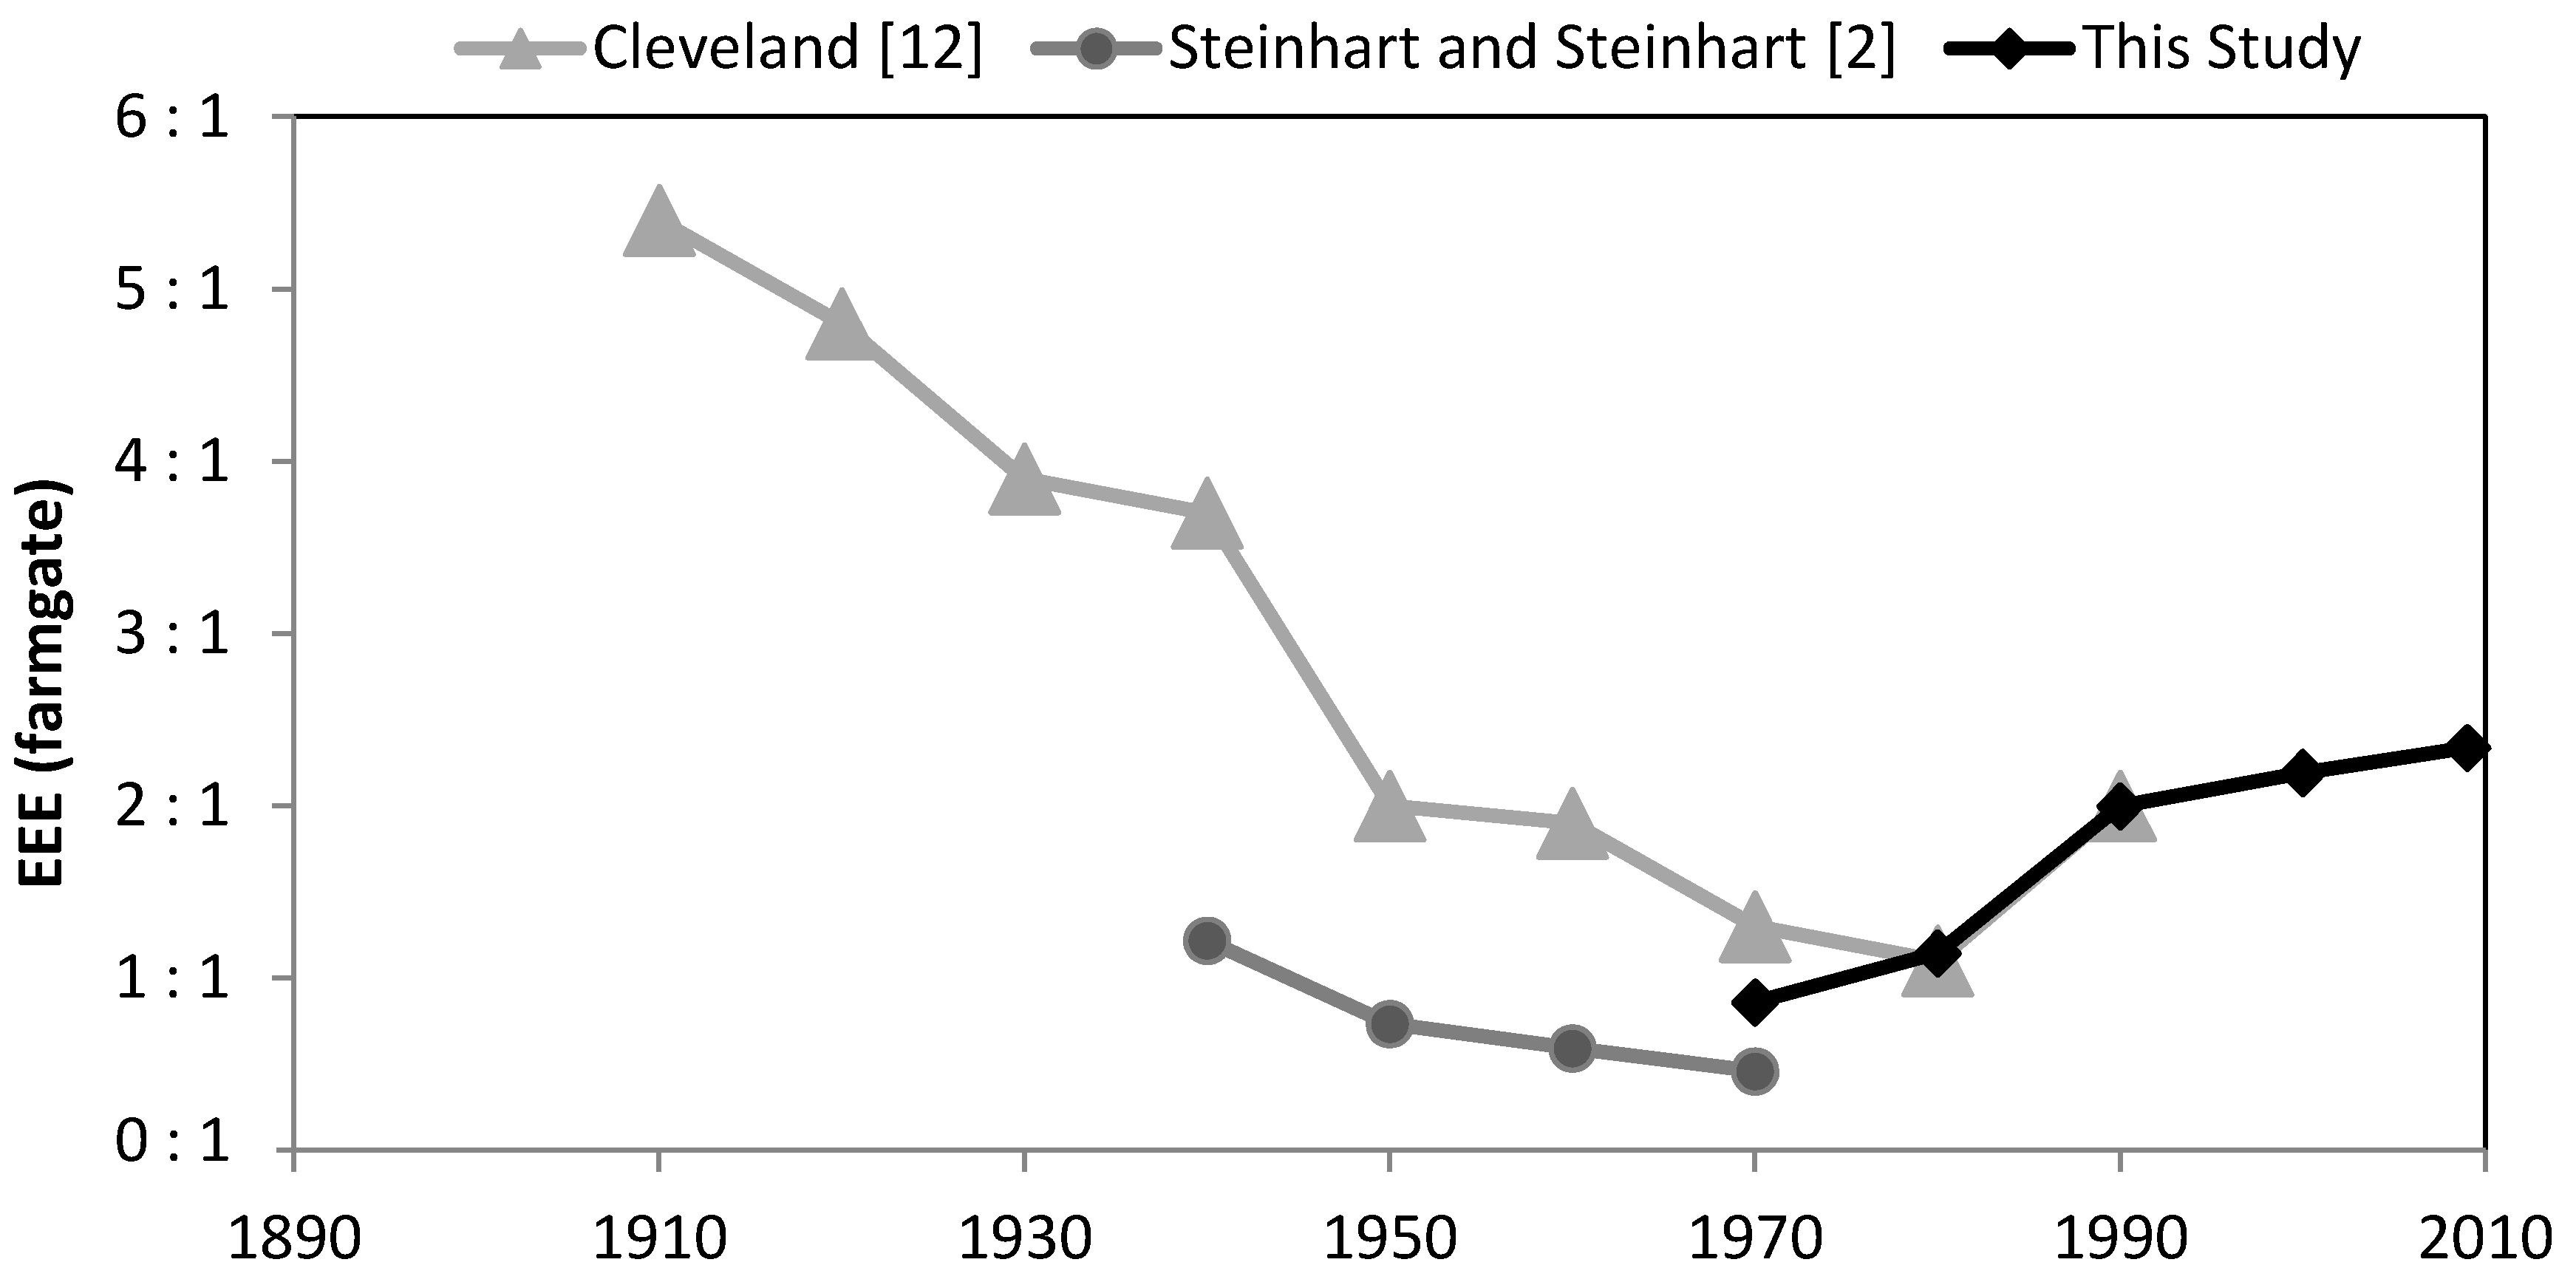
The only year in which all three datasets overlapped was 1970. Our energy input value is more consistent with Steinhart and Steinhart’s estimates; and less than Cleveland’s, however our estimates of EEE are closer to Cleveland’s estimates, which may reflect the greater importance of including food exports, or at least real production data, in the calculation of total agricultural production
(Figure 9 and
Figure 10).
Figure 10.
Comparison of edible energy efficiency (output/input) at the farm gate between this study, Steinhart & Steinhart [
2], and Cleveland [
12].
Figure 10.
Comparison of edible energy efficiency (output/input) at the farm gate between this study, Steinhart & Steinhart [
2], and Cleveland [
12].
The difference between our calculated EEE values and those by the other authors may be due to differences in the inputs considered for the analysis, and the fact that we used a mix of physical and monetary energy inputs. Steinhart and Steinhart used purely energetic inputs while Cleveland used purely monetary inputs multiplied by a dollar to energy conversion factor described above.
Overall, all of these results seem similar (
Figure 10) given the different methodologies utilized and the difference in the value of variables accounted for in each study. The clear long term trend for US EEE is a general decline until 1970 which almost certainly reflects the general increase in use of industrial inputs to US agriculture, for example the use of tractors instead of mules and commercial fertilizer
vs. manure, and then a smaller increase in energy efficiency from 1970 through the present day. One conclusion is that since 1950 it has taken roughly one unit of fossil energy to generate two average units of food energy at the farm gate in both the US and Canada (
Figure 2 and
Figure 10).
4. Conclusions
Despite millions of dollars spent on research and development and improving yields from the use of fertilizers, pesticides, and genetically modified crops, there does not appear to be a clear trend towards increasing edible energy efficiency of agricultural production in Canada or the United States in the past two decades other than that which can be attributable to growing intrinsically more efficient crops or using plant wastes more effectively. The US EEE increased from 1970 to 1990 but the magnitude of more recent increases has been much smaller. Canadian EEE has varied about a mean, and demonstrates no clear trend. Crop production is continuing to increase in both countries, while the inputs required for this level of crop production—machinery and fuel, pesticides, fertilizers, seeds—have decreased slowly in the US, but increased in Canada. The EEE in the US appears to be sensitive to the decrease in the amount of grains dedicated to feeding livestock. In the US, the EEE and efficiency of converting grain to animal products appear to be especially sensitive to the increasing amount of grain used to produce ethanol and the ability of animal product producers to incorporate the by-products of ethanol in animal feeds. There is little efficiency gain if these two factors are subtracted out.
Although the efficiency of US (and less clearly Canadian) agriculture appears to be increasing, agricultural production in both countries remains very energy intensive (especially in terms of oil and gas), using roughly two to four percent of all US energy, and three to six percent of petroleum. It then takes roughly three to four times this amount, again mostly oil and gas, to deliver the food to the consumer’s plate [
62]. But the rate of production of petroleum no longer increases as it once did and is likely to decrease in future decades [
22]. Given that the human population is very high and still growing, and that growing the food for these people is very energy-intensive, the future for food production globally is something to be concerned about. Since the energy-intensive processes of the US and Canada have been spreading throughout the world this is especially of concern in many poorer countries where the cost of food is a much greater portion of total income. Fortunately both the United States and Canada appear to have considerable ability to alter the amount of edible food they produce, because only a relatively small portion of food production is eaten directly. This may not continue to be the case if we are called upon increasingly to feed the rest of the world if and as global petroleum production decreases, as it inevitably will. From our perspective this is one of many important reasons to talk more about global population growth and its relation to resource availability, something that seems to have nearly disappeared from our scientific and political discussions.


