1. Introduction
It has been well known that the deployment of electric vehicles (EV) can reduce greenhouse gases emission and fossil fuel consumption. In addition, the development of EV was accelerated due to rising oil and gas prices, advances in battery technology,
etc. [
1,
2]. Unfortunately, EV still faces some constraints including high investment cost, long charging time, and short driving range. Although the running cost of EV is lower than the conventional vehicles with internal combustion engines, the production cost of EV is significantly higher [
3]. Therefore, a value-added utilization of EV is required to increase its economic performance. In addition, large-scale deployment of EV will influence significantly the power system, especially when the uncontrolled charging and discharging are at a high rate. To overcome this kind of problem and increase the economic benefit of EV, the concept of vehicle to grid (V2G) has been developed [
4].
The utilization of EV in supporting the grid electricity has been studied previously by many researchers [
5,
6,
7,
8,
9]. This utilization is possible as both charging and discharging behaviors are controllable leading to the possibility for scheduled charging and discharging. Hence, the parked and plugged EVs can be considered as a potential battery having capability to absorb, store and return the electricity from and to the grid, respectively. V2G can be realized in case three essential requirements are fully fulfilled: (1) electricity connection between EV and grid; (2) communication facilitating control flows between EV and operator; and (3) metering system providing fair measurement [
10]. In this V2G system, certain grid operator or energy management system (EMS) can send a request for power to a number of parked and plugged EVs to feed their electricity to the grid or conversely to store the electricity from the grid.
V2G allows several ancillary services to the grid including load leveling, spinning reserve, and storage [
11,
12]. The distributed EVs also offer a massive energy storage that could be utilized to balance the fluctuating supply [
13,
14]. In addition, as EVs are mobile, they can be utilized as energy carrier delivering the electricity in different places and time due to price difference or emergency condition. From an economic point of view, the utilization of EVs in V2G is feasible as the estimated profit is higher than the current market price of EV batteries although considering the wear of battery. This analysis has been validated using an actual cycle life data of EV battery cells [
15].
It is well known that the battery covers the largest share of the total cost of EV. As the number of EVs increases, the quantity of their used batteries increases accordingly. EV battery is generally replaced once its storage drops to about 70%–80% of its initial capacity because the possible driving range becomes shorter [
16]. Hence, although these used EV batteries are not suitable anymore for EVs, they can be utilized as stationary energy storage. This utilization can improve the overall economic efficiency of EV and decrease the environmental impacts due to longer battery end-of-life [
17,
18]. The concept of used EV batteries reutilization as stationary battery supporting EMS or grid has been reported in some previous works [
19,
20].
Unfortunately, although many theoretical studies related to both EVs and used EV batteries have been reported, there is a lack of study reporting on real application results. Hence, this study focuses on the utilization of EVs and used EV batteries to support the electricity in certain small-scale EMS covering both theoretical and practical studies. However, as many papers have reported on theoretical analysis, this paper will focus mainly on the report of our demonstration tests and their analyses.
2. EV Utilization for Grid Support
2.2. EV Utilization Schemes
Due to the characteristics of EVs, they can be utilized in supporting the grid electricity as energy storage and ancillary services. As energy storage, EVs can be charged when the electricity price is low due to surplus electricity such as renewable energy (RE) and excess power. In addition, the ancillary services from EVs to the grid could include frequency regulation and spinning (synchronous) reserve. These services are necessary to maintain the grid reliability or to balance the supply and demand.
Figure 2 shows the possible utilization schemes of EVs in supporting the grid electricity. Basically, the utilization of EVs in the electricity market can be performed through two types of contract: direct and aggregator-based contracts. A real time data collection in a certain frequency from EVs including state of charge (SOC), position and estimated arrival time is conducted by vehicle information system (VIS). VIS may be owned and operated directly by EMS, aggregator or it is independent as service operator providing EV information to EMS and aggregator.
Figure 2.
Possible utilization schemes of EV to support grid electricity: (a) direct utilization scheme; (b) aggregator-based utilization scheme.
Figure 2.
Possible utilization schemes of EV to support grid electricity: (a) direct utilization scheme; (b) aggregator-based utilization scheme.
In direct contract, the EV owners have the service contract directly with electricity-related entities. In this scheme, both the electricity and information are handled privately. Hence, it is well-suited for a relatively small-scale EMS, such as BEMS and FEMS, and in where EVs are parked and connected for a relatively long time, for example during working hours. The main benefit of this scheme is that it could maximize the profit of the involved entities. In addition, the charging and discharging controls are easier to use, as EVs are directly connected and fully controlled by EMS. The current study focuses on this type of utilization scheme.
On the other hand, in an aggregator-based contract, EV owners have service contracts with the aggregator. Hence, there is no direct contract between EV owners and EMS or other electricity-related entities. The information including its position and battery condition is basically handled by aggregator via VIS. Furthermore, aggregator will negotiate for electricity business with the electricity-related entities such as EMS or electricity utilities. This kind of utilization scheme is prevalent for relatively large-scale EMS or electricity utilities. EVs which are taking part in the offered ancillary service programs may be distributed in different locations, such as charging stations and parking areas. The electricity to and from EVs may be transferred via power wheeling system through the available transmission and distribution grids. Aggregator offers some possible ancillary services to the EV owners. In turn, EV owners can choose them and receive their profit payment from aggregator.
Load leveling correlates strongly with the management of both demand and supply of electricity. Its aim is lowering the total power consumption in peak hours by shifting the load from peak to off-peak hours. Load leveling can be performed through peak-shift and peak-cut. Peak-shift is defined as moving the electricity load during peak time to off-peak time. It could be achieved through utilization of stationary battery or other power storage devices. On the other hand, peak-cut is defined as the effort to reduce the electricity purchased from the grid by generating or purchasing the electricity. In reality, it could be performed through harvesting the energy especially during peak hours, such as RE, or by purchasing the electricity from other entities including the plugged EVs. In this case, EV is considered as energy storage and carrier which is storing and transporting the electricity from different times and places. Hence, the economic performance of EV can be increased by joining this kind of ancillary program.
2.3. EV Integration to Small-Scale EMS
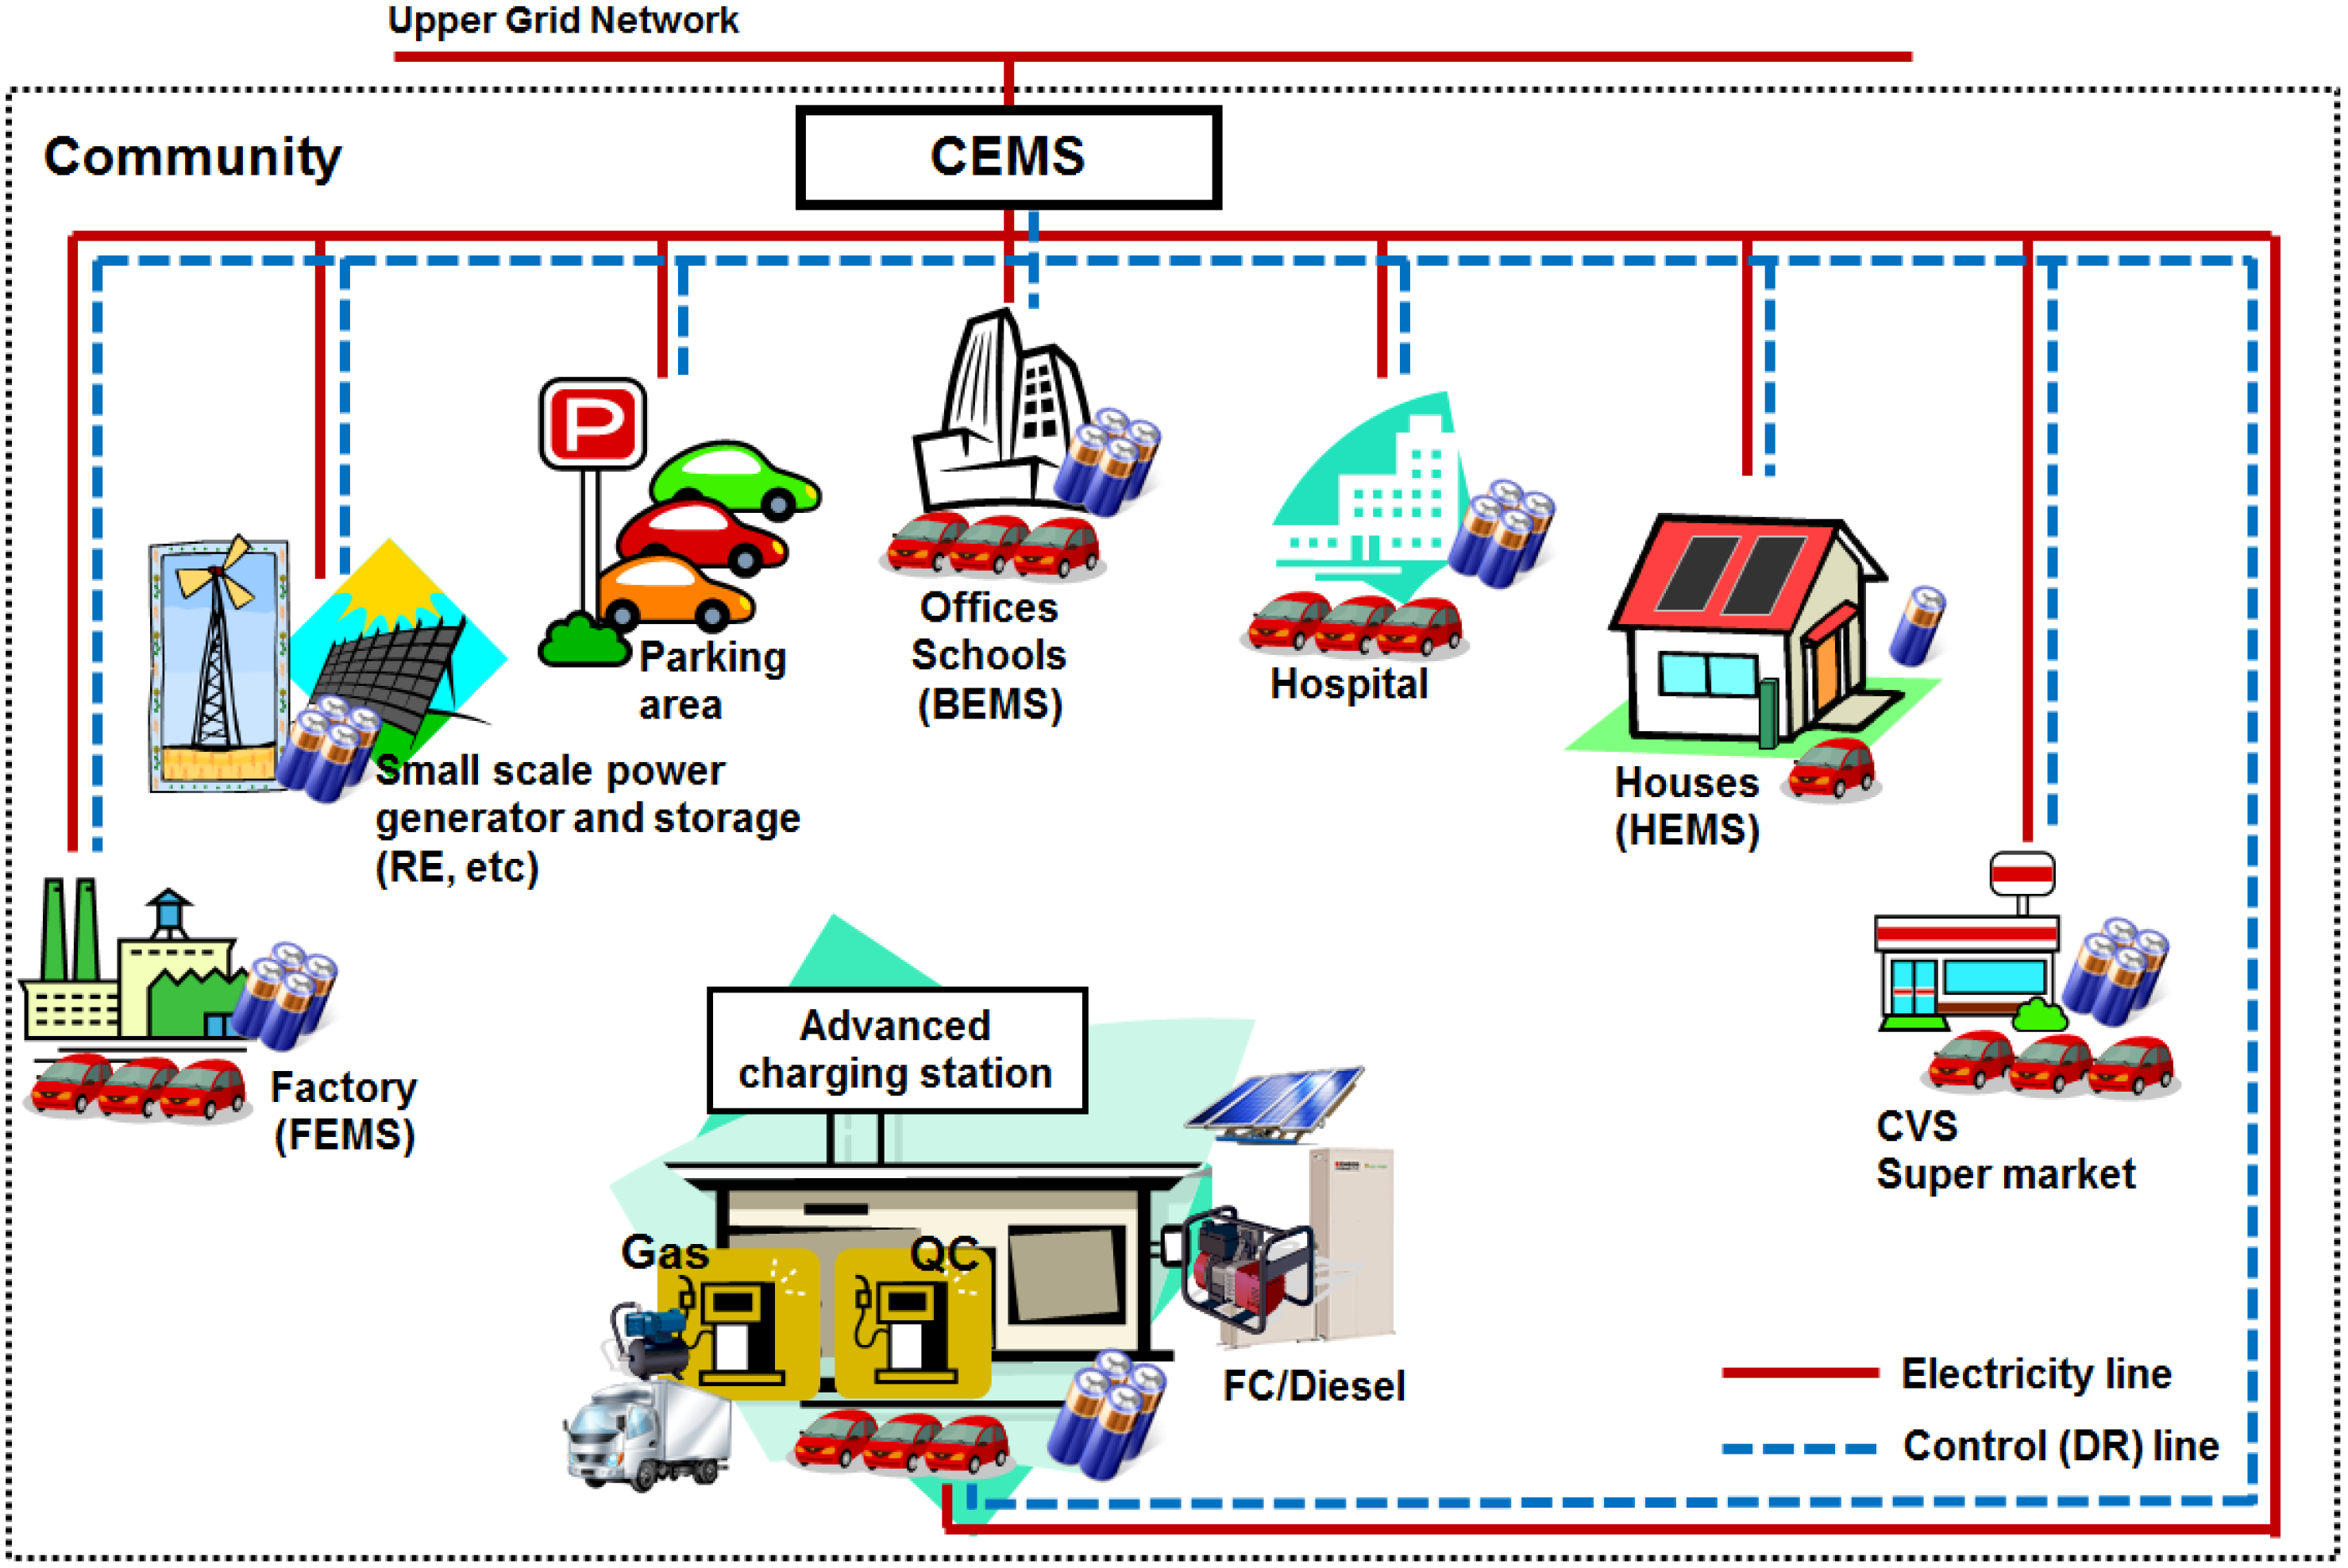
The schematic diagram of integration of EVs and their used batteries to support the electricity in a small-scale EMS is shown in
Figure 3. In this study, small-scale EMS includes BEMS, FEMS, and HEMS. EMS basically controls all the electricity demand and supply. It requests, manages, and integrates some information from difference sources: its own load, meteorological agency, VIS, CEMS, and utility. EMS has a contract with a meteorological agency who provides the local weather information. Therefore, the meteorological agency sends the weather information for a certain period of time during a day. This weather information is used by EMS to forecast its own load and the potentially generated electricity from RE. The type of building load basically can be categorized into base load and fluctuating load. The base load is the minimum amount of electricity demand to power the system operating for 24 h continuously. The base load is generally constant along the time and not influenced by the weather. On the other hand, fluctuating load depends strongly on the human behavior, which in turn, is influenced by the weather condition including temperature and humidity. In addition, the available RE, such as wind and solar, which can be generated, is forecasted also by EMS based on received weather information.
Figure 3.
Basic schematic diagram of EVs and their used batteries integration to EMS.
Figure 3.
Basic schematic diagram of EVs and their used batteries integration to EMS.
Figure 4 shows the seasonal average total load for office building, especially in Japan. The highest total demand occurs in summer, and is followed by one in winter. Both loads in spring and autumn are almost similar and lower than winter. In addition, daily peak-load occurs twice in a day: before noon and afternoon peak-loads. This is due to the sudden drop of electricity demand during a 1 h lunch break. Compared to before noon peak-load, the afternoon peak-load takes place over a relatively longer time (almost 3 h) and has a higher value. In addition, the highest peak-load in summer occurs during afternoon time starting from 13:00 to 16:00. On the other hand, the highest peak-loads in winter, spring, and autumn take places in the evening time between 16:00 and 17:00. This phenomenon is considered to be influenced strongly by the demand for air conditioning in each season.
Figure 4.
Seasonal average load for office building.
Figure 4.
Seasonal average load for office building.
EMS also receives the EV information from VIS consisting of its position, SOC, and estimated arrival time. VIS monitors and gathers the information from its EV member wirelessly. VIS can be an independent service operator or a part of EMS or aggregator. It is responsible for communicating with each EV and providing the data to the EMS or aggregator. Furthermore, this data is used for coordination of EV charging/discharging and to maintain the balance of electricity distribution and avoid any peak-load in EMS. On the other hand, VIS also can provide additional services to the driver regarding the availability of ancillary service programs which are being offered by EMS or aggregator. In addition, EMS also requests from an electric utility the electricity condition and price information. This will be used to calculate the demand as well as the charging and discharging behaviors of both EVs and used EV batteries.
EMS can control fully the used EV batteries and plugged EVs. Therefore, EMS cannot control the EVs which are not connected to the designated charging poles. It only receives the information from VIS without the capability to control the remotely moving EVs.
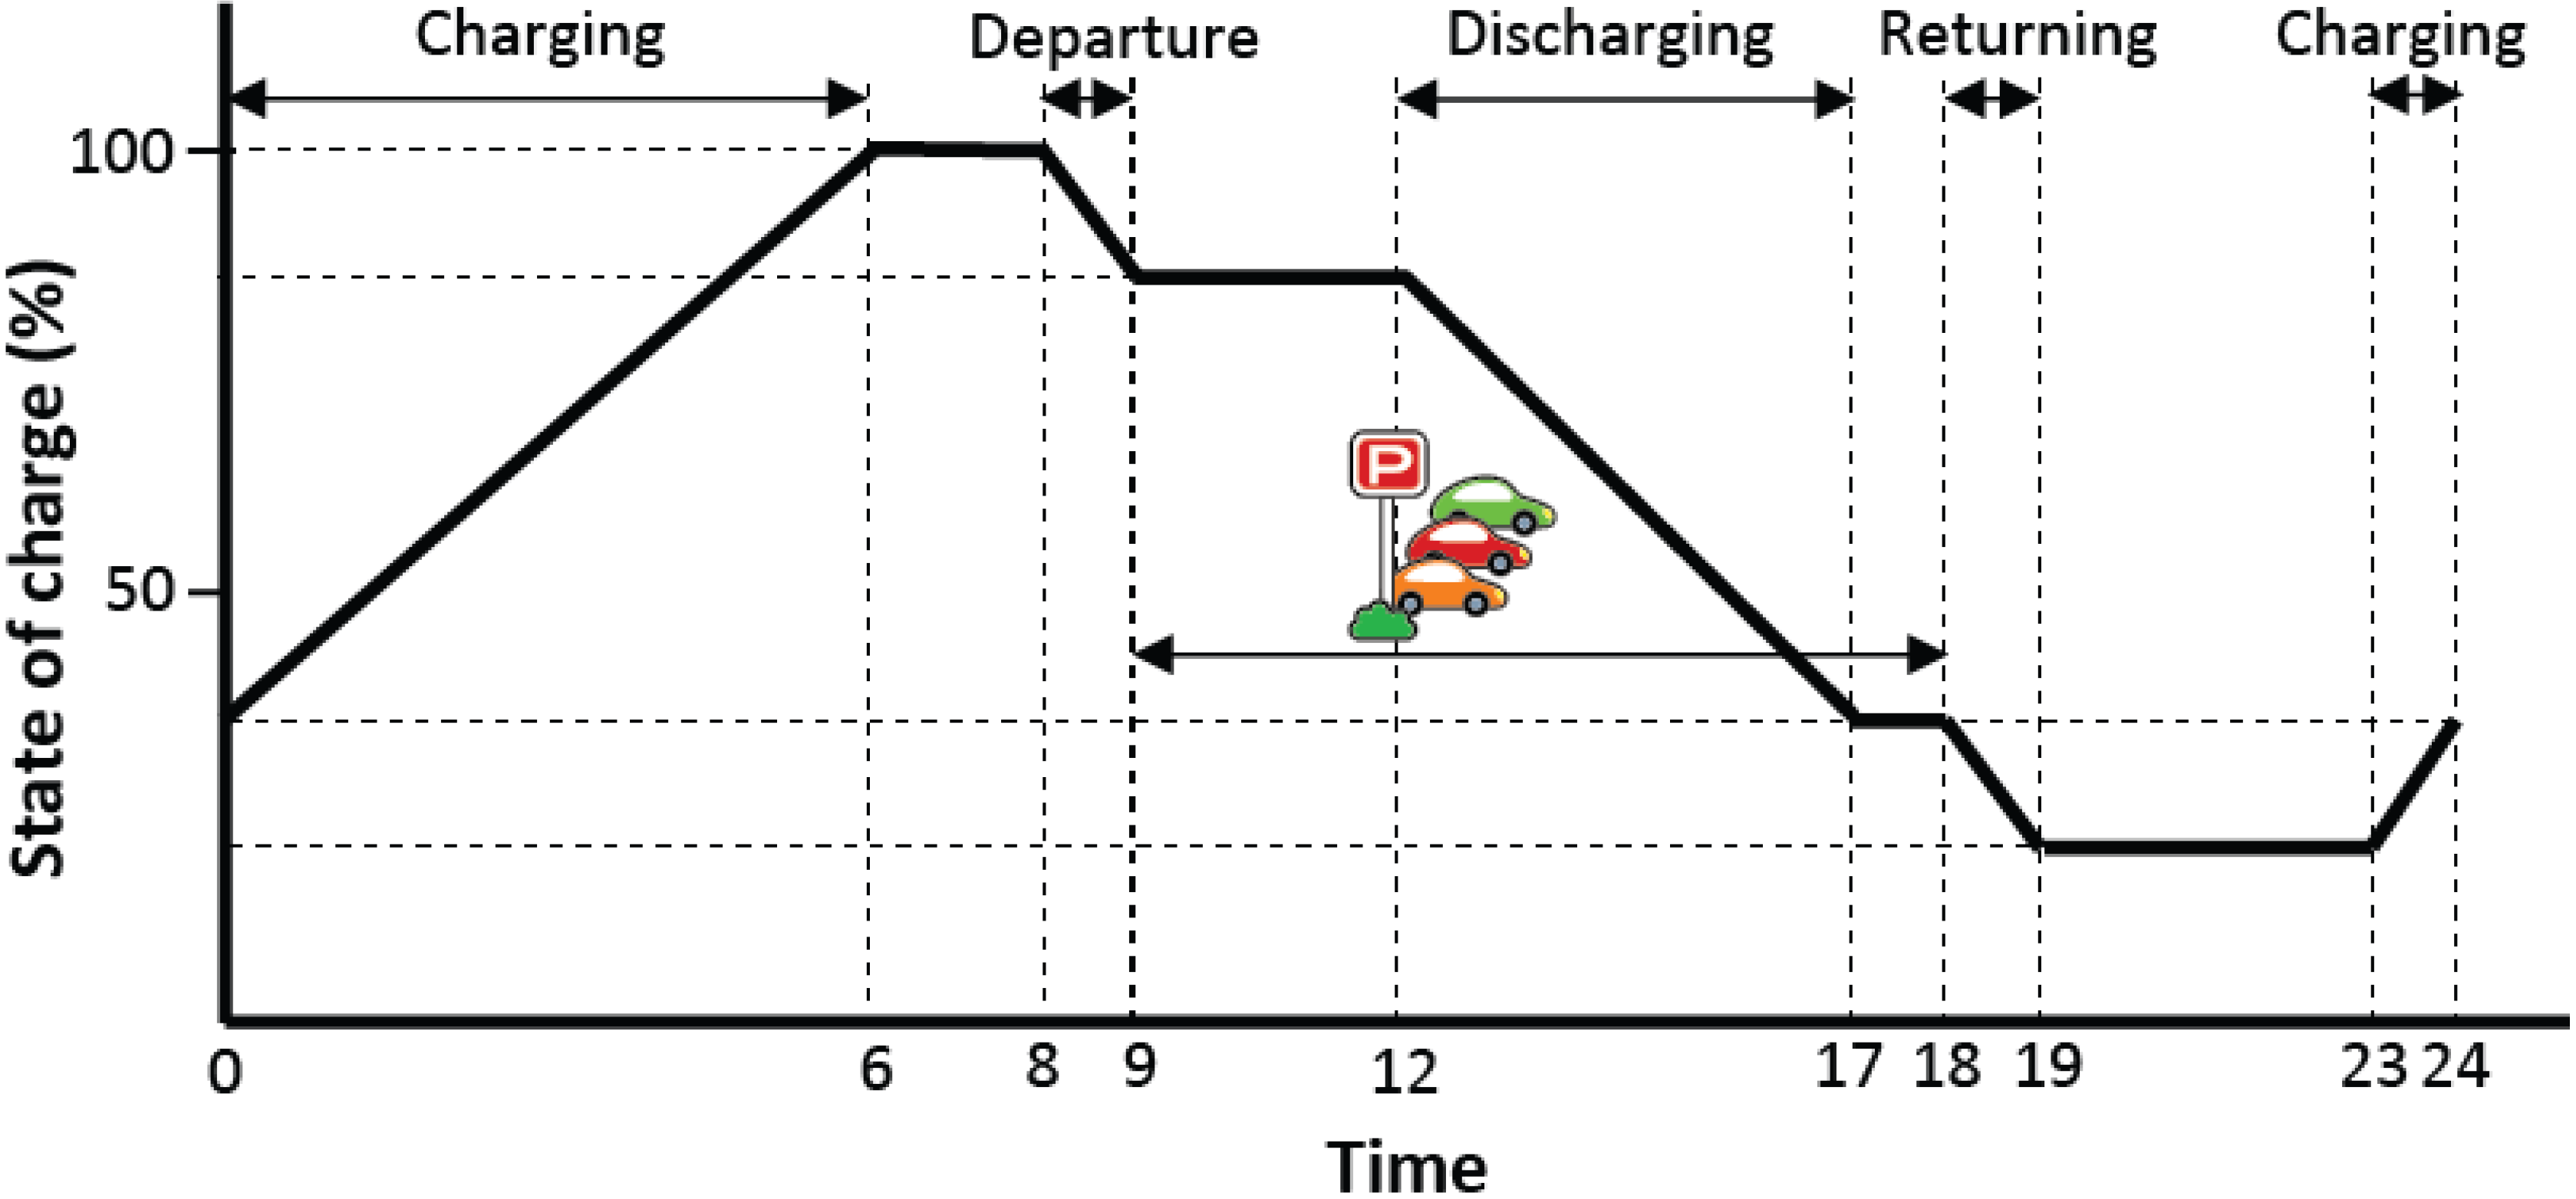
Figure 5 shows the assumption of a one day specific curve of SOC state during a weekday. EVs are departed in the morning and reach the target building at around 9 AM. Because the afternoon peak is higher and the available electricity from EV is relatively limited, EVs are basically utilized for peak-cut in the afternoon peak-load. Discharging from EVs ends once the peak-cut finishes or their SOC reaches a certain minimum value (
SOCmin) which can be defined by the owner, EMS, or aggregator. Furthermore, EVs leave the office at around 6 PM with SOC in minimum condition (
SOCmin). When the total building load—which is an original demand of the building to operate or facilitate the activity inside the building—is relatively low (such as in the morning and during a lunch break), EVs may be charged to increase their discharging capacity during peak time.
Figure 5.
The assumed SOC state of EV for 24 h during a weekday.
Figure 5.
The assumed SOC state of EV for 24 h during a weekday.
To join the ancillary services offered by EMS, the EV owner must have a contract with EMS whether direct contract or through third entity such as an aggregator (aggregator-based contract). Due to the mobility of EVs, their charging and discharging are controlled by EMS only when they are connected to the charging poles. On the other hand, the used EV batteries are fixed and always connected directly to EMS. Hence, their charging and discharging behaviors are fully controlled by EMS. Used EV batteries are basically used for peak-shift. They are charged during the night with a cheaper electricity price and discharged during peak time to decrease the electricity demand from the grid.
3. Proposed Utilization System for EVs and Their Used Batteries
Figure 6 shows the basic concept of load leveling developed for a small-scale EMS utilizing EVs, used EV batteries and RE including photovoltaic (PV) and wind. Four main continuous steps were proposed in this study: (1) RE generation and load forecasting; (2) load leveling forecasting; (3) value correction; and (4) charging and discharging controls of EVs and used EV batteries. The forecasting was basically performed by EMS for 24 h-ahead. In addition, because the amount of electricity in Japan is basically calculated for every period of 30 min, all electricity amounts (kWh) in this study were calculated as the total accumulation value for 30 min.
In RE generation and load forecasting, EMS initially requests information related to local weather forecasts from the meteorological agency. This information is very important in order to calculate the possibly generated electricity from RE including PV and wind. In this study, this generated electricity is prioritized in peak-cut and will be consumed entirely with no storage. In addition, the weather information is also utilized to predict the fluctuating load of the building, especially related to air conditioning and lighting. The outputs from this first step are forecasted RE generation and load curves for the next 24 h.
Once the load and RE generation have been forecasted, EMS calculates the possible load leveling which can be achieved in the next 24 h. For this purpose, EMS communicates with VIS to estimate the number of EVs and their SOC states which are available to join the peak-cut program. VIS initially receives the travelling schedule from the drivers and, subsequently, VIS transfers this information to EMS. This information includes the EV’s ID, planned departure time and estimated arrival time. Moreover, the registration of travelling schedule by the driver/owner should be done up to 24 h before the scheduled departure. As the available resources for peak-cut/peak-shift and load curves were estimated, EMS can calculate the peak-cut threshold for the next day. In this study, peak-cut threshold is defined as the maximum amount of electricity purchased from the grid by EMS. Peak-cut threshold is theoretically calculated based on some factors including electricity price, contracted capacity, available power generation, and storage. When the electricity consumed by the building is increasing and the purchased electricity from the grid reaches the peak-cut threshold, EMS sends the command to plugged EVs and used EV batteries to discharge their electricity to support EMS. Hence, the electricity purchased from the grid is same to of lower than the calculated peak-cut threshold. In the real application, it may avoid a higher price of electricity during peak time.
Figure 6.
Basic concept of developed load leveling in a small-scale EMS involving EVs and their used batteries.
Figure 6.
Basic concept of developed load leveling in a small-scale EMS involving EVs and their used batteries.
When EVs are departed or in motion, the information related to EV is transmitted to VIS in intervals of several seconds to minutes for data updating. Afterward, VIS sends the data to EMS which is further used to recalculate the available electricity from EV. On the other hand, EMS also recalculates the building load based on the real weather, measured by thermometer and hygrometer, and the present real load of the building. Next, EMS modifies its energy management plan, especially the predicted peak-cut threshold.
When EVs arrive and they are connected to the designated charging poles, EV can communicate directly with EMS (bypassing VIS). Hence, all the information of EV is updated again including the available electricity from EVs. From this moment, EVs are ready to take part in the ancillary service program offered by EMS. EVs are fully controlled by EMS, especially their charging and discharging behaviors. Finally, EMS calculates and sends the control command to each EV and used EV batteries to maintain its previously calculated peak-cut threshold. After finishing the peak-cut, EMS can control and coordinate EVs for charging before leaving the building.
4. Demonstration Test Bed
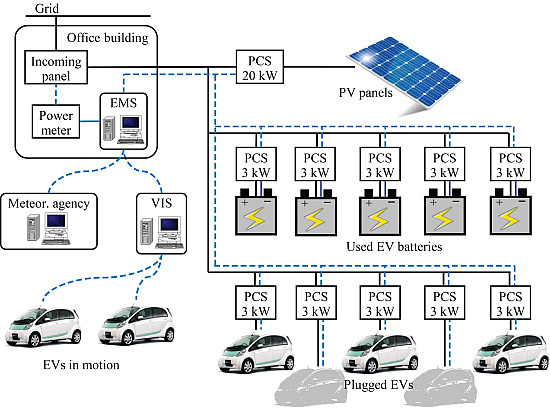
Figure 7 shows the schematic diagram and overview of the whole developed demonstration test bed used in this study. Black solid and blue dotted lines represent the electricity and information lines, respectively. This demonstration test bed was built in the area of Mitsubishi Motors Corporation located in Okazaki, Aichi prefecture, Japan. The test bed was connected to and used to support the electricity of the main office building.
Figure 7.
The developed demonstration test bed: (a) schematic diagram of the system; (b) overview of the developed system including PV panels and EVs.
Figure 7.
The developed demonstration test bed: (a) schematic diagram of the system; (b) overview of the developed system including PV panels and EVs.
As RE generator, 20 kW PV panels were installed on the roof top of the test bed. Five EVs, Mitsubishi i-Miev G, were taking part in the program and the drivers were also the employees working in the office building. Hence, EVs were mostly parked and plugged to the charging poles during the working hours. In addition, five used EV batteries, which were used for about one year from the same type of EV, were also installed and directly connected to EMS. EMS controlled all the demand and supply sides of the test bed. On the other hand, VIS was also developed as a standalone system communicating with EVs and transferring to EMS. The detailed specifications of developed demonstration test beds are shown in
Table 1.
Table 1.
Specifications of developed demonstration test bed.
Table 1.
Specifications of developed demonstration test bed.
| Component | Properties | Value |
|---|
| PV | Type | Mono crystalline |
| Capacity | 20 kW |
| Installation direction and angle | South, 30° |
| PCS capacity | AC 200 V, 100 A |
| EVs | Type | i-Miev G |
| Participating number | 5 |
| Battery capacity | 16 kWh |
| Max. charging capacity | DC 370 V, 15A |
| PCS capacity | AC 200 V, 15 A |
| Used EV batteries | Original EV | i-Miev G |
| Condition | 1 year usage |
| Installed number | 5 |
| Battery capacity | 16 kWh |
| Max charging capacity | DC 370 V, 15A |
| PCS capacity | AC 200 V, 15 A |
The drivers sent their travelling schedule to VIS up to one day before the departure. For this purpose, a web-based system has been developed allowing the drivers to access from their computers or mobile devices. When EV was not plugged in the charging pole of EMS, EVs sent their data to VIS in interval of 10 s remotely. Furthermore, VIS transmitted the data to EMS in a real time. Moreover, the used EV batteries became a part of EMS (stationary) and were fully controlled by EMS throughout a day. EMS was receiving data from both VIS and the meteorological agency. Although the weather information was received a day before, it was updated automatically up to three times a day according to the change in the weather forecast.
Used EV batteries were practically utilized for peak-shift. They were charged during the night time (off-peak hours) when the price of electricity is cheaper. In this study, this charging was basically conducted from 00:00 to 06:00 on the next day. The charging and discharging thresholds of both EV and used battery were fixed at SOC 90% and SOC 40%, respectively. Moreover, as the total amount of available electricity from EVs and used EV batteries was very small compared to the total load of the office, peak-cut was designed to start from 12:00 until 18:00 (6 h duration). Hence, the afternoon peak became the main target in this study. Furthermore, to minimize the influence of temperature on charging and discharging behaviors of used EV batteries, the temperature of battery storage room was controlled and maintained throughout the year at 25 °C.
In RE generation forecasting, as only PV was used as RE generator, the generated electricity from RE,
PRE, could be approximated as follows:
where,
Ppv,
Ht, η
PR,
CPV, and
I are generated electricity from PV (kWh), forecasted average solar radiation in the designated time (kWh m
−2), average performance ratio of PV panels, PV system capacity (kW), and solar radiation intensity in standard state (kW·m
−2). The forecasted average solar radiation was received from the meteorological agency and updated three times in a day. In addition, building load was approximated as the sum of the base load and air conditioning demand based on statistical data and the forecasted outside temperature received from the meteorological agency [
21]. A simplified mathematical representation of the building demand in certain time,
Lt, could be represented as follows:
where,
LBS,
f,
TOA,
TST, and ∆τ are building based load for 30 min interval (kWh), chosen functional relationship, outside temperature (°C), set room temperature (°C), and time shift (h), respectively.
The available electricity from EVs,
PEV, which are running and not connected to the charging poles could be approximated as the function of SOC and the remaining distance (both of them are received from VIS).
where,
SOCEV,t,
CEV,
dt, η
EV, and
SOCmin are SOC of EV at certain time, capacity of EV battery (kWh), remaining distance to charging pole (km), EV power consumption (kWh·km
−1), minimum SOC threshold for discharging, respectively.
Due to some limitations, the peak-cut threshold in this study was calculated with consideration of available sources capacity. This includes average PV generation and available electricity from both EVs and used EV batteries. Initially, a day load duration curve was created based on the average load data in the same month of the last year. Peak-cut threshold,
Pthr, was calculated according to Equation (4). The illustration of a day load duration curve and calculation of peak-cut threshold are shown in
Figure 8.
where,
Pbat,
n, and
m are available power from used battery, number of load higher than peak-cut threshold, and number of EVs and used EV batteries, respectively.
Generally, load duration curve illustrates all loads in a descending order of magnitude and the area under load duration curve shows the energy consumed by the system. In case of this study, a day load duration curve was adopted and created by arranging all 30 min periods of building load in a downward order from the highest to the lowest loads. Hence, the area under the curve represents the total energy demand consumed by the building for a day. Moreover, the generated electricity from PV was directly supplied to EMS without being stored in the battery. Furthermore, the total electricity which could be earned from EVs, used EV batteries, and PV were plotted on the top of the curve while its bottom is in straight line. The created straight line is a peak-cut threshold which was used in peak-shift and peak-cut.
Figure 8.
Load duration curve and the calculated peak-cut threshold.
Figure 8.
Load duration curve and the calculated peak-cut threshold.
6. Conclusions
The extended utilization of EVs and their used batteries to support electricity on a small-scale EMS has been proposed and demonstrated. Theoretically, this utilization is feasible, and it is largely expected that it will improve generally the economic performance of EVs. From the experimental study, it was proved that load leveling through peak-shift and peak-cut can be achieved by setting the peak-cut threshold and controlling both charging and discharging behaviors of EVs and used EV batteries. Hence, the total load during peak hours can be reduced leading to lower total electricity costs. In this load leveling, forecasting of load and resources including electricity from EVs and RE generation becomes a very important task to achieve a successful load leveling.
Some further challenges related to utilization of EVs and used EV batteries in supporting certain EMS relates strongly to some issues including supply, demand and EV availability forecast. Supply forecast includes available RE generation, electricity price on the market, and possible electricity generation with lower costs. In addition, the accuracy of demand forecasts including weather and human behavior is also one important key to success as it deals strongly with the air conditioning demand which actually becomes the largest part of fluctuating load.


