Article

Multi-Train Energy Saving for Maximum Usage of Regenerative Energy by Dwell Time Optimization in Urban Rail Transit Using Genetic Algorithm

School of Electrical Engineering, Beijing Jiaotong University, No. 3 Shangyuancun, Beijing 100044, China
*
Author to whom correspondence should be addressed.
Submission received: 2 February 2016 / Revised: 5 March 2016 / Accepted: 10 March 2016 / Published: 17 March 2016

Abstract

:
With its large capacity, the total urban rail transit energy consumption is very high; thus, energy saving operations are quite meaningful. The effective use of regenerative braking energy is the mainstream method for improving the efficiency of energy saving. This paper examines the optimization of train dwell time and builds a multiple train operation model for energy conservation of a power supply system. By changing the dwell time, the braking energy can be absorbed and utilized by other traction trains as efficiently as possible. The application of genetic algorithms is proposed for the optimization, based on the current schedule. Next, to validate the correctness and effectiveness of the optimization, a real case is studied. Actual data from the Beijing subway Yizhuang Line are employed to perform the simulation, and the results indicate that the optimization method of the dwell time is effective.

1. Introduction

Urban rail transit is an important part of urban public transport. With the characteristics of large capacity, high speed, security, punctuality, environmental protection, energy saving, and so on, urban rail transit is very popular and is especially suitable for large- and medium-sized cities [1]. China is the most populous country in the world and is very suitable for the development of urban rail transit. The first subway line in China was constructed in Beijing. Its planning began in 1953; the project was founded in 1965 and completed in 1969; and operations began in 1971. Today, the Beijing urban rail transit system is the second largest city subway system in the world. According to statistics from Beijing Subway, in the first three days of 2016, 16,367,700 passengers were transported, and 16,567 trains ran according to plan. In 2015, 2,832,000,000 passengers were transported, and a total of 2,324,486 trains ran according to plan [2]. Energy consumption of urban rail transit is much lower than buses or cars per passenger per km. However, the energy consumption of urban rail transit has a considerable scale with a large capacity. How to effectively reduce this energy consumption is a very significant matter.
González-Gil [3] provided a comprehensive appraisal of the main practices, strategies and technologies currently available for minimizing the energy use of urban rail systems. The two main methods are energy-efficient driving and regenerative braking. The former has been well studied by many researchers [4,5,6,7], while the latter is a rather new approach [8,9,10]. The braking system of subway trains typically adopts regenerative braking as the main system and air brakes (friction brakes) as a supplement. When the vehicle uses regenerative braking, the motor works in the state of the generator, and the electric energy generated returns to the traction power grid. In an urban rail transit system, the distance between stations is relatively short; thus, the train must perform frequent starting and braking, and this aspect of the braking energy has a great potential for recycling. The regenerative braking energy can reach up to more than 30% of the traction energy. If the regenerative braking energy cannot be used, then it is converted to a resistance brake or air brake, and the braking energy is wasted in vain. The energy that is not used accounts for more than 40% of the total braking energy used.
At present, the effective utilization of regenerative braking energy involves two main aspects of research [9]. One is using energy storage devices, such as flywheels [11,12,13,14], supercapacitors [15,16,17,18,19,20,21] and batteries [22,23,24,25]. New infrastructure requires a large amount of investment and is not easy to realize. The other method is operation optimization, which is more convenient. This method has also been studied by some researchers. Chen [26] optimized the timetable to reduce the maximum traction power. Kim et al. [27,28] developed a mixed integer programming model to minimize the maximum traction energy, which occurs when trains are running simultaneously. Gordeon [29] coordinated multi-trains to reduce the total traction energy. Ramos [30] coordinated a train’s acceleration and braking time to make full use of renewable energy. Yang et al. [31] increased the traction and braking overlap rate of different trains to optimize the timetable, thereby improving the utilization efficiency of regenerative braking. Zhao et al. [32] optimized schedules using the simulated annealing algorithm, by analyzing the relative position and running state of the adjacent train. The above researchers did not consider the effect of the traction power supply network. The following research considers the traction network model. Nasri et al. [33] optimized a timetable for maximum usage of regenerative braking energy and discussed the headway and stop time effect on the energy consumption. Albrecht et al. [34,35] researched the headway and stop time effect on the energy consumption based on a route in Berlin. In addition, there has also been other research with different parameter optimizations and methods [36,37,38].
In the present paper, the train dwell time is optimized to achieve the purpose of the use of regenerative braking energy. This paper is arranged as follows: Section 2 outlines the overall situation. A multi-train system for urban rail transit is introduced. The constraint conditions of multi-train operation optimization, considering regenerative braking energy, are analyzed. The principle of dwell time optimization is introduced. In 
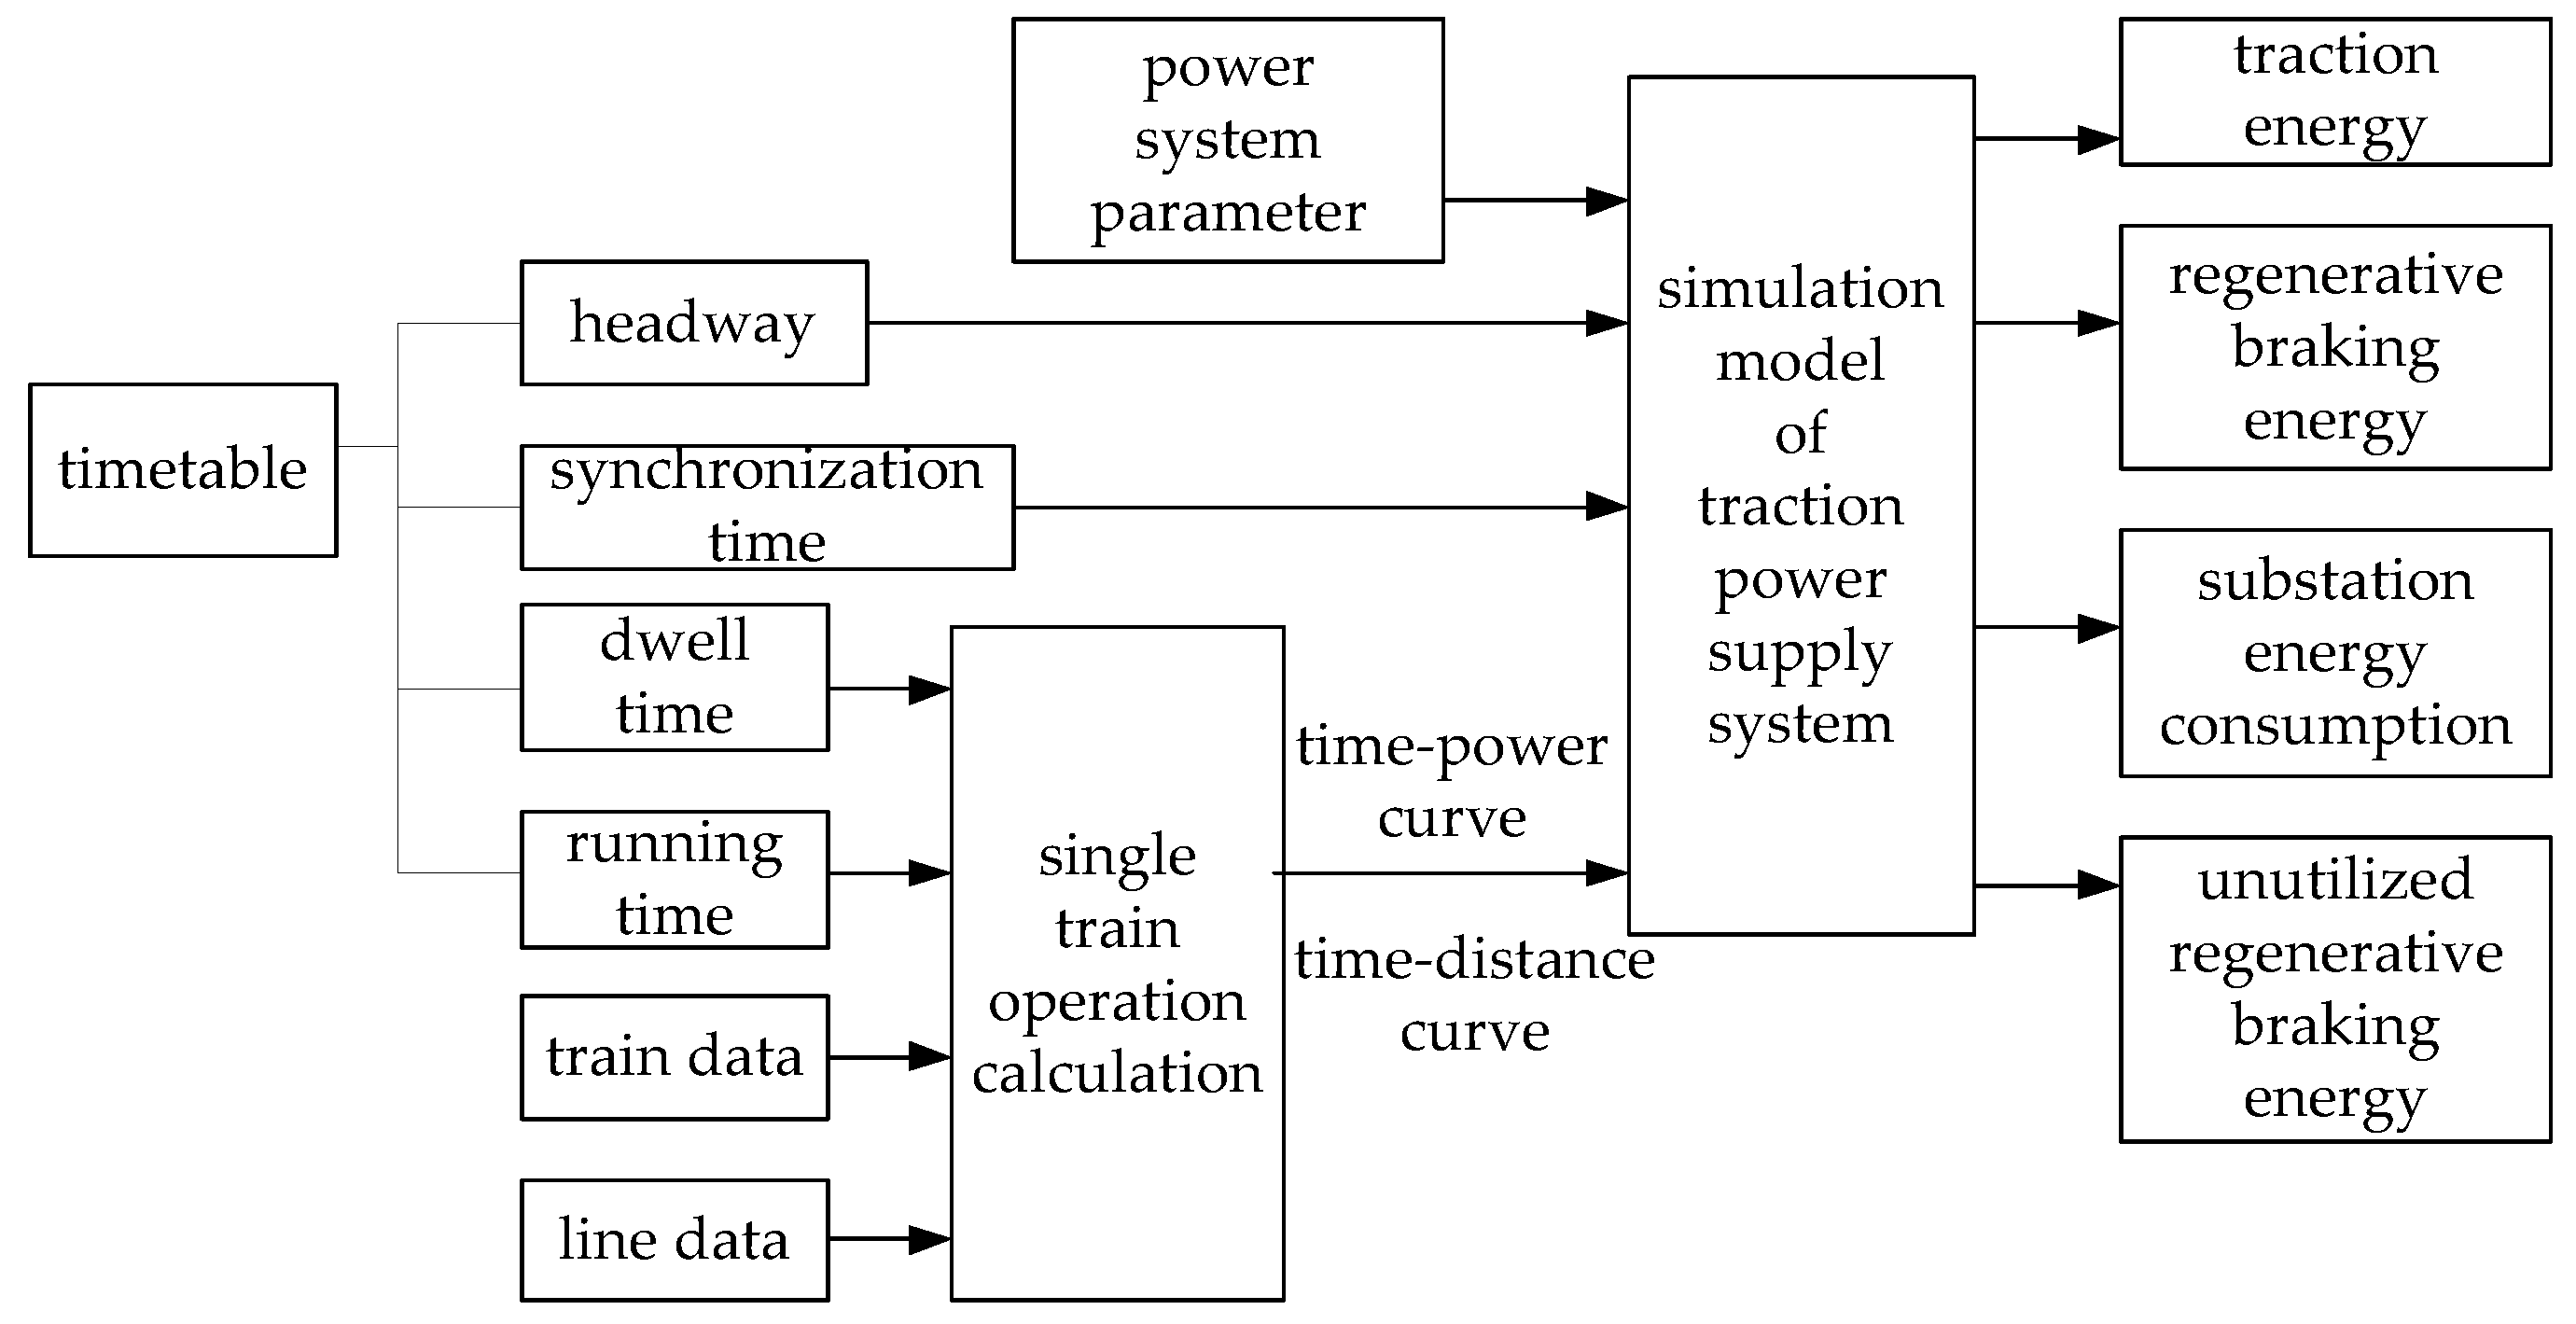
Section 3, a train operation model and tractive power supply system model are established. The optimization goals of multi-train energy saving operation are settled. The calculation flow of multi-train operation is proposed. In Section 4, the genetic algorithm optimization is described. A mathematical model is established, and the genetic algorithm is introduced briefly. The optimization method and calculation flowchart are proposed. Finally, the actual train data, line data and power supply system data of the Beijing Yizhuang subway line are employed for simulation, and the performance of the simulation system is tested.

2. Multi-Train System for Urban Rail Transit

2.1. Multi-Train System for Urban Rail Transit

The multi-train operation optimization is based on the single-train operation model. The calculation of the operation of each train is constrained by the traction braking characteristics of the vehicle and line condition. Vehicle characteristics include traction performance of the vehicle, braking performance, performance of the train running resistance, vehicle formation, weight of the vehicle itself and load, etc. Line conditions include the ramp of the line, curve, speed limit, station spacing, etc. For multiple trains operating on the same route, the line conditions of a train running on the same line (uplink or downlink) are the same, and vehicle characteristics are generally the same, while the load of each train varies with the passenger flow.
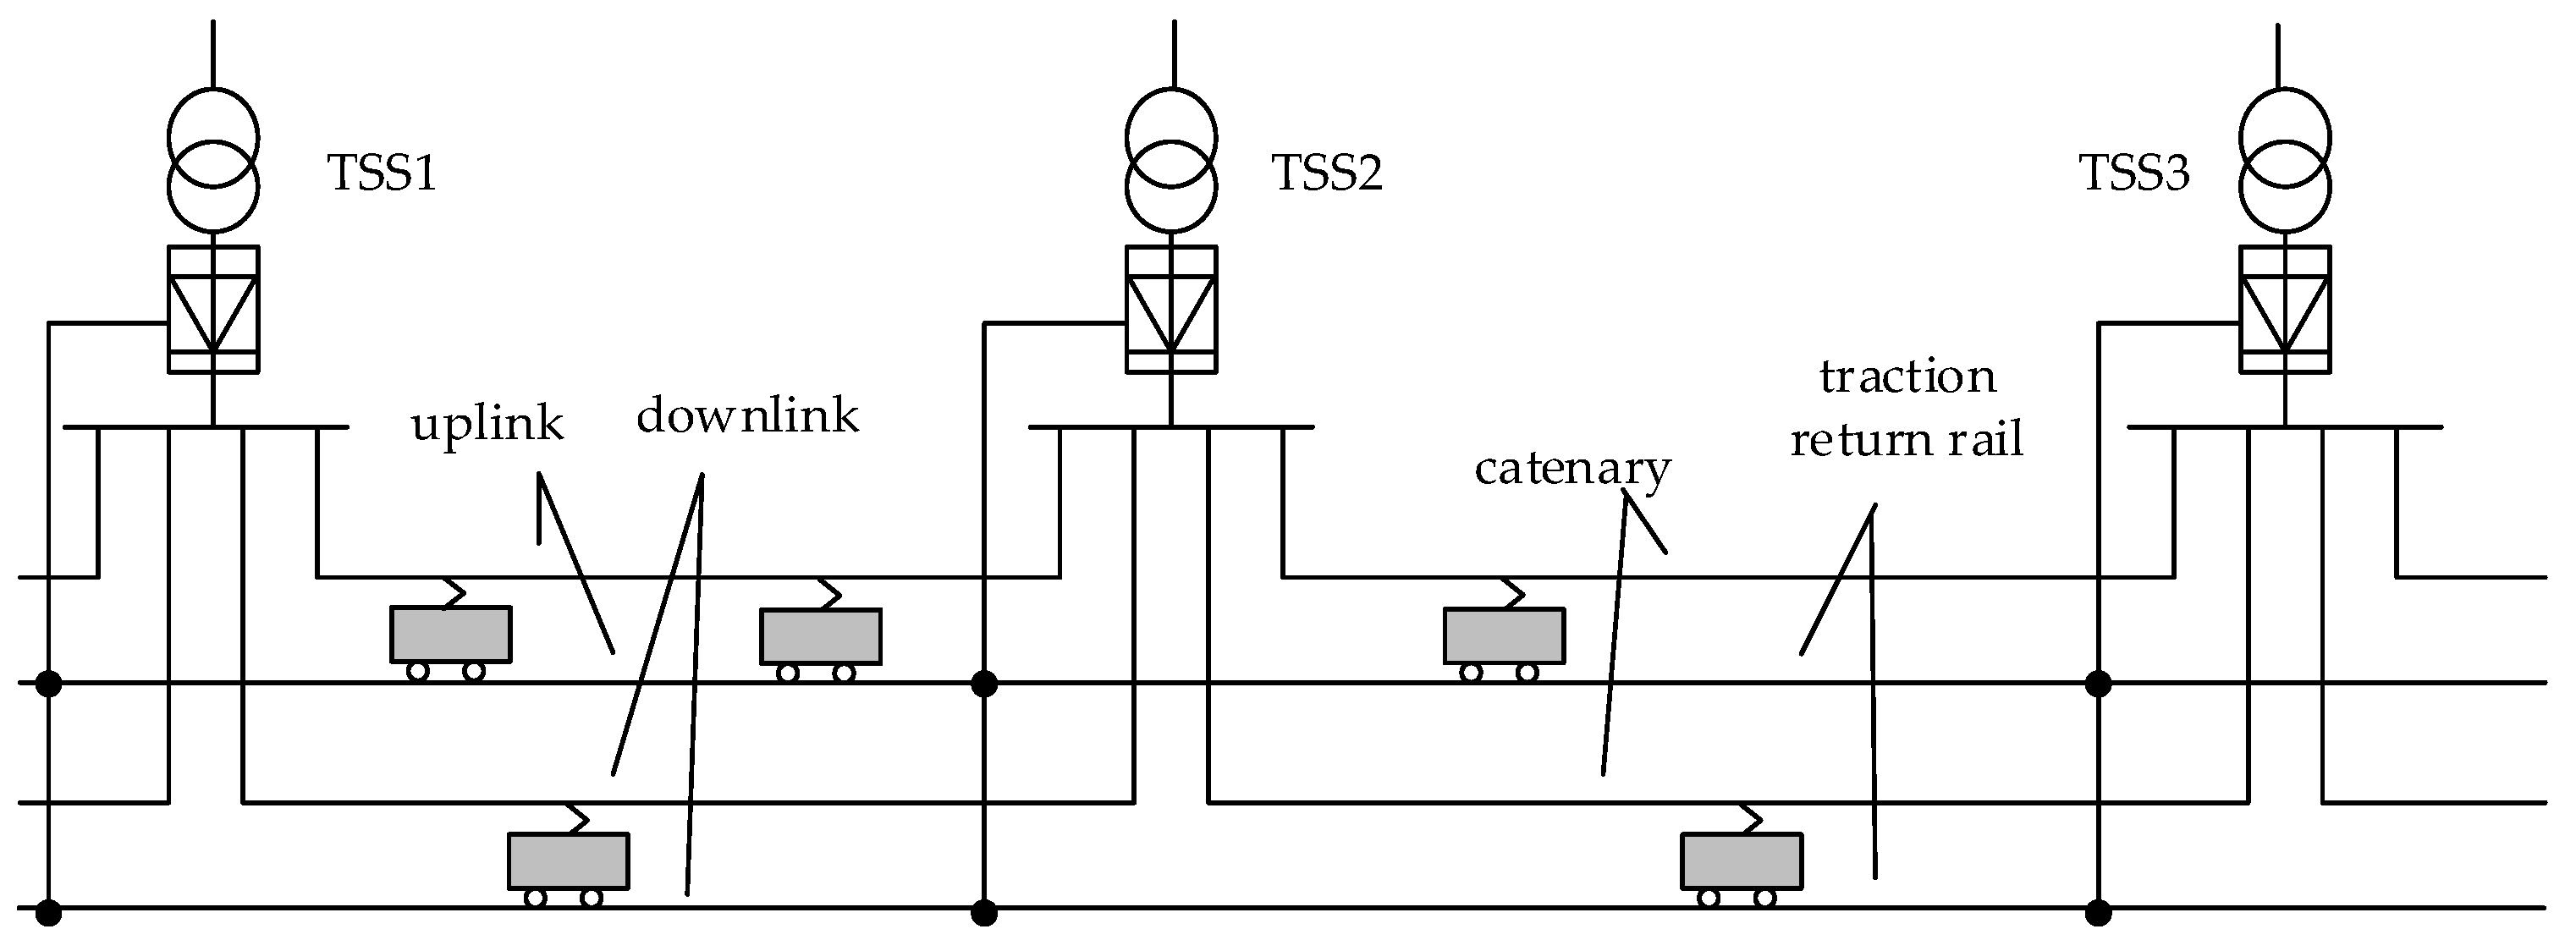
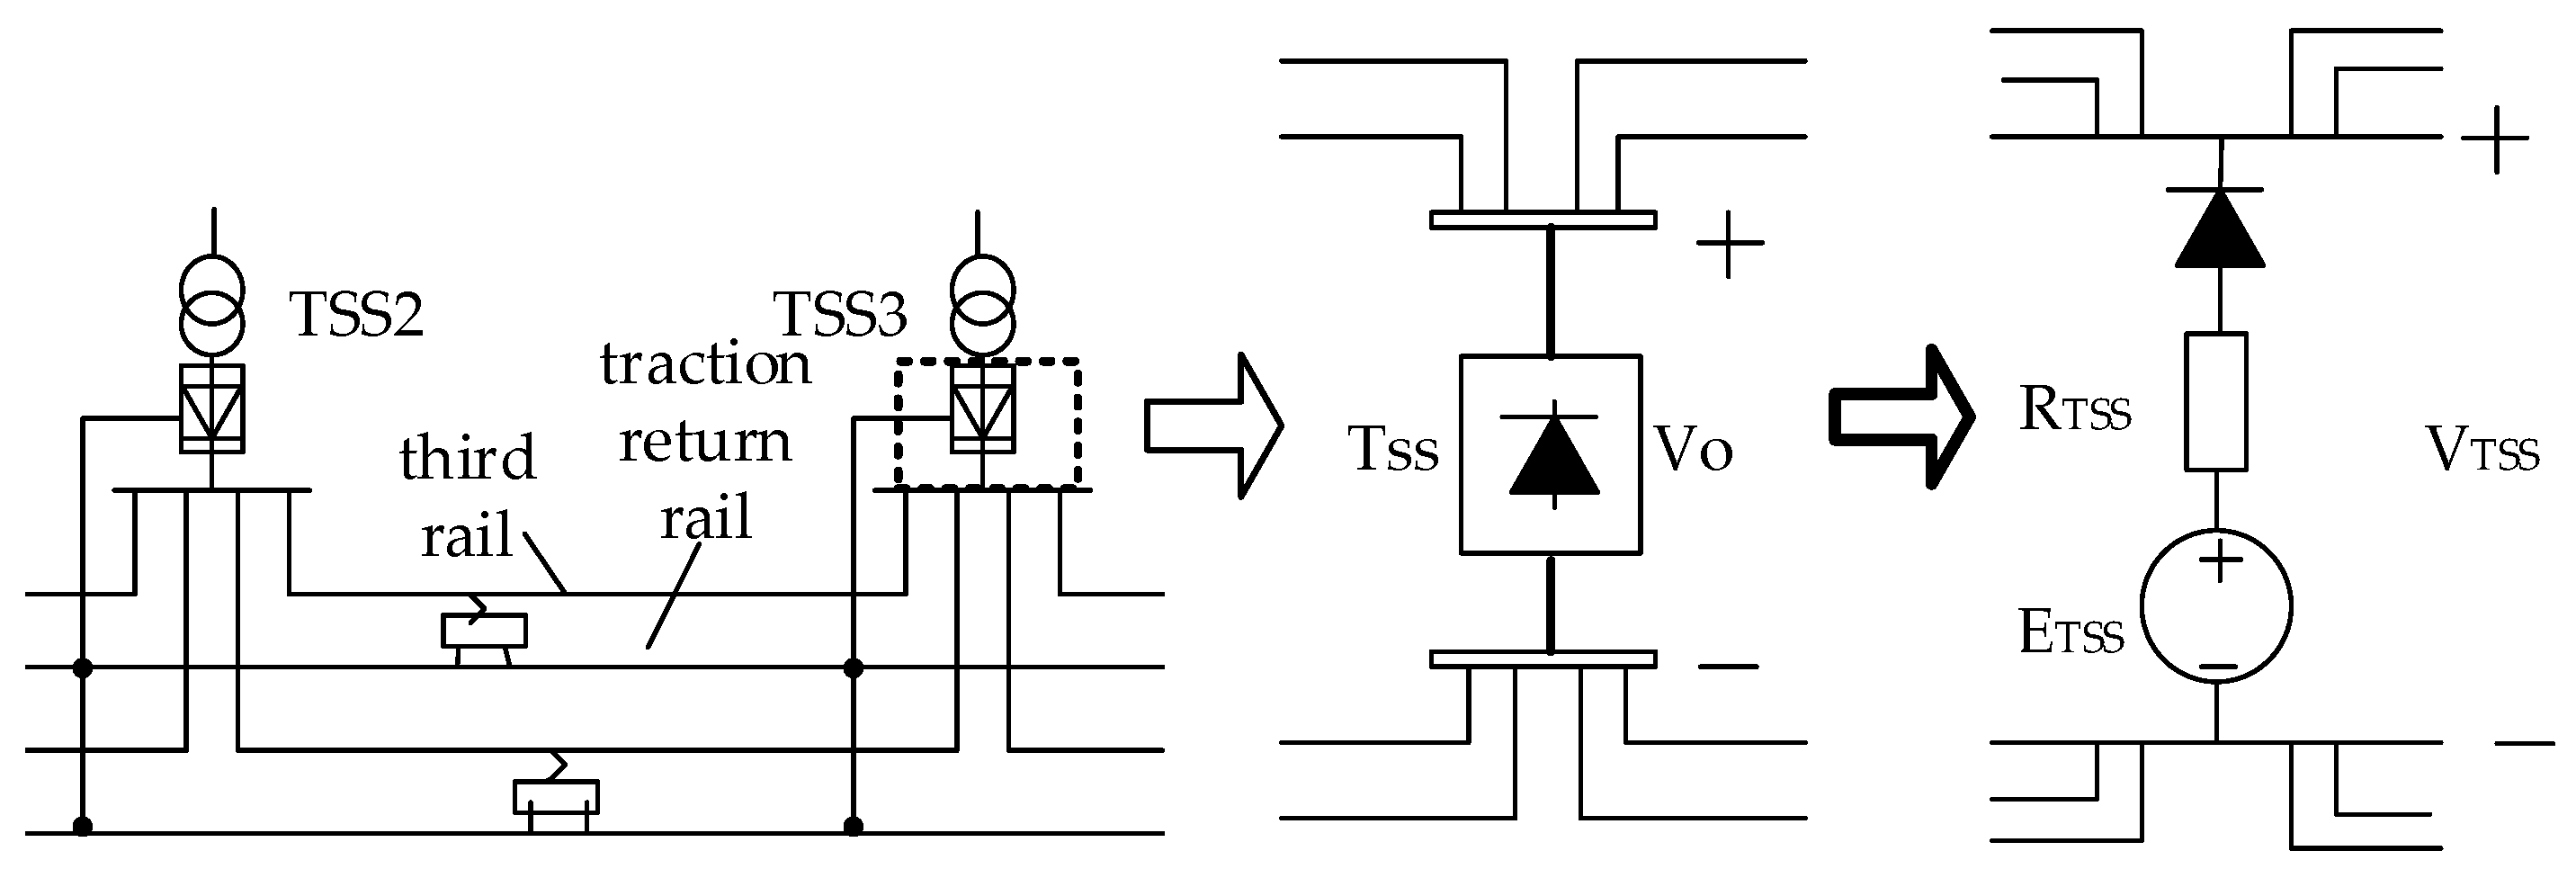
The traction substation in the traction power supply system transfers the three-phase high voltage alternating current (AC) into low voltage direct current (DC) used by urban rail trains. The DC-side power supply system is the part of the whole traction power supply system that directly provides power for the train. It mainly includes the catenary (three rail), the feeder line, the track and the reflux line. The feeder line delivers direct current from the traction substation to the catenary; the train obtains the electric energy through the direct contact of the current collector (pantograph or collector shoe) and the catenary; and the drive traction motor causes the train to operate. The track not only has the function of a guide rail, but also that of conduction reflux, leading the reflux from the track into the traction substation through the reflux line, as shown in Figure 1.

2.2. The Constraints of the Traction Power Supply System

The constraints of the traction power supply system when the train is operating are mainly as follows [39]:
  • For urban rail transit traction power supply systems, due to the fact that the DC traction substation adopts the diode rectifier, the energy has unidirectional liquidity, and regenerative braking energy cannot flow from the substation to the power supply network.
  • Feeder loss. Due to the resistance of the traction network, line loss is inevitable, and the line resistance changes with the change of the train operation position.
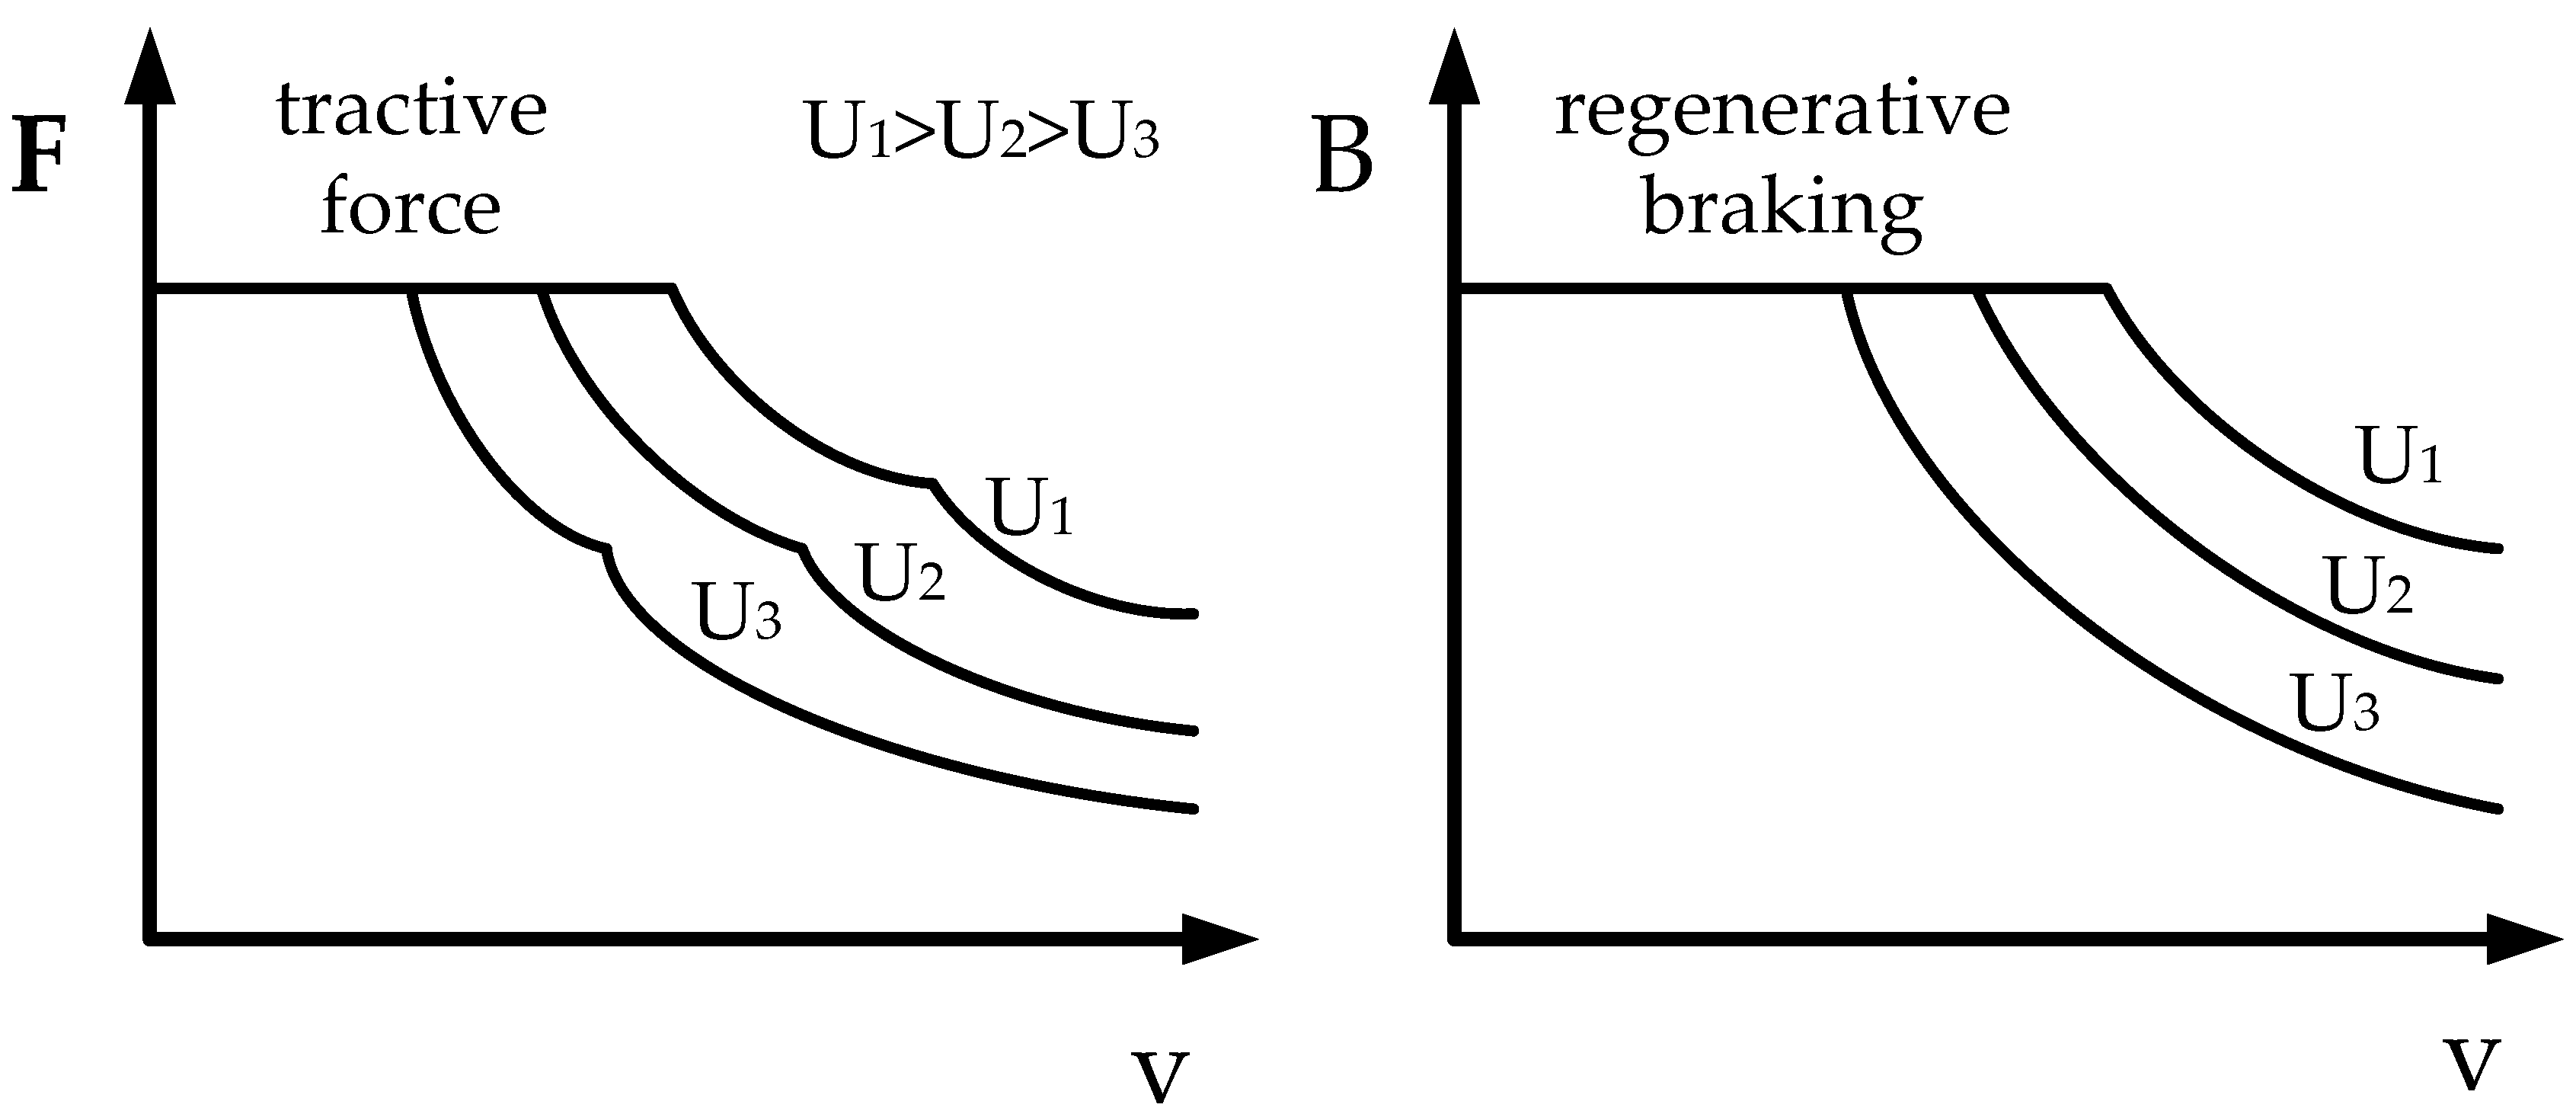
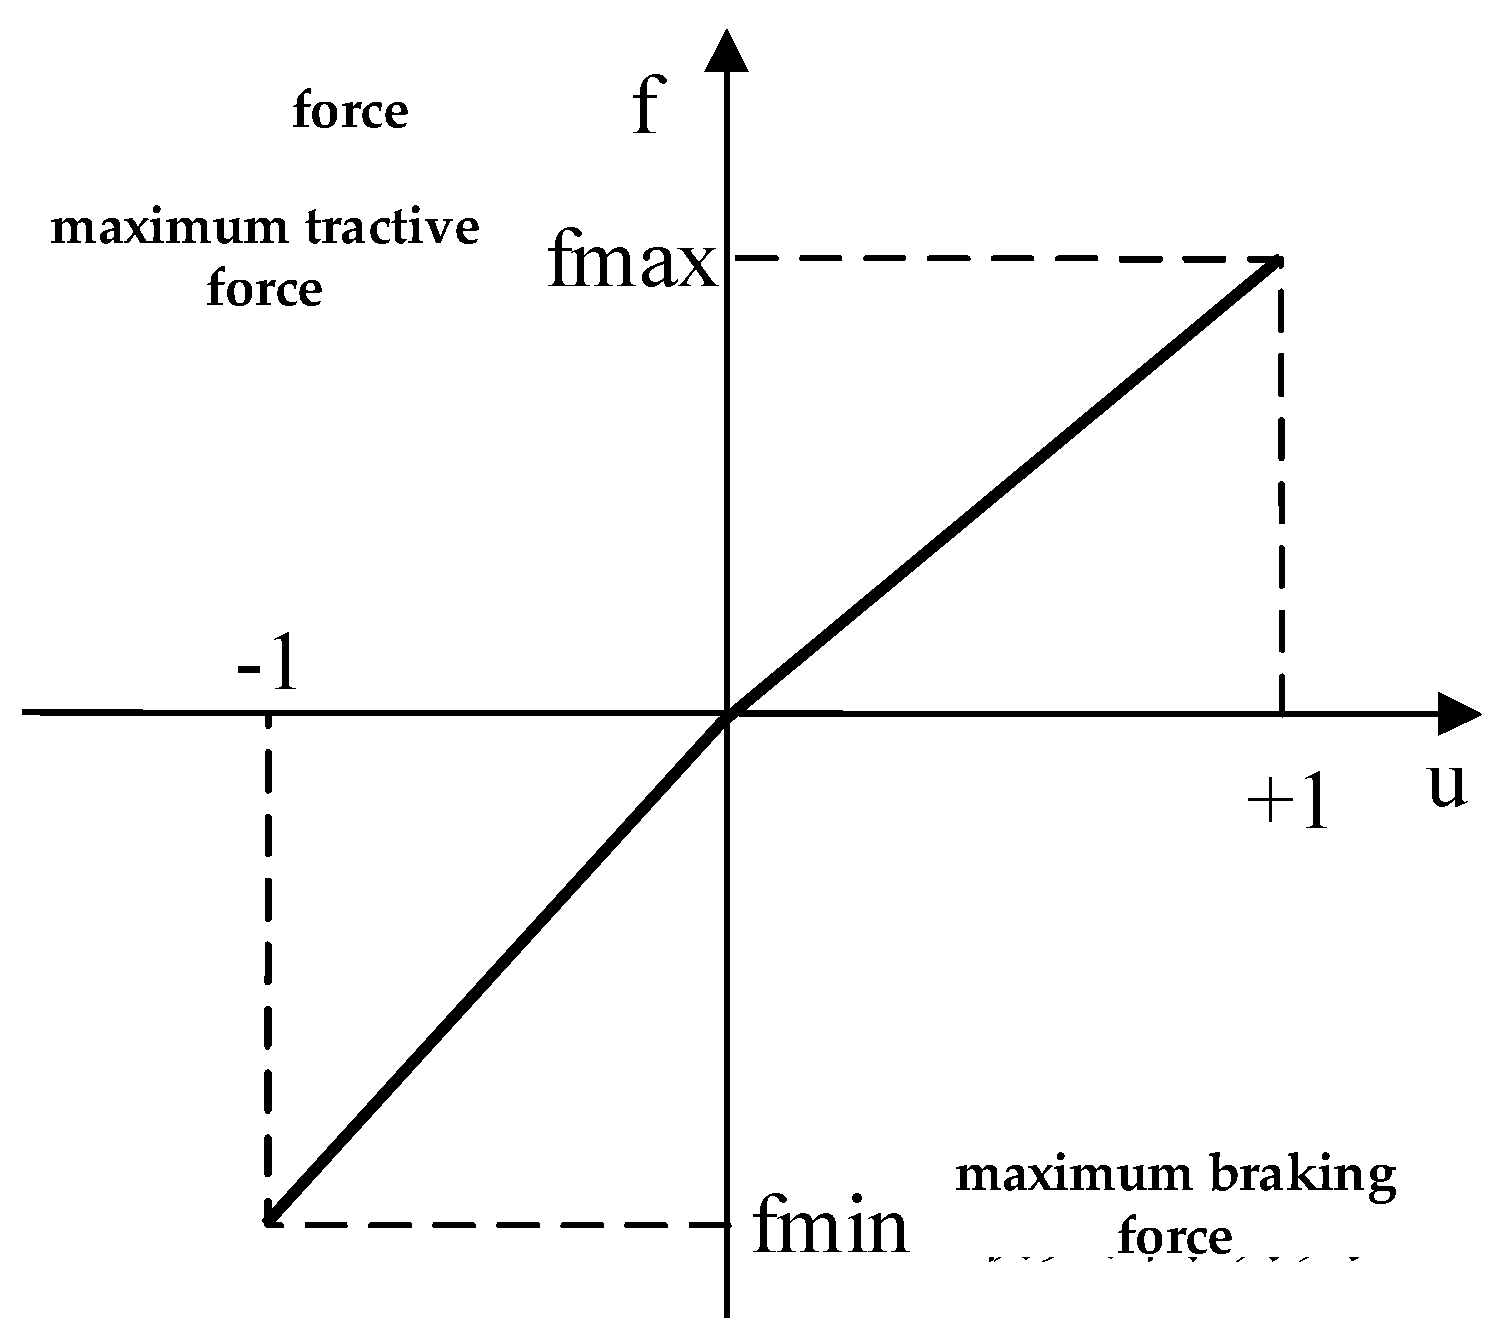
  • The train’s traction and regenerative braking curve are constrained by the traction network voltage, as shown in Figure 2, and the drop of traction network voltage, train tractive and regenerative braking capacity will be limited.
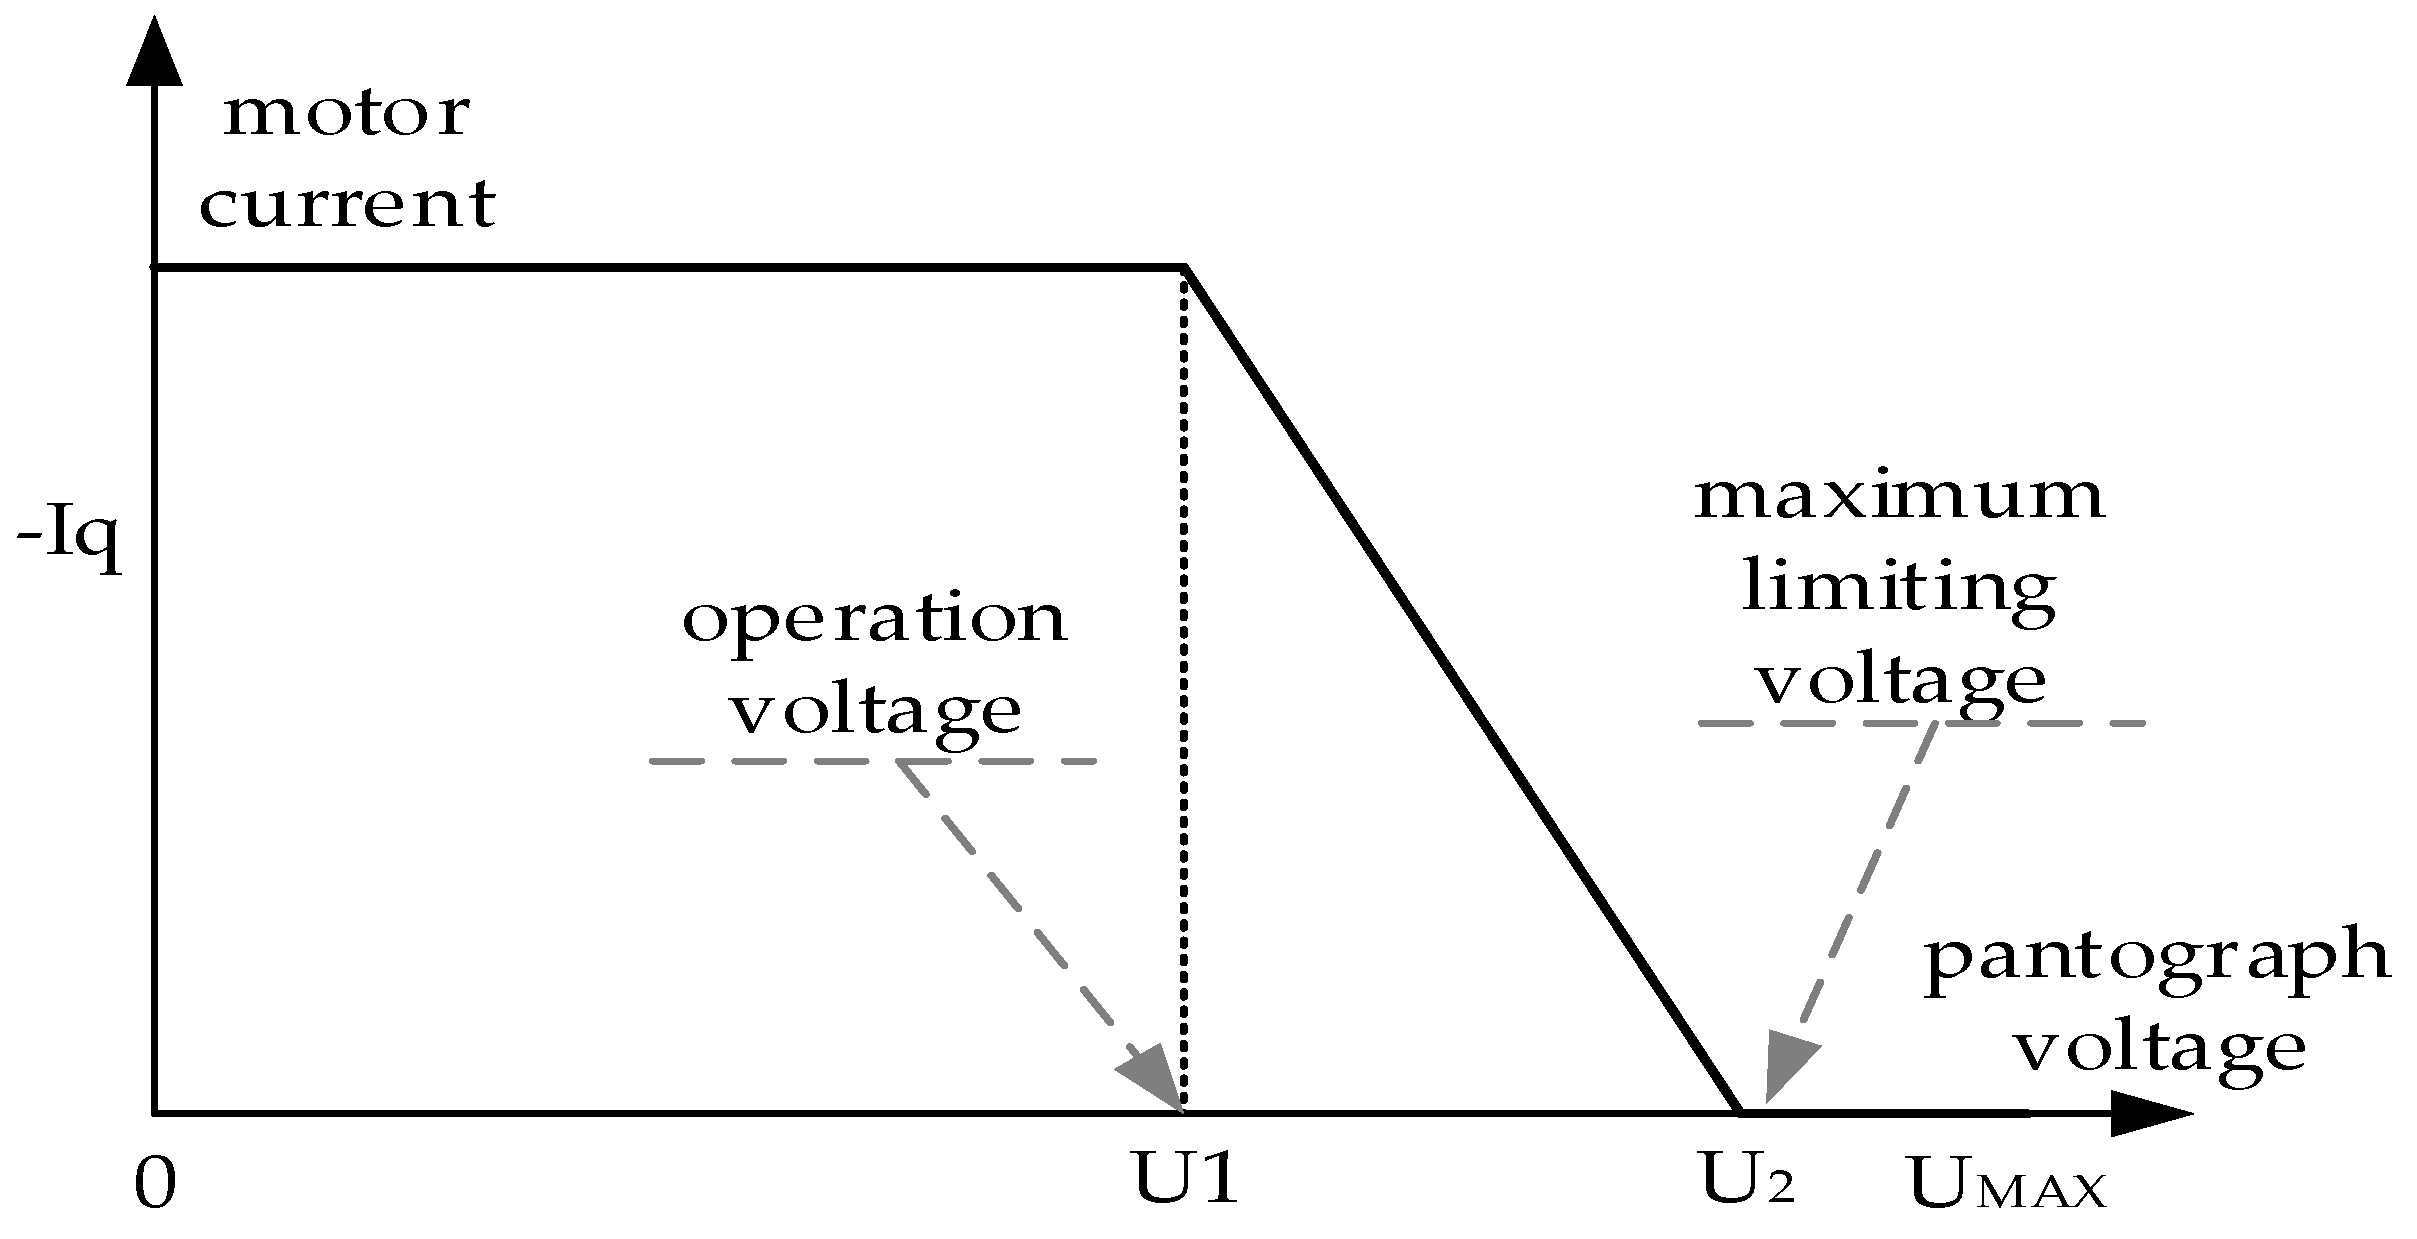
  • The regenerative braking is restricted by the traction network voltage. With the increase of traction network voltage, the regenerative braking power is limited. As shown in Figure 3, when the network voltage rises to U1, the train limit motor current reduces the output of the regenerative braking power; when the network voltage reaches the maximum limit voltage U2, then the regenerative braking is removed, and the motor current is zero.
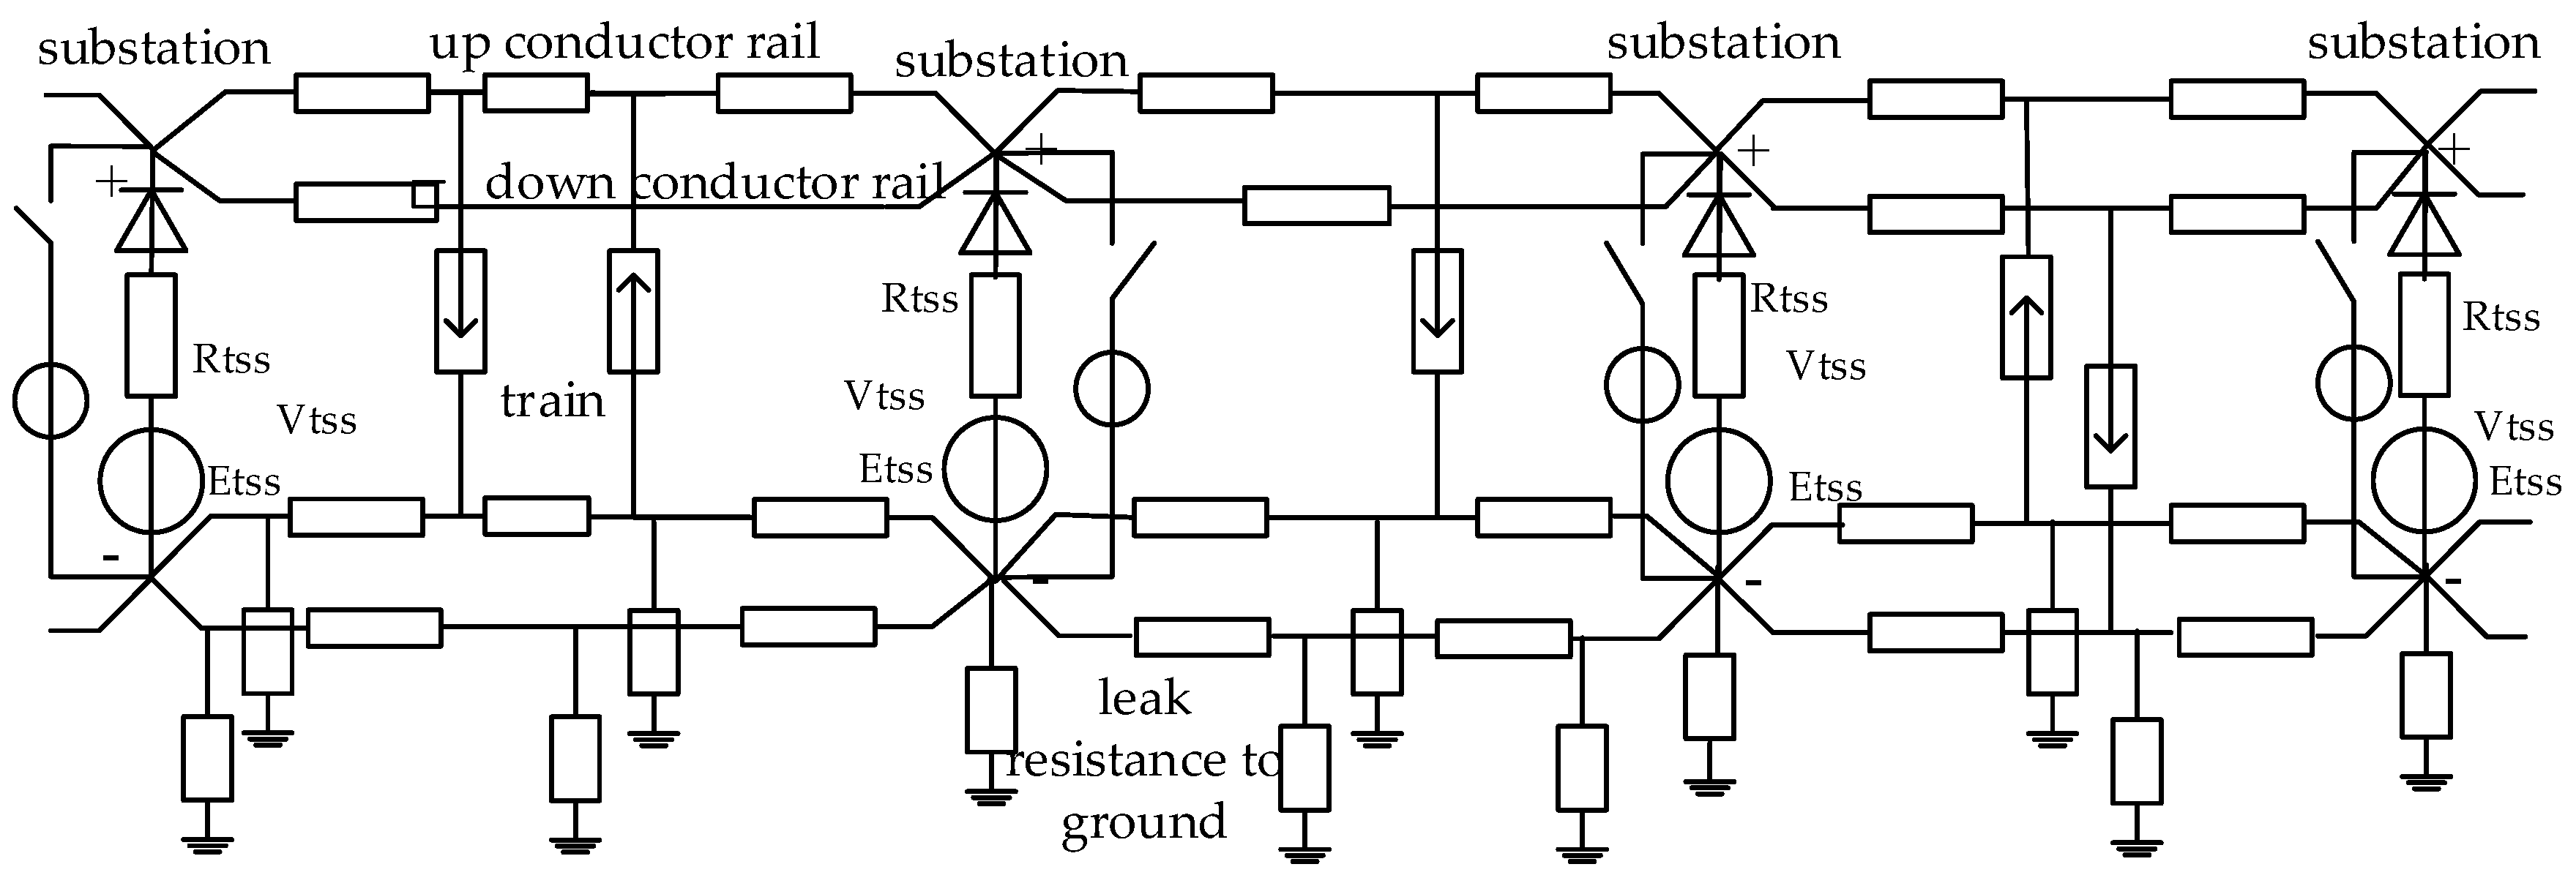
  • If there are energy storage devices (such as a super capacitor) in the line, they will affect the charging state of the energy storage device. For multi-train operation, to accurately calculate the energy consumption of the system and the utilization of the regenerative braking energy, a complete simulation model of the train and traction power supply system is required. The model of the traction power supply system includes the model of the substation, the model of the rectifier unit, the resistance model of the line, the model of the train, the model of the braking resistance, etc.

2.3. Principles of Dwell Time Optimization

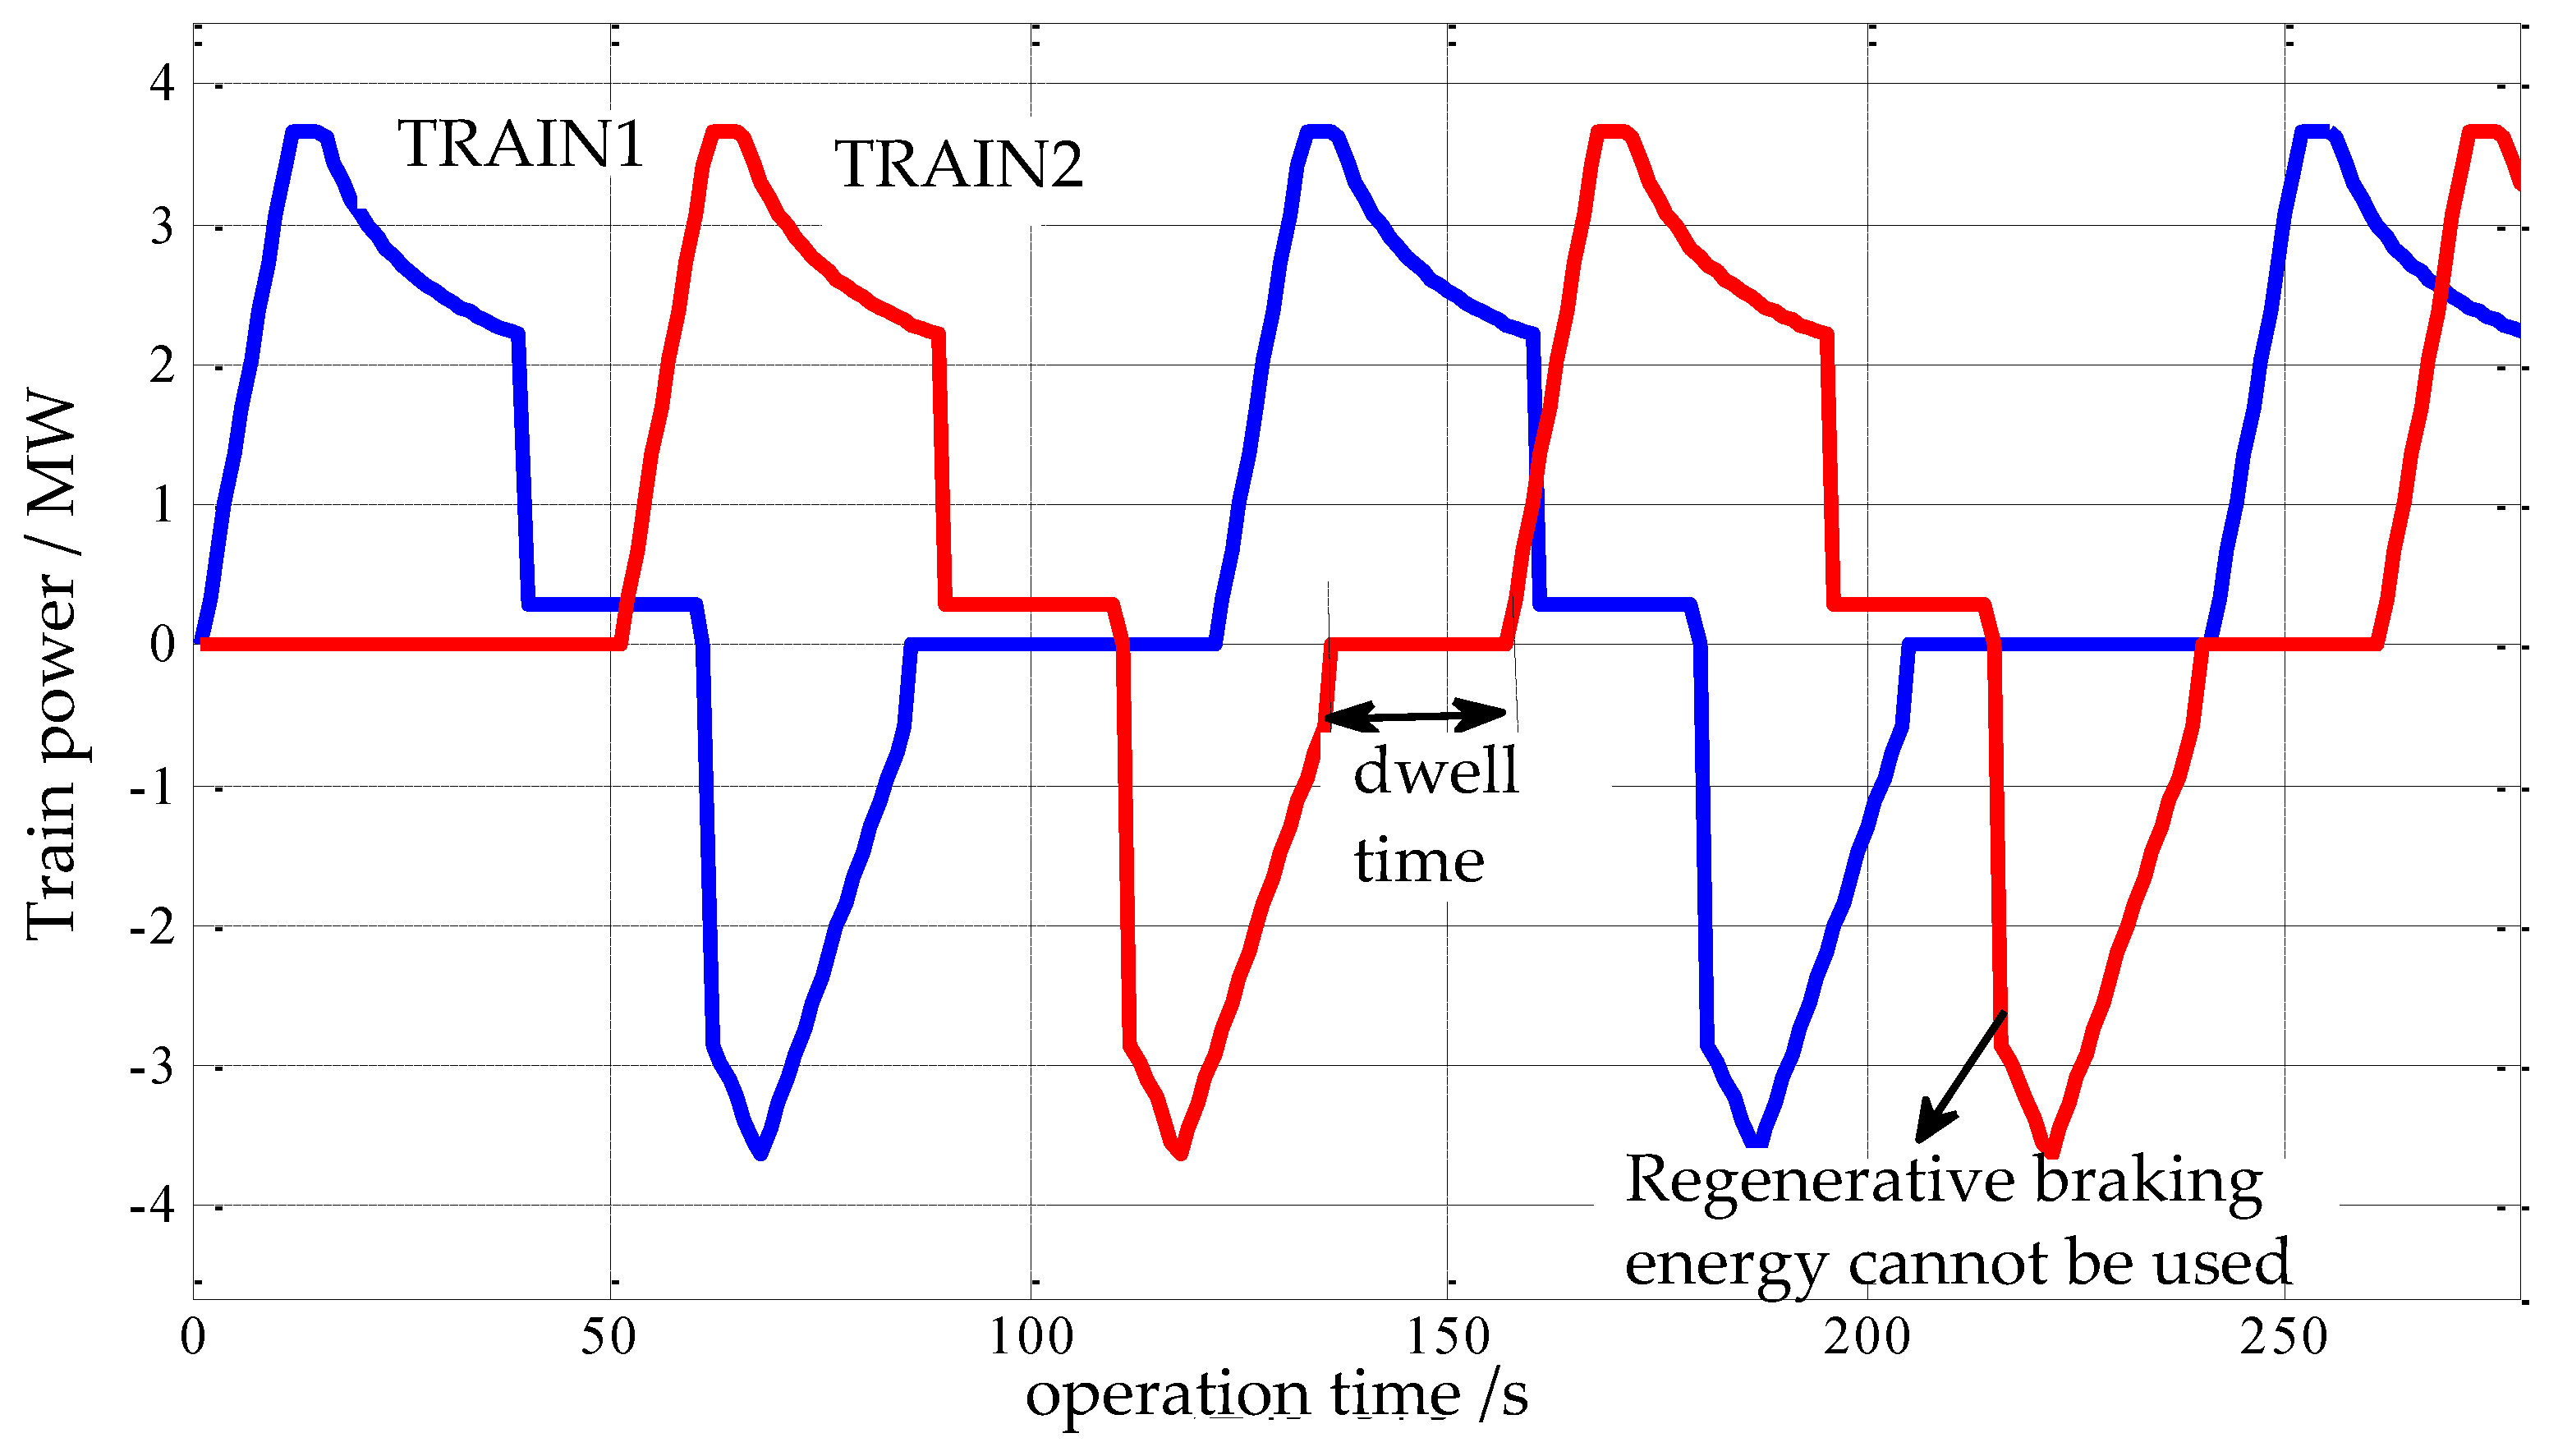
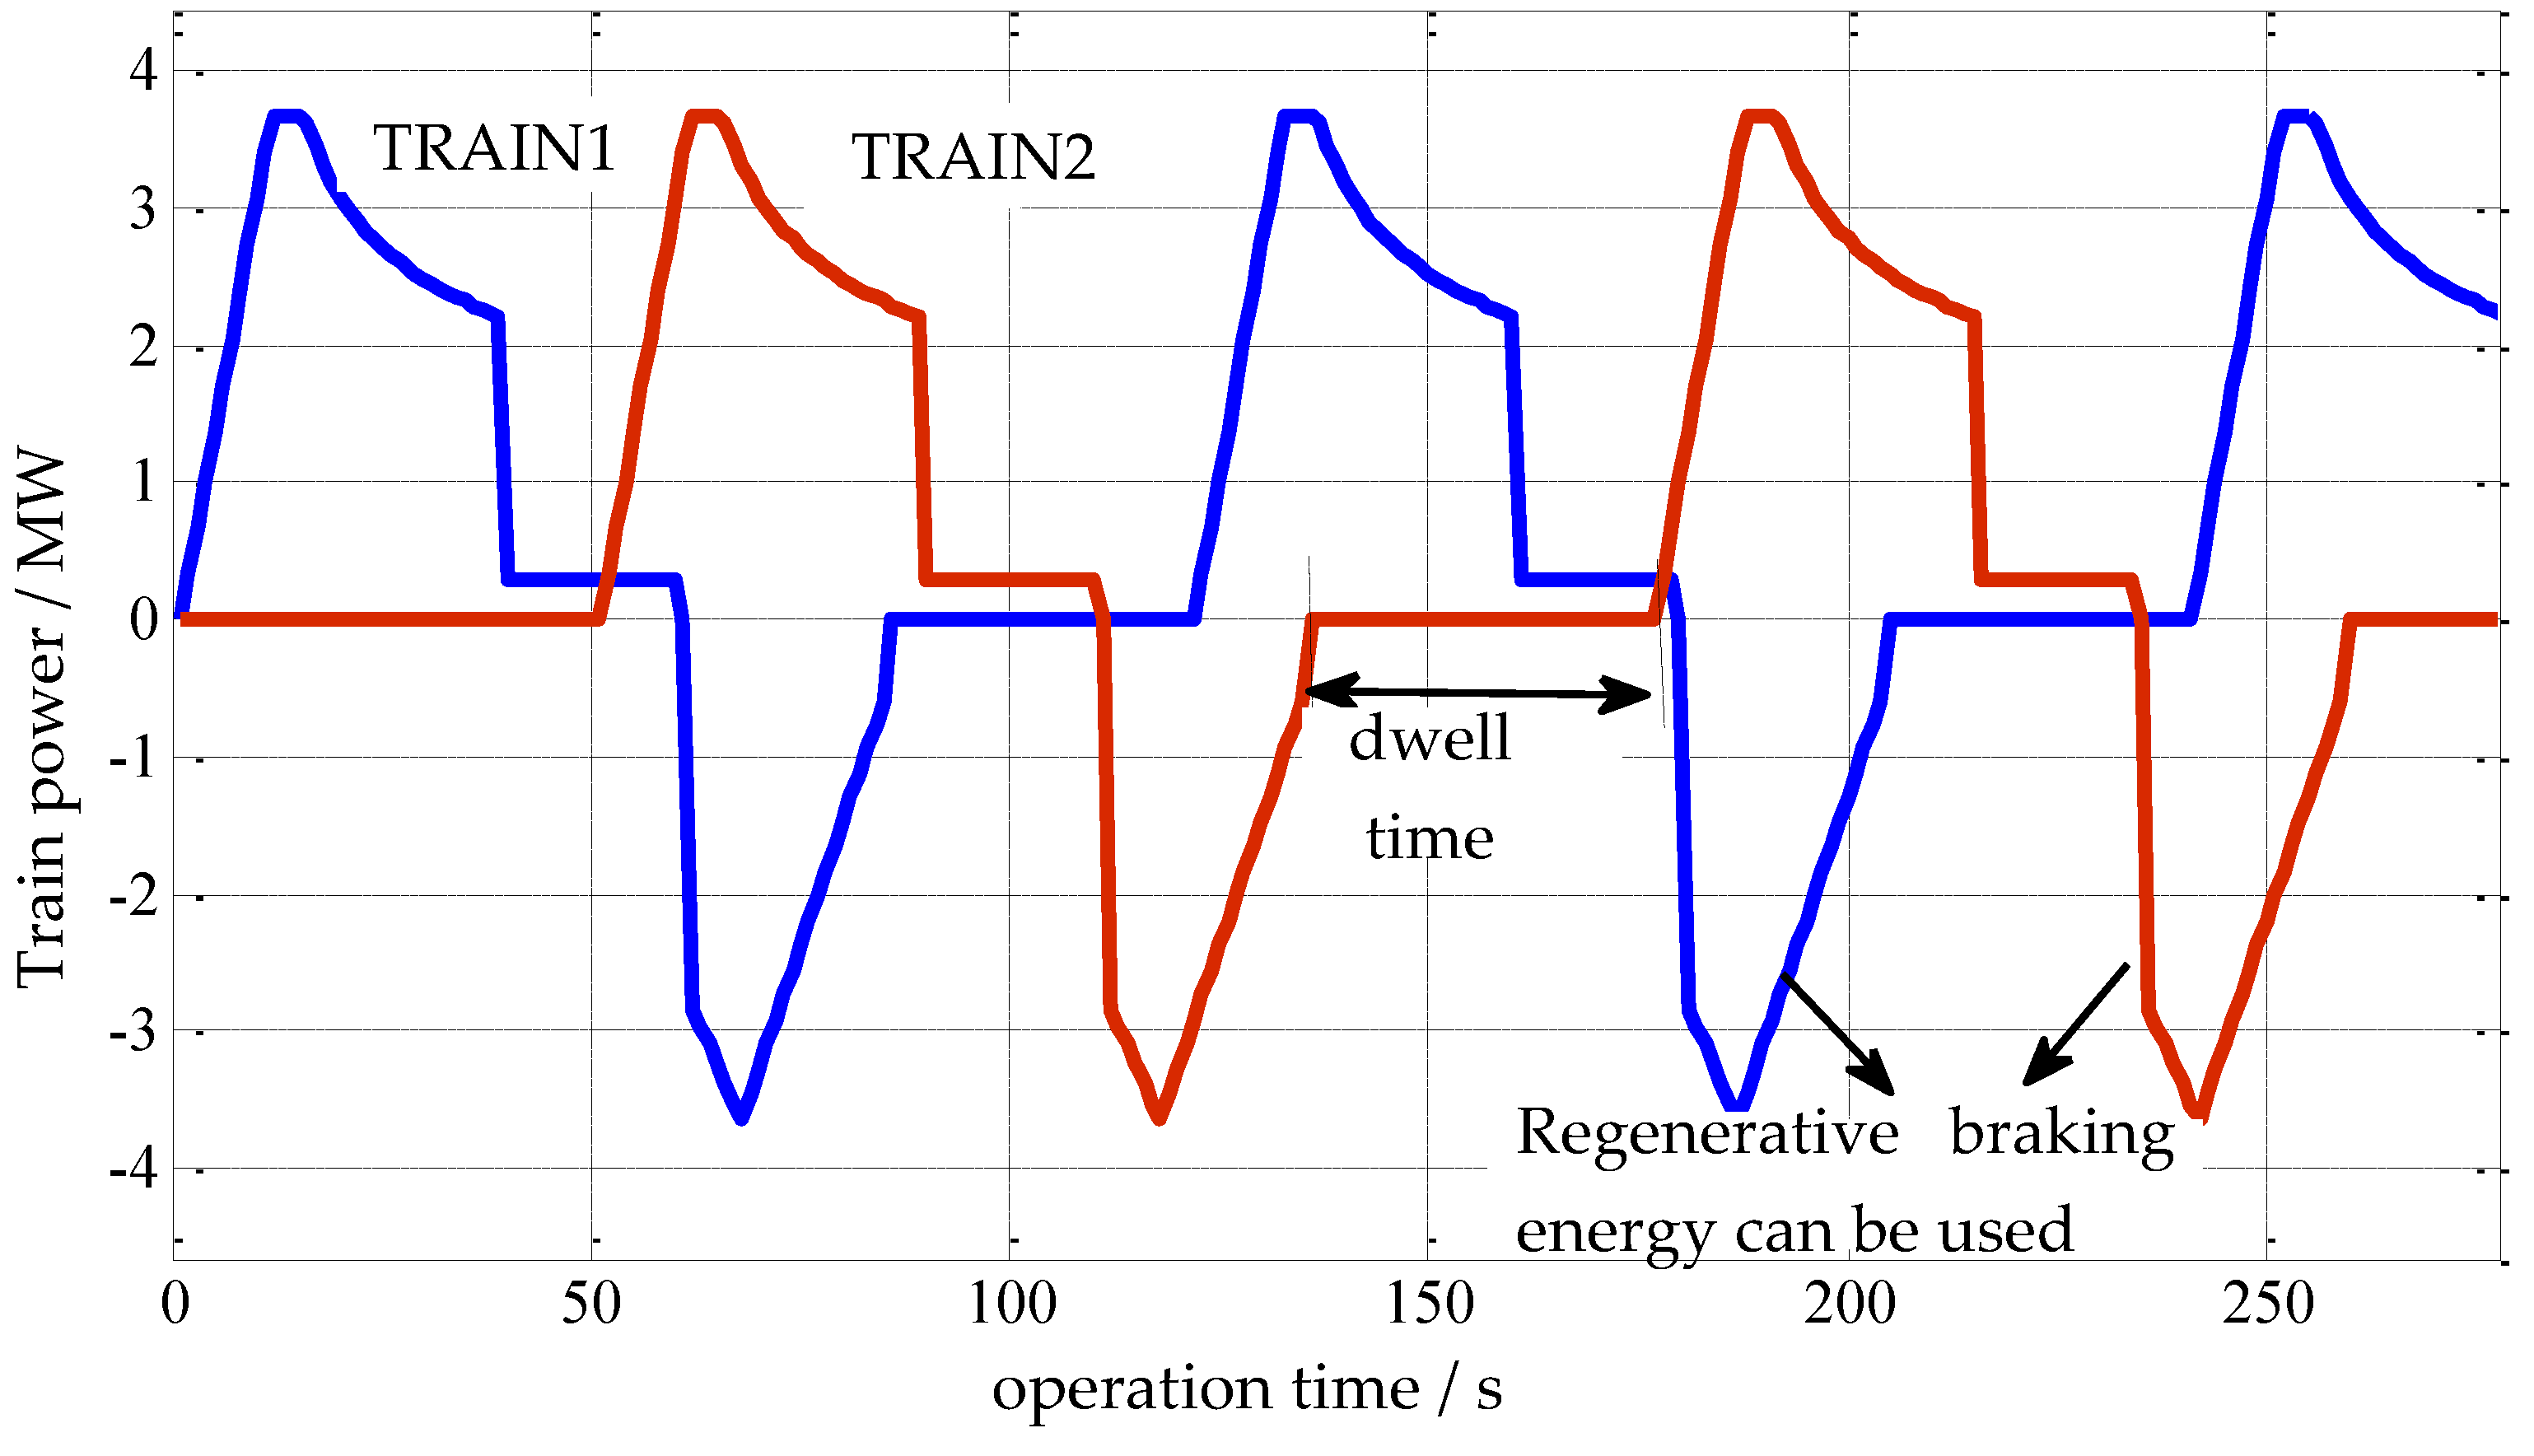
Urban rail transit system station spacing is relatively short, usually 1.5–2 km; thus, it must be able to quickly start or stop; the train’s traction acceleration is generally 0.9–1.0 m/s2, and braking deceleration is about 1.0 m/s2. Taking the Yizhuang Line as an example, it takes about 39 s to accelerate to 80 km/h; the maximum power needed for traction is about 3.6 MW; and traction energy consumption is 28 kW·h. It takes about 27 s from the speed of 80 km/h to stop, the maximum power of regenerative braking is approximately 3.6 MW; the produced regenerative braking energy is about 16 kW·h; and train dwell time in the stop is generally 30–35 s. A reasonable adjustment of the dwell time can improve the possibility that traction conditions and braking conditions occur at the same time with different trains, thus allowing the traction train to absorb greater regenerative braking energy and improve the regenerative braking energy utilization rate of the train.
Figure 4 and Figure 5 are the power curves of two trains running in the same power range, and the blue and red curves represent Train 1 and Train 2, respectively. Train 2 starts 50 s after Train 1. The two train power curves are the same. In Figure 4, Train 2 operates at the first station. At 118–135 s, then the traction and braking of Train 1 and Train 2 overlap, and Train 1 can use the regenerative braking energy of Train 2; at 179~198 s, Train 2’s traction condition and Train 1’s braking condition overlap, and the regenerative braking energy of Train 1 is partly used by Train 2; at 210 s and later, Train 1 stops, Train 2 brakes, and the regenerative braking energy of Train 2 cannot be used. In Figure 5, the dwell time of Train 2 is extended, and the starting time of Train 2 in the second station is delayed. It can be seen that, compared to Figure 4, in Figure 5, the train operating condition overlapping time is extended from 179~198 s to 179~205 s, and Train 2 uses more regenerative braking energy from Train 1, while the overlapping time of one train’s traction condition and another train’s braking condition is added to the 235~260 s. From Figure 4 and Figure 5, it can be seen that the adjustment of the stop time has a great impact on the regenerative braking energy.
Therefore, based on the existing schedule, reasonably adjusting the stop time of the train can effectively increase the overlapping time of the train traction and braking, so that more regenerative braking energy is utilized by the traction train nearby, thereby improving the utilization efficiency of regenerative braking energy and reducing the system total energy consumption.

3. Train Operation and Power Supply System Modeling

3.1. Train Operation Model

A multi-train operation model is established based on the single-train operation model, in which the train operation state equation and the constraint conditions that need to be satisfied, such as the dynamic performance of the train and the line conditions, are the same, but the traction network voltage constraints on the operation of the train are added. Assuming that there are N trains on the line, for train j, the train operation model must meet the following conditions:
Train kinematics model:
x ˙ j = { v j                         ( t j 0 t t j f )     0                    ( t s j 0 t t s j f )   
v ˙ j = { f j ( u j , U T j , v j ) r j ( x j , v j )                        ( t j 0 t t j f )     0                                                                                                                                       ( t s j 0 t t s j f )   
where xj is the position of train j at t time; vj is the speed of train j at t time; uj is the traction or braking control parameters of train j; UTj is the pantograph voltage of train j; fj is the unit mass tractive force or braking force with current control parameters fj, voltage UTj and speed vj; rj is the sum of the running resistance and accessories resistance of the unit mass of train j in the current position xj with speed vj; tj0 is the starting time of train j; tjf is the dwell time of train j; tsj0 is the start moment of the dwell time of train j; and tsjf is the end moment of the dwell time of train j.
Beginning and end state constraints of the train:
x ( t j 0 ) = x j 0 ,              v ( t j 0 ) = 0
x ( t j f ) = x j f ,               v ( t j f ) = 0
x ( t ) = x j f ,          v ( t ) = 0          ( t s j 0 t t s j f )
Train dynamic performance constraint:
1 u j 1
Figure 6 is the schematic diagram of uj, where, when the value of uj is greater than zero, fj is positive, as the traction force; when the value of uj is less than zero, then fj is negative, as is the braking force; when the value of uj is zero, then fj is zero, and the train is in the coasting drifting condition, as shown in Equation (7).
According to Equation (6) and the relationship between traction force and network voltage (Figure 2), the relationship among train force fj (traction or braking force), control parameters uj, network voltage UTj and train speed vj can be obtained, as shown in Equation (7):
f j ( u j , V T j , v j ) = { u j f j max ( U T j , v j )              ( u j 0 )     u j f j min ( U T j , v j )              ( u j < 0 )
where fjmax is the maximum traction force of train j with the current speed vj and voltage UTj; and fjmin is the maximum braking force of train j with the current speed vj and voltage UTj.
Line speed limit constraint:
0 v j V j max ( x j )
where Vjmax is the maximum speed allowed of train j in the current location xj.

3.2. Traction Power Supply System Model

In a multi-train operation process, power taken from the catenary and position of every train is constantly changing. In terms of circuit theory, the traction power supply system is a complex time-varying network; the power supply system state is related to location x(t), speed v(t), pantograph voltage U(t) and train control parameters u(t) of each train, as well as the number of circuit equations and the train number and locations.
With a normal bilateral power supply, the traction substation bus link uplink and downlink catenary (third rail) and, similarly, uplink and downlink rail are linked through the return line. The substations of the traction network all contribute. Due to the parallel operation of the uplink and downlink trains, it is necessary to consider the interaction between the upper and lower catenary and track when establishing the mathematical model of the DC side [40].

3.2.1. Power Substation Model with Rectifier Units

The external characteristic of the rectifier unit is that the DC output voltage curve changes with the load current or short-circuit current. The rectifier unit in the DC traction power supply system simulation is often treated as a constant ideal voltage source with internal resistance, as shown in Figure 7.
The TSS is the traction substation; RTSS is the substation equivalent resistance; ETSS is the equivalent voltage source of the substation; and VTSS is the substation busbar voltage. In fact, the external characteristic of the rectifier unit is nonlinear. In this paper, the output characteristic curve of the two parallel 12-pulse rectifier circuits is equivalent to the external characteristic curve of the 24-pulse rectifier circuit, and the substation external characteristic curve adopts the multi-linear model proposed in [41].

3.2.2. Train Model

The train power taken from the network is often dependent of the network voltage, and the current is greatly influenced by the network voltage; thus, the power source model is used for the train model in the traction power supply system. The speed, position and power of each train at each moment can be obtained using the train operation model. As the train is based on the power source model, the circuit equations are a nonlinear equation set and must be solved using the iterative method. When train traction occurs, the power value is positive, which means that electrical power must be obtained from the DC net; when the train is coasting, the power used is train auxiliary power obtained from the DC net power; and during regenerative braking, the power is negative, which means that regenerative braking power flows from the train to the power grid [42].

3.2.3. Traction Network Model

The line resistance of the traction network changes with the change of the location of the train and the position between trains, which mainly includes the line resistance between the train and the substation, the line resistance between trains and the leakage resistance of the track to the ground. The leakage resistance is generated due to the fact that the most traction current flows back to the traction substation along the rail line, as part of it leaks into the ground, then flows back to the rail and then back to the traction substation. When calculating the equivalent resistance, it is necessary to consider the leakage resistance. According to the uniform transmission line theory, the accurate equivalent π circuits [43,44] are used for each section of the line tracks. Considering the precision of the modeling, the upper and lower rails should be modeled separately, as shown in Figure 8.

3.3. Optimization Goal of Multi-Train Energy Saving Operation

3.3.1. Calculation of Energy Consumption Parameters

According to the circuit solution of the traction power supply system, the dynamic electrical data, such as voltage, current of each train and substation, can be obtained, and according to the voltage and current integral, the train and substation’s energy consumption values can be obtained.
When the train current is positive, it is in the traction state, and the power integration of the corresponding time is the train traction energy consumption.
E tra = 0 T P t r a d t = 0 T I t r a U train d t
where Ptra is the train traction power; Itra is the train traction current; Utrain is the train pantograph voltage; and T is the total running time.
When the train current is negative, it is in the regenerative braking state, and the power integration of the corresponding time is the train regenerative braking energy.
E r e g = 0 T P r e g d t = 0 T I r e g U train d t
where Prega is the train regenerative braking power; and Ireg is the train regenerative braking current.
According to the calculated results of the substation, the power integration at the time substation current is positive, which means that the output energy is the substation traction energy consumption within the corresponding time.
E ss = 0 T P s s d t = 0 T U s I s d t
where ESS is the substation energy consumption; PSS is the substation power; US is the substation voltage; and IS is the substation current.
In this paper, the model of the braking resistor is added to the actual simulation to calculate the unemployed regenerative braking energy. The braking resistance absorption power integration is the regenerative braking energy, which is not being used at the running time.
E r e g _ u n u s e = 0 T P b r _ r e s d t = 0 T U s I b r _ r e s d t
where Ereg_unused is the braking resistance absorption energy; Pbr_res is the braking resistance absorption power; and Ibr_res is the braking resistance absorption current.

3.3.2. Optimization Goal of Multi-Train Operation

When operating multi-trains, considering the utilization of regenerative braking energy, the energy consumption of the system consists of the following:
E ss = E t r a E r e g _ u s e d + E l o s s
E r e g _ u s e d = E r e g E r e g _ u n u s e
where ∑ESS is the total energy consumption of all substations; ∑Etra is the total traction energy consumption of all trains; ∑Ereg_used is the system total used regenerative braking energy; ∑Eloss is the total traction power supply network line loss; ∑Ereg_unuse is the system total unused regenerative braking energy; and ∑Ereg is the total regenerative braking energy of all trains.
As can be seen, the effective use of multi-train regenerative braking energy can reduce the system’s total substation energy consumption. The multi-train operation optimization aims to optimize the substation total energy consumption, as shown in Equation (15).
J = S = 1 M E s s
where J is the substation total energy consumption; and M is the number of traction substations.
To more accurately measure the use of the regenerative braking energy before and after optimization, we define the regenerative braking energy utilization, namely the ratios of total regenerative braking energy used by the trains and total regenerative braking energy generated by the trains, as shown in Equation (16):
η r e g -used = E r e g E r e g _ u n u s e E r e g × 100 %
where ηreg-used is the regenerative braking energy utilization.

3.4. Calculation Flow of Multi-Train Operation

3.4.1. Calculation of Train Operation

In this paper, the discussion of multi-train operation is built on the assumption that each of the trains is strictly restrained by schedule, and the models are simplified: the former means assuming the operation curves of each train running in the same direction are the same; and the latter means not considering the effect of traction network voltage to train traction and braking performance, assuming that the current network voltage can meet the needs of the train traction and braking performance.
As shown in Figure 9, dwell time, running time, train date and line data are the input data of single train operation calculation. Additionally, the time-power curve and the time-distance curve obtained by single-train operation calculation are the input data of multi-train operation simulation.

3.4.2. Multi-Train Operation Simulation

First, the simulation model of the traction power supply system is built according to the actual parameters of the line. Via the position, power and other information of the uplink and downlink trains at each moment obtained by single-train running calculation, and based on the constraint of headway and synchronization time according to the schedule, the time, position and power of multiple train operation are obtained, to be used as the input of the traction power supply system simulation model. As shown in Figure 9, according to the input multi-train operation data, the structure current traction network equivalent circuit in the model of the traction power supply system, we can determine the electrical parameters of the traction network and obtain the total traction energy consumption and regenerative braking energy of the multi-train operation, as well as the total energy consumption and unused regenerative braking energy of the traction power system in a given period of time.

3.4.3. Overall Process of Calculation

Based on MATLAB, this paper next carries out the programming of the multi-train operation simulation model, and the basic framework and data structure of the model are shown in Figure 9. Figure 9 is the summary of the content of Section 3.4.1 and Section 3.4.2.

4. Genetic Algorithm Optimization

Based on the mathematical model of the multi-train operation established above, the dwell time influence on the regenerative braking energy utilization and total energy consumption of the system is researched. The energy consumption model based on the dwell time is established and is optimized with genetic algorithms. Simulation and verification are performed based on the actual data of the Yizhuang Line.

4.1. Mathematical Model

The research of the dwell time is based on the assumption that the headway, synchronization time and inter-station travel time are all fixed.
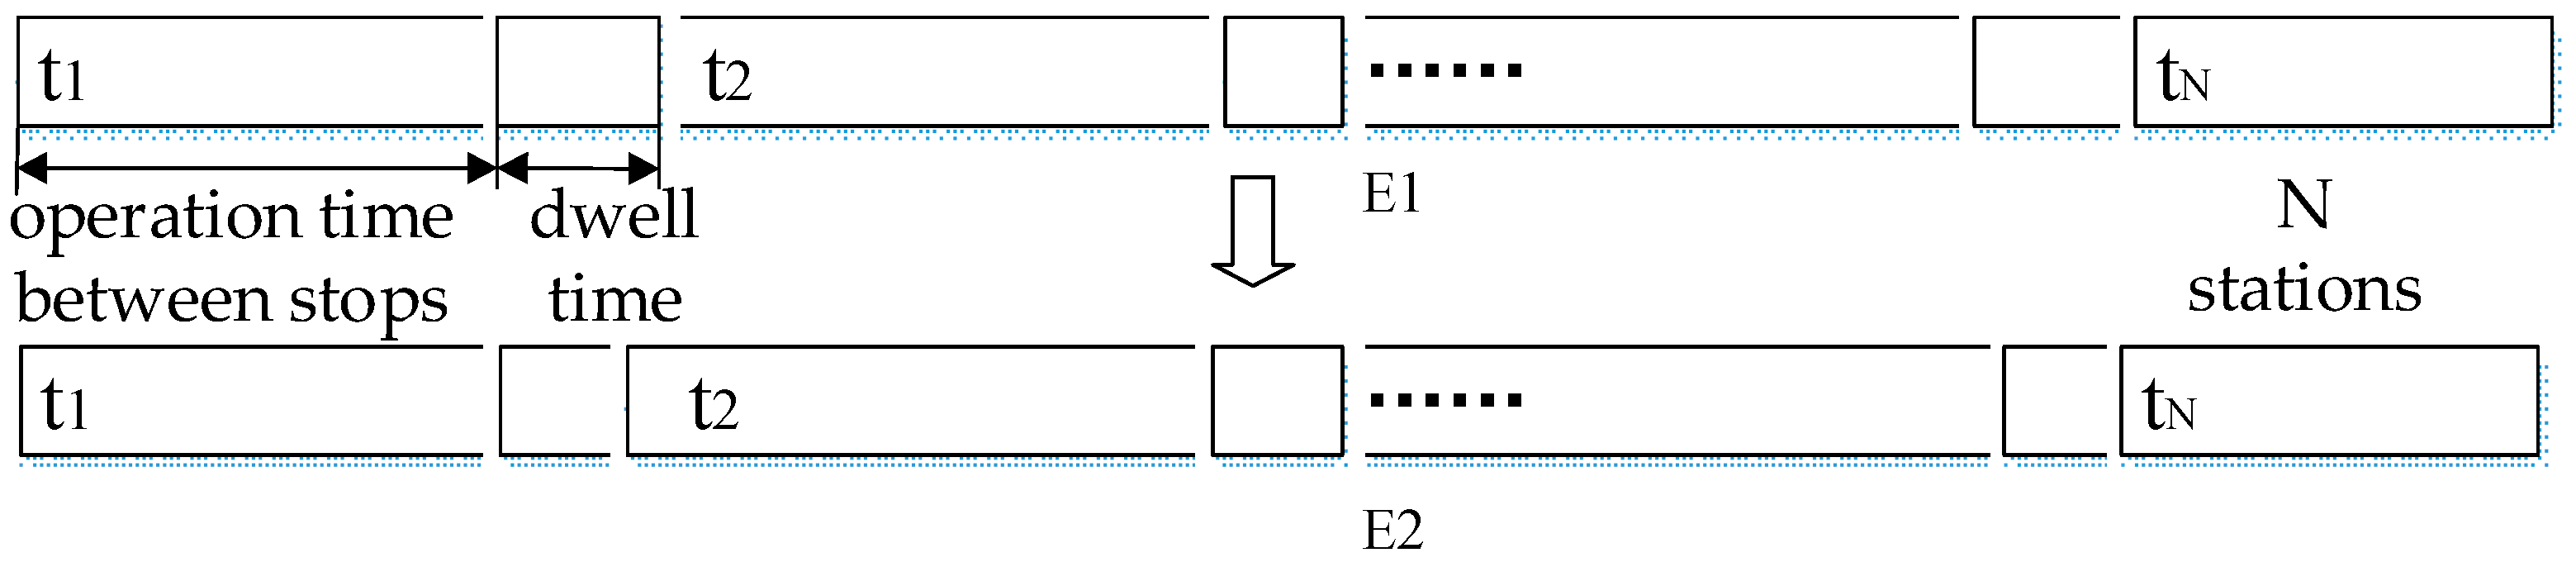
Figure 10 is the schematic diagram of the dwell time modification. Assuming that the number of stations in the line is N, then the dwell time at each station of the line are: t1, t2, , tN, where tN is the dwell time at the N-th station. The total energy consumption of the system is different with different dwell time combinations; thus, the problem can be abstracted as a combinatorial optimization problem of dwell time and energy consumption, such as shown in Equations (17) and (18).
For N stations, assuming that the dwell time of train, tstop, has k combinations, then tstop_i is the i-th dwell time combination.
t s t o p _ i = { t 1 , t 2 , t i , t N 1 , t N }
k combinations of dwell time have corresponding system total consumption Ei:
E i = f ( t s t o p _ i )
For urban rail transit, there are typically 10–15 stations. Assuming that the dwell time of each station is adjusted by −5 s–+5 s on the basis of the original schedule, there are 1010–1015 combinations of dwell time. The number of combinations is very large, too large to be enumerated; thus, an optimization algorithm is required for the solution. In a variety of heuristic algorithms, genetic algorithms operate directly on the structure of the object, with no derivation or function continuity limit, thus allowing the use of a very complex fitness function (also known as the target function), and the variable range of variables can be restricted. Randomization optimization methods can automatically obtain and guide the optimization search space and do no need to identify the rules; thus, they are more suitable for optimization in which time is the variable. Therefore, this paper uses a genetic algorithm to optimize the dwell time.

4.2. Introduction of Genetic Algorithm

A genetic algorithm is a random search algorithm, referencing biological natural selection and genetic mechanisms. Different from traditional algorithms, genetic algorithms search from a randomly-generated initial solution, and through the selection, crossover and mutation operations iterate step by step to produce new solutions. Each individual in a group is a solution, called chromosomes. The merits of chromosomes are evaluated by the fitness function. According to the fitness value, we select a certain number of outstanding individuals from the previous generation, to form the following group through crossover and mutation operations. After several generations of evolution, the algorithm converges to the optimal chromosome, i.e., the final solution of the problem.

4.3. Optimization Method

Different combinations of dwell time have different impacts on the energy consumption of the power supply system. By means of the genetic algorithm to encode each dwell time, the optimal combination of the dwell time can be solved.
Assuming that the train headway and synchronization time of the uplink and downlink train are fixed at the same period, the train operation curves in the same direction are the same (i.e., the operation curves of the uplink trains are the same, and the operation curves of the downlink trains are the same), and the dwell times of the uplink and downlink trains at the same station are the same, as shown in Equation (19).
t d o w n = { t 1 , t 2 , t i , t N 1 , t N } t u p             = { t N , t N 1 , t i , t 2 , t 1 }
where N is the number of stations; ti is the dwell time of the i-th station; tdown is the dwell time combination of downlink line; and tup is the dwell time combination of the uplink line.
Based on the above assumptions, we can build a dwell time optimization model based on the genetic algorithm.

4.3.1. Encoding

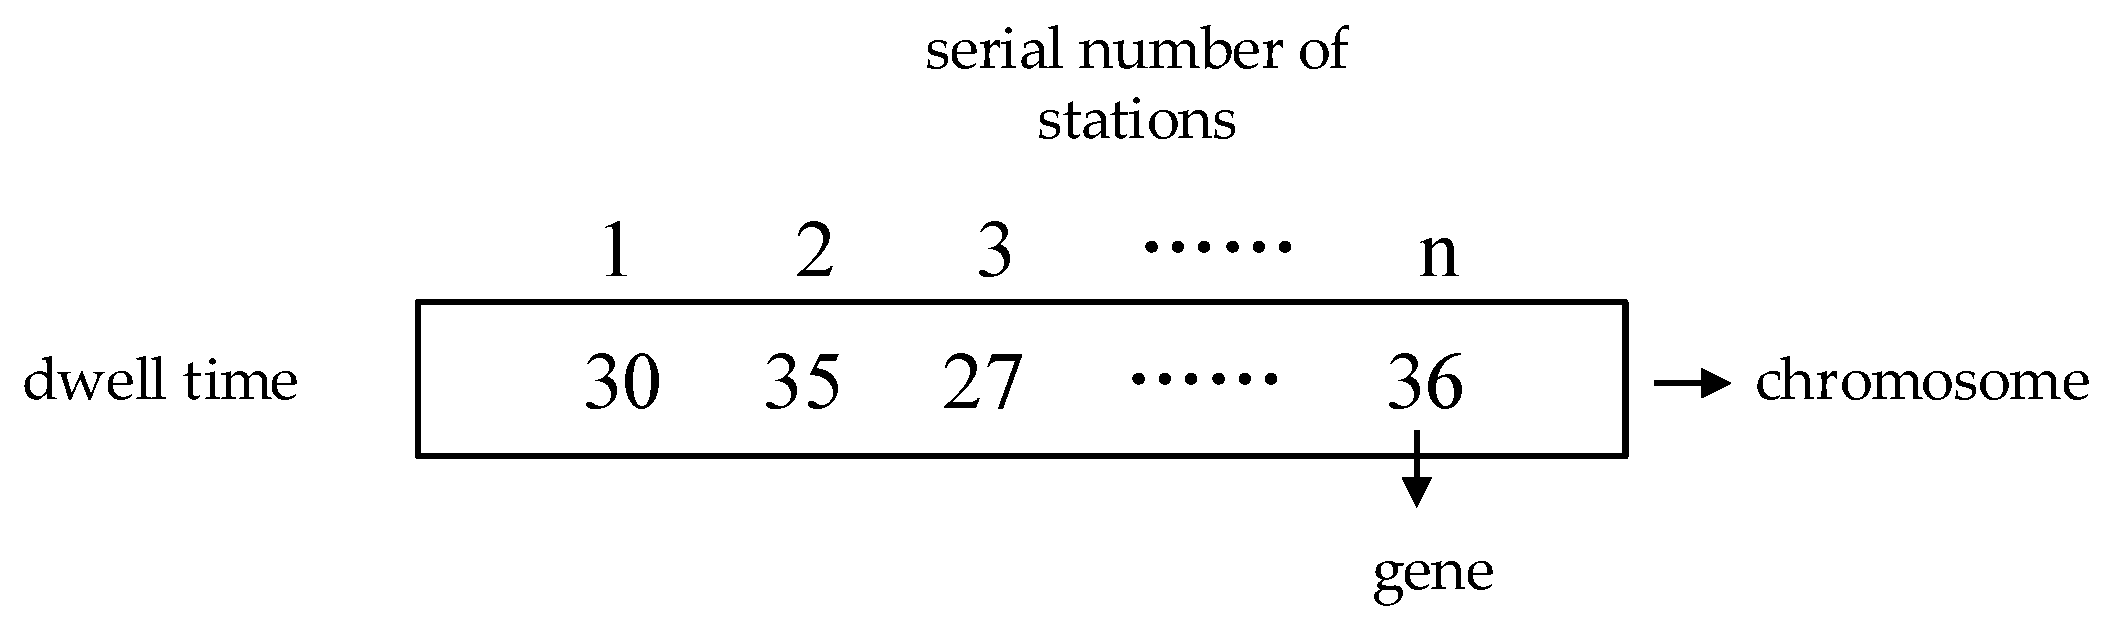
The optimization parameter is the train dwell time; thus, the collection of the train dwell time at each station is encoded as a chromosome, and each station dwell time is the gene forming the chromosome. Using real numbers to encode the dwell time, the schematic diagram of dwell time encoding is shown in Figure 11.
In an urban rail transit system, the length of the train dwell time is related to the number of passengers, the number of train doors and other factors [45]. In order to ensure the boarding/alighting needs of passengers during actual operation, this paper optimizes the dwell time based on the existing train schedule in a certain range. Therefore, the encoding must restrain the size of the gene, e.g., the dwell time is required within 25–45 s for each station, or adjusted within −5 s–+5 s on the basis of the original dwell time, to ensure the feasibility of the dwell time after optimization. Using the genetic algorithm, the initial population is generated, and for each chromosome, the genes must satisfy Equation (20).
t low _ limt t i t up _ limt
where tup_limit is the upper limit of dwell time; and tlow_limit is the lower limit of dwell time.

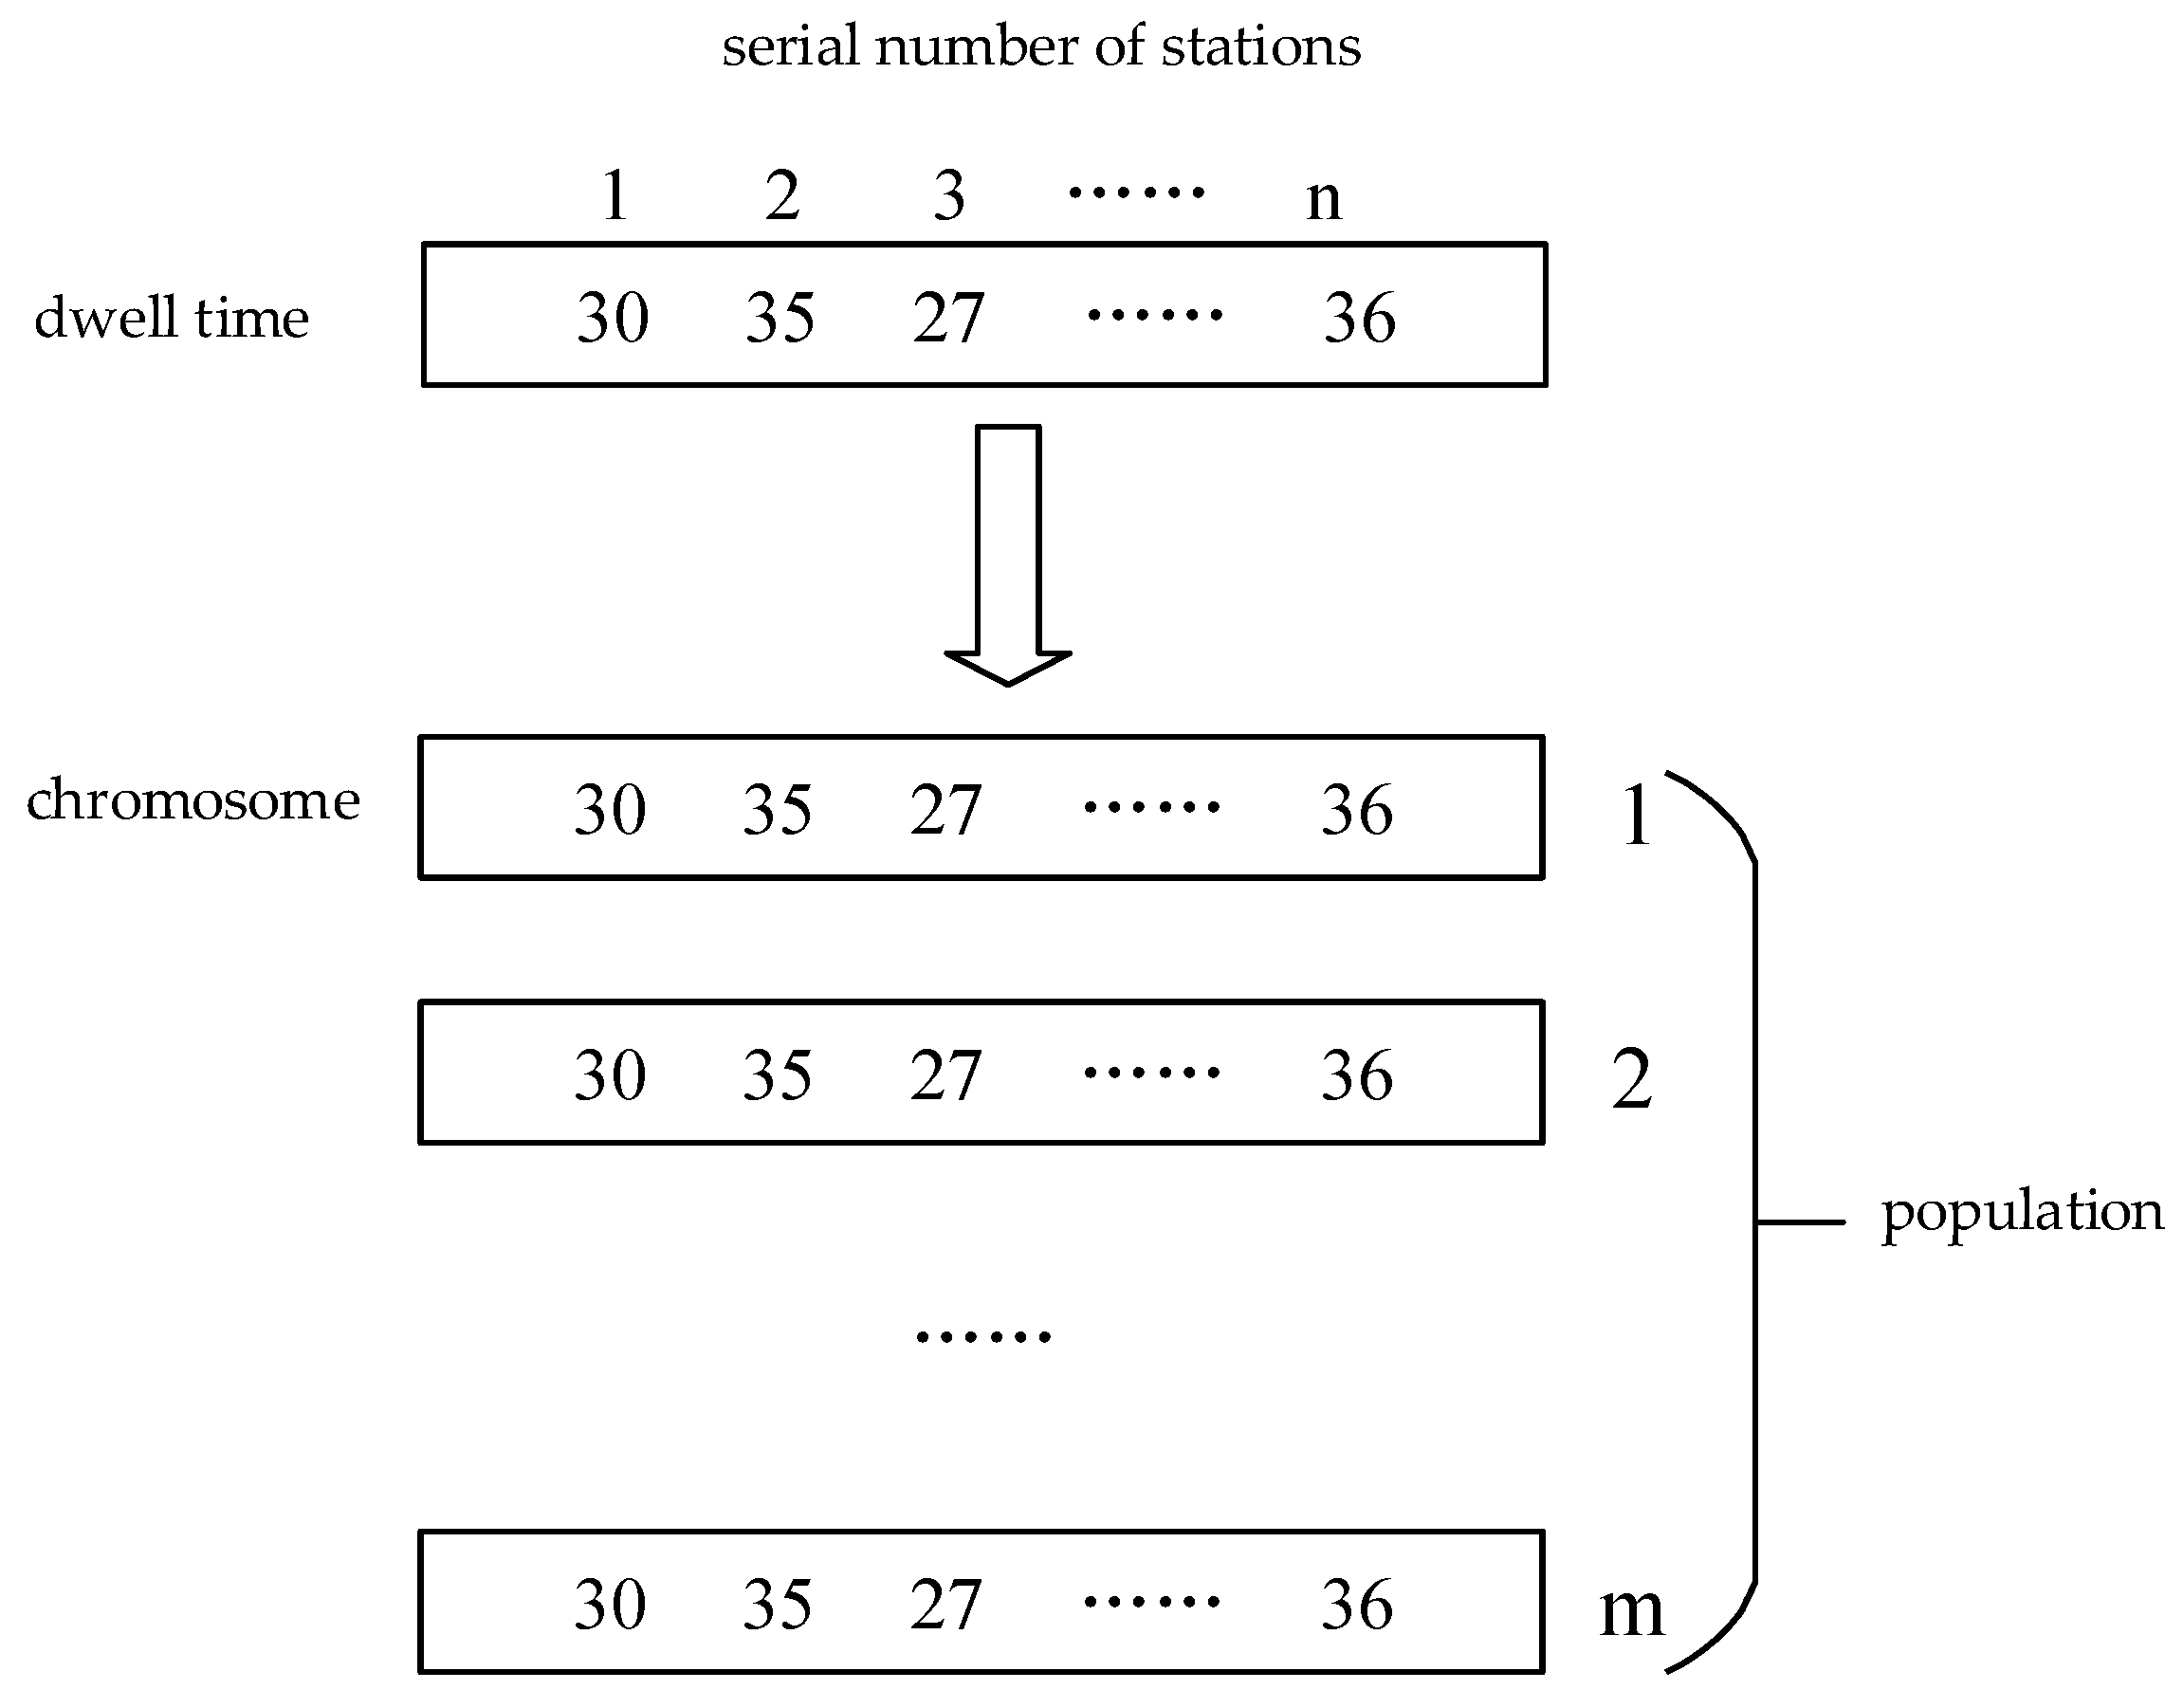
4.3.2. Generating the Initial Population

According to the genetic algorithm, the initial population of the combination of different dwell times is randomly generated, as shown in Figure 12.

4.3.3. Fitness Function

The optimization of the train dwell time affects the utilization of the regenerative braking energy when the multi-train is operating. The electric energy used by the train originates from the traction substation, thus the optimization objective function is the total energy consumption of the traction power supply system. The negative value of the energy consumption of the fitness function is shown in Equation (21).
F i t _ function = - 0 T P s d t
where Ps is the total power of all substations; and T is the total operation time.

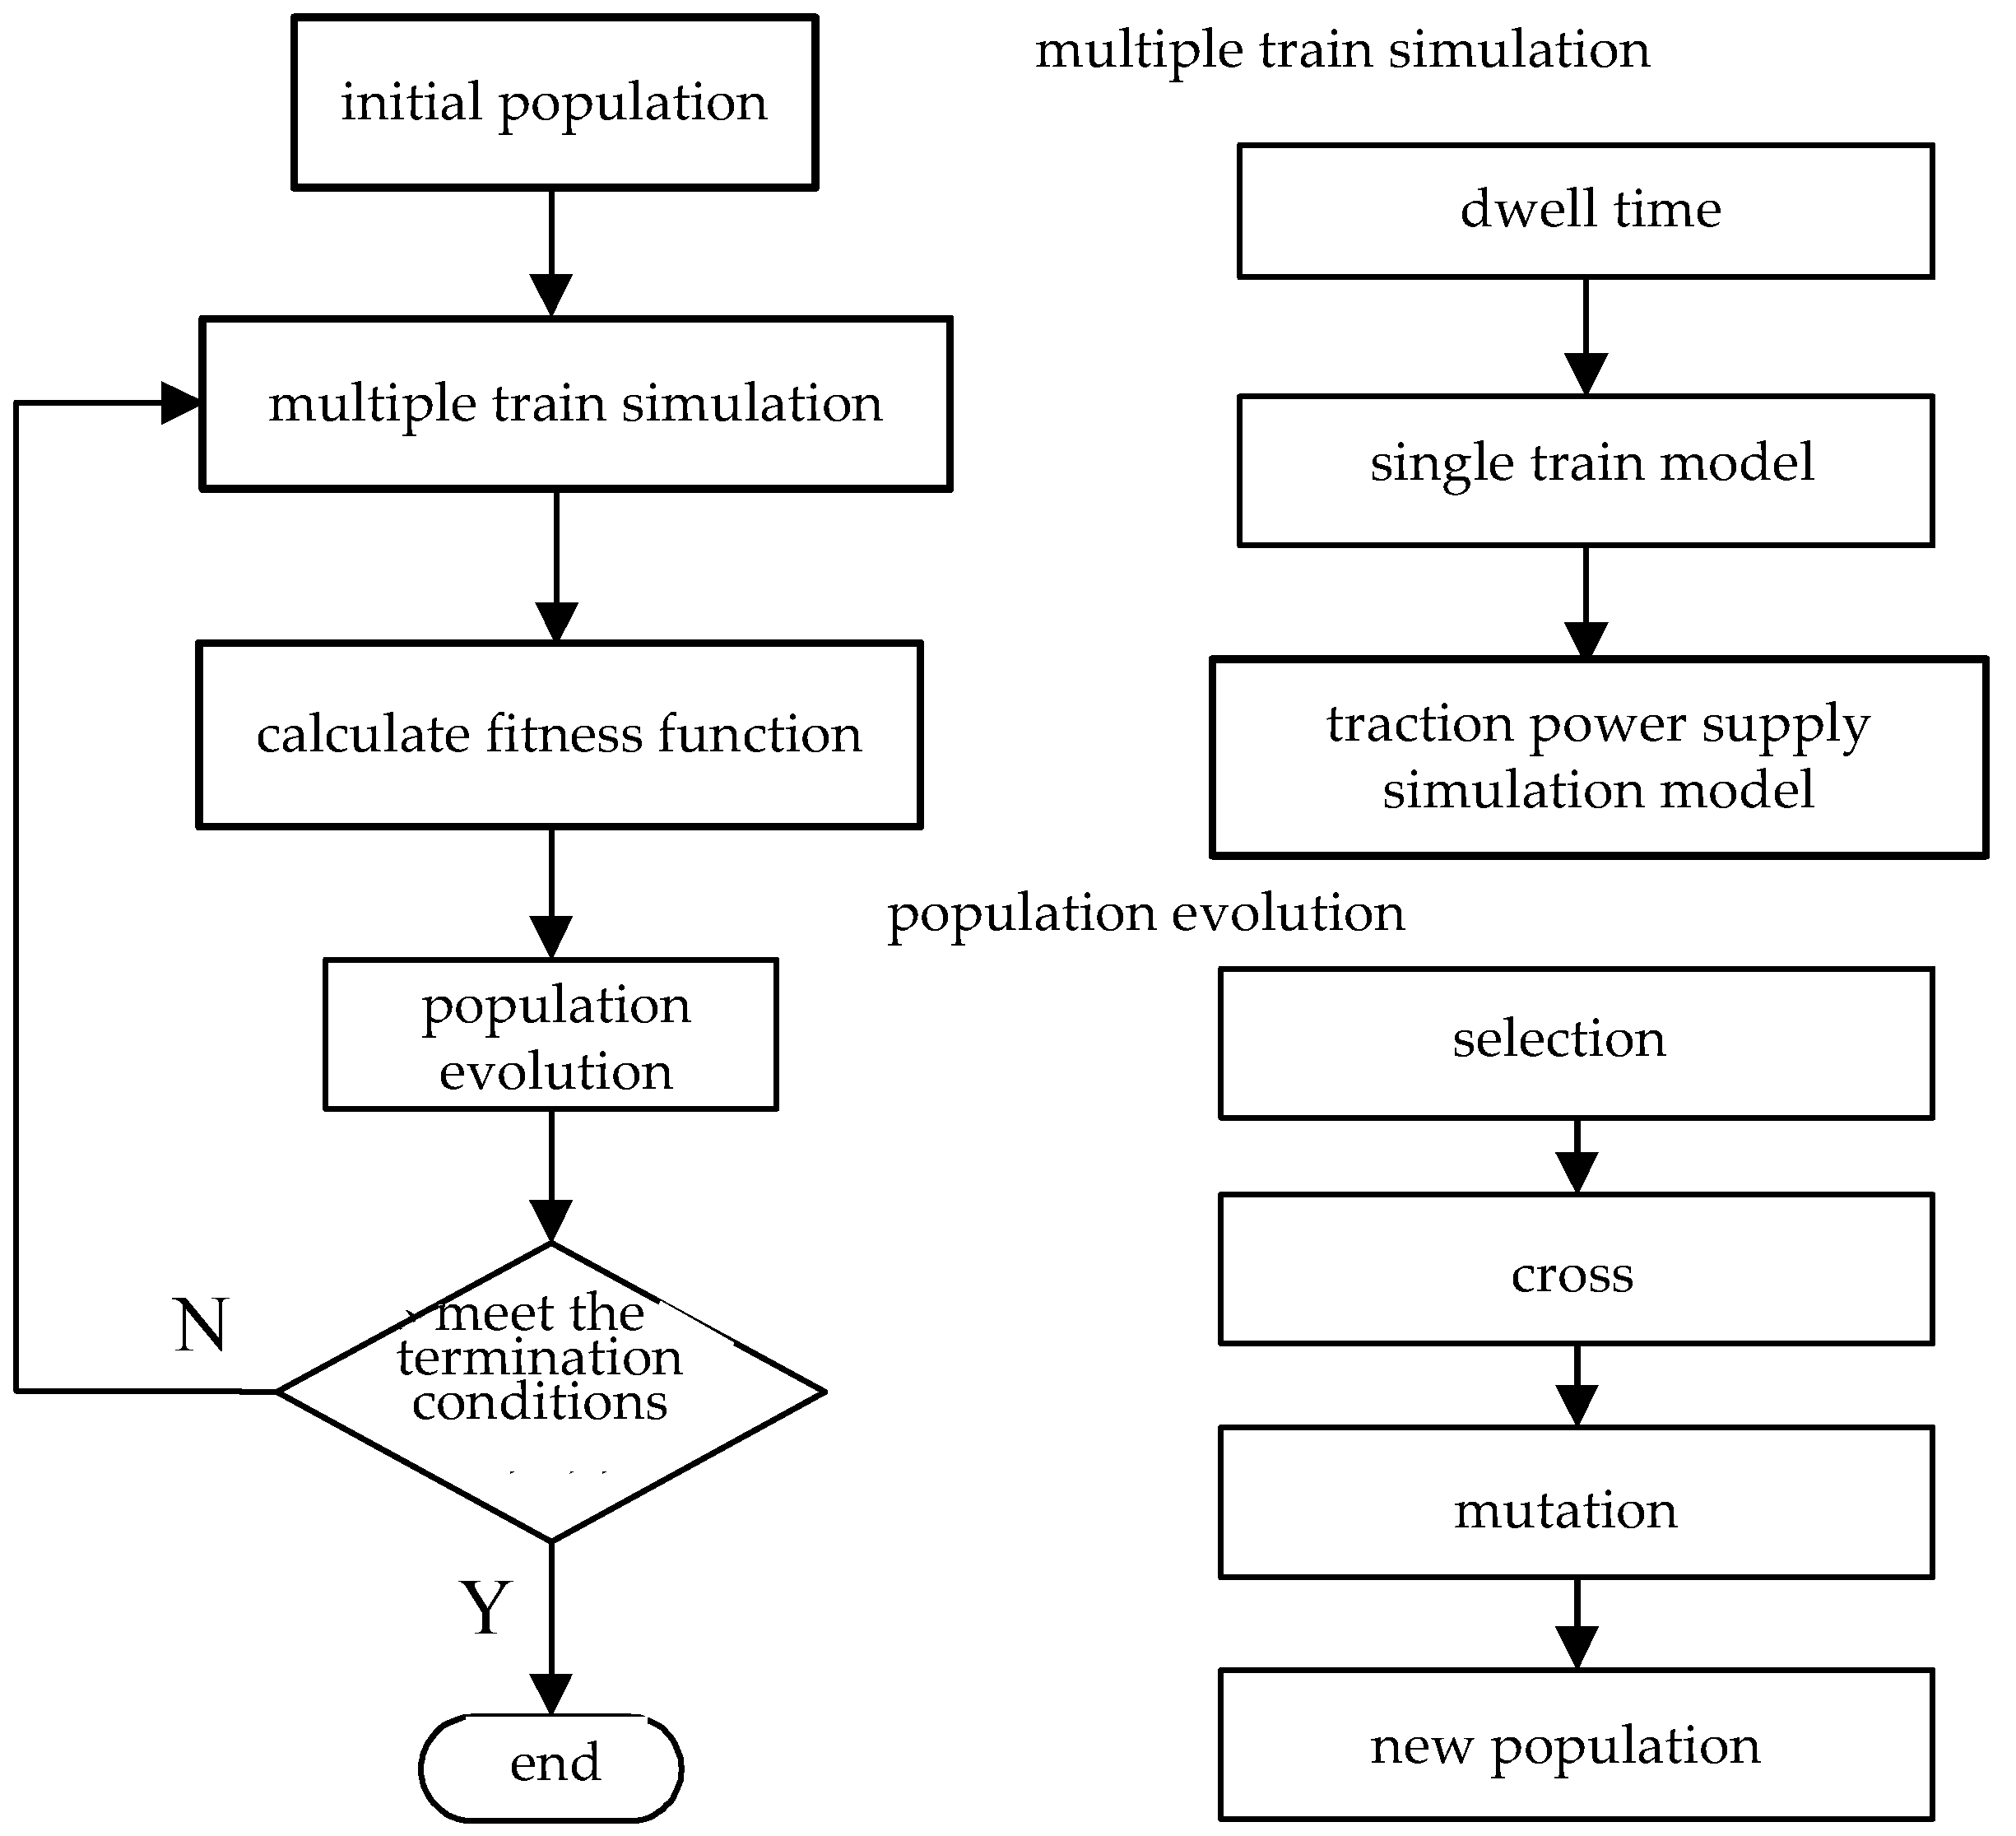
4.4. Calculation Flowchart

Figure 13 is the algorithm flowchart of the train dwell time optimization using a genetic algorithm.
  • The first generation of the population is generated randomly, and the m individuals generated correspond to the collection of dwell time, where m is the population quantity.
  • Combining the dwell time in Step 1 and train operation data, the input direct current supply model is used to establish the corresponding circuits to calculate the electric and energy consumption data of the trains and power substation.
  • According to the fitness function, Equation (20) is used calculate the fitness value of each individual.
  • According to the fitness value calculated in Step 3, we perform genetic manipulation, such as selection, cross, mutation, and so on, to generate a new population.
  • We determine whether the termination conditions are met, and if they are not satisfied, the new generation of population data will be input into Step 2 to continue the calculation; if they are satisfied, then the calculation and output results are terminated.

5. Dwell Time Optimization Based on Yizhuang Subway Line

The traction power supply system of the Beijing subway Yizhuang Line adopts the distributed power supply mode, with a total of 12 traction substations. The traction substation adopts the 24-pulse rectifier, as described in detail in Section 3.2.1. Regenerative braking absorbing resistors are set in each of the traction substation. Using the third rail power supply mode, the rated voltage is DC 750 V.
The train equivalent mass of Beijing Yizhuang subway line with different load cases is listed in Table 1. In Table 1, AW represents the train passenger capacity. AW0 represents no passengers. AW2 represents rated passenger capacity. AW3 represents overload passenger capacity. M represents motor car, T represents trailer car and Tc represents trailer with a cab. AW3 is the normal operation condition of Beijing Yizhuang subway line. The simulation data are AW3 level. Train and line parameters are listed in Table 2. A single motor rated power is 180 kW. There are four motors.
The Yizhuang subway line has a total of 14 stations. According to the current actual operating schedules, the dwell times of each station are listed in Table 3. The dwell time throughout the day of each train is the same, and the dwell time of the same station of up trains and down trains is the same.
Using the genetic algorithm to encode the 12 dwell times, the upper and lower bounds of the dwell time of each train are bound to the −5–+10 s range of the original stop time. In the simulation, the headway is 5.5 min; the synchronization time of the up train and the down train is 3.5 min; and the train operation data use automatic train operation (ATO) actual operation data. The genetic parameter settings are shown in Table 4. 
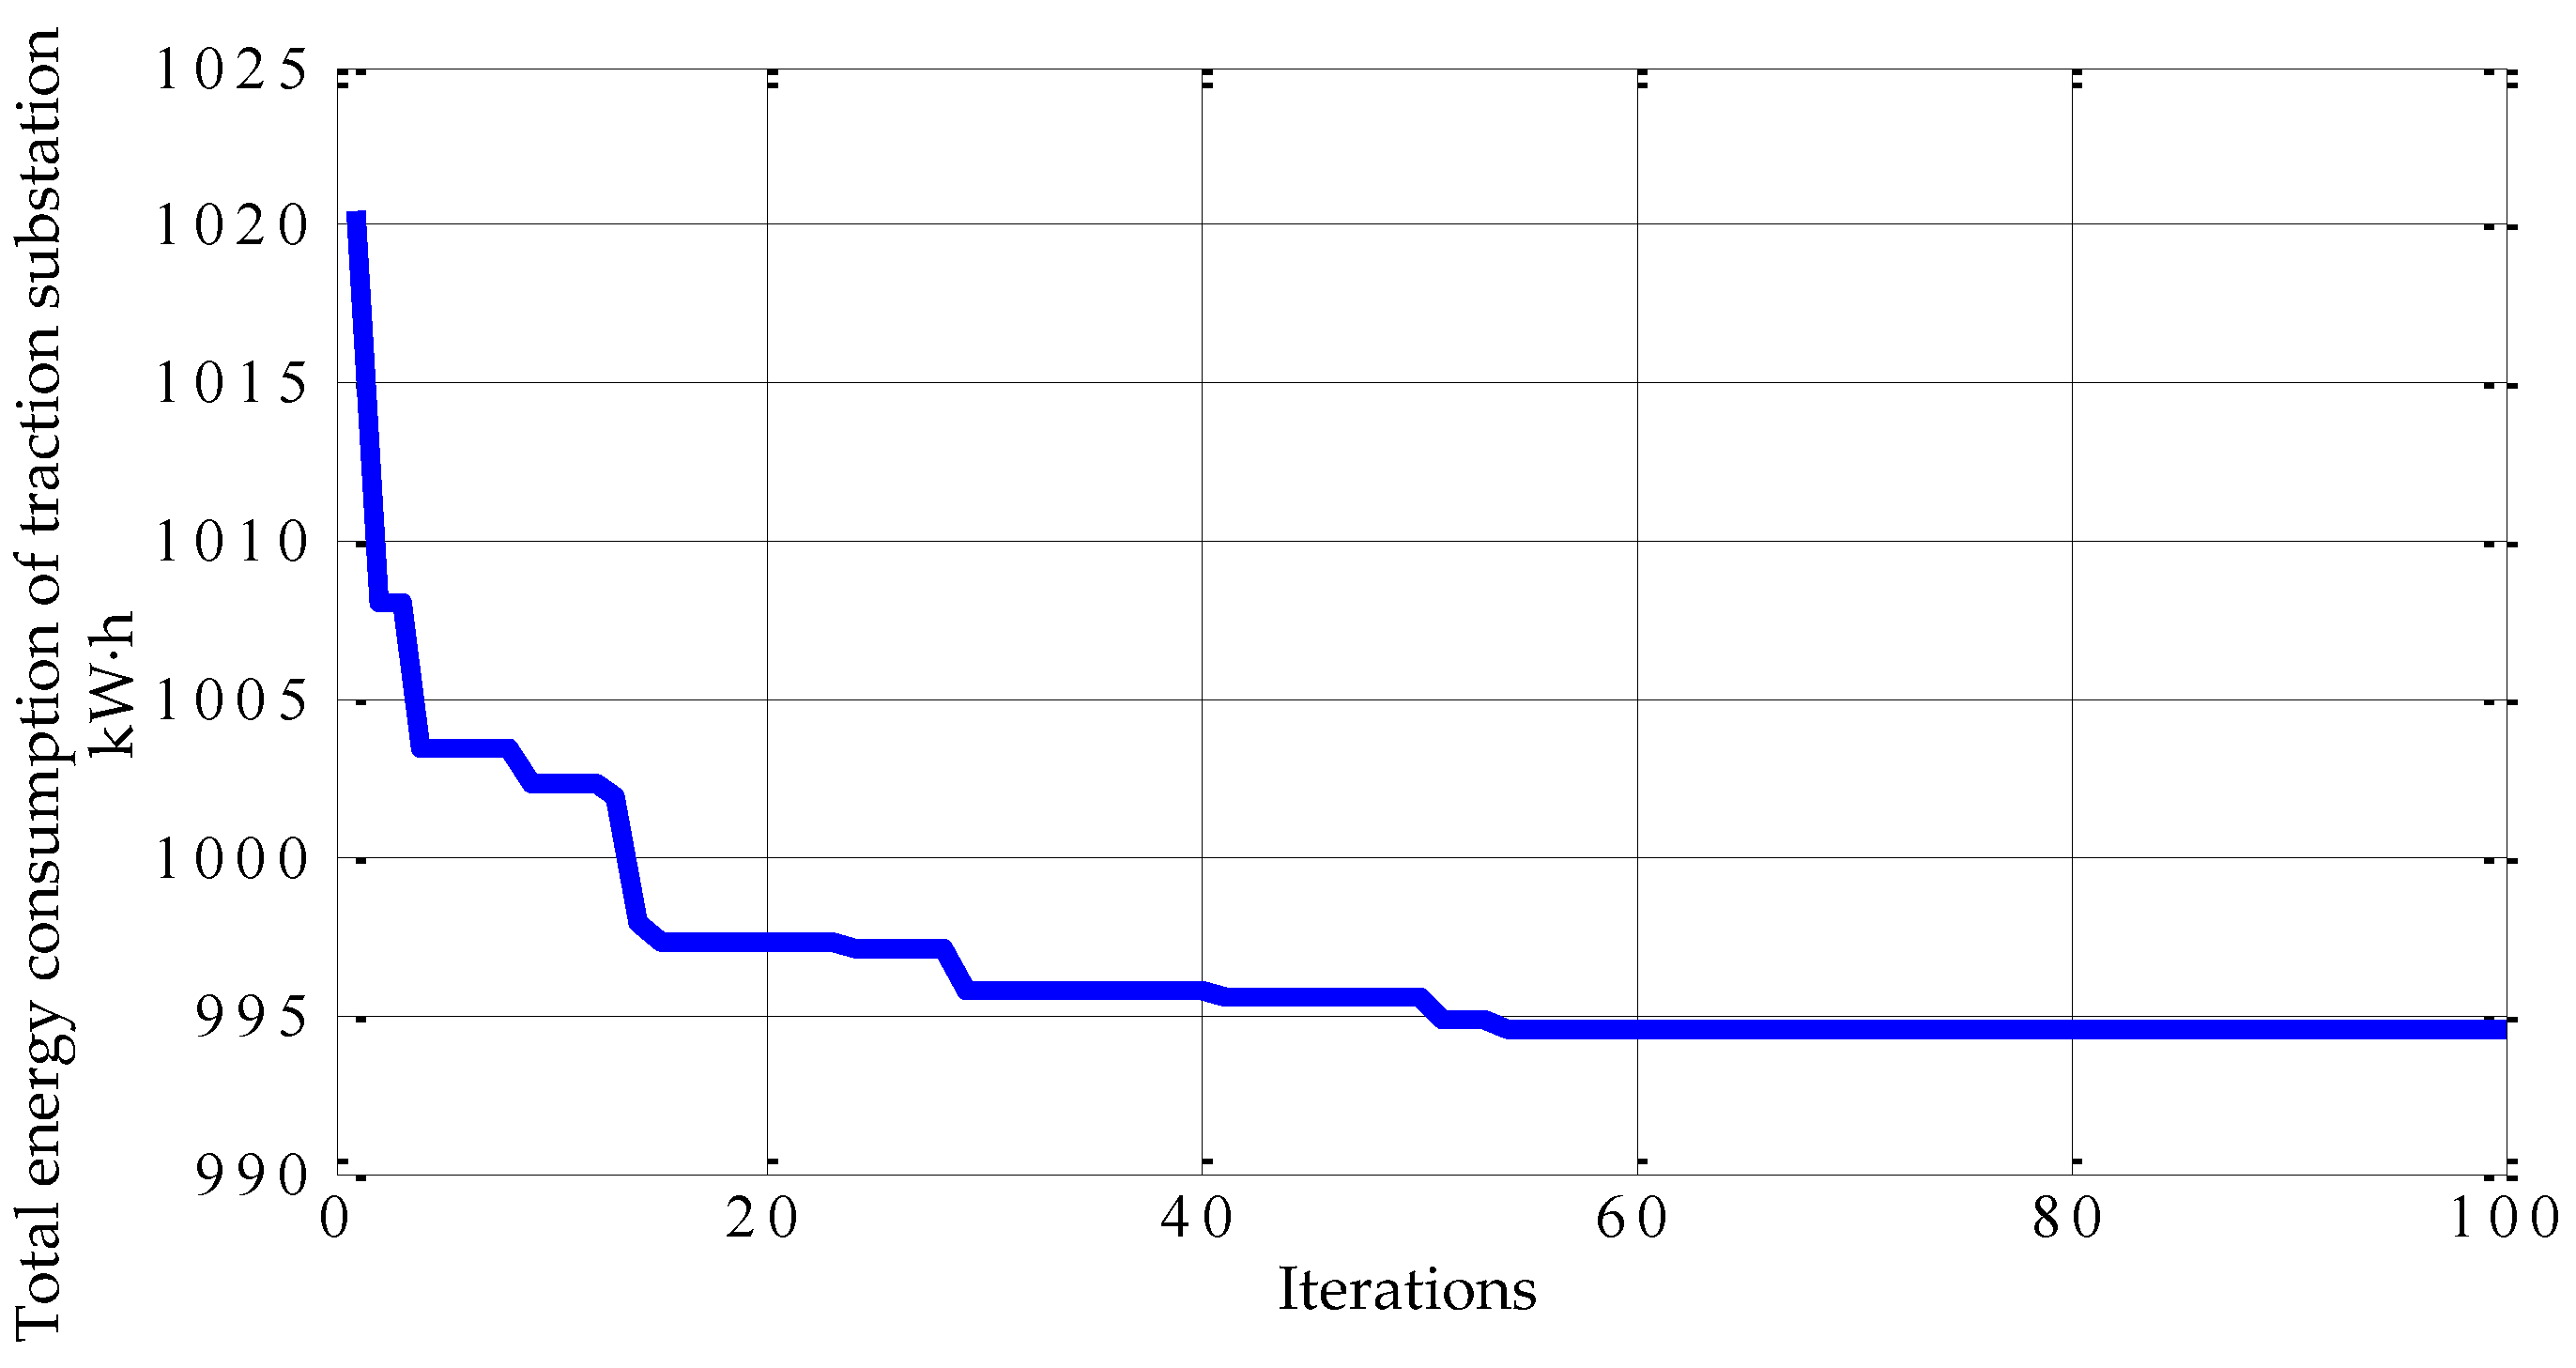
Figure 14 is an evolution of the search for the optimal solution in the algorithm calculation process.
Table 5 shows the constraint conditions of dwell time and the results of the dwell time optimization in the simulation. It can be seen that the dwell time after the optimization is only increased by 29 s, while the whole running time of the Yizhuang Line is about 34 min; thus, the impact on the running time is minimal.
Table 6 shows the energy consumption changes before and after dwell time optimization. It can be seen that the system total energy consumption is decreased from 1084 down to 995 kW·h, a decrease of 8%; meanwhile, the utilization rate of regenerative braking is improved from 71%–79%, for an improvement of 8%. Based on the genetic algorithm, the dwell time optimization effect is significant; the total energy consumption is reduced; and the utilization rate of regenerative braking is improved.
Assuming that the train operation curve is unchanged in simulation, namely the train running time between stations is fixed, only the dwell time is optimized. As for the train, because the operation curve is the same, the train traction energy consumption and regenerative braking energy are the same before and after optimization. The fact that the energy consumption of the train traction and regenerative braking energy before and after optimization have a certain difference, as shown in Table 6, is a result of the simulation results when compared to the multiple trains running results in fixed 15 min; before and after optimization, the dwell time of the train changes; the input power of train operation is different in the same time.
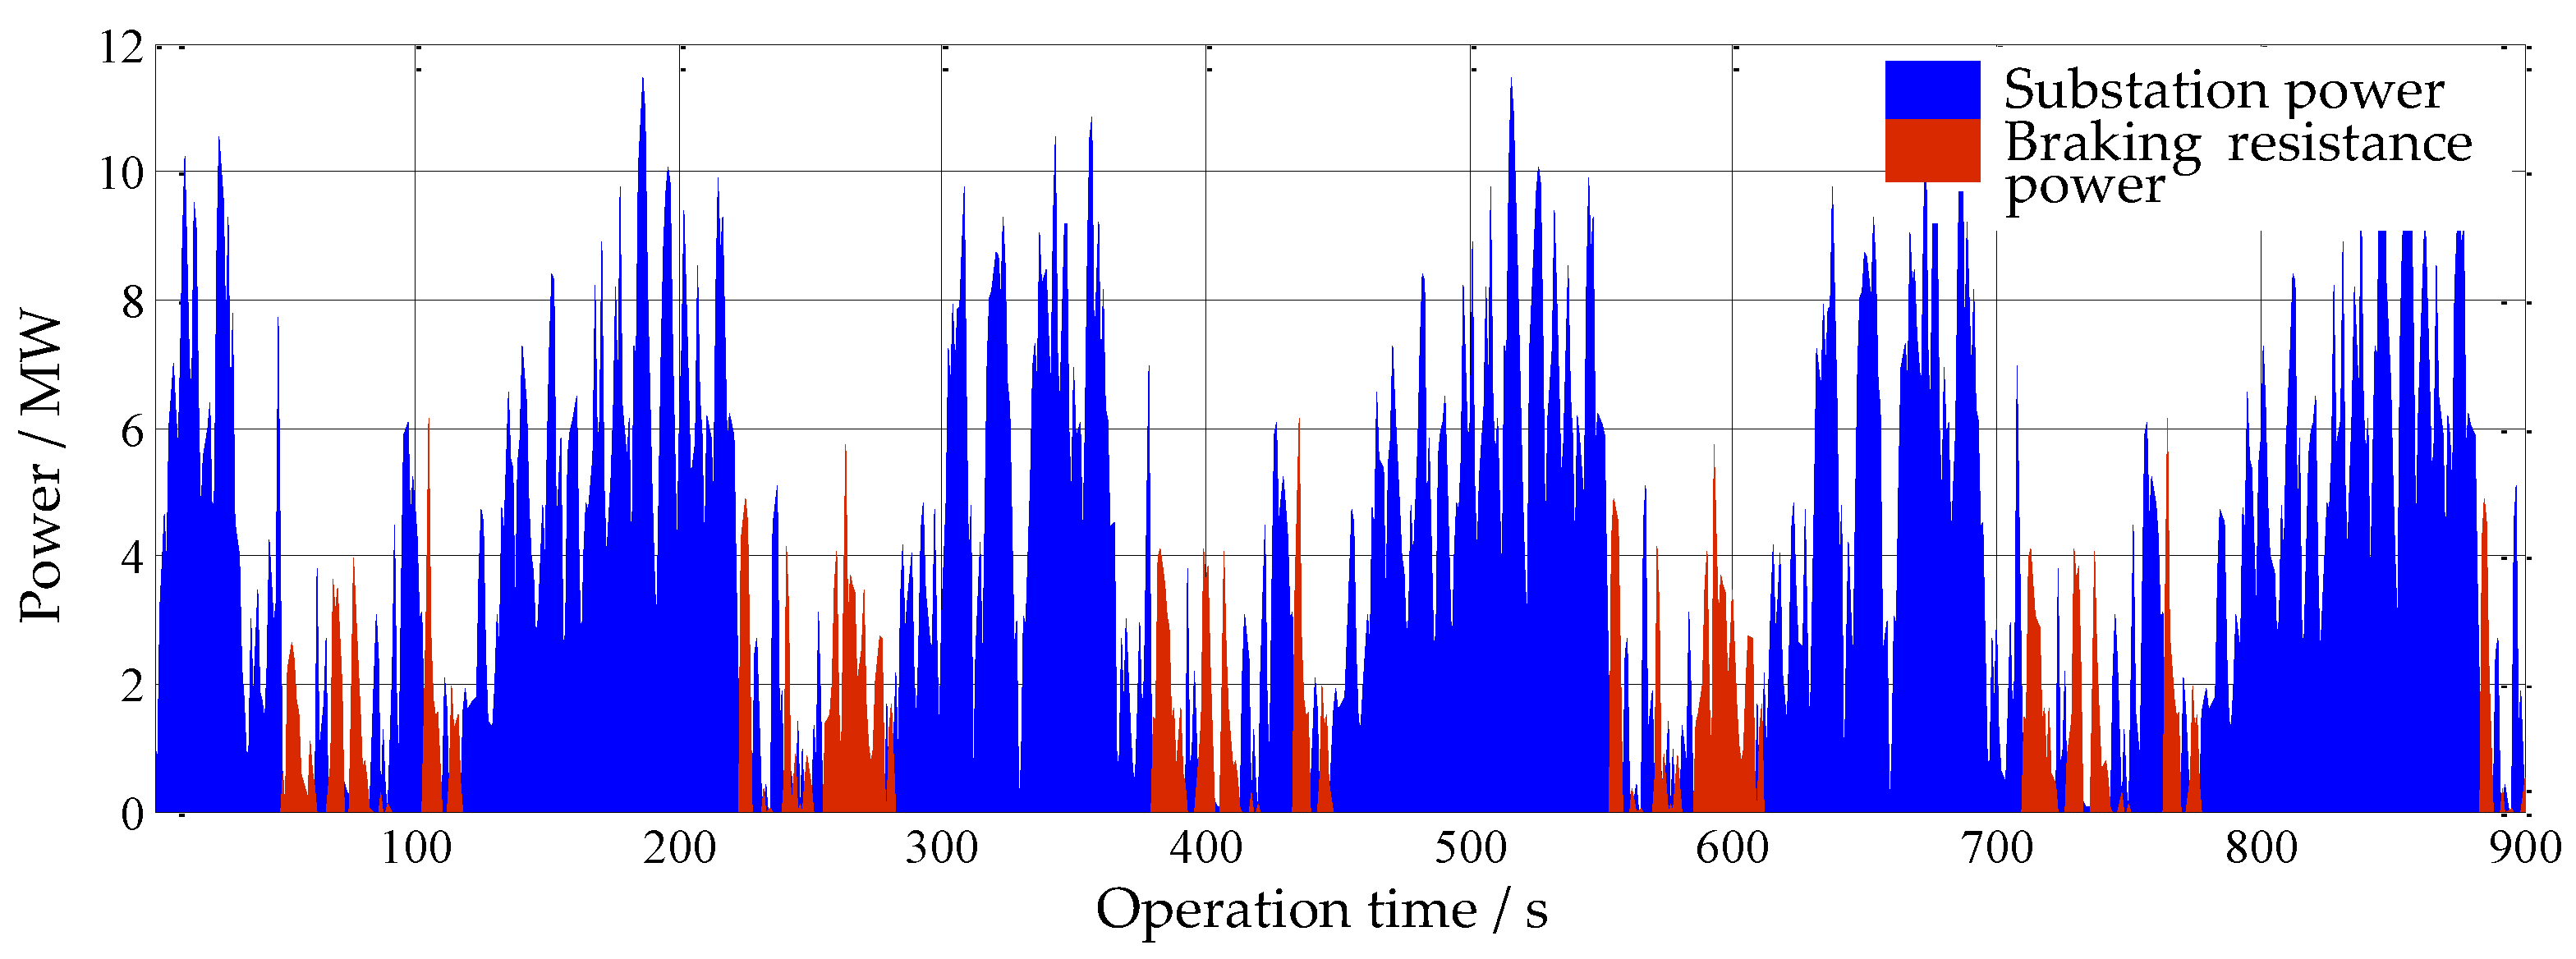
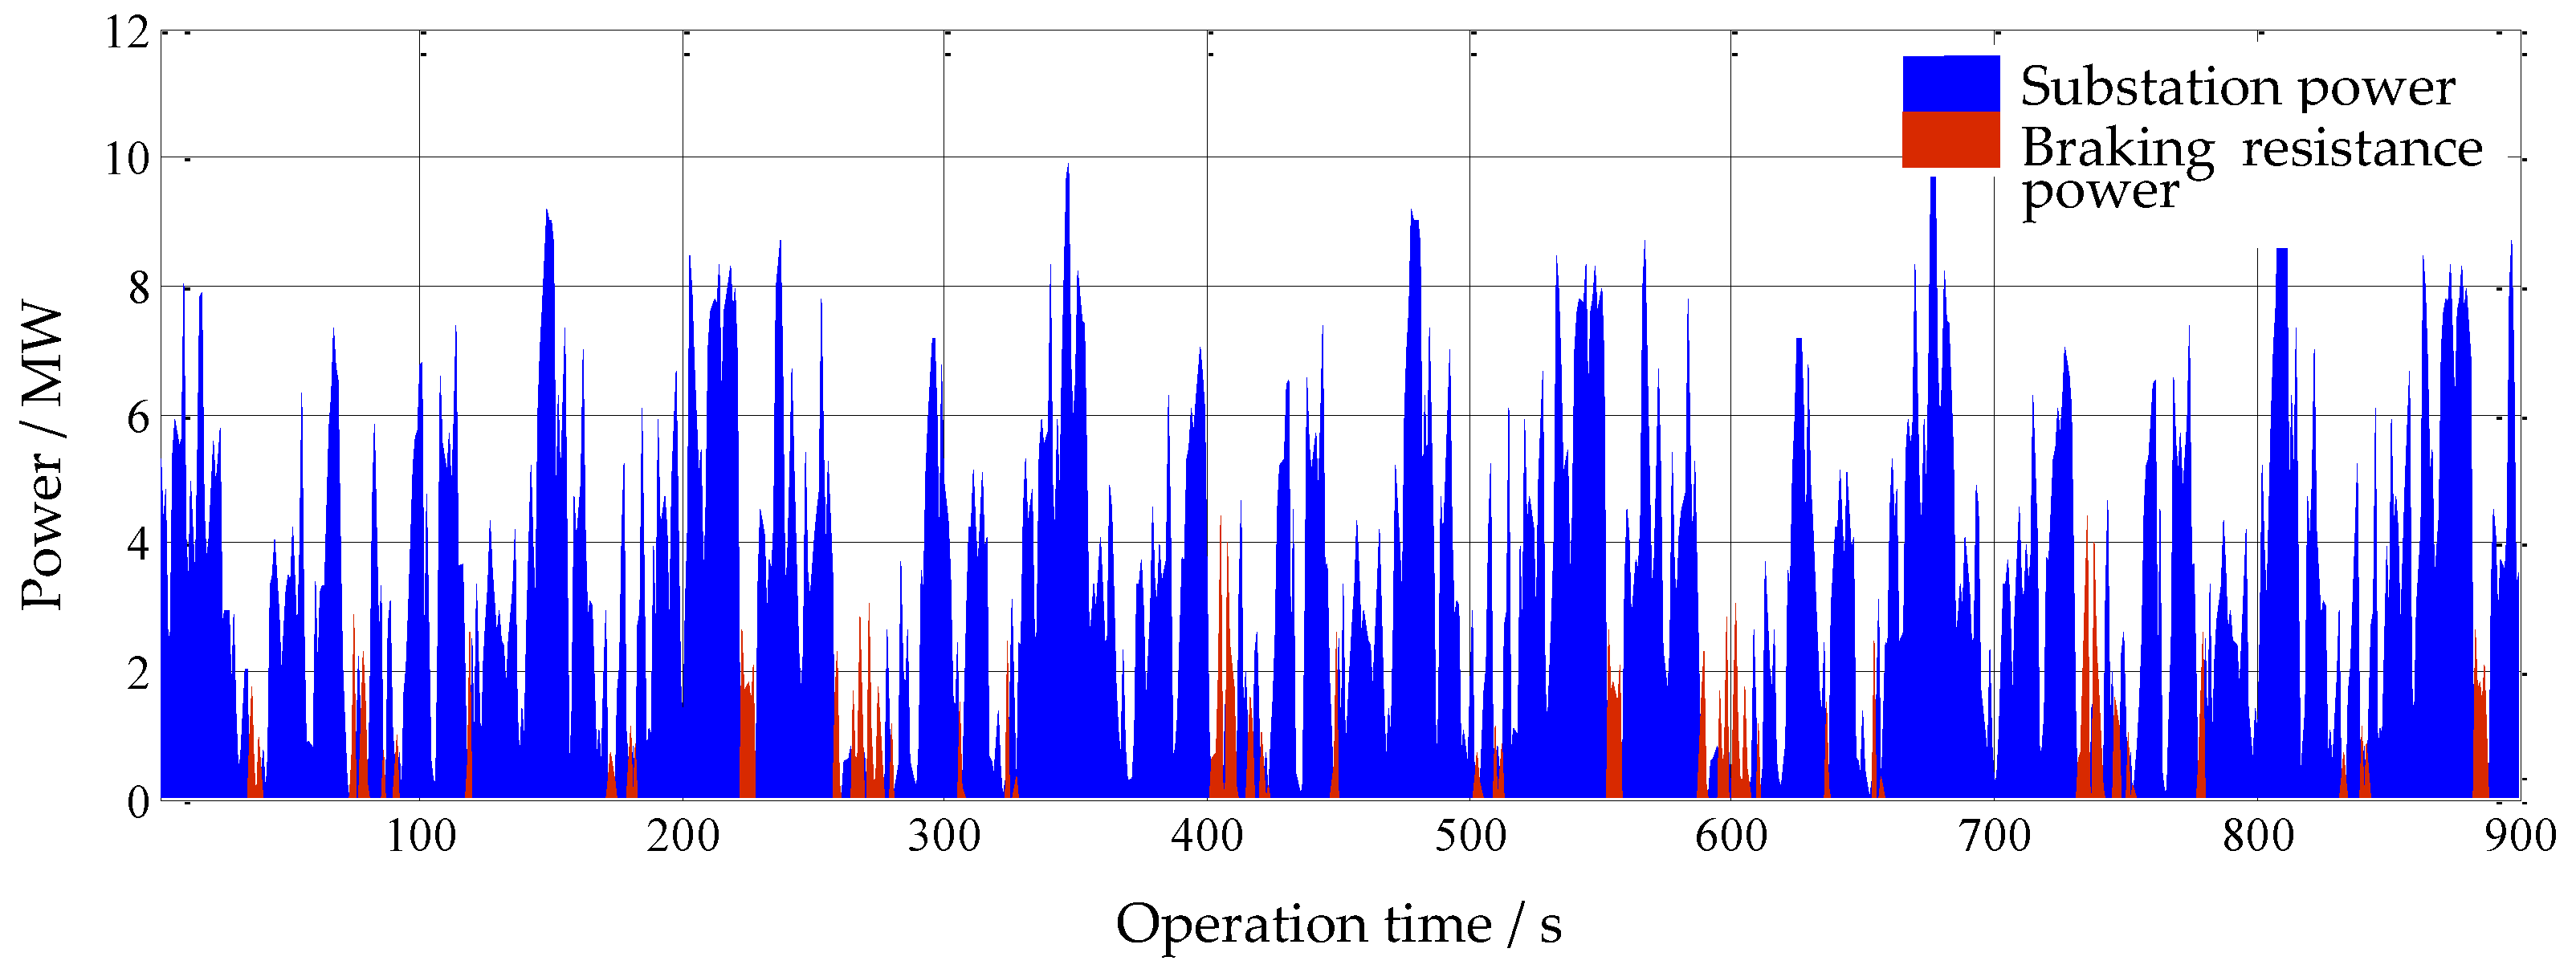
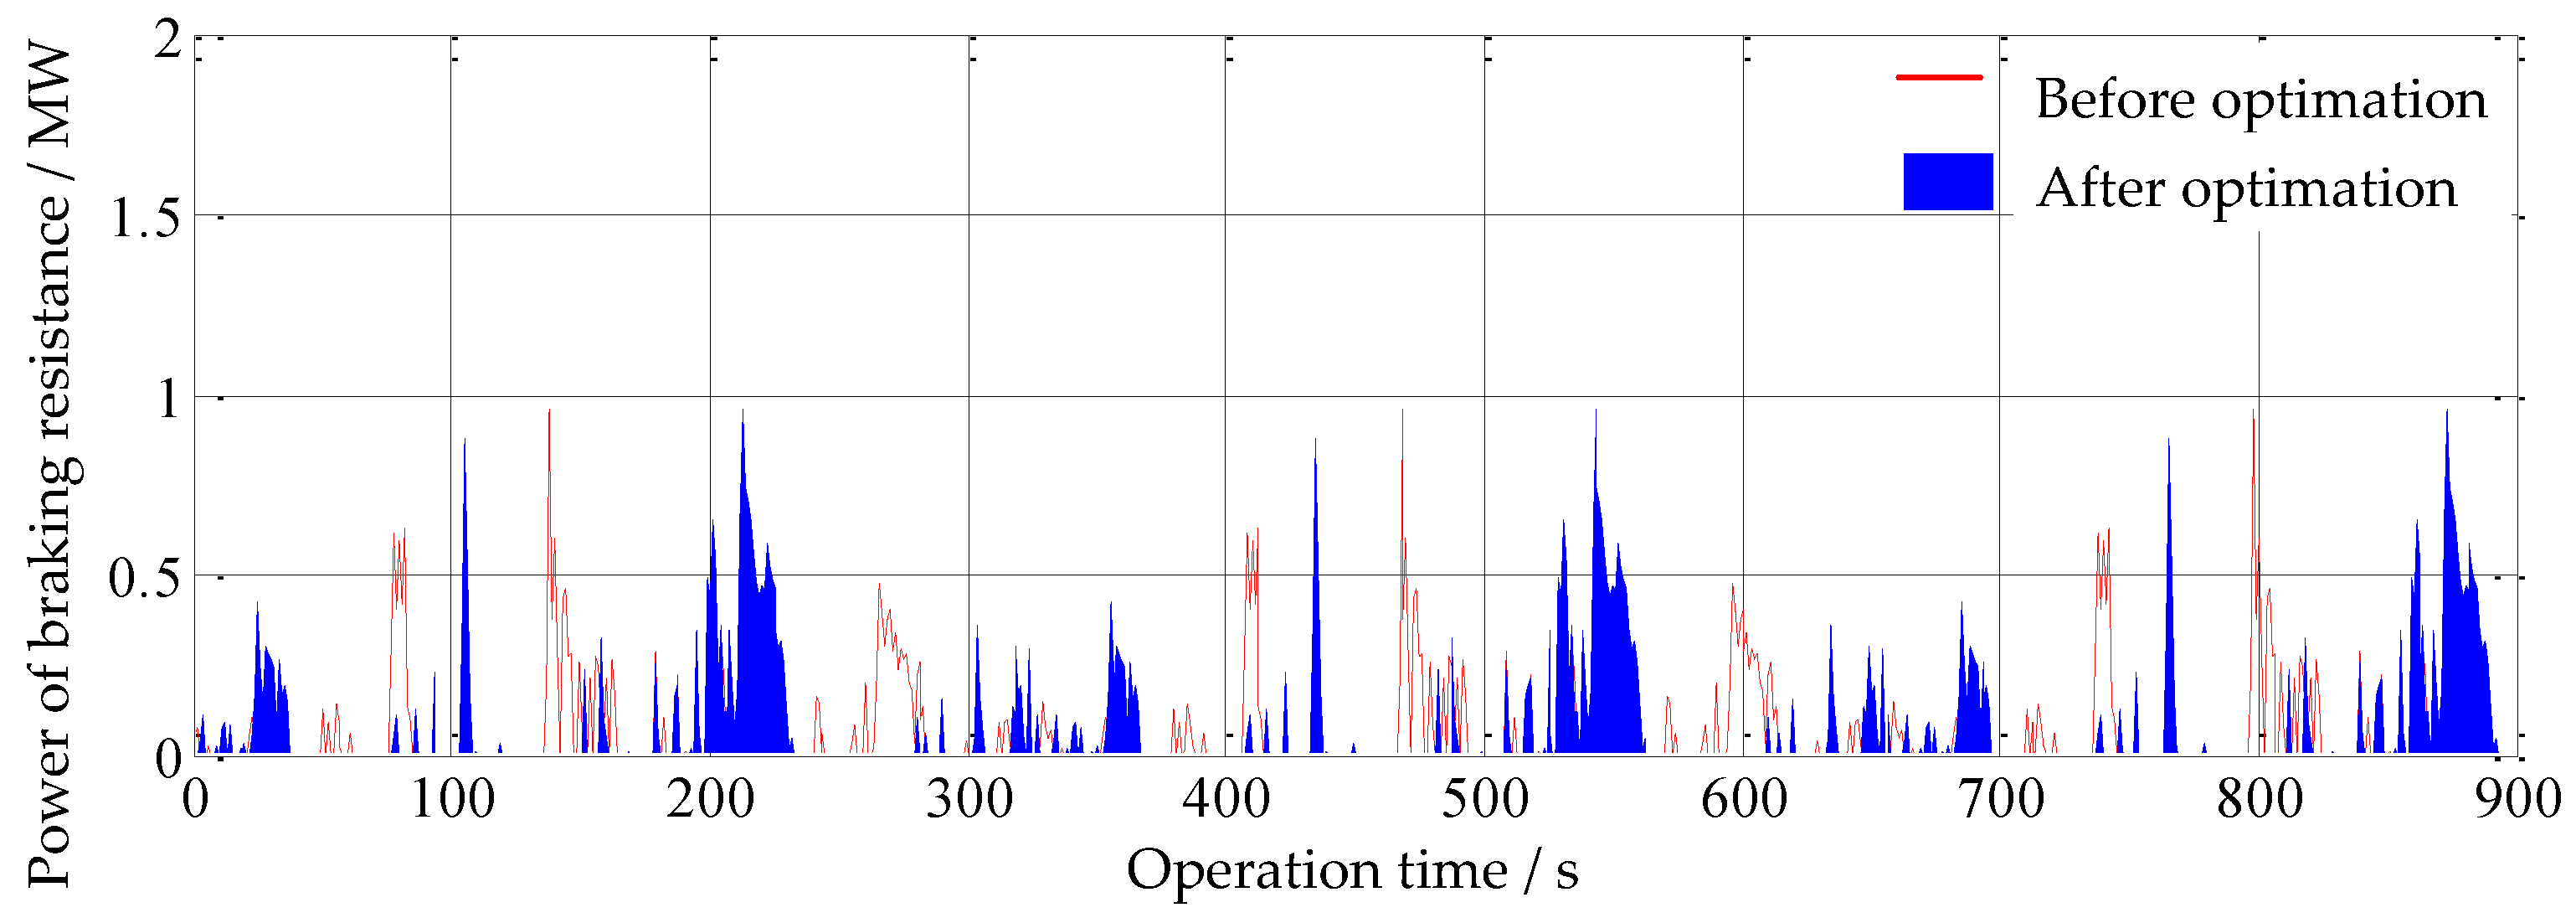
Figure 15 and Figure 16 are the total output power of the traction substation and the absorption power of braking resistance before and after dwell time optimization, respectively. For the convenience of comparison, in the figure, the power curve is filled with color; the envelope curve is the power value; the area surrounded by the envelope is the value of energy consumption. The blue curve is the total power of the substation, and the red curve is the total power absorbed by the braking resistance, i.e., the regenerative braking energy cannot be used. By comparison, it is clear that the optimized substation output energy consumption value is smaller; the energy consumption in the simulation time is quite average; and the energy absorption of the braking resistors decreases significantly.
From the peak value of power, the peak value of the output power of the traction substation and absorption power of braking resistance are both decreased. After optimization, the peak value of the output power of the traction substation decreases from 11.5 down to 9.9 MW, for a decrease of 14%; and the peak value of the absorption power of braking resistance is decreased from 6.2 down to 4.4 MW, for a decrease of 29%.
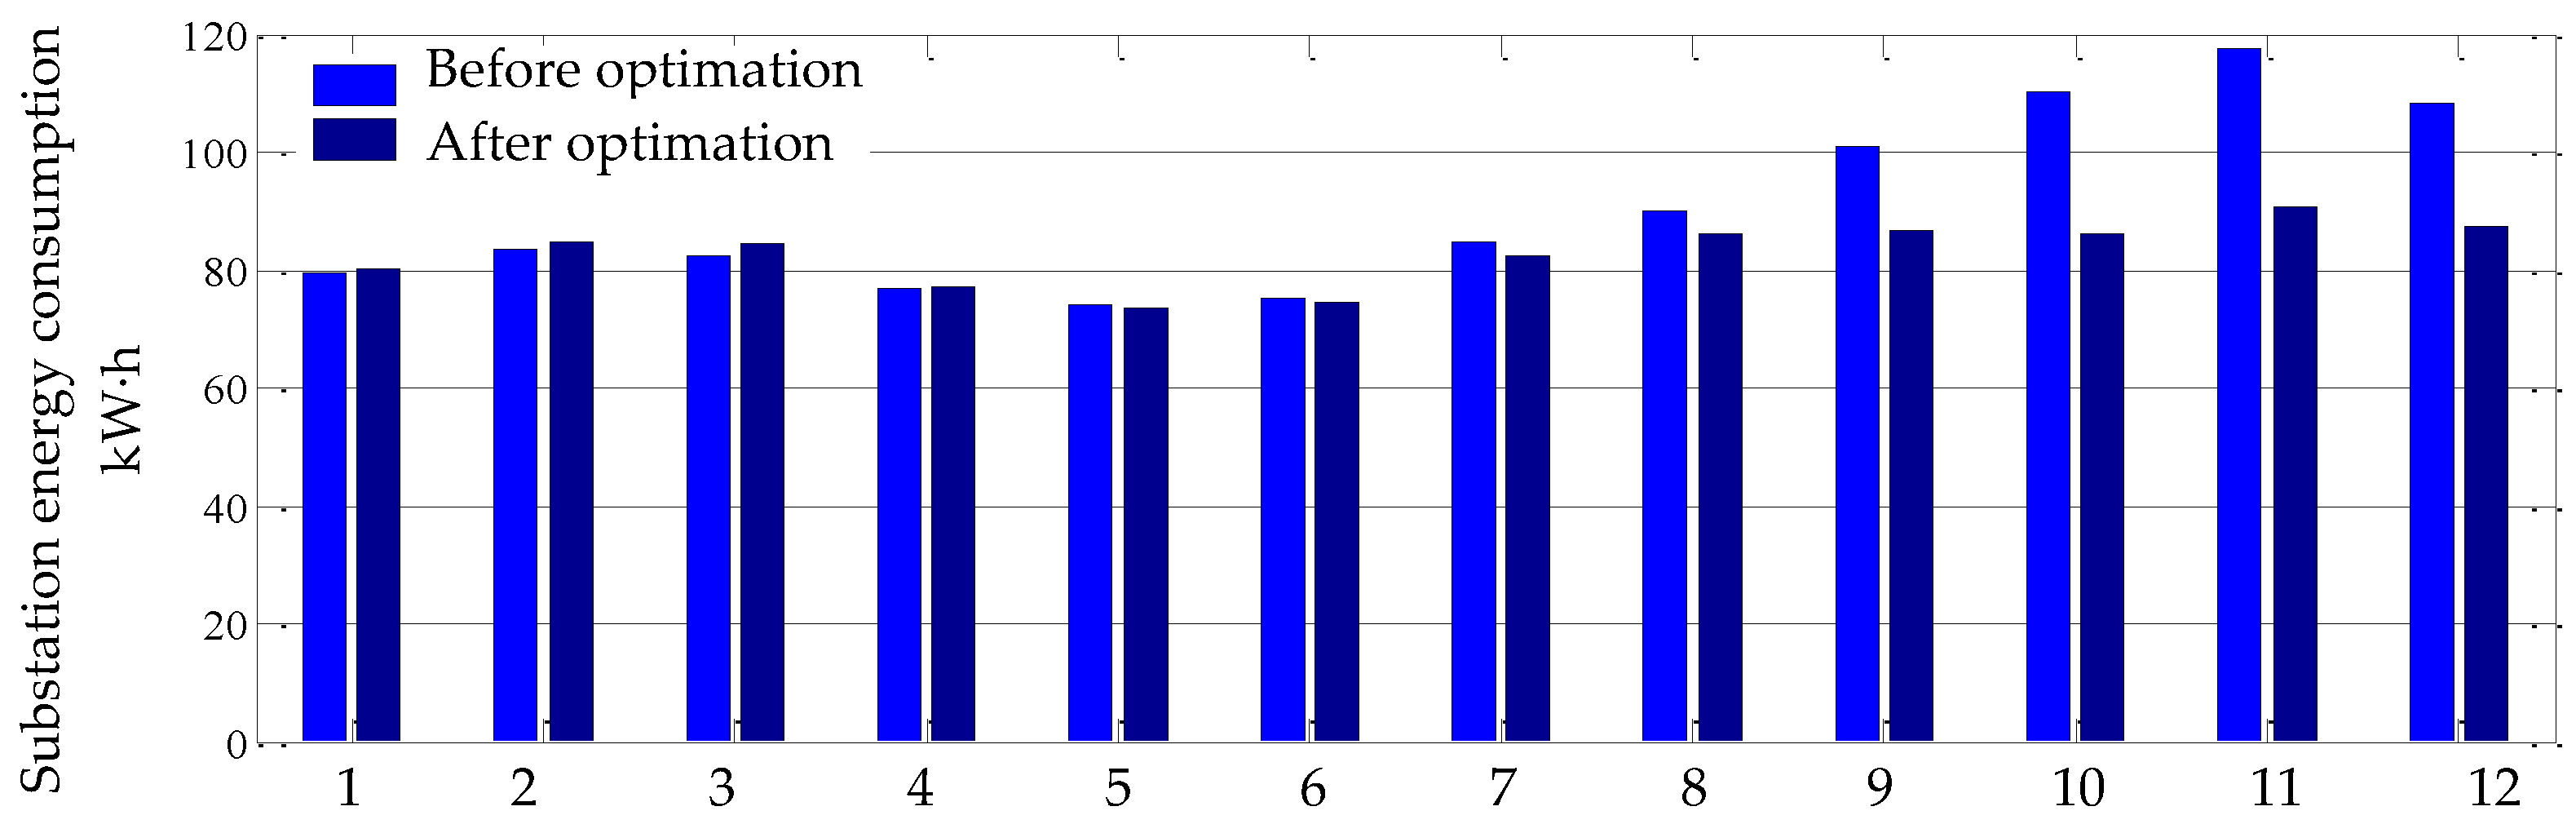
Figure 17 is the energy consumption comparison chart of each substation before and after dwell time optimization. It can be seen that the energy consumptions of the Yizhuang Railway Station, Ciqu South, Jinghailu and Tongjinanlu substations change greatly, while those of Songjiazhuang and other stations do not change significantly or are increased. Taking Yizhuang Railway Station and Songjiazhuang as examples, the substation power and absorption power of braking resistance are analyzed.
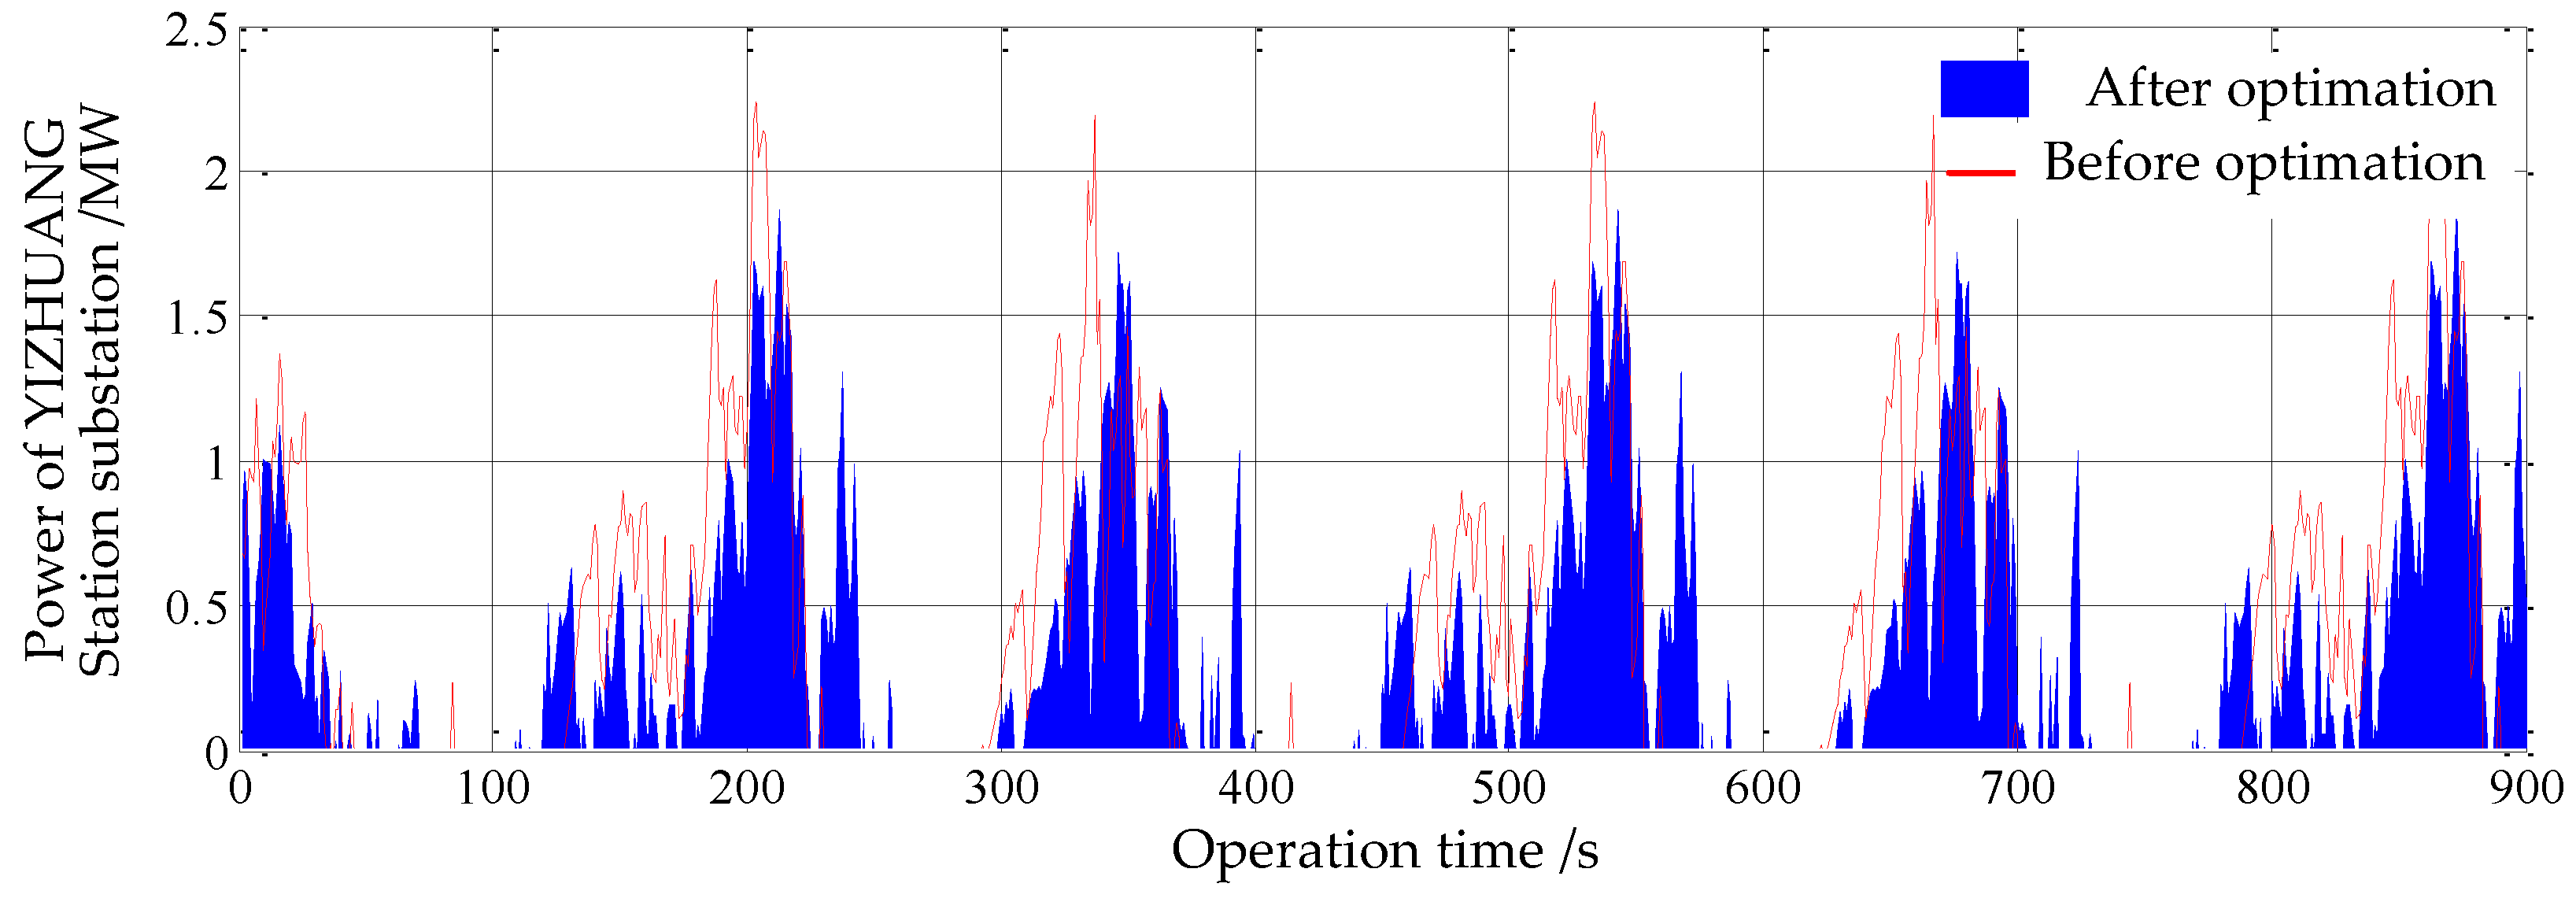
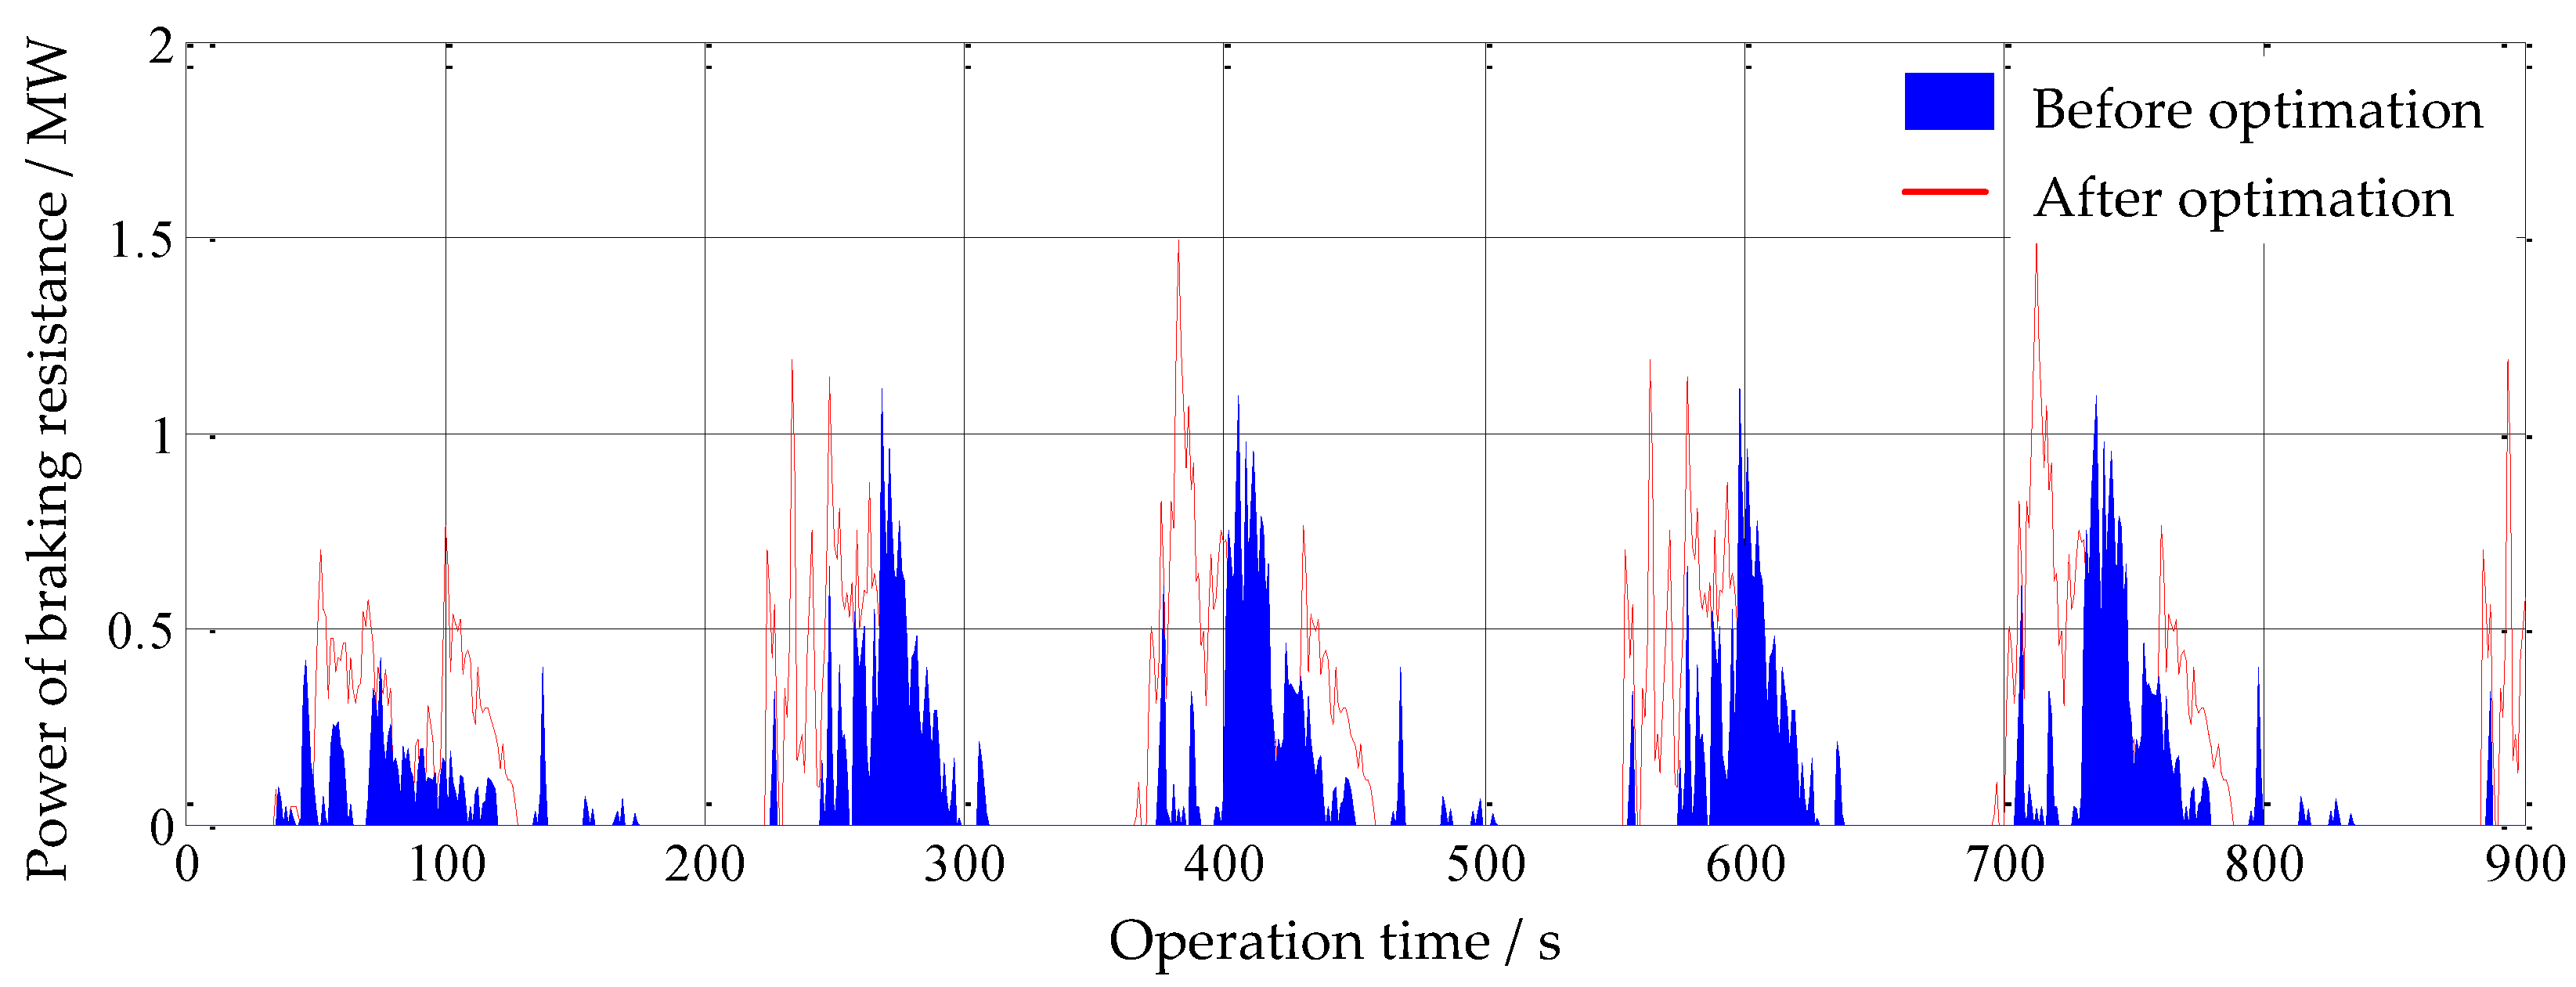
 Figure 18 and Figure 19 show the substation output power curve and braking resistance absorption power curve of Yizhuang Railway Station before and after dwell time optimization, respectively. For the convenience of comparison, the power curve before optimization is red, and that after optimization is blue. After the dwell time optimization, the substation traction power decreases obviously, and the absorption power of braking resistance also decreases; thus, the traction energy consumption values of the Yizhuang Railway Station substation decreased significantly.
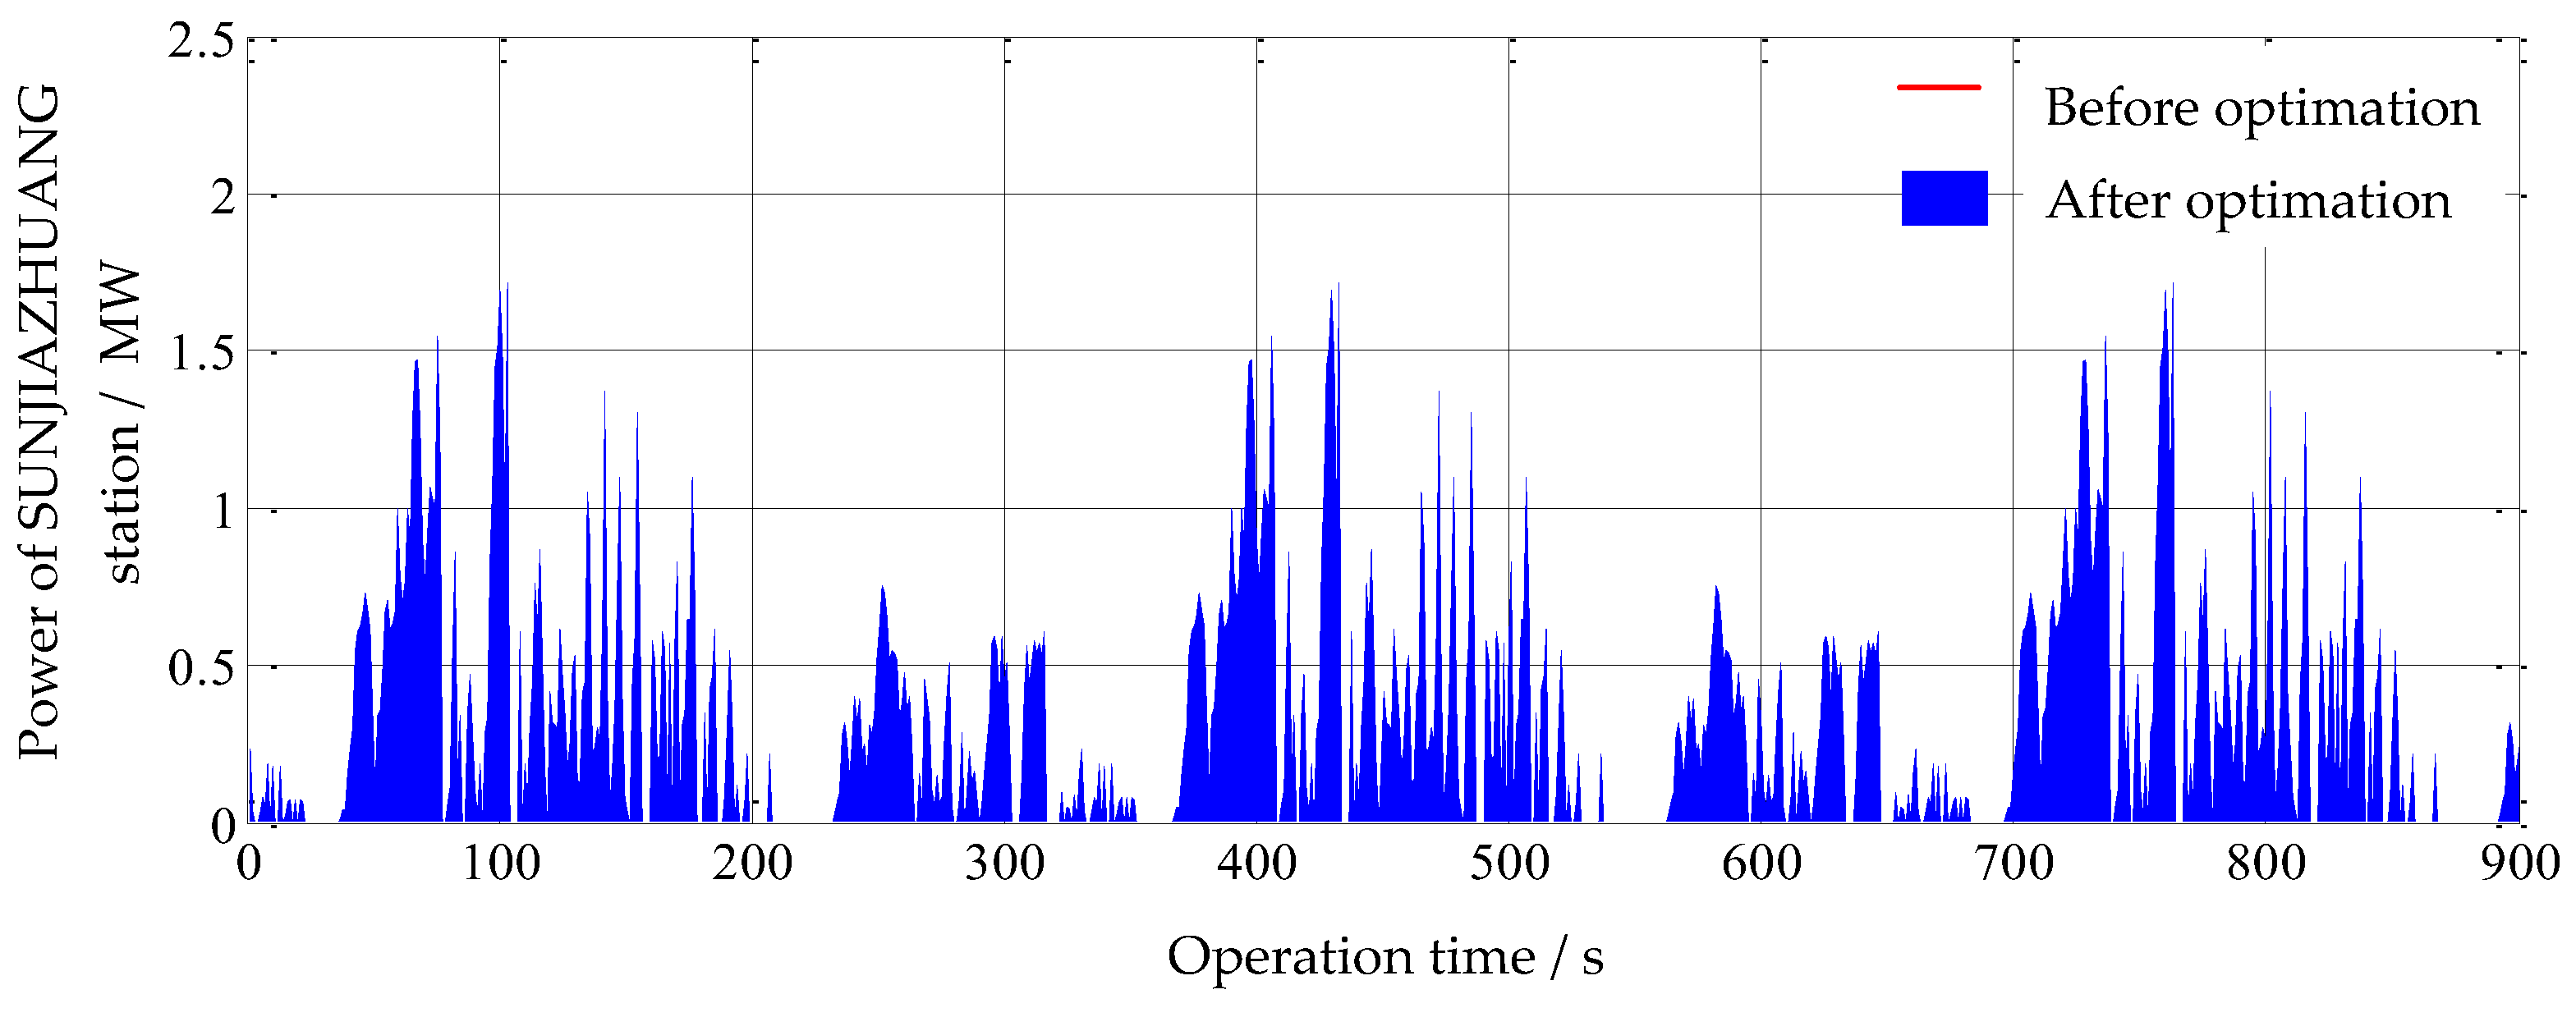
Figure 20 and Figure 21 respectively show the substation output power curve and braking resistance absorption power curve of Songjiazhuang before and after dwell time optimization. It can be seen that the substation power and absorption power of the braking resistance are not significantly reduced nor increased at Songjiazhuang before and after the optimization; thus, the change of the power consumption of the substation at Songjiazhuang is minimal.

6. Conclusions

In this paper, the basic principles of train energy saving optimization based on dwell time are introduced, and the optimization model based on dwell time is established. With the system total energy consumption minimum as the objective function and based on the multi-train operation model and power system simulation model, while using a genetic algorithm, the optimization model of the dwell time is solved. In addition, taking the Yizhuang Line as an example, based on the Yizhuang Line current dwell time and under the condition of the train running time increasing by 29 s, the regenerative braking rate of the system is increased by 8%, and the total traction energy consumption is reduced by 8%; thus, the total traction energy consumption is reduced by 8%. The results show that using this method is practical and effective.

Acknowledgments

This research is supported by the National Natural Science Foundation of China under Grant 5157701.

Author Contributions

Fei Lin contributed to the conception of the study and the algorithm. Shihui Liu, Zhihong Yang and Yingying Zhao contributed significantly to the analysis and manuscript preparation. Zhongping Yang helped to perform the analysis with constructive discussions. Hu Sun provided the line and vehicle data.

Conflicts of Interest

The authors declare no conflict of interest.

References

  1. Barrero, R.; Van Mierlo, J.; Tackoen, X. Energy savings in public transport. IEEE Veh. Technol. Mag. 2008, 3, 26–36. [Google Scholar] [CrossRef]
  2. Beijing Subway. Available online: http://www.bjsubway.com/news/qyxw/yyzd/2016-01-04/42043.html (accessed on 25 June 2016).
  3. González-Gil, A.; Palacin, R.; Batty, P.; Powell, J. A systems approach to reduce urban rail energy consumption. Energy Convers. Manag. 2014, 80, 509–524. [Google Scholar] [CrossRef]
  4. Chevrier, R. An evolutionary multi-objective approach for speed tuning optimization with energy saving in railway management. In Proceedings of the 13th IEEE International Conference on Intelligent Transportation Systems, Funchal, Portugal, 19–22 September 2010; pp. 279–284.
  5. Chevrier, R.; Pellegrini, P.; Rodriguez, J. Energy saving in railway timetabling: A bi-objective evolutionary approach for computing alternative running times. Transp. Res. C Emerg. Technol. 2013, 37, 20–41. [Google Scholar] [CrossRef]
  6. Bocharnikov, Y.; Tobias, A.; Roberts, C.; Hillmansen, S.; Goodman, C. Optimal driving strategy for traction energy saving on DC suburban railways. IET Electr. Power Appl. 2007, 1, 675–682. [Google Scholar] [CrossRef]
  7. Domínguez, M.; Fernández-Cardador, A.; Cucala, A.P.; Gonsalves, T.; Fernández, A. Multi objective particle swarm optimization algorithm for the design of efficient ATO speed profiles in metro lines. Eng. Appl. Artif. Intell. 2014, 29, 43–53. [Google Scholar] [CrossRef]
  8. Domínguez, M.; Fernández-Cardador, A.; Cucala, A.P.; Pecharromán, R.R. Energy savings in metropolitan railway substations through regenerative energy recovery and optimal design of ato speed profiles. IEEE Trans. Autom. Sci. Eng. 2012, 9, 496–504. [Google Scholar] [CrossRef]
  9. Domínguez, M.; Fernández, A.; Cucala, A.; Lukaszewicz, P. Optimal design of metro automatic train operation speed profiles for reducing energy consumption. Proc. Inst. Mech. Eng. F J. Rail Rapid Transit 2011, 225, 463–474. [Google Scholar] [CrossRef]
  10. Adinolfi, A.; Lamedica, R.; Modesto, C.; Prudenzi, A.; Vimercati, S. Experimental assessment of energy saving due to trains regenerative braking in an electrified subway line. IEEE Trans. Power Deliv. 1998, 13, 1536–1542. [Google Scholar] [CrossRef]
  11. Liu, H.; Jiang, J. Flywheel energy storage—An upswing technology for energy sustainability. Energy Build. 2007, 39, 599–604. [Google Scholar] [CrossRef]
  12. Suzuki, Y.; Koyanagi, A.; Kobayashi, M.; Shimada, R. Novel applications of the flywheel energy storage system. Energy 2005, 30, 2128–2143. [Google Scholar] [CrossRef]
  13. Tzeng, J.; Emerson, R.; Moy, P. Composite flywheels for energy storage. Compos. Sci. Technol. 2006, 66, 2520–2527. [Google Scholar] [CrossRef]
  14. Bolund, B.; Bernhoff, H.; Leijon, M. Flywheel energy and power storage systems. Renew. Sustain. Energy Rev. 2007, 11, 235–258. [Google Scholar] [CrossRef]
  15. Wang, G.; Zhang, L.; Zhang, J. A review of electrode materials for electrochemical supercapacitors. Chem. Soc. Rev. 2012, 41, 797–828. [Google Scholar] [CrossRef] [PubMed]
  16. Burke, A.; Miller, M. The power capability of ultracapacitors and lithium batteries for electric and hybrid vehicle applications. J. Power Sources 2011, 196, 514–522. [Google Scholar] [CrossRef]
  17. Hammar, A.; Venet, P.; Lallemand, R.; Coquery, G.; Rojat, G. Study of accelerated aging of supercapacitors for transport applications. IEEE Trans. Ind. Electron. 2010, 57, 3972–3979. [Google Scholar] [CrossRef]
  18. Sharma, P.; Bhatti, T.S. A review on electrochemical double-layer capacitors. Energy Convers. Manag. 2010, 51, 2901–2912. [Google Scholar] [CrossRef]
  19. Iannuzzi, D.; Tricoli, P. Metro trains equipped onboard with supercapacitors: A control technique for energy saving. In Proceedings of the IEEE International Symposium on Power Electronics Electrical Drives Automation and Motion (SPEEDAM), Pisa, Italy, 14–16 June 2010; pp. 750–756.
  20. Wang, B.; Yang, Z.; Lin, F.; Zhao, W. An Improved Genetic Algorithm for Optimal Stationary Energy Storage System Locating and Sizing. Energies 2014, 7, 6434–6458. [Google Scholar] [CrossRef]
  21. Xia, H.; Chen, H.; Yang, Z.; Lin, F.; Wang, B. Optimal Energy Management, Location and Size for Stationary Energy Storage System in a Metro Line Based on Genetic Algorithm. Energies 2015, 8, 11618–11640. [Google Scholar] [CrossRef]
  22. Kraytsberg, A.; Ein-Eli, Y. Review on Li-air batteries—Opportunities, limitations and perspective. J. Power Sources 2011, 196, 886–893. [Google Scholar] [CrossRef]
  23. Ellis, B.L.; Nazar, L.F. Sodium and sodium-ion energy storage batteries. Curr. Opin. Solid State Mater. Sci. 2012, 16, 168–177. [Google Scholar] [CrossRef]
  24. Mukherjee, R.; Krishnan, R.; Lu, T.M.; Koratkar, N. Nanostructured electrodes for high-power lithium ion batteries. Nano Energy 2012, 1, 518–533. [Google Scholar] [CrossRef]
  25. Czerwiński, A.; Obrębowski, S.; Rogulski, Z. New high-energy lead-acid battery with reticulated vitreous carbon as a carrier and current collector. J. Power Sources 2012, 198, 378–382. [Google Scholar] [CrossRef]
  26. Chen, J.F.; Lin, R.L.; Liu, Y.C. Optimization of an mrt train schedule: Reducing maximum traction power by using genetic algorithms. IEEE Trans. Power Syst. 2005, 20, 1366–1372. [Google Scholar] [CrossRef]
  27. Kim, K.M.; Oh, S.M. A model and approaches for smoothing peaks of traction energy in timetabling. J. Korean Soc. Railw. 2009, 12, 1018–1023. [Google Scholar]
  28. Kim, K.M.; Oh, S.M.; Han, M. A mathematical approach for reducing the maximum traction energy: The case of Korean MRT trains. In Proceedings of the International MultiConference of Engineers and Computer Scientists, Hong Kong, China, 17–19 March 2010; pp. 2169–2173.
  29. Gordon, S.P.; Lehrer, D.G. Coordinated train control and energy management control strategies. In Proceedings of the 1998 ASME/IEEE Joint Railroad Conference, Philadelphia, PA, USA, 15–16 April 1998; pp. 165–176.
  30. Galán, A.R.; Alcaraz, M.T.P.; Morales, A.F.; Cucala, P. Mathematical Programming Approach to Underground Timetabling Problem for Maximizing Time Synchronization; XI Congreso de Ingeniería de Organización: Madrid, Italy, 5–7 September 2007; pp. 1395–1405. [Google Scholar]
  31. Yang, X.; Ning, B.; Li, X.; Tang, T. A two-objective timetable optimization model in subway systems. IEEE Trans. Intel-Light Transp. Syst. 2014, 15, 1–9. [Google Scholar] [CrossRef]
  32. Zhao, L.; Li, K.; Su, S. A Multi-objective Timetable Optimization Model for Subway Systems. EITRT2013 2014, 1, 557–565. [Google Scholar]
  33. Nasri, A.; Moghadam, M.F.; Mokhtari, H. Timetable optimization for maximum usage of regenerative energy of braking in electrical railway systems. In Proceedings of IEEE International Symposium on Power Electronics Electrical Drives Automation and Motion (SPEEDAM), Pisa, Italy, 14–16 June 2010; pp. 1218–1221.
  34. Albrecht, T.; Oettich, S. A new integrated approach to dynamic schedule synchronization and energy-saving train control. In Computers in Railways VIII; WIT Press: Southampton, UK, 2002; pp. 847–856. [Google Scholar]
  35. Albrecht, T. Reducing power peaks and energy consumption in rail transit systems by simultaneous train running time control. In Computers in Railways IX; WIT Press: Southampton, UK, 2004; pp. 885–894. [Google Scholar]
  36. Gong, C.; Zhang, S.; Zhang, F.; Jiang, J.; Wang, X. An integrated energy-efficient operation methodology for metro systems based on a real case of Shanghai metro line one. Energies 2014, 7, 7305–7329. [Google Scholar] [CrossRef]
  37. Su, S.; Li, X.; Tang, T. A subway train timetable optimization approach based on energy-efficient operation strategy. IEEE Trans. Intel-Light Transp. Syst. 2013, 14, 883–893. [Google Scholar] [CrossRef]
  38. Su, S.; Tang, T.; Li, X.; Gao, Z. Optimization of multi-train operations in a subway system. IEEE Trans. Intell. Transp. Syst. 2014, 15, 673–684. [Google Scholar]
  39. Miyatake, M.; Matsuda, K. Energy Saving Speed and Charge/Discharge Control of a Railway Vehicle with On-board Energy Storage by Means of an Optimization Model. IEEJ Trans. Electr. Electron. Eng. 2009, 4, 771–778. [Google Scholar] [CrossRef]
  40. Guo, D. Research on the Solution of Simulation for Urban Traction Power Including Regenerative Braking. Master’s Thesis, Southwest Jiaotong University, Chengdu, China, 2005. [Google Scholar]
  41. Liu, W.; Li, Q.; Li, L. Steady-state short-circuit salculation of DC traction supply system based on polygonal external characteristic. Electr. Drive Locomot. 2008, 1, 61–64. [Google Scholar]
  42. Shen, N. Model of Inverter for Regenarative Energy Feedback and Process Simulation in DC Traction Power Supply System. Master’s Thesis, Southwest Jiaotong University, Chengdu, China, 2009. [Google Scholar]
  43. Liu, X.; Yu, S.; Liu, X. Model and algorithm for traction power system simulation of urban rail-line. Comput. Simul. 2004, 12, 213–218. [Google Scholar]
  44. Liu, W.; Li, Q.; Chen, M. Study of unified AC/DC power flow in DC traction power supply system. Power Syst. Prot. Control 2010, 38, 128–133. [Google Scholar]
  45. Zheng, L.; Song, R.; Wei, H.S.; Dong, L.H. Optimization Model and Algorithm of Skip-stop Strategy for Urban Rail Transit. J. China Railw. Soc. 2009, 31, 1–8. [Google Scholar]
Figure 1. Schematic diagram of the urban rail transit power supply system. TSS, traction substation.
Energies 09 00208 g001
Figure 2. Tractive and regenerative braking curve under different net voltages.
Energies 09 00208 g002
Figure 3. Squeezing curve of regenerative braking.
Energies 09 00208 g003
Figure 4. Train power curves before dwell time modification.
Energies 09 00208 g004
Figure 5. Train power curves after dwell time modification.
Energies 09 00208 g005
Figure 6. Definition of control parameter u.
Energies 09 00208 g006
Figure 7. Schematic diagram of rectifier units.
Energies 09 00208 g007
Figure 8. Equivalent circuit of the DC power supply system.
Energies 09 00208 g008
Figure 9. Flowchart of multiple train operation calculation.
Energies 09 00208 g009
Figure 10. Schematic diagram of dwell time modification.
Energies 09 00208 g010
Figure 11. Schematic diagram of dwell time encoding.
Energies 09 00208 g011
Figure 12. Initial population of dwell time.
Energies 09 00208 g012
Figure 13. Flowchart of the dwell time optimization algorithm.
Energies 09 00208 g013
Figure 14. Evolution of searching for the optimal solution.
Energies 09 00208 g014
Figure 15. Total output power of traction substation and absorption power of braking resistance before dwell time optimization.
Energies 09 00208 g015
Figure 16. Total output power of traction substation and absorption power of braking resistance after dwell time optimization.
Energies 09 00208 g016
Figure 17. Energy consumption of each substation before and after dwell time optimization.
Energies 09 00208 g017
Figure 18. Power of Yizhuang Railway Station’s substation before and after dwell time optimization.
Energies 09 00208 g018
Figure 19. Power of Yizhuang Railway Station’s braking resistance before and after dwell time optimization.
Energies 09 00208 g019
Figure 20. Power of Songjiazhuang’s substation before and after dwell time optimization.
Energies 09 00208 g020
Figure 21. Power of Songjiazhuang’s braking resistance before and after dwell time optimization.
Energies 09 00208 g021
Table 1. Train equivalent mass of Beijing Yizhuang subway line with different load cases.
Train Equivalent Mass (t)Tc1M1TM3M2Tc2
AW0333528353533
AW246.5650.2443.2450.2450.2446.56
AW350.454.547.554.554.550.4
Table 2. Train and line parameters.
ParametersValueParametersValue
Nominal voltage750 VEfficiency of inverter0.93
Maximum voltage900 VEfficiency of motor0.915
Minimum voltage680 VEfficiency of gear0.975
Power-factor of load0.85Motor rated power180 kW*4
Regeneration limit voltage U1/U2900 V/950 VMaximum acceleration1 m/s2
Maximum speed80 km/hMaximum deceleration1 m/s2
Resistance of traction network50.007 Ω/kmResistance of rail0.009 Ω/km
Table 3. Dwell times of Yizhuang subway line.
Serial NumberStation NameDwell Time (s)Station NameDwell Time (s)
1Songjiazhuang/Yizhuang Railway Station/
2Xiaocun30Ciqu35
3Xiaohongmen30Ciqu South35
4Jiugong30Jinghailu30
5Yizhuangqiao35Tongjinanlu30
6Yizhuang Culture Park30Rongchandongjie30
7Wanyuanjie30Rongjingdongjie30
8Rongjingdongjie30Wanyuanjie30
9Rongchandongjie30Yizhuang Culture Park30
10Tongjinanlu30Yizhuangqiao35
11Jinghailu30Jiugong30
12Ciqu South35Xiaohongmen30
13Ciqu35Xiaocun30
14Yizhuang Railway Station/Songjiazhuang/
Table 4. Simulation parameters.
Simulation ParametersValue
Population size40
Maximum number of generations100
Generation gap0.95
Crossover probability0.7
Mutation probability0.01
Table 5. Dwell time of Yizhuang subway line before and after optimization.
Serial NumberStation NameDwell Time (s)Optimization Scope (s)Post-Optimization Time (s)Difference before and after Optimization
Lower LimitUpper Limit
1Songjiazhuang/////
2Xiaocun302540355
3Xiaohongmen302540355
4Jiugong302540322
5Yizhuangqiao353045361
6Yizhuang Culture Park302540344
7Wanyuanjie302540355
8Rongjingdongjie302540333
9Rongchandongjie302540344
10Tongjinanlu302540344
11Jinghailu302540355
12Ciqu South35304531−4
13Ciqu35304530−5
14Yizhuang Railway Station/////
The total time375 40429
Table 6. Energy consumption after dwell time optimization.
Energy Consumption (kW·h)Before OptimizationAfter OptimizationRate of Change
Train traction energy consumption16741655
Train regenerative braking energy930922
Substation total energy consumption1084995−8%
Braking resistance absorption energy270195
The line losses energy7067
Utilization rate of regenerative braking71%79%8%

