Yield Stress and Reversible Strain in Titanium Nickelide Alloys after Warm Abc Pressing

Institute of Strength Physics and Materials Science of the Siberian Branch of the Russian Academy of Sciences, Tomsk, 634055, Russia
*
Author to whom correspondence should be addressed.
Materials 2019, 12(19), 3258; https://0-doi-org.brum.beds.ac.uk/10.3390/ma12193258
Submission received: 23 July 2019
/
Revised: 30 September 2019
/
Accepted: 3 October 2019
/
Published: 6 October 2019
(This article belongs to the Special Issue Materials with Shape Memory: Phase Transformations, Microstructure and Properties)
Abstract
:The results of the position analysis of the yield stress τ0.3 on the "stress–strain" (τ–γ) dependences, received at the torsion of specimens of Ti49.8Ni50.2 (at%) alloy are presented. The critical stress τ0.3 (IV), corresponding to the end of linear stage III and the beginning of the intensive development of plastic strain at stage IV, preceding the fracture of the specimens, were obtained as well. The structure of the specimens was transformed from coarse-grained to microcrystalline as a result of warm (723 K) abc pressing with a true deformation e of 8.4. The regularities of the development of reversible inelastic strain (superelasticity, SE, and shape memory effect, SME) and plastic strain γpl after isothermal (295 K) loading of specimens up to τ ≤ τ0.3(IV), unloading, and their subsequent heating up to 500 K are studied. From the joint analysis of the “τ–γ” dependences obtained at 295 K and "plastic strain–total strain" dependences the yield stress τ0.3 corresponding to the development of 0.3% of the plastic strain under loading of the specimens was determined. Critical stress τ0.3(IV) was determined as equal to the stress corresponding to a deviation of 0.3% from the linear “τ–γ”dependence at stage III. It is shown that the yield stress τ0.3 for all specimens is localized at the beginning of stage III for all specimens. The ratio τ0.3(IV)/τ0.3 is from 2.3 to 3.8. The accumulation of plastic strain at stage III (after loading with τ from τ0.3 to τ0.3(IV)) is from 2.4% to 4.7% (depending on the true deformation of the specimens during warm abc pressing). Thus, stage III is the stage of deformation hardening of specimens under torsion. On the basis of the results of this and previous works it is shown that, in alloys with thermoelastic martensitic transformations and with thermomechanical memory, the ratio τ0.3(IV)/τ0.3 can vary in a wide range: in reinforced specimens τ0.3 can be close to τ0.3(IV), and in more ductile specimens τ0.3 can be significantly less than τ0.3(IV). However, in order to correctly determine the yield stress of τ0.3 and the corresponding strain γt(0.3), it is necessary to carry out a joint analysis of “τ–γ” and "plastic strain–total strain" dependencies.
1. Introduction
TiNi-based materials, being bright representatives of smart materials, are widely used in engineering and medicine due to their high level of superelasticity (SE) and shape memory effect (SME), strength and plasticity, thermomechanical and thermal fatigue life, and corrosion resistance and biocompatibility. The excellent thermomechanical properties of TiNi are provided by thermoelastic martensite transformations from a cubic B2 phase to a rhombohedral R or a monoclinic B19′ phase. The shape of specimens with low internal stress remains unchanged under cooling and heating over the temperature ranges of martensitic transformations because of the formation of polivariant systems of self-accommodated martensite domains. SE and SME are conditioned by the deformation influence. Shape memory is the ability for accumulation of reversible inelastic strain in isothermal loading–unloading cycles at Td < Mf (where Td is the deformation temperature and Mf is the martensite finish temperature) and for its recovery in unloaded states of specimens at T > Af (where Af is the austenite finish temperature). Superelasticity is the ability for accumulation of inelastic strain during the formation of stress-induced martensite (SIM) under isothermal loading at stresses higher than the martensite shear stress σM (or τM in torsion) and for its complete recovery under further unloading due to reverse SIM→B2 transition. The deformation temperature Td for SE realization lies within the so-called superelastic window: ΔT = T2 – T1 with Ms < T1 < Td < T2 < Md, where Ms is the martensite start temperature on cooling and Md is the maximum SIM formation temperature under isothermal loading. Another important property of this type of alloy is the ability to produce high reactive stresses on the heating of specimens preliminary deformed in martensite (Td < Ms) or SIM (Td > Ms) states and constrained to prevent shape recovery.
In general, the degree of shape recovery η, being the ratio of reversible to total strains, and the reactive stress depend on development of plastic strain at the stages of preliminary loading and unloading or heating after predeformation of alloy specimens with thermoelastic martensitic transformations. Conventionally, the onset of plastic deformation in a material is judged from its macroscopic yield stress, i.e., from the stress σ0.2 (in compression and tension) or τ0.3 (in torsion) at which the accumulated plastic strain reaches 0.2% and 0.3%, respectively. The higher the stress σ0.2 compared to σM, the higher the SME, the SE, and the reactive stresses. The parameter Δσ = σ0.2 – σM is analyzed in many studies [1,2,3,4,5], showing its significance on the way to better performance and wider applicability of TiNi alloys. The yield stress of materials can be increased by different methods: variation in their elemental composition (e.g., alloying), thermomechanical treatment [5,6,7], and severe plastic deformation with hardening via grain structure refinement to fine- and ultrafine-grained states [8,9,10,11]. However, correctly determining the yield stress of alloys like TiNi is problematic. The stress–strain diagram of materials with no thermoelastic martensite transformations includes a linear elastic stage followed by a plastic stage, and their yield stress criterion is the stress σ0.2 or τ0.3 at which the dependence deviates from linearity by 0.2% (tension, compression) or by 0.3% (torsion) in the transition region between the elastic and plastic stages. For alloys with thermoelastic martensite transformations, such as TiNi, the stress–strain diagram is more complicated (Figure 1).
The diagram begins with short elastic stage I which passes to stage II at stresses σ > σM (τ > τM). Stage II represents martensite detwinning and reorientation (Td < Mf) or SIM generation (Td > Af) responsible for inelastic strain accumulation at comparatively small stresses. Then comes stage III in which the response to increasing stresses is almost linear and the strain hardening coefficient θ = dσ/dε (dτ/dγ) is higher than that in stage II. As σ > σ0.2(IV) is reached, stage IV begins showing intense plastic flow with further fracture of specimens. In general, the total strain εt at any of stages II–IV comprises elastic martensite strains εel, reversible inelastic strains εSE and εSME, and plastic strains εpl: εt = εel + εSE + εSME + εpl. Thus, the dependences σ–ε and τ–γ allow us to correctly determine σM and τM, but determining σ0.2 and τ0.3 from these dependences is impossible without analysis of the reversible strain εel + εSE + εSME and plastic strain εpl with increasing the total strain εt.
Another concept is also available to judge the position of σ0.2 on stress–strain diagrams [1,3,4,12,13,14,15,16,17,18]. The concept suggests that stage III corresponds to elastic martensite strains, and the yield stress to σ0.2(IV) and τ0.3 (IV) (Figure 1). The idea of such an interpretation has apparently come from a study of Cu–Zn–Si alloys [19] in which almost complete strain recovery was found under unloading at total strains εt close to the end of stage III, suggesting that stage III is elastic for the martensite formed at stage II (Td > Ms). The idea was then extended to Cu-, Ag-, and Au-based alloys with thermoelastic martensite transformations [20,21]. Similar judgments were made for TiNi-based alloys [1] from an analysis of their reversible inelastic and plastic behavior [22]: in loading–unloading cycles with heating to T > Af in unloaded states, TiNi alloys rich in C and Si completely recovered their shape at εt ≤ 8% with maximum reactive stresses at εt ≈ 8% late in stage III (note that εL was also introduced as a critical strain above which plastic deformation begins in a material [1]). In further studies [14,15,16,17,18], the stress σ0.2 in TiNi-based alloys was assessed from the criterion of 0.2% deviation from linearity at stage III.
However, even early studies reported that after tension to εt at the end of stage II, unloading, and heating in unloaded states, the plastic strain was ~1% [23] in binary alloys with a Ni content of 50.1 at% (initial B19′ martensite). It was noted [24] that in stage III, the slopes (dσ/dε or dτ/dγ) of “stress–strain” dependences under loading and unloading is essentially different for specimens of TiNi-based alloys. This contradicts the supposition that only elastic deformation of reoriented martensite occurs at stage III. Additionally, a high dislocation density was found by transmission electron microscopy in TiNi deformed at stage III [24]. These results were confirmed by further studies [25,26,27,28,29,30,31,32,33,34]. The finish of reorientation and detwinning of martensite domains (in specimens with initial martensite structure) and formation of SIM (in specimens with initial B2 structure), the appearance of high dislocation density and formation of compound twins, such as {20?1}B19′, {110}B19′, and {1?13}B19′, were observed after deformation at stage III of different TiNi-based alloys with polycrystalline [25,26,27,28,29,30,31] and monocrystal [32,33,34] structures. Consequently, the development of both inelastic strains and plastic strain may develop at stage III.
In several studies [25,26,29,30,32,33,34], the εt dependences of εel, εSE, εSME, and εpl were analyzed in isothermal cycles of loading and unloading with further heating to complete shape recovery via reverse martensite transformation to B2. The plastic strain at εt close to the end of stage III was shown to measure 1–5%, but the yield stress σ0.2 from the σ–ε and εpl–εt dependences was not determined. One of the recent studies [35] provides data on the γt dependences of γSE, γSME, and γpl in coarse-grained and microcrystalline Ti49.2Ni50.8 (at%) under torsion in isothermal τ–γ cycles (295 K) with heating in unloaded states. The τ–γ and γpl–γt dependences of Ti49.2Ni50.8 (with an average grain size of 43 µm to 1.5 µm after warm caliber rolling at 723 K) show that τ0.3 lies near the beginning of stage III and that after deformation with γt corresponding to τ0.3(IV), the plastic strain is 1% irrespective of the average grain size in the material. The difference Δτ = τ0.3(IV) – τ0.3 is considerable and increases from 160 MPa in the coarse-grained material to 460 MPa in the microcrystalline one.
Here we analyze the yield stress τ0.3, plastic strain, and reversible inelastic strain under torsion in Ti49.8Ni50.2 (at%) with an average grain size of 40 µm to ~1.5 µm after warm abc pressing at 723 K.
2. Materials and Methods
The almost equiatomic alloy Ti49.8Ni50.2 at%, containing Ti4Ni2 (N,O) in an amount of ~6 vol%, was supplied as hot-swaged bars of diameter 20 mm (MATEK-SMA, Moscow, Russia). After high-temperature abc forming at 1023 K, its specimens were shaped as cubes with an edge of ~20 mm. The specimens were exposed to warm multicycle abc pressing in a die at 723 K with upsetting in three orthogonal directions during each cycle. The strain rate was = 0.16–0.18 s–1, and the total true plastic strain per cycle was e = 0.2–0.3, being the sum of natural logarithm of ratios of specimen heights before and after upsetting. Before each upsetting event, the die with a specimen was heated in a furnace at 723 K. The specimen temperature during abc pressing varied by no more than 10 deg. In the initial state after hot forming at 1023 K, the specimens had a coarse-grained structure with an average grain size <d> = 40 µm. As the strain e was increased, the grain size <d> decreased, measuring 1.5 µm after warm abc pressing with e = 8.4 at 723 K. A detailed discussion of the effect of pressing at 723 K on the grain-subgrain structure of the alloy can be found elsewhere [36]. After warm abc pressing at 723 K, the true strain in the specimens was 0.3, 0.6, 1.8, 4.2, 6.4, and 8.4.
The inelastic and plastic strains in the material under torsion was studied on an inverted torsion pendulum with an operating temperature of 573–120 K. The test specimens were bars of diameter ~1 mm with a gage length of ~10 mm. The experimental method used to determine the reversible inelastic strains γSE, γSME and plastic strain γpl is shown in Figure 2. The total strain is γt = γSID + γpl = γel + γSE + γSME + γpl. The “τ–γ” dependencies for each strain γt were obtained in isothermal (295 K) “loading-unloading” cycles. The value of γSE (the superelasticity effect) was assumed to be equal to the recovery of the strain under isothermal unloading (including a small Hook strain of ~1.5% [37]): γSE = γt – γr. After unloading, the martensite phase was partially present providing the presence of residual strain γr in the unloaded specimens at 295 K. The martensitic phase transforms into the B2 phase with the subsequent heating of the unloaded specimens. This martensite transformation provides the recovery of inelastic strain during heating: γSME = γr – γpl. The plastic strain γpl is equal to the residual strain after completion of the shape recovery. The value of γpl for all specimens was determined at 500K (~150 degrees above Af in the initial specimens). The strains γt, γr, and γpl strains are equal to arctgSt, arctgSr, and arctgSpl, where , , ; ϕt, ϕr, and ϕpl. are the torsional angles of the specimens in radians under isothermal loading with γt, after complete unloading and at 500 K, respectively; d and l are the dimensions of the cross-section and the length of the specimen gage section. In each next cycle γt was increased. The final value of γt is equal to γt(IV), corresponding to τ0.3(IV) of each specimen with the true strain e after warm abc pressing (Figure 1). The degree of the shape recovery of the specimens was determined to be η = γSID / γt.
The sequence and temperatures of martensite transformations in the alloy after warm abc pressing at 723 K were considered previously [36]. Of importance here is the following aspect: In Ti49.8Ni50.2 (at%) preliminarily quenched from 1073 K, only B2↔B19′ transitions occur on cooling and heating. The martensite start and finish temperatures in the quenched alloy are Ms = 317 K and Mf = 219 K (B2→B19′ transition), and the austenite start and finish temperatures are As = 343 K and Af = 354 K (reverse B19′→B2 transition). The initial alloy preformed at high temperature undergoes B2→R→B19′ transitions on cooling. The rhombohedral R phase is formed at TR = 327 K, and the temperatures of R→B19′ and reverse B19′→B2 transitions lie in the range from Ms = 316 K to Mf = 281 K and from As = 338 K to Af = 355 K, respectively. Thus, the temperatures of B2→B19′, R→B19′, and B19′→B2 in the alloy after quenching and after high-temperature forming are almost the same.
After warm abc pressing with e = 0.3–8.4 at 723 K, the sequence of martensite transformation in the alloy on cooling and heating remains unchanged: B2→R→B19′ and B19′→B2, respectively. The temperatures TR, As,, and Af remain constant, and Ms and Mf decrease linearly to 311 K and 276 K (by ~5 and ~10 deg, respectively) with an increase in e to 8.4. Thus, both the initial and the abc-pressed specimens have a two-phase R + B19′ structure at 295 K.
3. Experimental Results
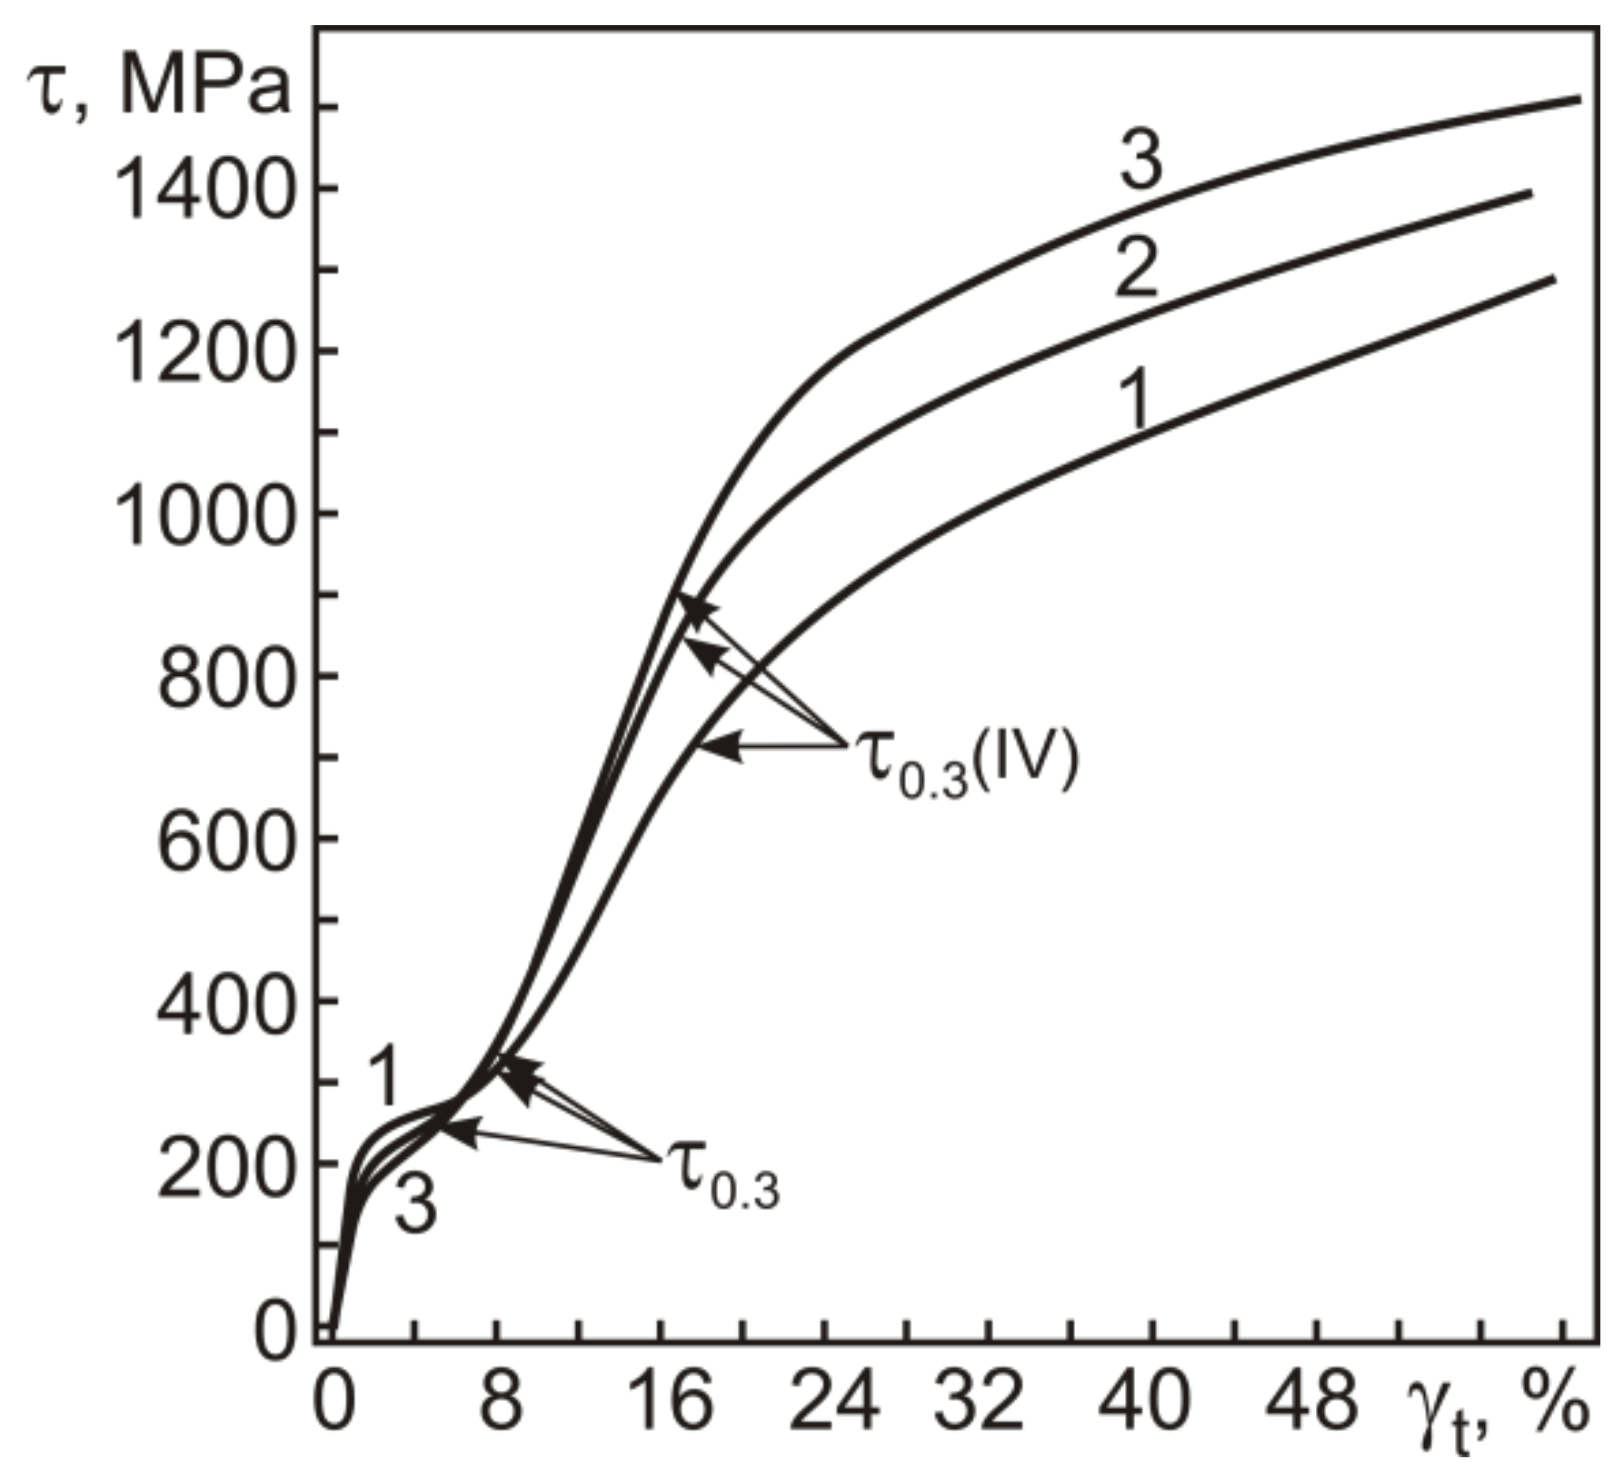
Figure 3 shows the engineering stress–strain diagrams of the initial and abc-pressed TiNi specimens under isothermal loading at 295 K. It is shown that the dependences comprise stages I–IV typical for alloys with thermoelastic martensite transformations (Figure 1).
Since both the initial and abc-pressed specimens at 295 K have a two-phase R + B19′ structure (Td > Mf), the deformation stage II in both involves the formation of SIM due to their R→B19′ transition under loading and the reorientation and detwinning of the B19′ martensite present before loading. The martensite shear stress τM as a function of the initial true strain e is shown in Figure 4.
Figure 4 shows that the martensite shear stress τM, or the pseudo-yield stress, decreases noticeably after pressing with e ≤ 0.6 and remains constant with further increasing e to 8.4. As can be seen from Figure 3, the pseudo-yield stage gradually passes to stage III at which the strain increases linearly with the applied stress. At this stage, the strain hardening coefficient θ = dτ/dγ increases with e specified in warm abc pressing (Figure 3). The stress τ0.3(IV), corresponding to a deviation of 0.3% from the previous linear stage III, causes the material to enter stage IV, which culminates in its fracture. In Figure 3, the stress τ0.3(IV) in the initial specimen and specimens pressed with e = 1.8 and e = 8.4 is 710, 870, and 915 MPa, respectively.
To correctly determine the yield stress τ0.3, which corresponds to an accumulated plastic strain of 0.3%, we should analyze the dependence of the plastic strain γpl on the total strain γt in torsion. All components of reversible inelastic strains γSID = γSE + γSME and γpl as a function of γt obtained in the study are for isothermal loading–unloading cycles at 295 K with heating in unloaded states to 500 K (as described in the Materials and Methods). As can be seen from Figure 5, the γt dependences of γpl for all specimens are qualitatively similar. Increasing the total strain γt to ~16% slightly increases the plastic strain γpl, and as γt goes above 16%, γpl begins to grow. The data in Figure 3 show that γt = 16% is close to γt(IV), corresponding to τ0.3(IV). Thus, the critical stress τ0.3(IV) in the initial and abc-pressed specimens characterizes the onset of intense plastic flow at stage IV rather than the onset of yielding, i.e., the yield stress τ0.3.
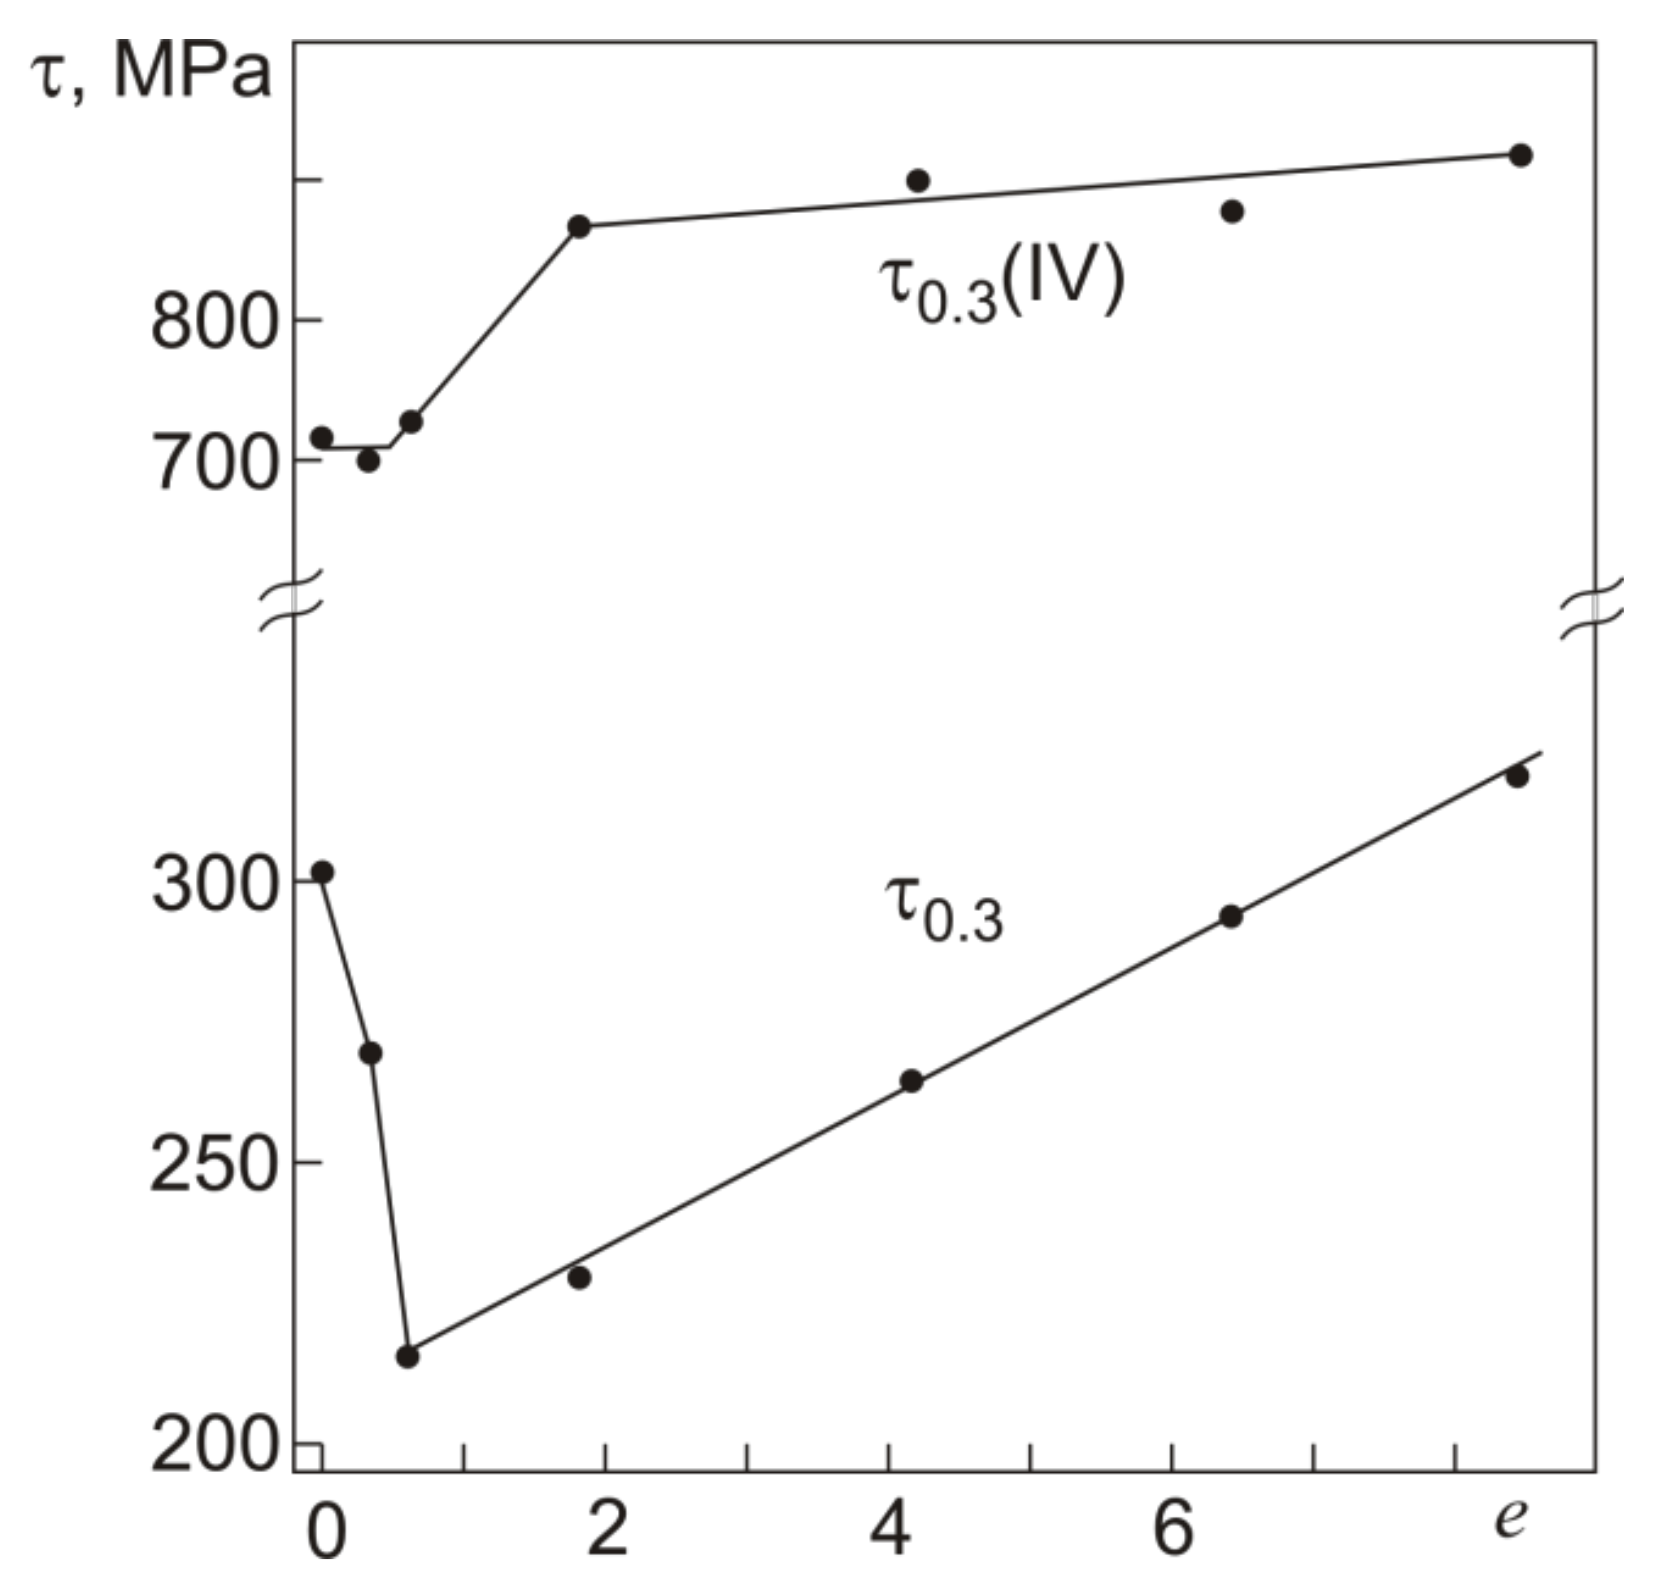
The γt dependences of γpl allow us to rather easily determine the yield stress τ0.3 on τ–γ diagrams like those in Figure 3. From the γt dependences of γpl we can estimate the total strain γt(0.3) at which γpl = 0.3%, and the values of γt(0.3) will give the position of the yield stress τ0.3 on the τ–γ diagrams. Figure 6 and Figure 7 show the yield stress τ0.3 and strain γt(0.3), and the stress τ0.3(IV) and strain γt(IV) in the initial and abc-pressed specimens.
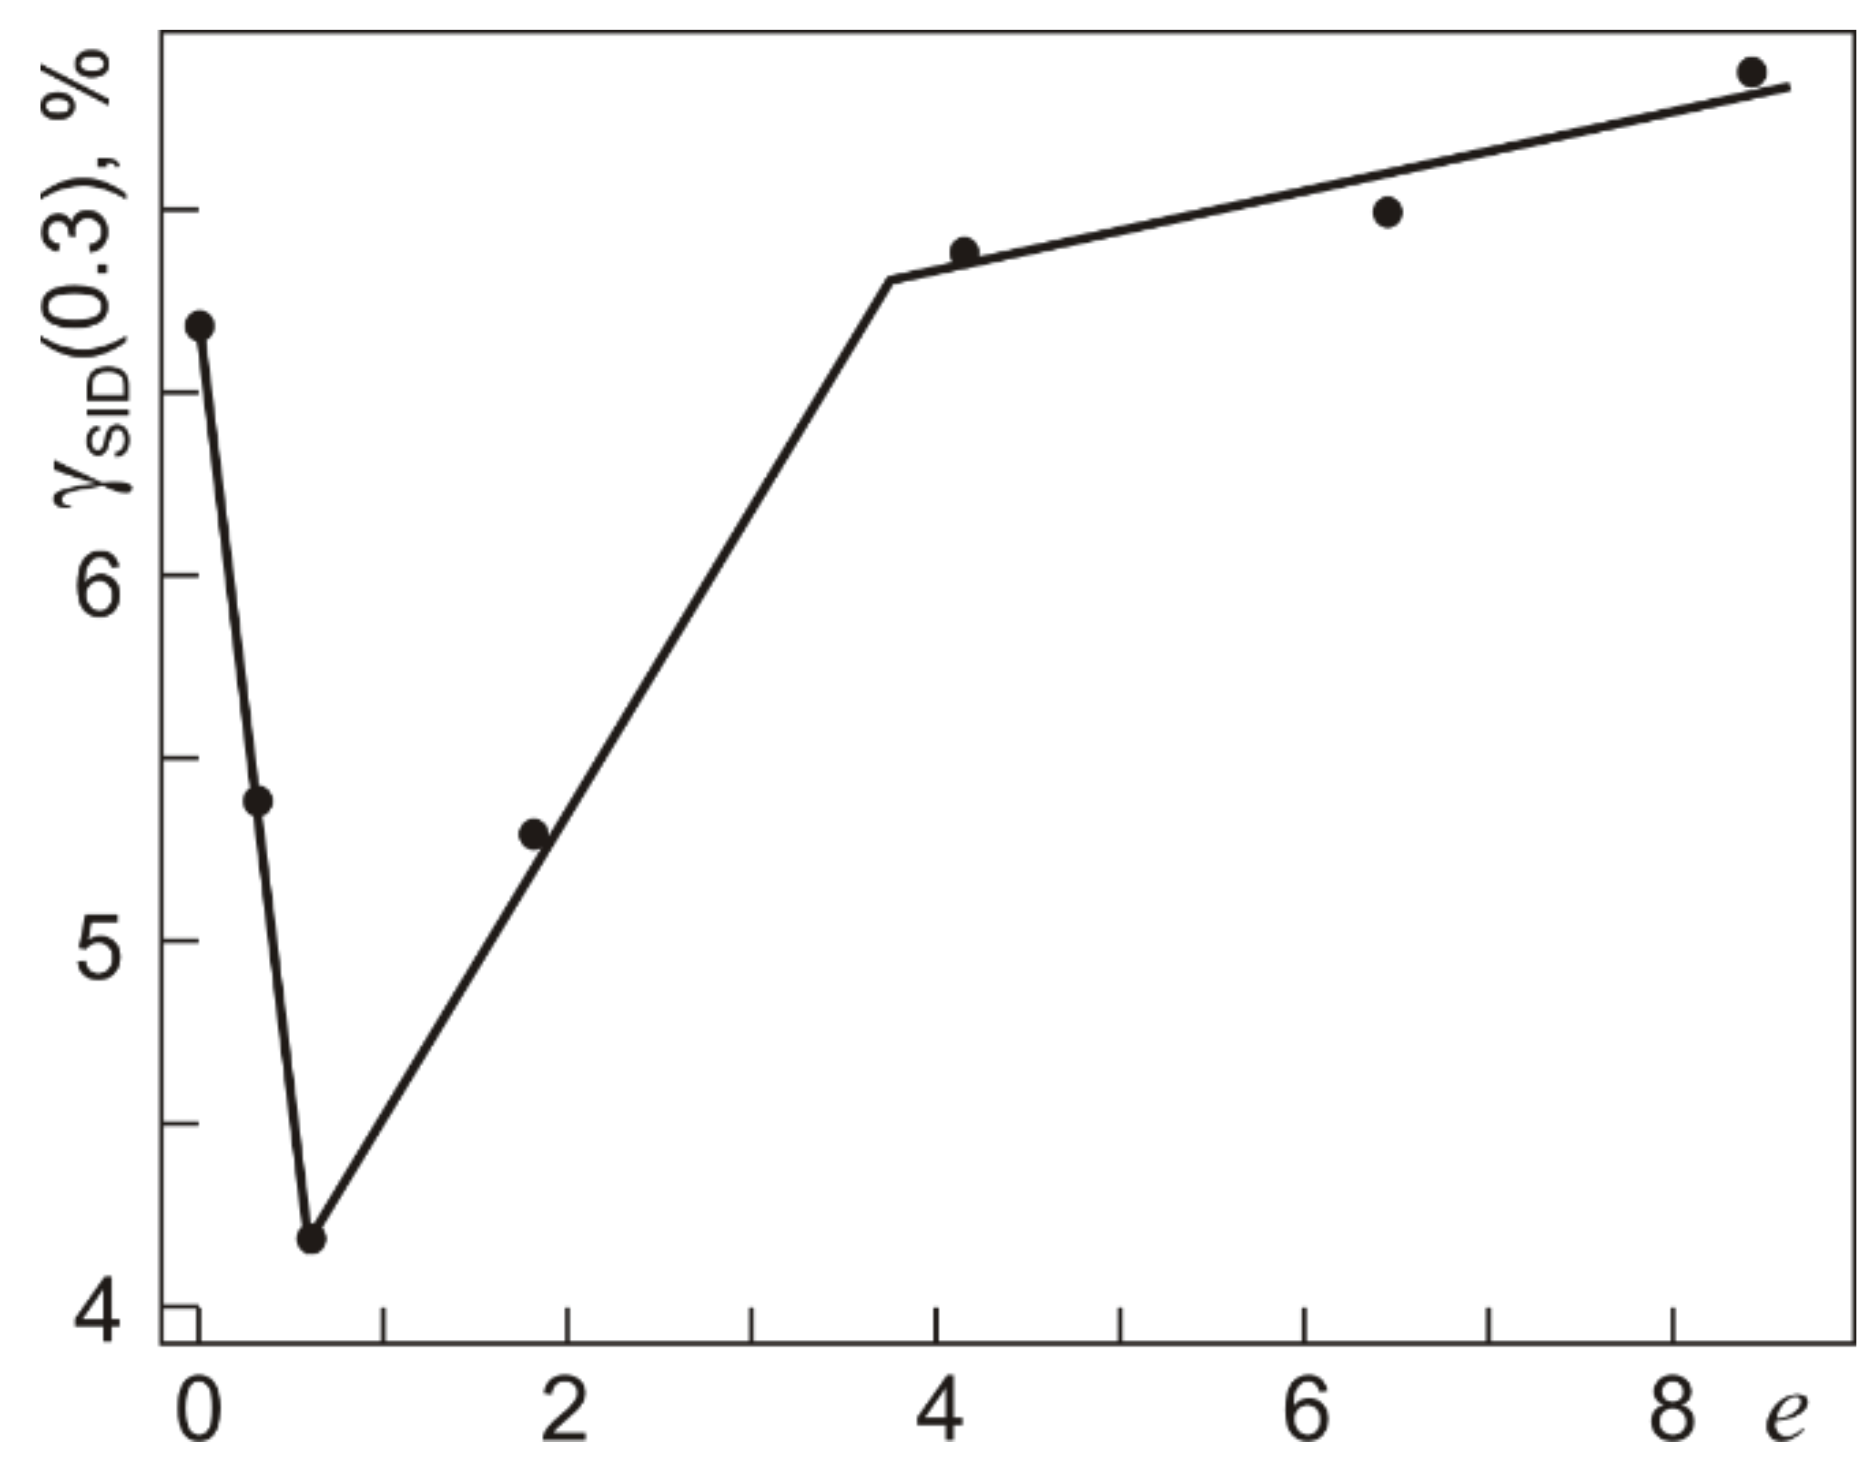
From Figure 6 it is seen that τ0.3(IV) remains almost unchanged after abc pressing with e ≤ 0.6 and increases as e is increased to 1.8. In the specimens pressed with e = 1.8–8.4, the increment in τ0.3(IV) is ~200 MPa. The diagrams in Figure 7 show that the strain γt(IV) corresponding to the end of stage III and the transition to stage IV decreases by 0.4% after abc pressing with e = 4.2 compared to γt(IV) in the initial specimens. After pressing with e = 6.4 and e = 8.4, the decrease in γt(IV) is ~1%. By and large, all τ0.3(IV) correspond to the range of γt(IV) from 17% to 18.5%. The yield stress τ0.3 in the specimens pressed with e = ≤ 0.6 at 723 K decreases to 220 MPa against its value τ0.3 = 300 MPa in the initial specimens. Consequently, the work softening is observed in the specimens after warm abc pressing with e ≤ 0.6. After abc pressing with e = 0.6–8.4, the yield stress τ0.3 increases linearly almost to its initial value. The secondary hardening of specimens is the result of warm pressing with e > 0.6. Thus, the yield stress τ0.3 in the initial (coarse-grained) and abc-pressed (microcrystalline structure) specimens differs little, measuring 300 and 320 MPa, respectively. As can be seen from Figure 7, the e dependence of γt(0.3), corresponding to τ0.3, differs from that of γt(IV).
The initial alloy reaches τ0.3 at γt(0.3) = 7%. After abc pressing with e = 0.6, the yield stress τ0.3 shows its minimum (Figure 6) at γt(0.3) = 4.5% (Figure 7), and as e is increased from 0.6 to 4.2, the value of γt(0.3) grows to that of the initial alloy. After abc pressing with e = 4.2–8.4, the increment in γt(0.3) slows down to ~0.5%. As a whole, the variation in γt(0.3) is ~3%, which is twice as large as the variation in γt(IV) after pressing with e up to 8.4. The extent of stage III in the initial alloy is 11.5%, reaches its maximum of ~14% after pressing with e = 0.6, and decreases to 9.5% after pressing with e = 8.4.
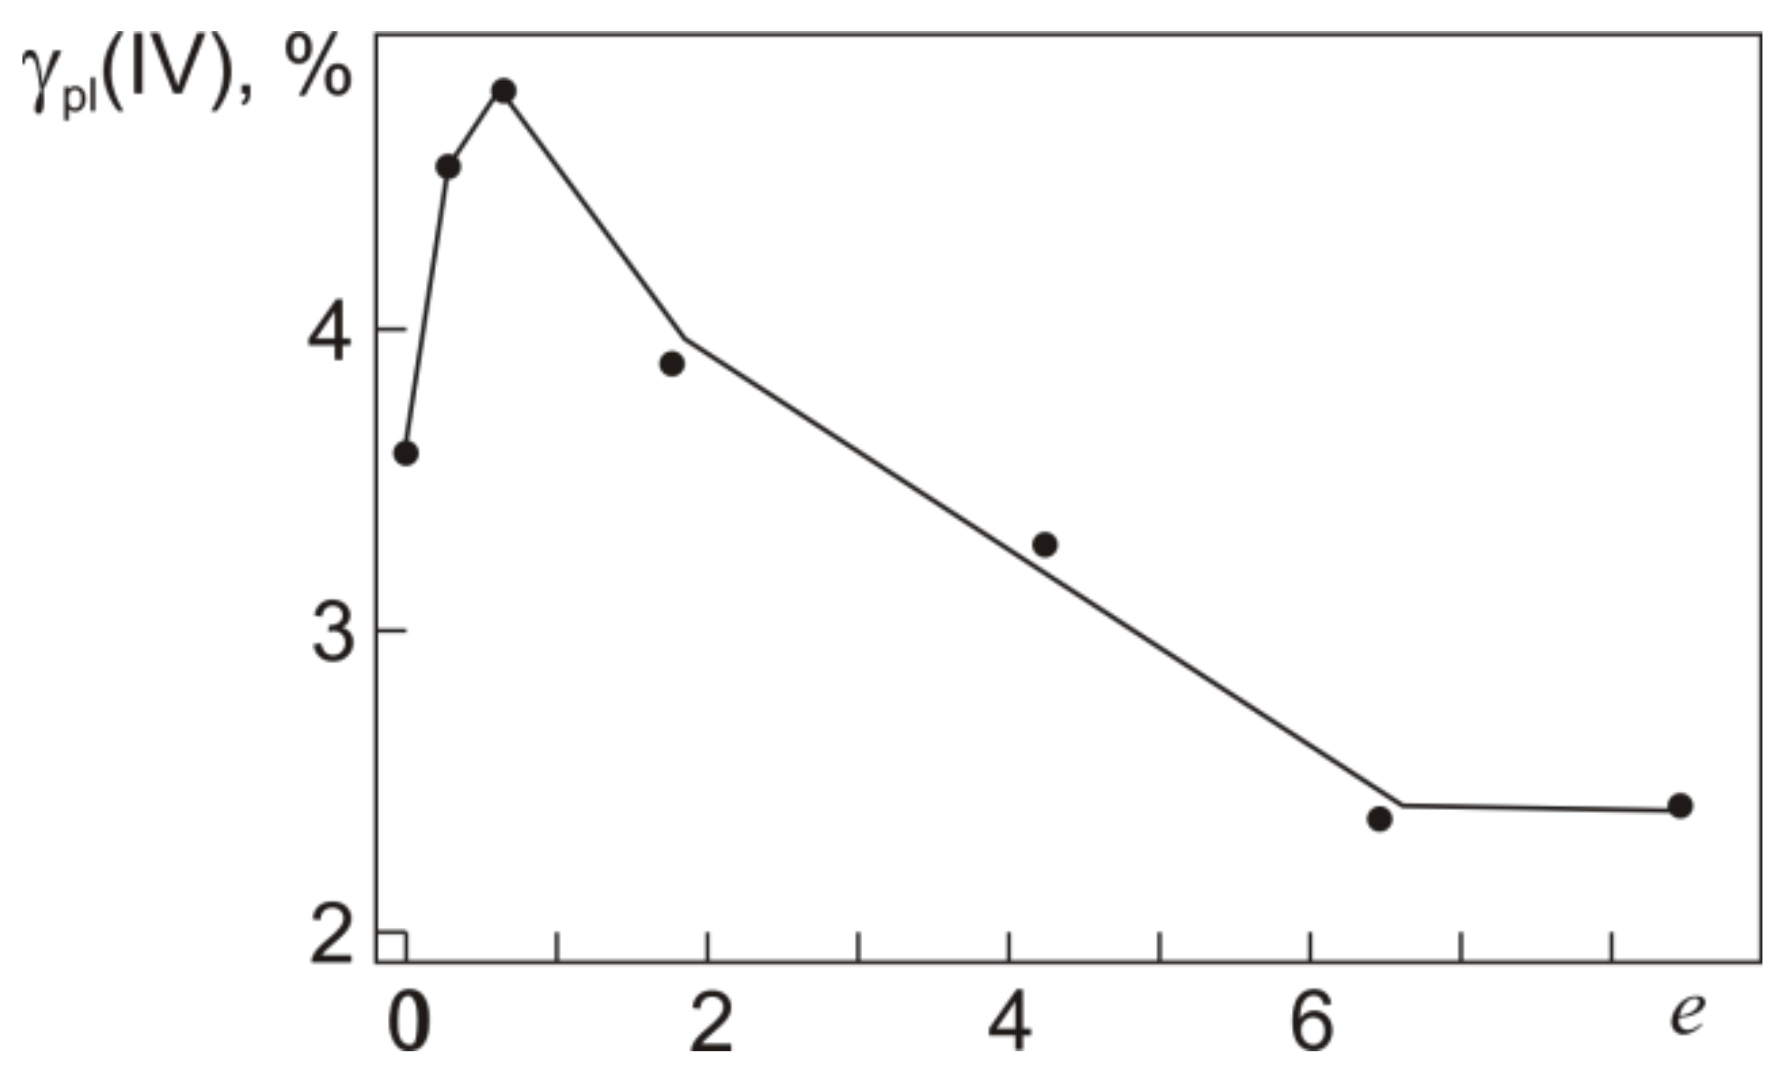
The plastic strain γpl(IV) after loading to τ0.3(IV) can be estimated from a joint analysis of the τ–γ and γpl–γt dependences in Figure 3 and Figure 5. Figure 8 shows the plastic strain γpl(IV) as a function of e specified in warm abc pressing.
Figure 8 shows that, against the decrease in τ0.3 and almost invariant τ0.3(IV) in the specimens pressed with e ≤ 0.6, their plastic strain γpl(IV) increases from 3.6% to its maximum 4.7% at e = 0.6. The specimens pressed with e > 0.6, in which the yield stress τ0.3 grows, reveal a monotonic decrease in γpl(IV). However, even in the specimens with e = 6.4 and 8.4, the plastic strain accumulated in torsion at γt = γt(IV) corresponding to τ0.3(IV) remains high (~2.4%). Thus, the actual yield stress in Ti49.8Ni50.2 is close to the onset of stage III on its τ–γ dependences (Figure 3). Stage III is a strain hardening stage at which γpl increases from 0.3% to 2.4–4.7%.
Figure 9 and Figure 10 show the total reversible inelastic strains γSID(0.3) and γSID(IV) recovered after isothermal loading to γt(0.3) and γt(IV), which correspond to τ0.3 and τ0.3(IV), unloading, and heating in unloaded states as a function of e in abc pressing (γSID = γSE + γSME = γt –γpl). As can be seen, the dependences are qualitatively similar. In the specimens pressed with e ≤ 0.6, the strains γSID(0.3) and γSID(IV) are smaller than those in the initial specimens. The strains γSID(0.3) and γSID(IV) increase after abc pressing with e from 0.6 to 4.2. After pressing with e from 4.2 to 8.4, the strain γSID(0.3) increases somewhat while γSID(IV) decreases somewhat. The dependence of γSID(0.3) is close to that of γt(0.3) because the accumulated plastic strain is low (0.3%) and is the same for all specimens. The behavior of γSID(IV) is governed by variations of both γt(IV) (Figure 7) and γpl(IV) accumulated under loading to τ0.3(IV) (Figure 8).
The minimum value of γSID(IV) after abc pressing with e = 0.6 is due to the maximum value of γpl(IV) and to the constancy of γt(IV). After pressing with 0.6 < e < 4.2, the plastic strain γpl(IV) decreases more greatly than γt(IV), and this allows γSID(IV) to reach its maximum almost equal to γSID(IV) in the initial specimens. When γpl(IV) and γt(IV) are decreased simultaneously, the specimens pressed with e = 6.4 and 8.4 show a slight decrease in γSID(IV).
An important characteristic of shape memory alloys is the degree of shape recovery η = (γt – γpl)/γt = γSID/γt, being the ratio between reversible inelastic strains produced under loading to γt and recovered under unloading (SE) and further heating (SME). Figure 11 shows the degree of shape recovery η0.3 and η0.3(IV) after loading to τ0.3 and τ0.3(IV), respectively, as a function of e in warm abc pressing. After abc pressing with e ≤ 0.6, η0.3 decreases from 96% to 93%, and after abc pressing with e from 1.8 to 8.4, its value is η0.3 = 96% as in the initial specimens.
The e dependences of η0.3 and η0.3(IV) are qualitatively similar. However, η0.3(IV) is 10–20% lower than η0.3 both in the initial and in the abc-pressed specimens. This is because plastic strain develops under loading at stage III (Figure 8). In the initial specimens, η0.3(IV) = 80%. In the specimens pressed with e ≤ 0.6, it decreases to 74% and, in those pressed with e from 1.8 to 8.4, it increases to 85%. Thus, in terms of complete shape recovery, the range of total strains γt ≤ γt(0.3) at applied stresses τ < τ0.3 is more preferable.
Another important result concerns the total strain γSID = γSE + γSME. From comparison of Figure 9 and Figure 10 it follows that γSID(IV) is two times higher than γSID(0.3). The inelastic strains γSE(0.3), γSME(0.3) and γSE(IV), γSME (IV) for loading to τ0.3 and τ0.3(IV) are plotted in Figure 12.
As can be seen from Figure 12, γSME > γSE in all specimens irrespective of their grain structure and total strains γt(0.3), γt(IV). The strain γSME(0.3) is close to γSID(0.3) because γSE(0.3) is small and is almost equal to the recovery of elastic martensite strain under unloading: 1–1.5% [37]. Increasing the total strain under loading to τ0.3(IV) increases γSE(IV) to 3–4% in the initial specimens and specimens after the pressing. The strain γSME(IV) in these specimens weakly depends on e, and its value γSME(IV) = 10–11% is 2–3 times higher than γSME(0.3). Thus, coarse-grained and microcrystalline Ti49.8Ni50.2 structures plastically deformed by torsion are promising SME materials capable of providing high reversible inelastic strains after loading with τ0.3(IV).
4. Discussion
Data on yield stress in alloys with martensitic transformations, including TiNi, are necessary for assessing their operability and reliability as structures with SE- and SME-based functional properties. In our analysis, we follow two approaches to yield stress estimations in near-equiatomic Ti49.8Ni50.2 (at%) transformed from coarse-grained to microcrystalline states by warm abc pressing at 723 K. The first approach implies an analysis of the τ–γ dependence (Figure 1) with linear stage III taken as elastic martensite deformation and yield stress as stresses at which stage III ends and passes to stage IV. The second approach implies a joint analysis of the τ–γ dependence and γpl–γt dependence in loading–unloading cycles at increasing γt with the yield stress taken as stress τ0.3, at which the accumulated plastic strain reaches 0.3%.
Our study shows that in Ti49.8Ni50.2 alloy, whether coarse-grained or microcrystalline after warm pressing, the accumulated plastic strain at stage III under torsion with τ = τ0.3(IV) ranges from 2.4% to 4.7%, i.e., it is much higher than 0.3%. Assuming that τ0.3(IV) is the yield stress, the degree of shape recovery after loading to τ0.3(IV), unloading, and further heating, would measure η0.3(IV) = (97.3 ± 0.1)% in all specimens irrespective of their structure. However, its actual value after loading to τ = τ0.3(IV) varies from 74% to 85% depending on e. The stress τ0.3(IV) is 700–920 MPa, and the yield stress τ0.3 compared to τ0.3(IV) is 2–3 times smaller, measuring 230–320 MPa and approximating the onset of stage III. After such cycles with loading to τ = τ0.3, the degree of shape recovery remains high: 93–96%.
These results are qualitatively similar to the results of our previous study [35] in which we analyzed the yield stress τ0.3 and critical stress τ0.3(IV) under torsion in Ti49.2Ni50.8 (at%) alloy transformed from coarse- to fine-grained states by warm caliber rolling at 723 K. For the alloy, which had a two-phase B2+R structure before torsion at Td = 295 K, the ratio τ0.3(IV)/τ0.3 was 1.45 ± 0.20 depending on the true strain in rolling. The stress τ0.3 was also close to the onset of stage III, but the degree of shape recovery after loading, unloading, and heating to 500 K in Ti49.2Ni50.8 alloy was higher than its value in Ti49.8Ni50.2: 97% and 93% after loading to τ0.3 and τ0.3(IV), respectively. The plastic strain accumulated at stage III with τ = τ0.3(IV) was 1%.
Thus, our research in abc-pressed Ti49.8Ni50.2 (at%) and caliber-rolled Ti49.2Ni50.8 (at%) [35] demonstrates that jointly analyzing the dependences τ–γ and γpl–γt in loading, unloading, and heating cycles allows one to estimate the yield stress τ0.3, critical stress τ0.3(IV), plastic strain accumulated at stage III, and total inelastic strain γSID and its components γSE and γSME depending on the total torsional strain γt.
It is seen from Figure 10 and Figure 12 that, in Ti49.8Ni50.2 alloy after warm abc pressing, the inelastic strains γSID, γSE, and γSME increase 2–2.5 times after loading with total strains from γt(0.3) to γt(IV) at stage III. The dependences of γSID, γSE, and γSME are similar to those obtained for the same material in torsion with γt > γt(IV) at Td = 295 K [38]: after deformation with γt > γt(IV), the strains γSID, γSE, and γSME continue to grow, reach their maximum values, and then decrease. However, the increments in γSID, γSE, and γSME are much lower than that after loading with γt from γt(0.3) to γt(IV). The maximum value of γSID equal to 16–18% is reached in the range γt = 27–48% with the plastic strain measuring γpl = 10–30%. The increment in γSME is no greater than 1–2%: γSME increases to 11–13%. The increase in γSID to its maximum is governed mostly by γSE, which increases from 4% after deformation at γt = γt(IV) to 6–7% at γt = 27–48%. Thus, ~85% of the reversible inelastic strain in Ti49.8Ni50.2 alloy is attained after loading with γt corresponding to stage III on the τ–γ dependence.
In summary, it should be noted that, in Ti49.8Ni50.2 alloy after warm abc pressing, the ratio τ0.3(IV)/τ0.3 is 2.4–3.8 and, in Ti49.2Ni50.8 alloy after warm rolling, it is 1.45 ± 0.2 [35]. At the same time, research data are available on two TiNi-based alloys in which the yield stress and the critical stress at the end of stage III are very close [14,16]. After compression at 293 K and unloading, complete shape recovery was observed in single-crystal Ti48.5Ni51.5 (at%) alloy aged at 823 K for 1.5 h [14]. Polycrystalline Ti50.2Ni49.8 (at%) alloy hardened by a single pass of equal channel angular pressing (channel angle 90°) at room temperature revealed its complete shape recovery after isothermal (293 K) cycles of compression with strains close to the end of stage III and unloading with further heating [16].
Thus, the ratio τ0.3(IV)/τ0.3 or σ0.2(IV)/σ0.2 can vary over a wide range depending on the composition of an alloy and its preliminary thermomechanical treatment. However, the yield stress in alloys with martensitic transformations, including TiNi, can be correctly determined only from a joint analysis of stress–strain dependences (τ–γ or σ–ε) and dependences of accumulated plastic strains on total strains (τpl–γt or σpl–σt). The similarity of the methods for determining the actual yield stress under torsion, compression, and tension of TiNi-based alloy specimens is provided by the following results. The deformation behavior of these alloys is qualitatively similar for these deformation modes. The same four deformation stages (I–IV) are observed on the “σ–ε” dependences obtained under tension and compression of TiNi-based alloy specimens, as well as on their “τ–γ” dependences obtained under torsion. The development of plastic εpl strain and reversible inelastic strains (SE, SME, total inelastic strain) were studied and depend on the total εt tension strain in isothermal "loading–unloading" cycles with subsequent heating of the unloaded specimens of binary alloys with 50.5 at% Ni (polycrystalline structure [29]) and 50.6 at% Ni (single-crystal with [100] orientation [31]). In [29,31] it was noted that the onset of εpl development corresponded to the transition from stage II (pseudo-yield "plateau") to stage III, but σ0.2 was not determined in these studies. By the end of stage III εpl reached 2.5% in polycrystalline specimens [29] and ~5% in single-crystal specimens [31]. At the same time, the maximum total reversible inelastic strain was attained after loading at stresses corresponding to the end of stage III. Similar studies of the plastic strain εpl and reversible inelastic strains were carried out in [32] under compression of single-crystal (orientation [001]) specimens of the TiNi(Mo,Fe) alloy with the initial B2 structure. The results [32] showed that 0.2% of the plastic strain appears after loading with σ0.2 = 580 MPa (the beginning of stage III on the “σ–ε” dependence). After compression with σ ≈ 900 MPa (the end of stage III and the transition to stage IV) the plastic strain increased up to 2%. Consequently, σ0.2(IV) / σ0.2 ≥ 1.6 in these specimens. In general, the results [29,31,32] for TiNi-based alloy specimens under compression and tension are qualitatively similar to those obtained for Ti49.8Ni50.2 (at%) alloy specimens after warm abc pressing in our study and for Ti49.2Ni50.8 (at%) alloy specimens after warm rolling under torsion [35].
In conclusion, the following should be noted: Non-monotonous changes of yield stress τ0.3, intensity of plastic strain accumulation, and corresponding changes of reversible inelastic strains under torsion are determined by the work softening and further strengthening of specimens during warm abc pressing. The physical causes for these processes are not discussed in our paper because no experimental data are presently available for such a discussion. At present, research is conducted on the fine crystalline and dislocation structures in the material after warm abc pressing and after torsion. The results of this research will be presented in our future publications.
5. Conclusions
Our study shows that in Ti49.8Ni50.2 (at%) transformed from coarse-grained to microcrystalline states by warm abc pressing at 723 K the yield stress τ0.3 on its τ–γ diagram occurs early in stage III featuring a linear increase in torsional strains under applied stress. The end of stage III and the onset of stage IV, with its intense plastic flow and eventual fracture, fall on the critical stress τ0.3(IV) corresponding to a deviation of 0.3% from the previous linear τ–γ stage. The ratio τ0.3(IV)/τ0.3 in the alloy is 2.3–3.8.
At total strains in the range from τ0.3 to τ0.3(IV), the accumulated plastic strain in the abc pressed alloy is 2.4–4.7%. Hence, stage III represents strain hardening.
After isothermal torsional loading to τ0.3 and unloading at 295 K with further heating to 500 K, the degree of shape recovery in the TiNi alloy is 93–96% both in its initial state and in its states after abc pressing with different true strains e. The total inelastic strain γSID in such TiNi specimens is no greater than ~7% and is mostly due to the component γSME while the component γSE approximates the elastic strain and measures ~1.5%. As the applied stress is increased from τ0.3 to τ0.3(IV), the degree of shape recovery in the TiNi specimens after loading, unloading, and heating decreases to 74–85% while the total reversible inelastic strain grows to 14–15% of which 10–11% is recovered via heating (shape memory effect) and ~4% via unloading (superelasticity). Thus, at τ0.3(IV), both components γSME and γSE increase, but γSE remains much lower than γSME. Such plastically deformed specimens with high inelastic strain recovery may be useful for manufacture of functional elements with shape memory.
Reasoning from this study and studies reported elsewhere [14,16,35], we can conclude that the ratio τ0.3(IV)/τ0.3 in alloys with martensite transformations is widely variable: in hardened specimens, the yield stress τ0.3 can approximate τ0.3(IV), and its value in more plastic specimens can be much lower than τ0.3(IV). By and large, the yield stress τ0.3 and the total strain γt(0.3) for its reach should be assessed by jointly analyzing of “stress–strain” and “plastic strain–total strain” dependences.
Author Contributions
Conceptualization: A.L., V.G.; formal analyses: A.L., V.G., A.B.; Investigations, V.G., D.Z., V.T.; methodology: A.L., V.G.; project administration: A.L., V.G.; supervision: A.L., V.G., A.B., V.T.; validation: A.L., V.G., V.T.; writing—original draft: V.G.
Funding
The work was supported by Fundamental Research Program of the State Academies of Sciences for 2013–2020 (priority direction III.23).
Conflicts of Interest
The authors declare no conflict of interest. The sponsors had no role in the design, execution, interpretation, or writing of the study
References
- Perkins, J.; Edwards, G.R.; Such, C.R.; Johnson, J.M.; Alten, R.R. Thermomechanical characteristics of alloys exhibiting martensitic thermoelasticity. In Shape Memory Effects in Alloys, 1st ed.; Perkins, J., Ed.; Plenum Press: New York, NY, USA, 1975; pp. 273–303. [Google Scholar]
- Otsuka, K.; Shimizu, K.; Suzuki, Y.; Sekiguchi, Y.; Tadaki, K.; Honma, Т.; Miyazaki, S. Shape Memory Alloys; Funakubo, H., Ed.; Gordon and Breach Science: New York, NY, USA, 1987; pp. 41–73. [Google Scholar]
- Atli, K.C.; Karaman, I.; Noebe, R.D.; Garg, A.; Chumlyakov, Y.I.; Kireeva, I.V. Shape memory characteristics of Ti49.5Ni25Pd25Sc0.5 high-temperature shape memory alloys after severe plastic deformation. Acta Mater. 2011, 59, 4747–4760. [Google Scholar] [CrossRef]
- Kockar, B.; Karaman, I.; Kim, J.I.; Chumlyakov, Y.I.; Sharp, J.; Yu, C.-J. (Mike) Thermomechanical cyclic response of an ultrafine-grained NiTi shape memory alloy. Acta Mater. 2008, 56, 3630–3646. [Google Scholar] [CrossRef]
- Otsuka, K.; Ren, X. Physical metallurgy of Ti-Ni-based shape memory alloy. Prog. Mater. Sci. 2005, 50, 511–678. [Google Scholar]
- Titanium Nickelide Alloys with Shape Memory. Part 1. Structure, Phase Transitions, and Properties; Pushin, V.G., Ed.; UB RAS: Ekaterinburg, Russia, 2006; pp. 72–169. [Google Scholar]
- Brailovski, V.; Prokoshkin, S.; Terriault, P.; Trochu, F. Shape Memory Alloys: Fundamentals, Modeling and Applications; ETS Publ.: Montreal, QC, Canada, 2003; pp. 158–601. [Google Scholar]
- Valiev, R.Z.; Aleksandrov, I.V. Bulk Nonstructural Metal Materials: Production, Structure and Properties; Akademkniga: Moscow, Russia, 2007; pp. 55–349. [Google Scholar]
- Gunderov, D.; Lukyanov, A.; Prokofiev, E.; Kilmametov, A.; Pushin, V.; Valiev, R.Z. Mechanical properties and martensitic transformations in nanocrystalline Ti49.4Ni50.6 alloy produced by high-pressure torsion. Mater. Sci. Eng. A 2009, 503, 75–77. [Google Scholar] [CrossRef]
- Lotkov, A.I.; Grishkov, V.N.; Dudarev, E.F.; Girsova, N.V.; Tabachenko, A.N. The formation of ultrafine-grained state, martensitic transformations and inelastic properties of titanium nickelide after “abc”-pressing. Vopr. Mater. 2008, 1, 161–165. [Google Scholar]
- Nakayama, K.; Tsuchiya, K.; Umemoto, M. Crystal refinement and amorphization by cold rolling. JMNM 2003, 15–16, 283–288. [Google Scholar] [CrossRef]
- Mohamed, H.A.; Washburn, J. Deformation behaviour and shape memory effect of near-equiatomic NiTi alloy. J. Mater. Sci. 1977, 12, 469–480. [Google Scholar] [CrossRef]
- Hornbogen, E. Ausforming of NiTi. J. Mater. Sci. 1999, 34, 599–606. [Google Scholar] [CrossRef]
- Sehitoglu, H.; Jun, J.; Zhang, X.; Karaman, I. Shape memory and pseudoelastic behavior of 51.5%Ni–Ti single crystals in solutionized and overaged state. Acta Mater. 2001, 49, 3609–3620. [Google Scholar] [CrossRef]
- Prokoshkin, S.D.; Brailovski, V.; Inaekyan, K.E.; Demerus, V.; Khmelevskaya, I.Yu.; Dobatkin, S.V.; Tatyanin, E.V. Structure and Properties of Severely Cold-Rolled and Annealed Ti-Ni Shape Memory Alloys. Mater. Sci. Eng. A 2008, 481–482, 114–118. [Google Scholar] [CrossRef]
- Karaman, I.; Karaca, H.E.; Luo, Z.P.; Maier, H.J. The effect of severe marforming on shape memory characteristics of a Ti-rich NiTi alloy processed using equal channel angular extrusion. Metall. Mater. Trans. A 2003, 34, 2527–2539. [Google Scholar] [CrossRef]
- Gunderov, D.V.; Prokofiev, E.A; Pushin, V.G.; Valiev, R.Z. On the nature of high strength and plasticity in ultrafine-grained TiNi produced by equal channel angular pressing. Deform. Razrush. Mater. 2007, 10, 13–21. [Google Scholar]
- Pushin, V.G.; Lotkov, A.I.; Kolobov, Yu.R.; Valiev, R.Z.; Dudarev, E.F.; Kuranova, N.N.; Dyupin, A.P.; Gunderov, D.V.; Bakach, G.P. On the Nature of Anomalously High Plasticity of High-Strength Titanium Nickelide Alloys with Shape-Memory Effects: I. Initial Structure and Mechanical Properties. Phys. Met. Metallogr. 2008, 106, 520–530. [Google Scholar] [CrossRef]
- Pops, H. Stress-Induced Pseudoelasticity in Ternary Cu-Zn Based Beta Prime Phase Alloys. Met. Trans. 1970, 1, 251–258. [Google Scholar]
- Warlimont, H.; Delay, L. Martensitic Transformation in Cooper-, Silver- and Gold-Based Alloys; Pergamon: Oxford, UK, 1974; pp. 113–135. [Google Scholar]
- Wayman, C.M.; Duerig, T.W. An Introduction to Martensite and Shape Memory. In Engineering Aspects of Shape Memory Alloys, 1st ed.; Wayman, C.M., Duerig, T.W., Eds.; Butterworth-Heineman: London, UK, 1990; pp. 3–20. [Google Scholar]
- Cross, W.B.; Kariotis, A.H.; Stimler, F.J. Nitinol Characterization Study; NASA: Langley, USA, 1969; CR-1433; pp. 1–60.
- Wasilewski, R.J. The shape memory effect in TiNi: one aspect of stress-assisted martensitic transformation. In Shape Memory Effects in Alloys, 1st ed.; Perkins, J., Ed.; Plenum Press: New York, NY, USA, 1975; pp. 245–270. [Google Scholar]
- Melton, K.N.; Mercier, O. Deformation Behavior of NiTi-Based Alloys. Met. Trans. A 1970, 9A, 1487–1488. [Google Scholar] [CrossRef]
- Miyazaki, S.; Otsuka, K.; Suzuki, Y. Transformation pseudoelasticity and deformation behavior in Ti-50.6at%Ni alloy. Scripta Metall. 1981, 15, 287–292. [Google Scholar] [CrossRef]
- Piao, M.; Otsuka, K.; Miyazaki, S.; Horikawa, H. Mechanism of the AS temperature increase by pre-deformation in thermoelastic alloys. Mater. Trans. 1993, 34, 919–929. [Google Scholar] [CrossRef]
- Roumagnac, P.; Guillemer-Neel, C.; Saanouni, K.; Clavel, M. Mechanical behavior and deformation mechanisms of Ni-Ti shape memory alloys in tension. Eur. Phys. J. 2000, AP10, 109–122. [Google Scholar]
- Lu, Y.; Xie, Z.; Humbeeck, J.V.; Delay, L.; Liu, Y. On the deformation of the twined domain in NiTi shape memory alloys. Phil. Mag. A 2000, 80, 1935–1953. [Google Scholar] [CrossRef]
- Tan, G.; Liu, Y. Comparative study of deformation-induced martensite stabilization via martensitic reorientation transformation in NiTi. Intermetallics 2004, 12, 373–381. [Google Scholar] [CrossRef]
- Zang, J.X.; Sato, M.; Ishida, A. Deformation mechanism of martensite in Ti-rich Ti-Ni shape memory alloy thin films. Acta Mater. 2006, 54, 1185–1198. [Google Scholar] [CrossRef]
- Liu, Y.; Tan, G.; Miyazaki, S. Deformation-induced martensite stabilization in [100] single-crystalline Ni-Ti. Mater. Sci. Eng. A 2006, 438–440, 612–616. [Google Scholar] [CrossRef]
- Surikova, N.S.; Evtushenko, O.V.; Pavlyuk, V.A. Strain localization and temperature dependence of yield stress in TiNi-based single crystals. Phys. Mesomech. 2010, 1–2, 96–102. [Google Scholar] [CrossRef]
- Ezaz, T.; Wang, J.; Sehitoglu, H.; Maier, H.J. Plastic deformation of NiTi shape memory alloys. Acta Mater. 2012, 61, 67–78. [Google Scholar] [CrossRef]
- Tadayyon, G.; Guo, Y.; Mazinani, M.; Zebarjad, S.M.; Tiernan, P.; Tofail, S.A.M.; Biggs, M.J.P. Effect of different stages of deformation on microstructure evolution of Ti-rich NiTi shape memory alloy. Mater. Charact. 2017, 125, 51–66. [Google Scholar] [CrossRef]
- Lotkov, A.; Grishkov, V.; Timkin, V.; Baturin, A.; Zhapova, D. Yield stress in titanium nickelide-based alloys with thermoelastic martensitic transformations. Mater. Sci. Eng. A 2019, 744, 74–78. [Google Scholar] [CrossRef]
- Lotkov, A.I.; Kashin, O.A.; Grishkov, V.N.; Krukovskii, K.V. The influence of degree of deformation under isothermal abc pressing on evolution of structure and temperatures of phase transformations of alloy based on titanium nickelide. Inorg. Mater. Appl. Res. 2015, 6, 96–104. [Google Scholar] [CrossRef]
- Prokoshkin, S.; Dubinskiy, S.; Brailovski, V.; Korotitskiy, A.; Sheremetyev, S.; Blinova, E. Nanostructures and stress-induced phase transformation mechanism in titanium nickelide annealed after moderate cold deformation. Mater. Lett. 2017, 192, 111–114. [Google Scholar] [CrossRef]
- Lotkov, A.; Grishkov, V.; Zhapova, D.; Timkin, V.; Baturin, A.; Kashin, O. Superelasticity and shape memory effect after warm abc-pressing of TiNi-based alloy. In Proceedings of the 2nd Conference on Shape Memory Alloys, SMA 2016, St Petersburg State University, St Petersburg, Russia, 20–23 September 2016; Belyaev, S., Prokoshkin, S., Razov, A., Volkov, A., Resnina, N., Eds.; Mater. Today Proc.: Amsterdam, The Netherlands, 2017. 4 (3PB). pp. 4814–4818. [Google Scholar]
Figure 1.
Schematic stress–strain diagram with stages I–IV at temperatures Td < Md for alloys with martensitic transformations: σM, τM: martensitic shear stresses; σ0.2(IV), τ0.3(IV): critical stresses are equal to yield stress σ0.2, τ0.3 (according to [1,3,4,12,13,14,15,16,17,18]).

Figure 2.
The accumulation and recovery of strain in isothermal (Td = 295 K) cycle “τ-γ” and during the subsequent heating of unloaded specimens (scheme).
Figure 2.
The accumulation and recovery of strain in isothermal (Td = 295 K) cycle “τ-γ” and during the subsequent heating of unloaded specimens (scheme).

Figure 3.
Engineering stress–strain diagrams in torsion at 295 K for Ti49.8Ni50.2 before (1) and after warm abc pressing at 723 K with true strains e = 1.8 (2) and e = 8.4 (3).
Figure 3.
Engineering stress–strain diagrams in torsion at 295 K for Ti49.8Ni50.2 before (1) and after warm abc pressing at 723 K with true strains e = 1.8 (2) and e = 8.4 (3).

Figure 4.
Martensite shear stress τM vs. true strain e in T49.8Ni50.2 in torsion at 295 K.

Figure 5.
Plastic strain γpl vs. total strain γt in torsion at 295 K for Ti49.8Ni50.2 before (●) and after abc pressing with e equal to 0.6 (■), 1.8 (△), 4.2 (☐), 6.4 (✚), and 8.4 (▲).
Figure 5.
Plastic strain γpl vs. total strain γt in torsion at 295 K for Ti49.8Ni50.2 before (●) and after abc pressing with e equal to 0.6 (■), 1.8 (△), 4.2 (☐), 6.4 (✚), and 8.4 (▲).

Figure 6.
Yield stress τ0.3 and critical stress τ0.3(IV) in torsion at 295 K for Ti49.8Ni50.2 after abc pressing with different true strains e.
Figure 6.
Yield stress τ0.3 and critical stress τ0.3(IV) in torsion at 295 K for Ti49.8Ni50.2 after abc pressing with different true strains e.

Figure 7.
Total strains γt(0.3) and γt(IV) at which τ0.3 and τ0.3(IV) are reached in Ti49.8Ni50.2 after warm abc pressing with different true strains e.
Figure 7.
Total strains γt(0.3) and γt(IV) at which τ0.3 and τ0.3(IV) are reached in Ti49.8Ni50.2 after warm abc pressing with different true strains e.

Figure 8.
Plastic strain γpl(IV) corresponding to τ0.3(IV) early in stage IV in torsion at 295 K for Ti49.8Ni50.2 after abc pressing with different true strains e.
Figure 8.
Plastic strain γpl(IV) corresponding to τ0.3(IV) early in stage IV in torsion at 295 K for Ti49.8Ni50.2 after abc pressing with different true strains e.

Figure 9.
Total reversible inelastic strain γSID(τ0.3) recovered by Ti49.8Ni50.2 after torsion with τ = τ0.3 (295 K) and heating (500 K) at different true strains e specified in warm abc pressing. Residual plastic strains γpl = 0.3%.
Figure 9.
Total reversible inelastic strain γSID(τ0.3) recovered by Ti49.8Ni50.2 after torsion with τ = τ0.3 (295 K) and heating (500 K) at different true strains e specified in warm abc pressing. Residual plastic strains γpl = 0.3%.

Figure 10.
Total reversible inelastic strain γSID(IV) recovered by Ti49.8Ni50.2 after torsion with τ = τ0.3(IV) (295 K) and heating (500 K) at different true strains e specified in warm abc pressing.
Figure 10.
Total reversible inelastic strain γSID(IV) recovered by Ti49.8Ni50.2 after torsion with τ = τ0.3(IV) (295 K) and heating (500 K) at different true strains e specified in warm abc pressing.

Figure 11.
The degree of shape recovery η0.3 at τ0.3 and η0.3(IV) at τ0.3(IV) in Ti49.8Ni50.2 in isothermal loading–unloading cycles (295 K) with heating in unloaded states (500 K) as a function of the true strain e in warm abc pressing.
Figure 11.
The degree of shape recovery η0.3 at τ0.3 and η0.3(IV) at τ0.3(IV) in Ti49.8Ni50.2 in isothermal loading–unloading cycles (295 K) with heating in unloaded states (500 K) as a function of the true strain e in warm abc pressing.

Figure 12.
Reversible inelastic strains γSE(0.3) and γSME(0.3) at τ0.3, and γSE(IV) and γSME(IV) at τ0.3(IV) in Ti49.8Ni50.2 in isothermal loading–loading cycles (295 K) with heating in unloaded states (500 K) as a function of the true strain e in warm abc pressing.
Figure 12.
Reversible inelastic strains γSE(0.3) and γSME(0.3) at τ0.3, and γSE(IV) and γSME(IV) at τ0.3(IV) in Ti49.8Ni50.2 in isothermal loading–loading cycles (295 K) with heating in unloaded states (500 K) as a function of the true strain e in warm abc pressing.

© 2019 by the authors. Licensee MDPI, Basel, Switzerland. This article is an open access article distributed under the terms and conditions of the Creative Commons Attribution (CC BY) license (http://creativecommons.org/licenses/by/4.0/).
Share and Cite
MDPI and ACS Style
Lotkov, A.; Grishkov, V.; Baturin, A.; Timkin, V.; Zhapova, D. Yield Stress and Reversible Strain in Titanium Nickelide Alloys after Warm Abc Pressing. Materials 2019, 12, 3258. https://0-doi-org.brum.beds.ac.uk/10.3390/ma12193258
AMA Style
Lotkov A, Grishkov V, Baturin A, Timkin V, Zhapova D. Yield Stress and Reversible Strain in Titanium Nickelide Alloys after Warm Abc Pressing. Materials. 2019; 12(19):3258. https://0-doi-org.brum.beds.ac.uk/10.3390/ma12193258
Chicago/Turabian StyleLotkov, Aleksander, Victor Grishkov, Anatoly Baturin, Victor Timkin, and Dorzhima Zhapova. 2019. "Yield Stress and Reversible Strain in Titanium Nickelide Alloys after Warm Abc Pressing" Materials 12, no. 19: 3258. https://0-doi-org.brum.beds.ac.uk/10.3390/ma12193258
Note that from the first issue of 2016, this journal uses article numbers instead of page numbers. See further details here.