Influence of Pseudowollastonite on the Performance of Low Calcium Amorphous Hydraulic Binders

 ,
,  and
and
Abstract
:
1. Introduction
2. Materials and Methods
3. Results
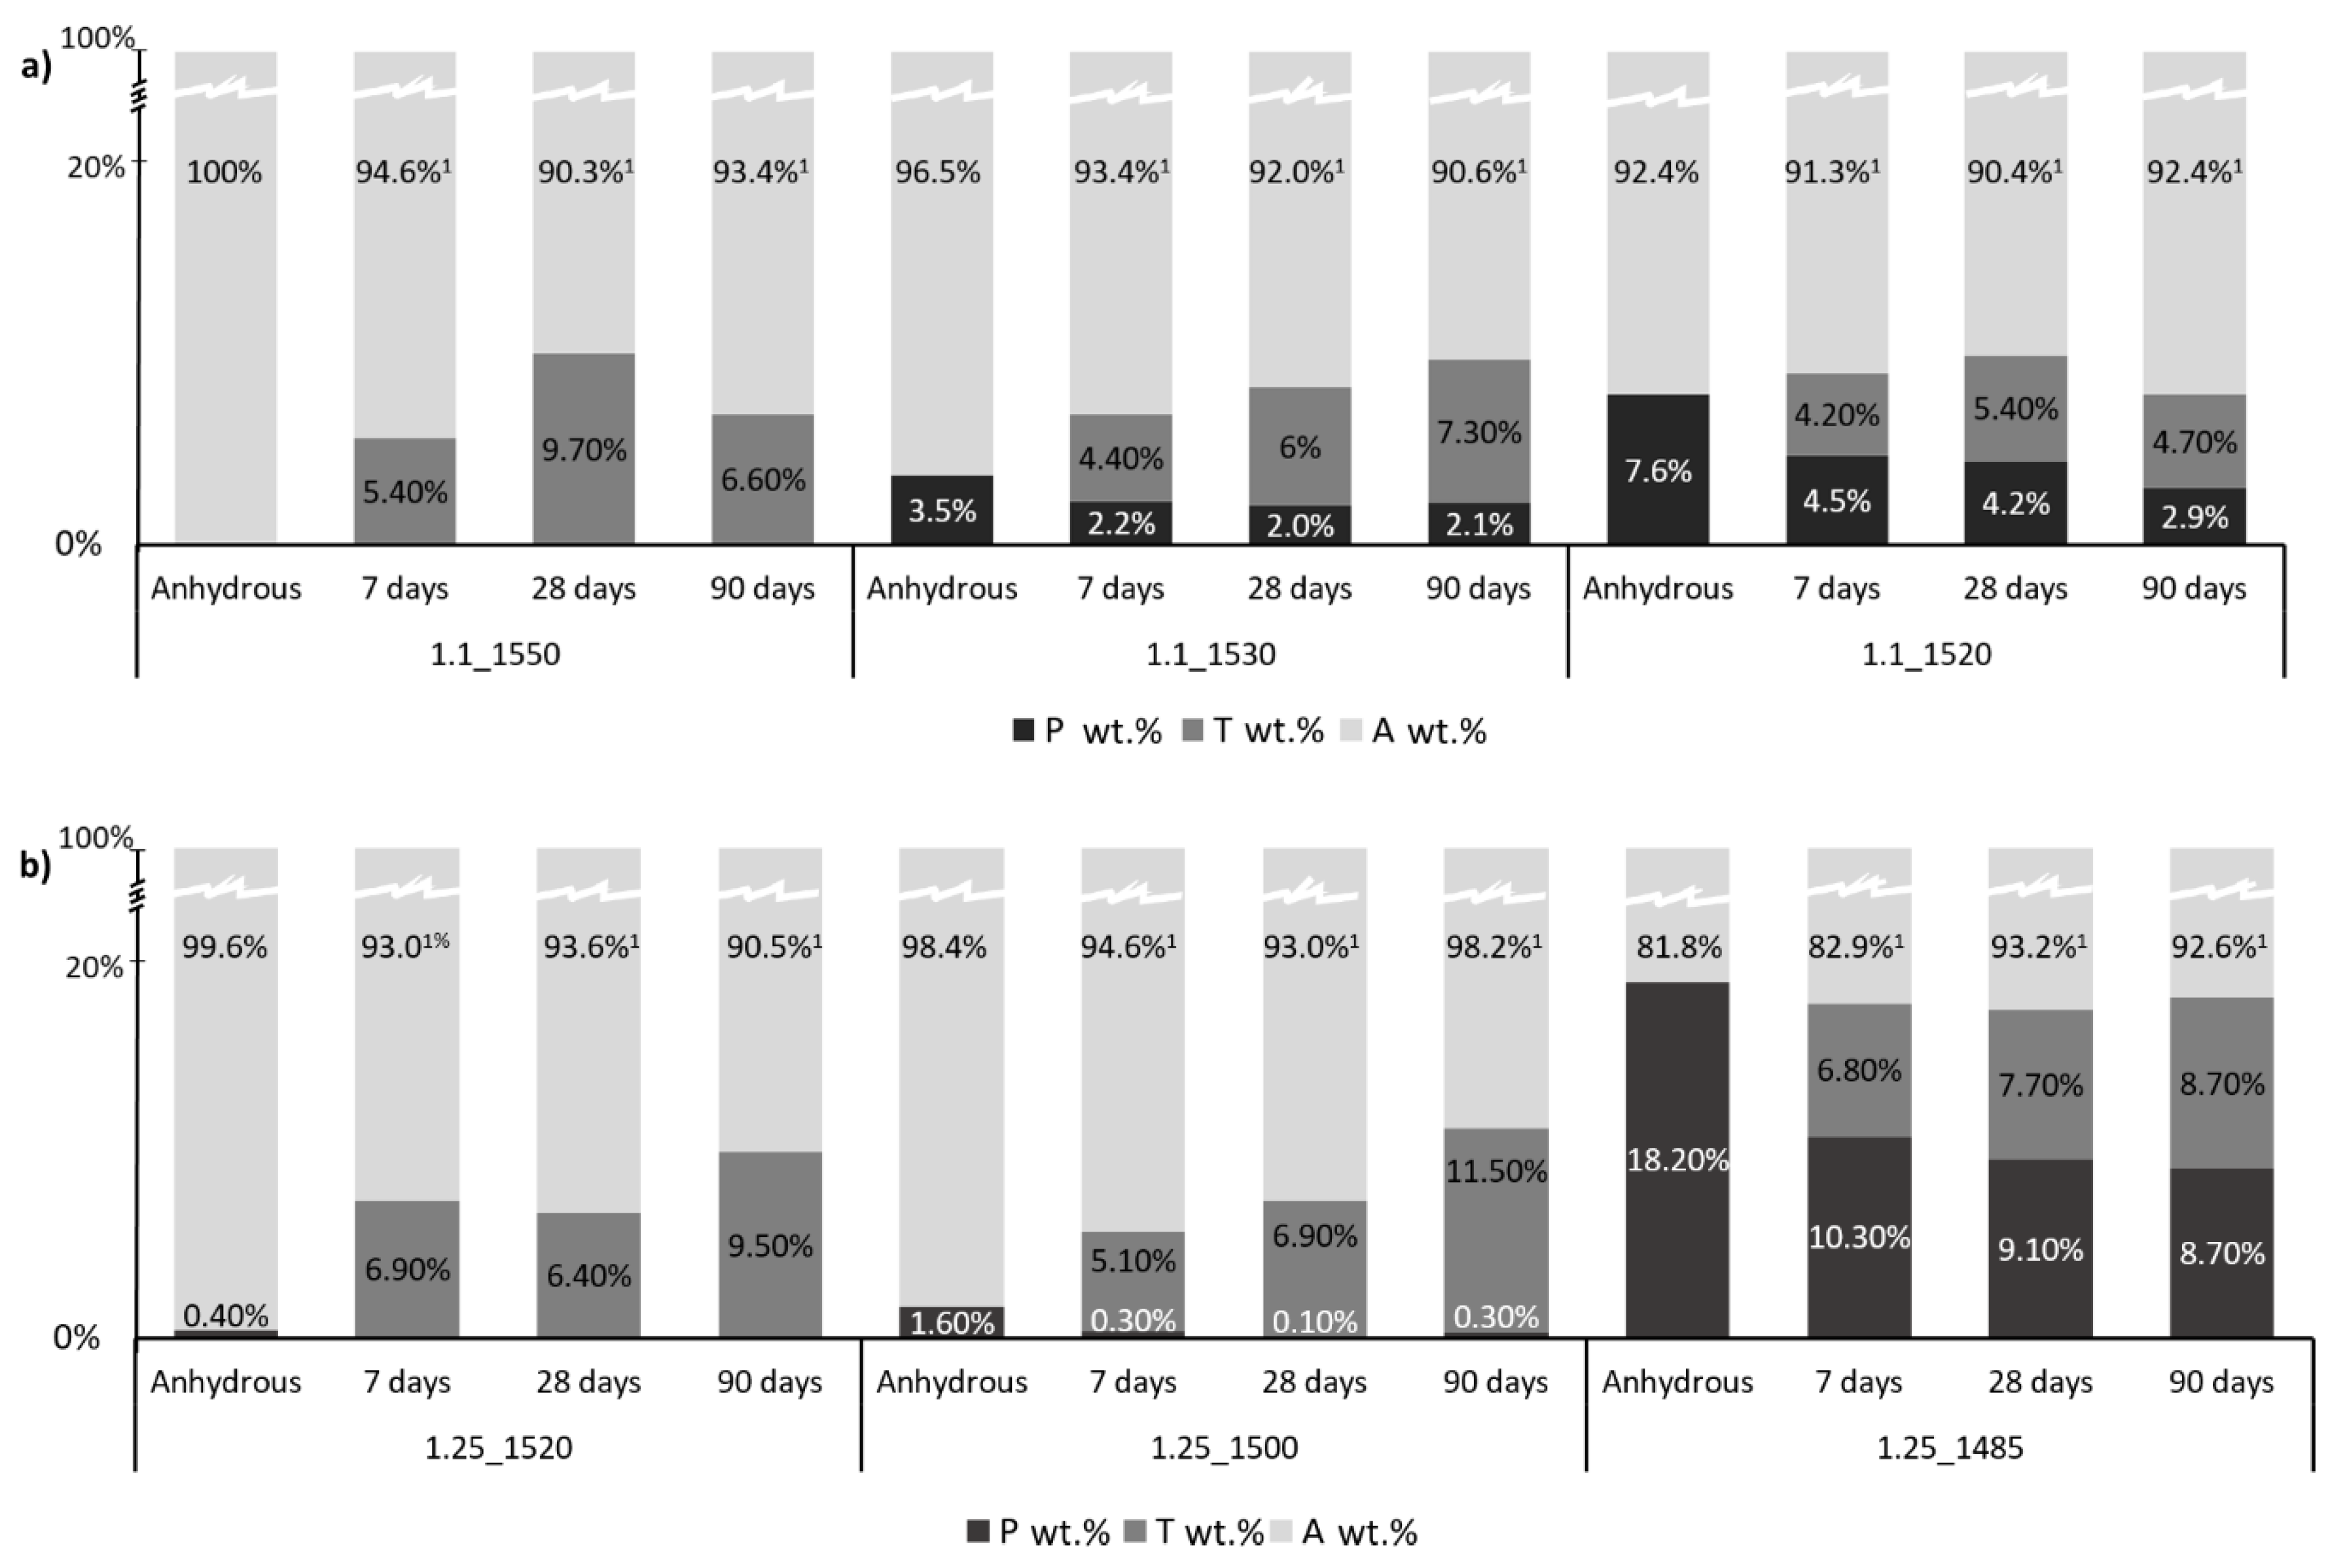
3.1. XRD/Rietveld
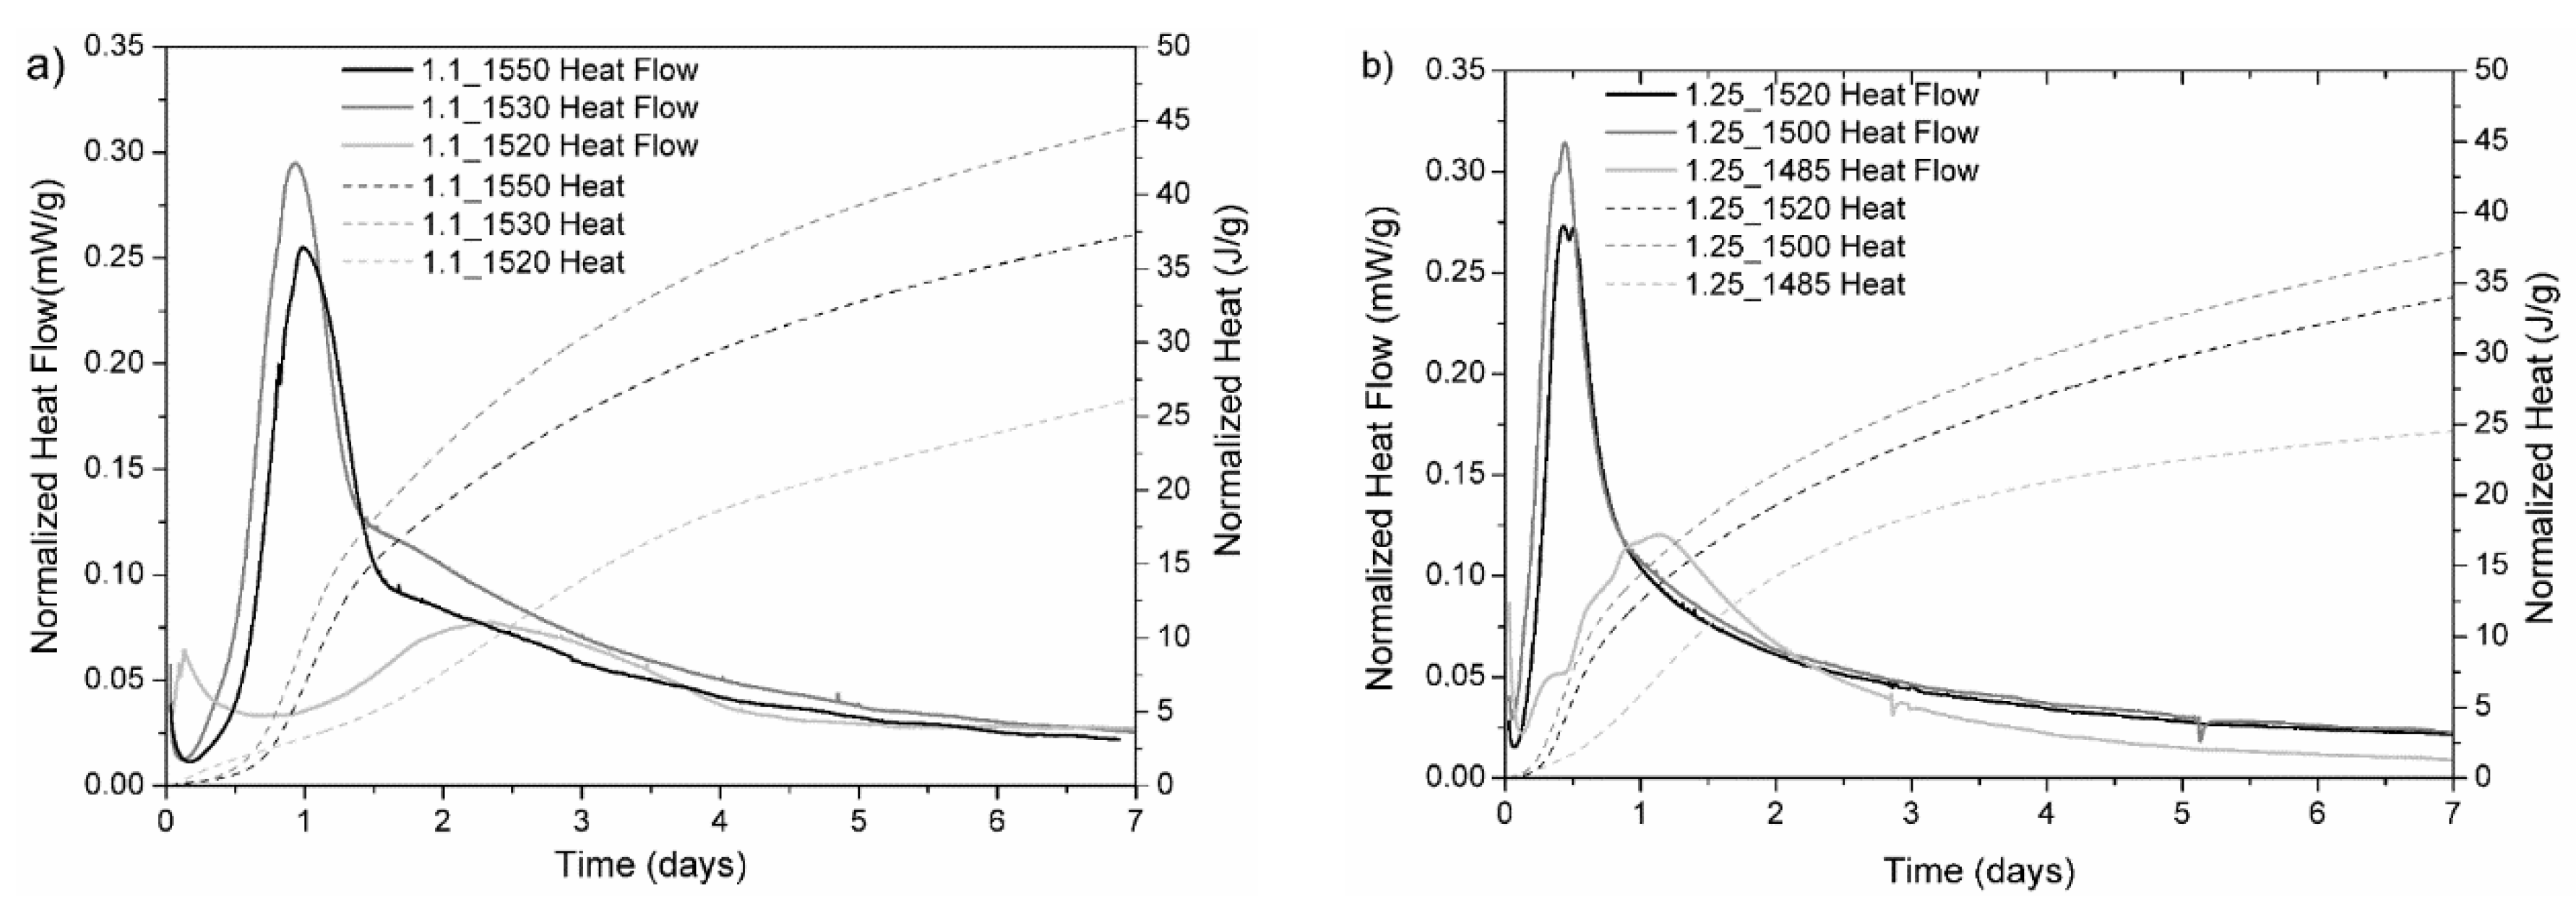
3.2. Isothermal Calorimetry
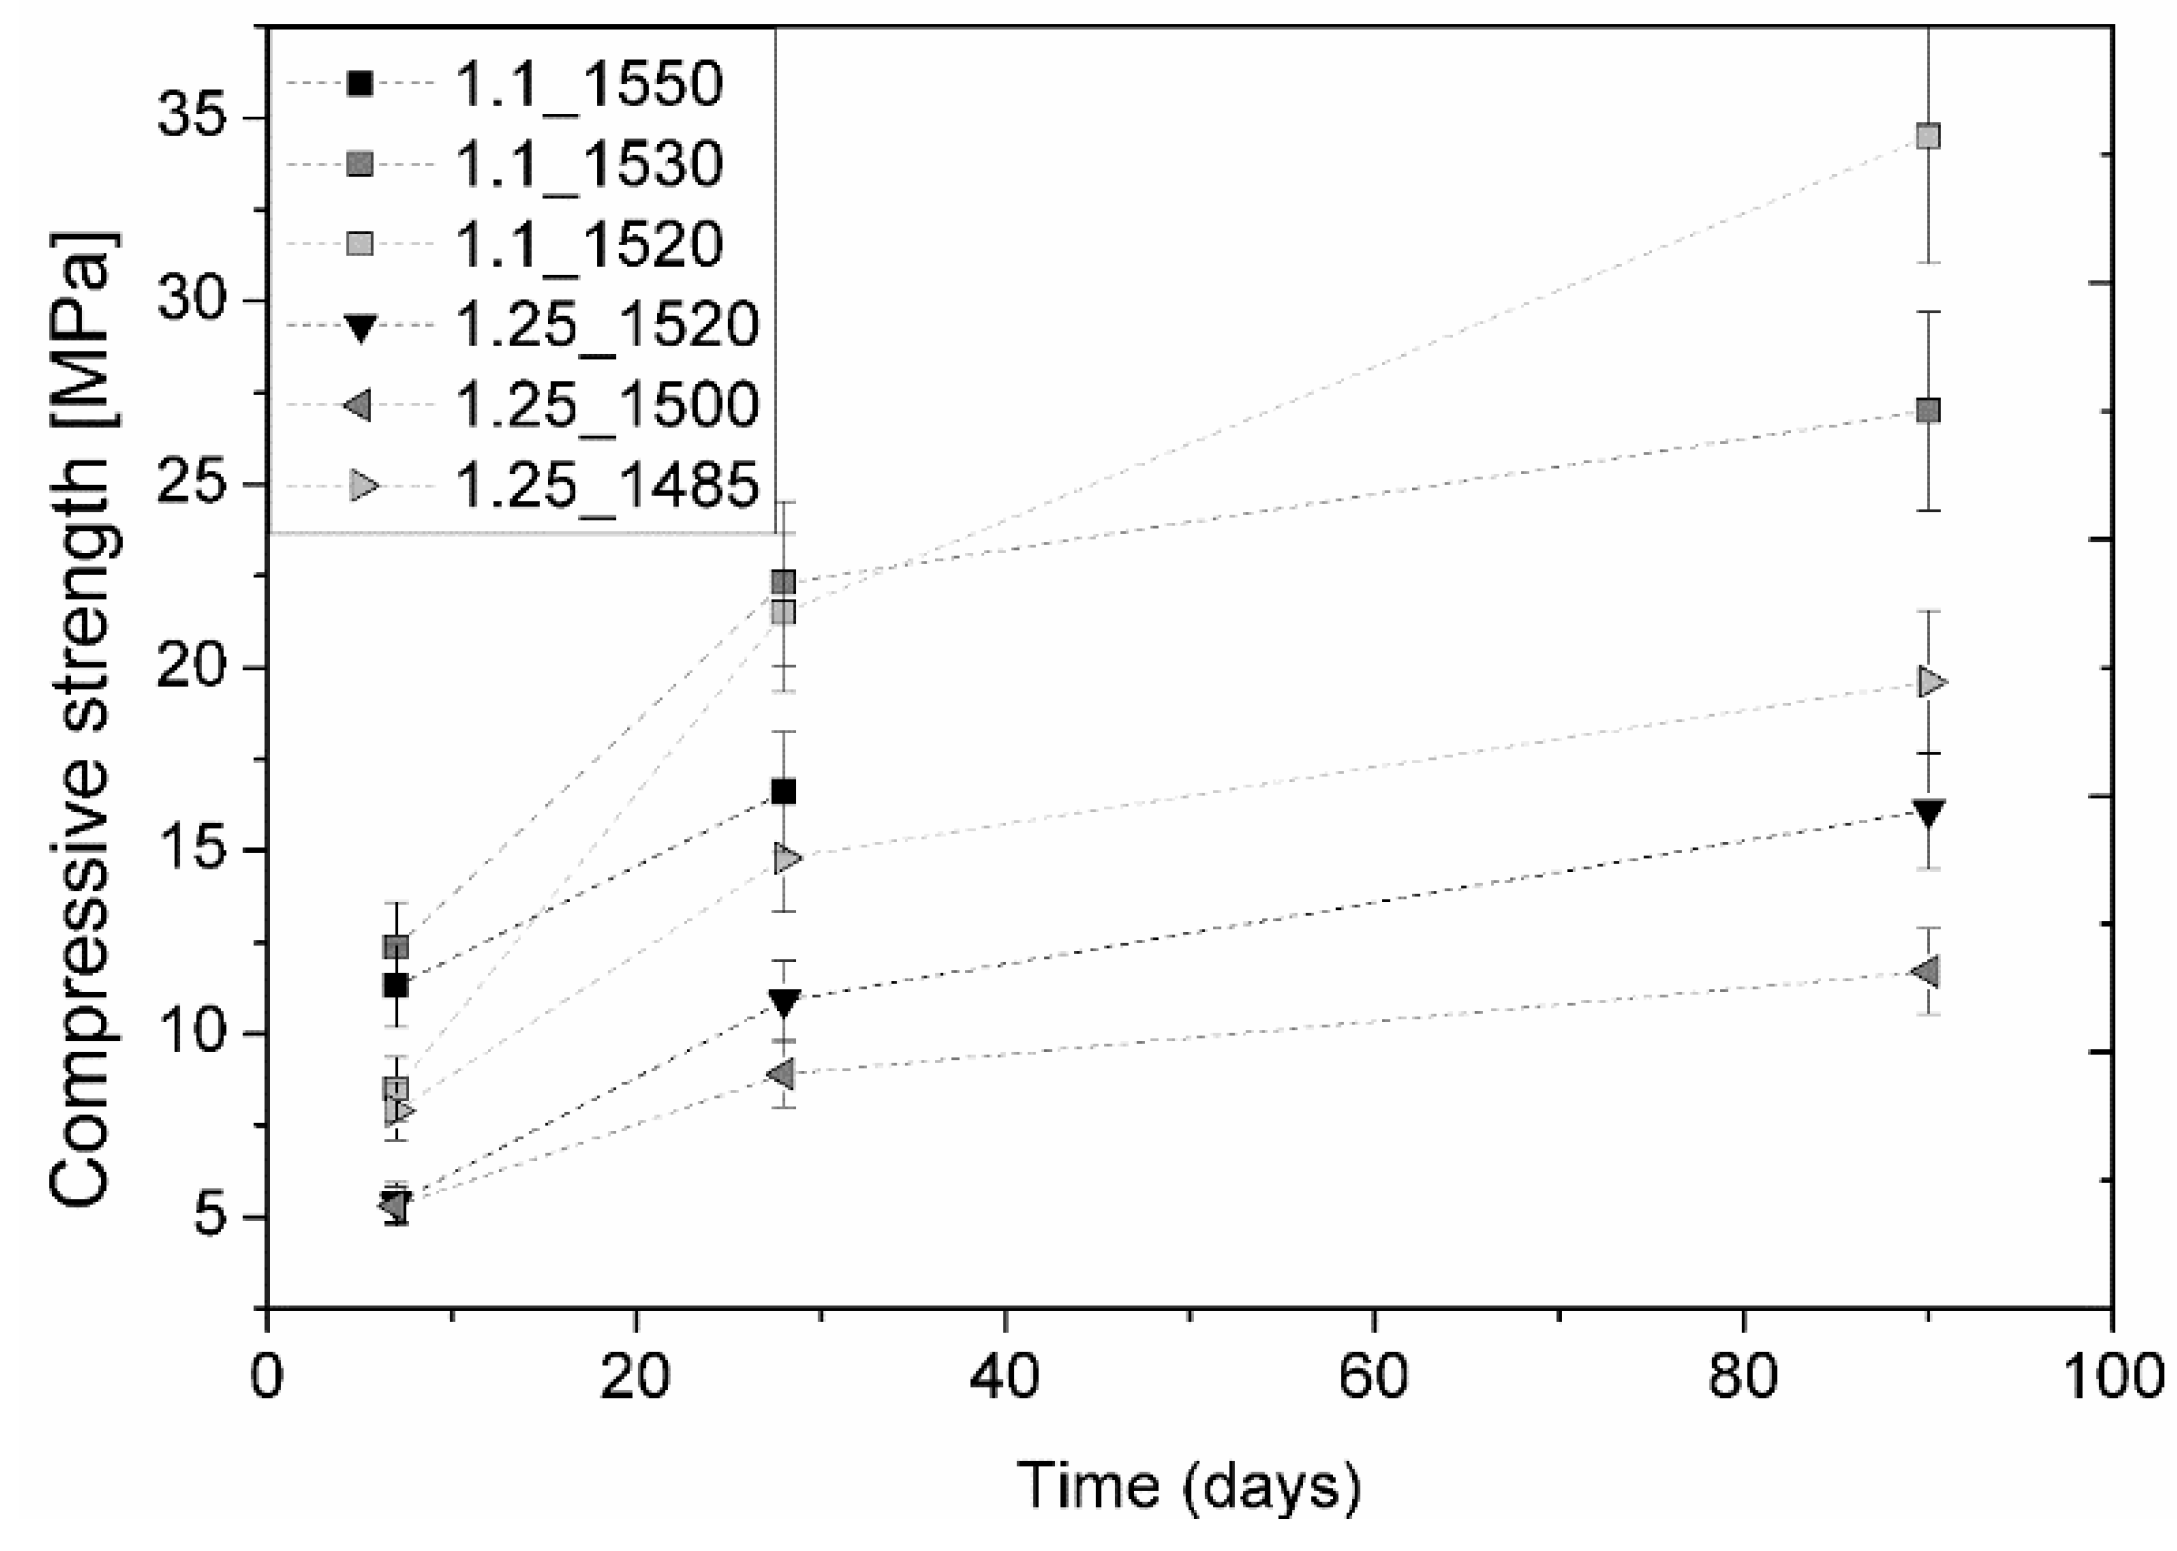
3.3. Compressive Strength
3.4. Thermogravimetry Analysis (TGA)
3.5. Scanning Electron Microscopy (SEM)
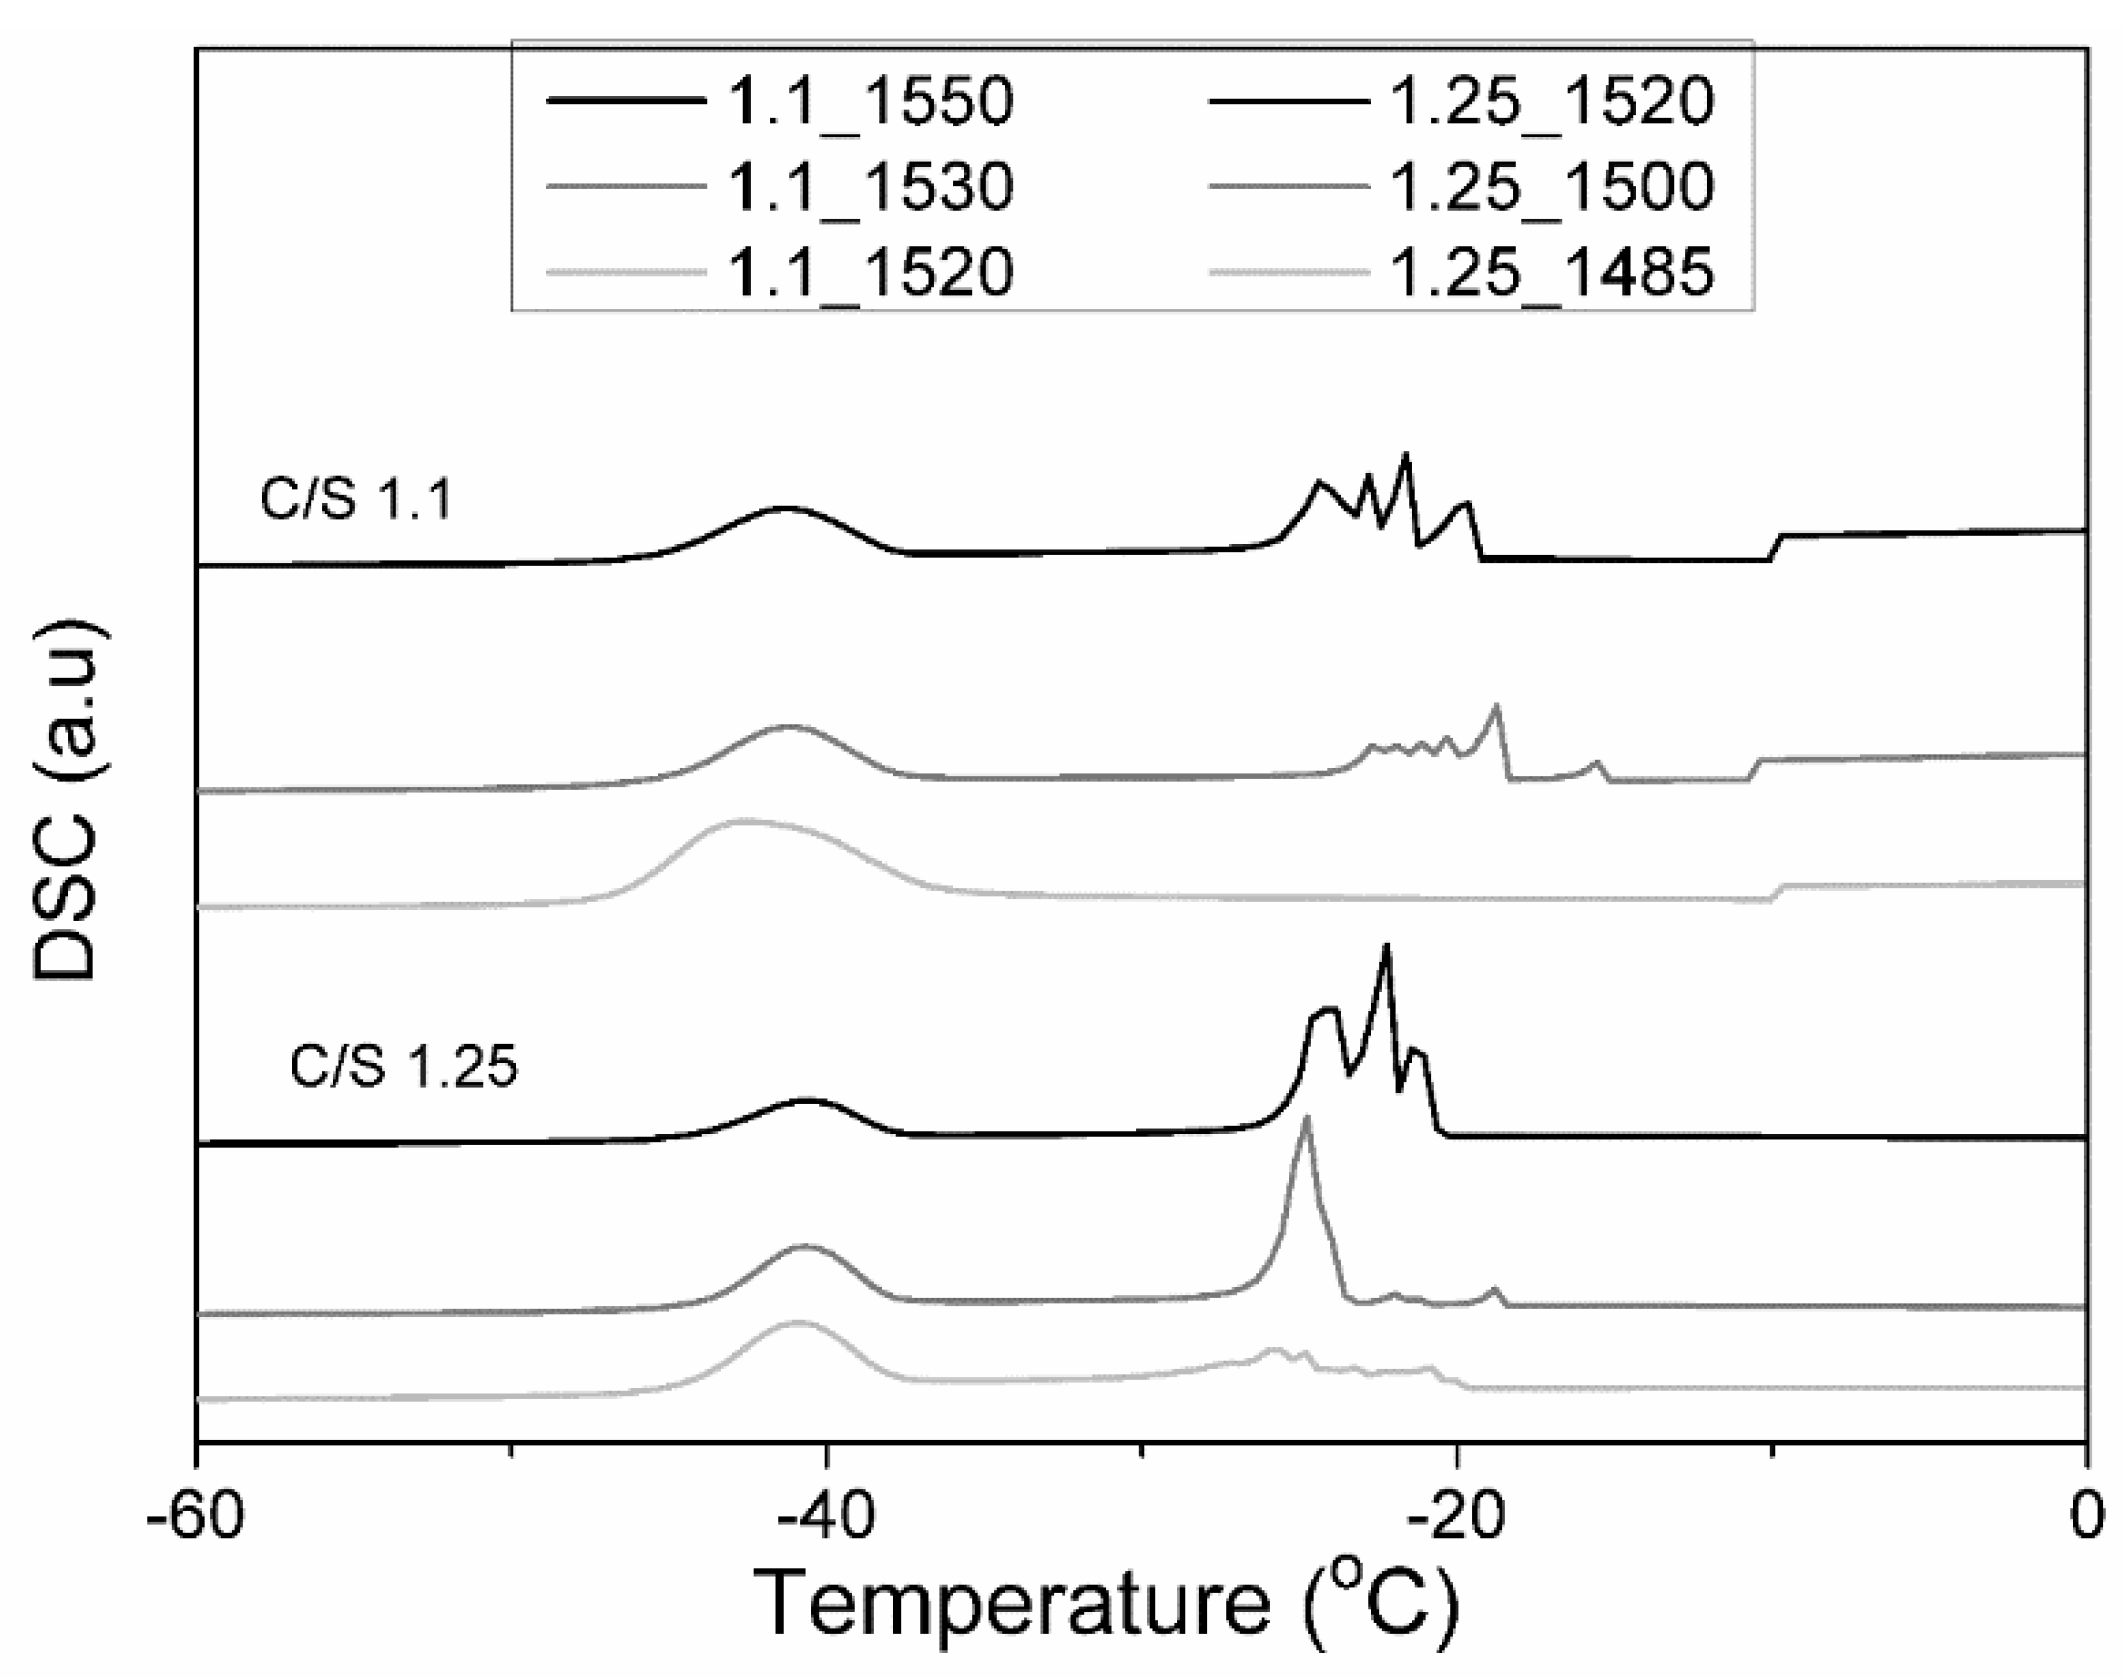
3.6. Low-Temperature Differential Scanning Calorimetry (LT-DSC)
4. Discussion
5. Conclusions
Author Contributions
Funding
Acknowledgments
Conflicts of Interest
References
- Martin Moeller, G.; Cohen, J.L. Liquid Stone: New Architecture in Concrete, 1st ed.; Birkhäuser: Basel, Switzerland, 2006. [Google Scholar]
- Hasanbeigi, A.; Price, L.; Lin, E. Emerging energy-efficiency and CO2 emission-reduction technologies for cement and concrete production: A technical review. Renew. Sustain. Energy Rev. 2012, 16, 6220–6238. [Google Scholar] [CrossRef]
- Walenta, G.; Comparet, C.; Morin, V.; Gartner, E. Hydraulic Binder with a Base of Sulfoaluminate Clinker and Portland Clinker. U.S. Patent No. 8177903, 15 May 2012. [Google Scholar]
- Walenta, G.; Comparet, C.; Morin, V. Industrial Process for the Production of a Clinker with a High Content of Belite. U.S. Patent 8,852,339, 12 April 2012. [Google Scholar]
- Cangiano, S.; Princigallo, A. Hydraulic Binder Comprising a Ground Blast Furnace Slag. World Intellectual Property organization. International Publication Nr WO2011064378 A1, 03 June 2011. [Google Scholar]
- Habert, G. 10—Assessing the environmental impact of conventional and ‘green’ cement production. In Eco-Efficient Construction and Building Materials; Pacheco-Torgal, F., Cabeza, L.F., Labrincha, J., de Magalhães, A., Eds.; Woodhead Publishing: Cambridge, UK, 2014; pp. 199–238. [Google Scholar]
- Stemmermann, P.; Schweike, U.; Garbev, K.; Beuchle, G.; Möller, H. Celitement—A sustainable prospect for the cement industry. Cem. Int. 2010, 8, 52–66. [Google Scholar]
- Horta, R.S.B.; Colaço, R.A.C.; Lopes, J.N.A.C.; dos Santos, R.L.; Pereira, J.C.; da Rocha e Silva, P.J.P.; Lebreiro, S.M.M. Dendritic Belite Based Hydraulic Binders and Methods for Their Manufacturing. World Intellectual Property organization, International Publication Nr WO2016118029 A1, 28 July 2016. [Google Scholar]
- Horta, R.S.B.; Colaço, R.A.C.; Lopes, J.N.A.C.; dos Santos, R.L.; Pereira, J.C.; da Rocha e Silva, P.J.P.; Lebreiro, S.M.M. Amorphous Low-Calcium Content Silicate Hydraulic Binders and Methods for Their Manufacturing. U.S. Patent 10,414,690, 17 September 2019. [Google Scholar]
- Santos, R.L.; Horta, R.B.; Pereira, J.; Nunes, T.G.; Rocha, P.; Lopes, J.N.C.; Colaço, R. Novel high-resistance clinkers with 1.10 CaO/SiO2 1.25: Production route and preliminary hydration characterization. Cem. Concr. Res. 2016, 85, 39–47. [Google Scholar] [CrossRef]
- Paradiso, P.; Santos, R.L.; Horta, R.B.; Lopes, J.N.C.; Ferreira, P.J.; Colaço, R. Formation of nanocrystalline tobermorite in calcium silicate binders with low C/S ratio. Acta Mater. 2018, 152, 7–15. [Google Scholar] [CrossRef]
- Santos, R.L.; Horta, R.B.; Pereira, J.; Nunes, T.G.; Rocha, P.; Colaço, R. Alkali activation of a novel calcium silicate hydraulic binder with CaO/SiO2 = 1.1. J. Am. Ceram. Soc. 2018, 101, 4158–4170. [Google Scholar] [CrossRef]
- Vedalakshmi, R.; Sundara Raj, A.; Srinivasan, S.; Ganesh Babu, K. Quantification of hydrated cement products of blended cements in low and medium strength concrete using TG and DTA technique. Thermochim. Acta 2003, 407, 49–60. [Google Scholar] [CrossRef]
- Esteves, L.P. On the hydration of water-entrained cement–silica systems: Combined SEM, XRD and thermal analysis in cement pastes. Thermochim. Acta 2011, 518, 27–35. [Google Scholar] [CrossRef]
- Ridi, F.; Luciani, P.; Fratini, E.; Baglioni, P. Water Confined in Cement Pastes as a Probe of Cement Microstructure Evolution. J. Phys. Chem. B 2009, 113, 3080–3087. [Google Scholar] [CrossRef]
- Jennings, H.J. Refinements to colloidal model of C-S-H in cement: CM-II. Cem. Concr. Res. 2008, 38, 275–289. [Google Scholar] [CrossRef]
- Snyder, K.A.; Bentz, D.P. Suspended hydration and loss of freezable water in cement pastes exposed to 90% relative humidity. Cem. Concr. Res. 2004, 34, 2045–2056. [Google Scholar] [CrossRef]
- Hoshino, S.; Yamada, K.; Hirao, H. XRD/Rietveld Analysis of the Hydration and Strength Development of Slag and Limestone Blended Cement. J. Adv. Concr. Technol. 2006, 4, 357–367. [Google Scholar] [CrossRef] [Green Version]
- Kazuhiro, M.; Fukunaga, T.; Sugiyama, M.; Iwase, K.; Oishi, K.; Yamamuro, O. Hydration properties and compressive strength development of Low Heat Cement. J. Phys. Chem. Solids 2012, 73, 1274–1277. [Google Scholar] [CrossRef]
- Abdolhosseini Qomi, M.J.; Krakowiak, K.J.; Bauchy, M.; Stewart Shahsavari, R.; Jagannathan, D.; Brommer, D.B.; Baronnet, A.; Buehler, M.J.; Yip, S.; Ulm, F.J.; et al. Combinatorial molecular optimization of cement hydrates. Nat. Commun. 2014, 5, 4960. [Google Scholar] [CrossRef] [PubMed]
- Richardson, I.G. Model structures for C-(A)-S-H(I). Acta Crystallogr. Sect. B 2014, 70, 903–923. [Google Scholar] [CrossRef] [Green Version]
- Bentz, D.; Barrett, T.; De la Varga, I.; Weiss, W. Relating Compressive Strength to Heat Release in Mortars. Adv. Civ. Eng. Mater. 2012, 1, 1–14. [Google Scholar] [CrossRef]
- Baran, T.; Pichniarczyk, P. Correlation factor between heat of hydration and compressive strength of common cement. Constr. Build. Mater. 2017, 150, 321–332. [Google Scholar] [CrossRef]
- Hu, J.; Koleva, D.A.; Ma, Y.; Schlangen, E.; van Breugel, K. Early age hydration, microstructure and micromechanical properties of cement paste modified with polymeric vesicles. J. Adv. Concr. Technol. 2013, 11, 291–300. [Google Scholar] [CrossRef]
- Vance, K.; Aguayo, M.; Dakhane, A.; Ravikumar, D.; Jain, J.; Neithalath, N. Microstructural, Mechanical, and Durability Related Similarities in Concretes Based on OPC and Alkali-Activated Slag Binders. Int. J. Concr. Struct. Mater. 2014, 8, 289–299. [Google Scholar] [CrossRef] [Green Version]
- Scrivener, K.L.; Julliand, P.; Monteiro, P.J.M. Advances in understanding hydration of Portland cement. Cem. Concr. Res. 2015, 78, 38–56. [Google Scholar] [CrossRef]
- Taylor, H.F.W. Cement Chemistry, 2nd ed.; Thomas Telford: London, UK, 1997. [Google Scholar]
- Wang, L.; Yang, H.Q.; Zhou, S.H.; Chen, E.; Tang, S.W. Mechanical properties, long-term hydration heat, shinkage behavior and crack resistance of dam concrete designed with low heat Portland (LHP) cement and fly ash. Constr. Build. Mater. 2018, 187, 1073–1091. [Google Scholar] [CrossRef]
- Barbhuiya, S.; Chow, P. Nanoscaled Mechanical Properties of Cement Composites Reinforced with Carbon Nanofibers. Materials 2017, 10, 662. [Google Scholar] [CrossRef] [PubMed]
- Ylmén, R.; Jäglid, U.; Steenari, B.-M.; Panas, I. Early hydration and setting of Portland cement monitored by IR, SEM and Vicat techniques. Cem. Concr. Res. 2009, 39, 433–439. [Google Scholar] [CrossRef]
- Vigil de la Villa, R.; Fernández, R.; Rodríguez, O.; García, R.; Villar-Cociña, E.; Frías, M. Evolution of the pozzolanic activity of a thermally treated zeolite. J. Mater. Sci. 2013, 48, 3213–3224. [Google Scholar] [CrossRef]
- Franus, W.; Panek, R.; Wdowin, M. SEM Investigation of Microstructures in Hydration Products of Portland Cement. In 2nd International Multidisciplinary Microscopy and Microanalysis Congress; Springer: Cham, Switzerland, 2015; pp. 105–112. [Google Scholar]


| C/S Molar Ratio | 1.1 | 1.25 | 0.9 | Composition (wt.%) | |||||||||
|---|---|---|---|---|---|---|---|---|---|---|---|---|---|
| Raw Materials | Wt.% | SiO2 | Al2O3 | Fe2O3 | CaO | MgO | SO3 | K2O | Na2O | TiO2 | P2O5 | ||
| Limestone | 63.78 | 66.57 | 58.97 | 0.20 | 0.16 | 0.14 | 99.11 | 0.30 | 0.04 | 0.02 | 0.04 | 0.02 | - |
| Sand | 34.97 | 32.2 | 39.74 | 96.94 | 1.29 | 0.16 | - | 0.02 | - | 0.52 | 0.11 | - | - |
| FCC | 1.25 | 1.23 | 1.29 | 39.48 | 51.39 | 0.52 | 0.13 | 0.17 | 0.09 | 0.02 | 0.48 | 0.81 | 0.22 |
| Binder | Wt.% | SiO2 | Al2O3 | Fe2O3 | CaO | MgO | SO3 | K2O | Na2O | TiO2 | P2O5 | ||
| C/S 1.1 | 100 | - | - | 47.87 | 1.59 | 0.16 | 49.26 | 0.16 | 0.02 | 0.26 | 0.08 | 0.02 | 0.00 |
| C/S 1.25 | - | 100 | - | 44.97 | 1.56 | 0.16 | 52.39 | 0.17 | 0.02 | 0.25 | 0.08 | 0.02 | 0.00 |
| C/S 0.9 | - | - | 100 | 52.86 | 1.65 | 0.16 | 44.34 | 0.15 | 0.02 | 0.29 | 0.08 | 0.02 | 0.00 |
| Sample | C/S | Maximum Temperature (°C) |
|---|---|---|
| 0.9_1550 | 0.9 | 1550 |
| 1.1_1550 | 1.1 | 1550 |
| 1.1_1530 | 1.1 | 1530 |
| 1.1_1520 | 1.1 | 1520 |
| 1.25_1520 | 1.25 | 1520 |
| 1.25_1500 | 1.25 | 1500 |
| 1.25_1485 | 1.25 | 1485 |
© 2019 by the authors. Licensee MDPI, Basel, Switzerland. This article is an open access article distributed under the terms and conditions of the Creative Commons Attribution (CC BY) license (http://creativecommons.org/licenses/by/4.0/).
Share and Cite
Santos, D.; Santos, R.L.; Pereira, J.; Bayão Horta, R.; Colaço, R.; Paradiso, P. Influence of Pseudowollastonite on the Performance of Low Calcium Amorphous Hydraulic Binders. Materials 2019, 12, 3457. https://0-doi-org.brum.beds.ac.uk/10.3390/ma12203457
Santos D, Santos RL, Pereira J, Bayão Horta R, Colaço R, Paradiso P. Influence of Pseudowollastonite on the Performance of Low Calcium Amorphous Hydraulic Binders. Materials. 2019; 12(20):3457. https://0-doi-org.brum.beds.ac.uk/10.3390/ma12203457
Chicago/Turabian StyleSantos, Daniela, Rodrigo Lino Santos, João Pereira, Ricardo Bayão Horta, Rogério Colaço, and Patrizia Paradiso. 2019. "Influence of Pseudowollastonite on the Performance of Low Calcium Amorphous Hydraulic Binders" Materials 12, no. 20: 3457. https://0-doi-org.brum.beds.ac.uk/10.3390/ma12203457