Experimental Analysis on the Influence and Optimization of μ-RUM Parameters in Machining Alumina Bioceramic


Abstract
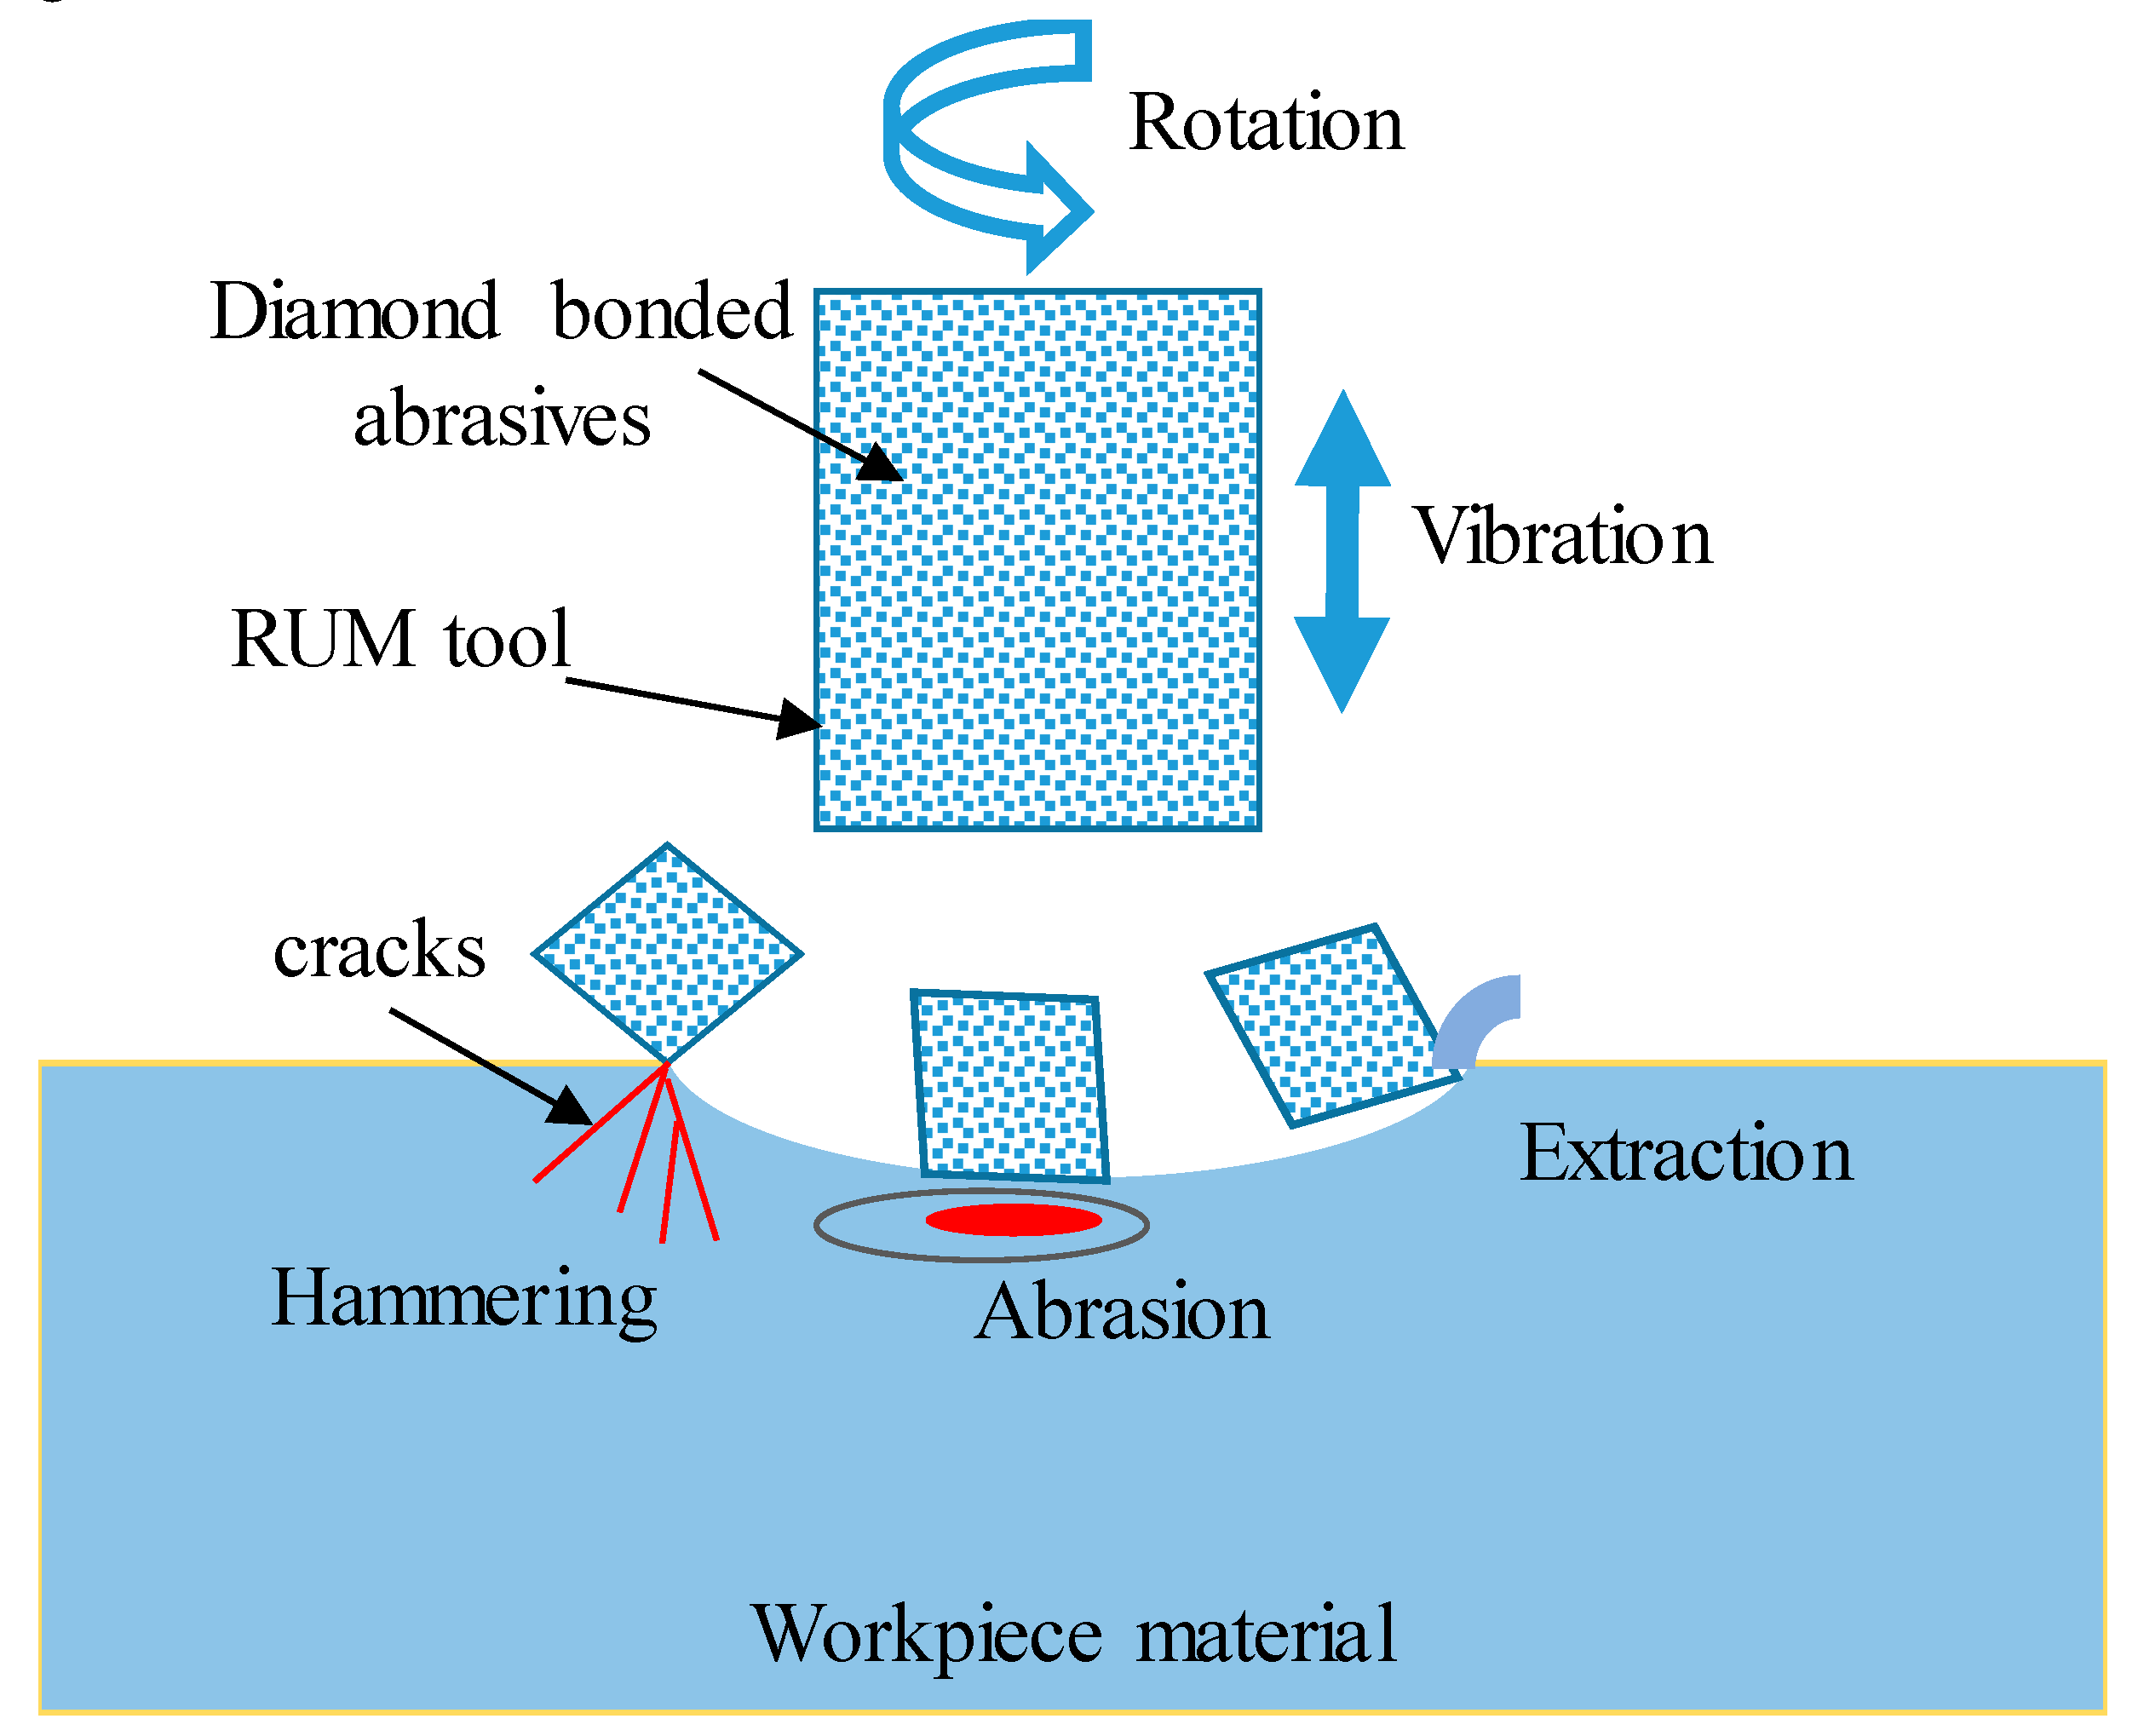
:1. Introduction
2. Materials and Experimental Procedure
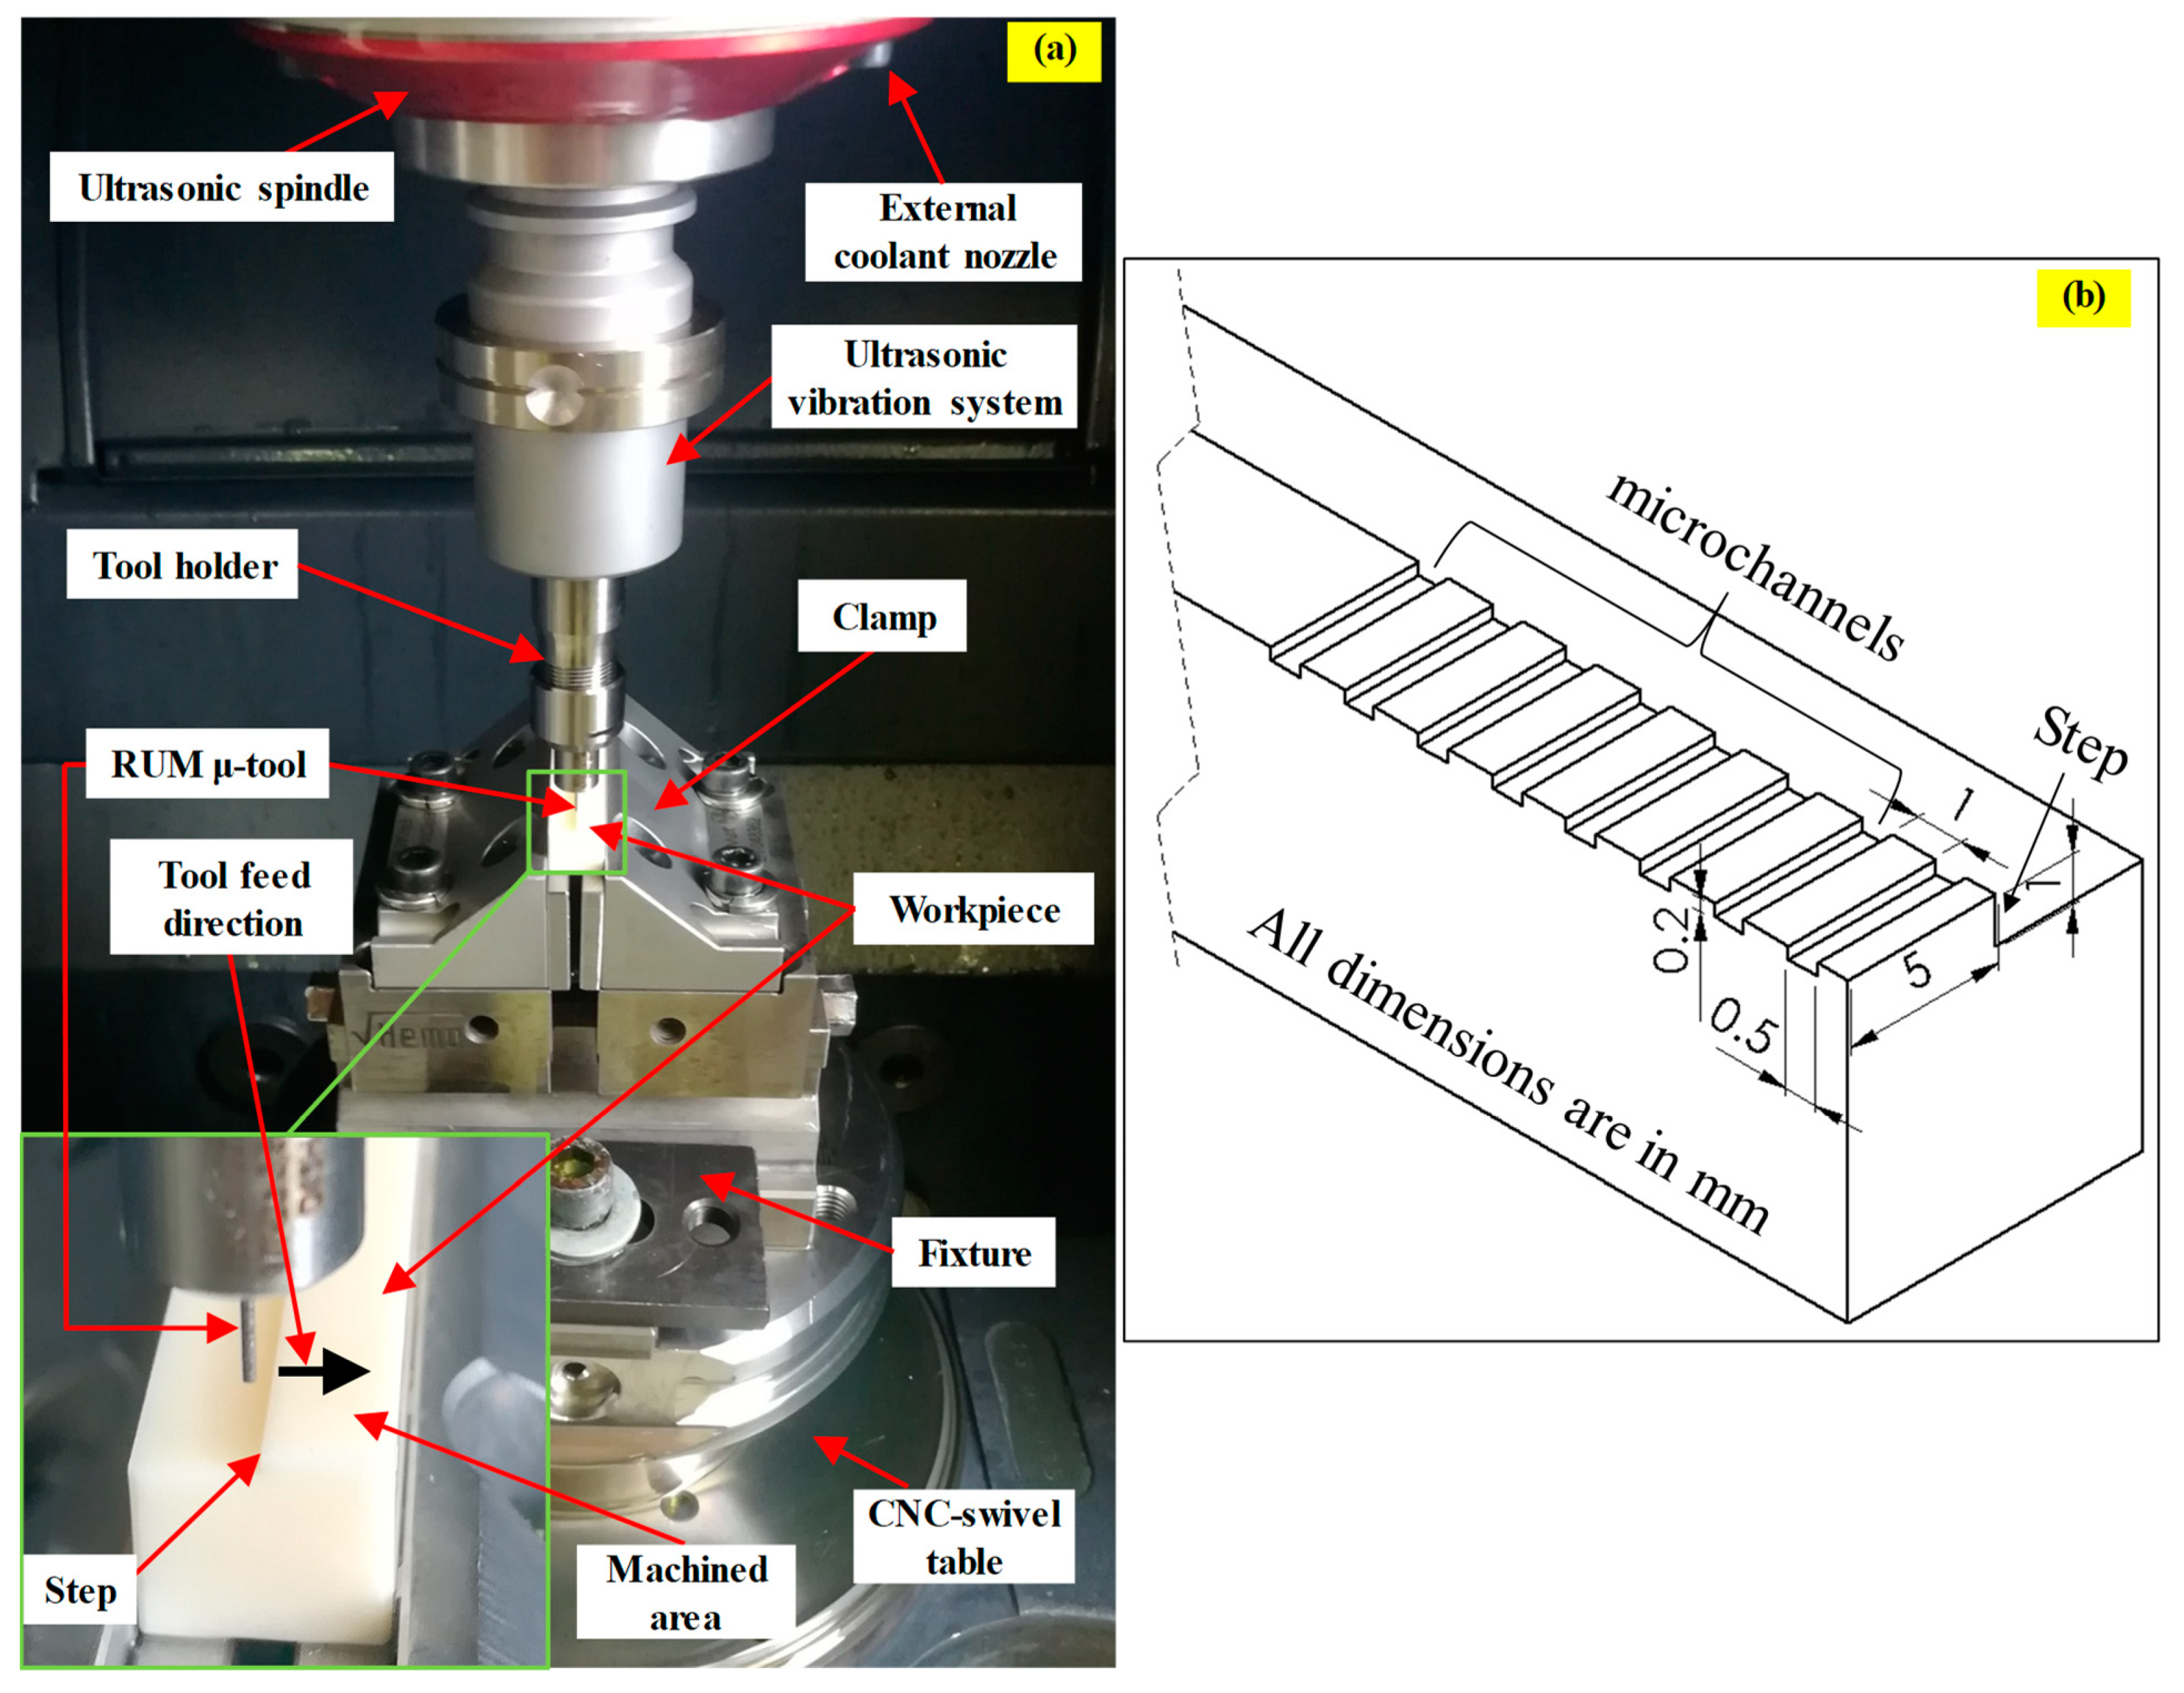
2.1. Experimental Set Up
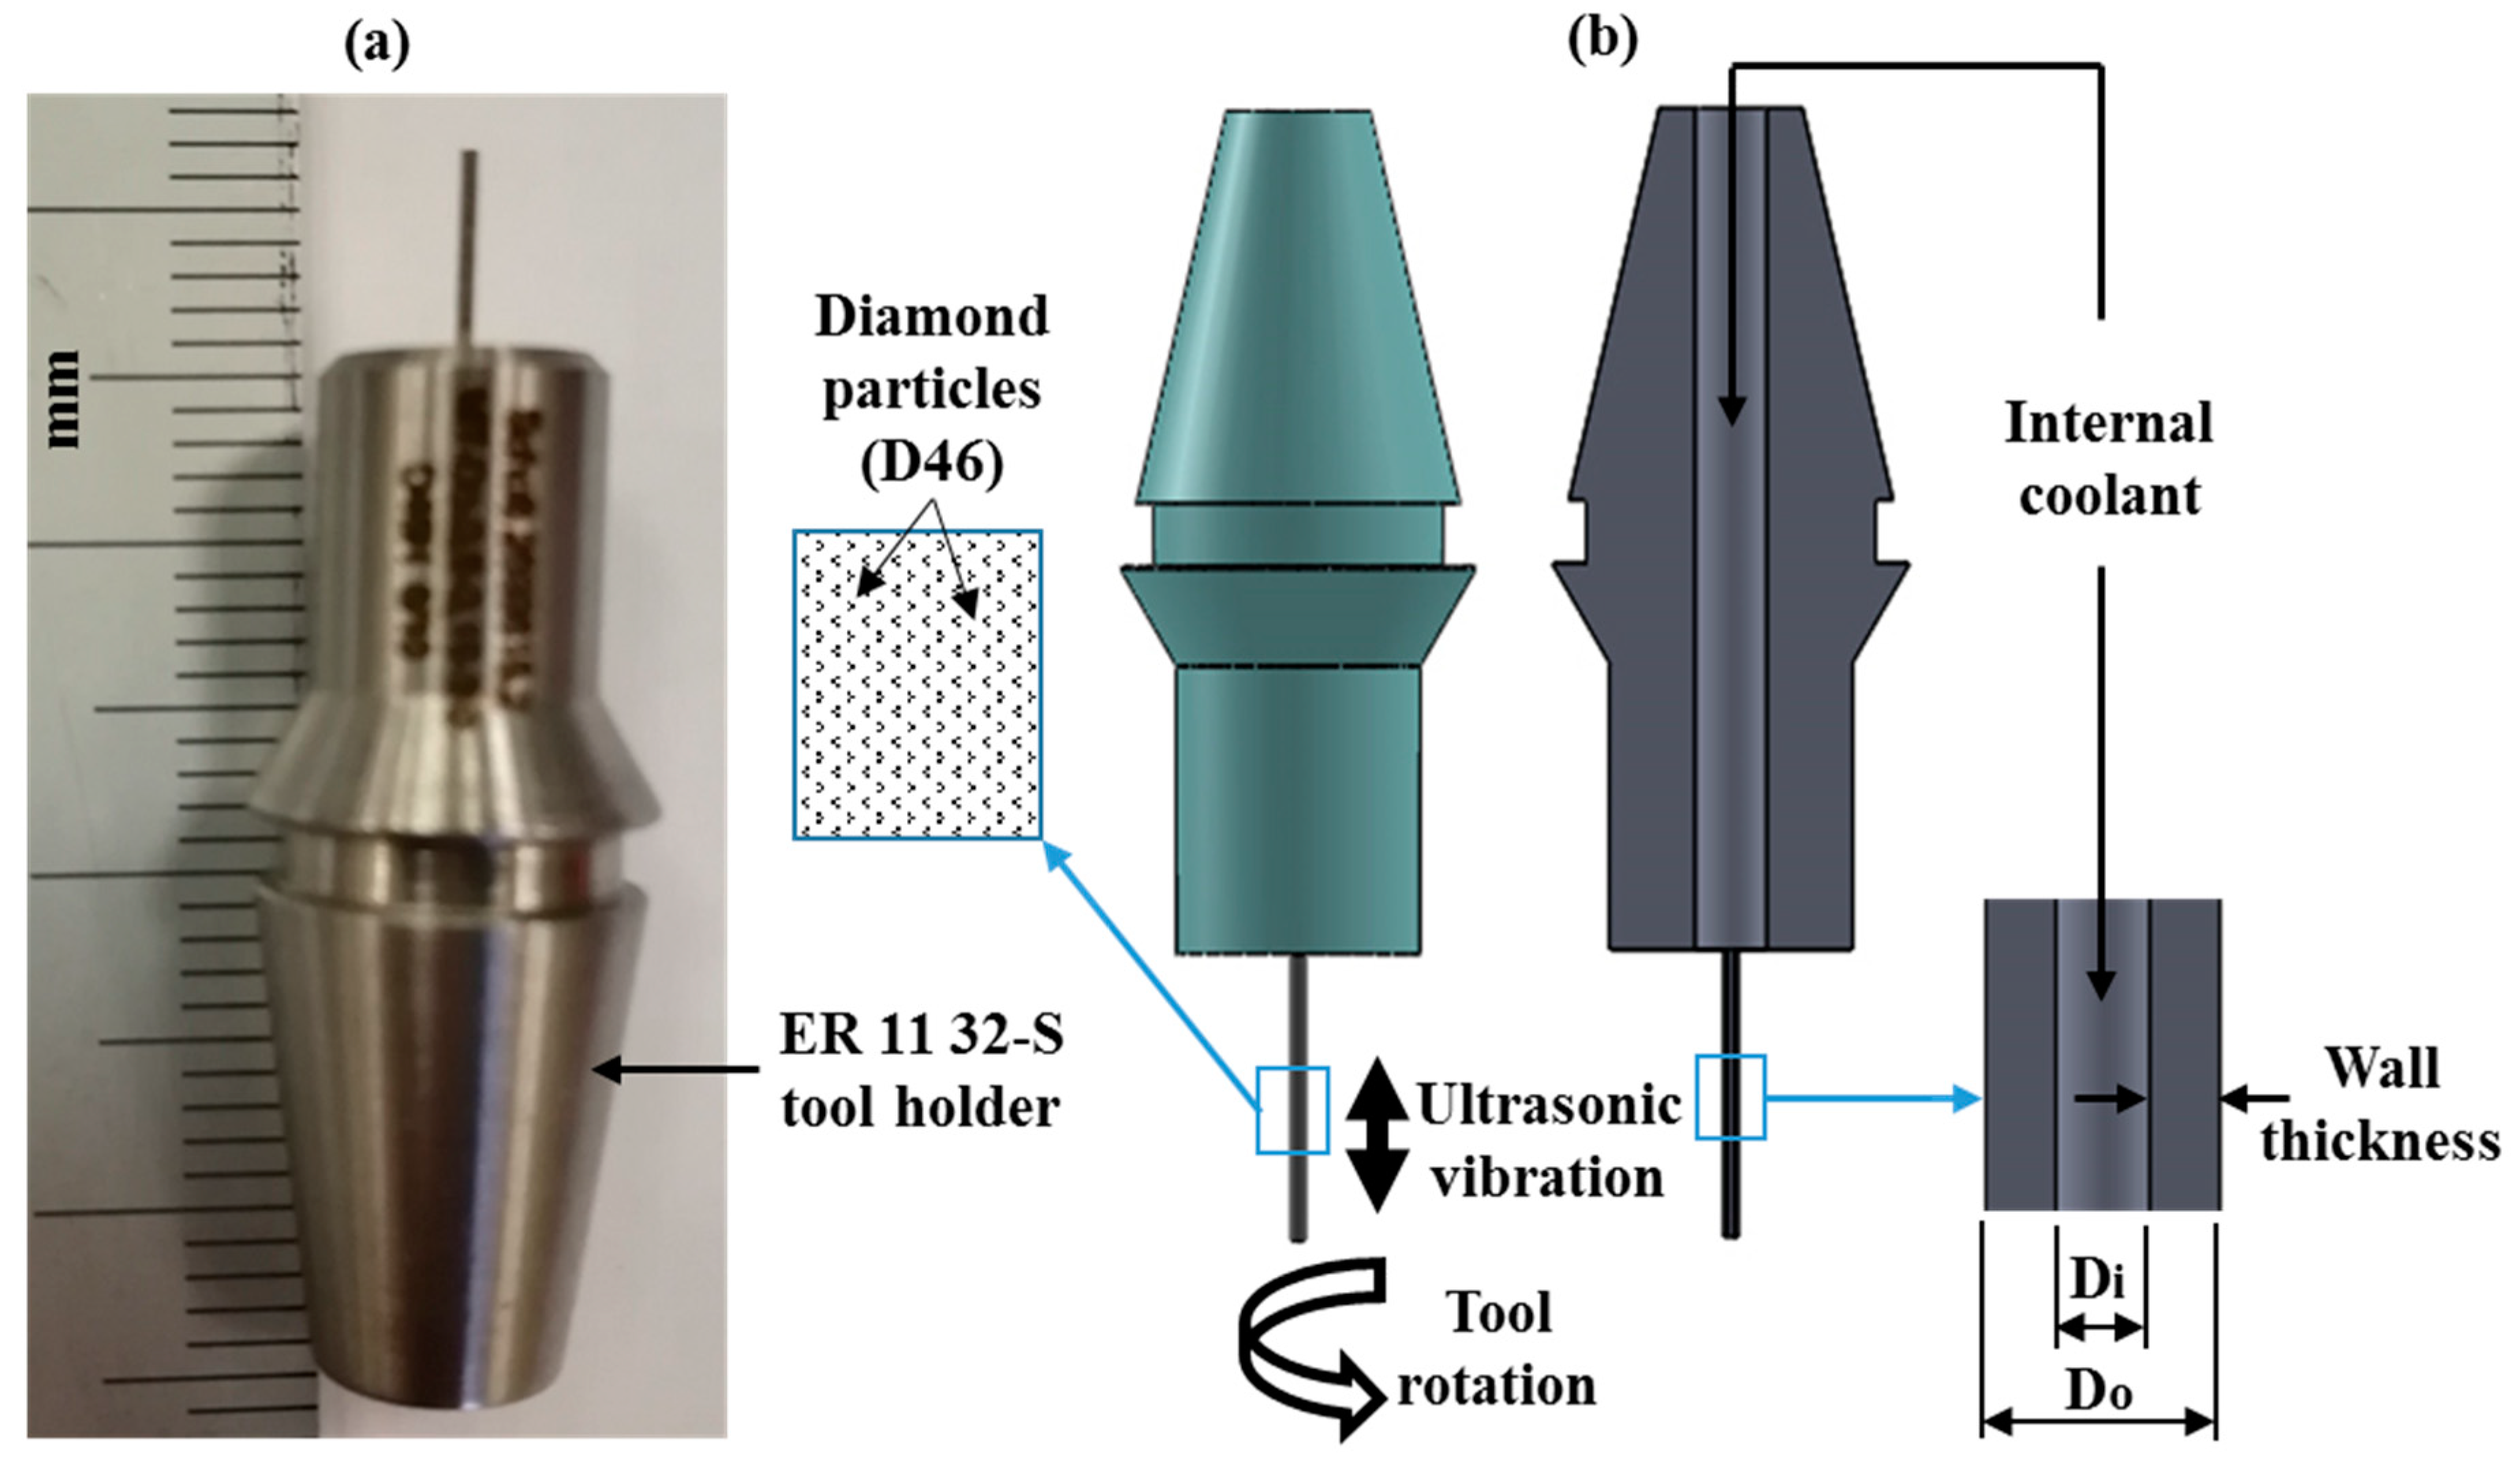
2.2. Materials and Tools
2.3. Experimental Design and Selection of the Process Parameters
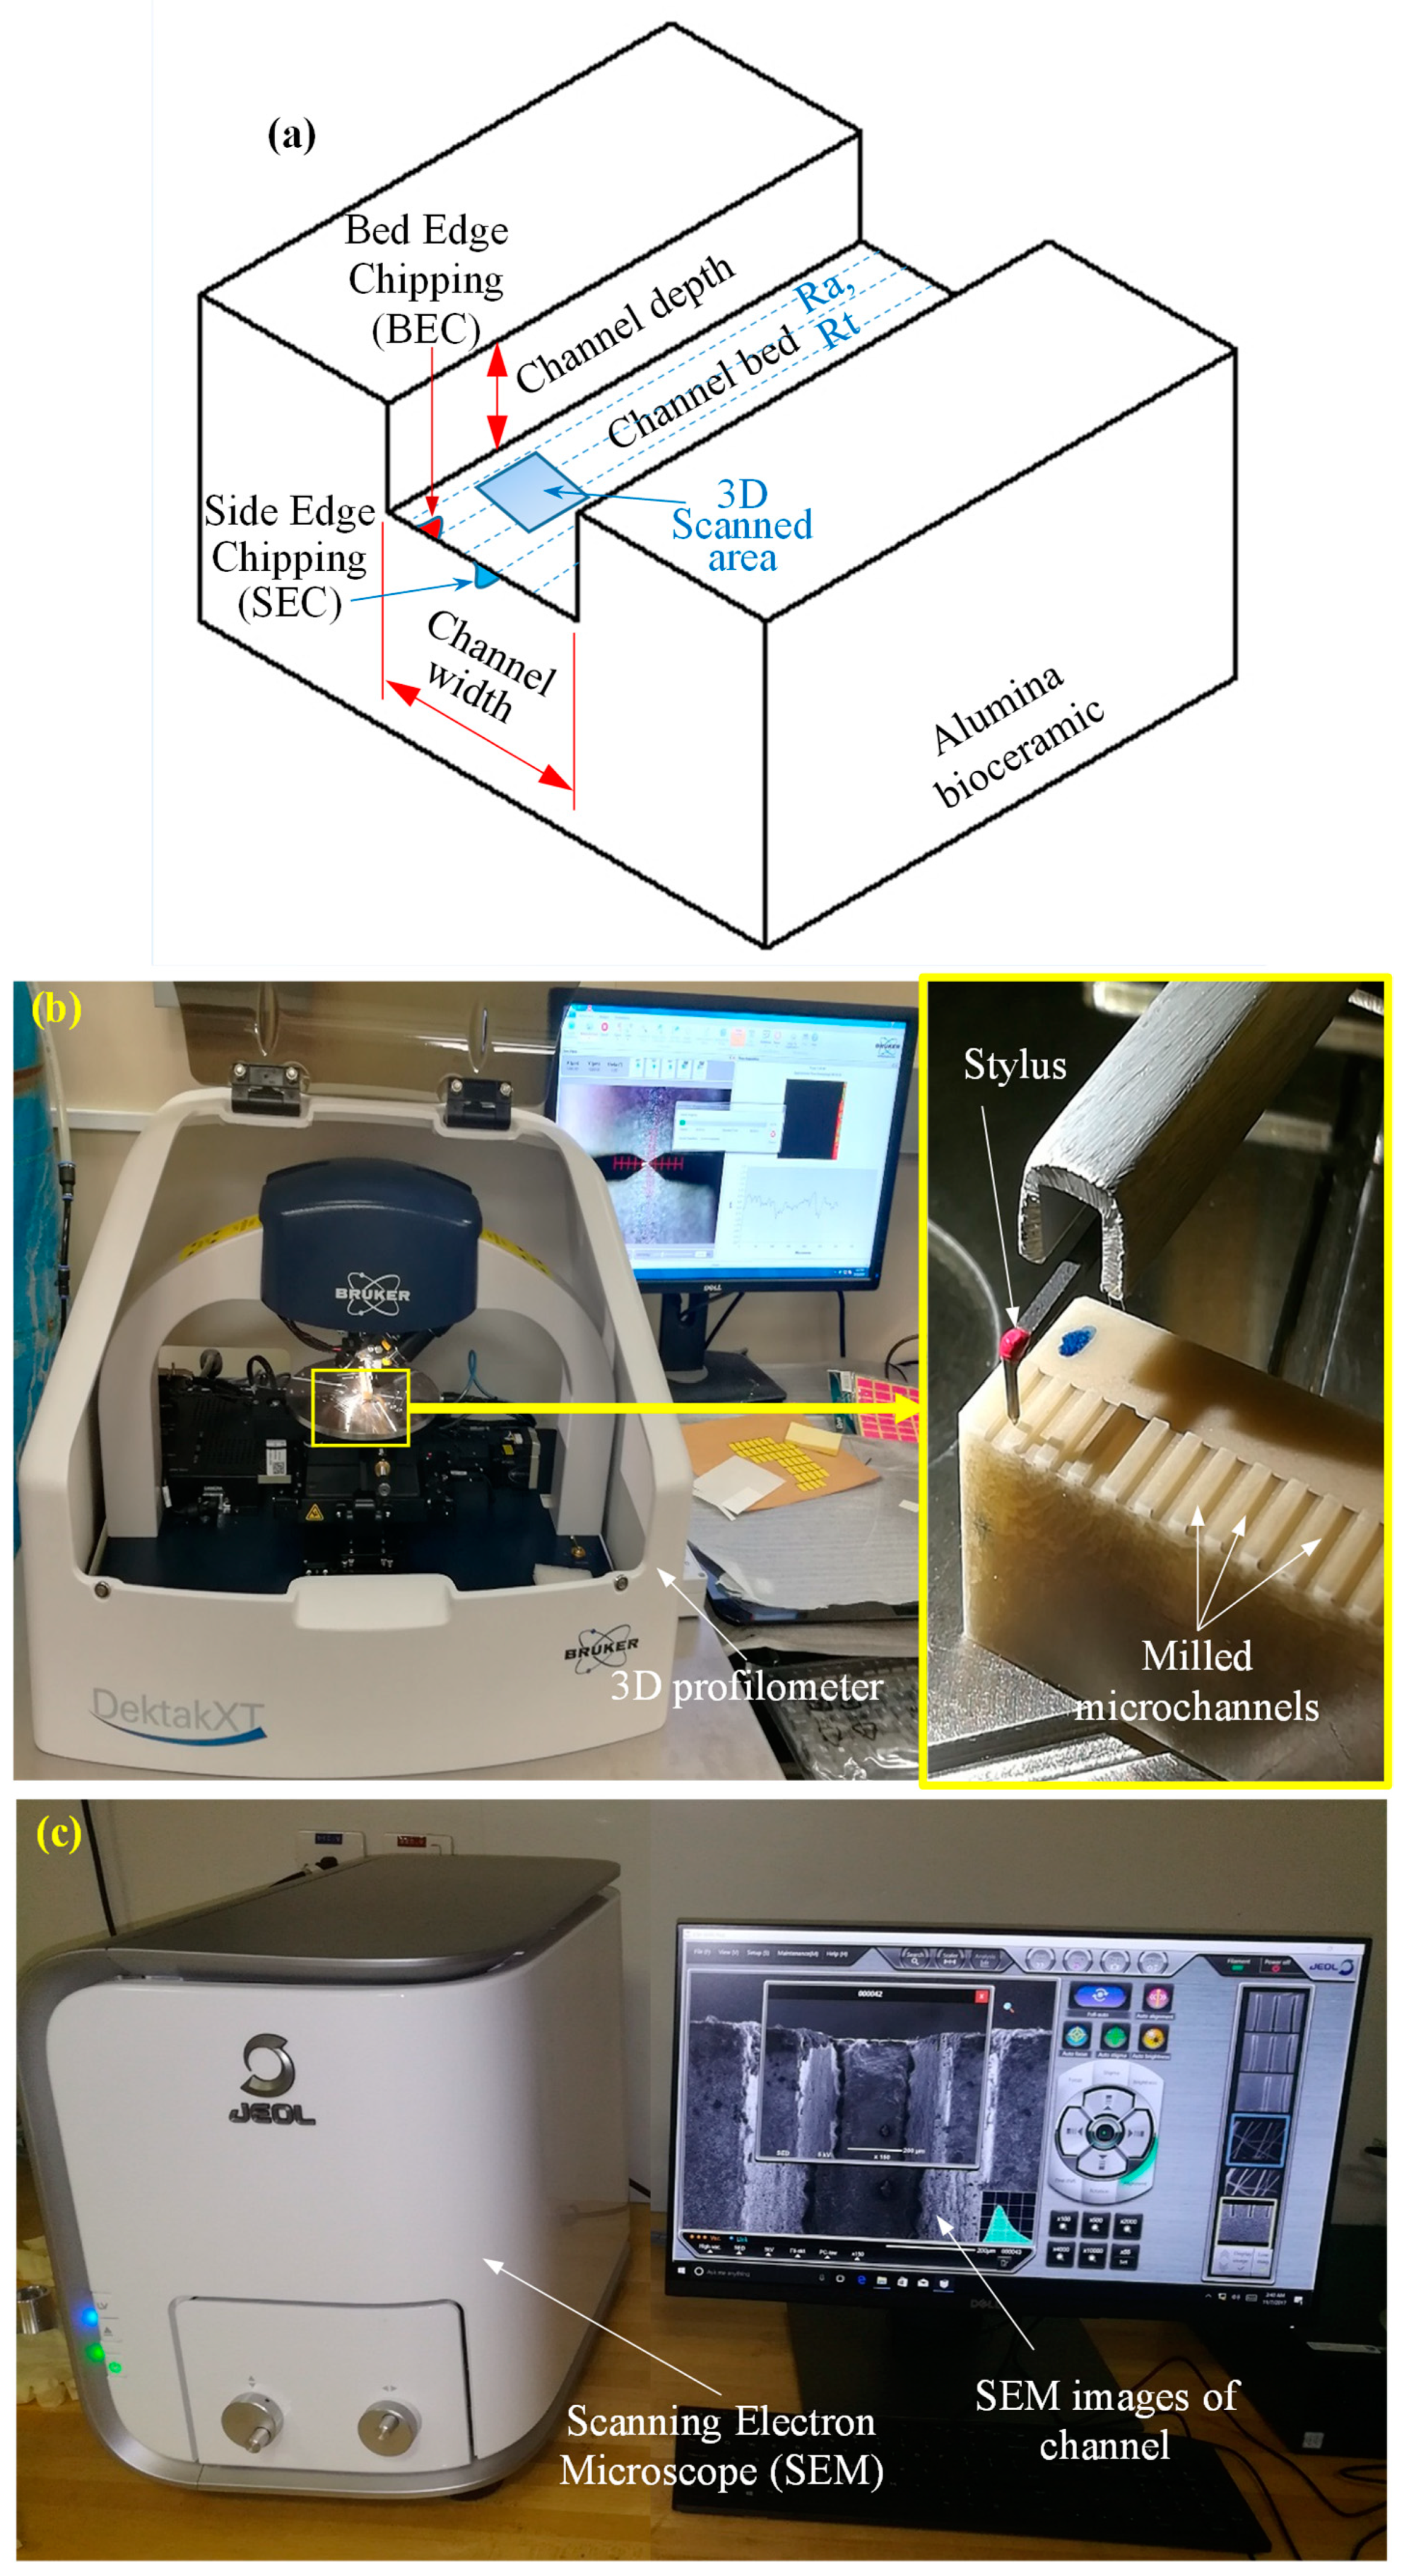
2.4. Measurement Procedures
3. Results and Discussions
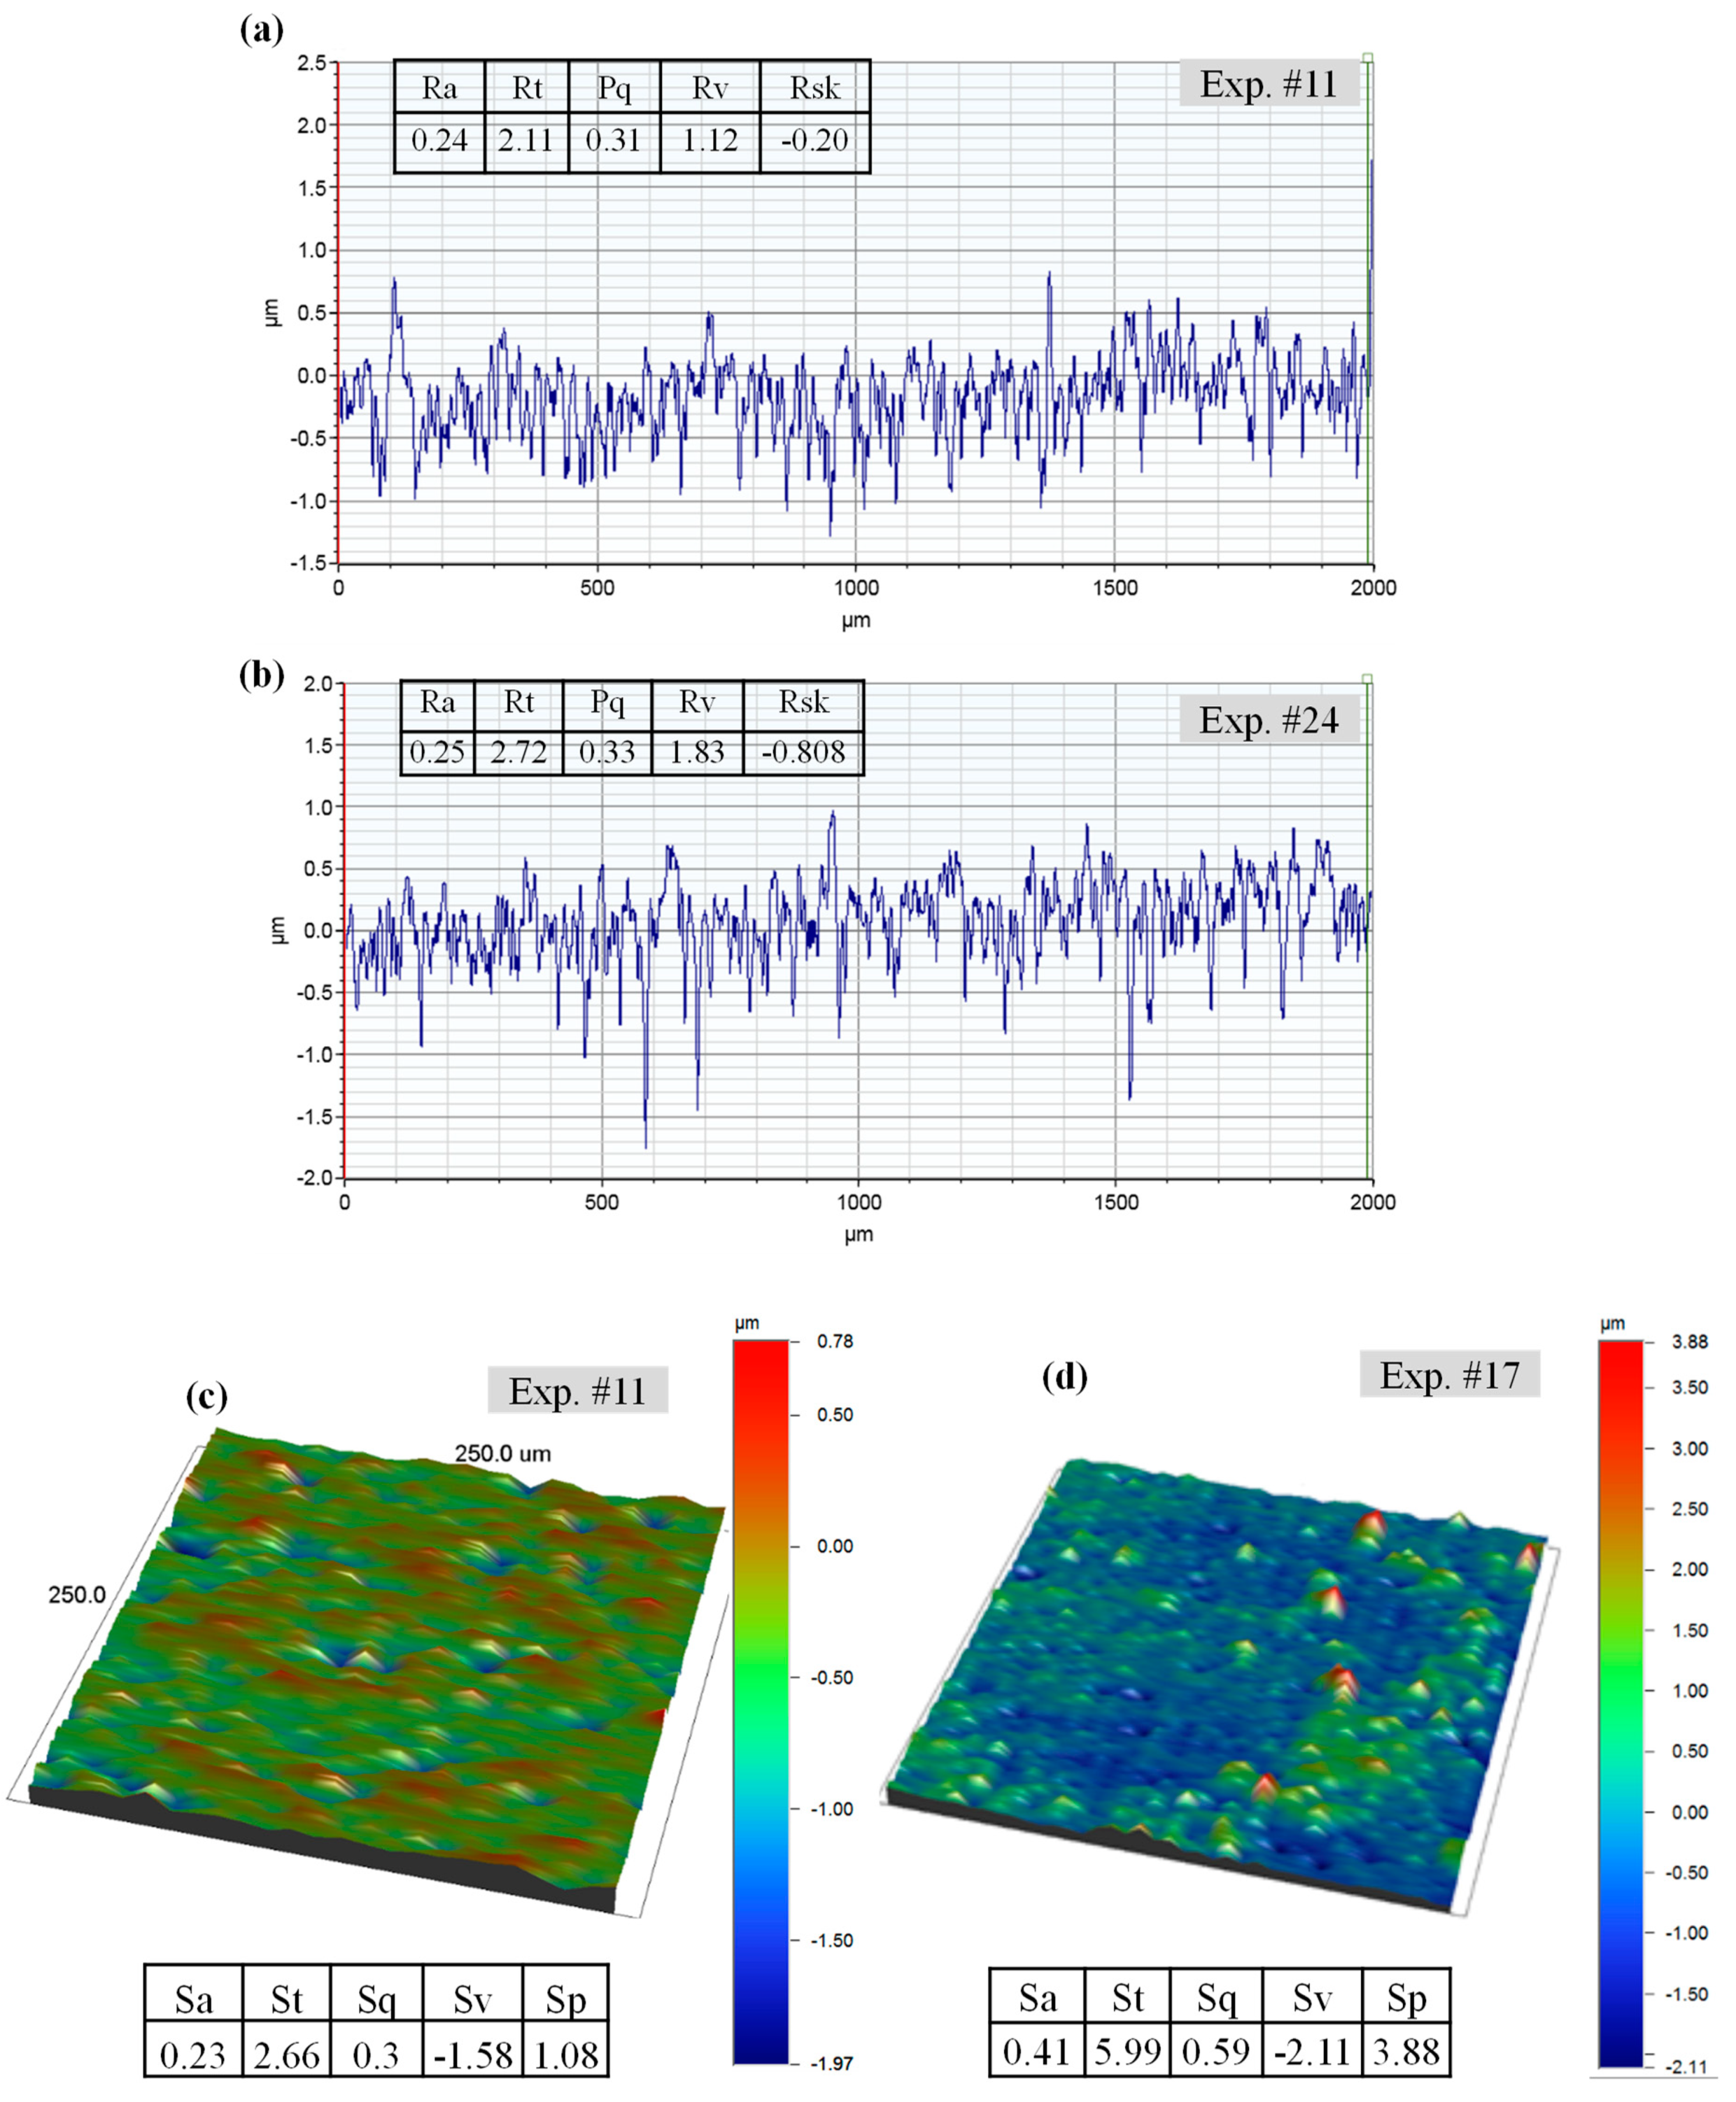
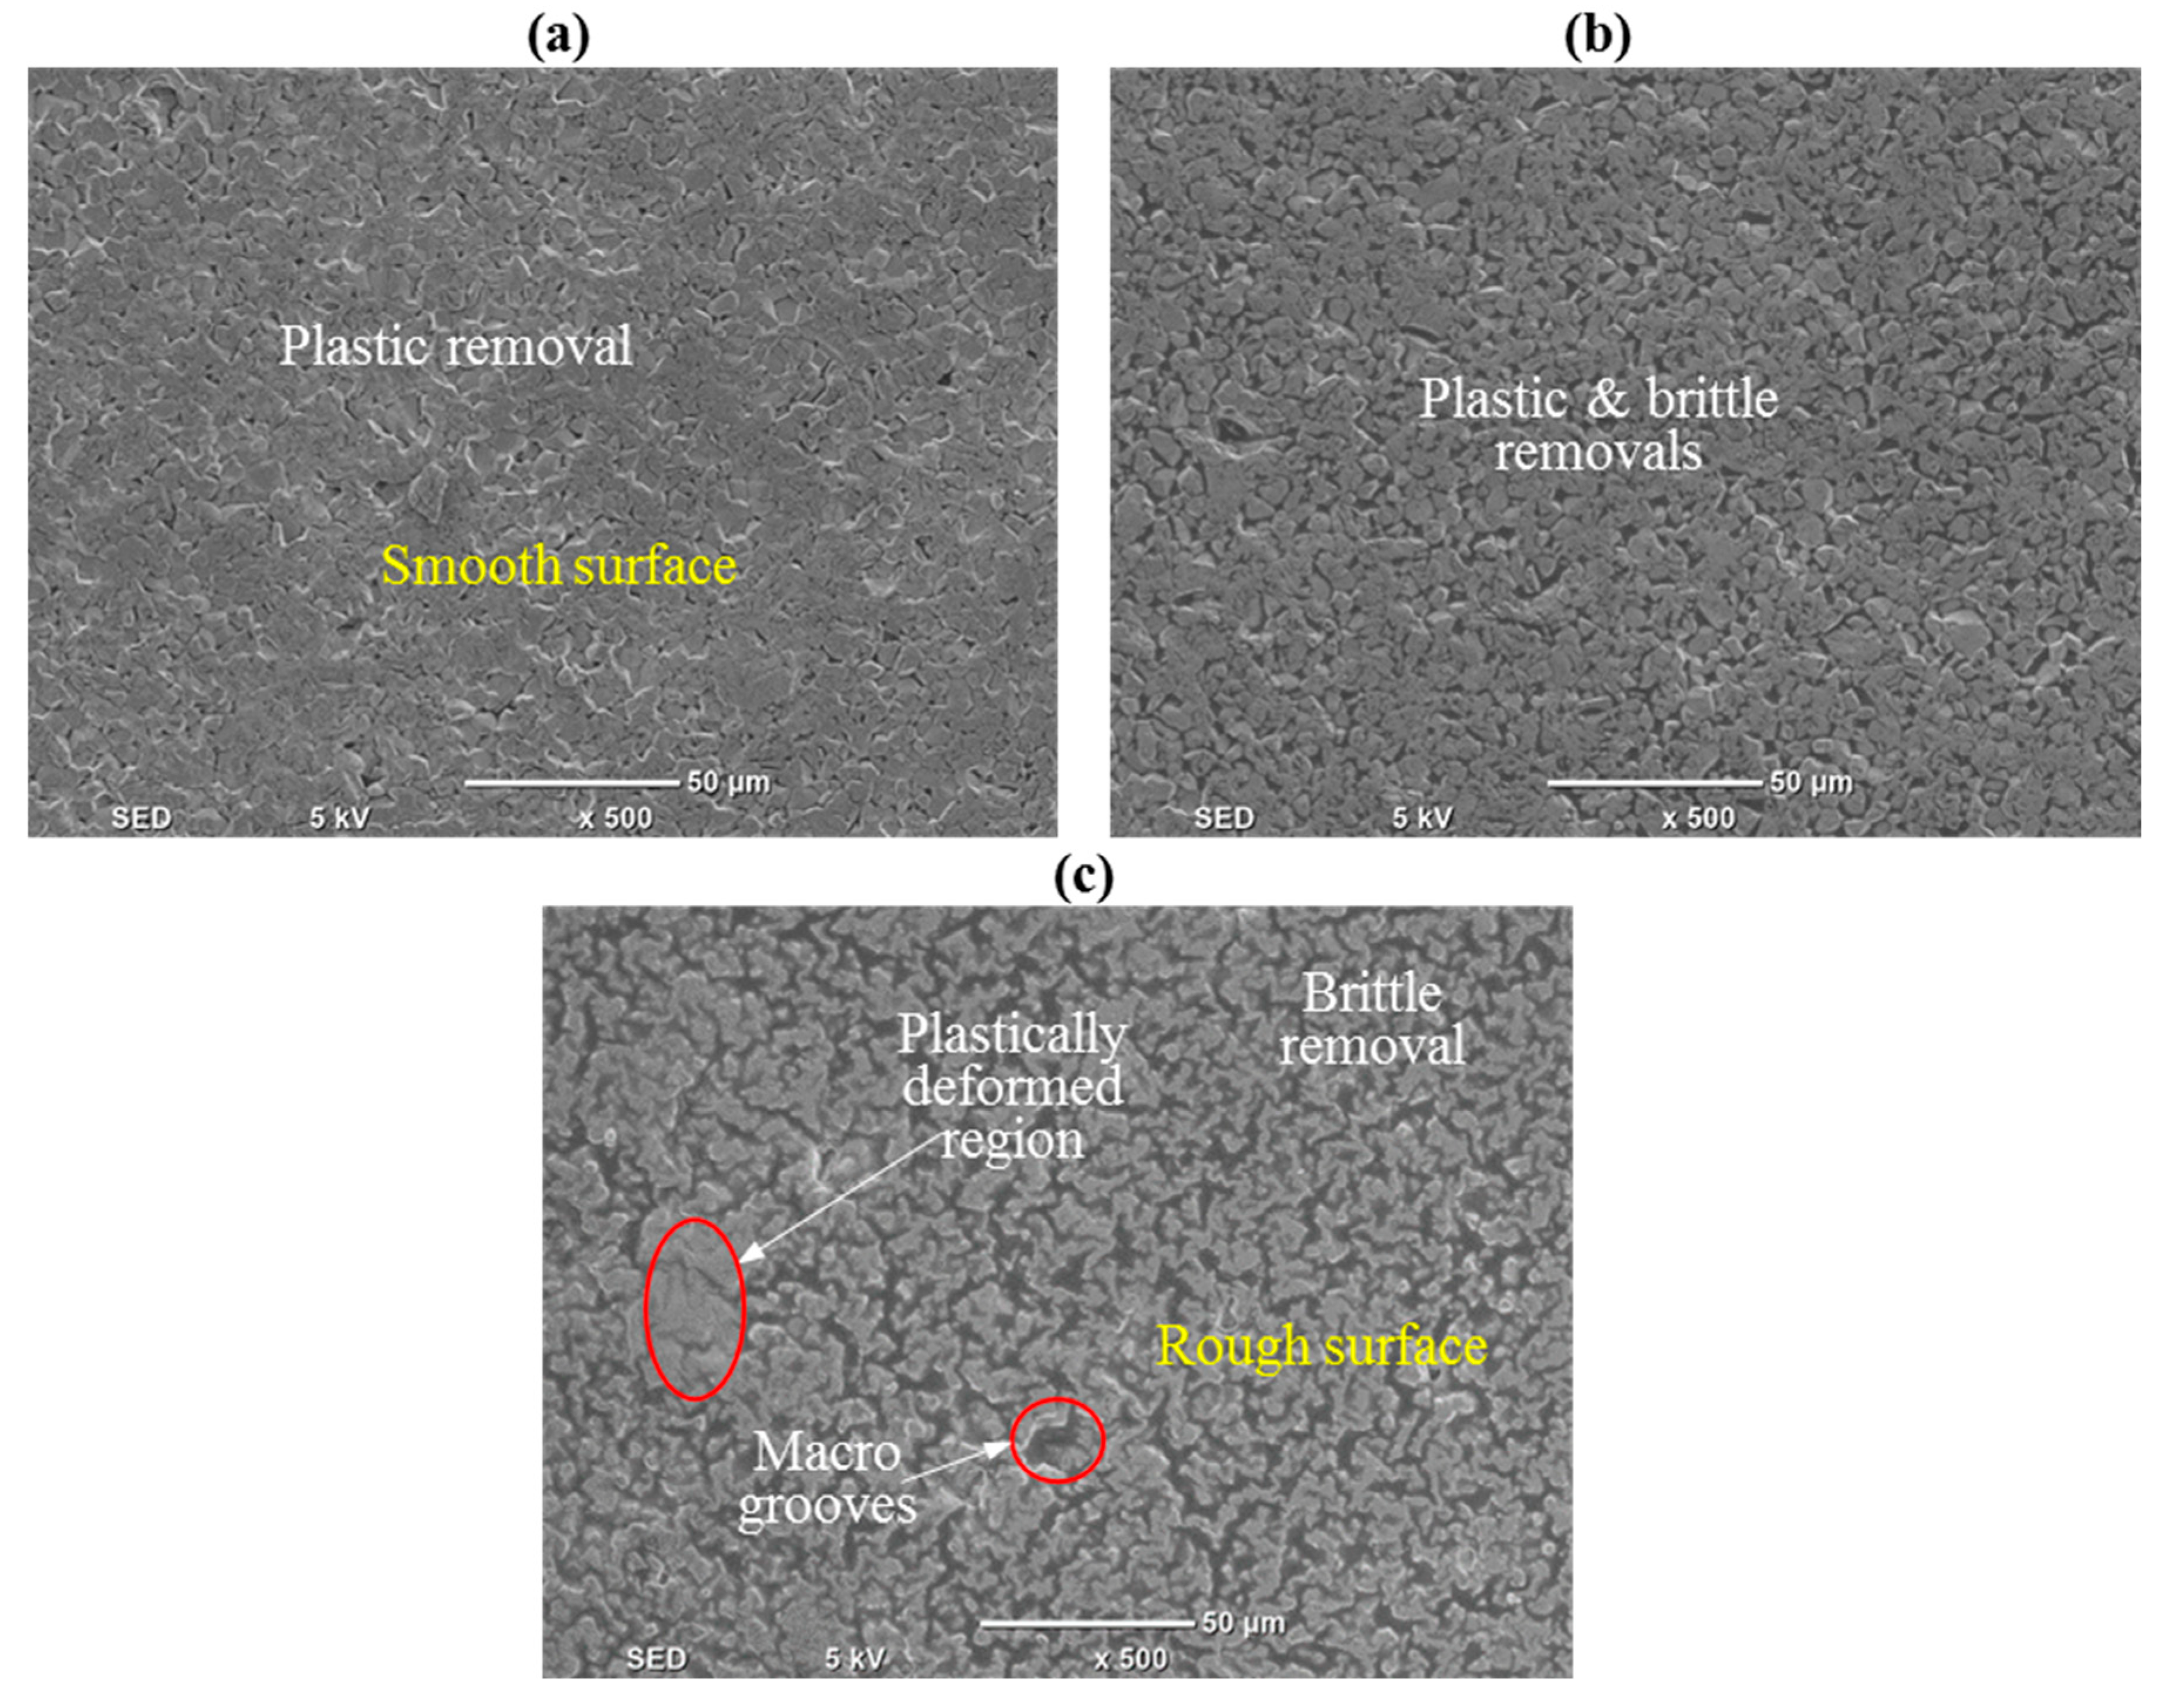
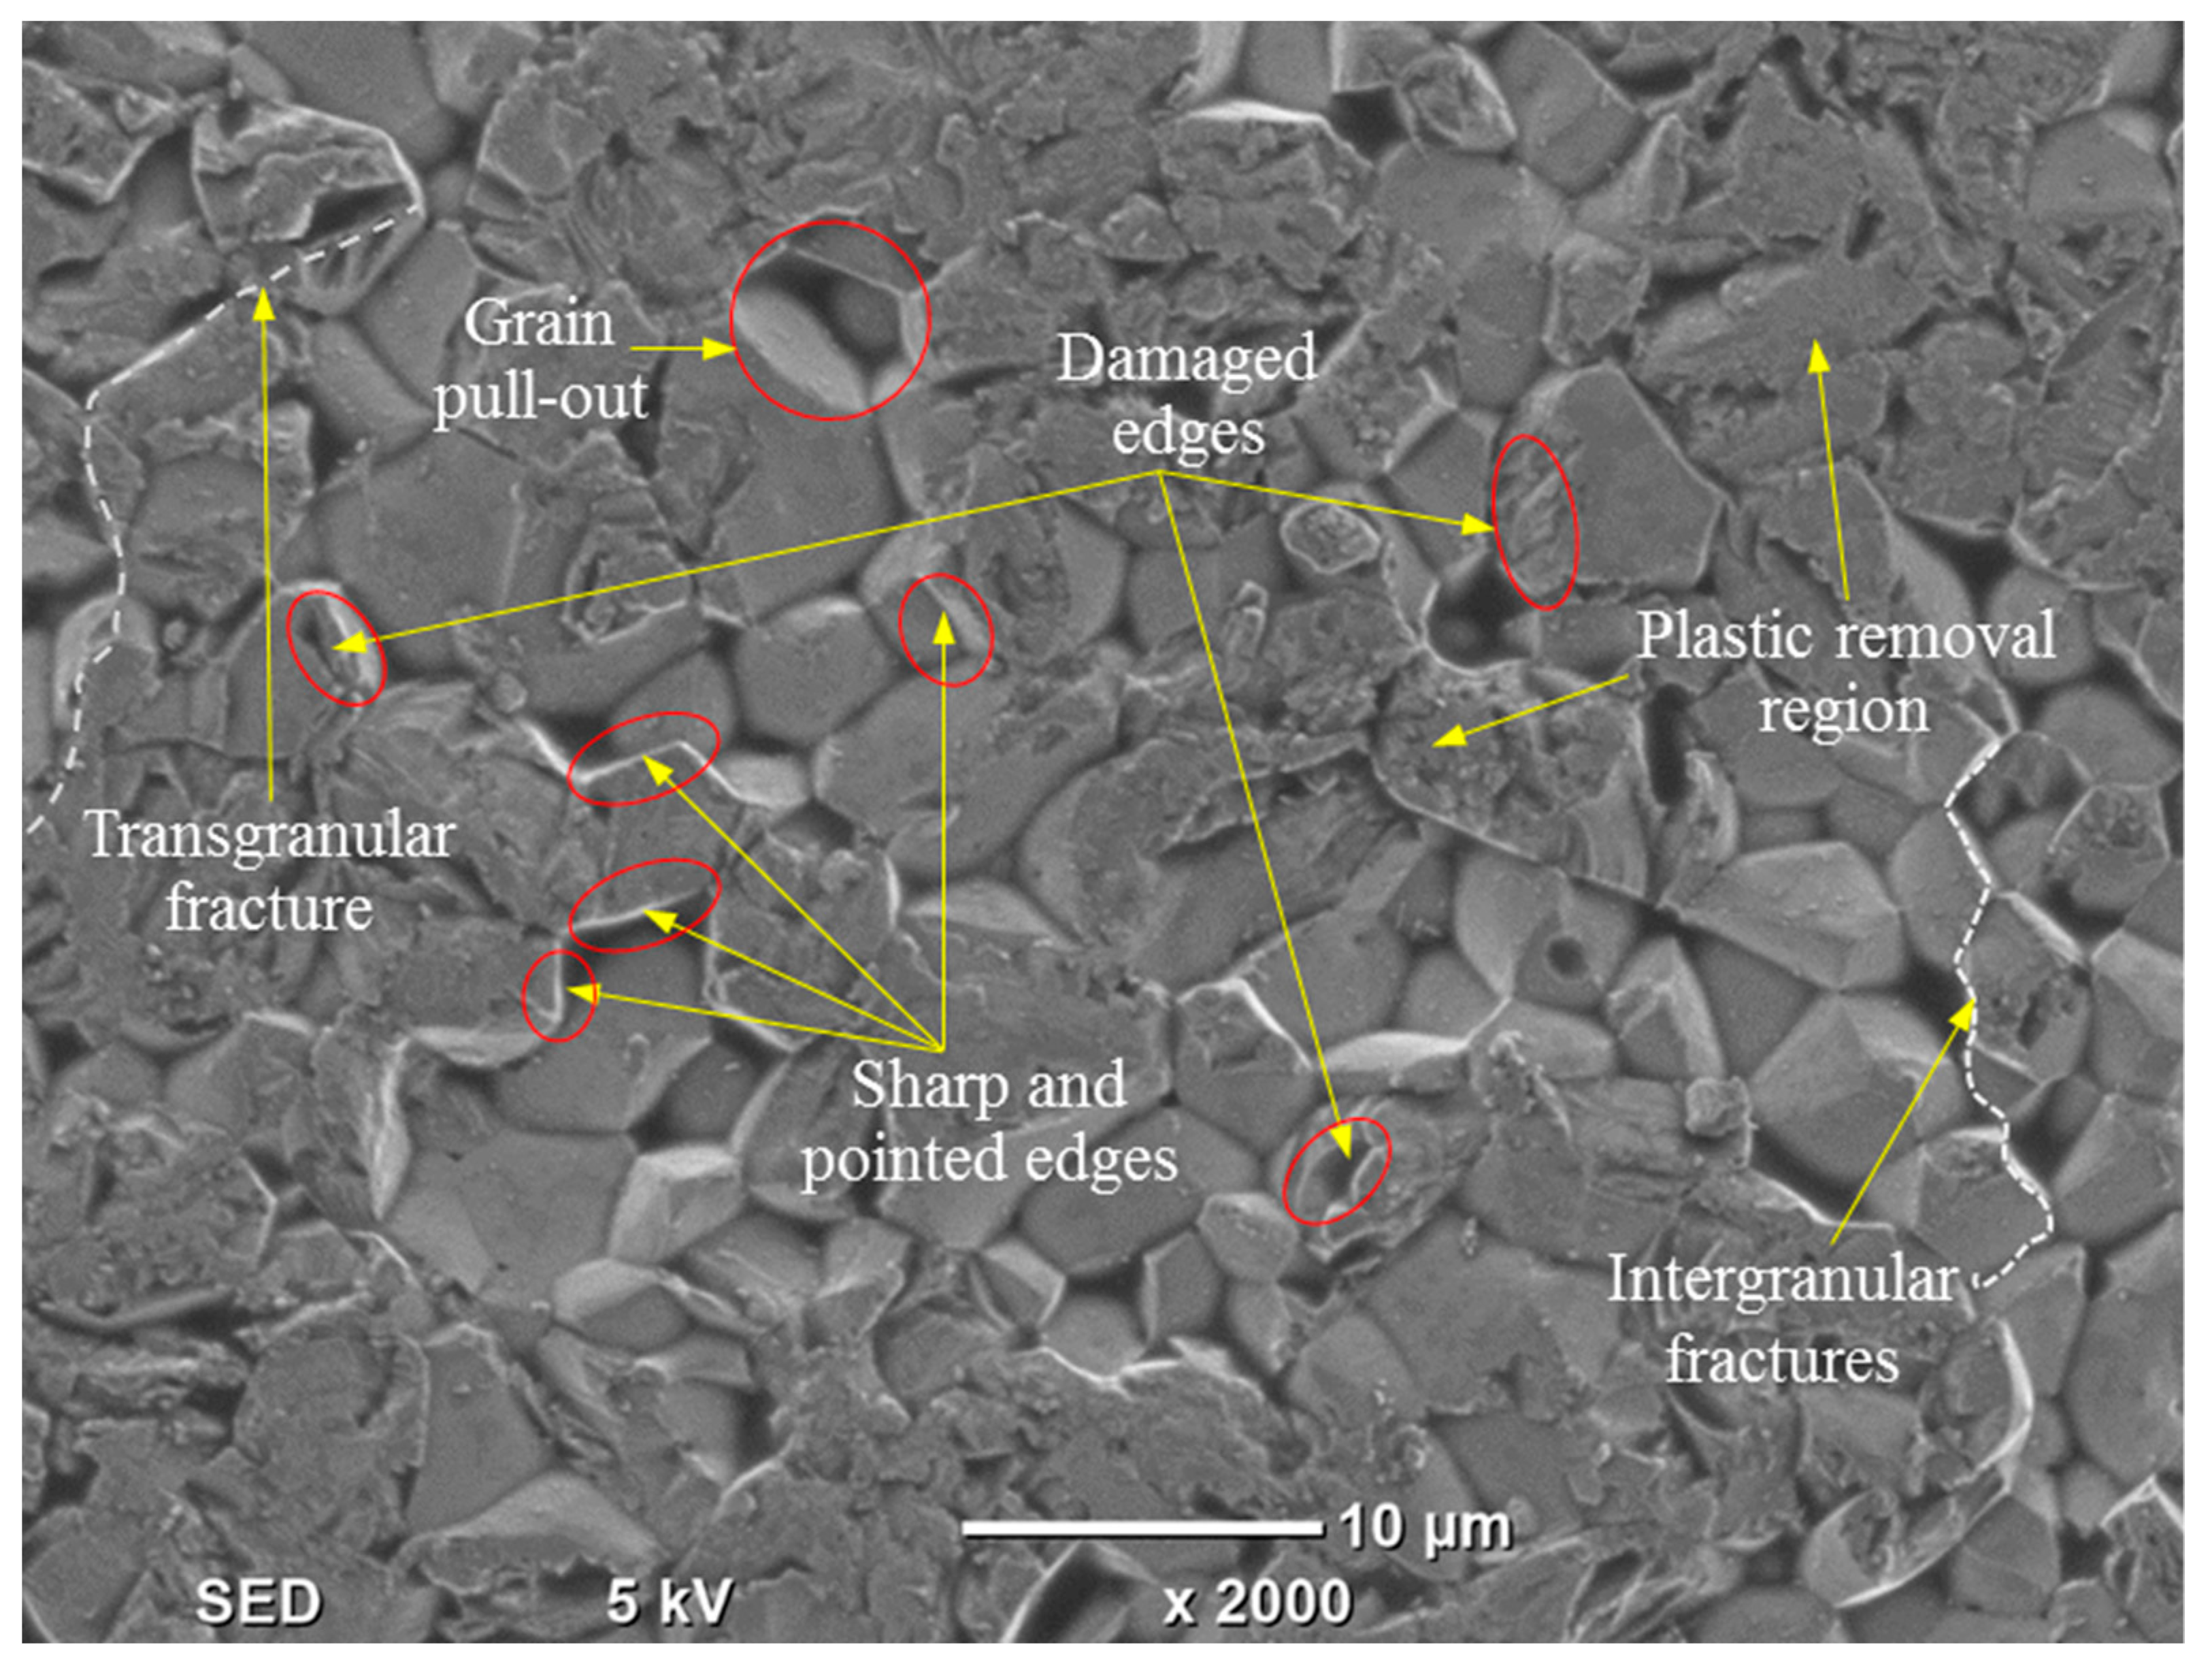
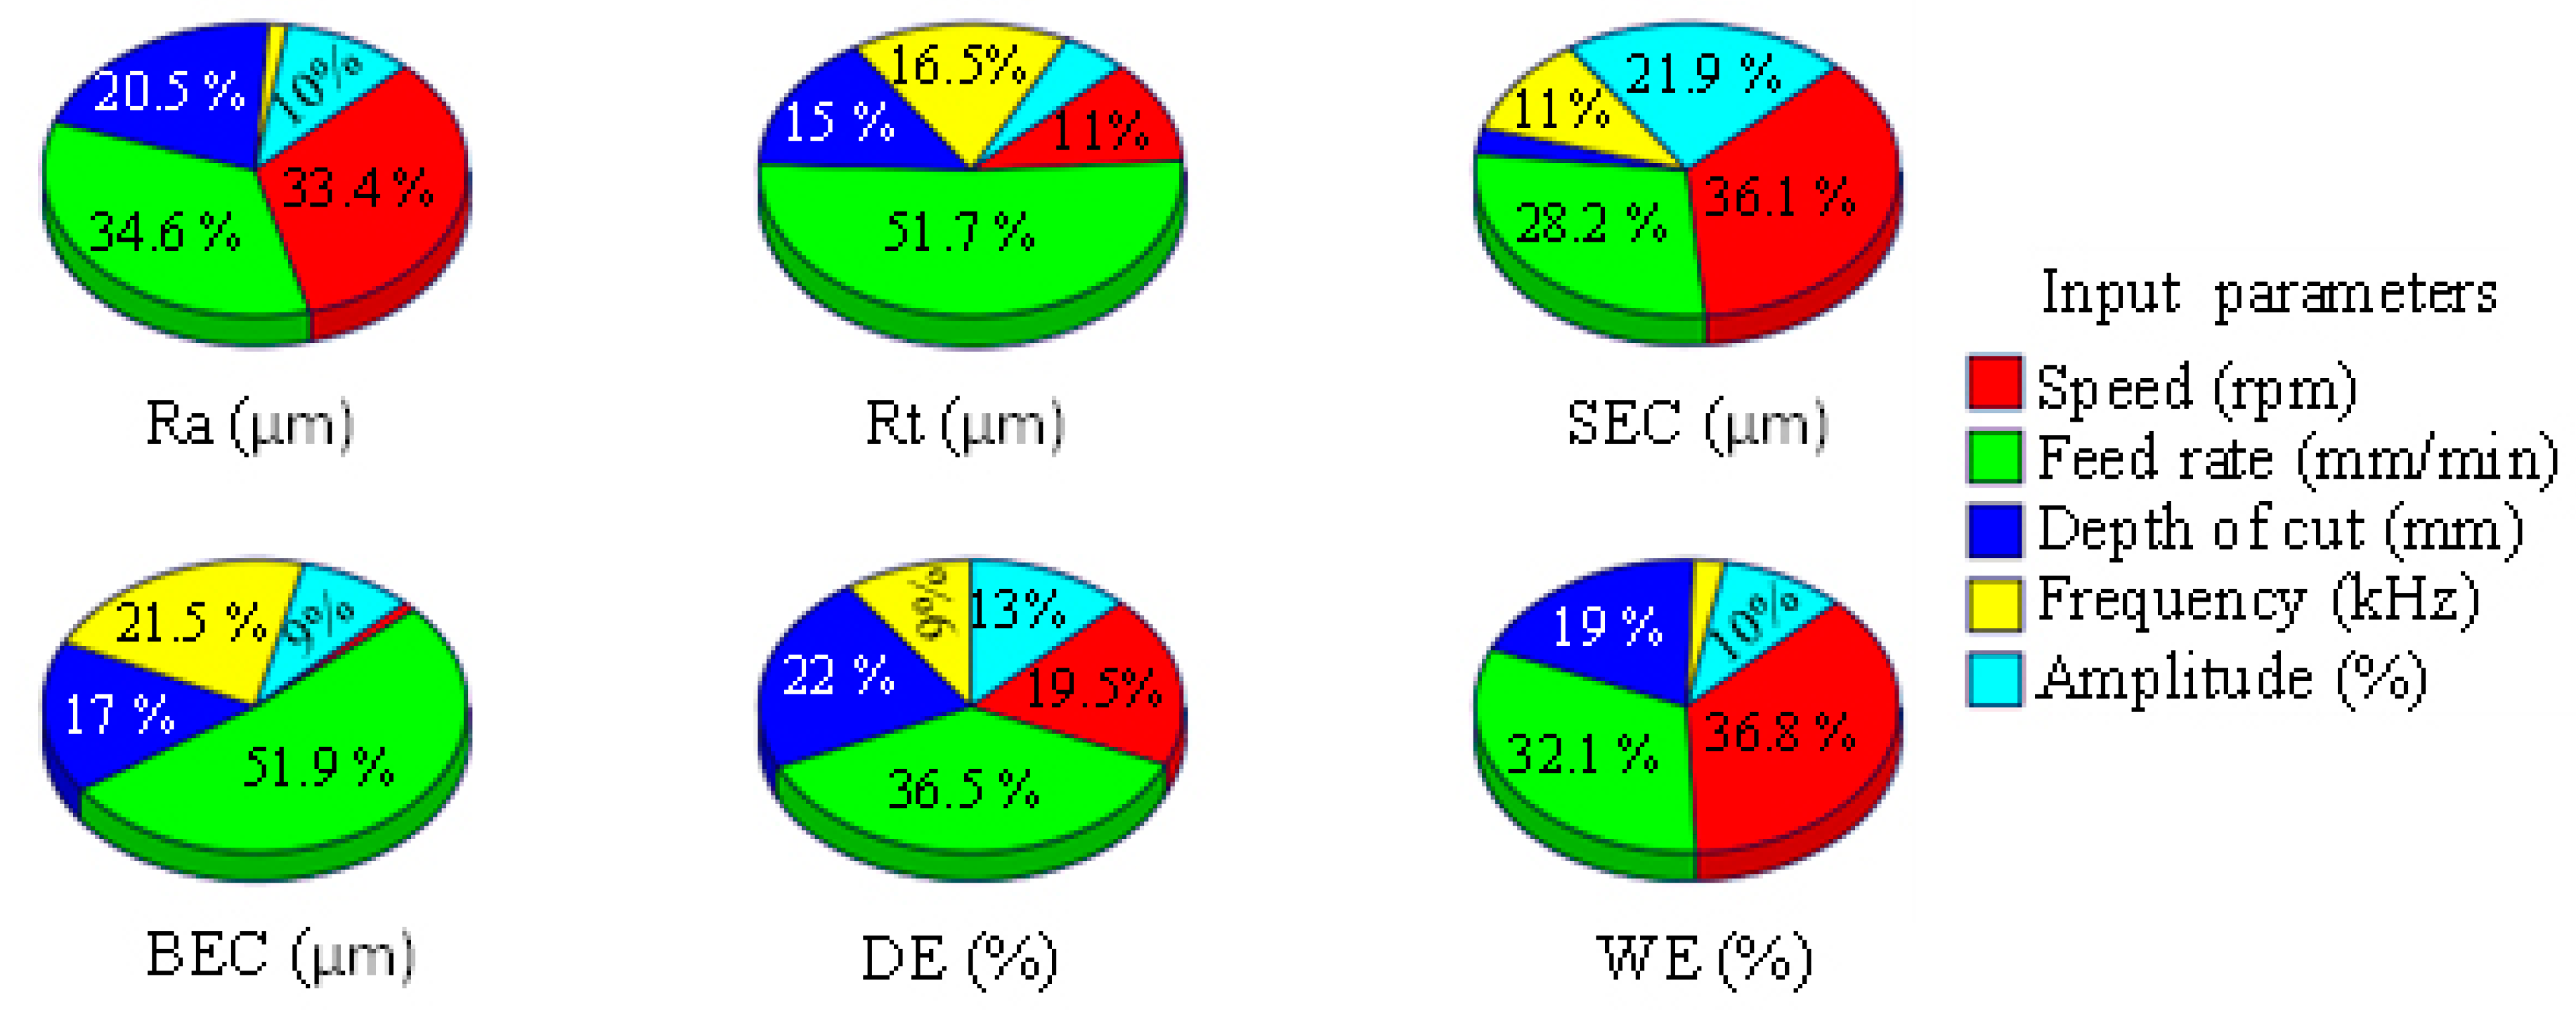
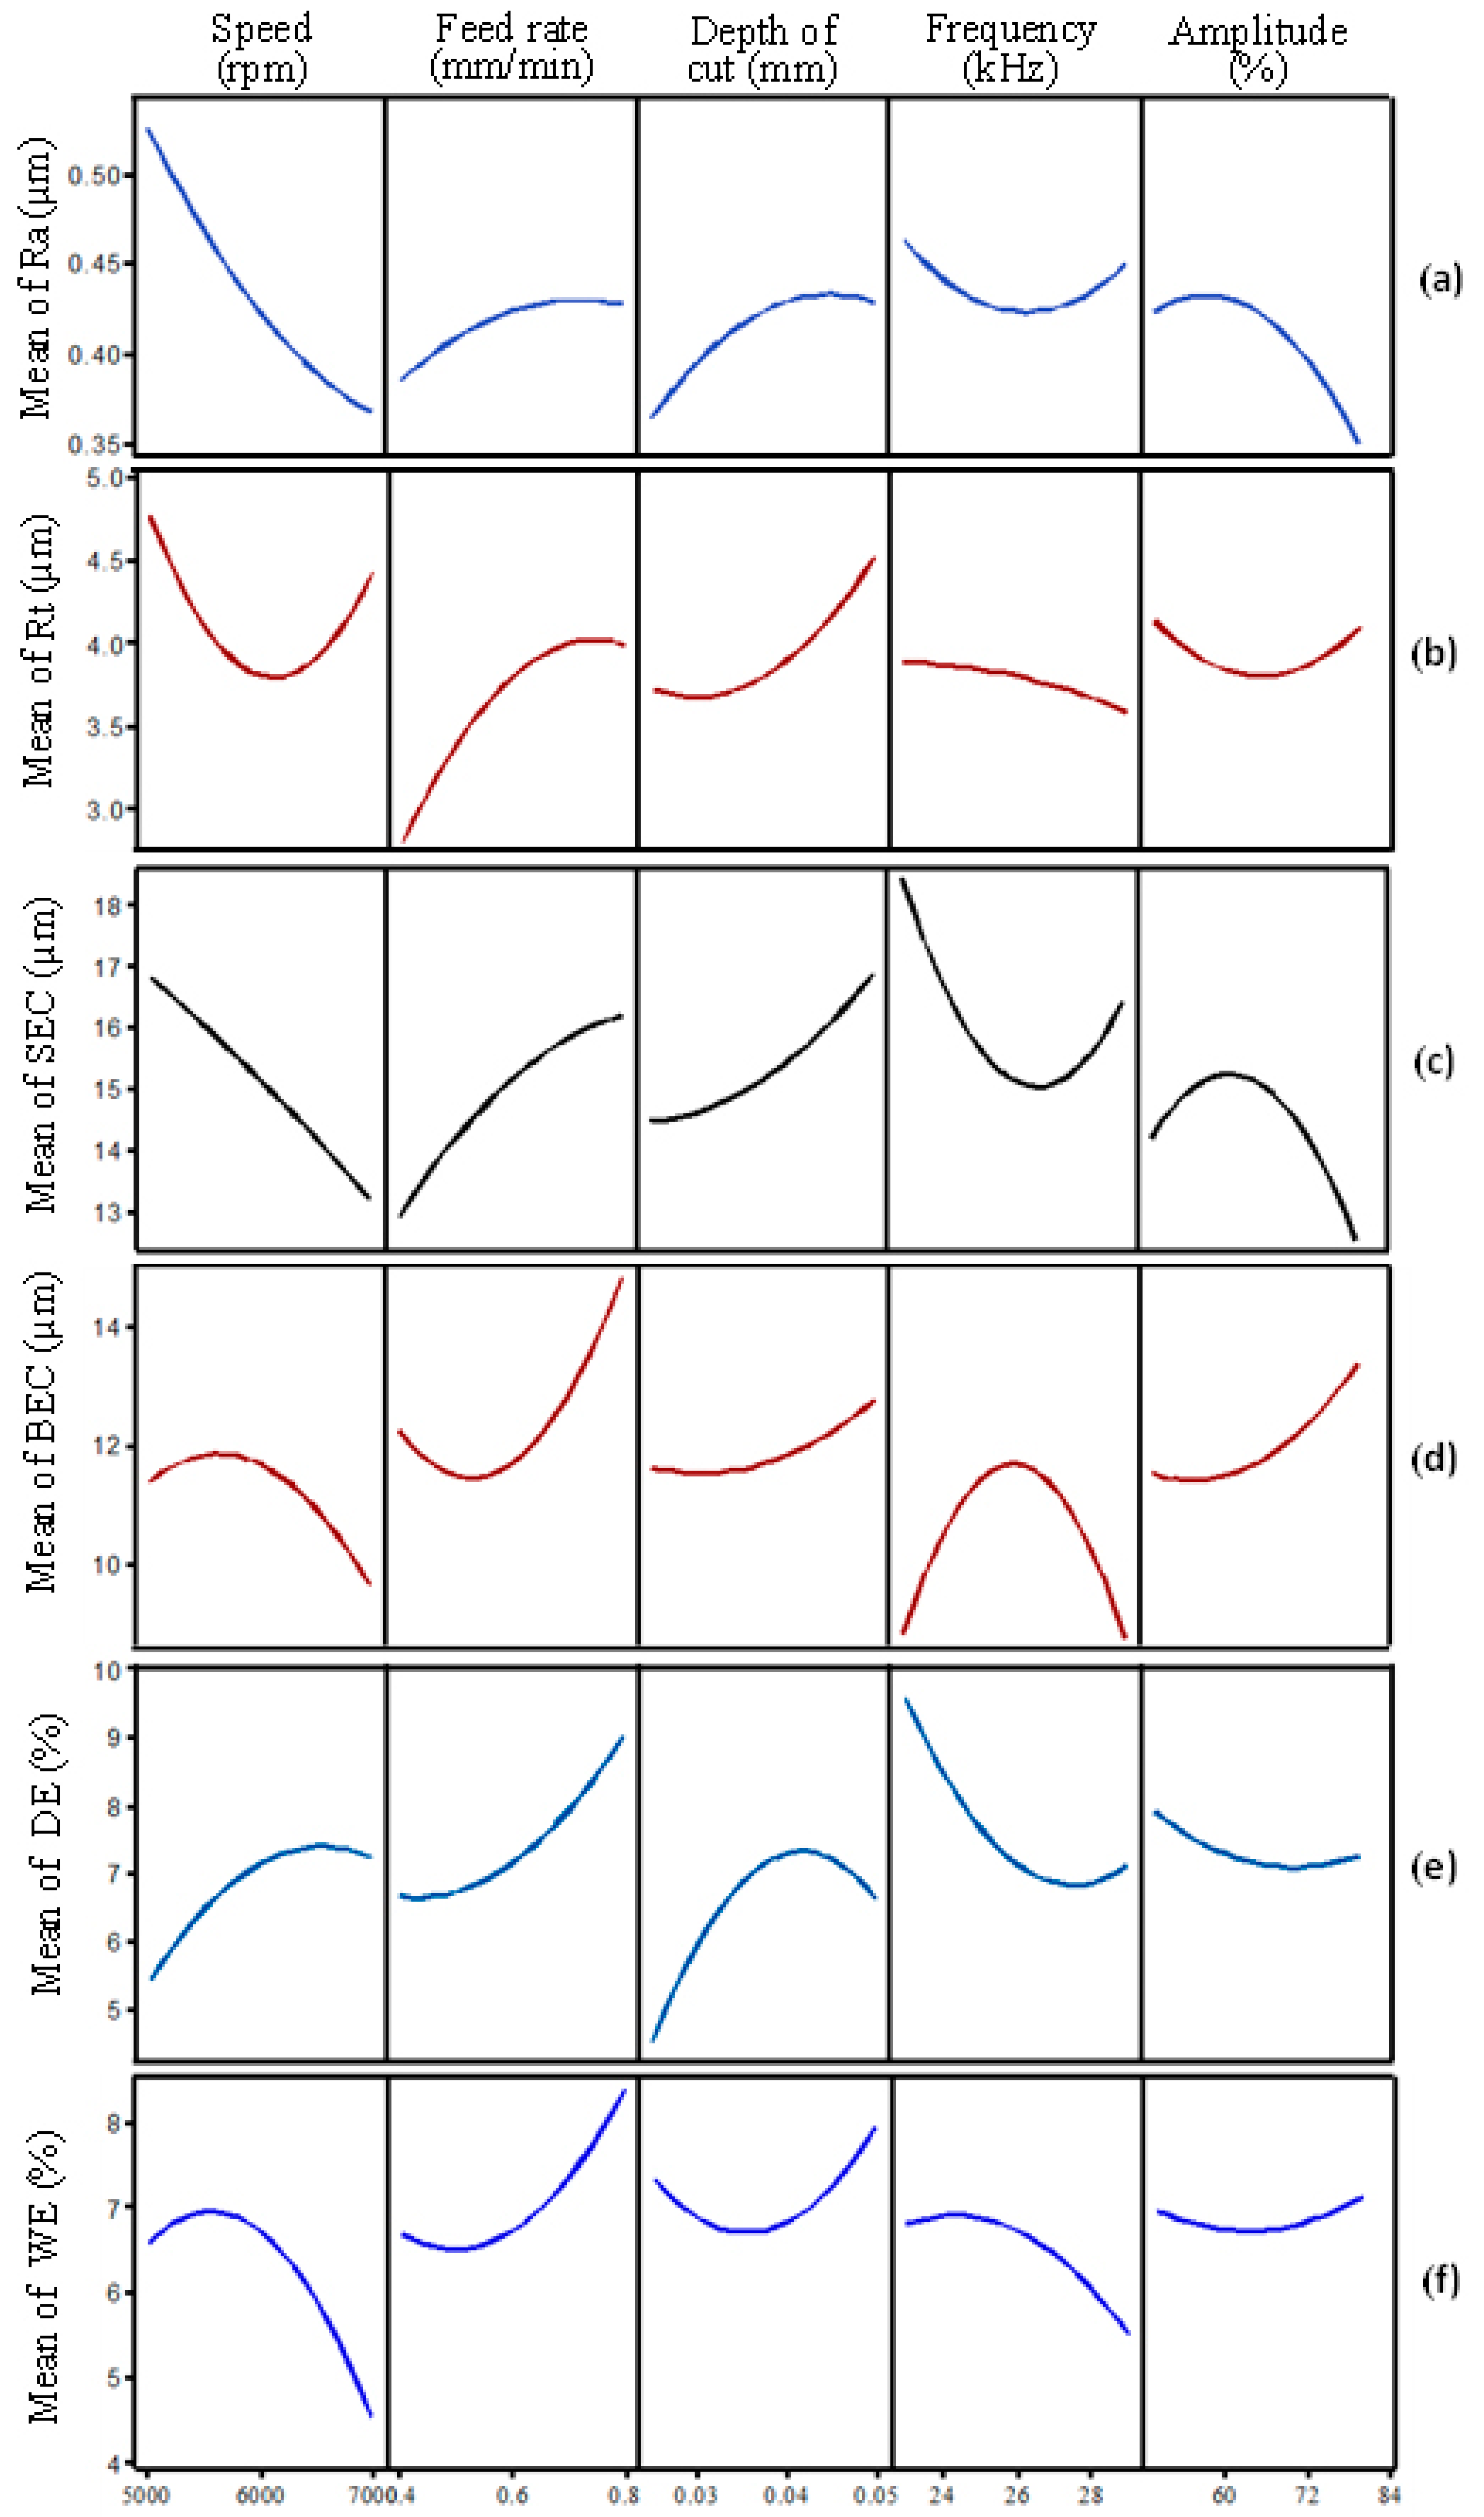
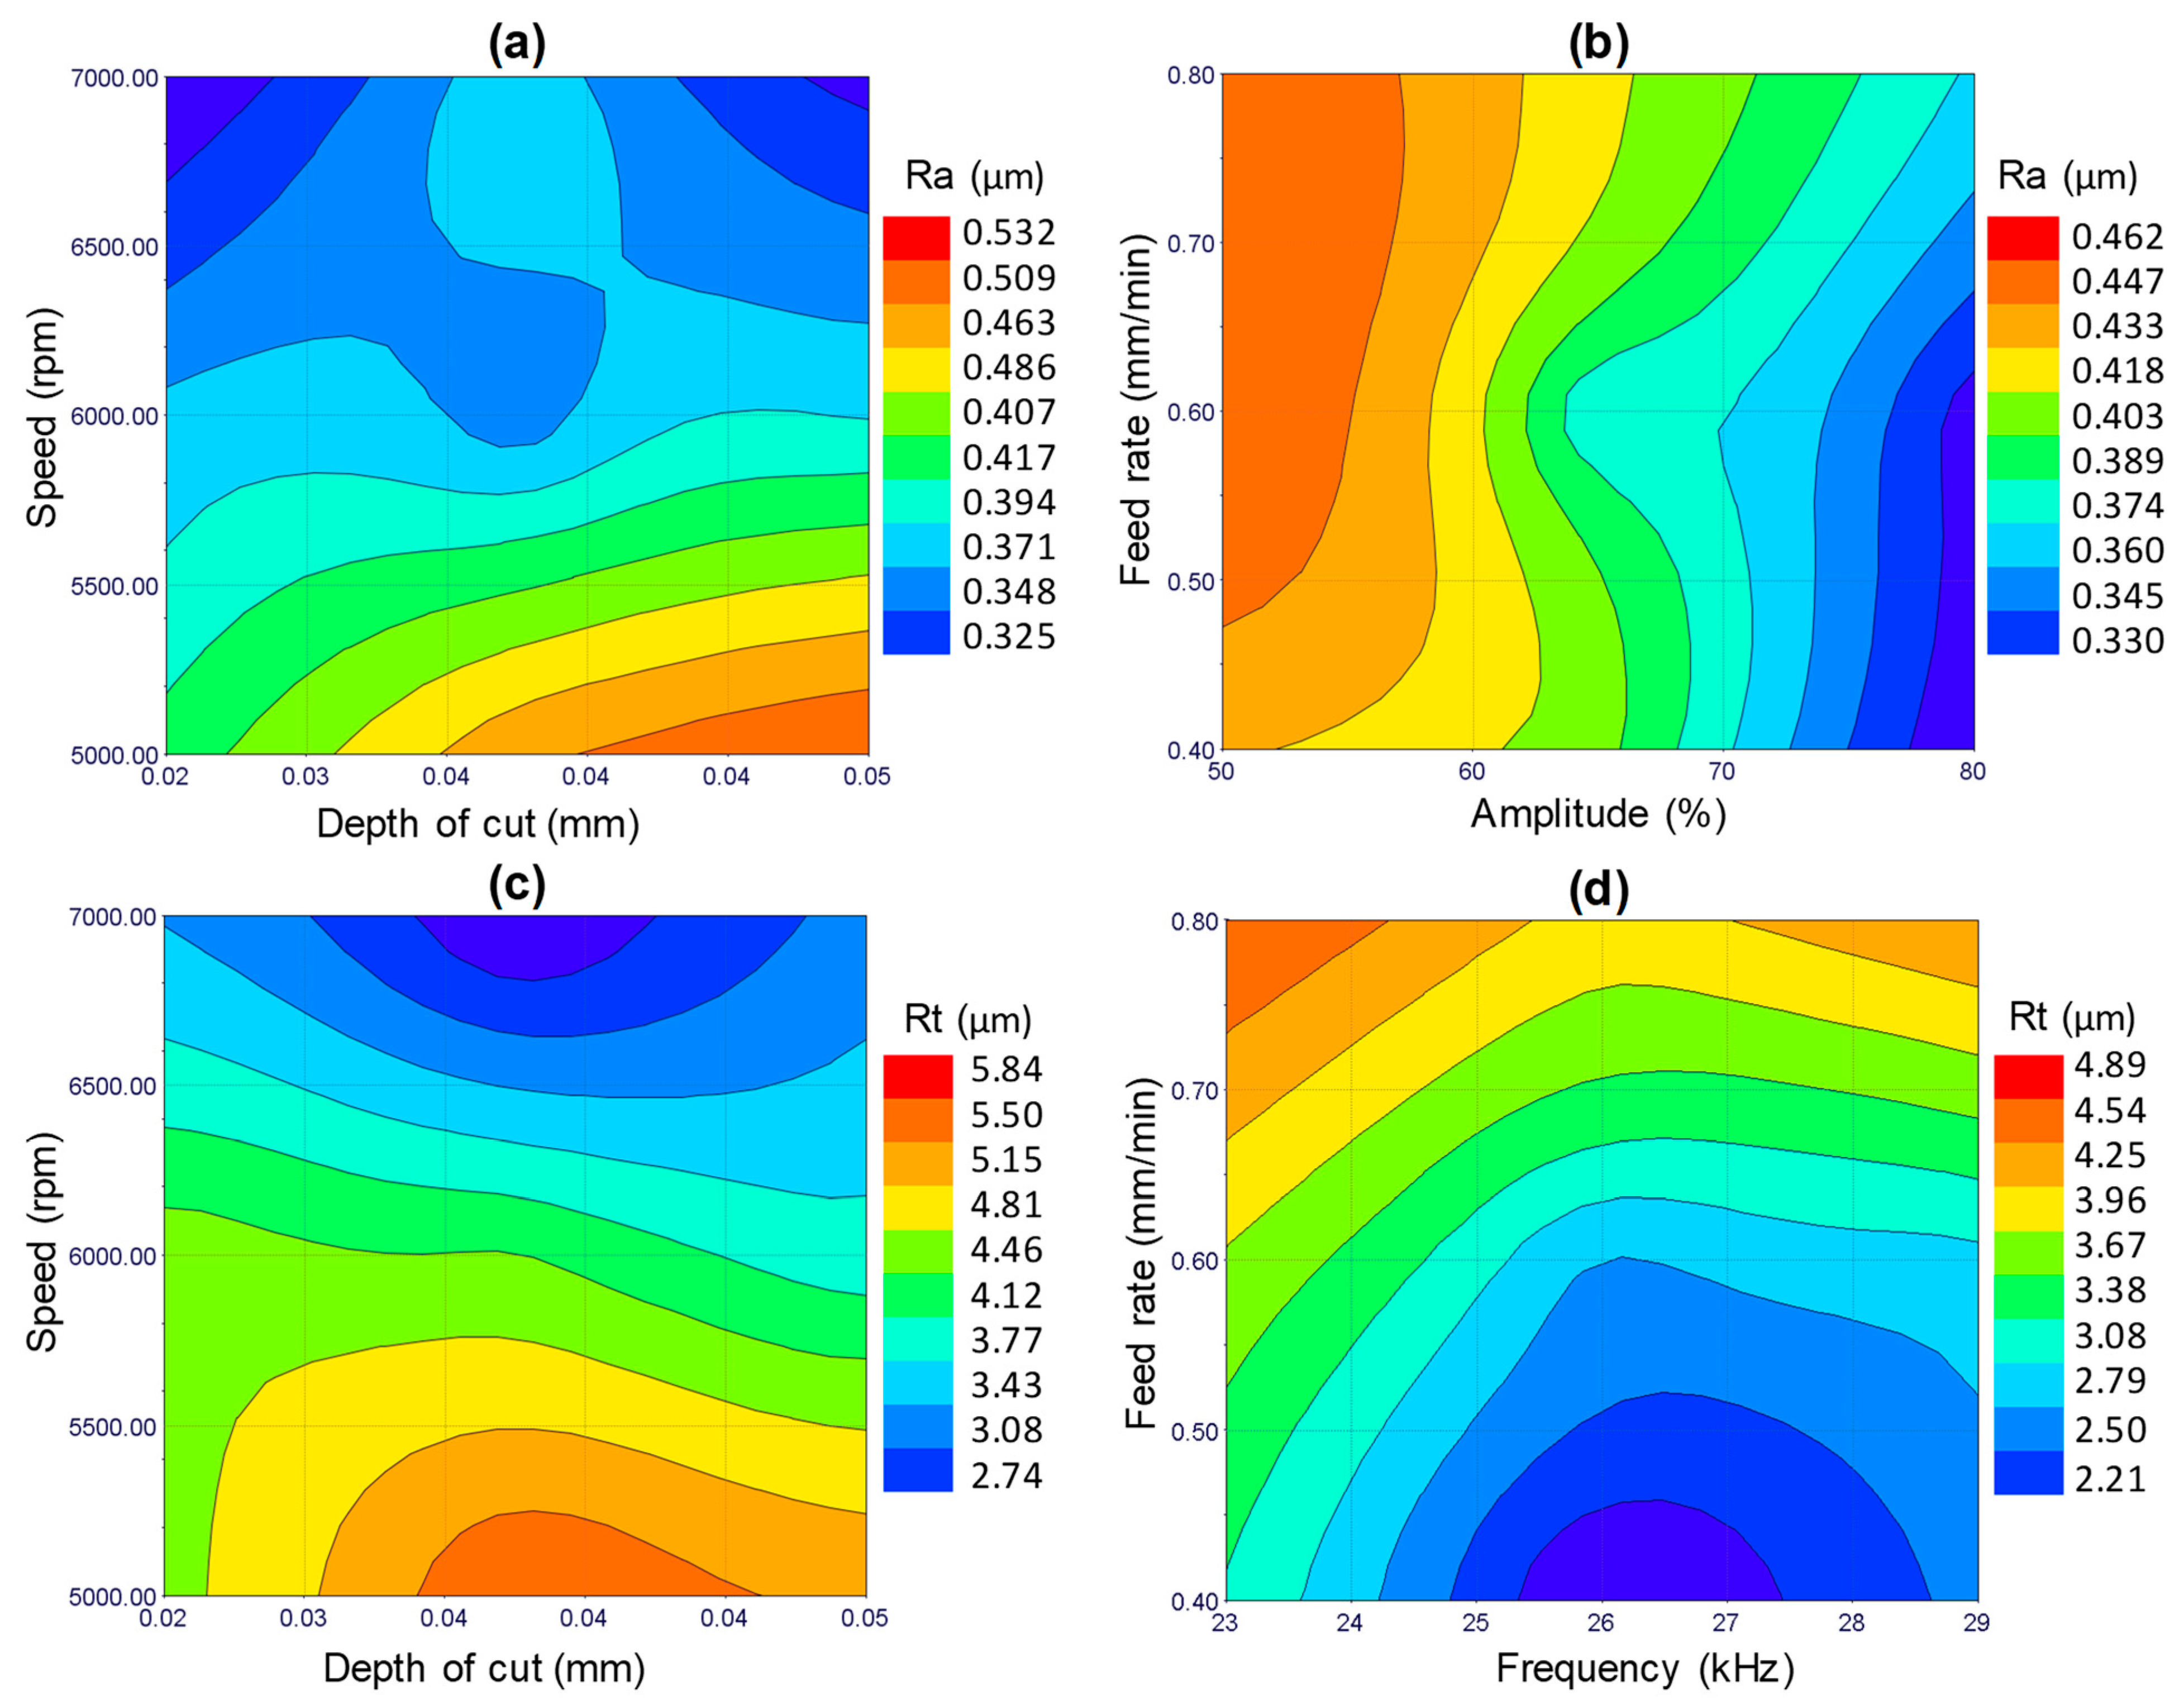
3.1. Effects of µ-RUM Parameters on Surface Roughness
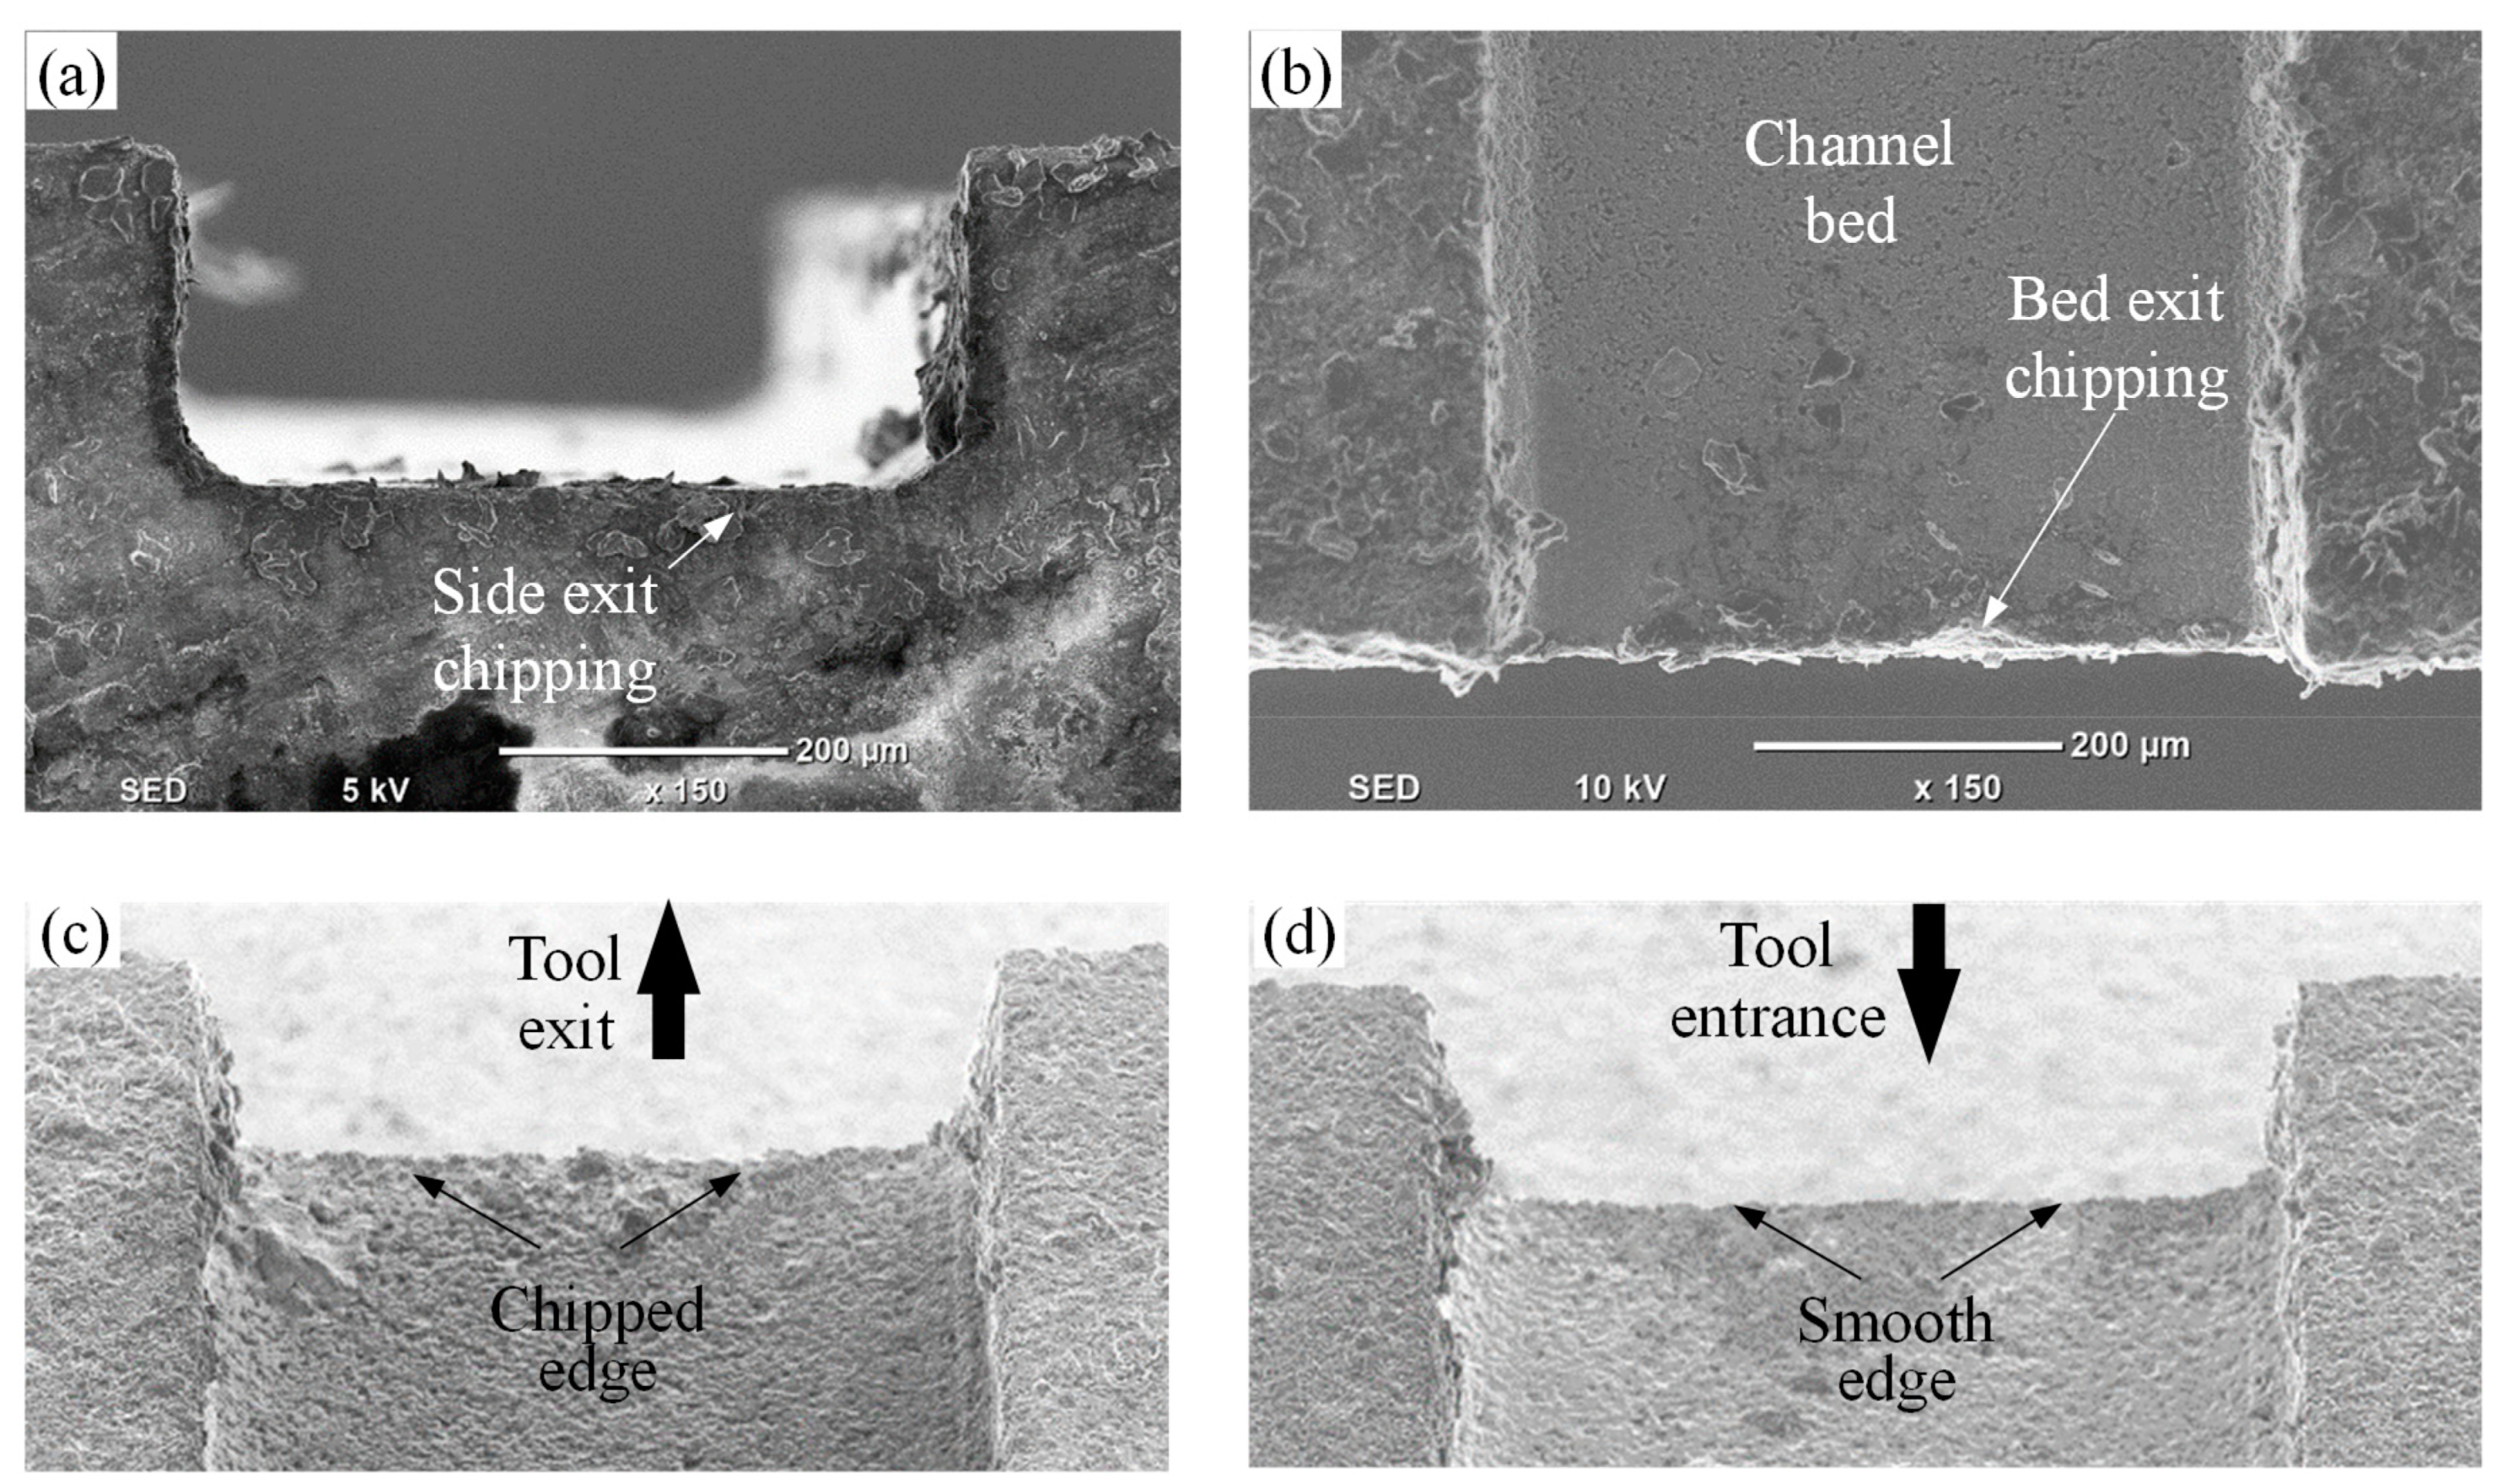
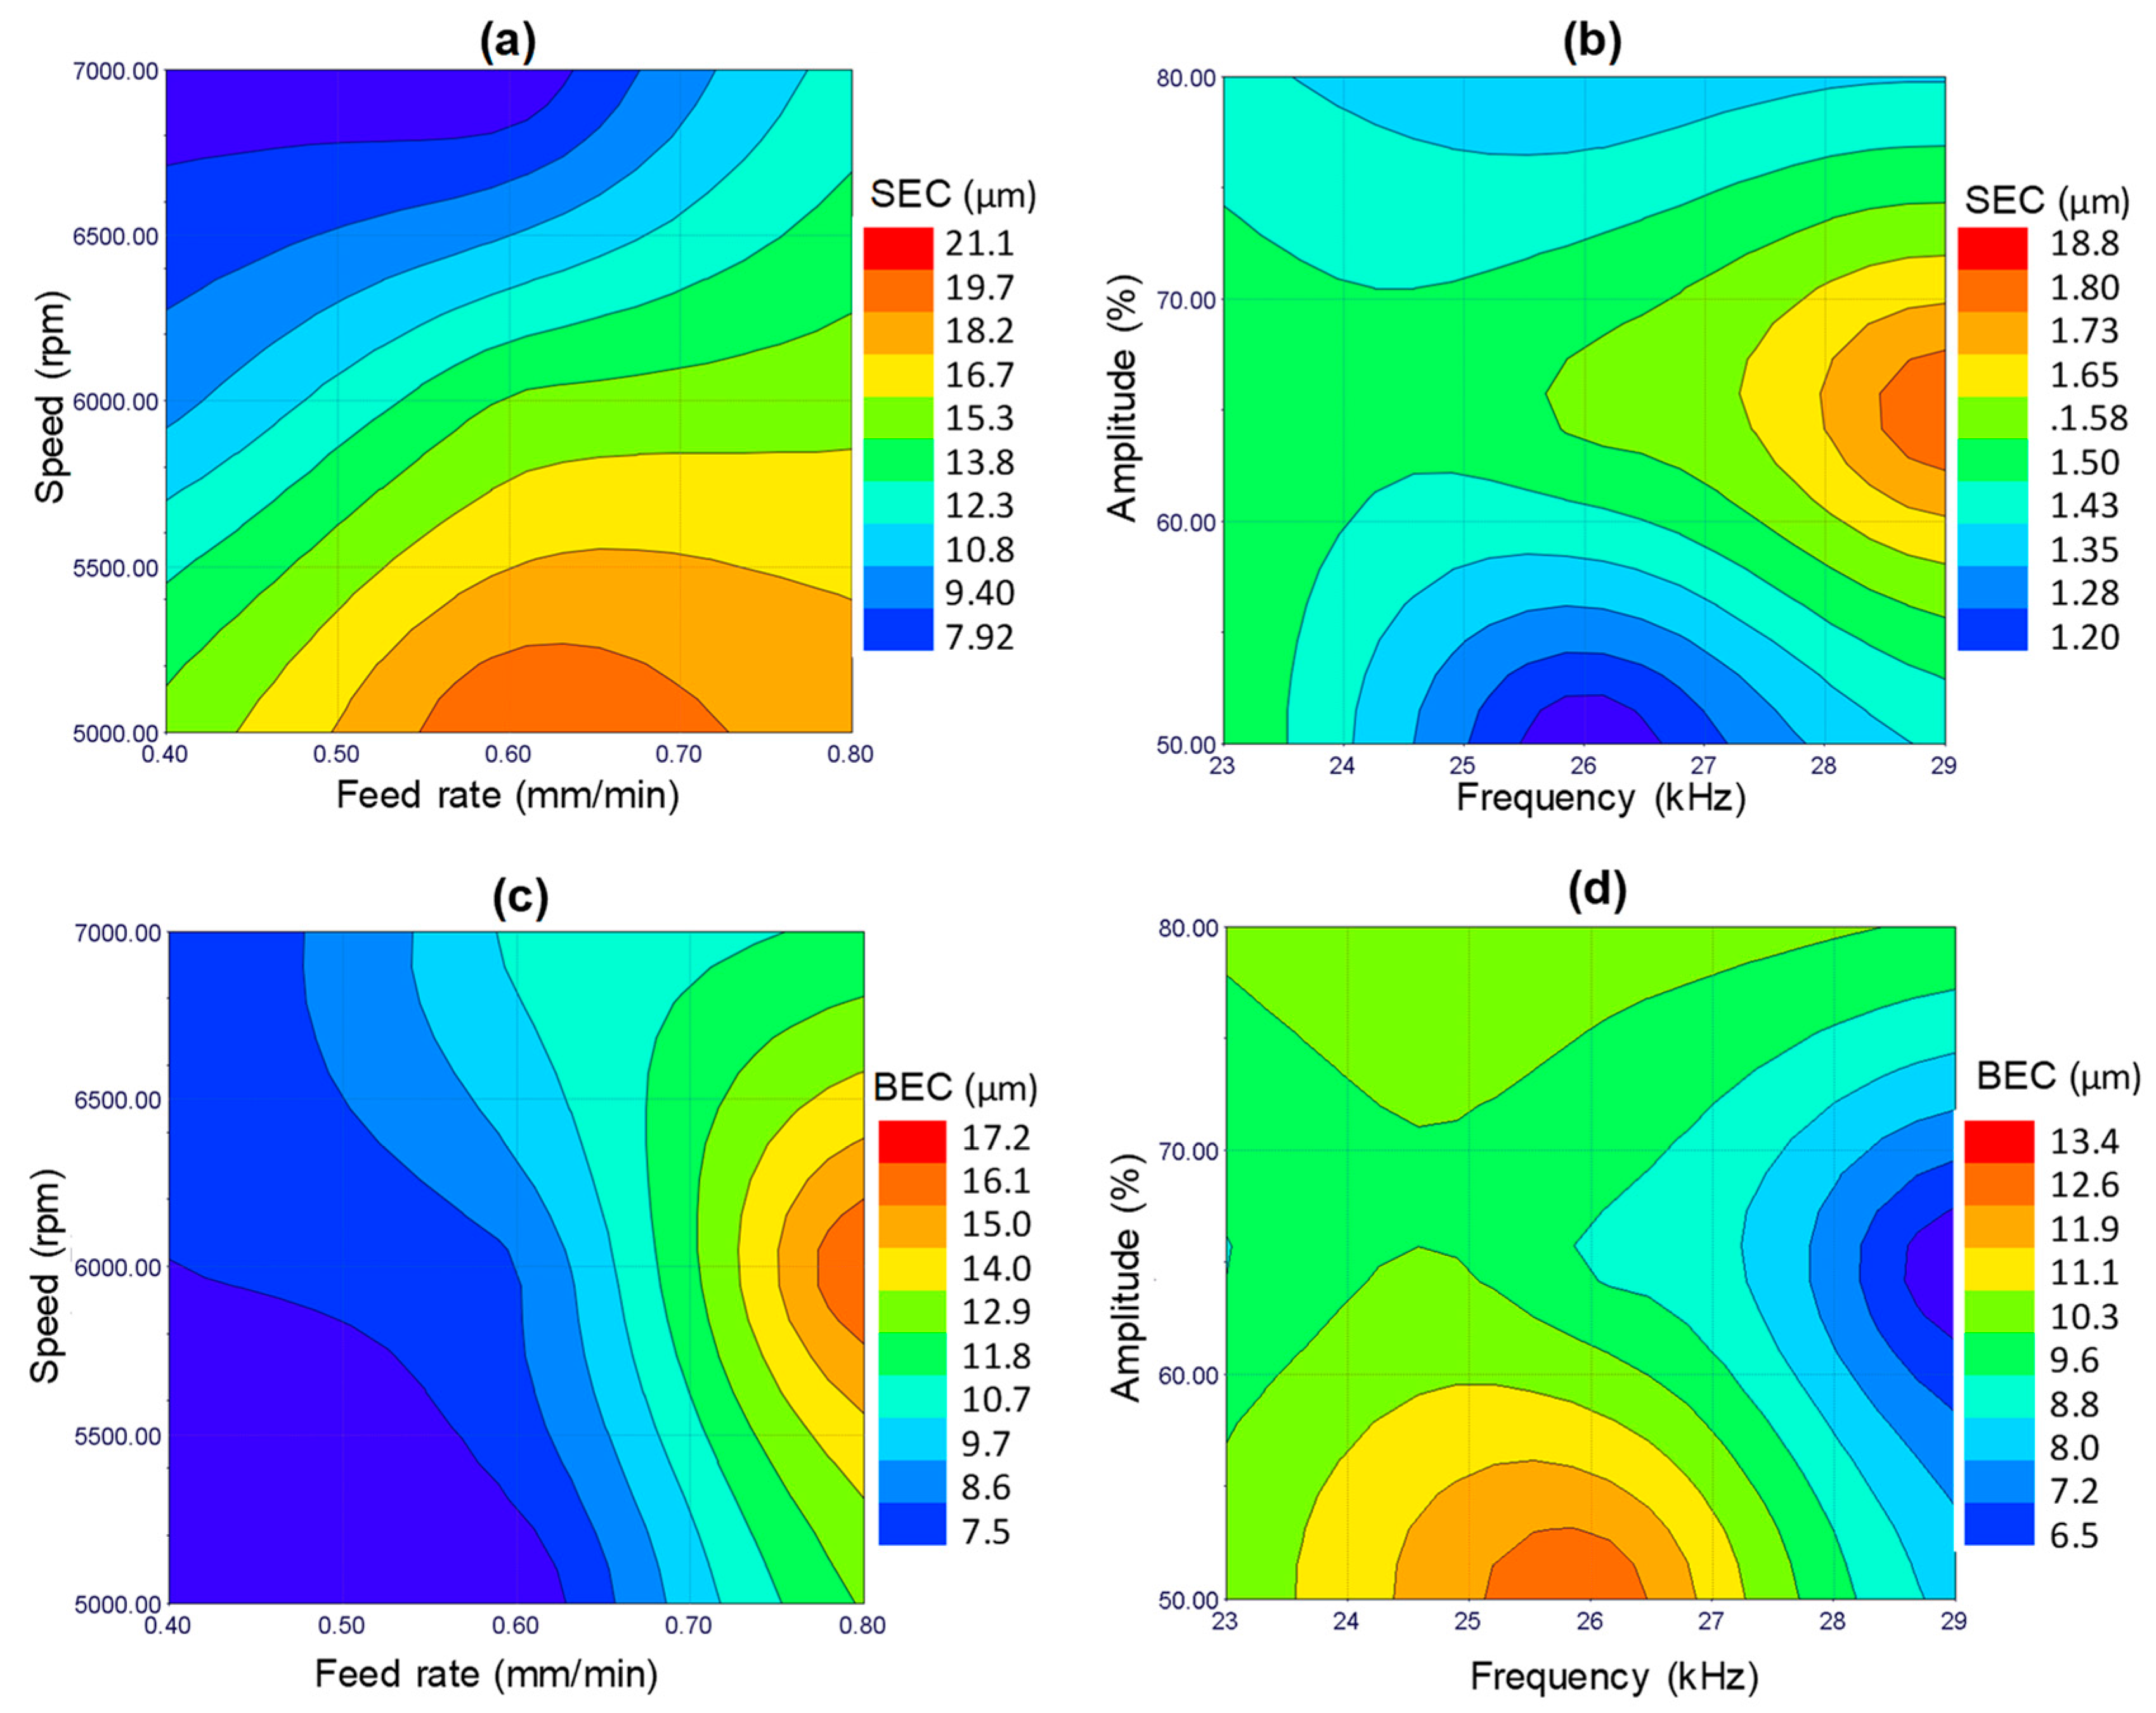
3.2. Effects of µ-RUM Parameters on Edge Chipping
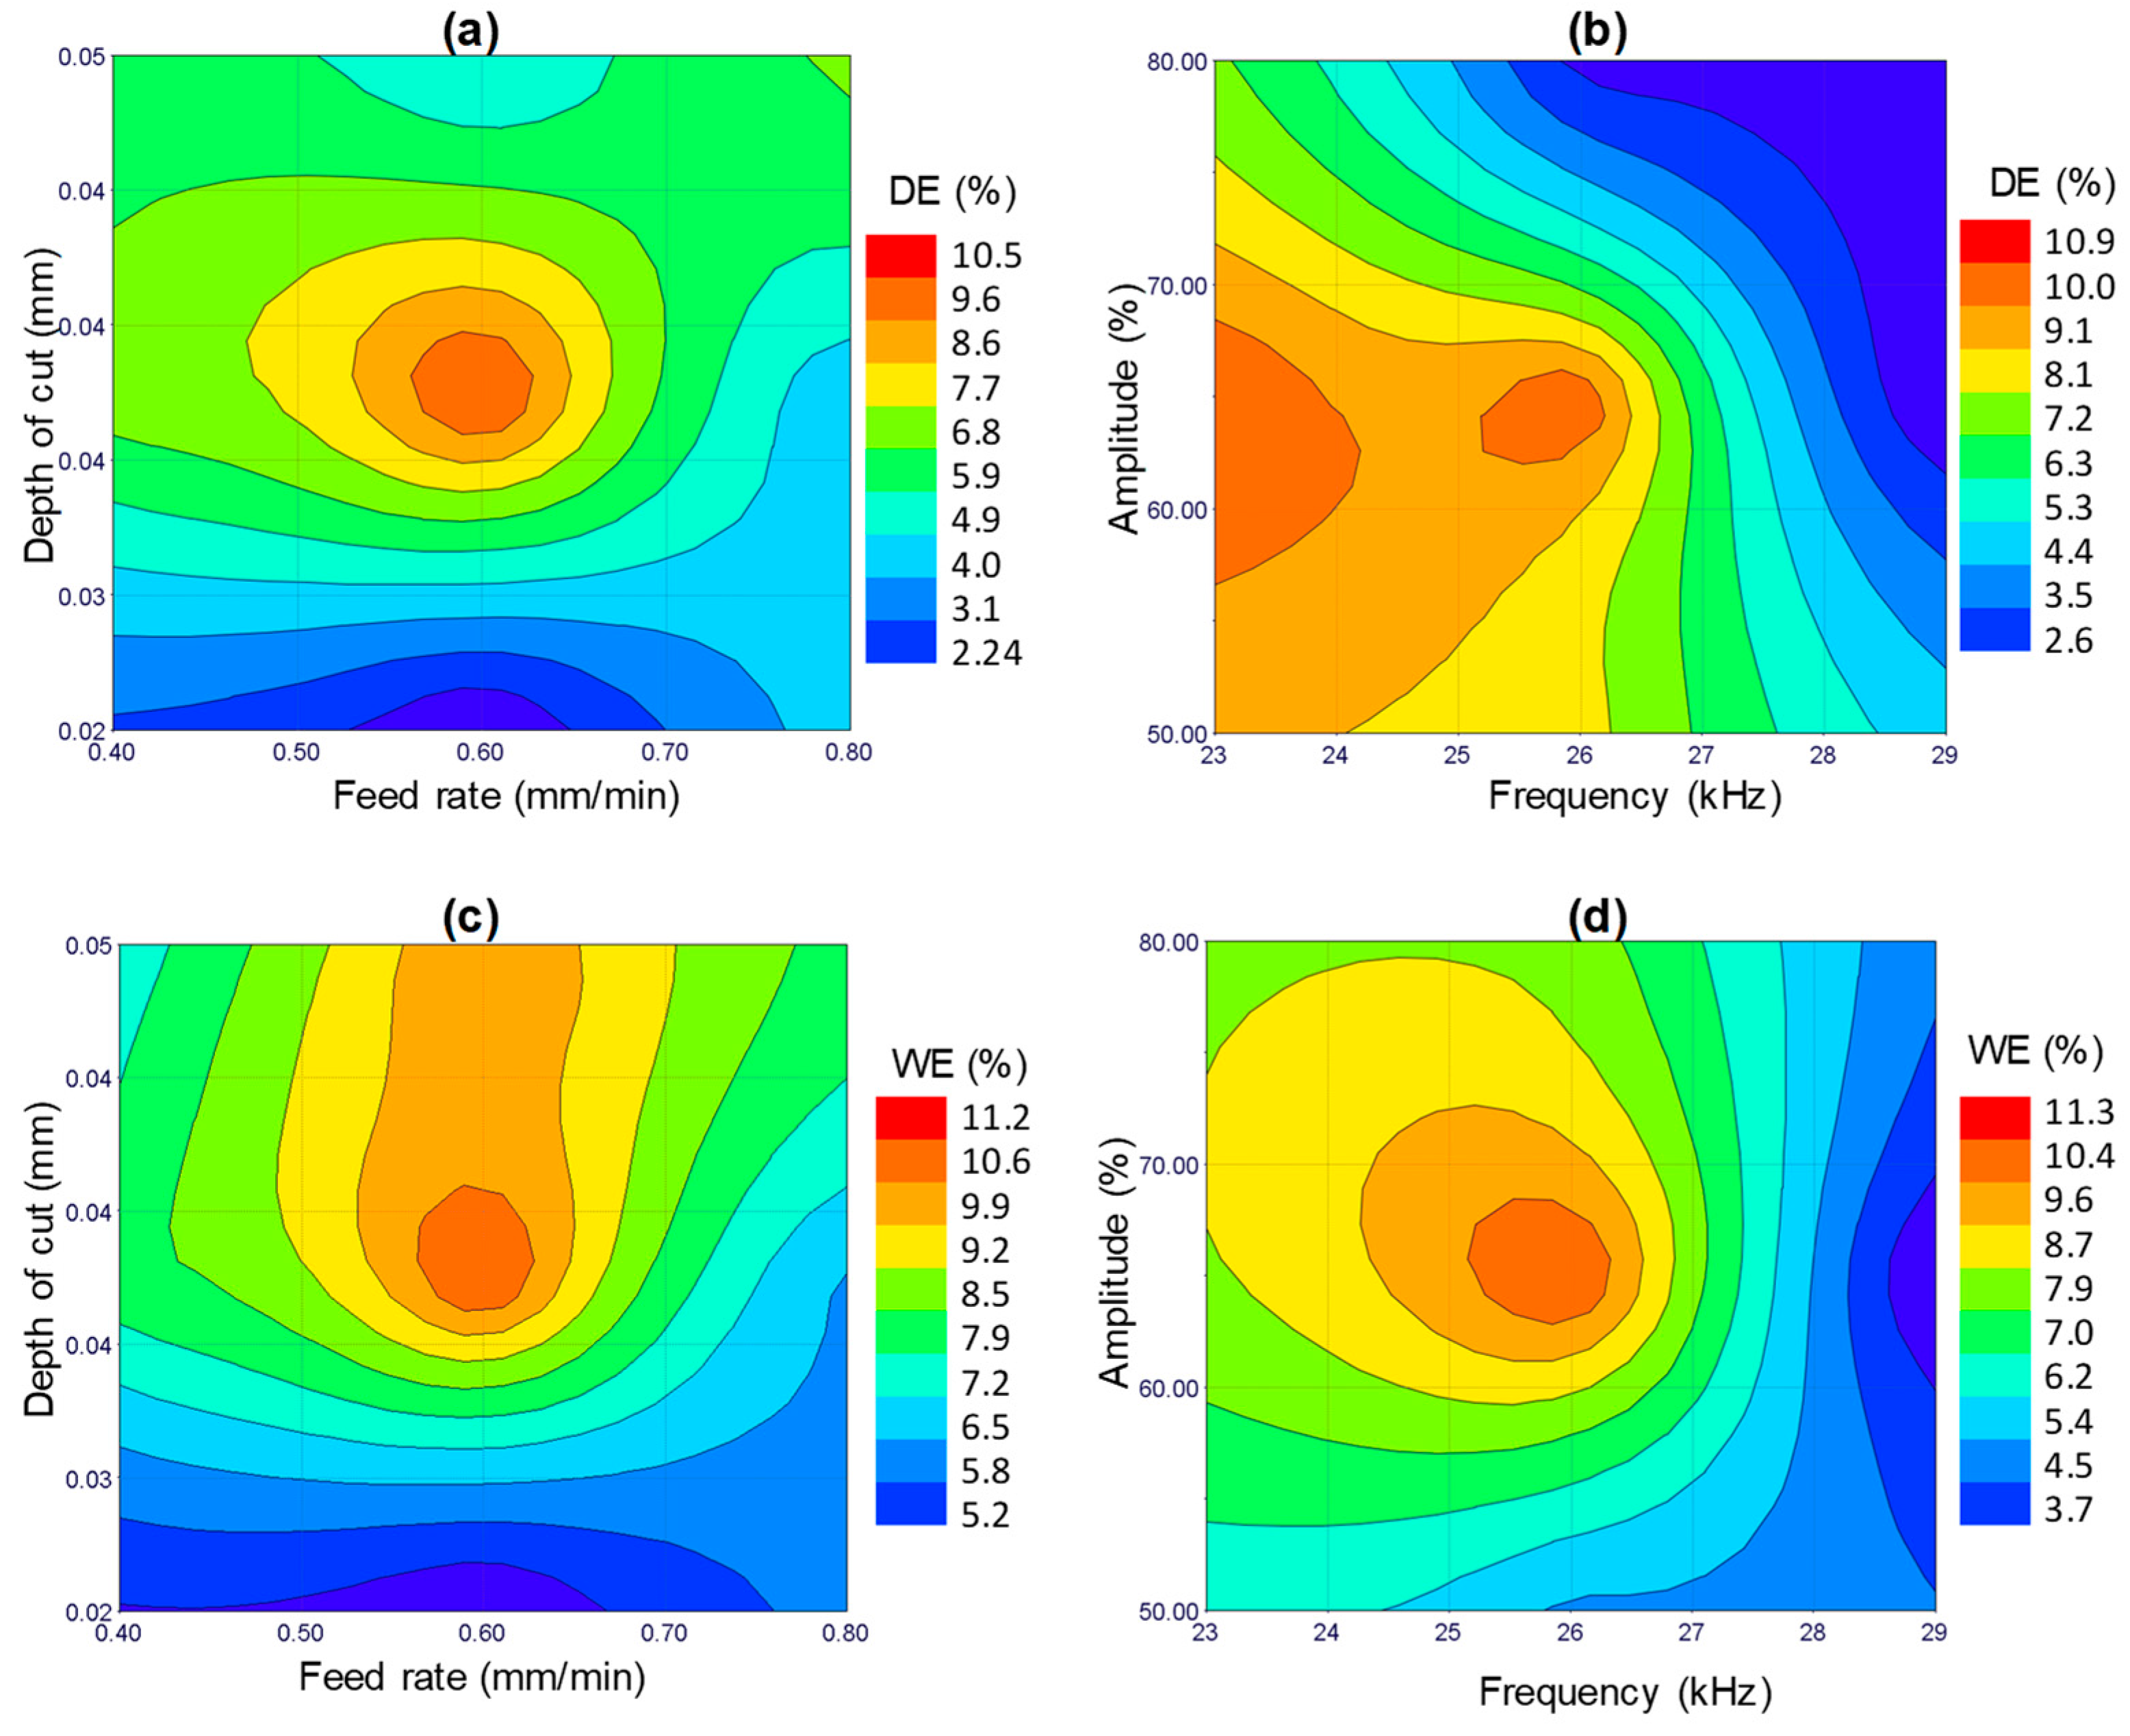
3.3. Effects of µ-RUM Parameters on Dimensional Errors
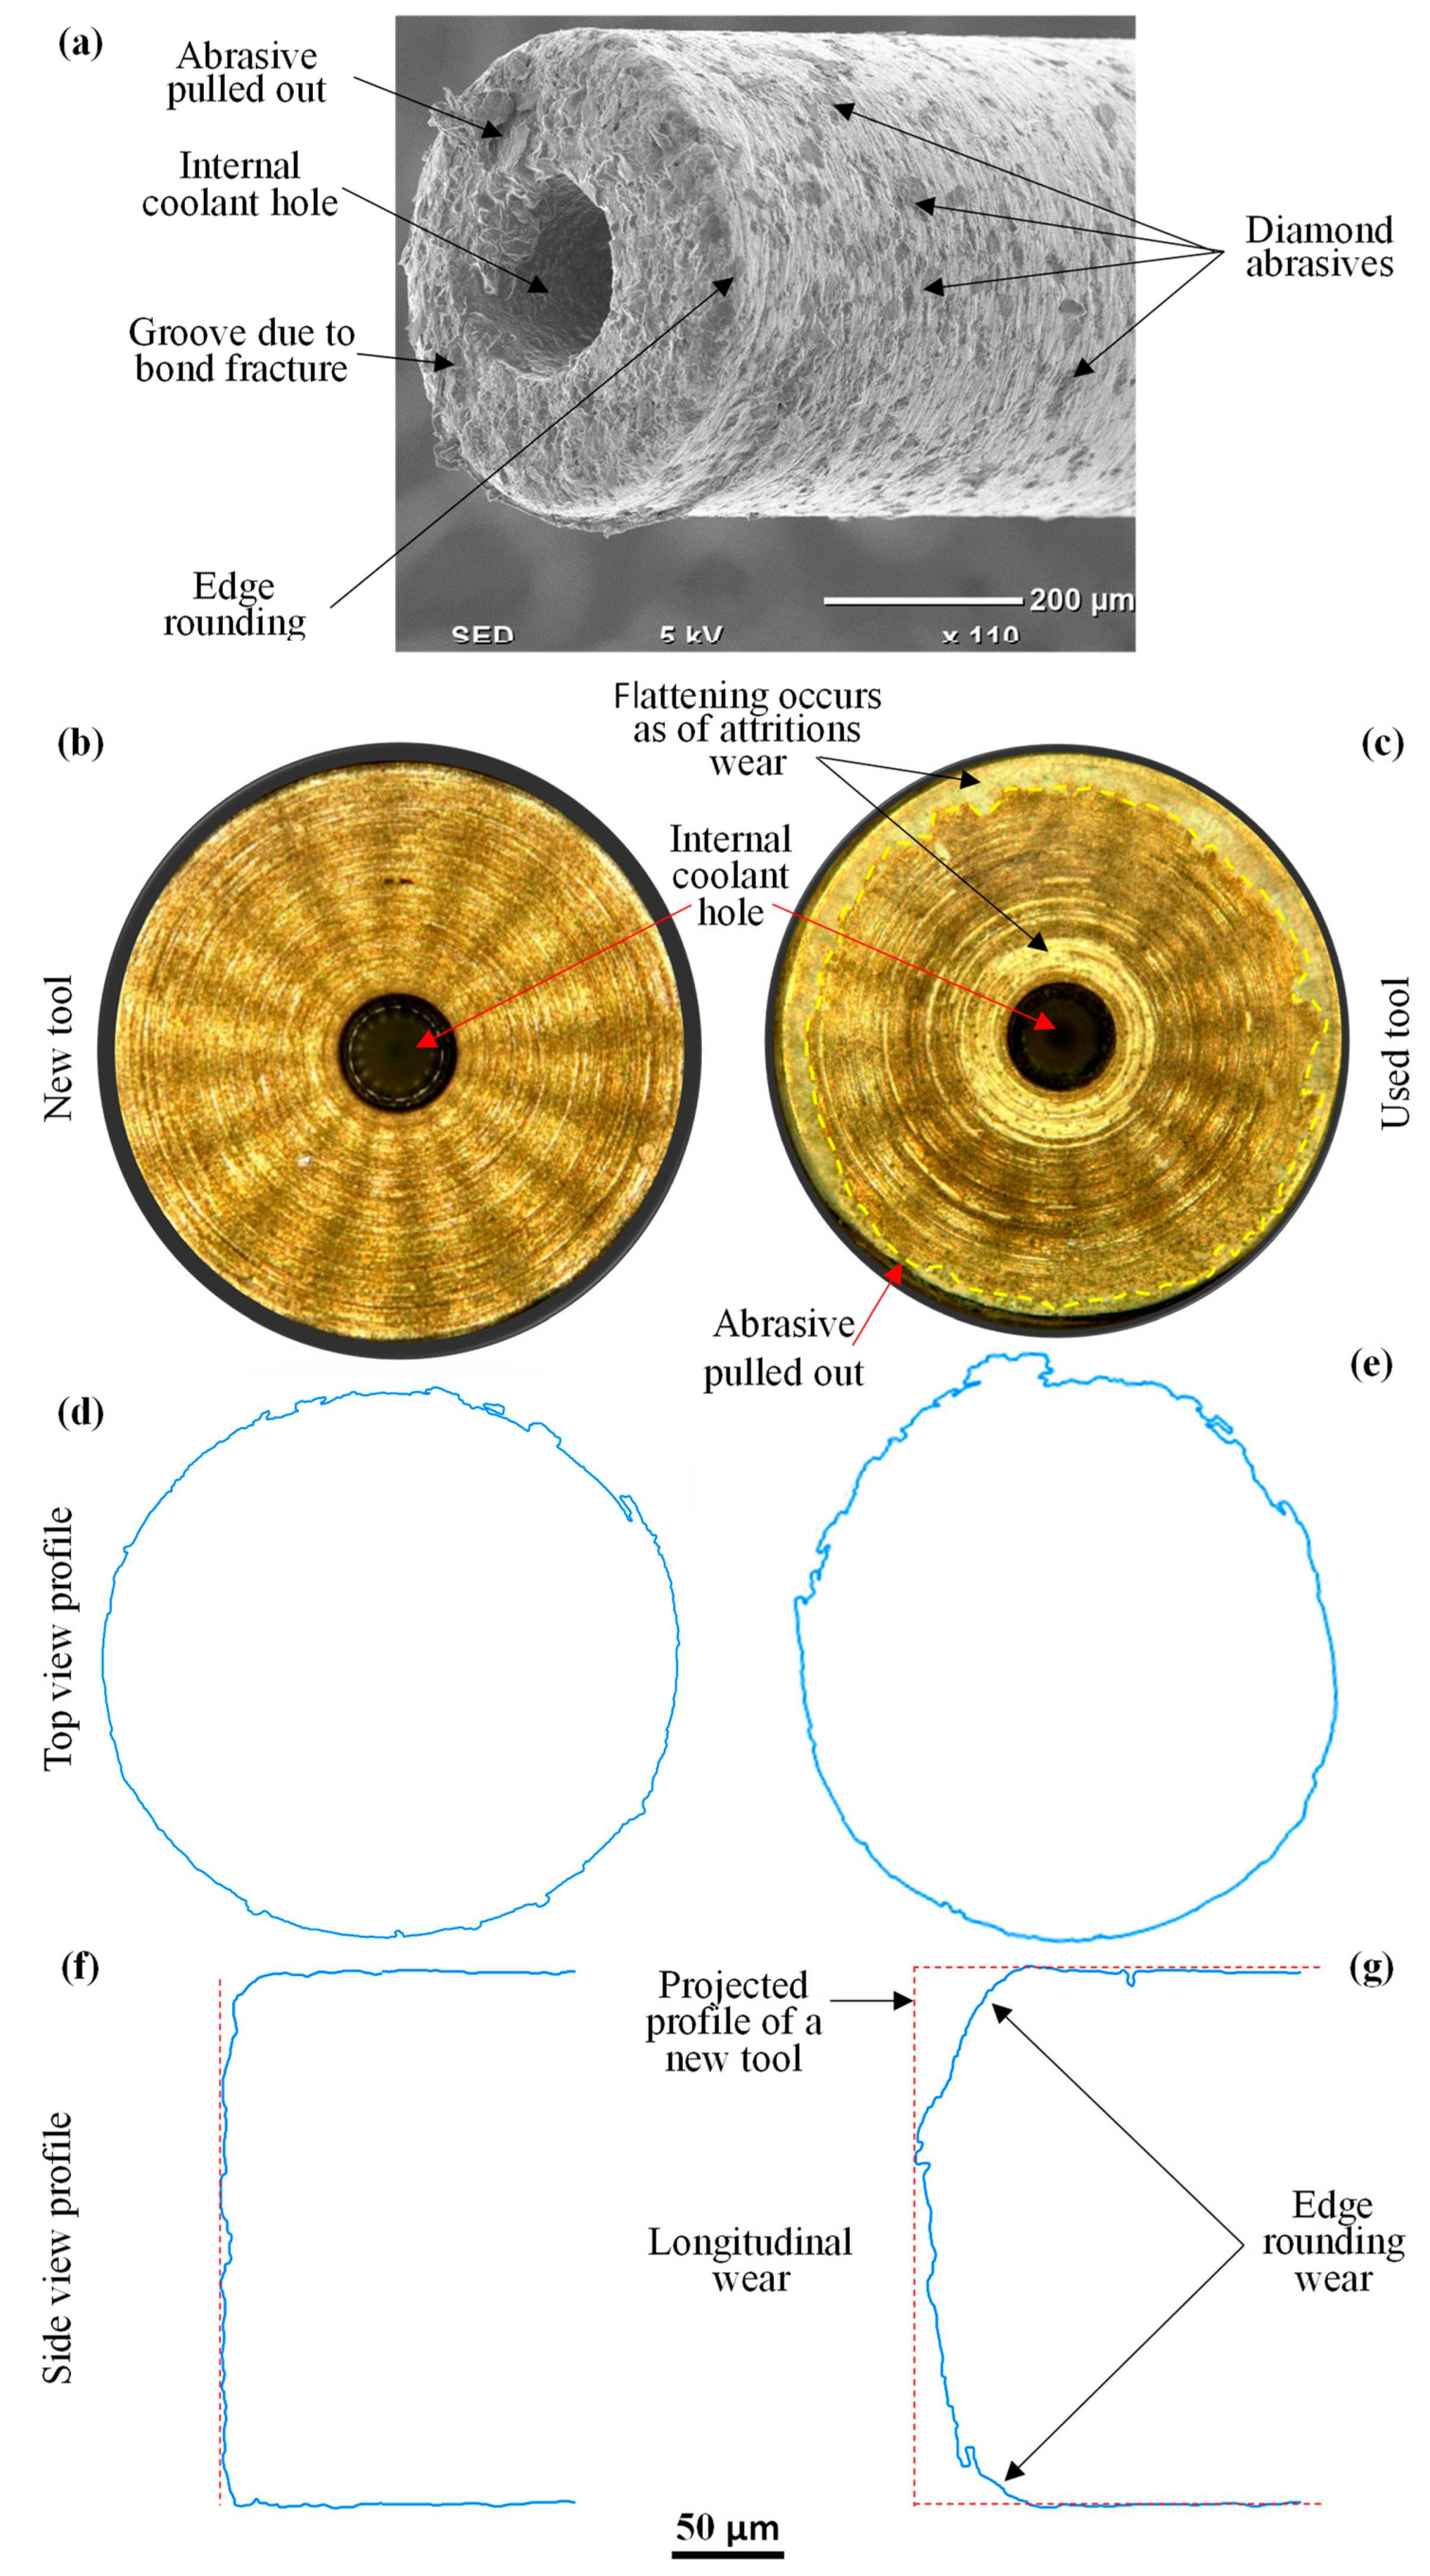
3.4. Tool Wear
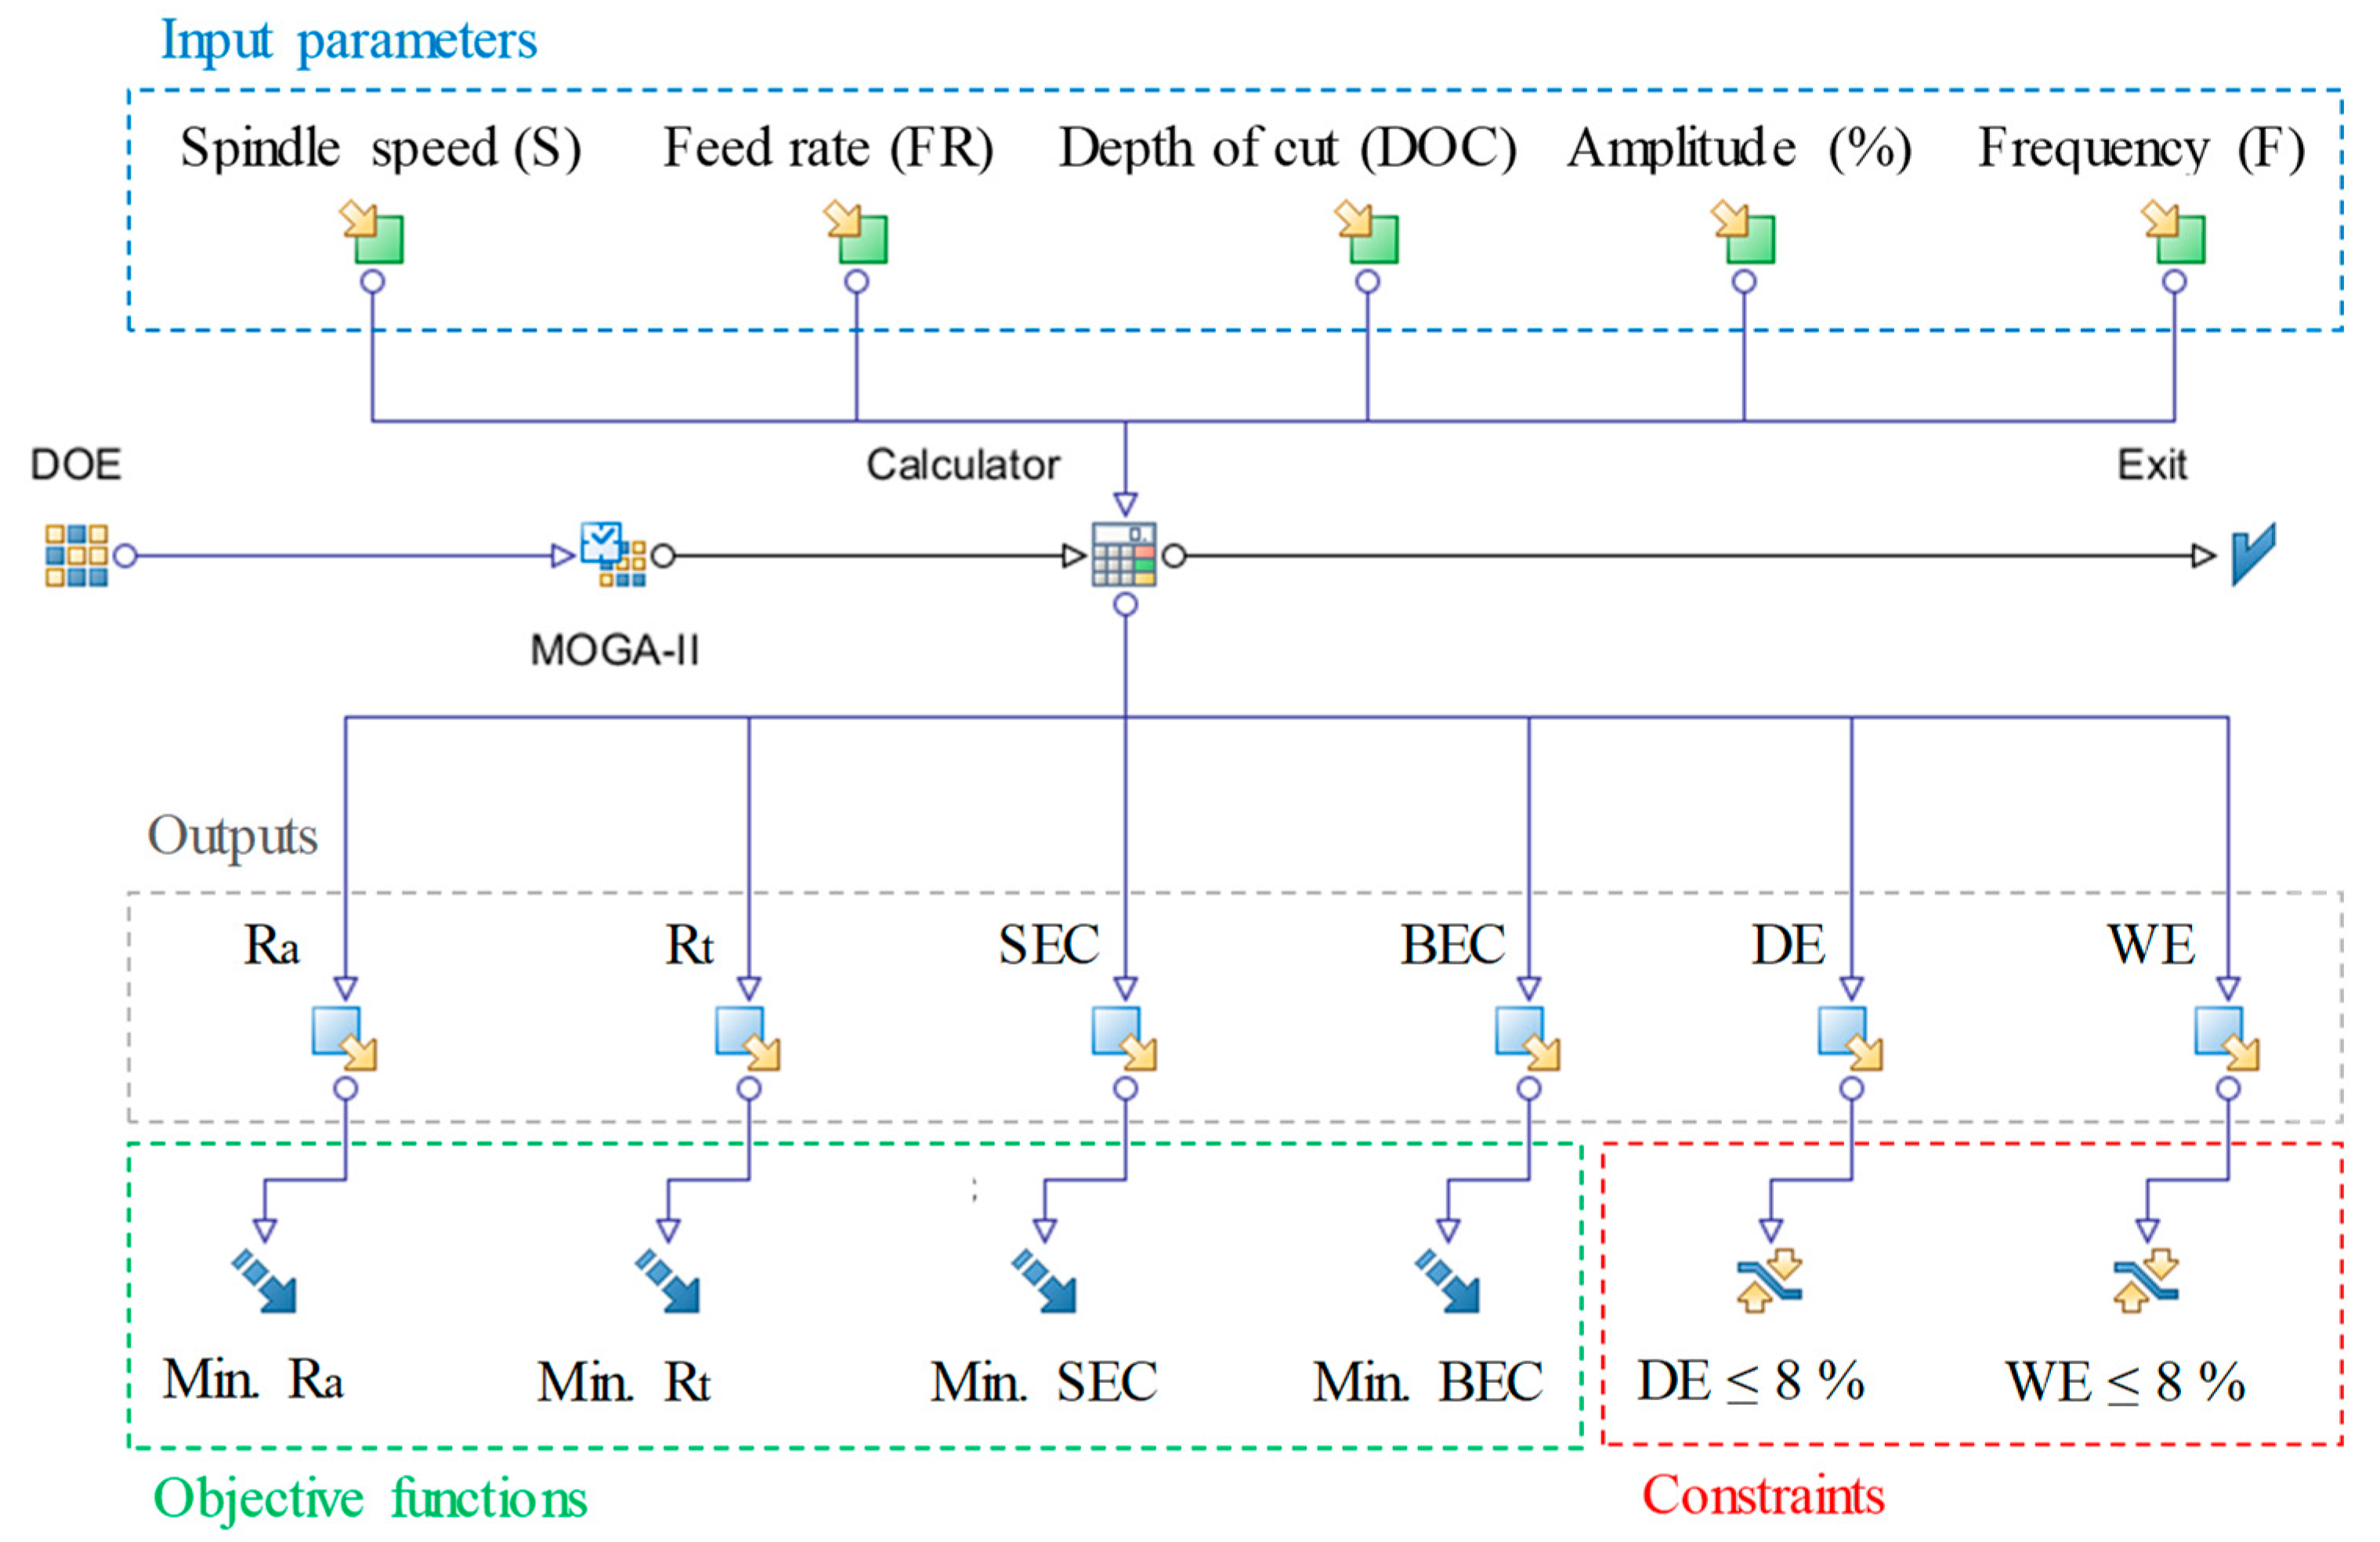
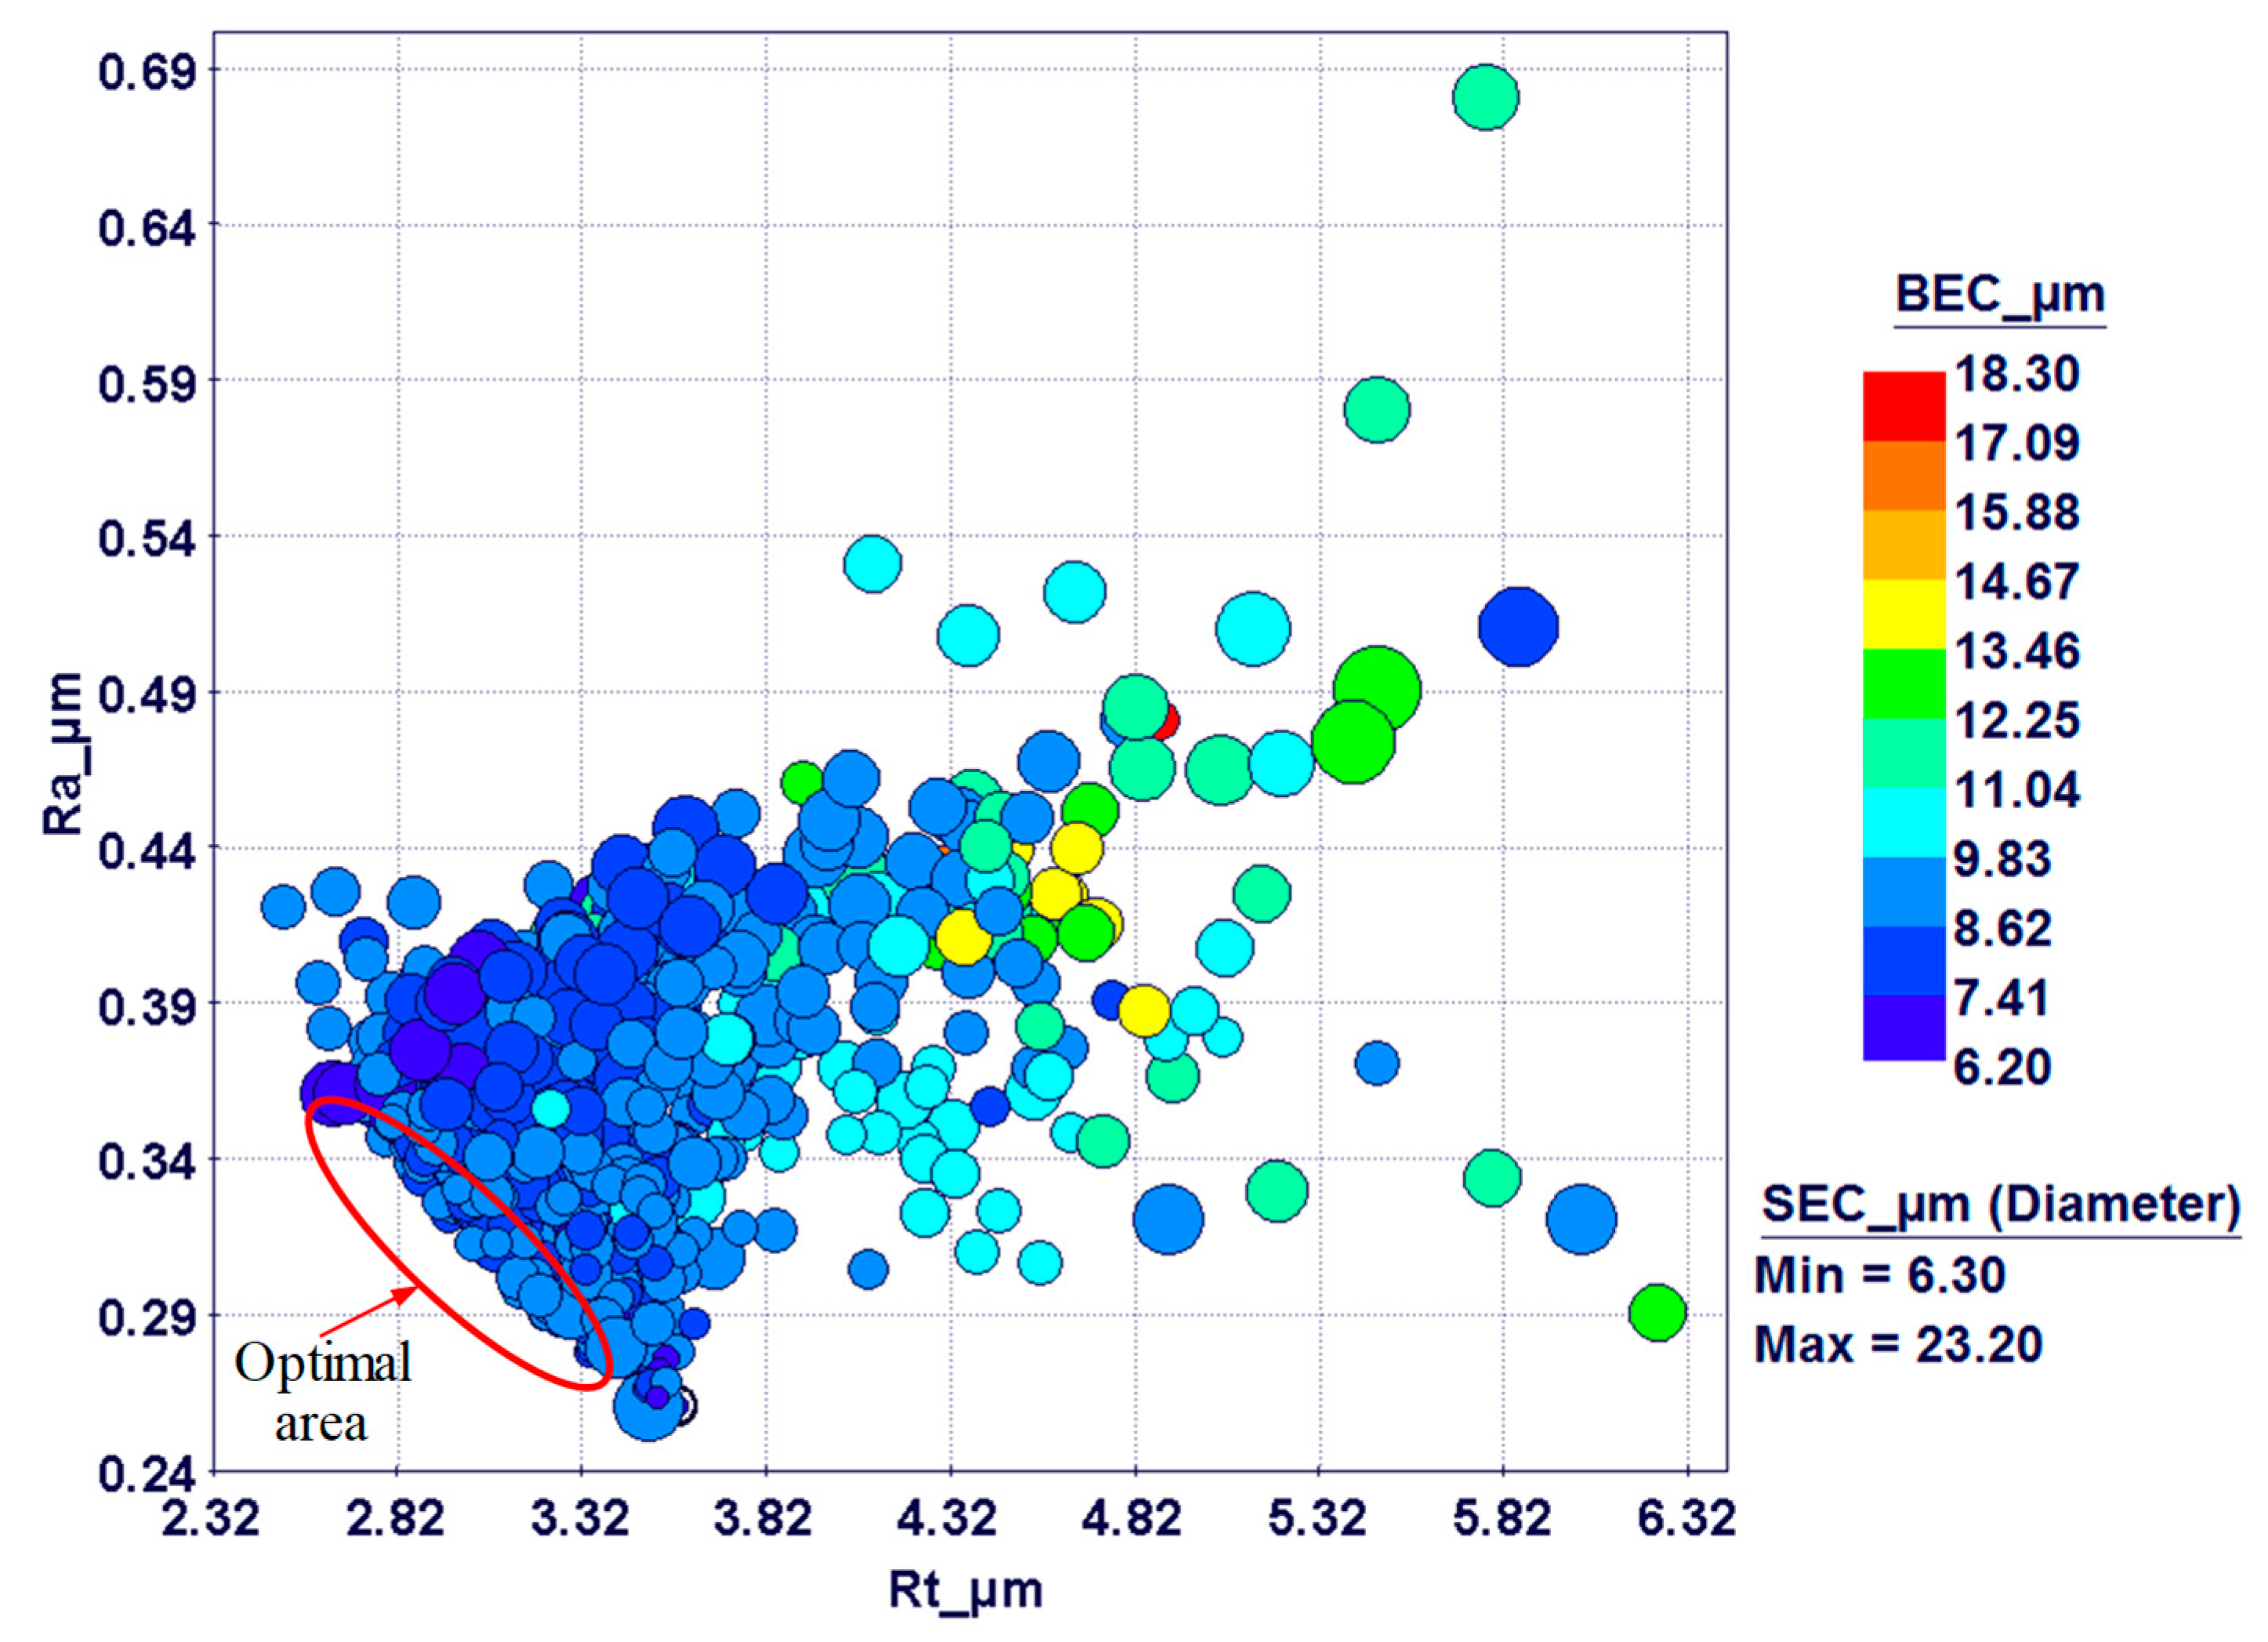
3.5. Optimization Results
4. Conclusions
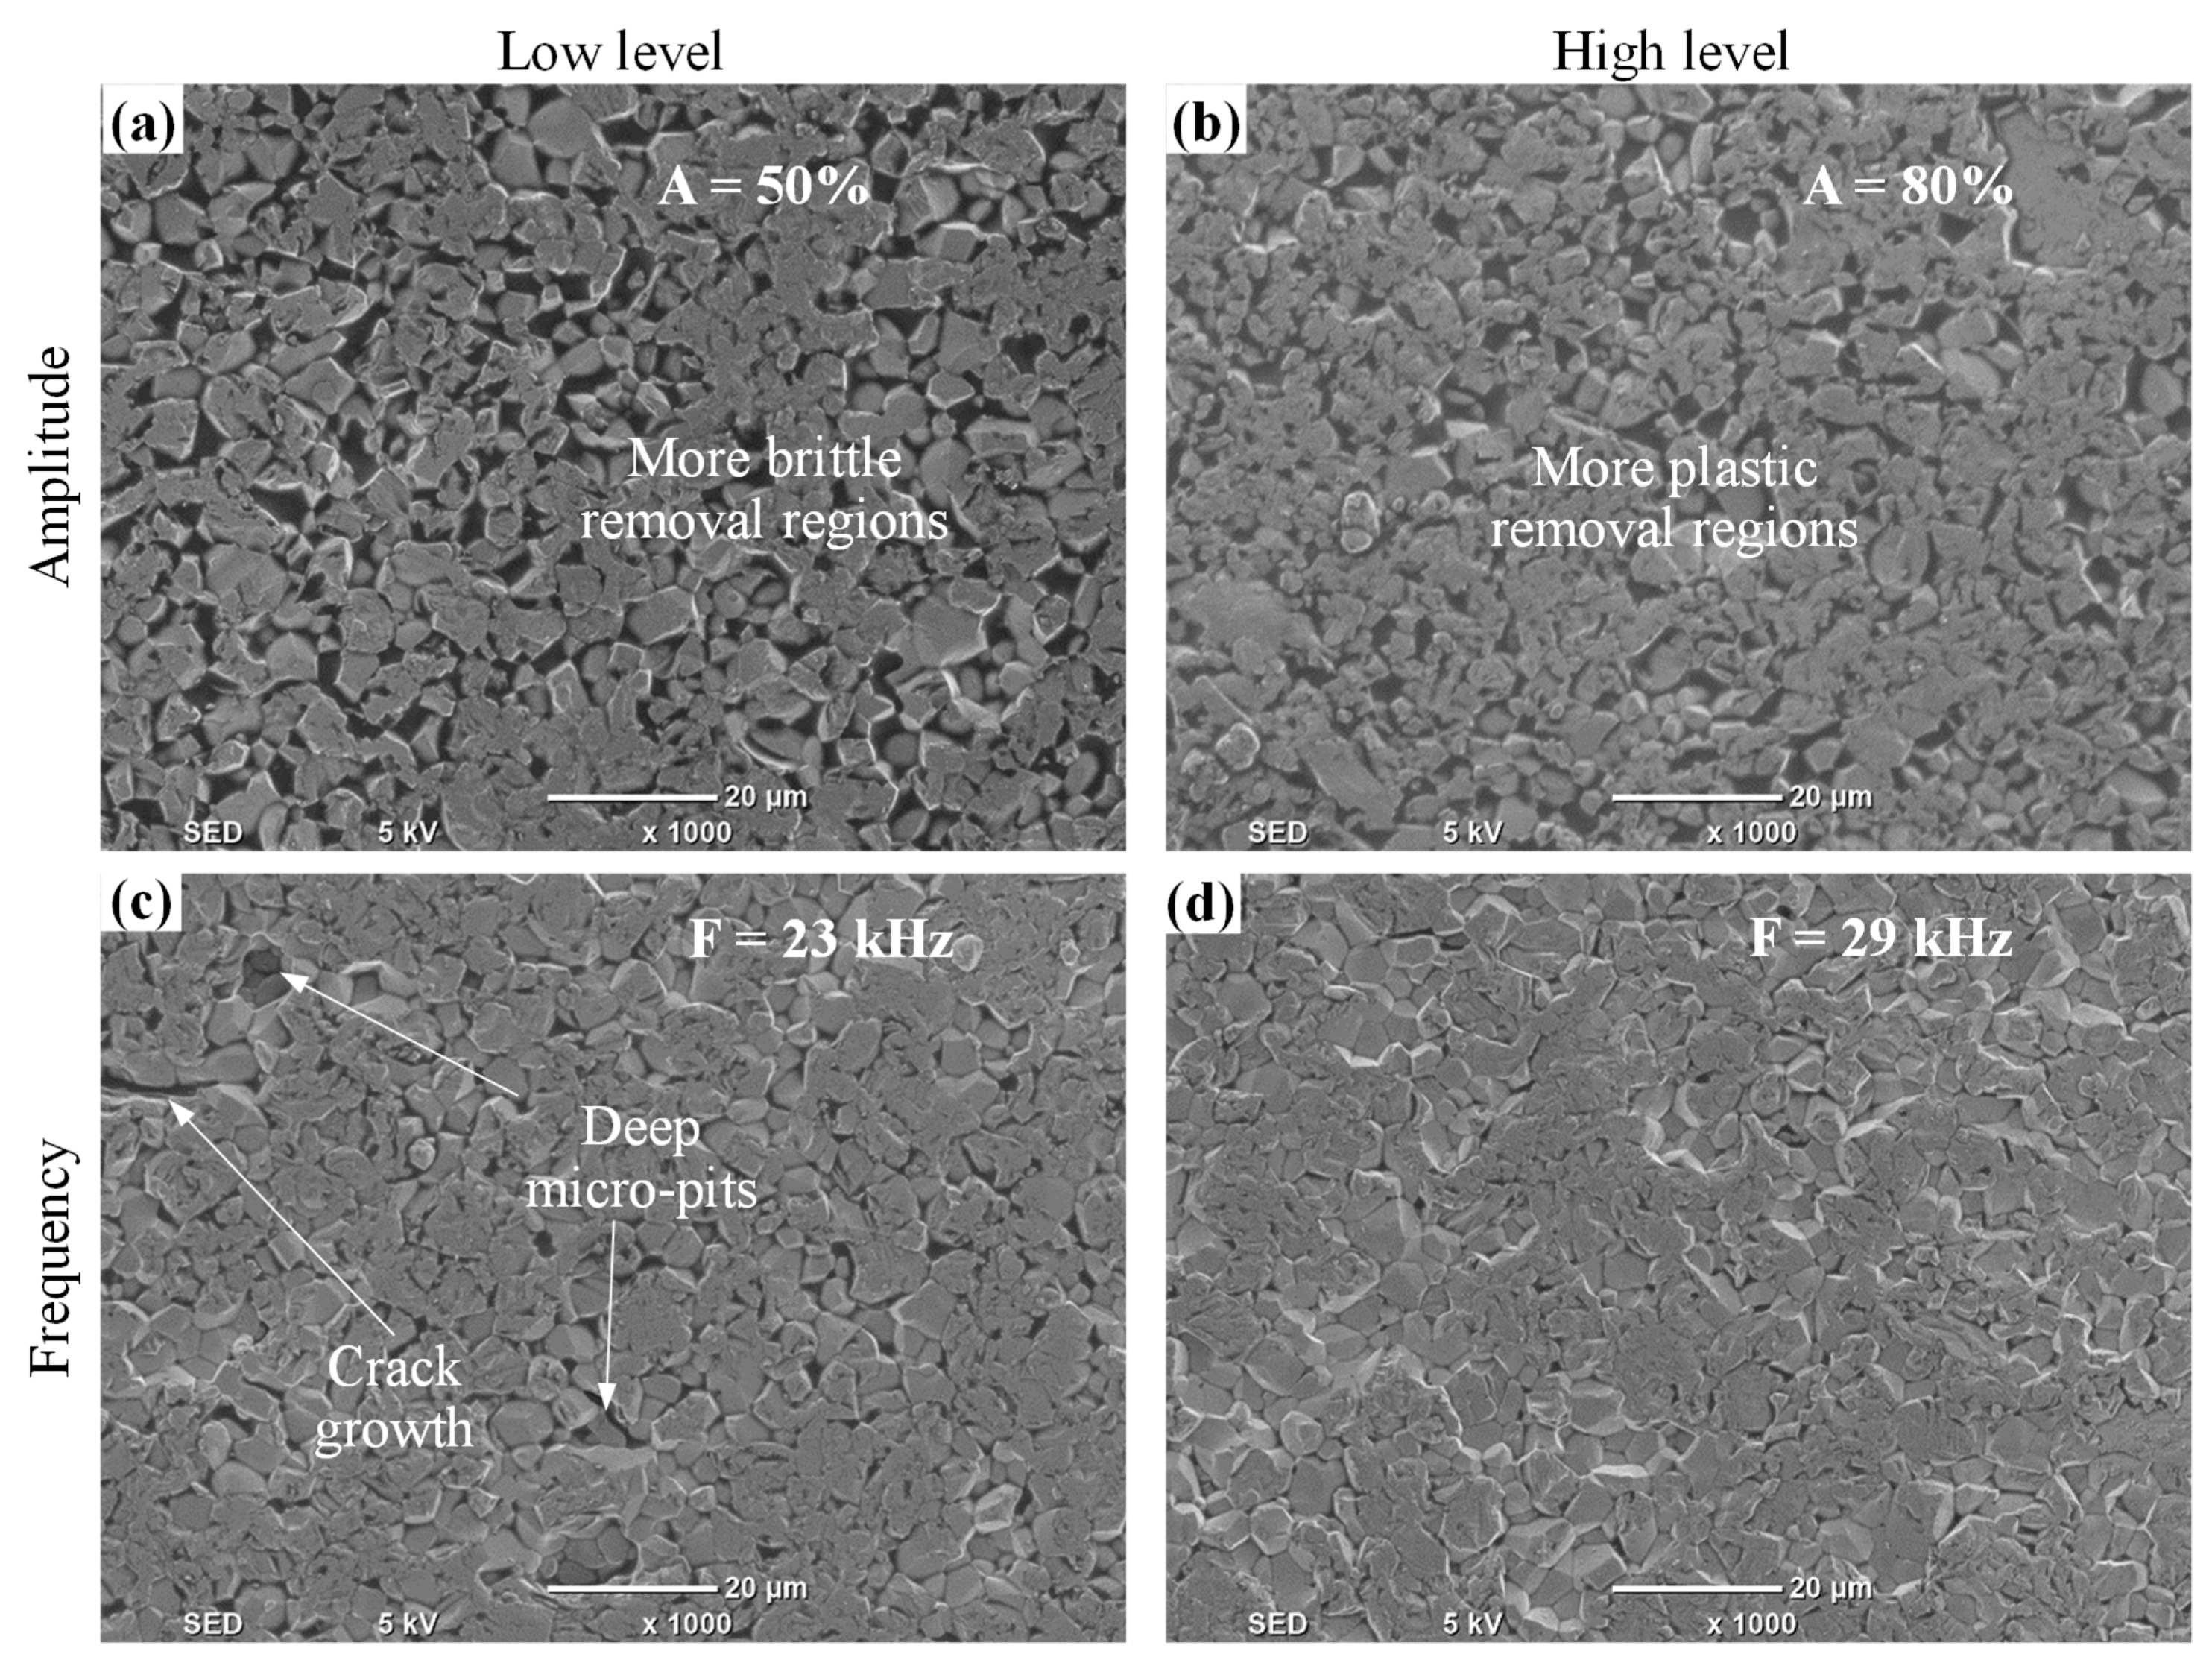
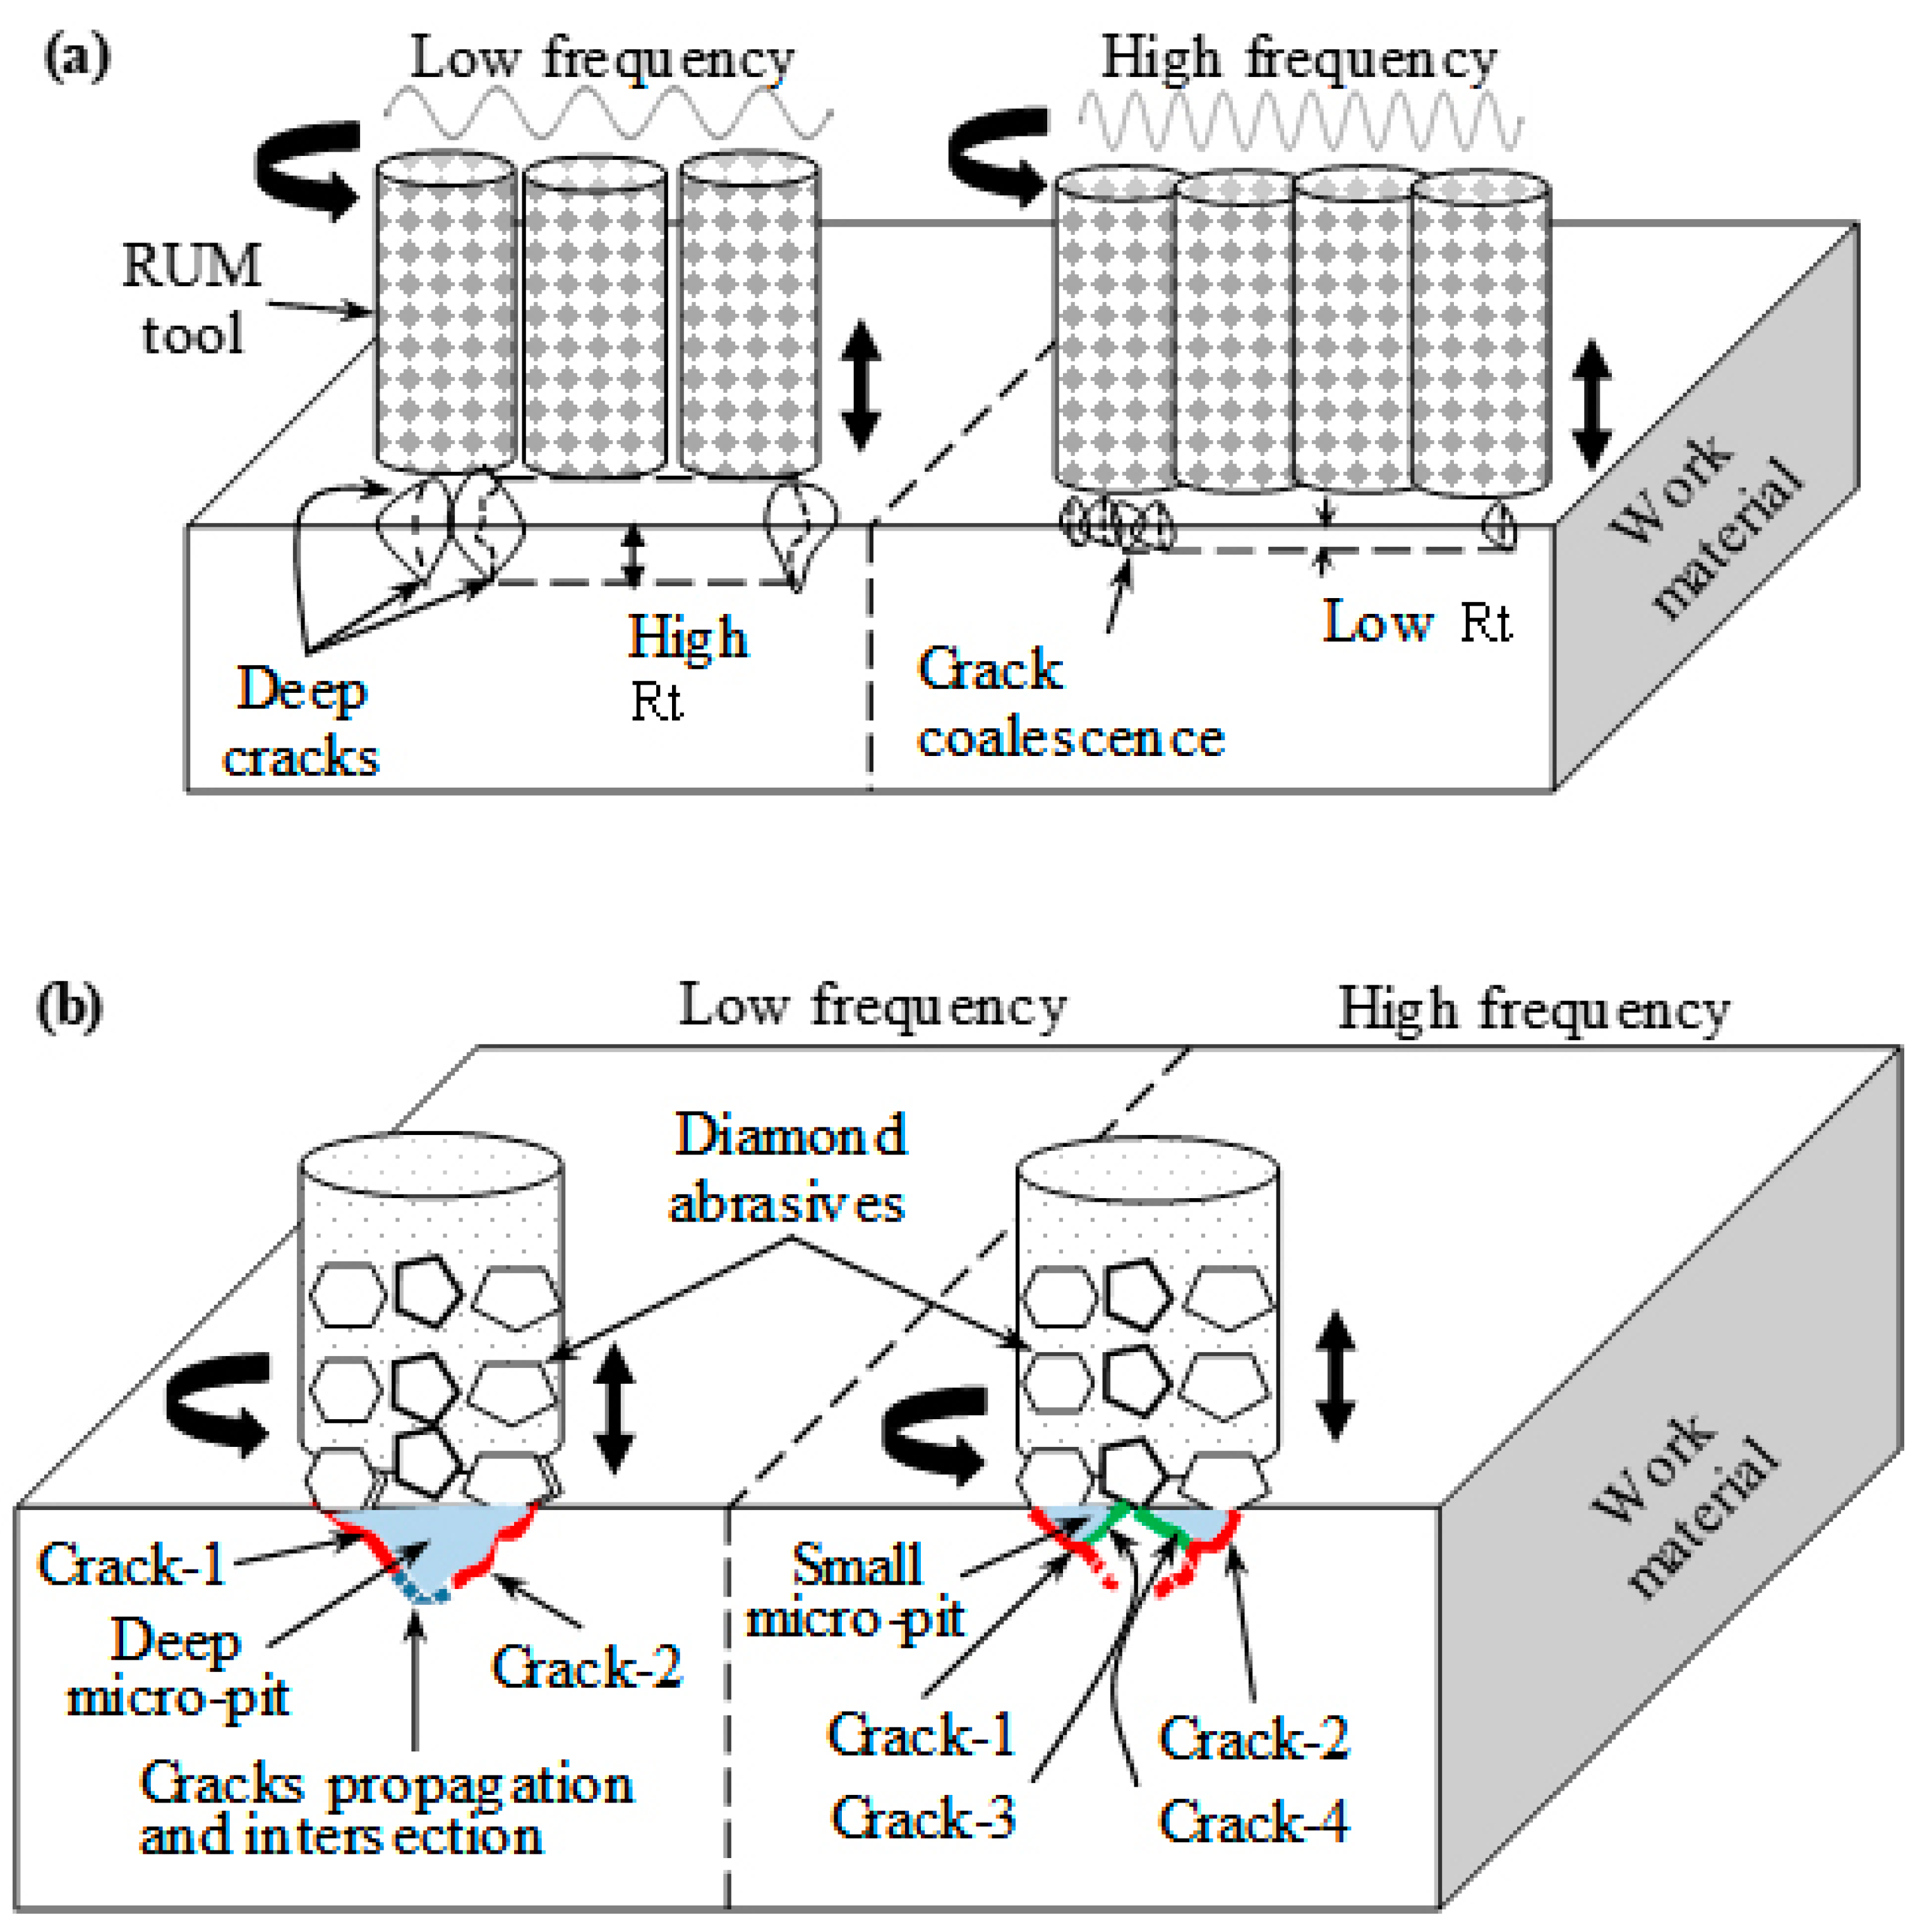
- Vibration frequency significantly affects crack density and crack propagation and hence affects the depth of micro-pits generated in the machined surface, consequently influencing the Rt;
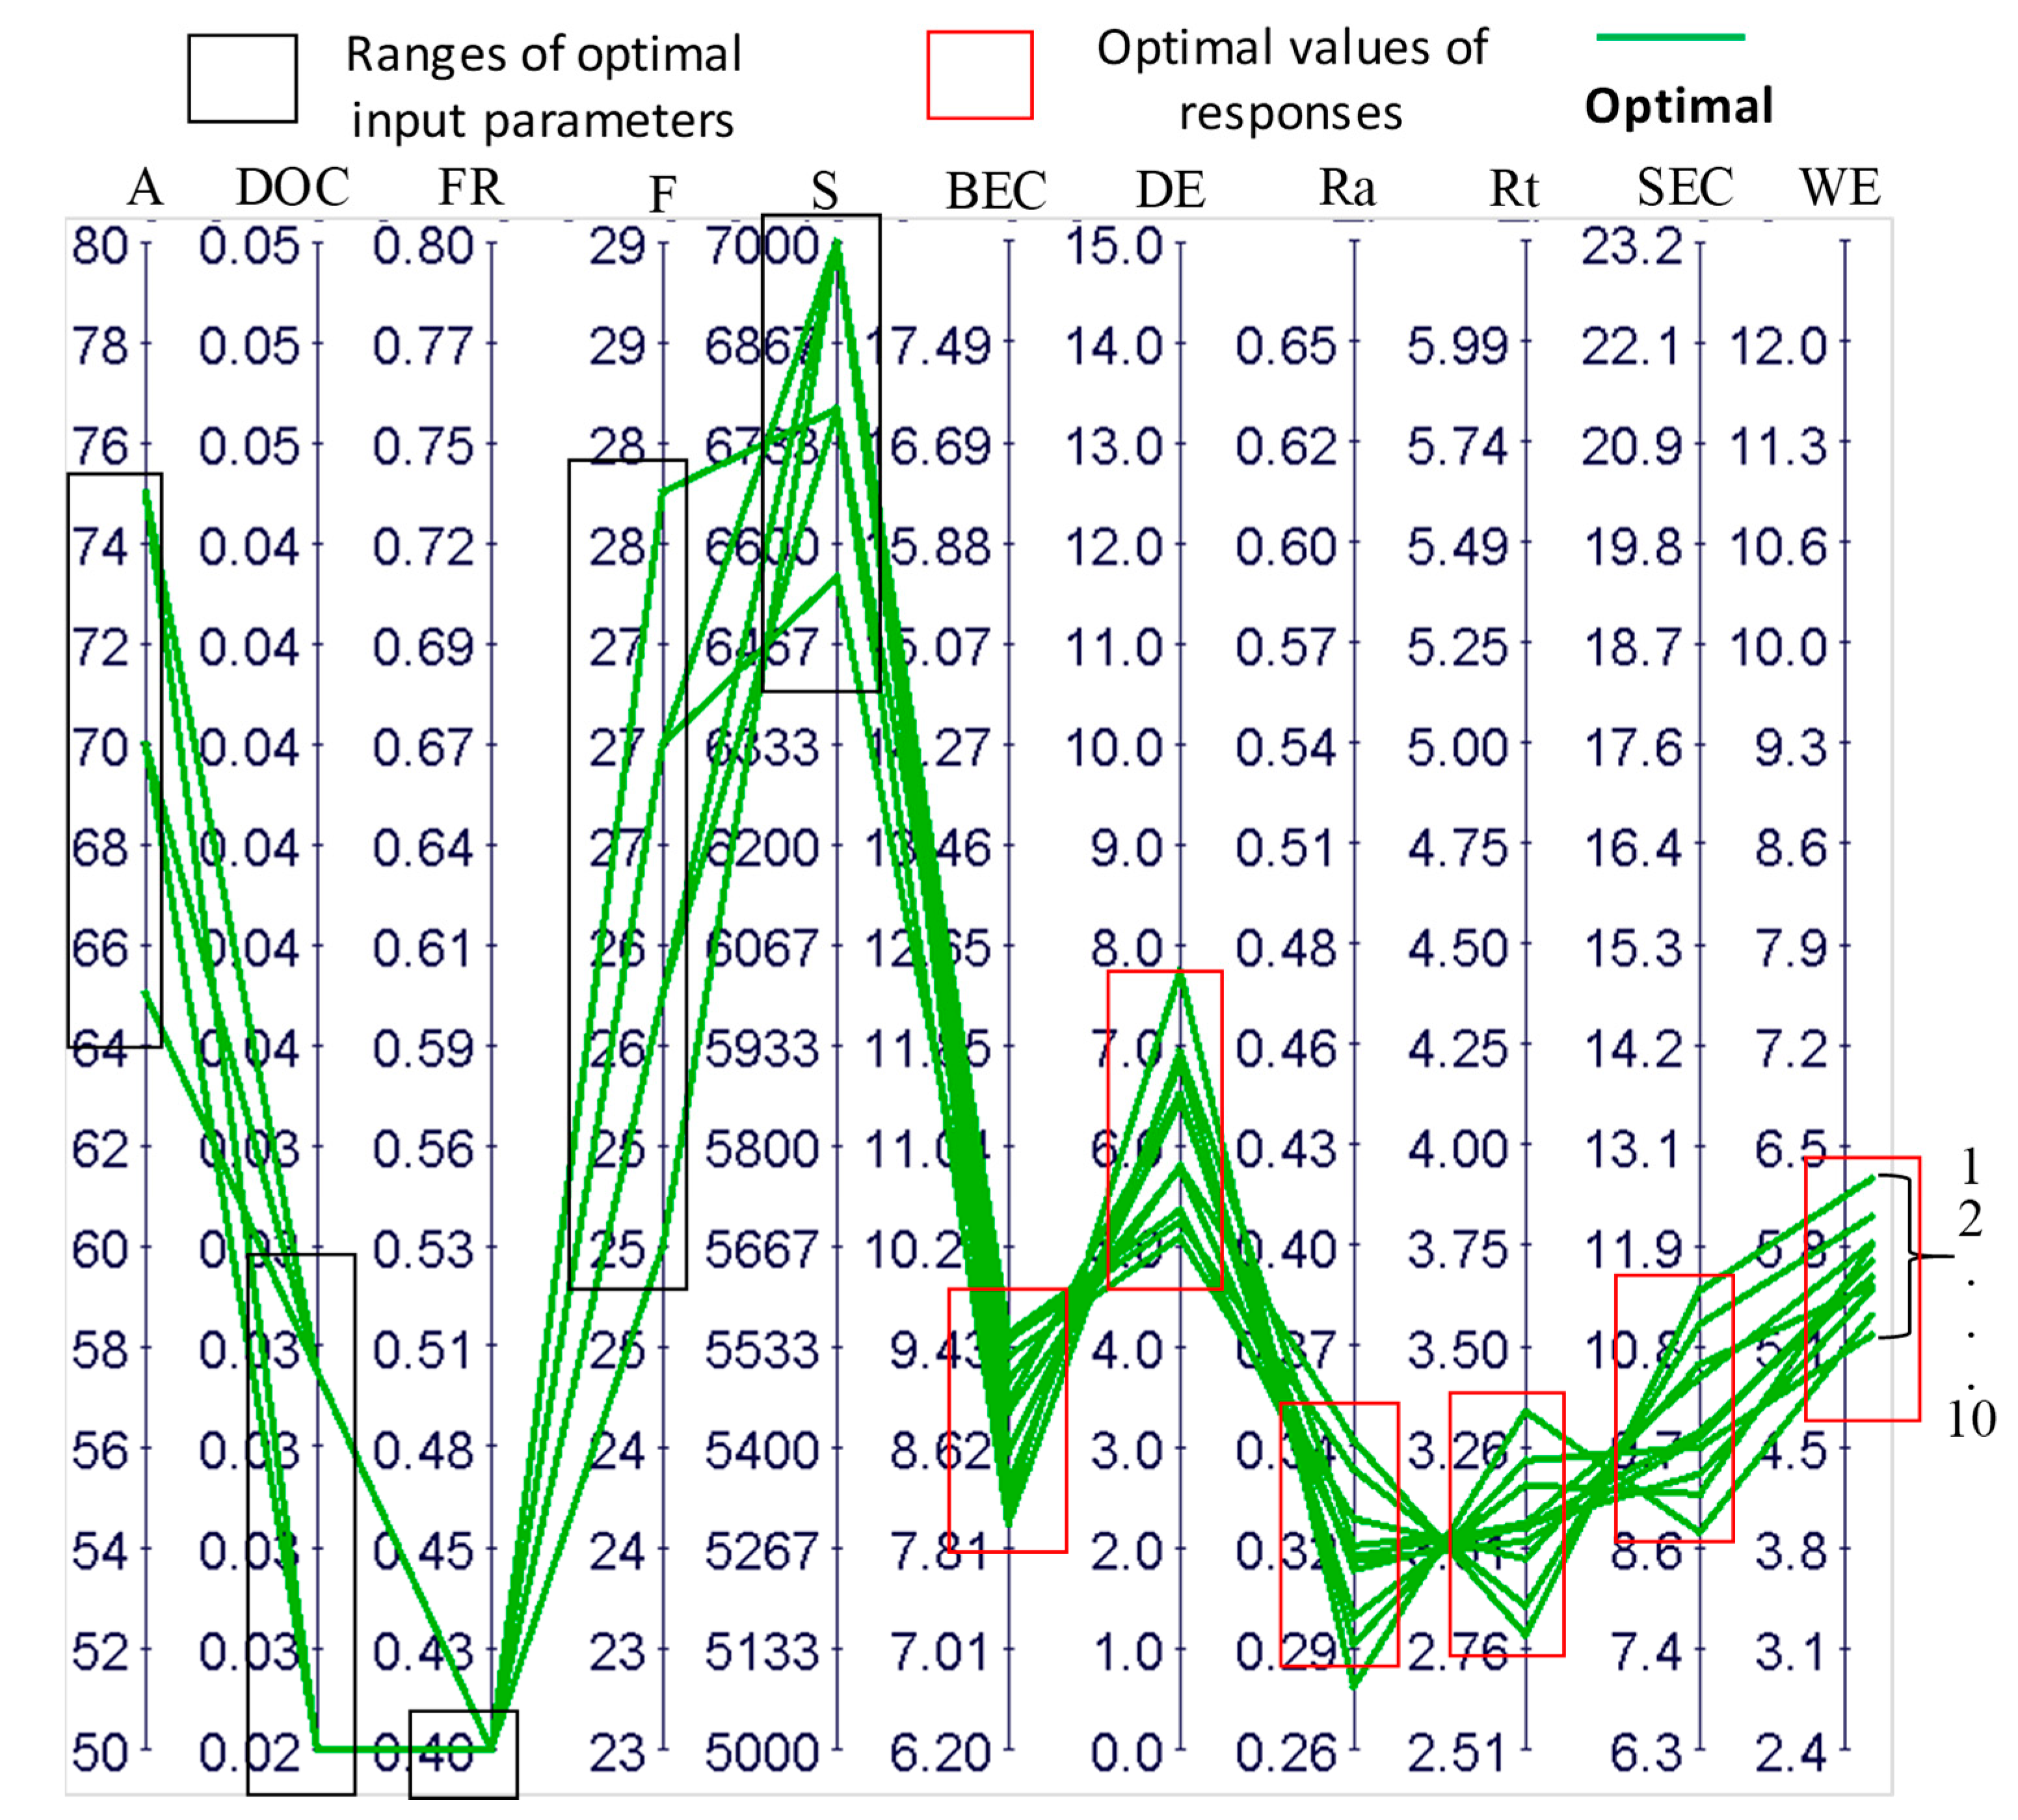
- In general, a smoothed surface morphology with more plastic removal, less brittle fracture, and low exit edge chipping can be achieved by employing a high spindle speed (7000 rpm) and a lower feed rate (0.4 mm/min) and depth of cut (0.025 mm), and medium to high levels of vibration amplitude (65–75%) and frequency (25 kHz–28 kHz);
- RUM can be applied to mill precise microchannels in Al2O3 bioceramic. The dimensional accuracy in terms of the depth error and width error is found to be less than 11% at any combination of the selected RUM parameters;
- A multi-objective optimization method was successfully accomplished in order to minimize the surface roughness (Ra and Rt) and the exit edge chipping (SEC and BEC) while keeping the dimensional errors (DE and WE) less than 8%;
- The current study provides the optimal parametric combination of RUM parameters to obtain microchannels in Al2O3 with high surface quality and accuracy. The optimal RUM parameters are a cutting speed of 7000 rpm, a feed rate of 0.4 mm/min, a depth of cut of 0.025 mm, a frequency of 27 kHz, and an amplitude of 75%, yielding the key responses as Ra = 0.27 μm, Rt = 2.7 μm, SEC = 8.7 μm, BEC = 8 μm, DE = 5%, and WE = 5.2%.
Author Contributions
Funding
Conflicts of Interest
References
- Groß, G.A.; Thelemann, T.; Schneider, S.; Boskovic, D.; Köhler, J.M. Fabrication and fluidic characterization of static micromixers made of low temperature cofired ceramic (LTCC). Chem. Eng. Sci. 2008, 63, 2773–2784. [Google Scholar] [CrossRef]
- Beebe, D.J.; Mensing, G.A.; Walker, G.M. Physics and Applications of Microfluidics in Biology. Annu. Rev. Biomed. Eng. 2002, 4, 261–286. [Google Scholar] [CrossRef] [PubMed]
- Finch, D.S.; Oreskovic, T.; Ramadurai, K.; Herrmann, C.F.; George, S.M.; Mahajan, R.L. Biocompatibility of atomic layer-deposited alumina thin films. J. Biomed. Mater. Res. Part A 2008, 87, 100–106. [Google Scholar] [CrossRef] [PubMed]
- Rayat, M.S.; Gill, S.S.; Singh, R.; Sharma, L. Fabrication and machining of ceramic composites — A review on current scenario. Mater. Manuf. Process. 2017, 32, 1451–1474. [Google Scholar] [CrossRef]
- Chen, J.; Fang, Q.; Li, P. Effect of grinding wheel spindle vibration on surface roughness and subsurface damage in brittle material grinding. Int. J. Mach. Tools Manuf. 2015, 91, 12–23. [Google Scholar] [CrossRef]
- Abdo, B.M.A.; Anwar, S.; El-Tamimi, A.M.; Alahmari, A.M.; Abouel Nasr, E. Laser micro-milling of bio-lox forte ceramic: An experimental analysis. Precis. Eng. 2018, 53, 179–193. [Google Scholar] [CrossRef]
- Abdo, B.M.A.; El-Tamimi, A.M.; Anwar, S.; Umer, U.; Alahmari, A.M.; Ghaleb, M.A. Experimental investigation and multi-objective optimization of Nd:YAG laser micro-channeling process of zirconia dental ceramic. Int. J. Adv. Manuf. Technol. 2018, 98, 1–18. [Google Scholar] [CrossRef]
- Guzzo, P.L.; Shinohara, A.H.; Raslan, A.A. A comparative study on ultrasonic machining of hard and brittle materials. J. Brazilian Soc. Mech. Sci. Eng. 2004, 26, 18–21. [Google Scholar] [CrossRef]
- Singh, R.P.; Singhal, S.; Singh, R.P.; Singhal, S. Rotary Ultrasonic Machining: A Review. Mater. Manuf. Process. 2017, 31, 1795–1824. [Google Scholar] [CrossRef]
- Kataria, R.; Kumar, J. Ultrasonic Machining: A Review. Adv. Mater. Res. 2016, 1137, 61–78. [Google Scholar] [CrossRef]
- Jain, V.; Sharma, A.K.; Kumar, P. Recent Developments and Research Issues in Microultrasonic Machining. ISRN Mech. Eng. 2011, 2011, 1–15. [Google Scholar] [CrossRef]
- Gong, H.; Fang, F.Z.; Hu, X.T. Kinematic view of tool life in rotary ultrasonic side milling of hard and brittle materials. Int. J. Mach. Tools Manuf. 2010, 50, 303–307. [Google Scholar] [CrossRef]
- Popli, D.; Gupta, M. A Chipping reduction approach in Rotary Ultrasonic Machining of Advance Ceramic. Mater. Today Proc. 2018, 5, 6329–6338. [Google Scholar] [CrossRef]
- Liu, J.W.; Baek, D.K.; Ko, T.J. Chipping minimization in drilling ceramic materials with rotary ultrasonic machining. Int. J. Adv. Manuf. Technol. 2014, 72, 1527–1535. [Google Scholar] [CrossRef]
- Singh, R.P.; Singhal, S. Investigation of Machining Characteristics in Rotary Ultrasonic Machining of Alumina Ceramic. Mater. Manuf. Process. 2016, 32, 309–326. [Google Scholar] [CrossRef]
- Shen, J.Y.; Wang, J.Q.; Jiang, B.; Xu, X.P. Study on wear of diamond wheel in ultrasonic vibration-assisted grinding ceramic. Wear 2015, 332–333, 788–793. [Google Scholar] [CrossRef]
- Ding, K.; Fu, Y.; Su, H.; Chen, Y.; Yu, X.; Ding, G. Experimental studies on drilling tool load and machining quality of C/SiC composites in rotary ultrasonic machining. J. Mater. Process. Technol. 2014, 214, 2900–2907. [Google Scholar] [CrossRef]
- Wang, J.; Feng, P.; Zhang, J.; Guo, P. Experimental study on vibration stability in rotary ultrasonic machining of ceramic matrix composites: Cutting force variation at hole entrance. Ceram. Int. 2018, 44, 14386–14392. [Google Scholar] [CrossRef]
- Shiliang, W.; Hong, Z.; Juntao, J.; Yunfeng, L. Investigation on surface micro-crack evaluation of engineering ceramics by rotary ultrasonic grinding machining. Int. J. Adv. Manuf. Technol. 2015, 81, 483–492. [Google Scholar] [CrossRef]
- Jain, A.K.; Pandey, P.M. Experimental studies on tool wear in μ-RUM process. Int. J. Adv. Manuf. Technol. 2016, 85, 2125–2138. [Google Scholar] [CrossRef]
- Kumar, S.; Dvivedi, A. Fabrication of microchannels using rotary tool micro-USM: An experimental investigation on tool wear reduction and form accuracy improvement. J. Manuf. Process. 2018, 32, 802–815. [Google Scholar]
- Cheema, M.S.; Singh, P.K.; Tyagi, O.; Dvivedi, A.; Sharma, A.K. Tool wear and form accuracy in ultrasonically machined microchannels. Meas. J. Int. Meas. Confed. 2016, 81, 85–94. [Google Scholar] [CrossRef]
- Lv, D. Influences of high-frequency vibration on tool wear in rotary ultrasonic machining of glass BK7. Int. J. Adv. Manuf. Technol. 2016, 1443–1455. [Google Scholar] [CrossRef]
- Cheema, M.S.; Dvivedi, A.; Sharma, A.K. Tool wear studies in fabrication of microchannels in ultrasonic micromachining. Ultrasonics 2015, 57, 57–64. [Google Scholar] [CrossRef] [PubMed]
- Al-Sanabani, F.A.; Madfa, A.A.; Al-Qudaimi, N.H. Alumina ceramic for dental applications: A review article Citation. Am. J. Mater. Res. 2014, 1, 26–34. [Google Scholar]
- CeramTec—The Ceramic Experts. Available online: https://www.ceramtec.com/ (accessed on 17 March 2018).
- Whitesides, G.M. The origins and the future of microfluidics. Nature 2006, 442, 368–373. [Google Scholar] [CrossRef]
- Farhan Shafique, M.; Laister, A.; Clark, M.; Miles, R.E.; Robertson, I.D. Fabrication of embedded microfluidic channels in low temperature co-fired ceramic technology using laser machining and progressive lamination. J. Eur. Ceram. Soc. 2011, 31, 2199–2204. [Google Scholar] [CrossRef]
- Ong, S.E.; Zhang, S.; Du, H.J.; Fu, Y.Q. Fundamental principles and applications of microfluidic systems. Front. Biosci. 2008, 13, 2757–2773. [Google Scholar] [CrossRef]
- Montgomery, D.C. Design and Analysis of Experiments; John Wiley & Sons, Inc.: Hoboken, NJ, USA, 2013; ISBN 9781118146927. [Google Scholar]
- Wang, J.; Shimada, K.; Mizutani, M.; Kuriyagawa, T. Effects of abrasive material and particle shape on machining performance in micro ultrasonic machining. Precis. Eng. 2018, 51, 373–387. [Google Scholar] [CrossRef]
- Das, S.S.; Patowari, P.K. Fabrication of serpentine micro-channels on glass by ultrasonic machining using developed micro-tool by wire-cut electric discharge machining. Int. J. Adv. Manuf. Technol. 2018, 95, 3013–3028. [Google Scholar] [CrossRef]
- Xiao, X.; Zheng, K.; Liao, W.; Meng, H. Study on cutting force model in ultrasonic vibration assisted side grinding of zirconia ceramics. Int. J. Mach. Tools Manuf. 2015, 104, 58–67. [Google Scholar] [CrossRef]
- Ahmed, N.; Abdo, B.M.; Darwish, S.; Moiduddin, K.; Pervaiz, S.; Alahmari, A.M.; Naveed, M. Electron beam melting of titanium alloy and surface finish improvement through rotary ultrasonic machining. Int. J. Adv. Manuf. Technol. 2017, 92, 3349–3361. [Google Scholar] [CrossRef]
- Wang, J.; Zhang, J.; Feng, P.; Guo, P. Damage formation and suppression in rotary ultrasonic machining of hard and brittle materials: A critical review. Ceram. Int. 2018, 44, 1227–1239. [Google Scholar] [CrossRef]
- Anwar, S.; Nasr, M.M.; Pervaiz, S.; Al-Ahmari, A.; Alkahtani, M.; El-Tamimi, A. A study on the effect of main process parameters of rotary ultrasonic machining for drilling BK7 glass. Adv. Mech. Eng. 2018, 10, 1–12. [Google Scholar] [CrossRef]
- Kuriakose, S.; Patowari, P.K.; Bhatt, J. Machinability study of Zr-Cu-Ti metallic glass by micro hole drilling using micro-USM. J. Mater. Process. Technol. 2017, 240, 42–51. [Google Scholar] [CrossRef]
- Khoo, C.Y.; Hamzah, E.; Sudin, I. a Review on the Rotary Ultrasonic Machining of Advanced Ceramics. J. Mek. 2008, 25, 9–23. [Google Scholar]
- modeFrontier|ESTECO. Available online: http://www.esteco.com/modefrontier (accessed on 28 February 2018).


| Property | Value (unit) |
|---|---|
| Flexural strength (20 °C) | 630 (MPa) |
| Compressive strength | 4000 (MPa) |
| Tensile strength | 650 (MPa) |
| Bulk density | 3.96 (g/cm3) |
| Poisson’s ratio | 0.23 |
| Vickers hardness (HV 0.5) | 2000 |
| Fracture toughness | 4 (MPa·m1/2) |
| Thermal conductivity 20°C | 30 (W/mK) |
| Melting point | 2270 (°C) |
| Parameter (unit)/Levels | 1 | 2 | 3 |
| Spindle Speed (rpm) | 5000 | 6000 | 7000 |
| Feed rate (mm/min) | 0.4 | 0.6 | 0.8 |
| Depth of cut (mm) | 0.025 | 0.0375 | 0.05 |
| Vibration amplitude % (μm) | 50 (5) | 65 (27.5) | 80 (50) |
| Vibration frequency (kHz) | 23 | 26 | 29 |
| Exp. # | Input Parameters | Responses | |||||||||
|---|---|---|---|---|---|---|---|---|---|---|---|
| Speed (rpm) | Feed rate (mm/min) | Depth of cut (mm) | Frequency (kHz) | Amplitude (%) | SEC (µm) | BEC (µm) | Ra (µm) | Rt (µm) | DE (%) | WE (%) | |
| 1 | 5000 | 0.4 | 0.025 | 29 | 50 | 17.6 | 6.2 | 0.36 | 2.65 | 5.5 | 9.0 |
| 2 | 7000 | 0.8 | 0.05 | 23 | 50 | 19.2 | 9.3 | 0.32 | 6.03 | 11.2 | 9.0 |
| 3 | 6000 | 0.6 | 0.05 | 26 | 65 | 14.6 | 10.6 | 0.42 | 3.96 | 6 | 10.8 |
| 4 | 7000 | 0.4 | 0.05 | 23 | 80 | 9.6 | 10.3 | 0.29 | 3.33 | 10 | 9.4 |
| 5 | 6000 | 0.4 | 0.0375 | 26 | 65 | 12.5 | 9.5 | 0.42 | 2.51 | 8 | 9.0 |
| 6 | 6000 | 0.6 | 0.0375 | 26 | 65 | 16.7 | 10.2 | 0.39 | 3.19 | 11 | 11.6 |
| 7 | 5000 | 0.4 | 0.05 | 23 | 50 | 17.6 | 11.6 | 0.68 | 5.77 | 13 | 6.6 |
| 8 | 5000 | 0.8 | 0.025 | 23 | 50 | 16.9 | 9.2 | 0.48 | 4.81 | 7.5 | 7.8 |
| 9 | 5000 | 0.8 | 0.05 | 23 | 80 | 23.2 | 13.5 | 0.49 | 5.48 | 11.9 | 11.7 |
| 10 | 7000 | 0.8 | 0.025 | 23 | 80 | 19.2 | 9.2 | 0.32 | 4.91 | 9 | 4.8 |
| 11 | 7000 | 0.4 | 0.025 | 29 | 80 | 6.3 | 6.6 | 0.26 | 2.58 | 12 | 5.6 |
| 12 | 6000 | 0.6 | 0.0375 | 26 | 65 | 15.9 | 12.3 | 0.40 | 4.11 | 8 | 4 |
| 13 | 6000 | 0.6 | 0.0375 | 26 | 80 | 14.7 | 11.2 | 0.35 | 4.33 | 4 | 9 |
| 14 | 7000 | 0.8 | 0.025 | 29 | 50 | 11.6 | 8.2 | 0.39 | 4.76 | 15 | 7 |
| 15 | 5000 | 0.6 | 0.0375 | 26 | 65 | 21.3 | 8.6 | 0.51 | 5.86 | 8 | 7.8 |
| 16 | 5000 | 0.4 | 0.05 | 29 | 80 | 19.6 | 12.7 | 0.43 | 4.06 | 2.5 | 2.4 |
| 17 | 6000 | 0.6 | 0.0375 | 29 | 65 | 19.1 | 7.1 | 0.42 | 3.38 | 3.5 | 4.4 |
| 18 | 7000 | 0.8 | 0.05 | 29 | 80 | 16.3 | 13.3 | 0.29 | 6.24 | 9 | 2.8 |
| 19 | 6000 | 0.8 | 0.0375 | 26 | 65 | 17.2 | 17.5 | 0.43 | 4.29 | 5.5 | 7.4 |
| 20 | 6000 | 0.6 | 0.0375 | 26 | 65 | 14.7 | 11.7 | 0.41 | 3.46 | 11.5 | 5.8 |
| 21 | 6000 | 0.6 | 0.0375 | 26 | 65 | 12.3 | 12.6 | 0.23 | 3.5 | 8 | 3.4 |
| 22 | 6000 | 0.6 | 0.0375 | 26 | 65 | 9.7 | 11.3 | 0.44 | 4.22 | 9 | 2.0 |
| 23 | 5000 | 0.8 | 0.025 | 29 | 80 | 11.5 | 18.3 | 0.48 | 4.89 | 0.5 | 11.4 |
| 24 | 7000 | 0.4 | 0.025 | 23 | 50 | 18.9 | 9.9 | 0.26 | 3.5 | 0 | 3.8 |
| 25 | 6000 | 0.6 | 0.025 | 26 | 65 | 17.3 | 13.7 | 0.41 | 4.29 | 3 | 5.8 |
| 26 | 6000 | 0.6 | 0.0375 | 26 | 65 | 19.4 | 12.4 | 0.53 | 4.3 | 3 | 8.4 |
| 27 | 6000 | 0.6 | 0.0375 | 26 | 50 | 12.6 | 13.6 | 0.46 | 3.92 | 9 | 6.4 |
| 28 | 6000 | 0.6 | 0.0375 | 23 | 65 | 16.3 | 10.3 | 0.53 | 4.11 | 11 | 9.2 |
| 29 | 7000 | 0.4 | 0.05 | 29 | 50 | 12.3 | 9.2 | 0.37 | 5.48 | 2.5 | 5.4 |
| 30 | 5000 | 0.4 | 0.025 | 23 | 80 | 9.4 | 11.5 | 0.33 | 5.24 | 0.5 | 4.8 |
| 31 | 7000 | 0.6 | 0.0375 | 26 | 65 | 9.3 | 12.3 | 0.42 | 3.36 | 2.5 | 4.6 |
| 32 | 5000 | 0.8 | 0.05 | 29 | 50 | 17.9 | 12.6 | 0.58 | 5.48 | 3.5 | 7.4 |
| Objective Functions | 1. Minimize Ra 2. Minimize Rt 3. Minimize SEC 4. Minimize BEC |
| Constraints | 1. Depth error ≤ 8% 2. Width error ≤ 8% |
| Parameter | Value |
|---|---|
| Number of generations | 100 |
| Probability of direction cross-over | 0.5 |
| Probability of selection | 0.05 |
| Probability of mutation | 0.1 |
| DNA string mutation ratio | 0.05 |
| Random generator seed | 1 |
| Point # | Inputs | Outputs | |||||||||
|---|---|---|---|---|---|---|---|---|---|---|---|
| S | FR | DOC | F | A | SEC | BEC | Ra | Rt | DE | WE | |
| 1 | 7000 | 0.4 | 0.031 | 25 | 70 | 10.45 | 9.52 | 0.313 | 3.067 | 5.352 | 5.854 |
| 2 | 7000 | 0.4 | 0.031 | 26 | 65 | 10.60 | 9.35 | 0.320 | 2.978 | 5.092 | 5.560 |
| 3 | 6777.7 | 0.4 | 0.031 | 26 | 65 | 11.05 | 9.47 | 0.337 | 2.865 | 5.247 | 6.029 |
| 4 | 7000 | 0.4 | 0.031 | 26 | 75 | 9.15 | 8.98 | 0.296 | 3.161 | 6.501 | 5.838 |
| 5 | 7000 | 0.4 | 0.031 | 26 | 70 | 9.78 | 9.15 | 0.312 | 3.024 | 5.784 | 5.725 |
| 6 | 7000 | 0.4 | 0.031 | 27 | 70 | 9.36 | 8.58 | 0.309 | 3.064 | 6.451 | 5.533 |
| 7 | 6555.5 | 0.4 | 0.031 | 27 | 65 | 11.43 | 8.90 | 0.346 | 2.789 | 5.807 | 6.284 |
| 8 | 7000 | 0.4 | 0.025 | 27 | 75 | 8.74 | 8.13 | 0.277 | 3.343 | 7.740 | 5.361 |
| 9 | 7000 | 0.4 | 0.025 | 27 | 70 | 9.67 | 8.30 | 0.289 | 3.220 | 6.818 | 5.223 |
| 10 | 6777.7 | 0.4 | 0.031 | 28 | 70 | 9.86 | 8.01 | 0.316 | 3.058 | 6.926 | 5.615 |
© 2019 by the authors. Licensee MDPI, Basel, Switzerland. This article is an open access article distributed under the terms and conditions of the Creative Commons Attribution (CC BY) license (http://creativecommons.org/licenses/by/4.0/).
Share and Cite
Abdo, B.M.A.; Anwar, S.; El-Tamimi, A.M.; Abouel Nasr, E. Experimental Analysis on the Influence and Optimization of μ-RUM Parameters in Machining Alumina Bioceramic. Materials 2019, 12, 616. https://0-doi-org.brum.beds.ac.uk/10.3390/ma12040616
Abdo BMA, Anwar S, El-Tamimi AM, Abouel Nasr E. Experimental Analysis on the Influence and Optimization of μ-RUM Parameters in Machining Alumina Bioceramic. Materials. 2019; 12(4):616. https://0-doi-org.brum.beds.ac.uk/10.3390/ma12040616
Chicago/Turabian StyleAbdo, Basem M. A., Saqib Anwar, Abdulaziz M. El-Tamimi, and Emad Abouel Nasr. 2019. "Experimental Analysis on the Influence and Optimization of μ-RUM Parameters in Machining Alumina Bioceramic" Materials 12, no. 4: 616. https://0-doi-org.brum.beds.ac.uk/10.3390/ma12040616