Addition of Graphene Oxide in Different Stages of the Synthesis of Waterborne Polyurethane-Urea Adhesives and Its Influence on Their Structure, Thermal, Viscoelastic and Adhesion Properties


Abstract
:
1. Introduction
2. Materials and Methods
2.1. Materials
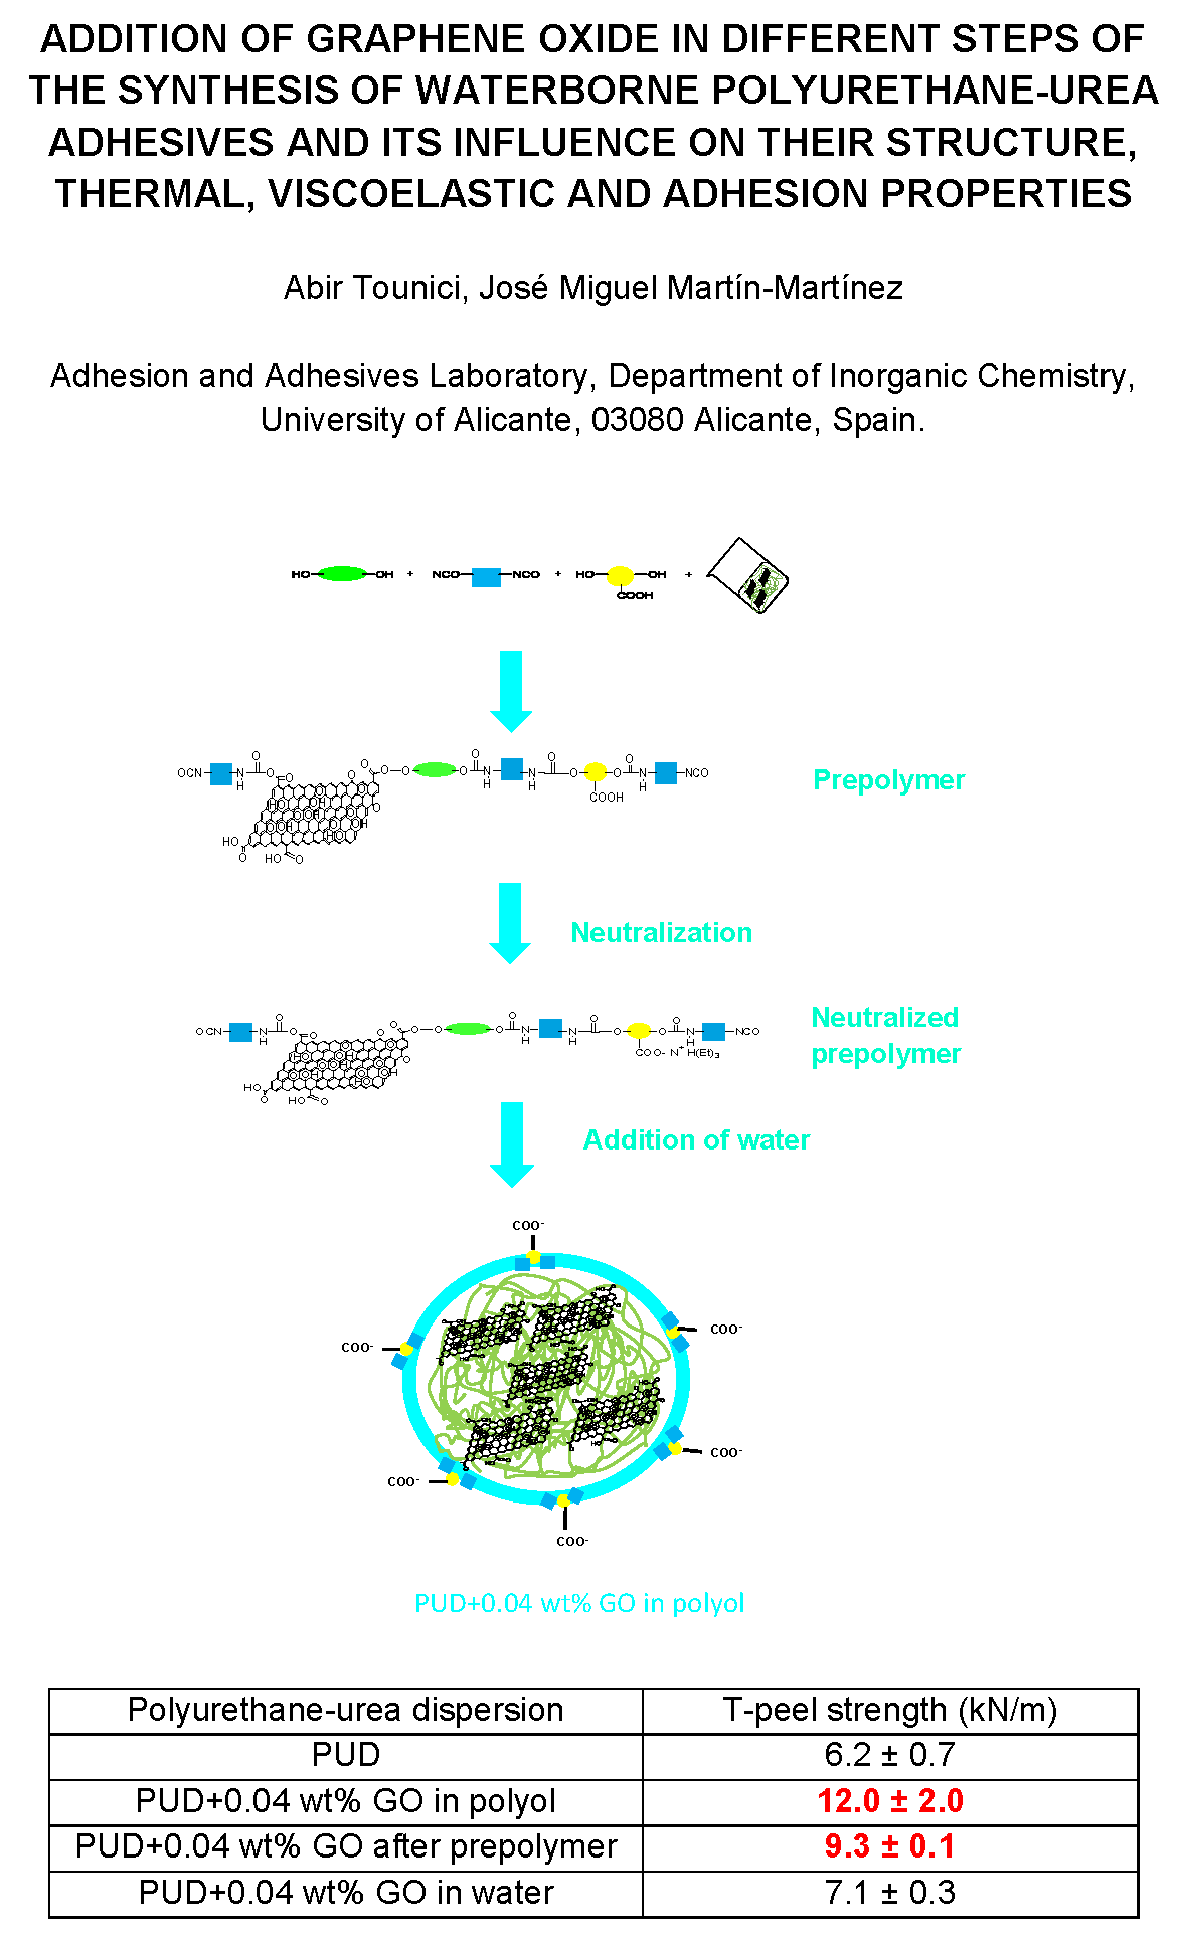
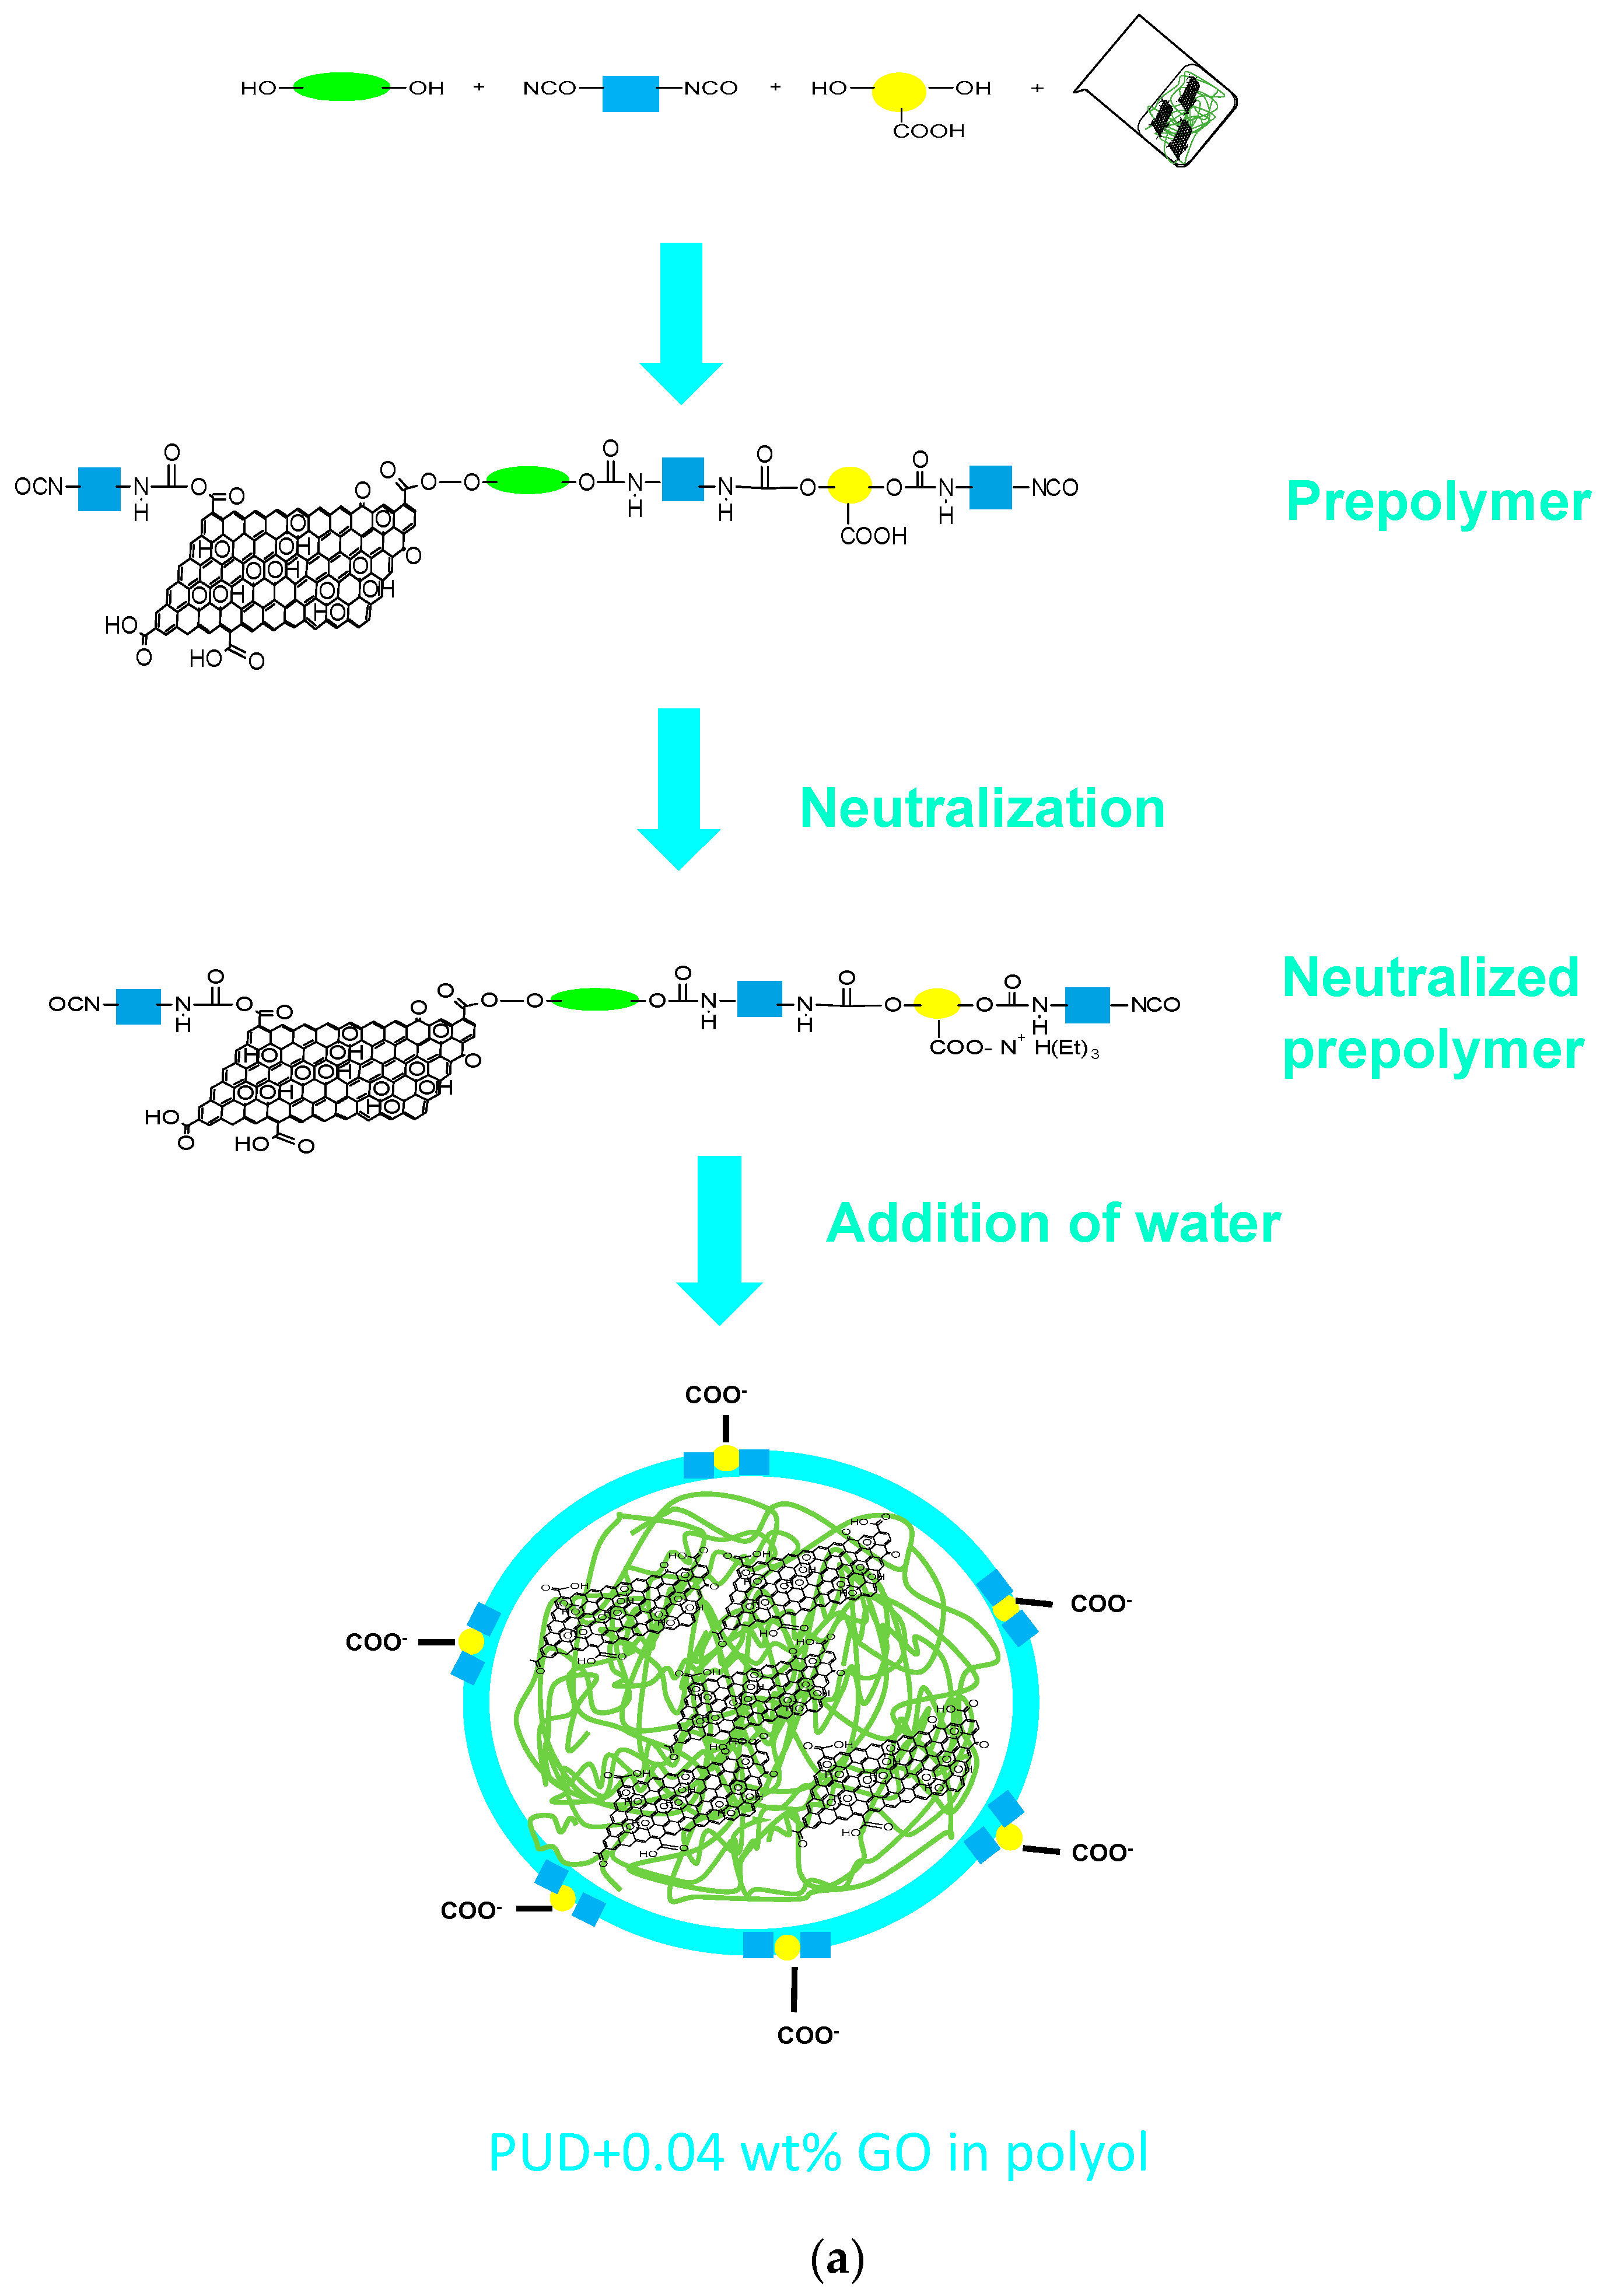
2.2. Synthesis of the Waterborne Polyurethane-Urea Dispersions without and with 0.04 wt % GO
- (a)
- Synthesis of the prepolymer: The polyol, 5 wt % DMPA (with respect to the total amount of prepolymer) and DBTDL catalyst were added into the reactor at 80 °C under mechanical stirring at 450 rpm for 30 min. Then, IPDI diisocyanate was added slowly, allowing the reaction for 2 h 30 min.
- (b)
- Dissolution of the prepolymer in acetone: The temperature was lowered to 40 °C and the acetone was added to dissolve the prepolymer, maintaining the mechanical stirring at 450 rpm for 30 min.
- (c)
- Neutralization of the ionic groups: TEA in 25 mL acetone was added to neutralize the protons of the DMPA hard segments in the prepolymer under mechanical stirring at 40 °C and 450 rpm for 30 min.
- (d)
- Chain extension: HZ was added under mechanical stirring at 40 °C and 450 rpm for 30 min.
- (e)
- Dispersion in water: The stirring speed was increased to 900 rpm and water was added under mechanical stirring at 40 °C for 30 min.
- (f)
- Distillation of acetone: The residual acetone was removed in rotavapor (Büchi, Flawil, Switzerland) at 50 °C under 300 mbar for 1 h.
2.2.1. PUD Obtained by Adding 0.04 wt % GO before Prepolymer Formation
2.2.2. PUD Obtained by Adding 0.04 wt % GO after Prepolymer Formation
2.2.3. PUD Obtained by Adding 0.04 wt % GO in Water
2.3. Experimental Techniques
2.3.1. Characterization of the Polyurethane-Urea Dispersions (PUDs) without and with 0.04 wt % GO
Solids Content
pH Measurement
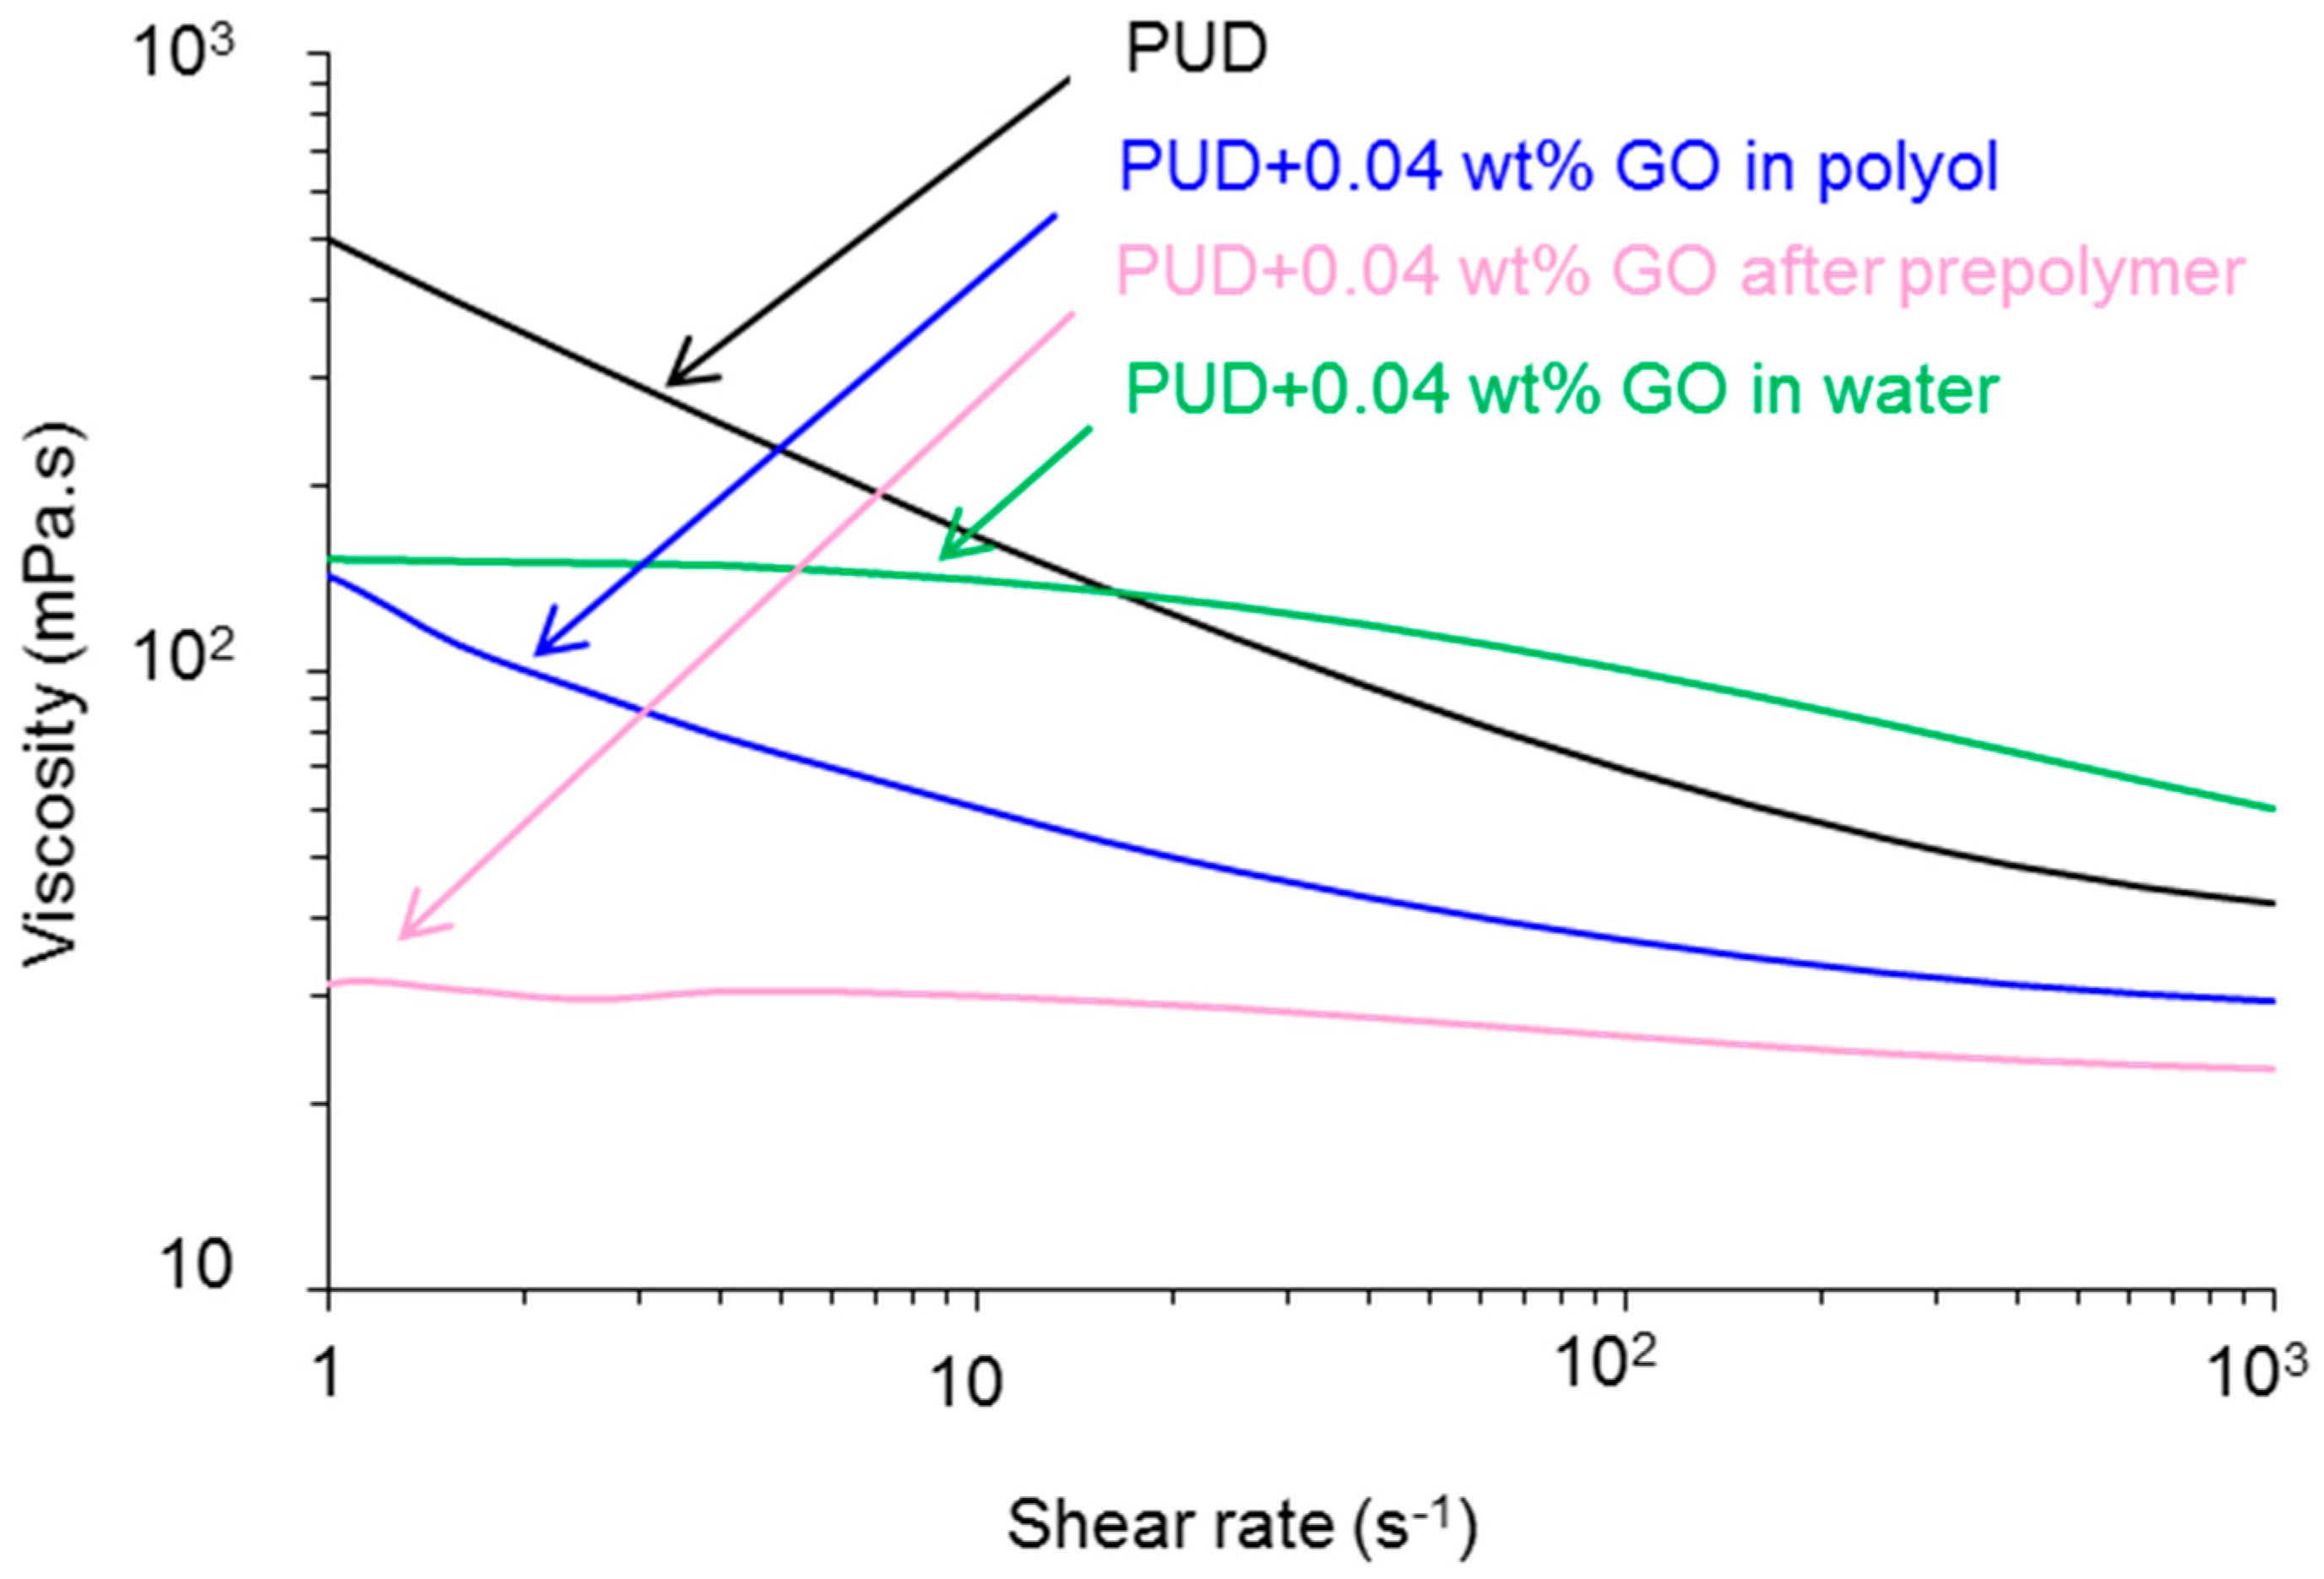
Viscosity
2.3.2. Characterization of the Polyurethane-Urea (PU) Films without and with 0.04 wt % GO
Attenuated Total Reflectance Fourier Transform Infrared (ATR-IR) Spectroscopy
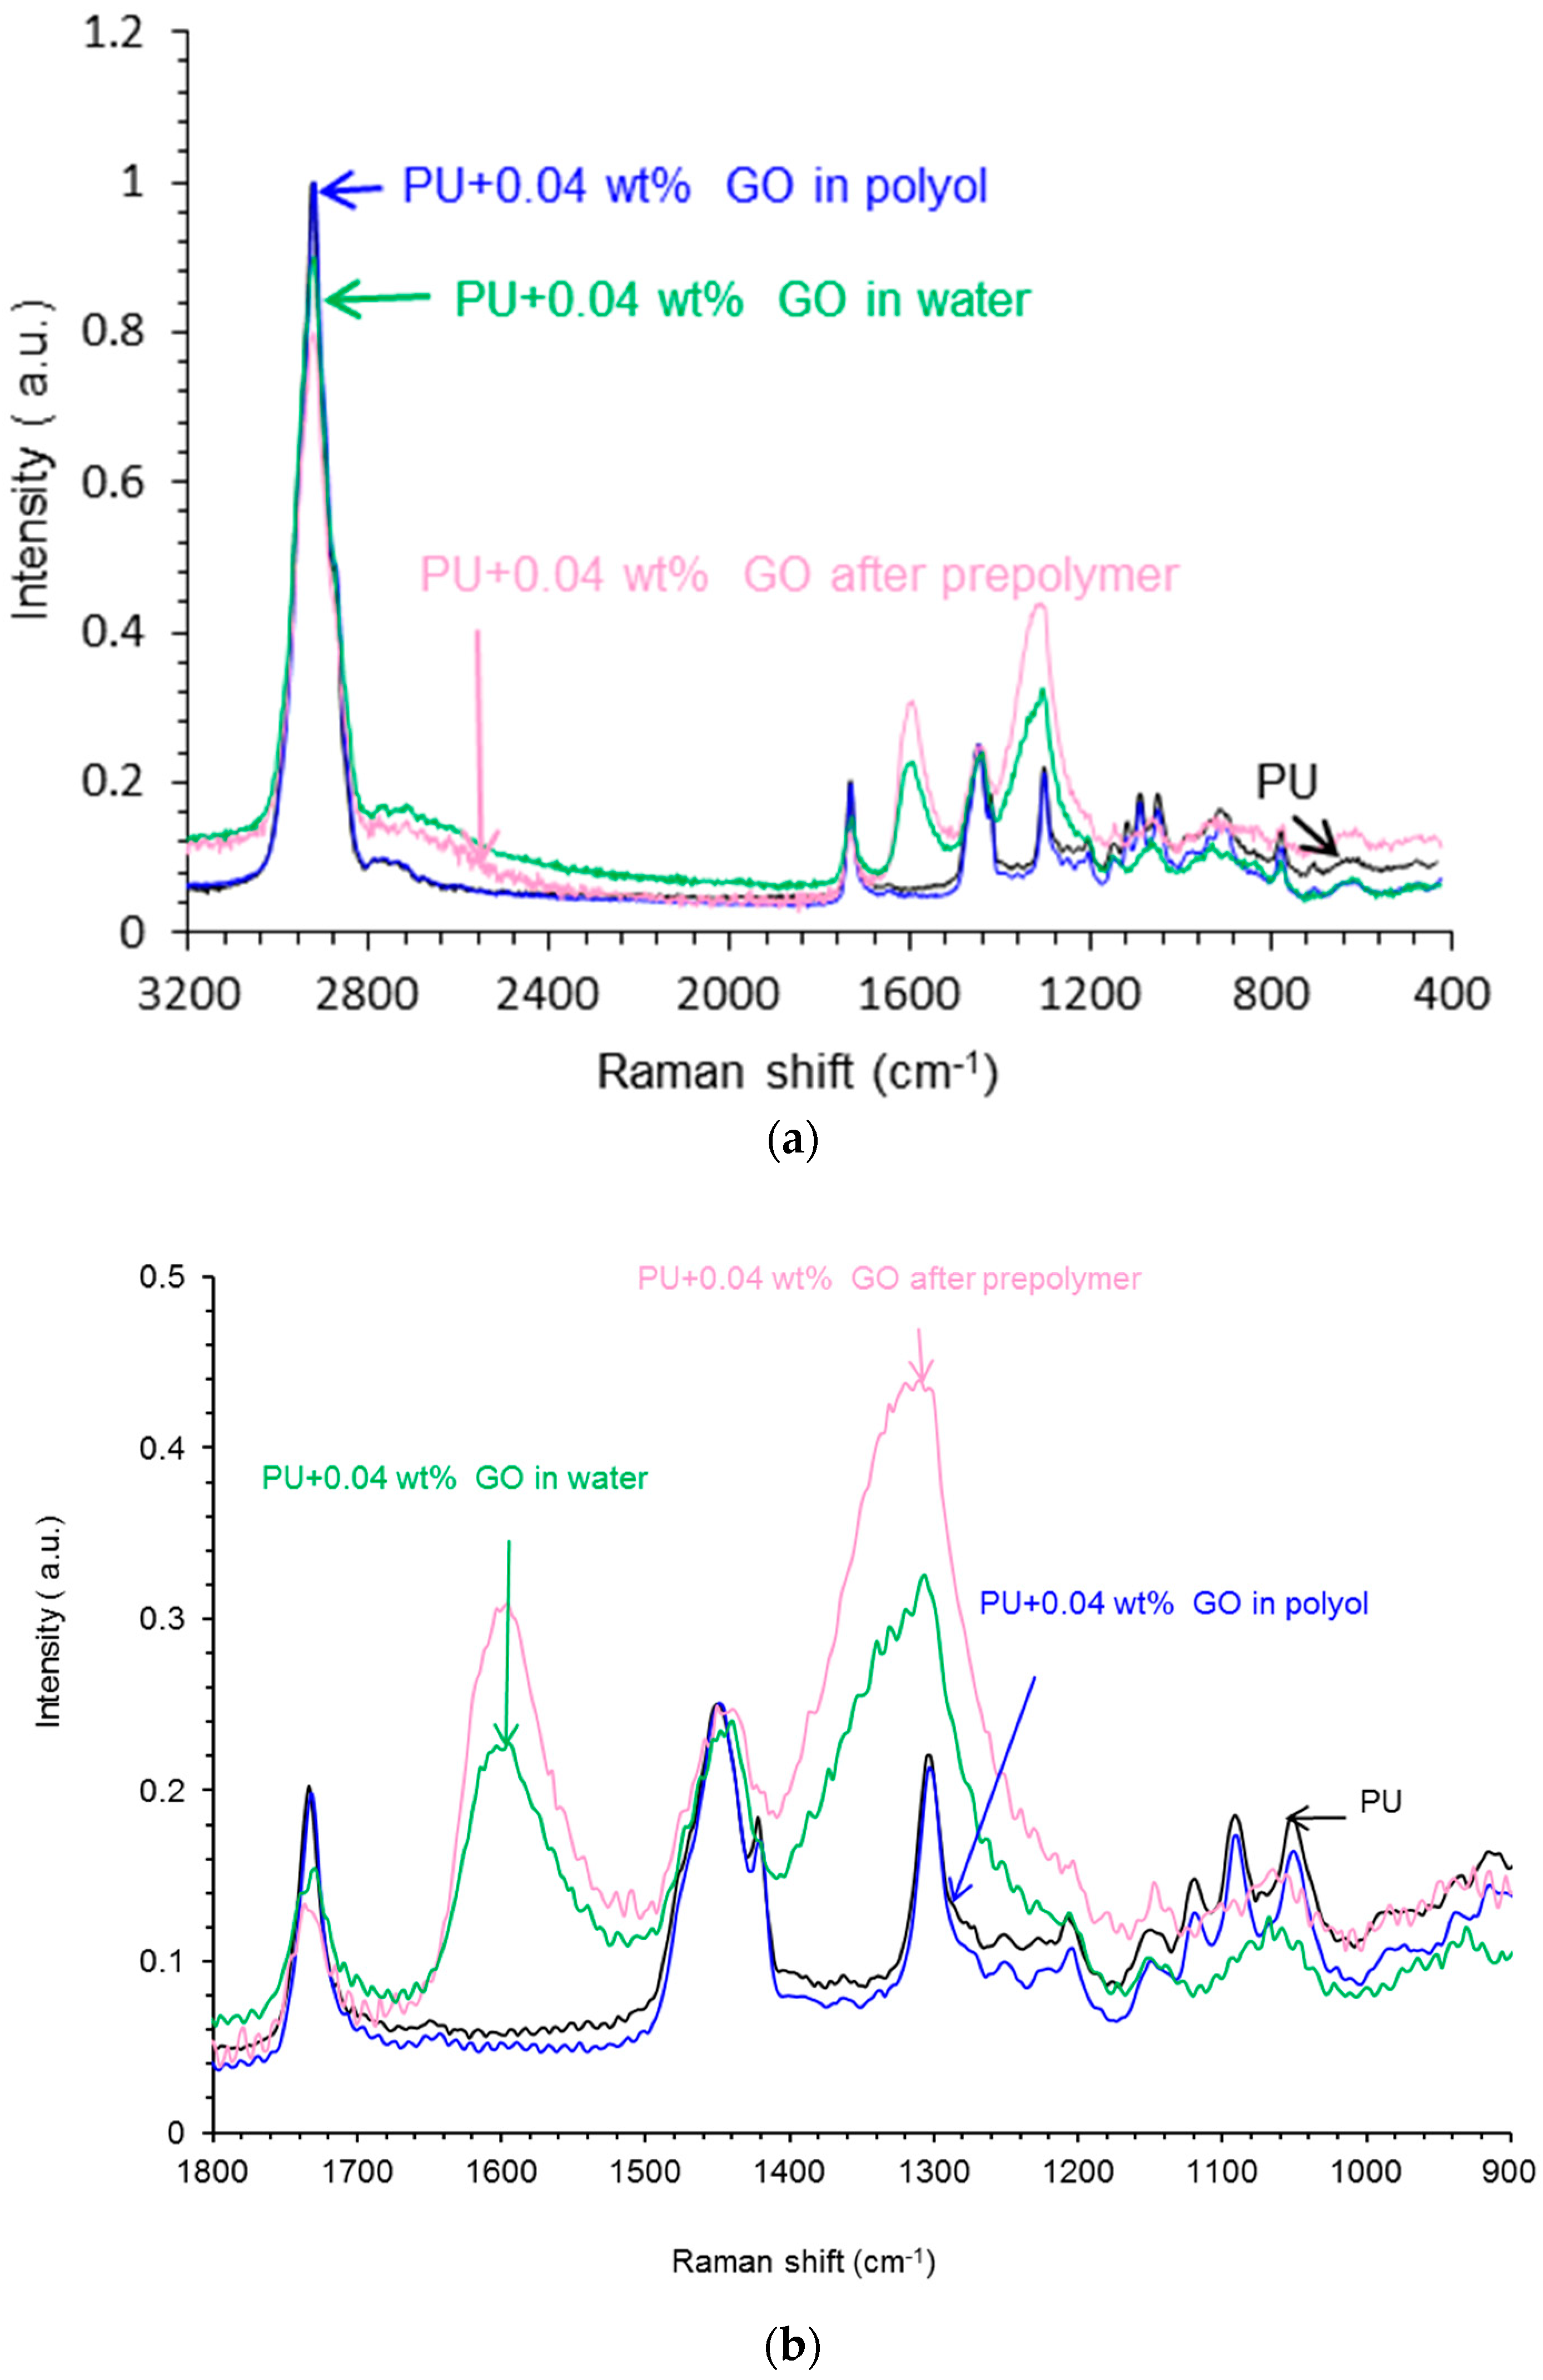
Raman Spectroscopy
Differential Scanning Calorimetry (DSC)
Thermal Gravimetric Analysis (TGA)
X-Ray Diffraction (XRD)
Plate-Plate Rheology
Stress-Strain Tests
Confocal Laser Microscopy
Water Contact Angle Measurements
2.3.3. Adhesion Properties
T-peel Tests of Plasticized PVC/Polyurethane-Urea Dispersion/Plasticized PVC Joints
Single Lap-Shear Test of Stainless Steel 304/Polyurethane-Urea Dispersion/Stainless Steel 304 Joints
3. Results and Discussion
3.1. Characterization of the Graphene Oxide (GO)
3.2. Characterization of the PUDs
3.3. Characterization of the PU Films
3.4. Adhesion Properties of the PUDs
4. Conclusions
Author Contributions
Funding
Acknowledgments
Conflicts of Interest
References
- Pérez-Limiñana, M.A.; Arán-Aís, F.; Torró-Palau, A.M.; Orgilés-Barceló, A.C.; Martín-Martínez, J.M. Characterization of waterborne polyurethane adhesives containing different amounts of ionic groups. Int. J. Adhes. Adhes. 2005, 25, 507–517. [Google Scholar] [CrossRef]
- Fuensanta, M.; Khoshnood, A.; Llansola, F.R.; Martín-Martínez, J.M. New waterborne polyurethane-urea synthesized with ether-carbonate copolymer and amino-alcohol chain extenders with tailored pressure-sensitive adhesion properties. Materials 2020, 13, 627. [Google Scholar] [CrossRef] [PubMed] [Green Version]
- Feng, H.; Wang, X.; Wu, D. Fabrication of spirocyclic phosphazene epoxy-based nanocomposites with graphene via exfoliation of graphite platelets and thermal curing for enhancement of mechanical and conductive properties. Ind. Eng. Chem. Res. 2014, 52, 10160–10171. [Google Scholar] [CrossRef]
- Zhang, X.; Alloul, O.; He, Q.; Zhu, J.; Joseph, M.; Li, Y.; Wei, S.; Guo, Z. Strengthened magnetic epoxy nanocomposites with protruding nanoparticles on the graphene nanosheets. Polymer (Guildf.) 2013, 54, 3594–3604. [Google Scholar] [CrossRef]
- Giuri, A.; Colella, S.; Listorti, A.; Rizzo, A.; Mele, C.; Esposito Corcione, C. GO/glucose/PEDOT:PSS ternary nanocomposites for flexible supercapacitors. Compos. Part B Eng. 2018, 148, 149–155. [Google Scholar] [CrossRef]
- Sun, M.; Wang, G.; Yang, C.; Jiang, H.; Li, C. A graphene/carbon nanotube π-conjugated polymer nanocomposite for high-performance organic supercapacitor electrodes. J. Mater. Chem. A 2015, 3, 3880–3890. [Google Scholar] [CrossRef]
- Ghaleb, Z.A.; Mariatti, M.; Ariff, Z.M. Properties of graphene nano powder and multi-walled carbon nanotube-filled epoxy thin-film nanocomposites for electronic applications: The effect of sonication time and filler loading. Compos. A Appl. Sci. Manuf. 2014, 58, 77–83. [Google Scholar] [CrossRef]
- Sharmila, T.K.B.; Nair, A.B.; Abraham, B.T.; Beegum, P.M.S.; Thomas, E. Microwave exfoliated reduced graphene oxide epoxy nanocomposites for high performance applications. Polymer (Guildf.) 2014, 55, 3614–3627. [Google Scholar] [CrossRef]
- Musico, Y.L.F.; Santos, C.M.; Dalida, M.L.P.; Rodrigues, D.F. Improved removal of lead (II) from water using a polymer-based graphene oxide nanocomposite. J. Mater. Chem. A 2013, 1, 3789–3796. [Google Scholar] [CrossRef]
- Veeramalai, C.P.; Li, F.; Xu, H.; Kim, T.W.; Guo, T. One pot hydrothermal synthesis of graphene like MoS2 nanosheets for application in high performance lithium ion batteries. RSC Adv. 2015, 5, 57666–57670. [Google Scholar] [CrossRef]
- Pokharel, P.; Truong, Q.; Lee, D.S. Multi-step microwave reduction of graphite oxide and its use in the formation of electrically conductive graphene/epoxy composites. J. Compos. B Eng. 2014, 64, 187–193. [Google Scholar] [CrossRef]
- Strankowski, M.; Korzeniewski, P.; Strankowska, J.; Anu, A.S.; Thomas, S. Morphology, mechanical and thermal properties of thermoplastic polyurethane containing reduced graphene oxide and graphene nanoplatelets. ACS Mater. 2018, 11, 82. [Google Scholar] [CrossRef] [PubMed] [Green Version]
- Strankowski, M. Effect of variation of hard segment content and graphene-based nano filler concentration on morphological, thermal, and mechanical properties of polyurethane nanocomposites. Int. J. Polym. Sci. 2018, 1090753. [Google Scholar] [CrossRef]
- Urban, M.; Strankowski, M. Shape memory polyurethane materials containing ferromagnetic iron oxide and graphene nanoplatelets. Materials 2017, 10, 1083. [Google Scholar] [CrossRef] [PubMed] [Green Version]
- Menes, O.; Cano, M.; Benedito, A.; Giménez, E.; Castell, P.; Maser, W.K.; Benito, A.M. The effect of ultra-thin graphite on the morphology and physical properties of thermoplastic polyurethane elastomer composites. Compos. Sci. Technol. 2012, 72, 1595–1601. [Google Scholar] [CrossRef] [Green Version]
- Gaidukovs, S.; Kampars, V.; Bitenieks, J.; Bochkov, I.; Gaidukova, G.; Cabulis, U.; Kampars, V.; Bitenieks, J.; Bochkov, I.; Gaidukova, G. Thermo-mechanical properties of polyurethane modified with graphite oxide and carbon nanotube particles. J. Renew. Mat. 2016, 4587, 1–11. [Google Scholar] [CrossRef]
- Pokharel, P.; Lee, D.S. High performance polyurethane nanocomposite films prepared from a masterbatch of graphene oxide in polyether polyol. Chem. Eng. J. 2014, 253, 356–365. [Google Scholar] [CrossRef]
- Zhang, F.; Liu, W.; Liang, L.; Wang, S.; Shi, H.; Xie, Y.; Yang, M.; Pi, K. The effect of functional graphene oxide nanoparticles on corrosion resistance of waterborne polyurethane. Colloids Surf. A Physicochem. Eng. Asp. 2020, 591, 124565. [Google Scholar] [CrossRef]
- Cai, D.; Jin, J.; Yusoh, K.; Rafiq, R.; Song, M. High performance polyurethane/functionalized graphene nanocomposites with improved mechanical and thermal properties. Compos. Sci. Technol. 2012, 72, 702–707. [Google Scholar] [CrossRef]
- Ding, J.N.; Fan, Y.; Zhao, C.X.; Liu, Y.B.; Yu, C.T.; Yuan, N.Y. Electrical conductivity of waterborne polyurethane/graphene composites prepared by solution mixing. J. Compos. Mater. 2011, 46, 747–752. [Google Scholar] [CrossRef]
- Lee, Y.R.; Raghu, A.V.; Jeong, H.M.; Kim, B.K. Properties of waterborne polyurethane/functionalized graphene sheet nanocomposites prepared by an in situ method. Macromol. Chem. Phys. 2009, 210, 1247–1254. [Google Scholar] [CrossRef]
- Kim, H.; Lee, S. Electrical properties of graphene/waterborne polyurethane composite films. Fibers Polym. 2017, 18, 1304–1313. [Google Scholar] [CrossRef]
- Zhang, F.; Liu, W.; Wang, S.; Jiang, C.; Xie, Y.; Yang, M.; Shi, M. A novel and feasible approach for polymer amine modified graphene oxide to improve water resistance, thermal, and mechanical ability of waterborne polyurethane. Appl. Surf. Sci. 2019, 491, 301–312. [Google Scholar] [CrossRef]
- Wan, T.; Chen, D. In situ reduction of graphene oxide in waterborne polyurethane matrix and the healing behavior of nanocomposites by multiple ways. J. Polym. Sci. Part B Polym. Phys. 2019, 57, 202–209. [Google Scholar] [CrossRef]
- Kim, H.; Miura, Y.; Macosko, C.W. Graphene/polyurethane nanocomposites for improved gas barrier and electrical conductivity. Chem. Mater. 2010, 22, 3441–3450. [Google Scholar] [CrossRef]
- Singh, V.; Joung, D.; Zhai, L.; Das, S.; Khondaker, S.I.; Seal, S. Graphene based materials: Past, present and future. Prog. Mater. Sci. 2011, 56, 1178–1271. [Google Scholar] [CrossRef]
- Wang, X.; Hu, Y.; Song, L.; Yang, H.; Xing, W.; Lu, H. In situ polymerization of graphene nanosheets and polyurethane with enhanced mechanical and thermal properties. J. Mater. Chem. 2011, 21, 4222–4227. [Google Scholar] [CrossRef]
- Fu, Y.X.; He, Z.X.; Mo, D.C.; Lu, S.S. Thermal conductivity enhancement of epoxy adhesive using graphene sheets as additives. Int. J. Therm. Sci. 2014, 86, 276–283. [Google Scholar] [CrossRef]
- Marami, G.; Nazari, S.A.; Faghidian, S.A.; Vakili-Tahami, F.; Etemadi, S. Improving the mechanical behavior of the adhesively bonded joints using RGO additive. Int. J. Adhes. Adhes. 2016, 70, 277–286. [Google Scholar] [CrossRef]
- Choi, J.Y.; Kim, S.W.; Cho, K.Y. Improved thermal conductivity of graphene encapsulated poly(methyl methacrylate) nanocomposite adhesives with low loading amount of graphene. Compos. Sci. Technol. 2014, 94, 147–154. [Google Scholar] [CrossRef]
- Zhao, Z.; Guo, L.; Feng, L.; Lu, H.; Xu, Y.; Wang, J.; Xiang, B.; Zou, X. Polydopamine functionalized graphene oxide nanocomposites reinforced the corrosion protection and adhesion properties of waterborne polyurethane coatings. Eur. Polym. J. 2019, 120, 1–13. [Google Scholar] [CrossRef]
- Nine, M.J.; Tran, D.N.H.; El Mekawy, A.; Losic, D. Interlayer growth of borates for highly adhesive graphene coatings with enhanced abrasion resistance, fire-retardant and antibacterial ability. Carbon 2017, 117, 252–262. [Google Scholar] [CrossRef]
- Yang, F.; Wu, Y.; Zhang, S.; Zhang, H.; Zhao, S.; Zhang, J.; Fei, B. Mechanical and thermal properties of waterborne polyurethane coating modified through one-step cellulose nanocrystals/graphene materials sols method. Coatings 2020, 10, 40. [Google Scholar] [CrossRef] [Green Version]
- Kale, M.B.; Luo, Z.; Zhang, X.; Dhamodharan, D.; Divakaran, N.; Mubarak, S.; Wu, L.; Xu, Y. Waterborne polyurethane/graphene oxide-silica nanocomposites with improved mechanical and thermal properties for leather coatings using screen printing. Polymer 2019, 170, 43–53. [Google Scholar] [CrossRef]
- Cristofolini, L.; Guidetti, G.; Morellato, K.; Gibertini, M.; Calvaresi, M.; Zerbetto, F.; Montalti, M.; Falini, G. Graphene materials strengthen aqueous polyurethane adhesives. ACS Omega 2018, 3, 8829–8835. [Google Scholar] [CrossRef]
- Tounici, A.; Martín-Martínez, J.M. Addition of small amounts of graphene oxide in the polyol for synthesizing waterborne polyurethane-urea adhesives with improved adhesion properties. Int. J. Adhes. Adhes. 2020. Submitted for publication. [Google Scholar]
- Johra, F.T.; Lee, J.W.; Jung, W.G. Facile and safe graphene preparation on solution based platform. J. Ind. Eng. Chem. 2014, 20, 2883–2887. [Google Scholar] [CrossRef]
- Stankovich, S.; Dikin, D.A.; Dommett, G.H.B.; Kohlhaas, K.M.; Zimney, E.J. Graphene-based composite materials. Nature 2006, 442, 282–286. [Google Scholar] [CrossRef] [PubMed]
- Giuri, A.; Masi, S.; Colella, S.; Listorti, A.; Rizzo, A.; Kovtun, A.; Dell’Elce, S.; Liscio, A.; Esposito Corcione, C. Rheological and physical characterization of PEDOT:PSS/graphene oxide nanocomposites for perovskite solar cells. Polym. Eng. Sci. 2017, 57, 546–552. [Google Scholar] [CrossRef] [Green Version]
- Strankowski, M.B.; Damian, W.B.; Piszczyk, A.; Strankowska, J. Polyurethane nanocomposite containing reduced Graphene Oxide. FTIR, Raman and XRD Studies. J. Spectrosc. 2016, 7520741. [Google Scholar] [CrossRef] [Green Version]
- Potts, J.R.; Dreyer, D.R.; Bielawski, C.W.; Ruoff, R.S. Graphene-based polymer nanocomposites. Polymer (Guildf.) 2011, 52, 5–25. [Google Scholar] [CrossRef] [Green Version]
- Wan, T.; Chen, D. Mechanical enhancement of self-healing waterborne polyurethane by graphene oxide. Prog. Org. Coat. 2018, 121, 73–79. [Google Scholar] [CrossRef]


| Polyurethane-Urea Dispersion | Solids Content (wt %) | pH |
|---|---|---|
| PUD | 38.6 ± 0.6 | 9.5 ± 0.2 |
| PUD+0.04 wt % GO in polyol | 36.8 ± 0.7 | 9.2 ± 0.2 |
| PUD+0.04 wt % GO after prepolymer | 39.1 ± 0.7 | 9.4 ± 0.2 |
| PUD+0.04 wt % GO in water | 39.0 ± 0.4 | 9.1 ± 0.0 |
| Polyurethane-Urea Dispersion | Viscosity at 1 s−1 (mPa·s) | Viscosity at 700 s−1 (mPa·s) | Pseudoplasticity Index * |
|---|---|---|---|
| PUD | 505 | 42 | 12.0 |
| PUD+0.04 wt % GO in polyol | 142 | 30 | 4.7 |
| PUD+0.04 wt % GO after prepolymer | 31 | 23 | 1.3 |
| PUD+0.04 wt % GO in water | 150 | 60 | 2.5 |
| Polyurethane-Urea Dispersion | η0 (mPa·s) | η∞ (mPa·s) | τ (s) | m |
|---|---|---|---|---|
| PUD | 1520 | 42 | 8.1 | 0.0240 |
| PUD+0.04 wt % GO in polyol | 360 | 29 | 2.4 | 0.0003 |
| PUD+0.04 wt % GO after prepolymer | 37 | 22 | 0.5 | 0.0002 |
| PUD+0.04 wt % GO in water | 170 | 59 | 2.6 | 0.0006 |
| Wavenumber (cm−1) | Relative Contribution of Species (%) | |||
|---|---|---|---|---|
| PU | PU+0.04 wt % GO in Polyol | PU+0.04 wt % GO after Prepolymer | PU+0.04 wt % GO in Water | |
| 1727 (free urethane) | 58 | 45 | 38 | 42 |
| 1711–1709 (H-bonded urethane) | 9 | 35 | 33 | 38 |
| 1693–1687 (free urea) | 22 | 9 | 14 | 12 |
| 1658–1652 (H-bonded urea) | 11 | 11 | 15 | 8 |
| Polyurethane-Urea Film | Tg1 (°C) | Tg2 (°C) | Tg3 (°C) |
|---|---|---|---|
| PU | −49 | 30 | 198 |
| PU+0.04 wt % GO in polyol | −52 | 28 | 195 |
| PU+0.04 wt % GO after prepolymer | −52 | 27 | 174 |
| PU+0.04 wt % GO in water | −52 | 26 | 197 |
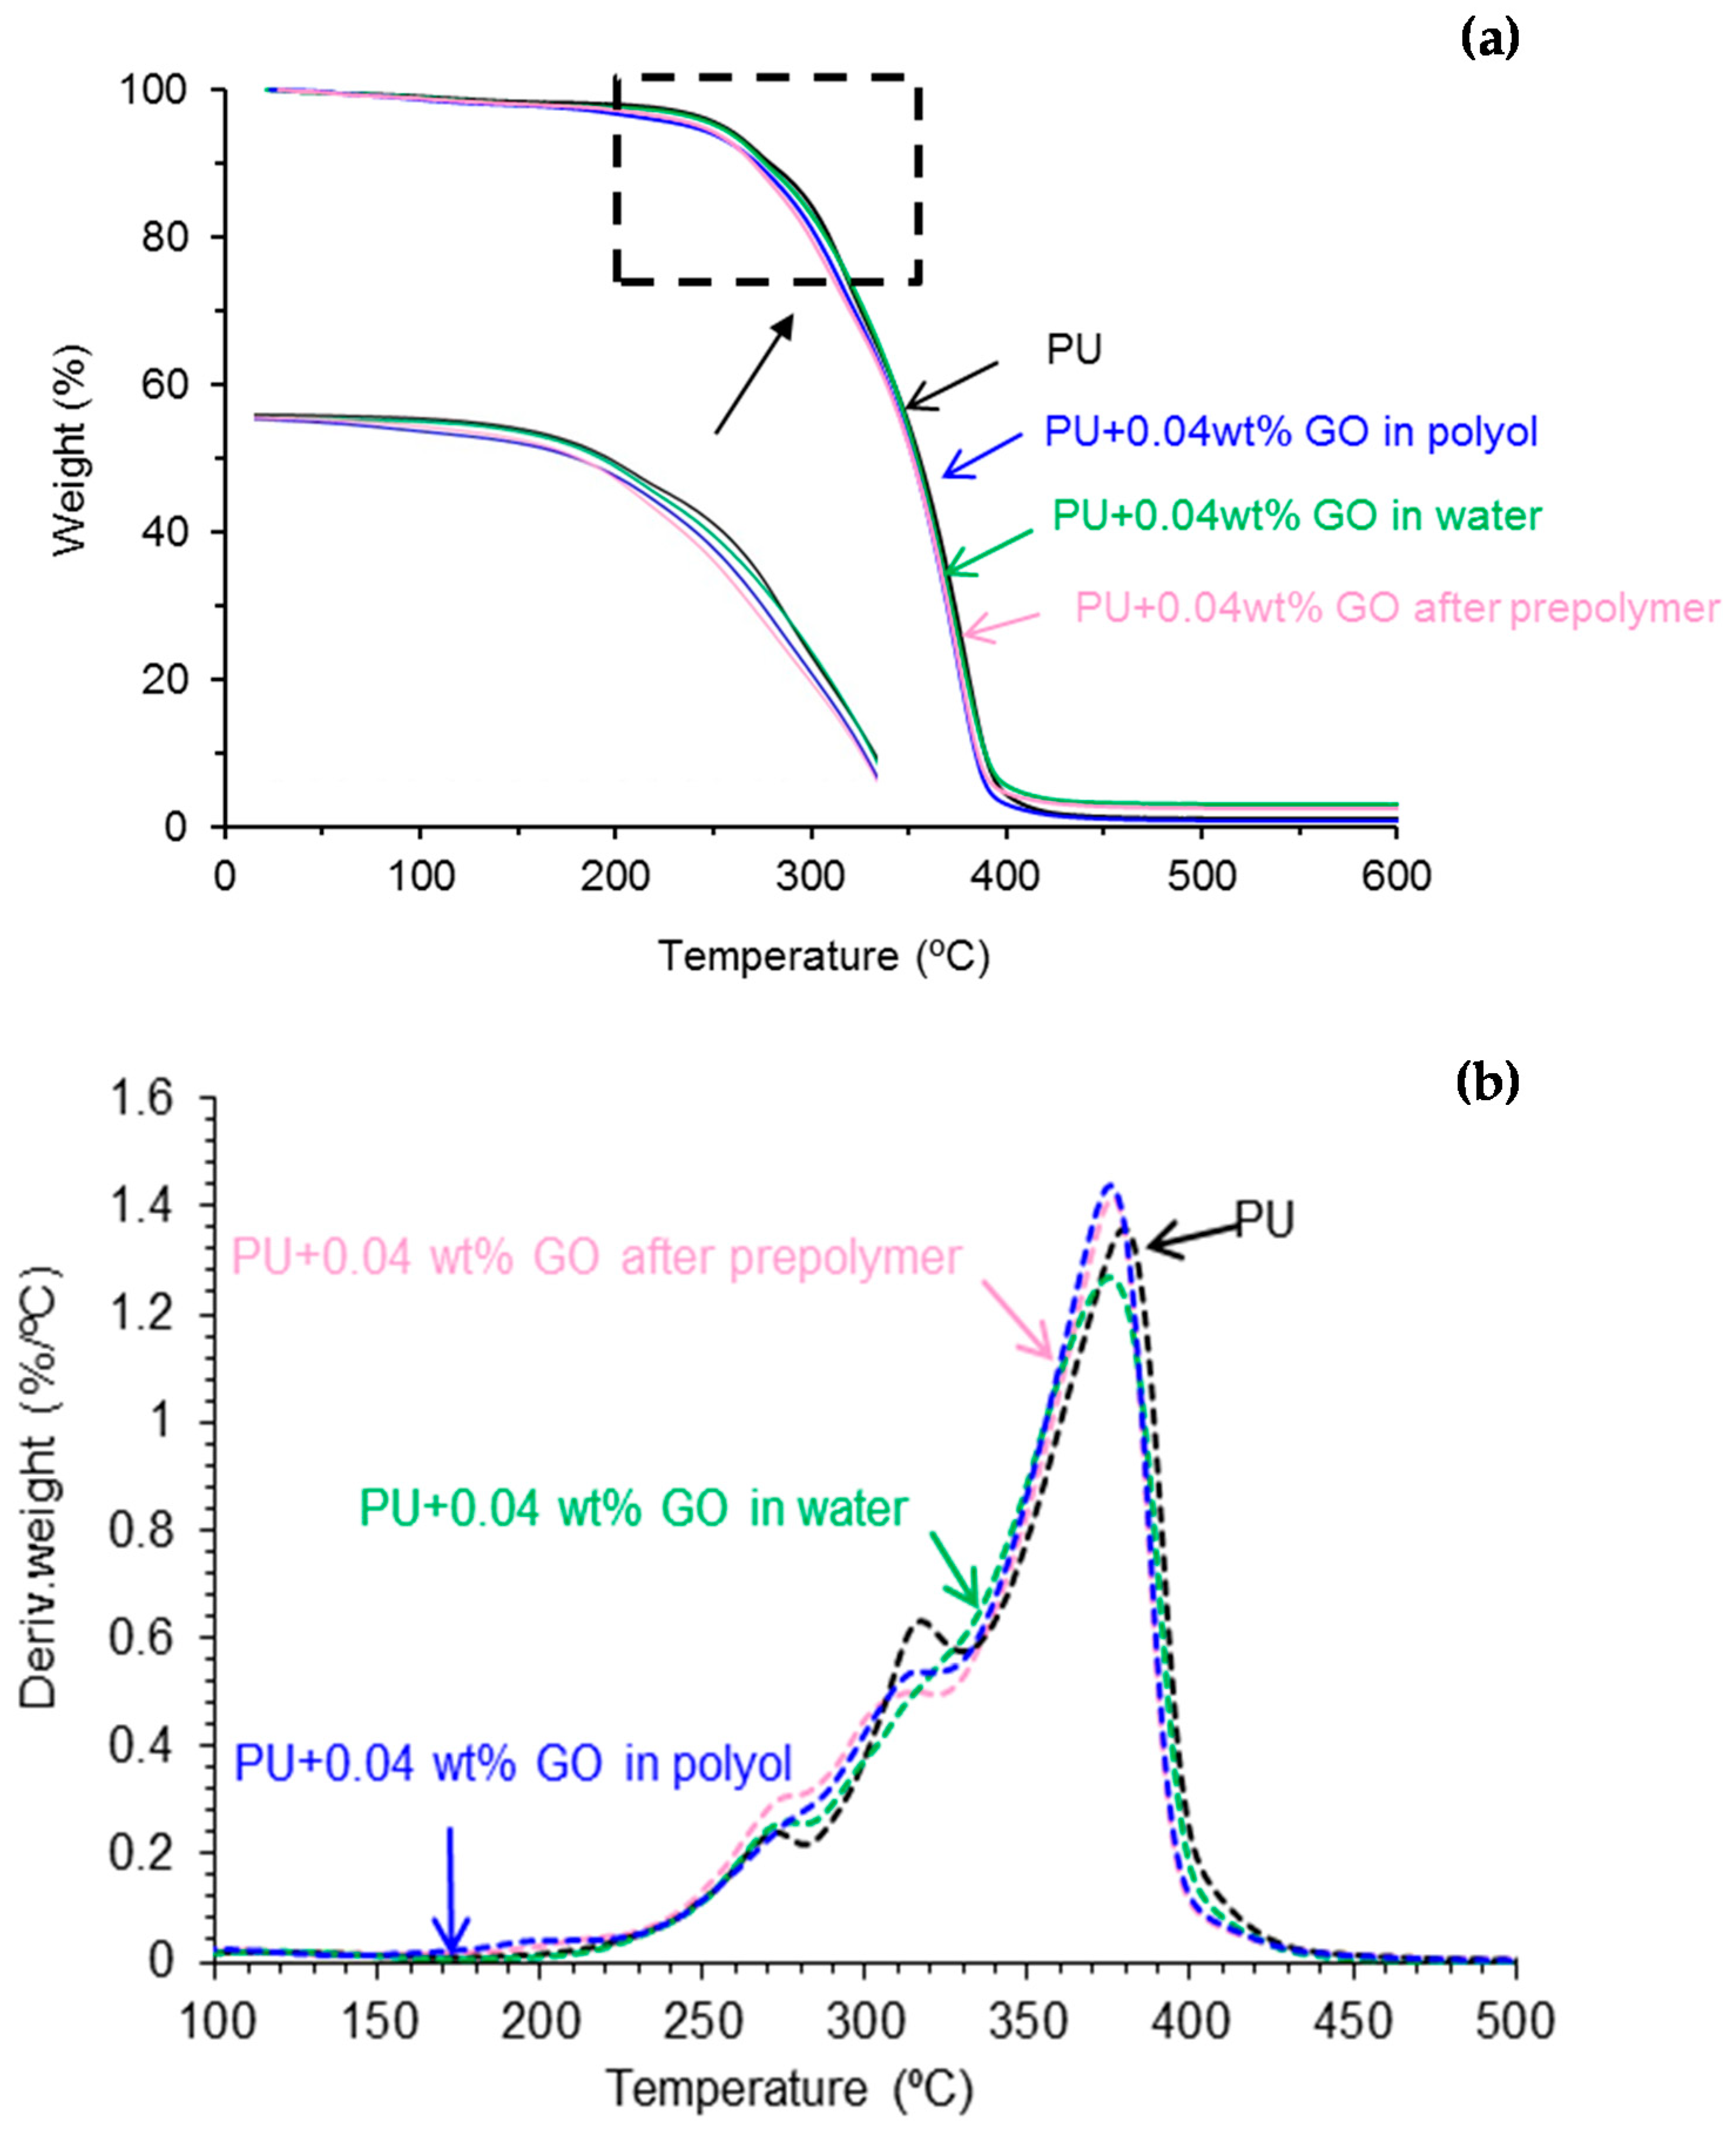
| Polyurethane-Urea Film | T5% (°C) | T50% (°C) |
|---|---|---|
| PU | 255 | 356 |
| PU+0.04 wt % GO in polyol | 239 | 352 |
| PU+0.04 wt % GO after prepolymer | 244 | 352 |
| PU+0.04 wt % GO in water | 253 | 354 |
| Polyurethane Urea Film | T1 (°C) | Weight Loss1 (%) | T2 (°C) | Weight Loss2 (%) | T3 (°C) | Weight Loss3 (%) | T4 (°C) | Weight Loss4 (%) |
|---|---|---|---|---|---|---|---|---|
| PU | 114 | 2 | 270 | 10 | 315 | 24 | 380 | 62 |
| PU+0.04 wt % GO in polyol | 196 | 4 | 275 | 10 | 312 | 21 | 376 | 63 |
| PU+0.04 wt % GO after prepolymer | 211 | 5 | 271 | 11 | 304 | 18 | 377 | 64 |
| PU+0.04 wt % GO in water | 126 | 4 | 270 | 10 | 312 | 21 | 377 | 63 |
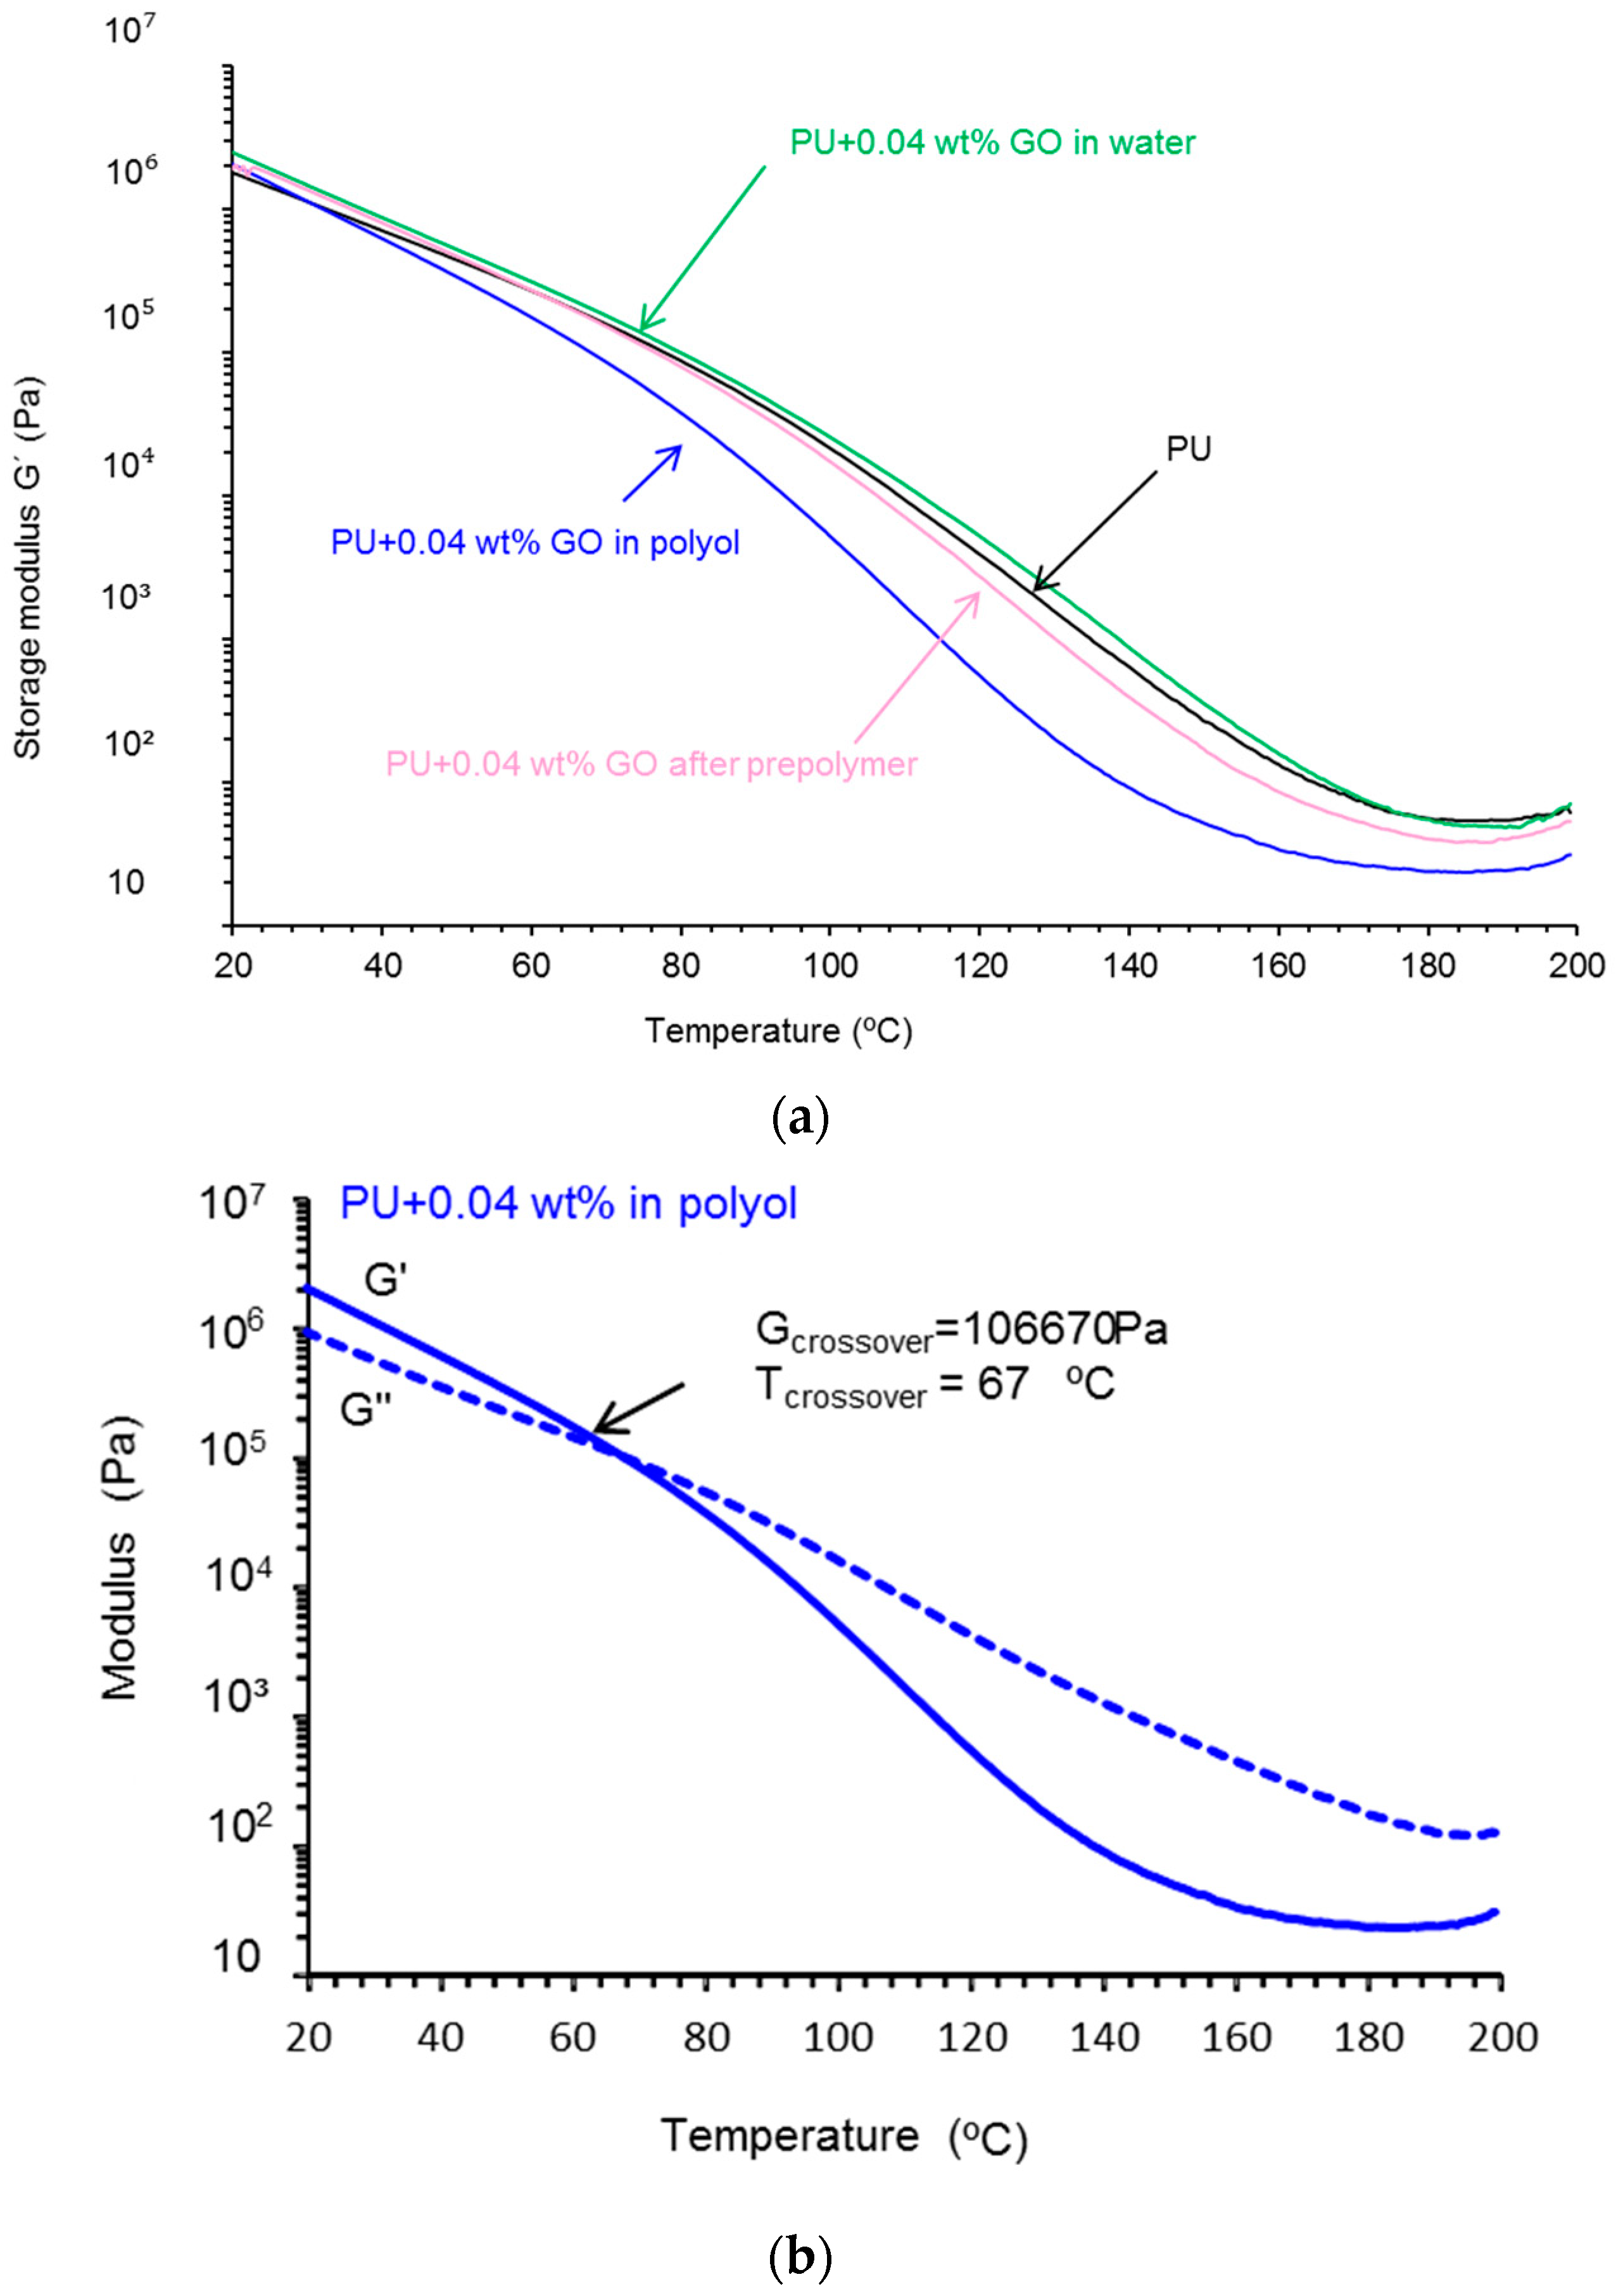
| Polyurethane-Urea Film | T cross-over (°C) | Gcross-over (kPa) |
|---|---|---|
| PU | 81 | 78.5 |
| PU+0.04 wt % GO in polyol | 67 | 106.7 |
| PU+0.04 wt % GO after prepolymer | 79 | 81.0 |
| PU+0.04 wt % GO in water | 83 | 80.8 |
| Polyurethane-Urea Film | Yield Stress (MPa) | Yield Strain (%) | Tensile Strength (MPa) | Elongation At-Break (%) |
|---|---|---|---|---|
| PU | 14 ± 1 | 7 ± 1 | 34 ± 4 | 725 ± 16 |
| PU+0.04 wt % GO in polyol | 23 ± 1 | 3 ± 1 | 20 ± 5 | 637 ± 40 |
| PU+0.04 wt % GO after prepolymer | 19 ± 5 | 11 ± 3 | 33 ± 5 | 728 ± 41 |
| PU+0.04 wt % GO in water | 13 ± 1 | 13 ± 1 | 54 ± 3 | 695 ± 3 |
| Polyurethane-Urea Film | Water Contact Angle (°) |
|---|---|
| PU | 40 ± 0 |
| PU+0.04 wt % GO in polyol | 45 ± 2 |
| PU+0.04 wt % GO after prepolymer | 50 ± 2 |
| PU+0.04 wt % GO in water | 54 ± 4 |
| Polyurethane-Urea Dispersion | T-peel Strength—1 h (kN/m) | T-peel Strength—72 h (kN/m) | Locus of Failure |
|---|---|---|---|
| PUD | 4.6 ± 0.4 | 6.2 ± 0.7 | CA+CS |
| PUD+0.04 wt % GO in polyol | 6.9 ± 0.7 | 12.0 ± 2.0 | S+CA |
| PUD+0.04 wt % GO after prepolymer | 7.4 ± 0.1 | 9.3 ± 0.1 | CS+CA |
| PUD+0.04 wt % GO in water | 6.3 ± 0.4 | 7.1 ± 0.3 | CS+CA |
| Polyurethane-Urea Dispersion | Shear Strength (kPa) | Locus of Failure |
|---|---|---|
| PUD | 95 ± 10 | A |
| PUD+0.04 wt % GO in polyol | 226 ± 29 | A |
| PUD+0.04 wt % GO after prepolymer | 190 ± 60 | A |
| PUD+0.04 wt % GO in water | 721 ± 49 | A |
© 2020 by the authors. Licensee MDPI, Basel, Switzerland. This article is an open access article distributed under the terms and conditions of the Creative Commons Attribution (CC BY) license (http://creativecommons.org/licenses/by/4.0/).
Share and Cite
Tounici, A.; Martín-Martínez, J.M. Addition of Graphene Oxide in Different Stages of the Synthesis of Waterborne Polyurethane-Urea Adhesives and Its Influence on Their Structure, Thermal, Viscoelastic and Adhesion Properties. Materials 2020, 13, 2899. https://0-doi-org.brum.beds.ac.uk/10.3390/ma13132899
Tounici A, Martín-Martínez JM. Addition of Graphene Oxide in Different Stages of the Synthesis of Waterborne Polyurethane-Urea Adhesives and Its Influence on Their Structure, Thermal, Viscoelastic and Adhesion Properties. Materials. 2020; 13(13):2899. https://0-doi-org.brum.beds.ac.uk/10.3390/ma13132899
Chicago/Turabian StyleTounici, Abir, and José Miguel Martín-Martínez. 2020. "Addition of Graphene Oxide in Different Stages of the Synthesis of Waterborne Polyurethane-Urea Adhesives and Its Influence on Their Structure, Thermal, Viscoelastic and Adhesion Properties" Materials 13, no. 13: 2899. https://0-doi-org.brum.beds.ac.uk/10.3390/ma13132899