Experiment and Numerical Simulation for the Compressive Buckling Behavior of Double-Sided Laser-Welded Al–Li Alloy Aircraft Fuselage Panel

 ,
,
Abstract
:1. Introduction
2. Basic Principles
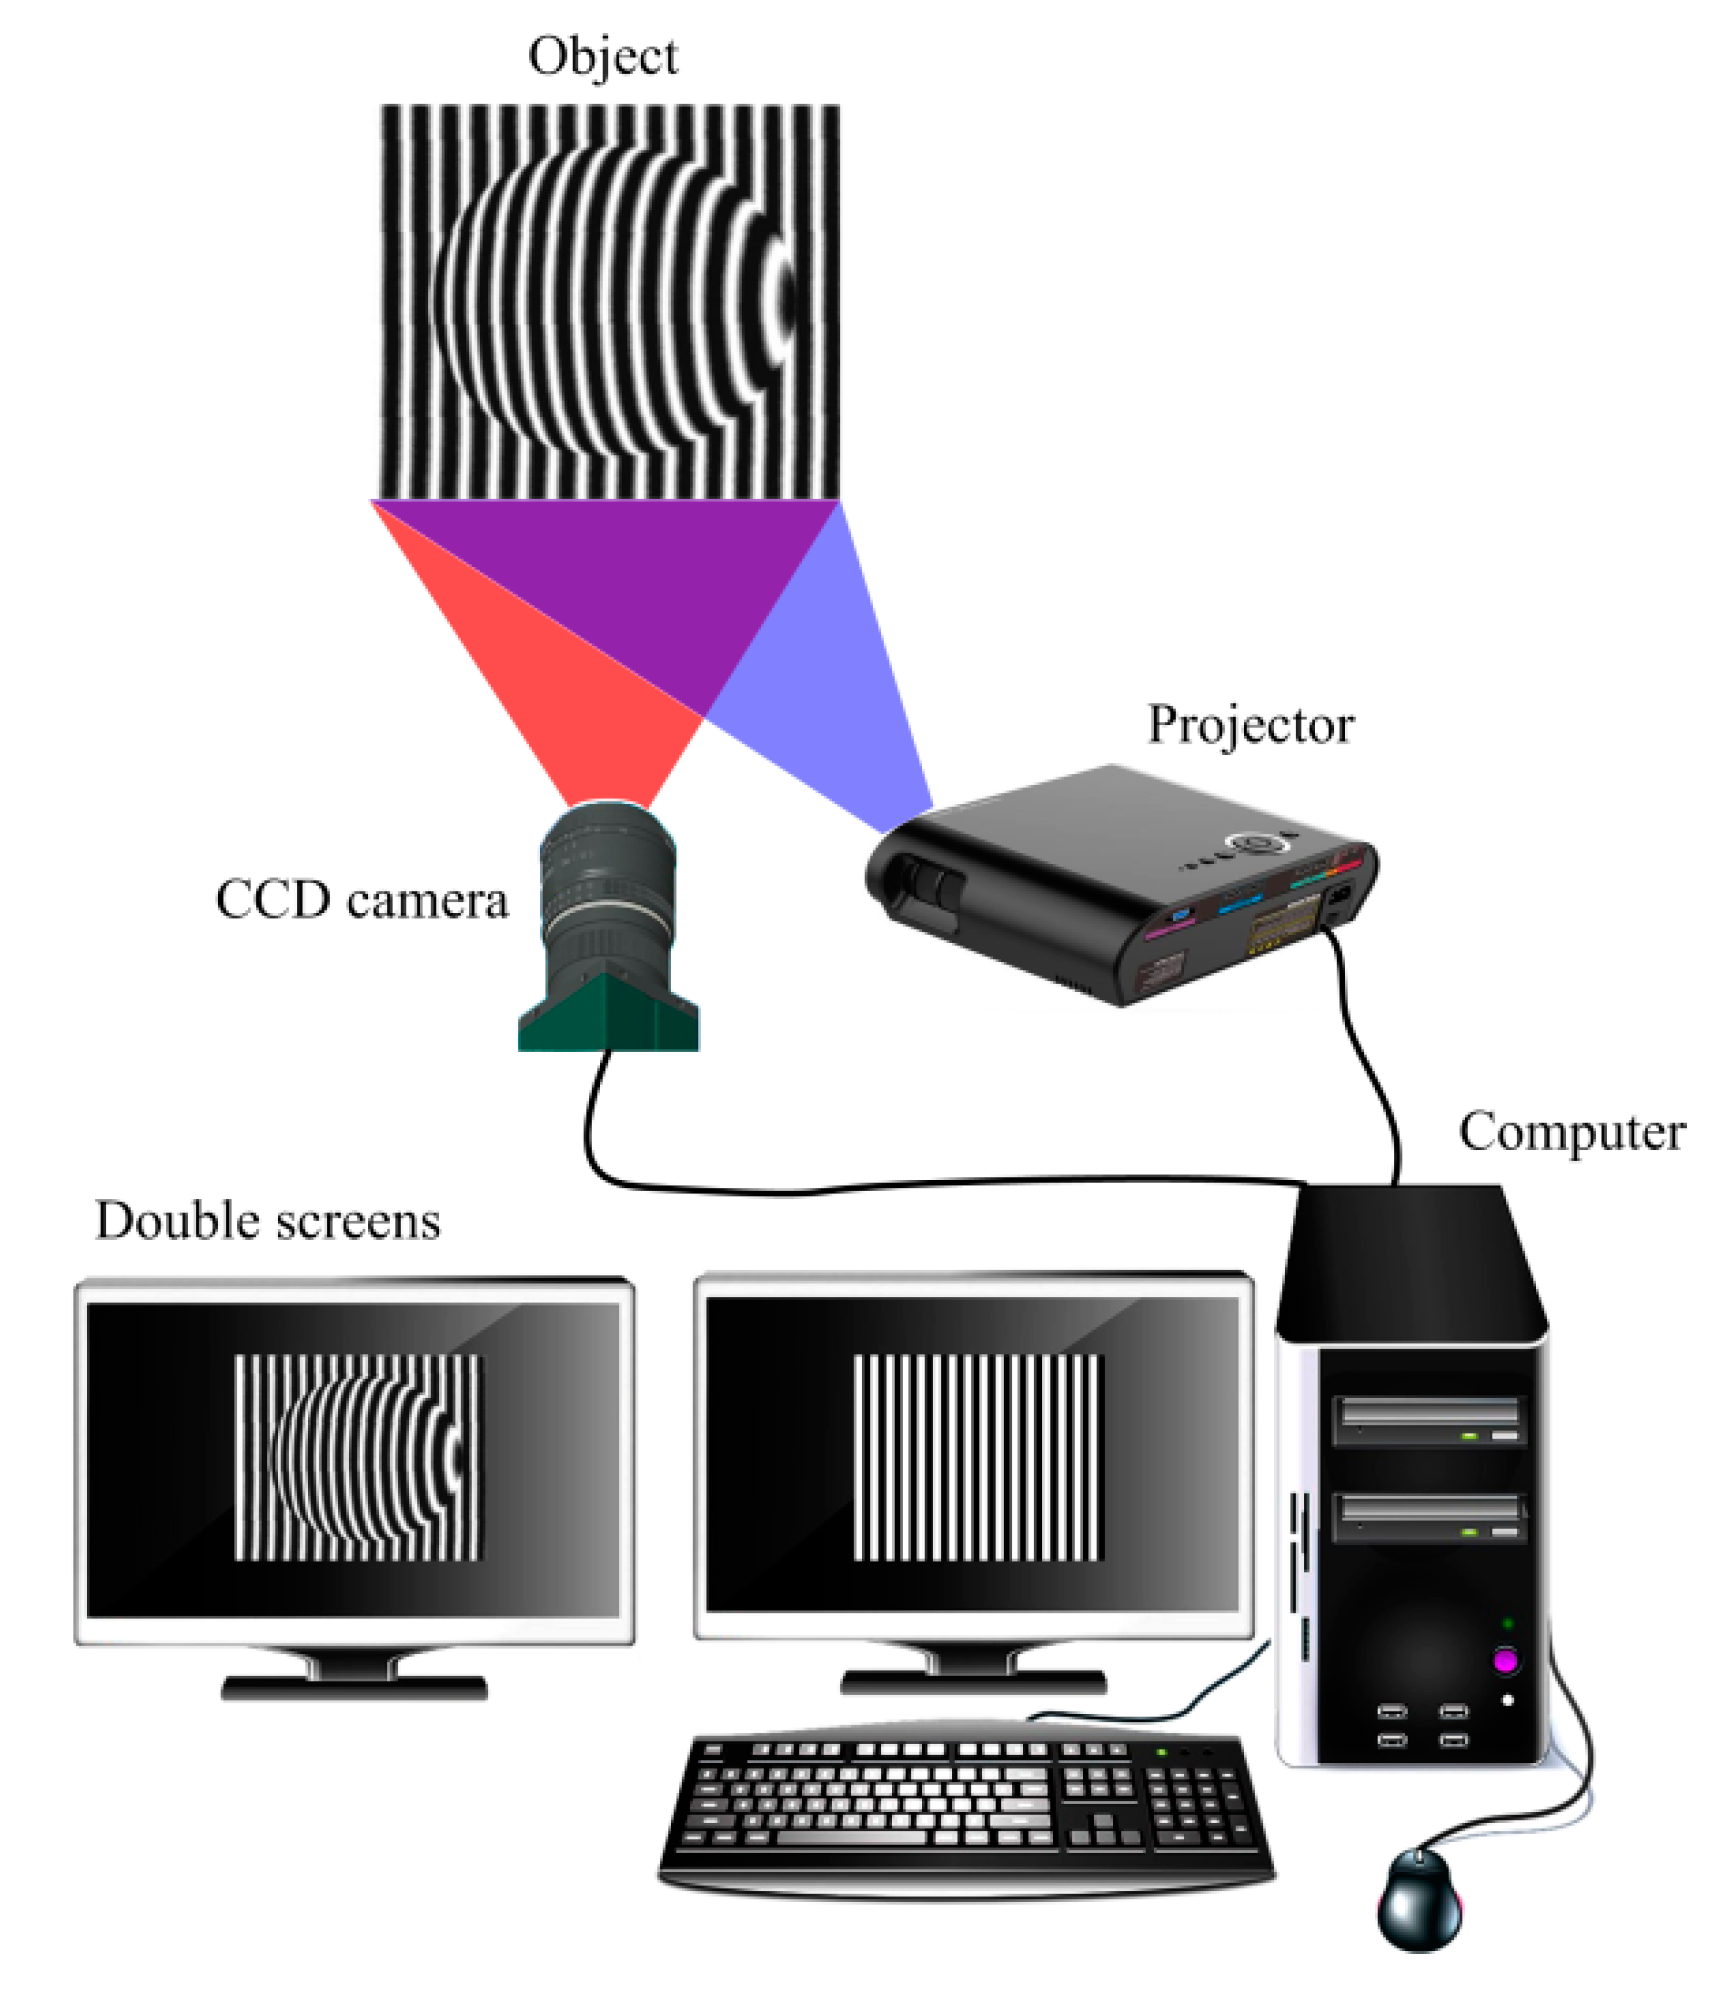
2.1. Fringe Projection Profilometry Method
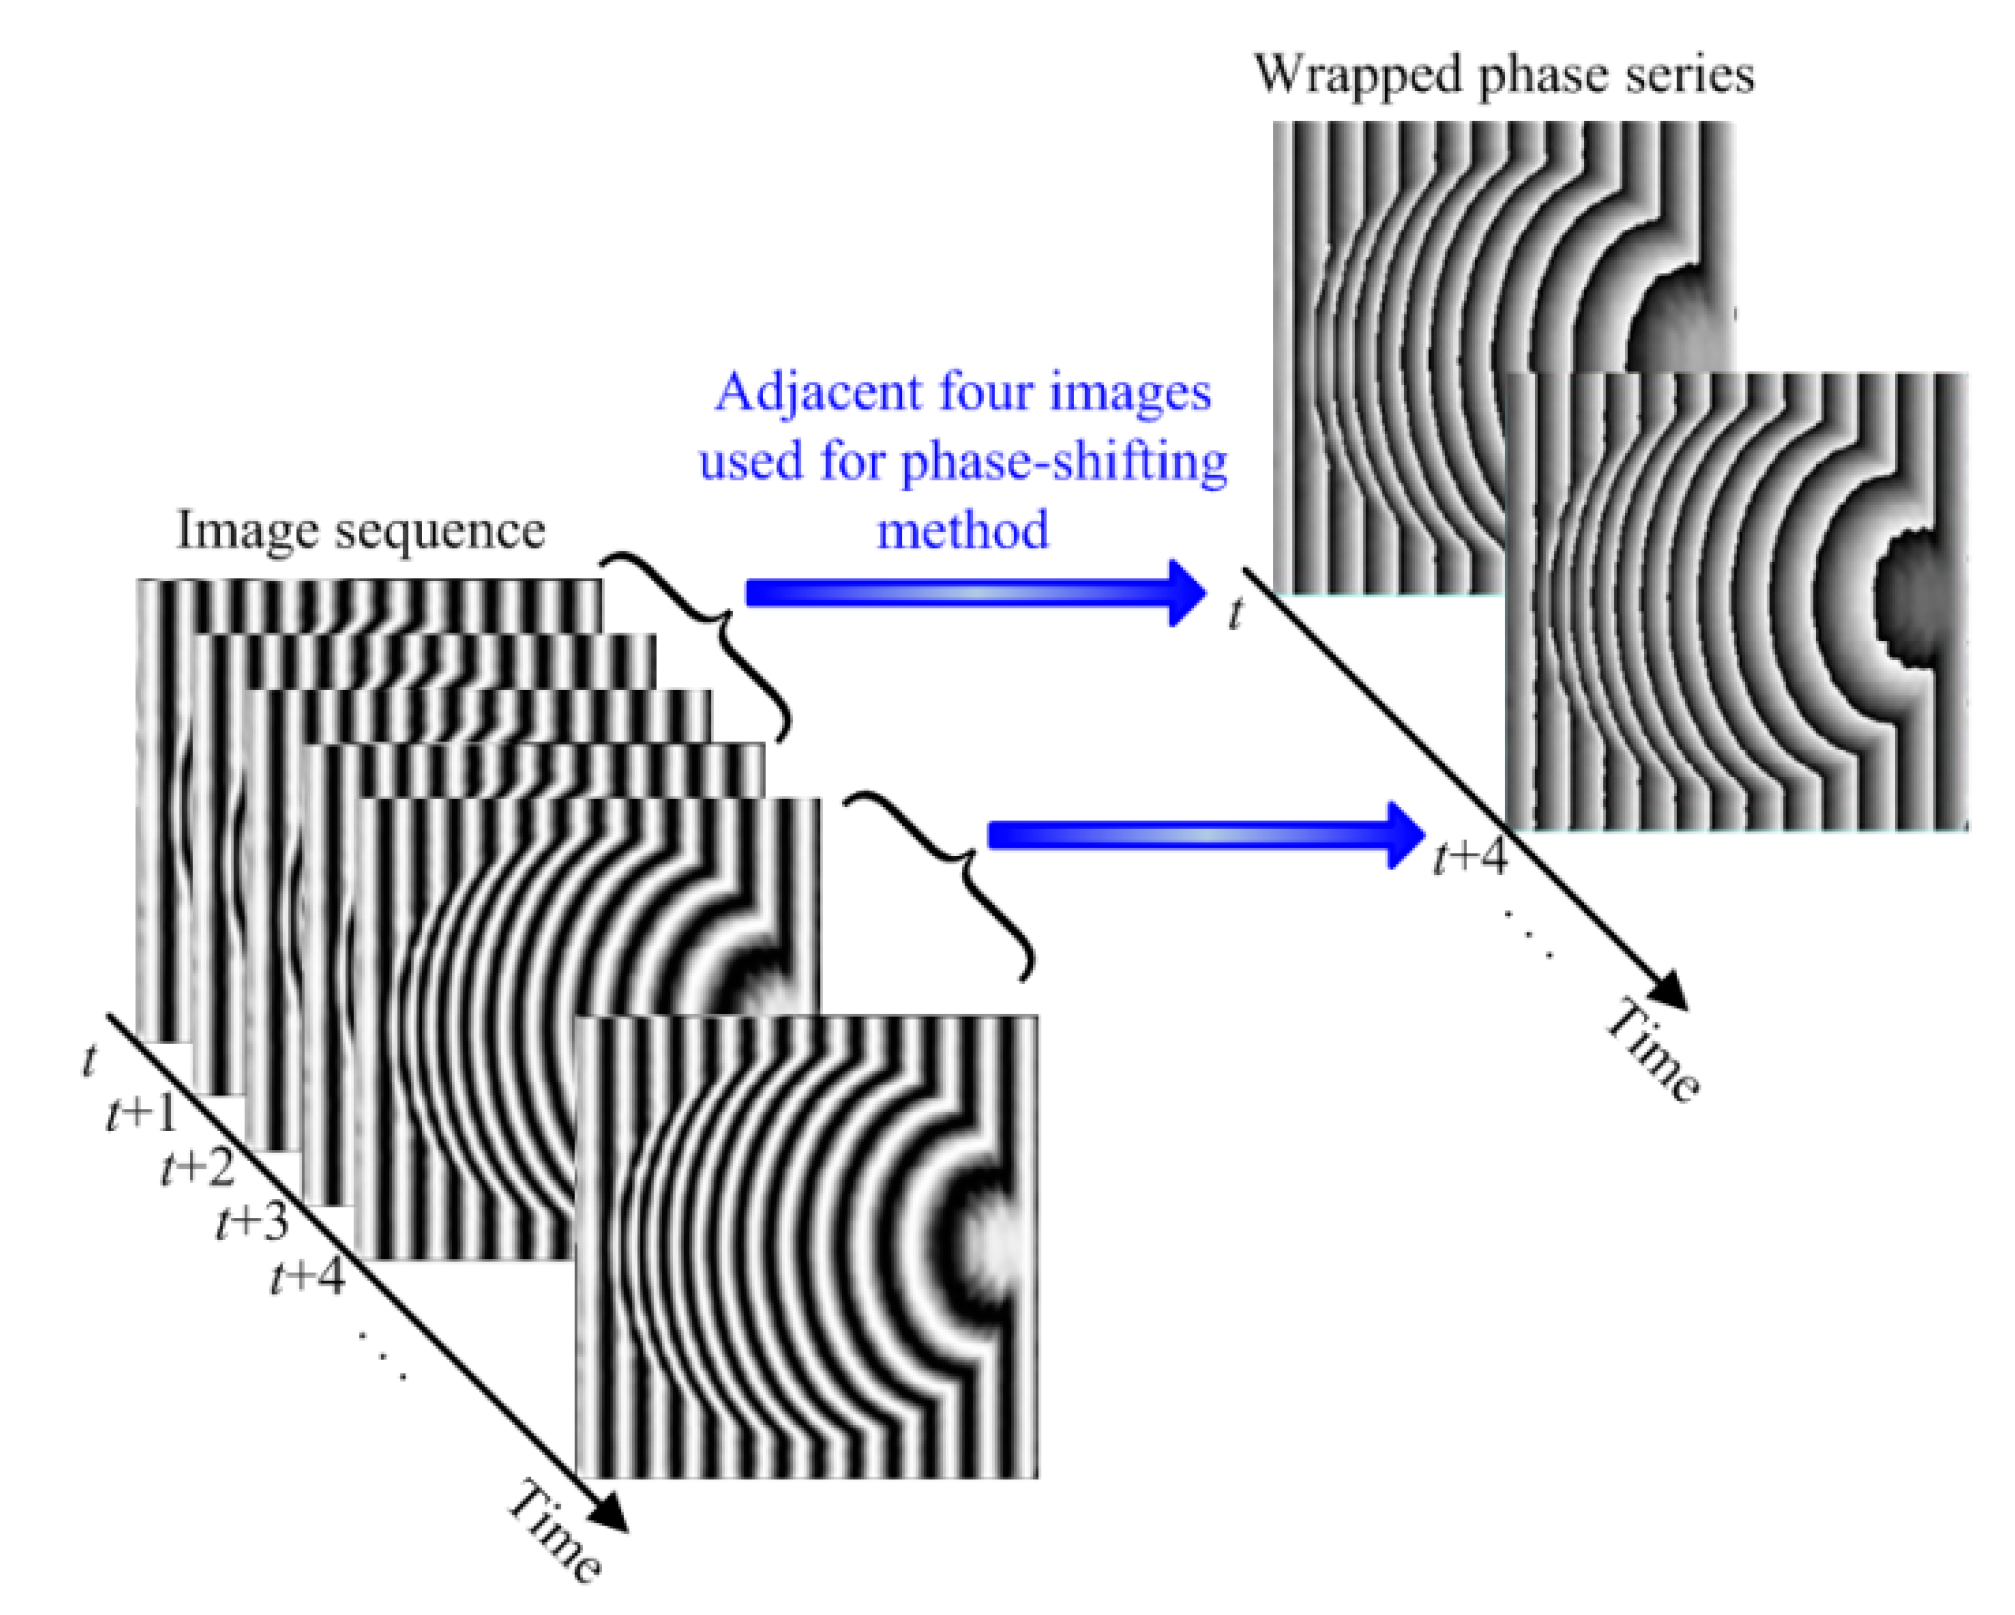
2.2. Phase-Shifting Method
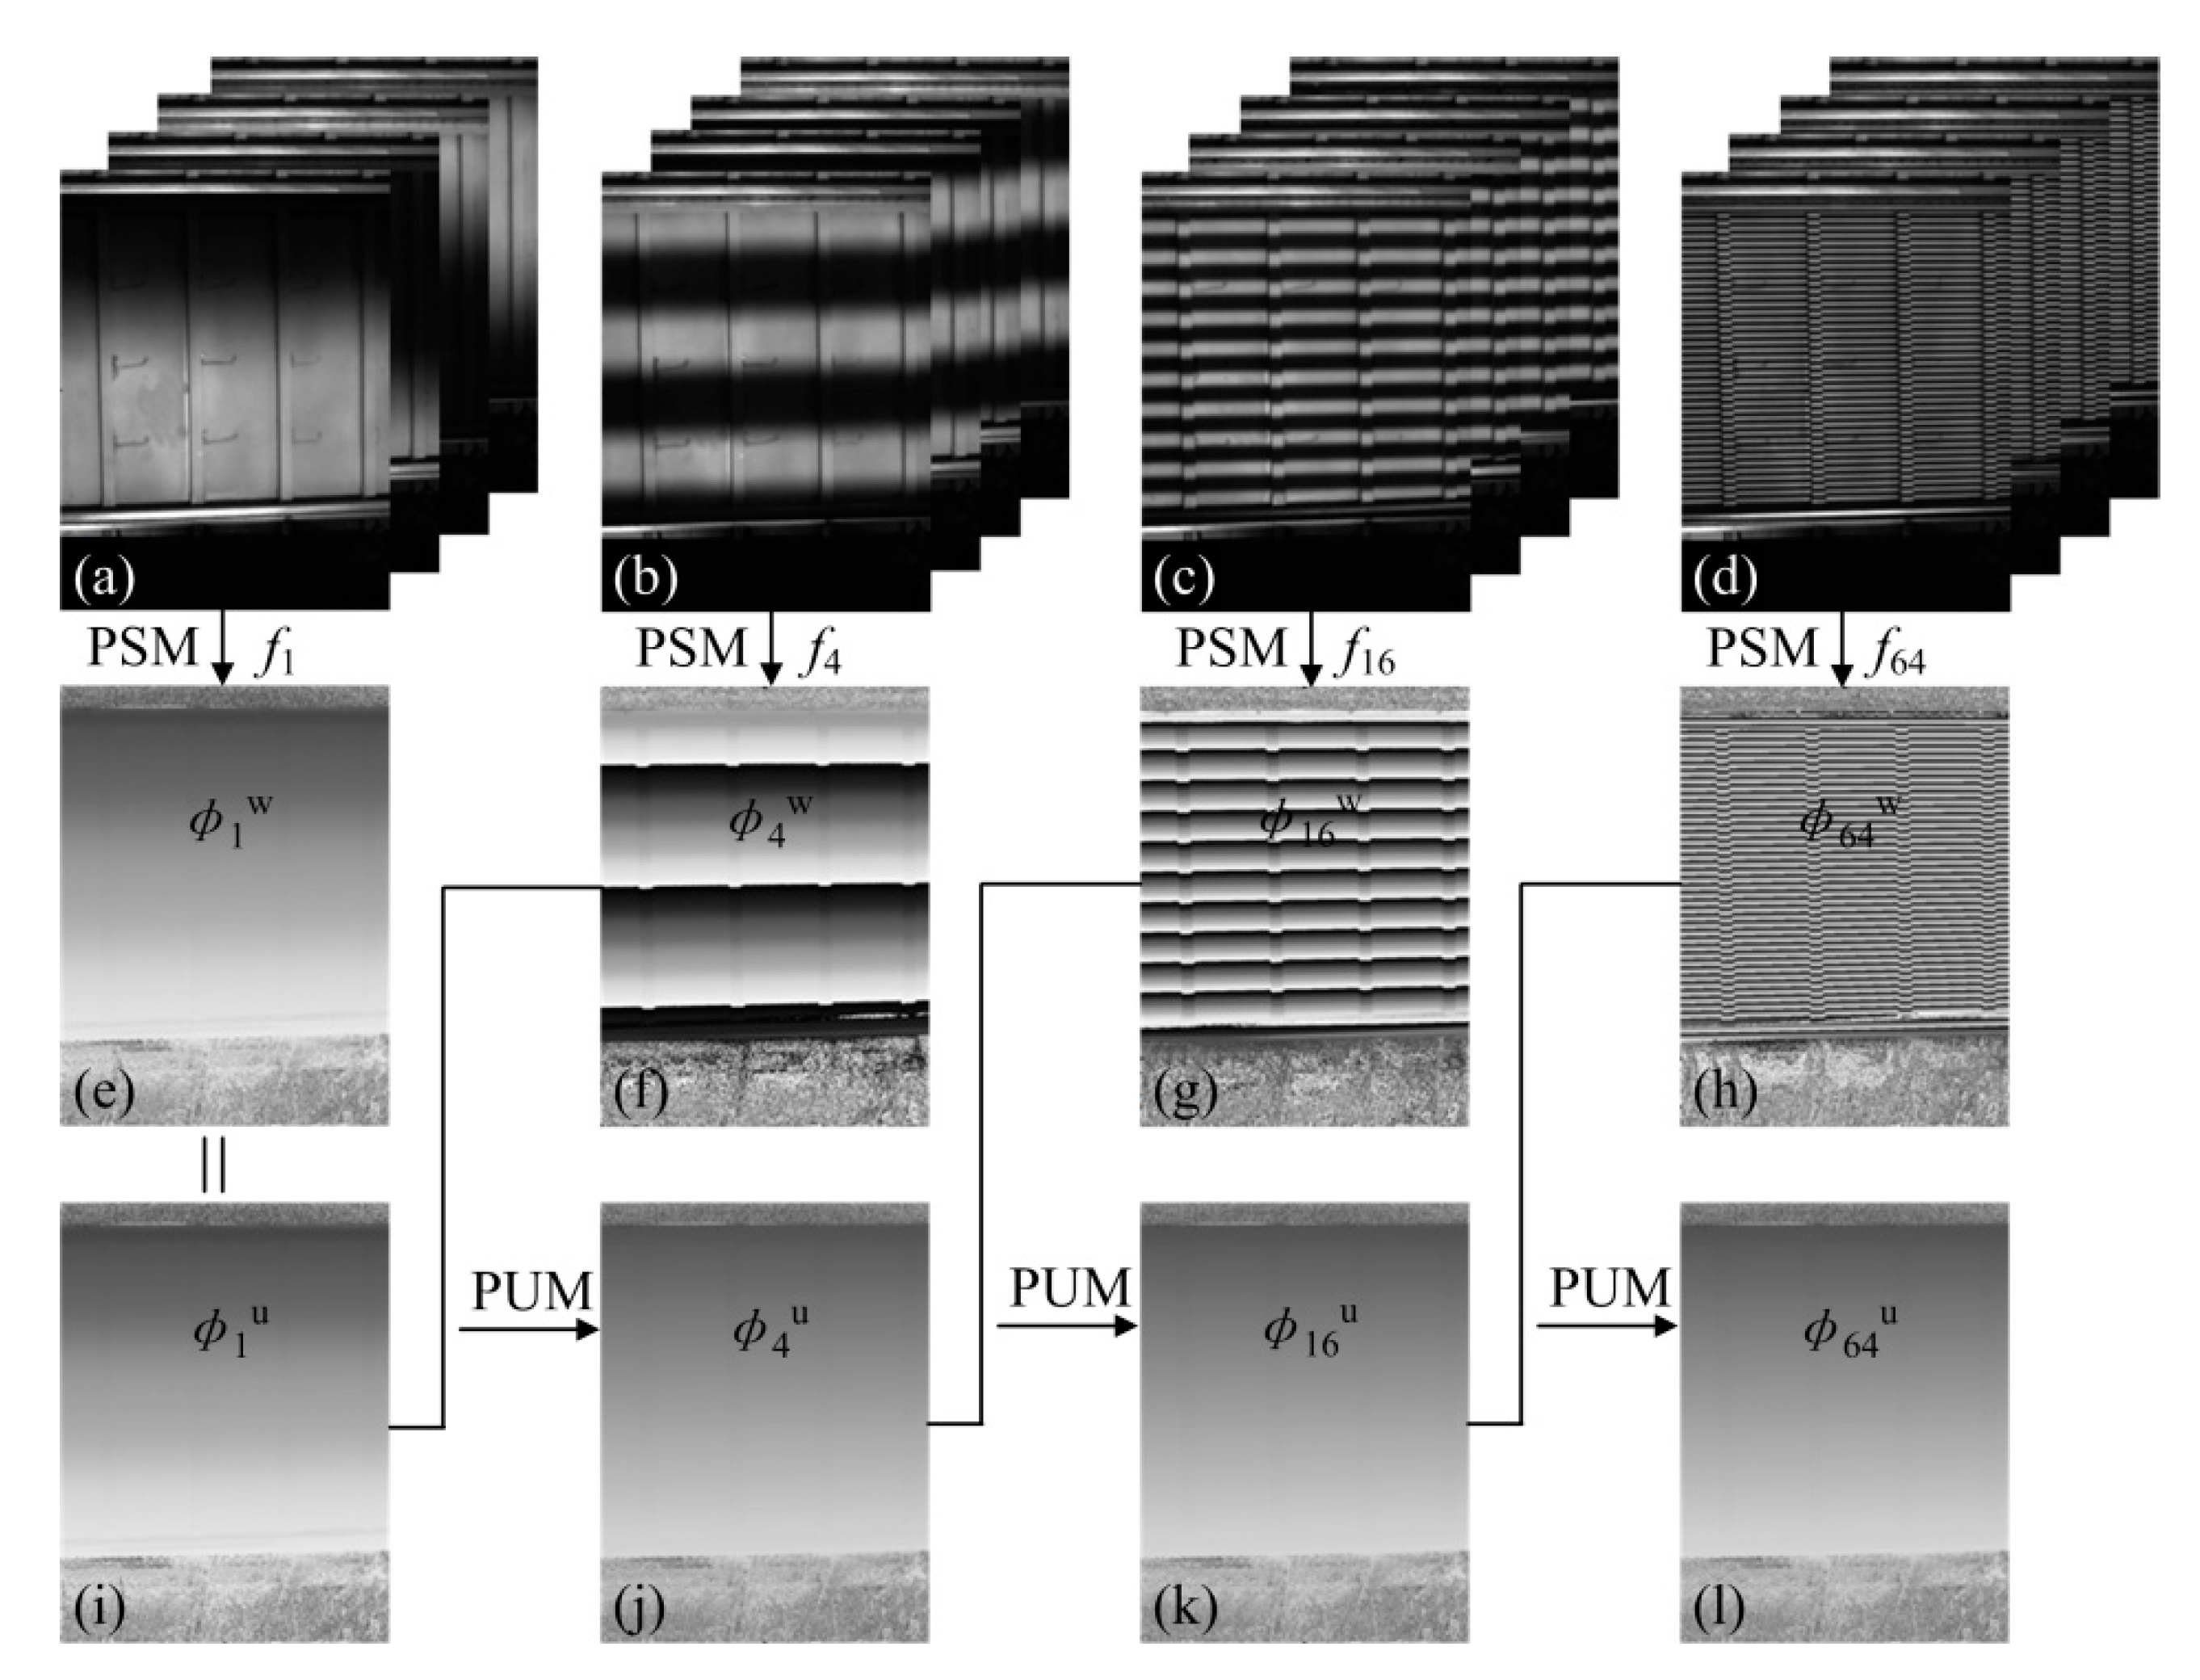
2.3. Phase-Unwrapping Method with Multi-Frequency Fringes
3. Experiment
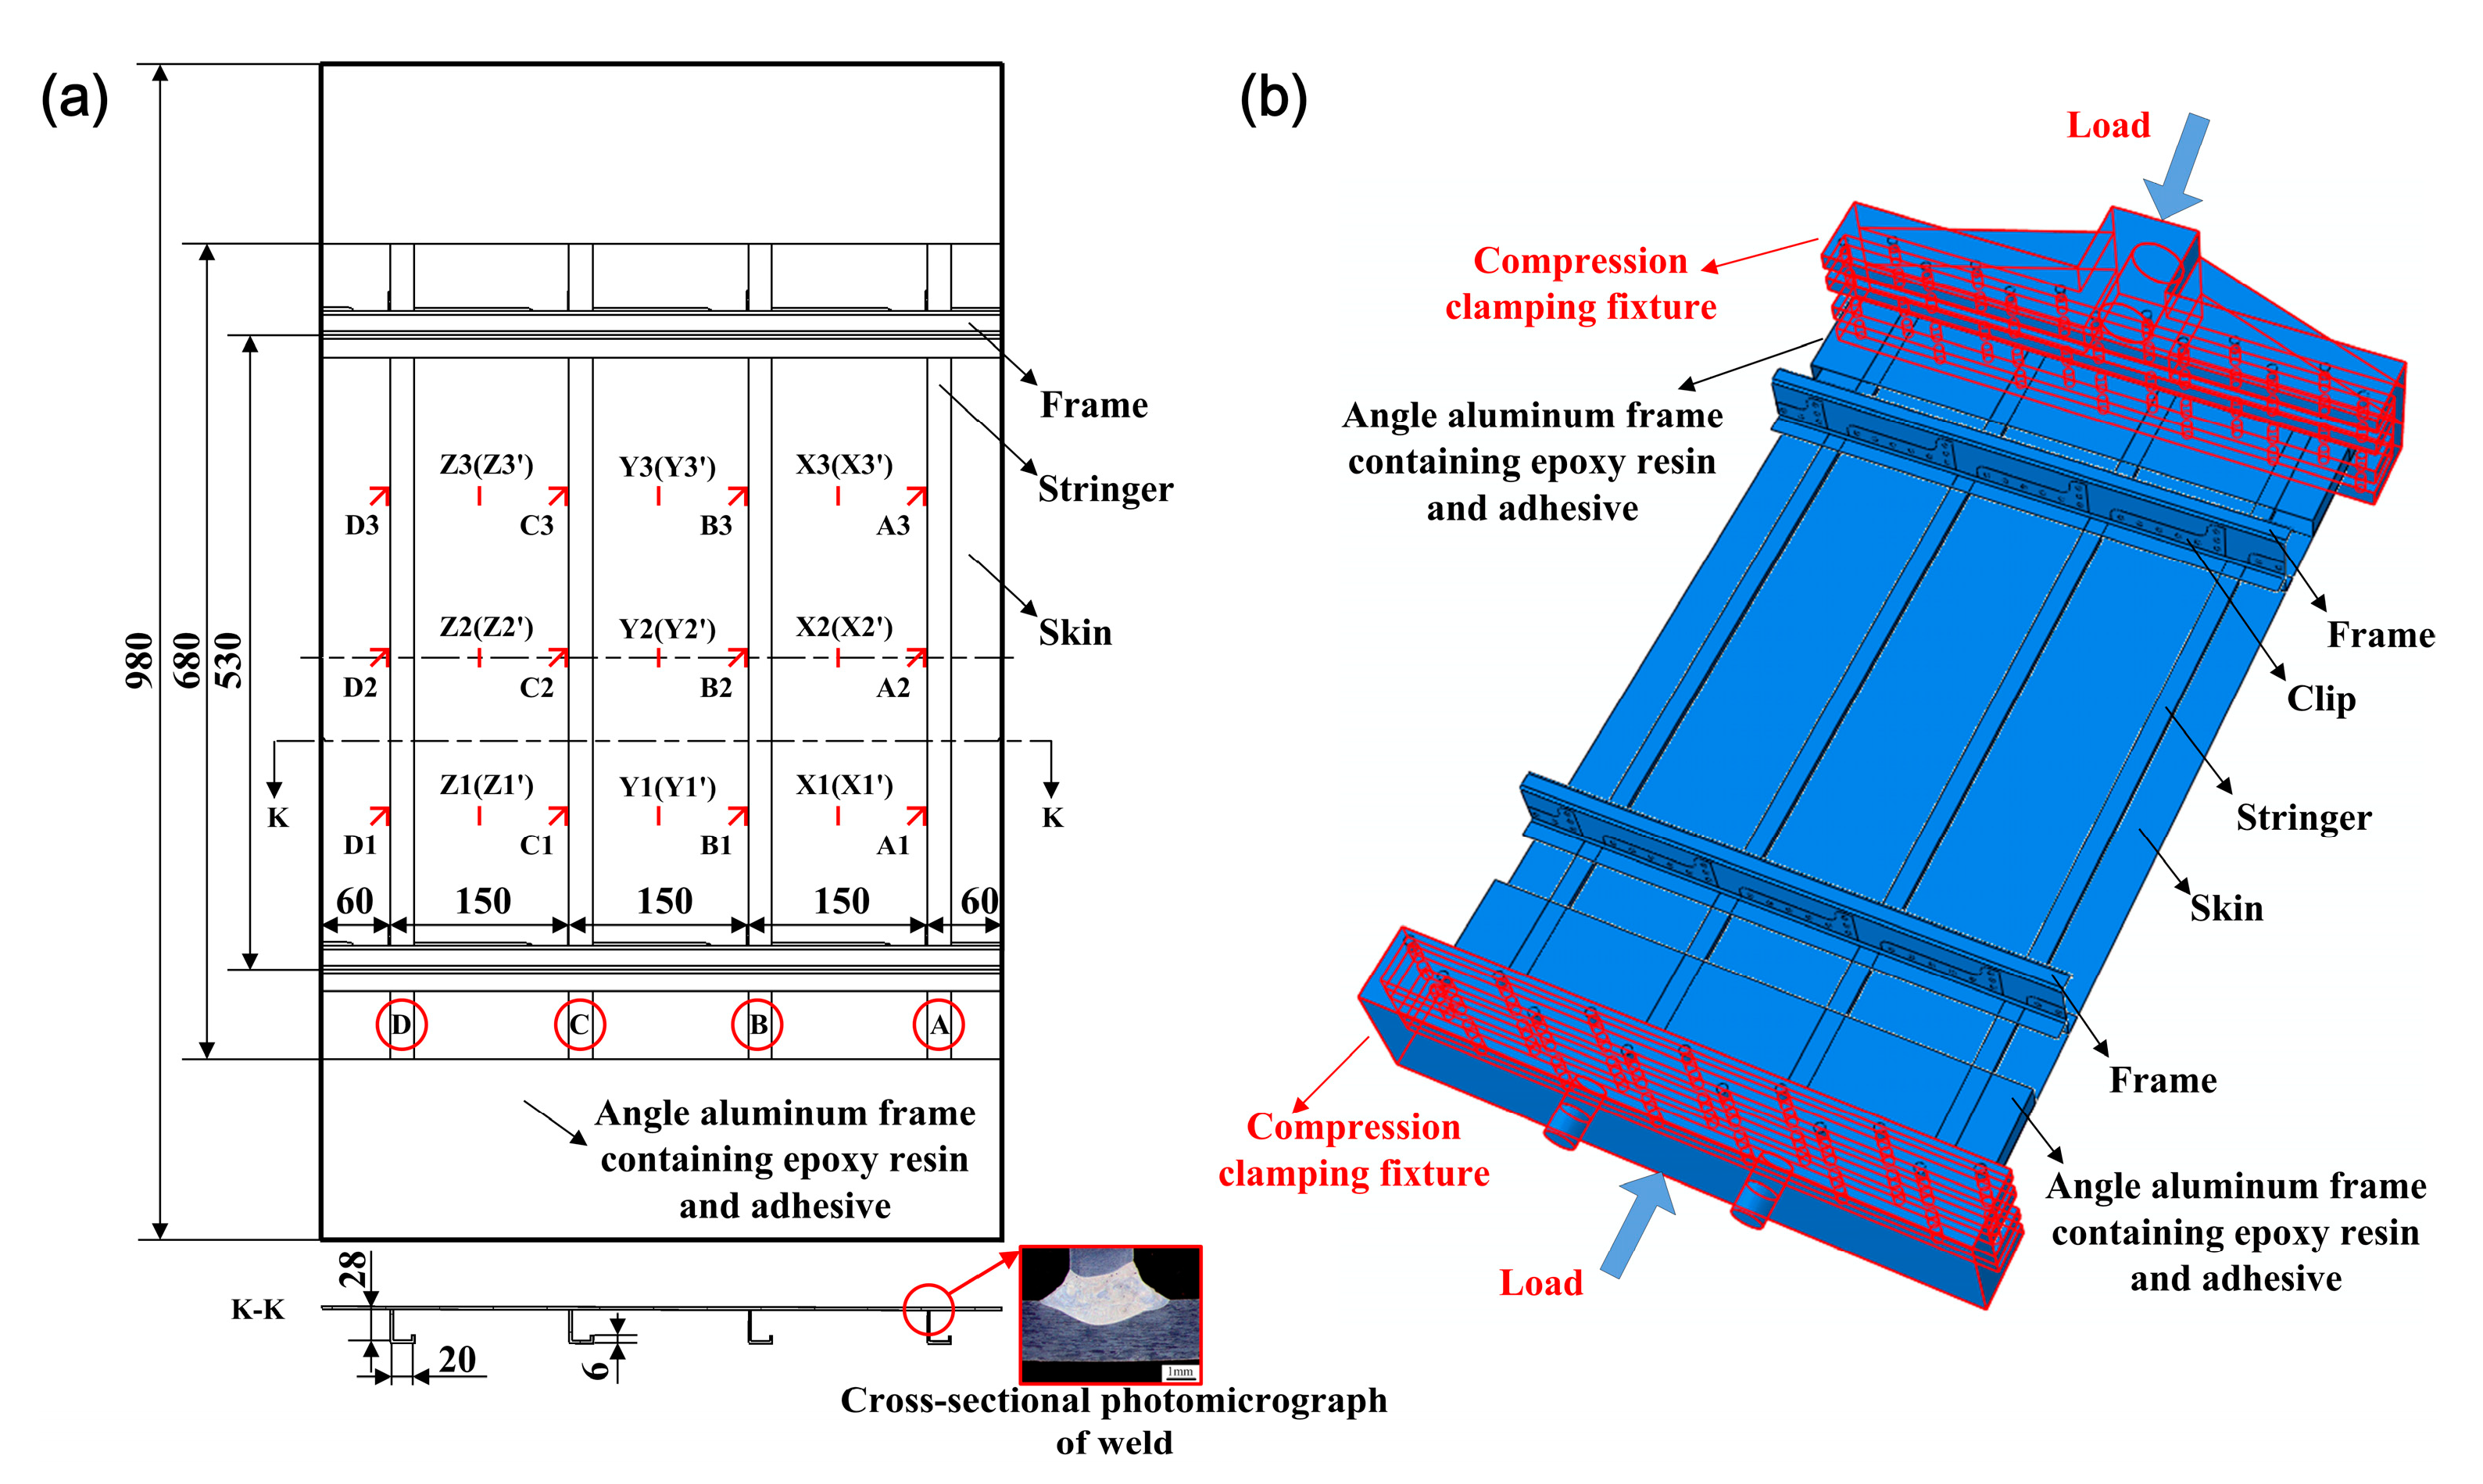
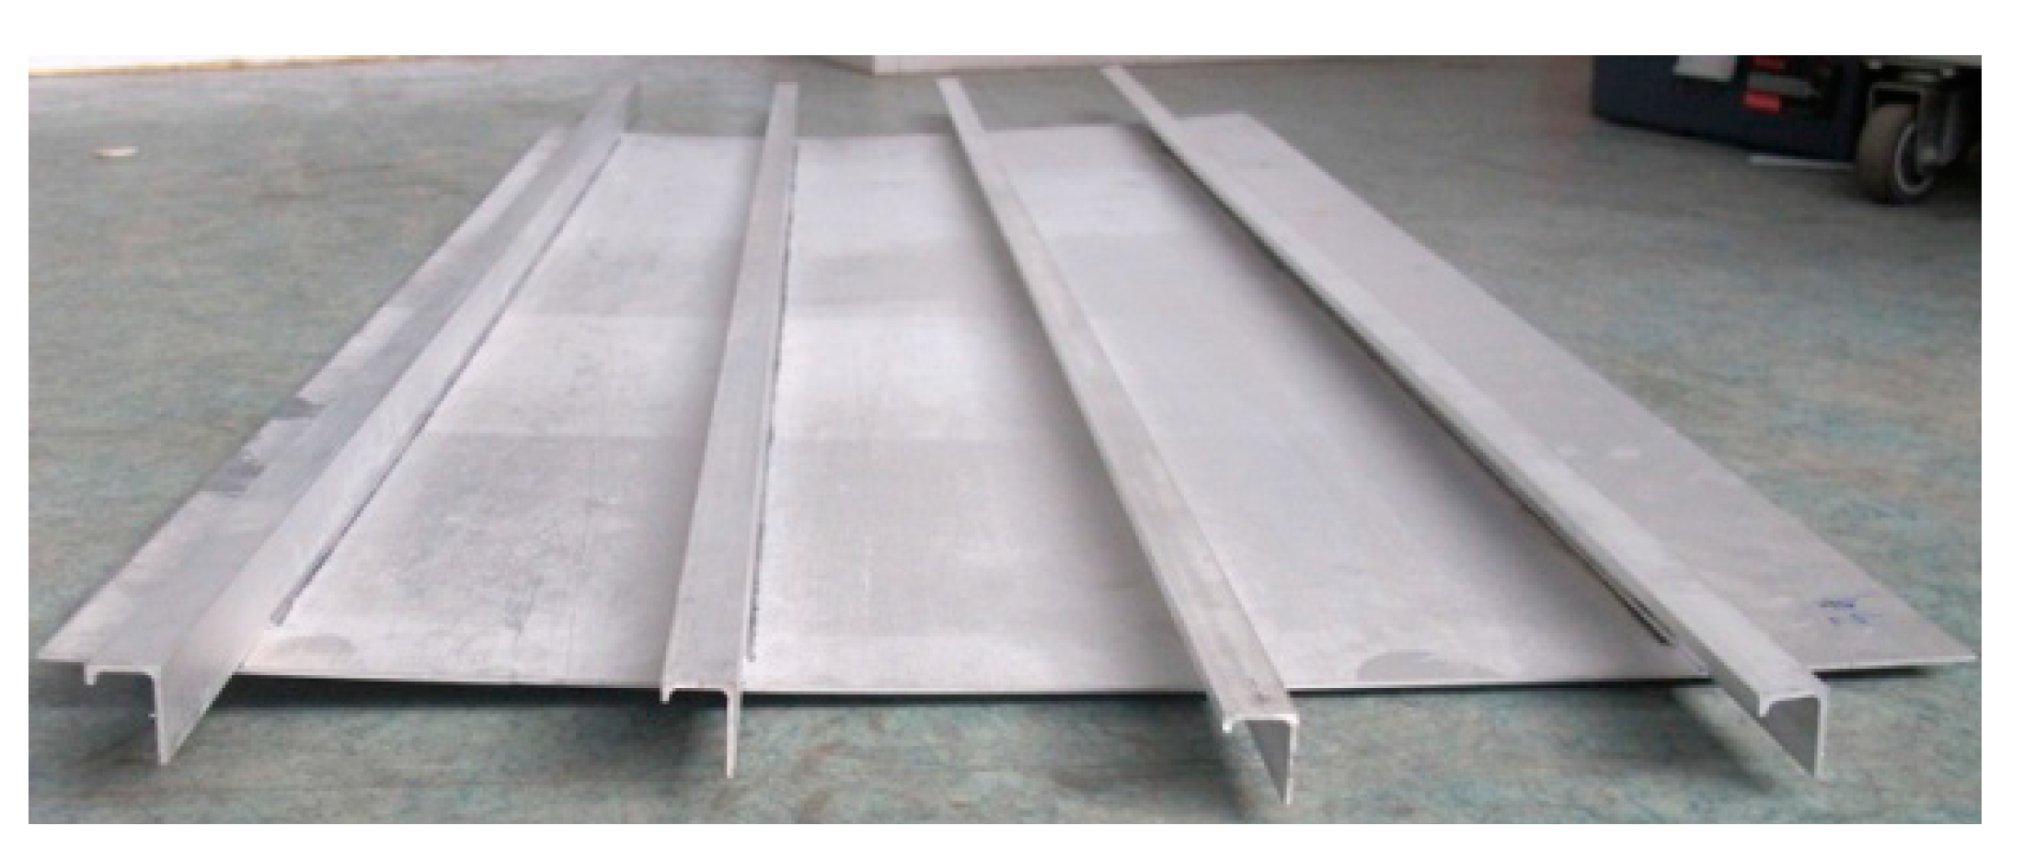
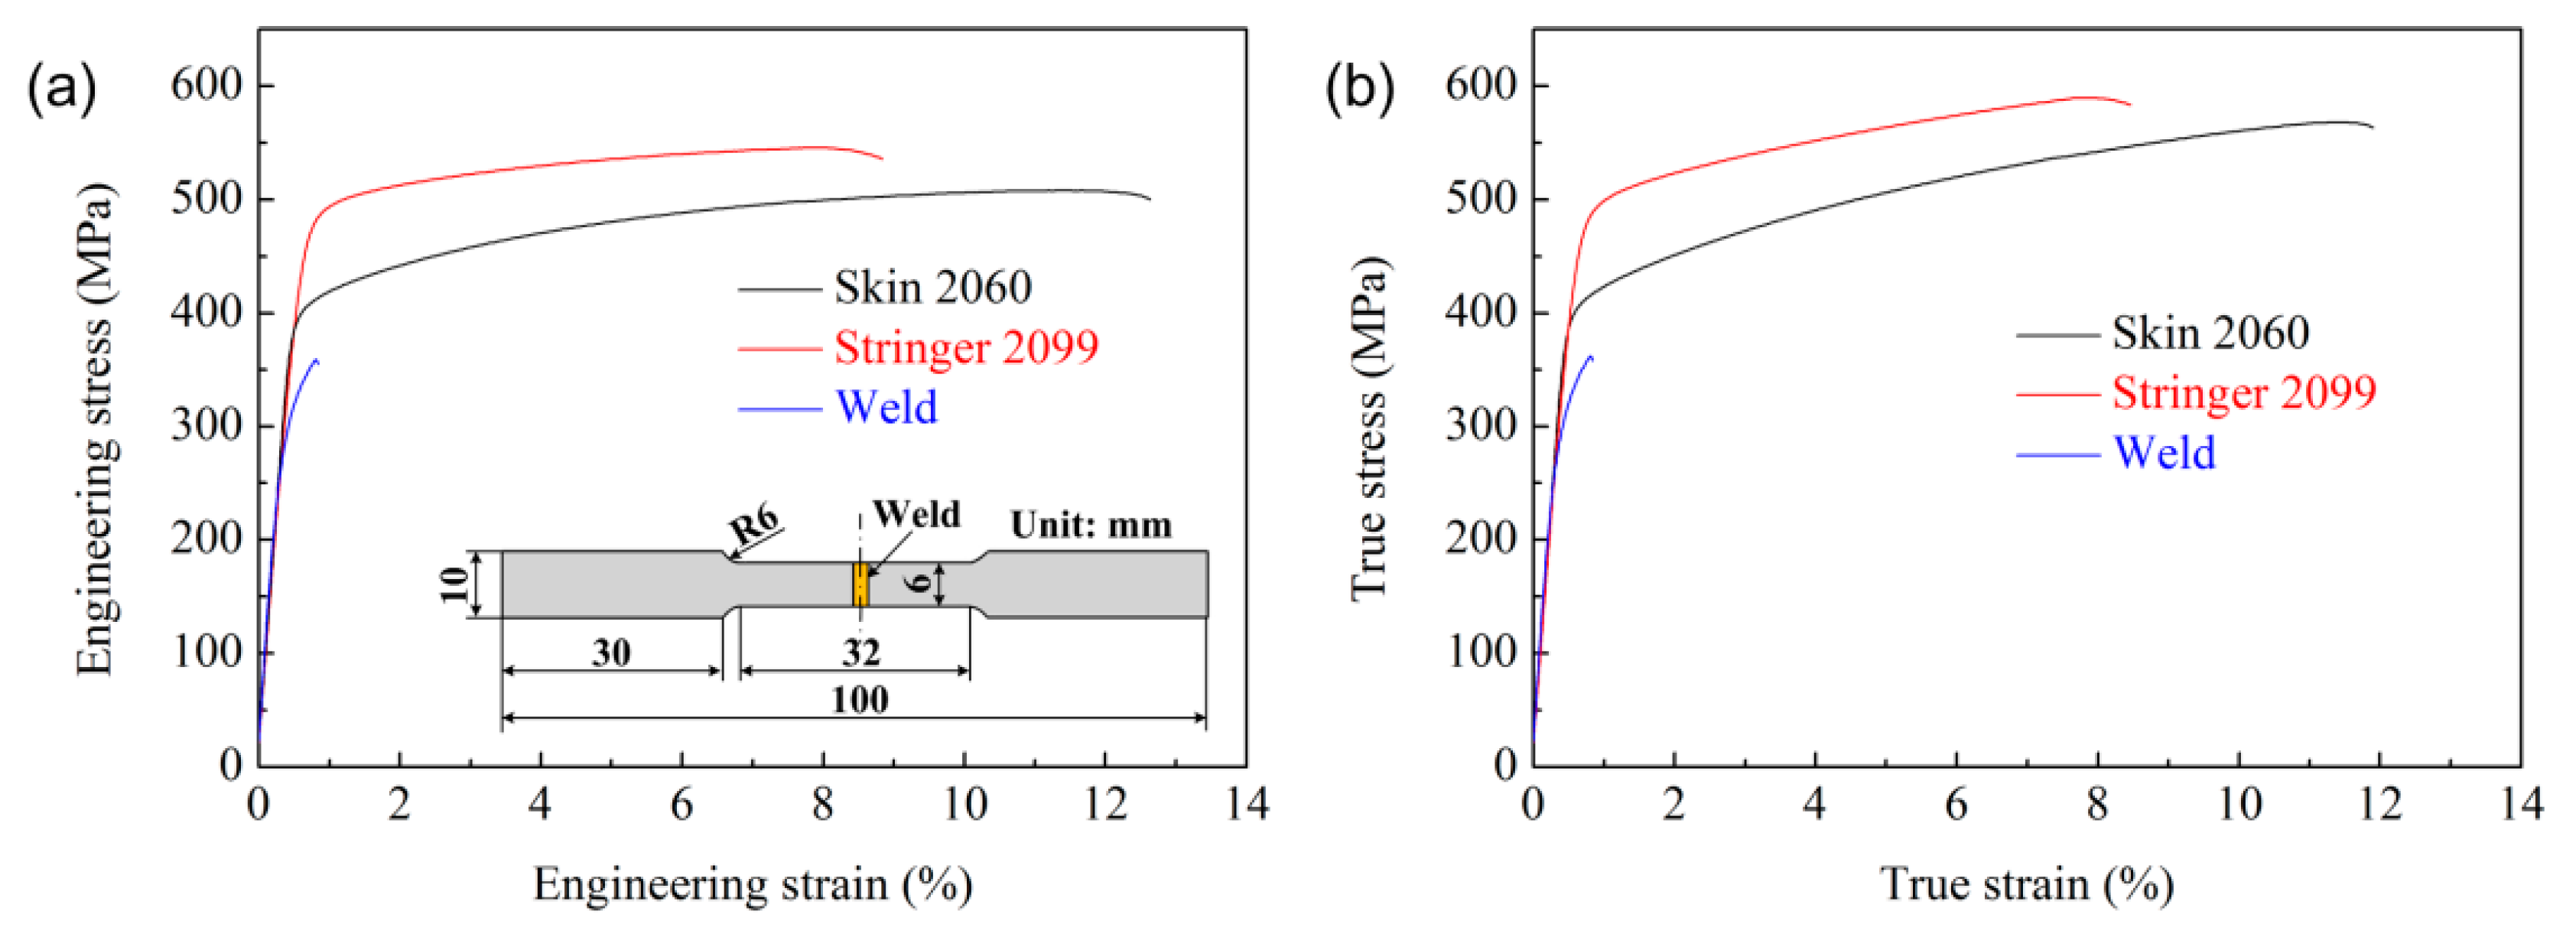
3.1. Test Specimen
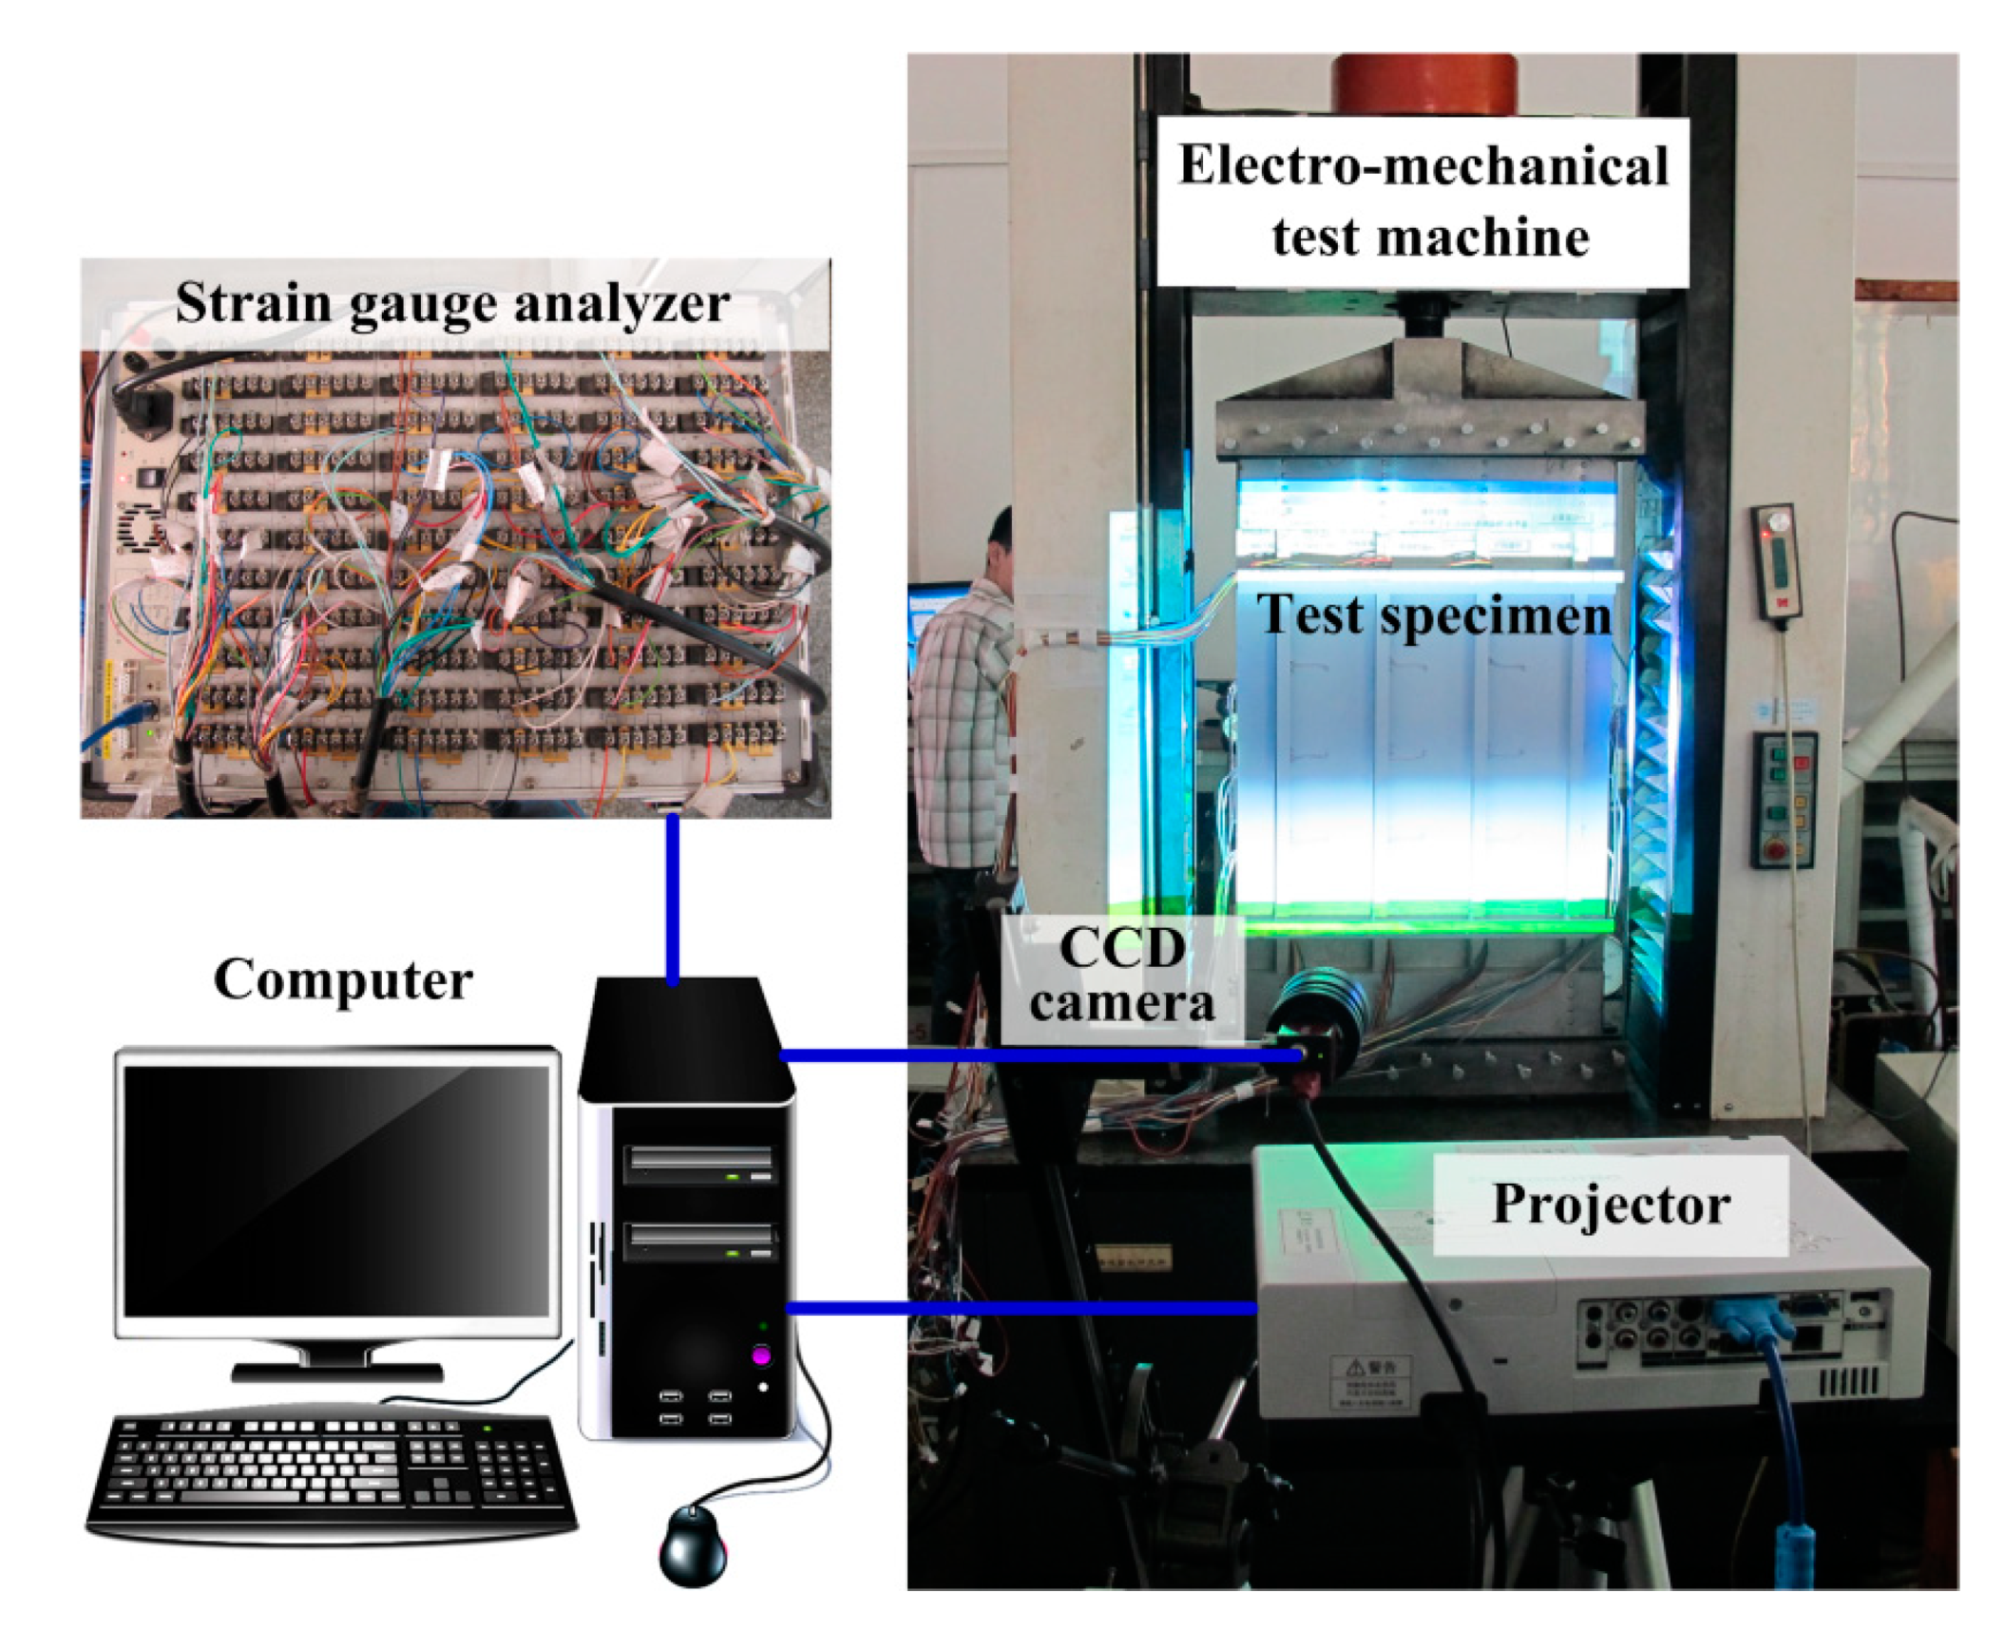
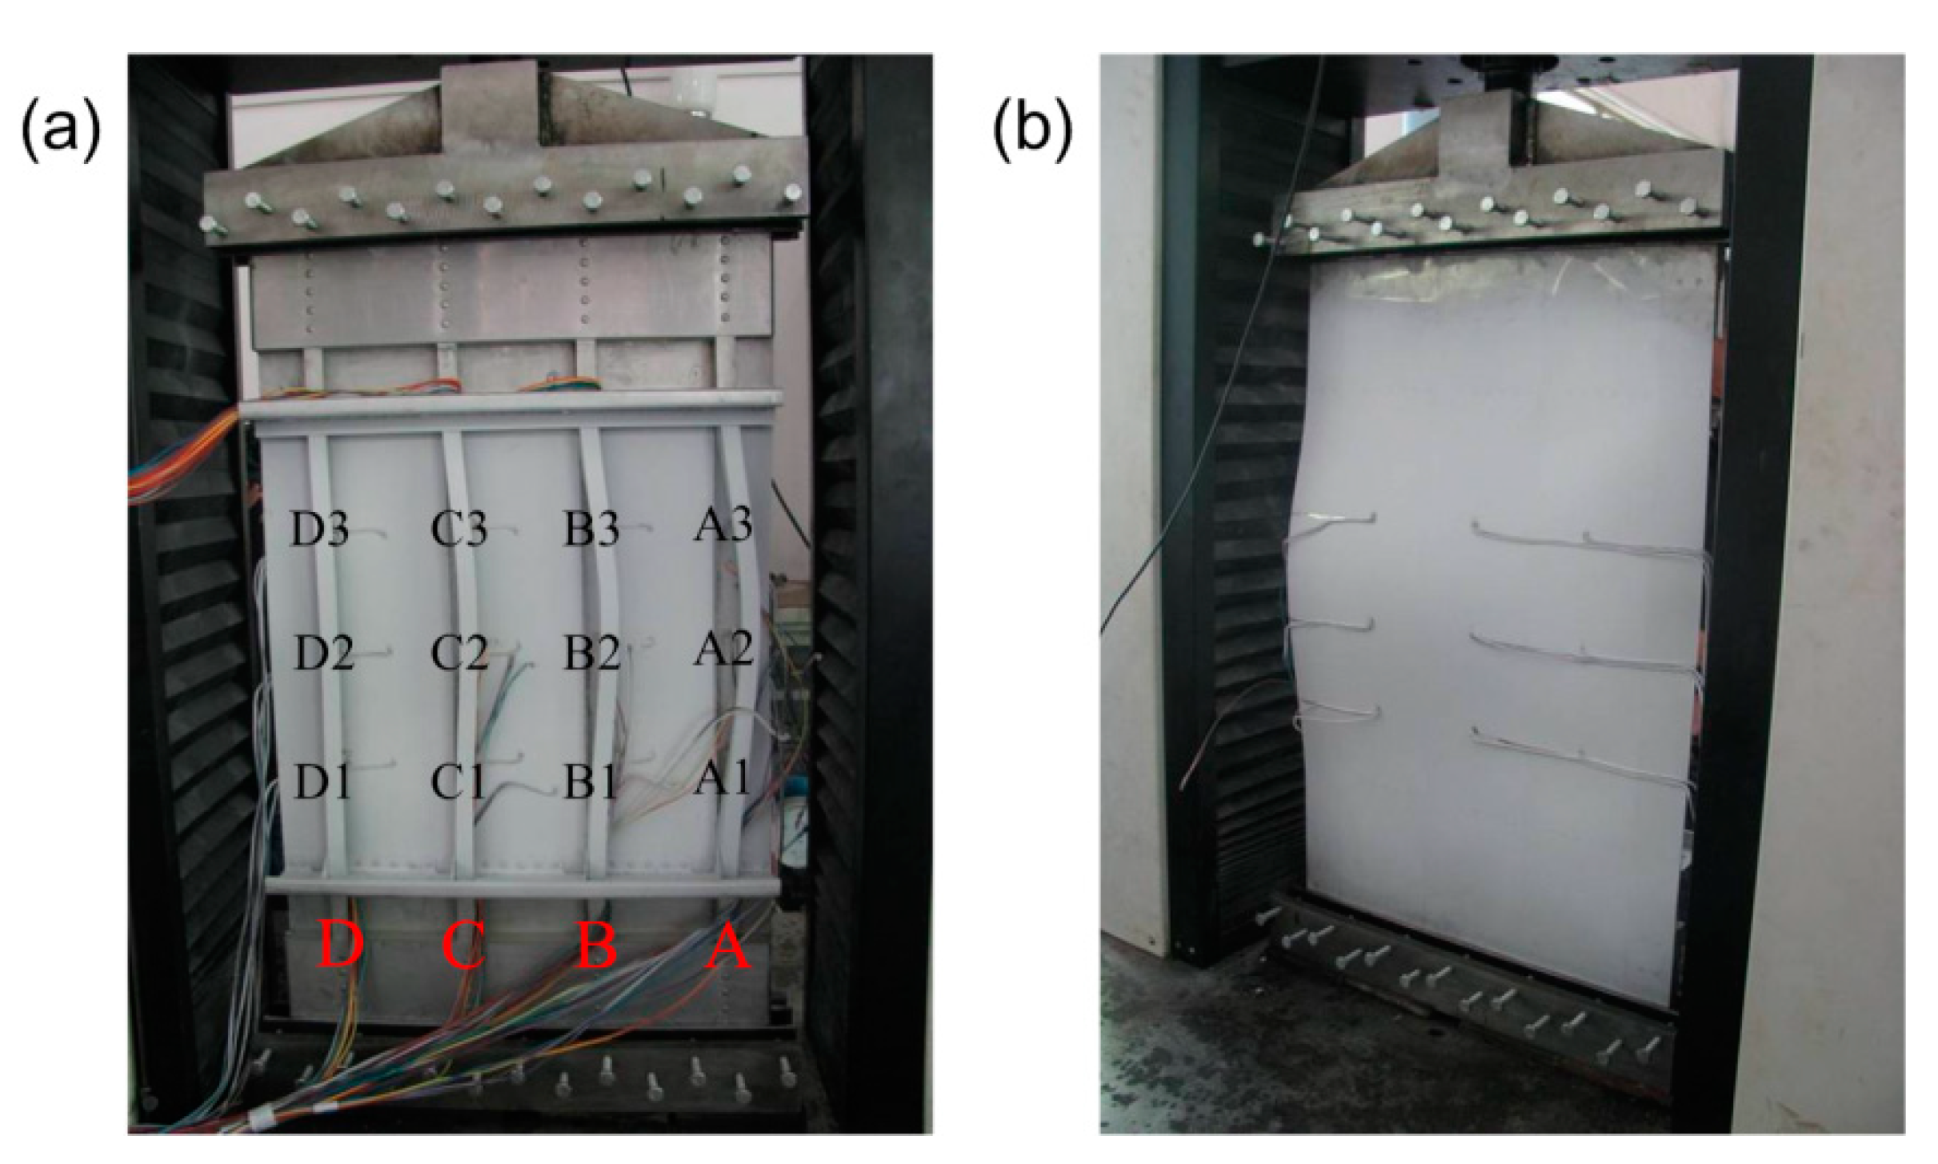
3.2. Test Equipment
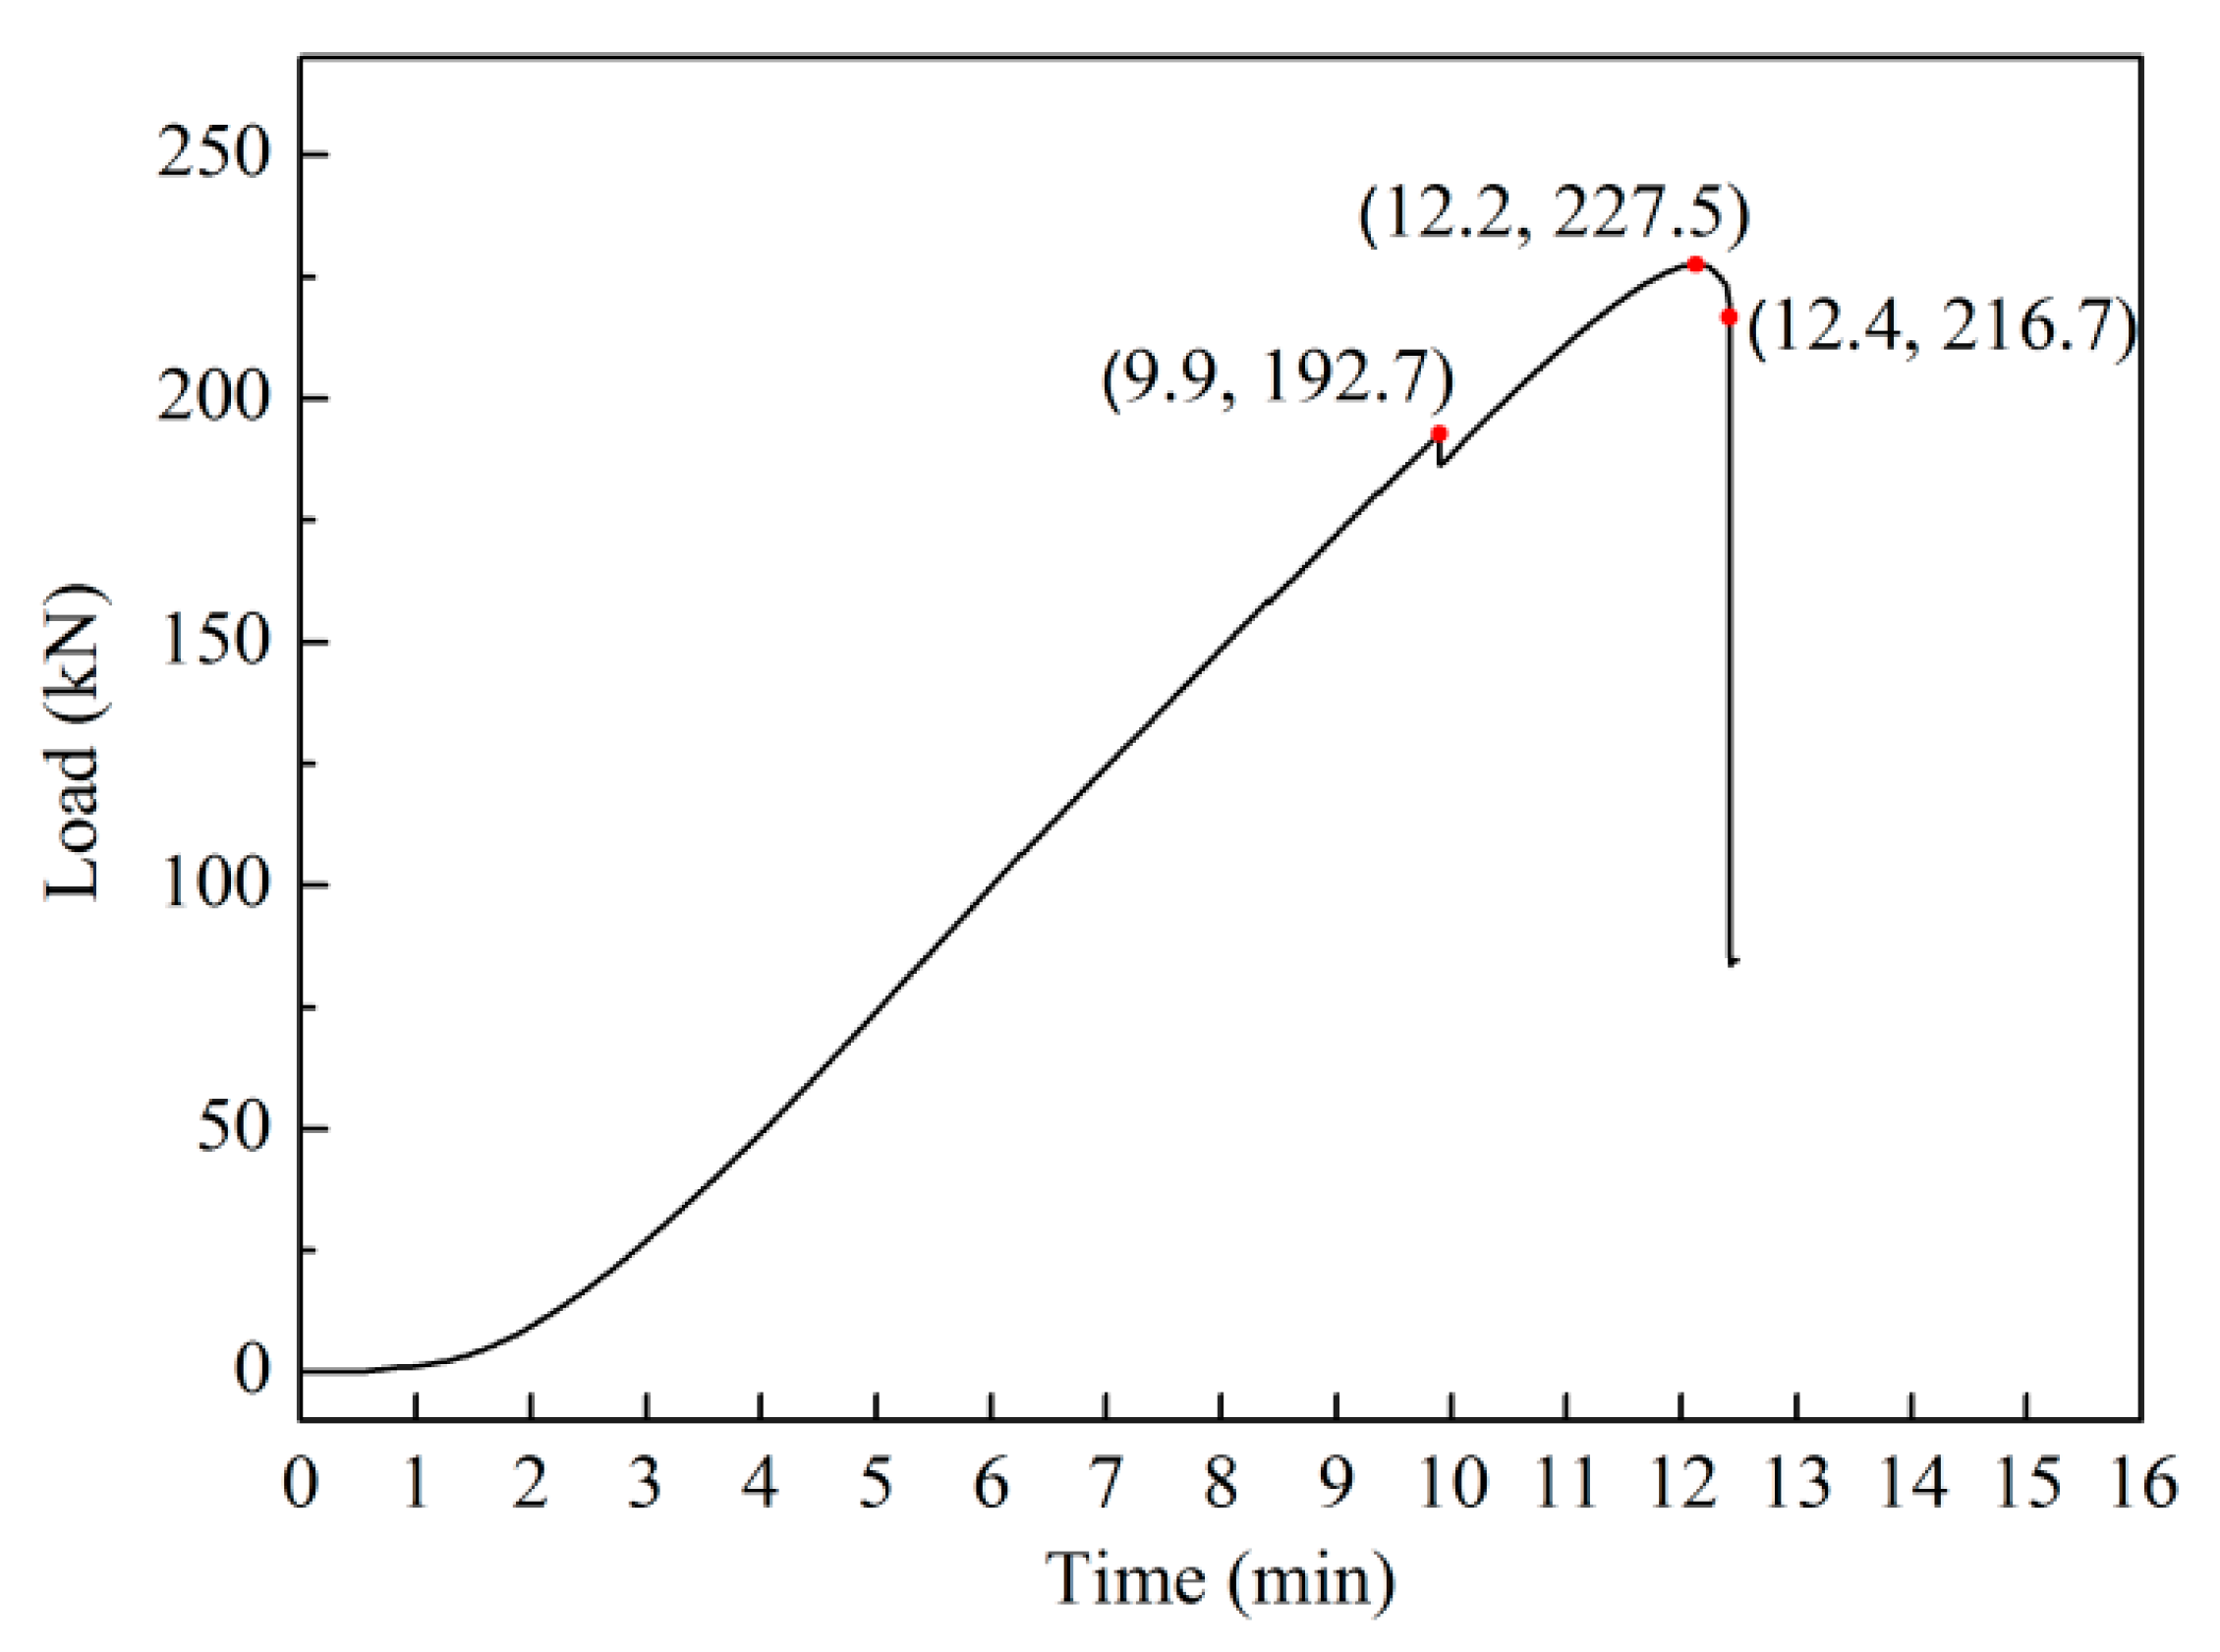
3.3. Test Procedure
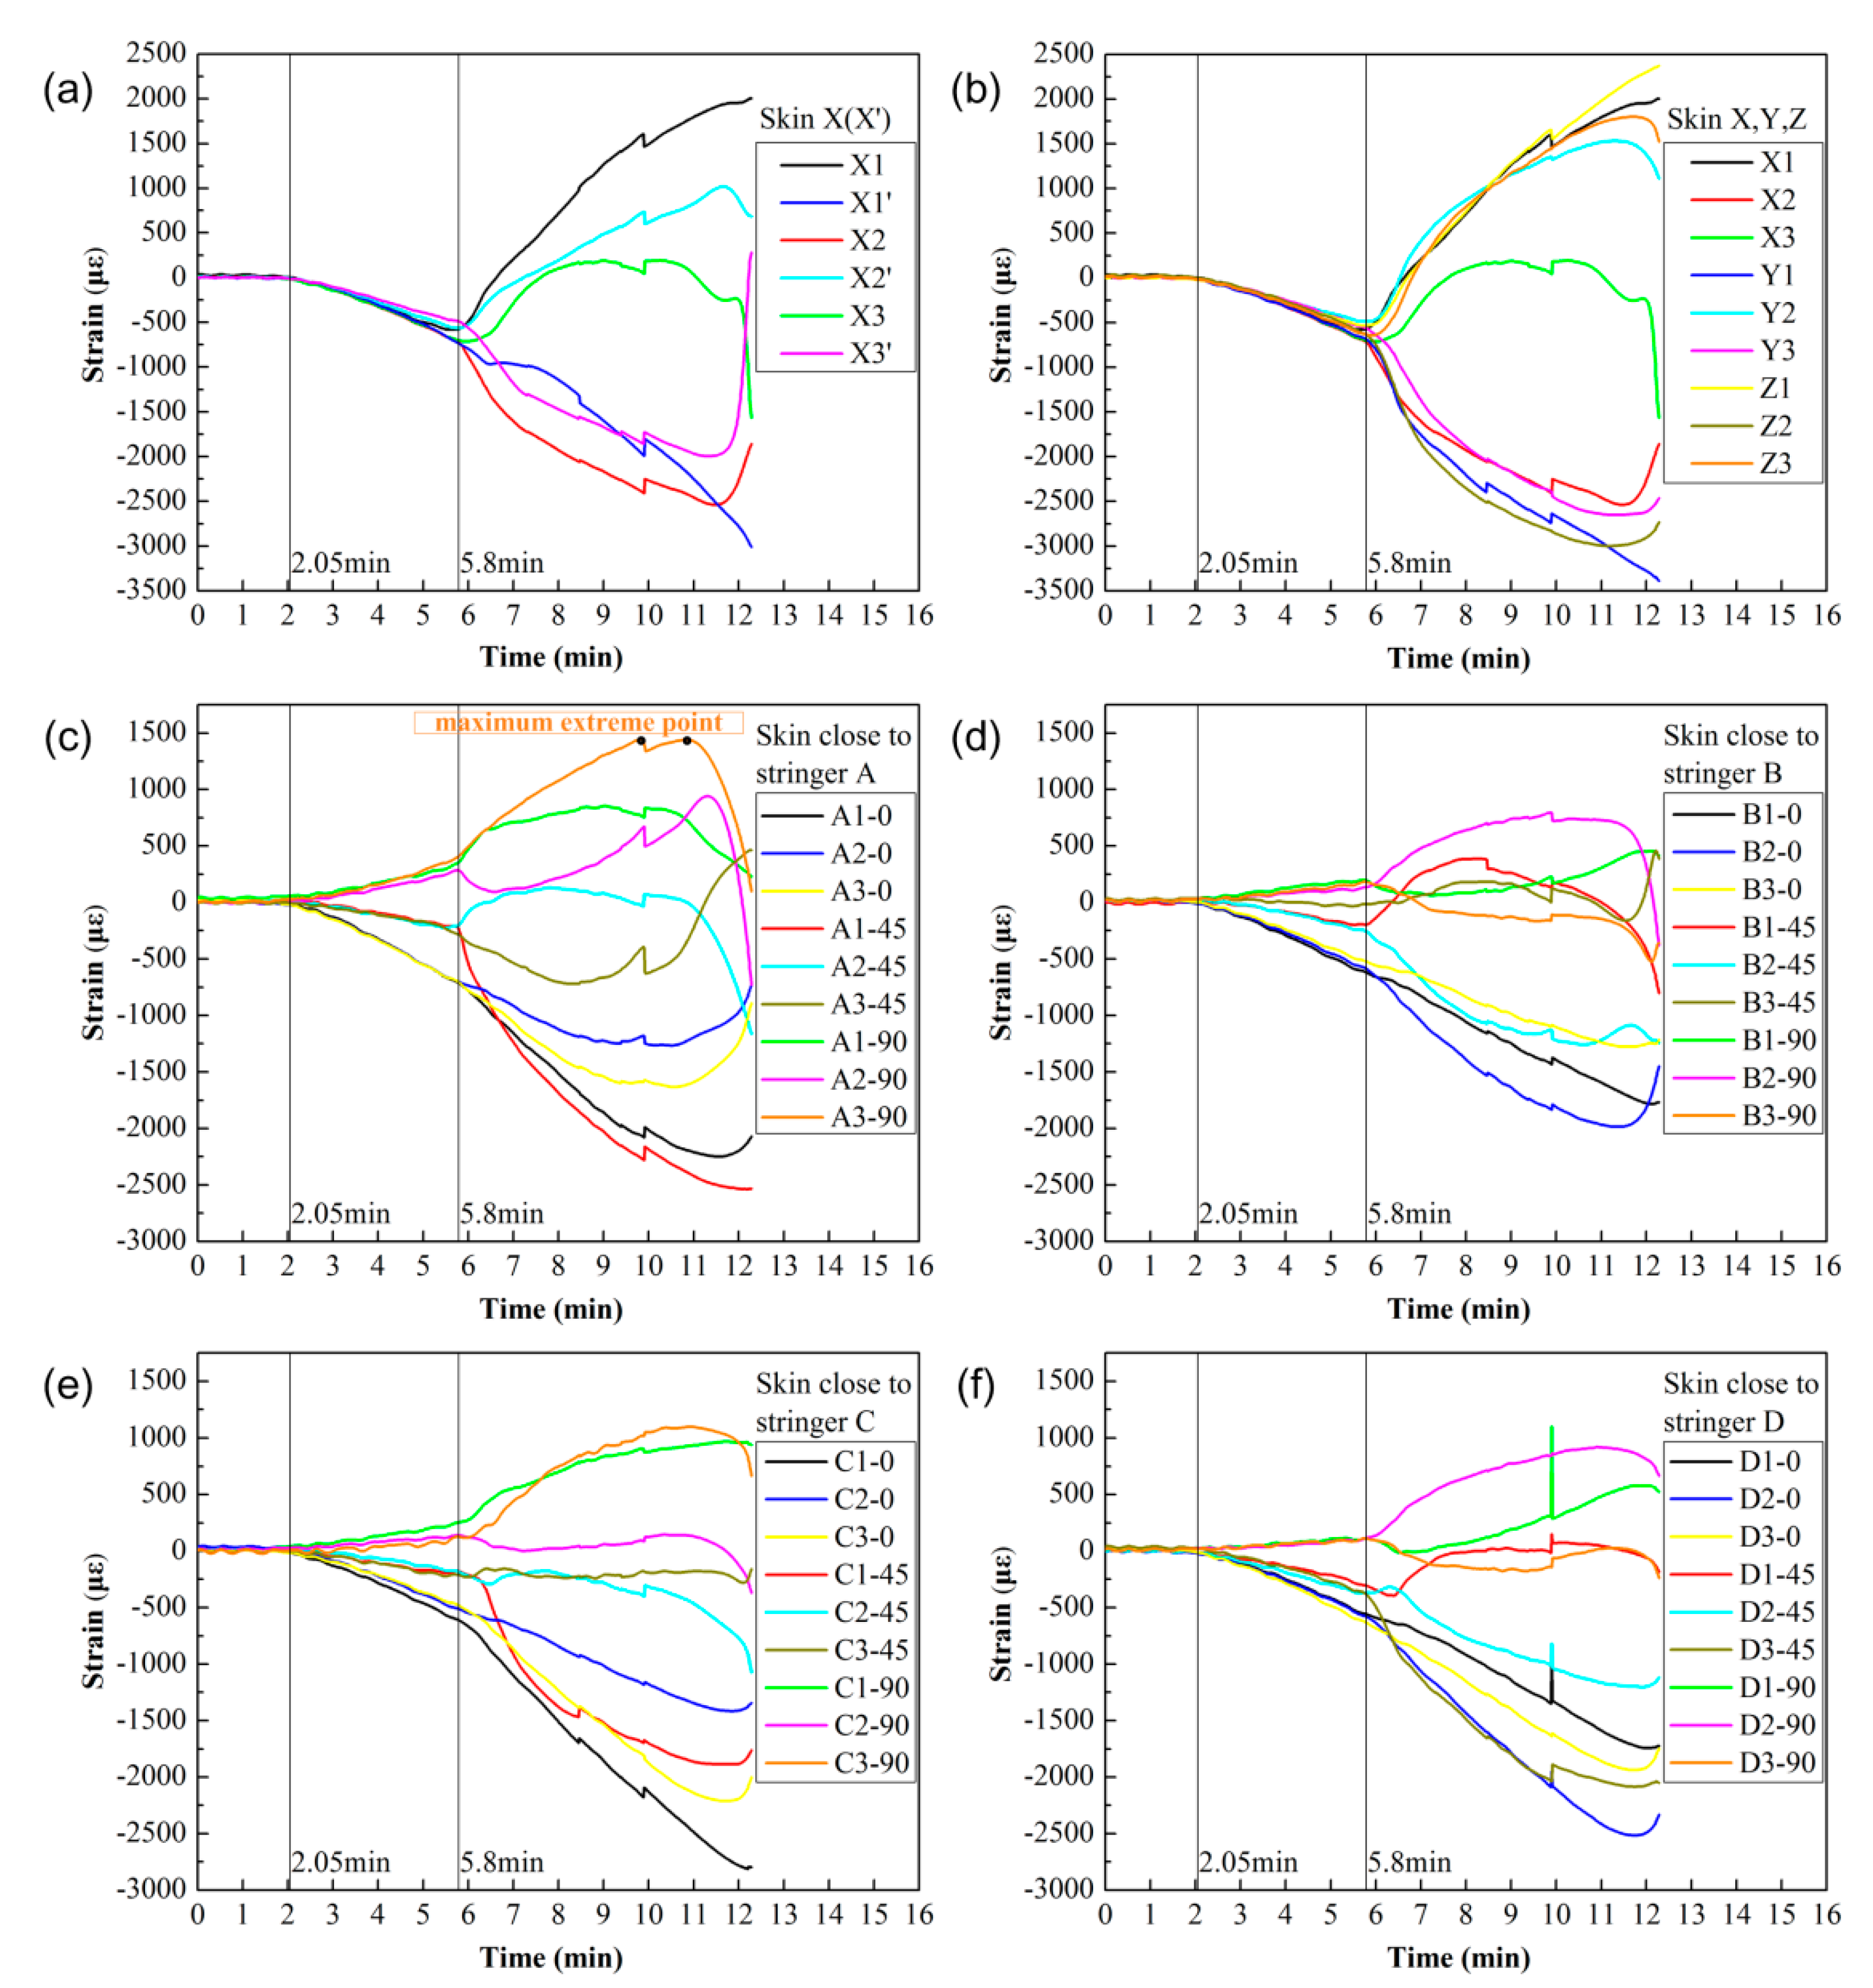
3.4. Strain Measurement
4. Results of Optical Measurement and Analysis
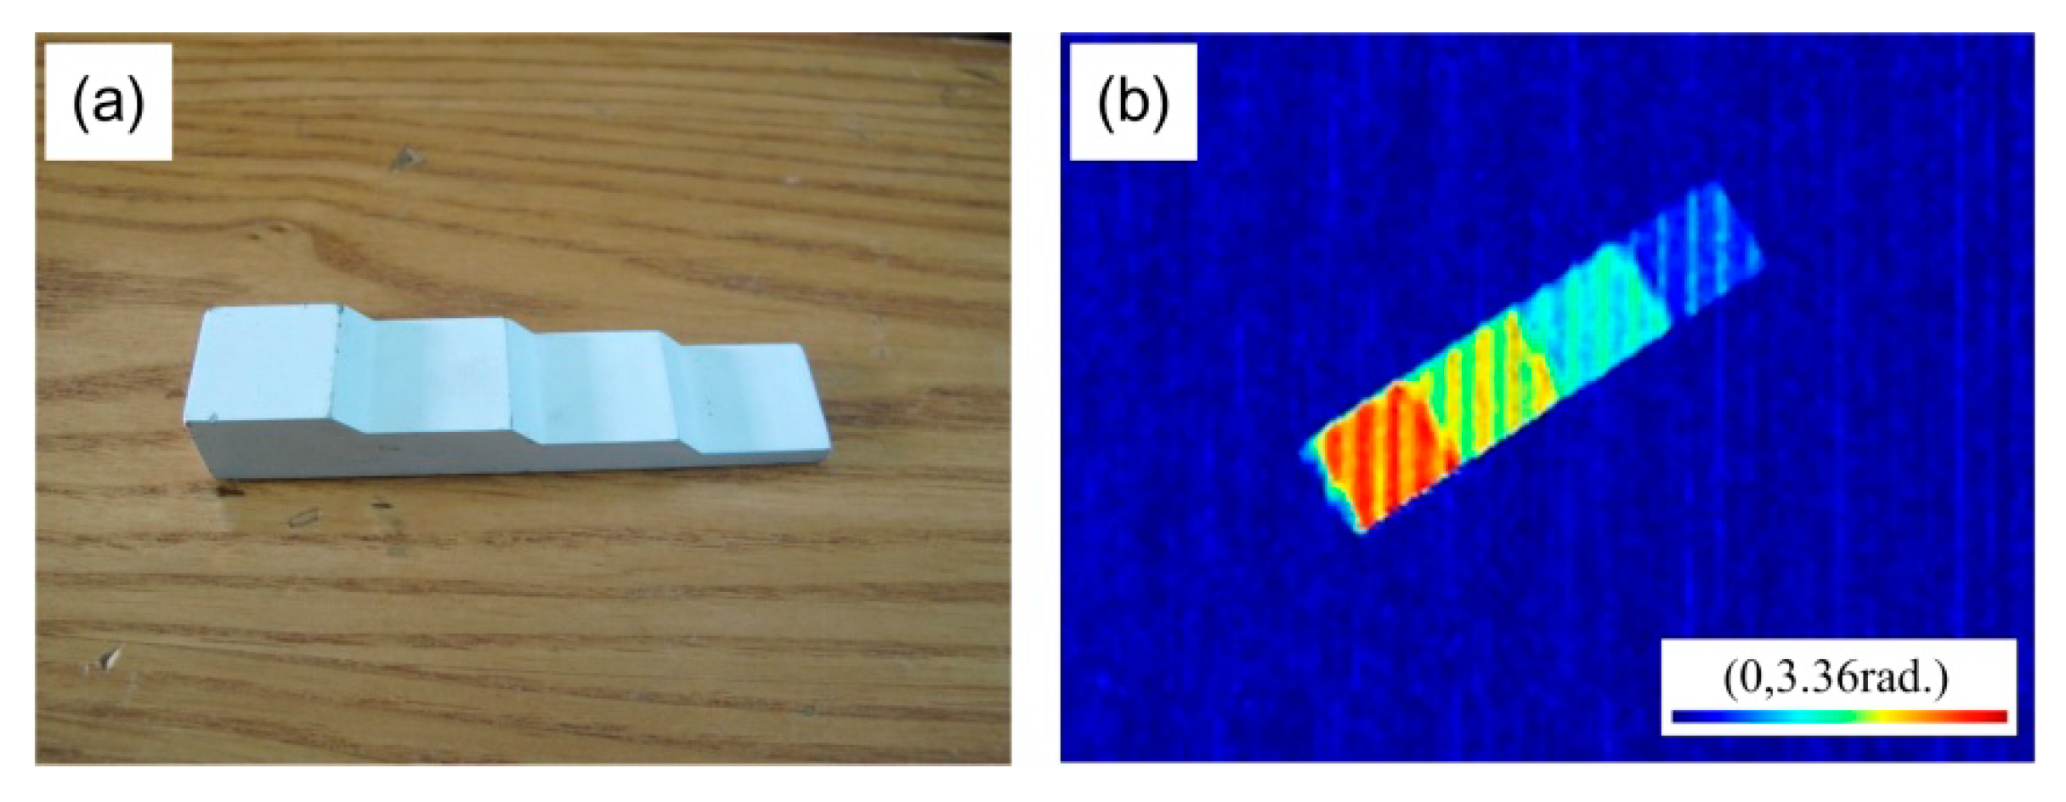
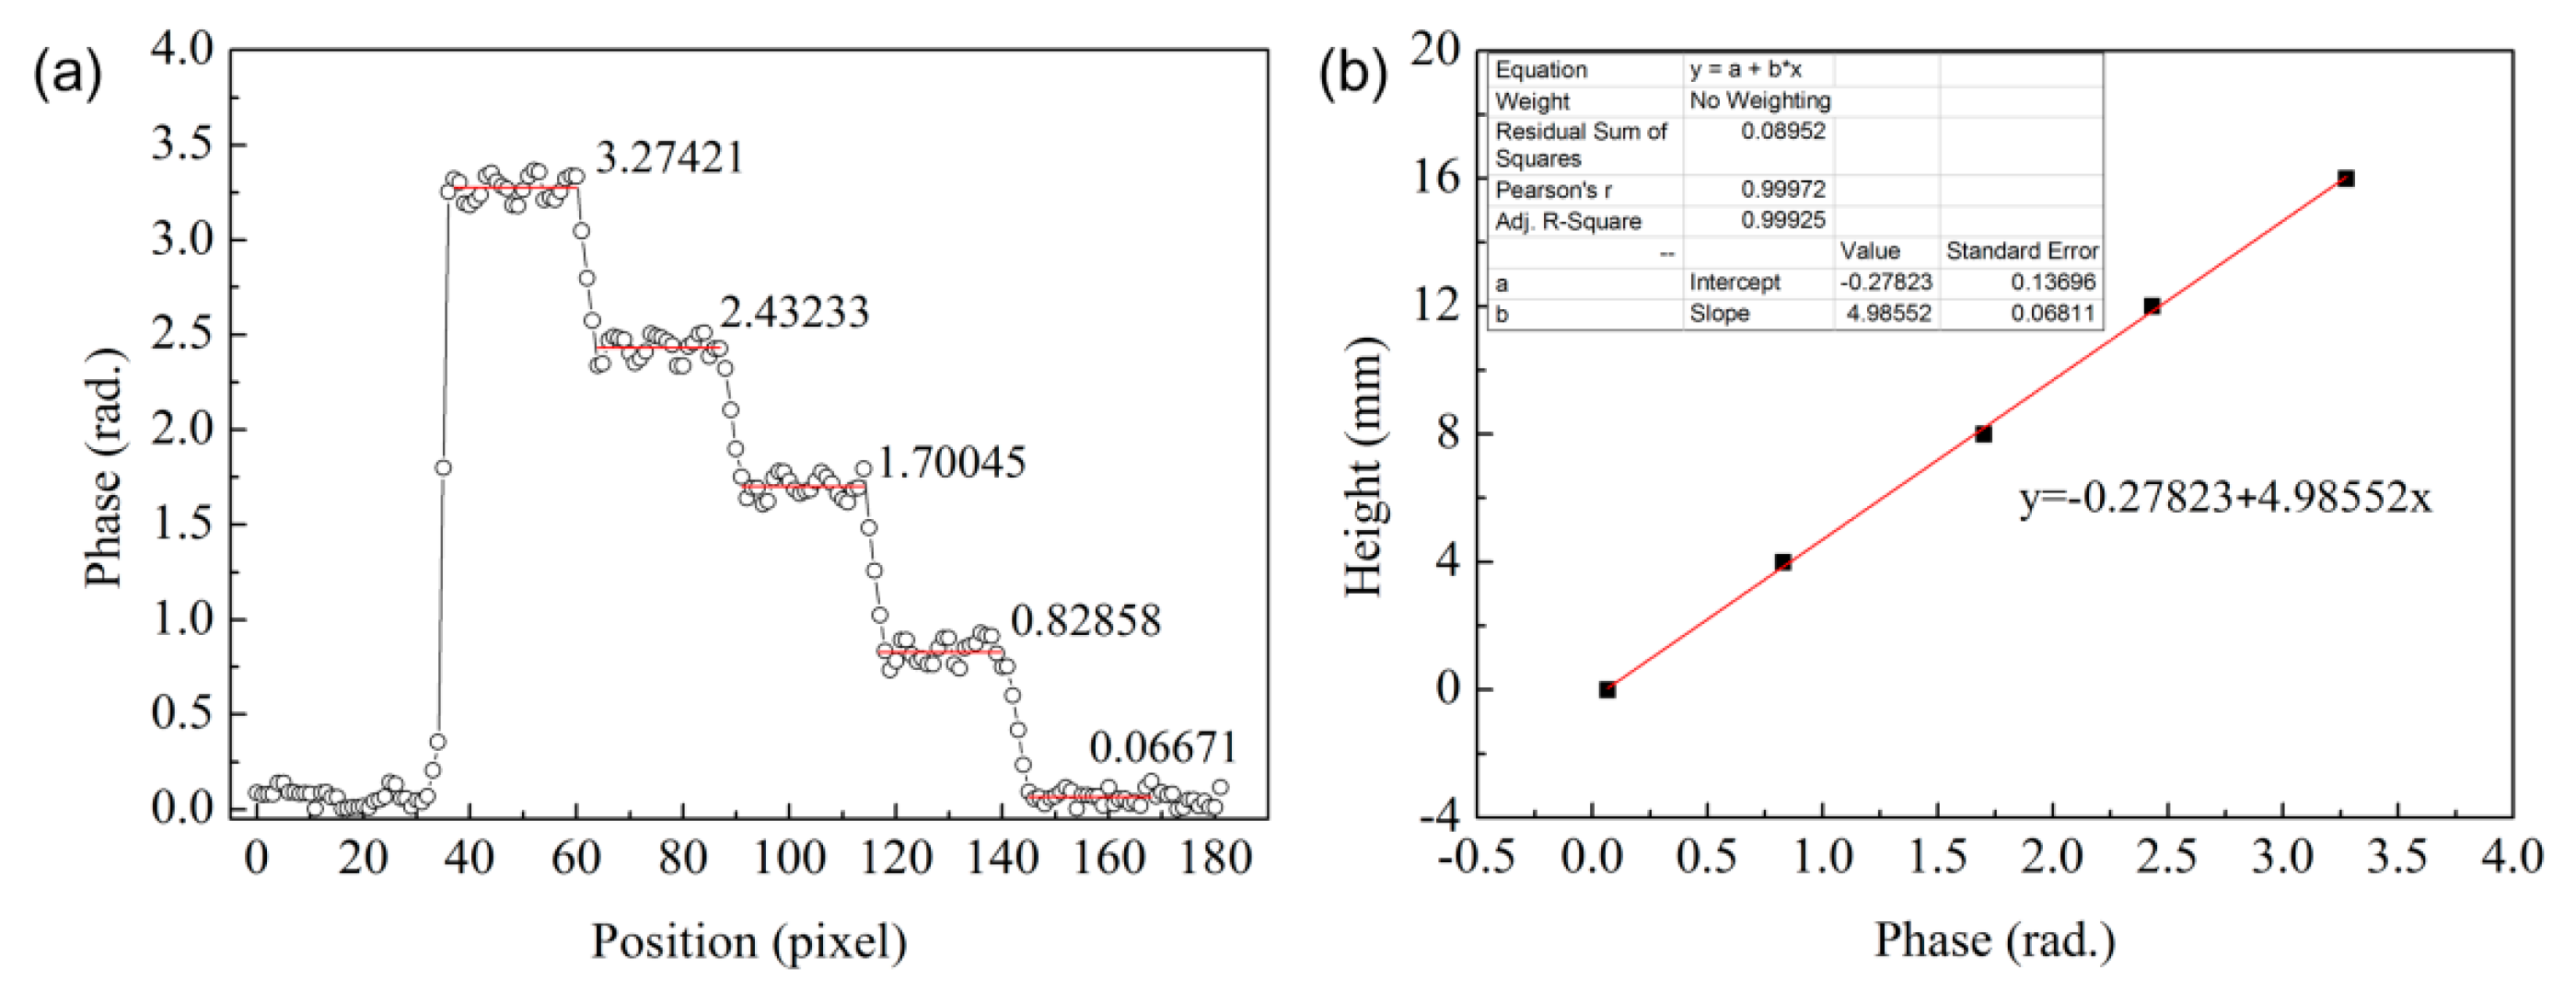
4.1. System Calibration
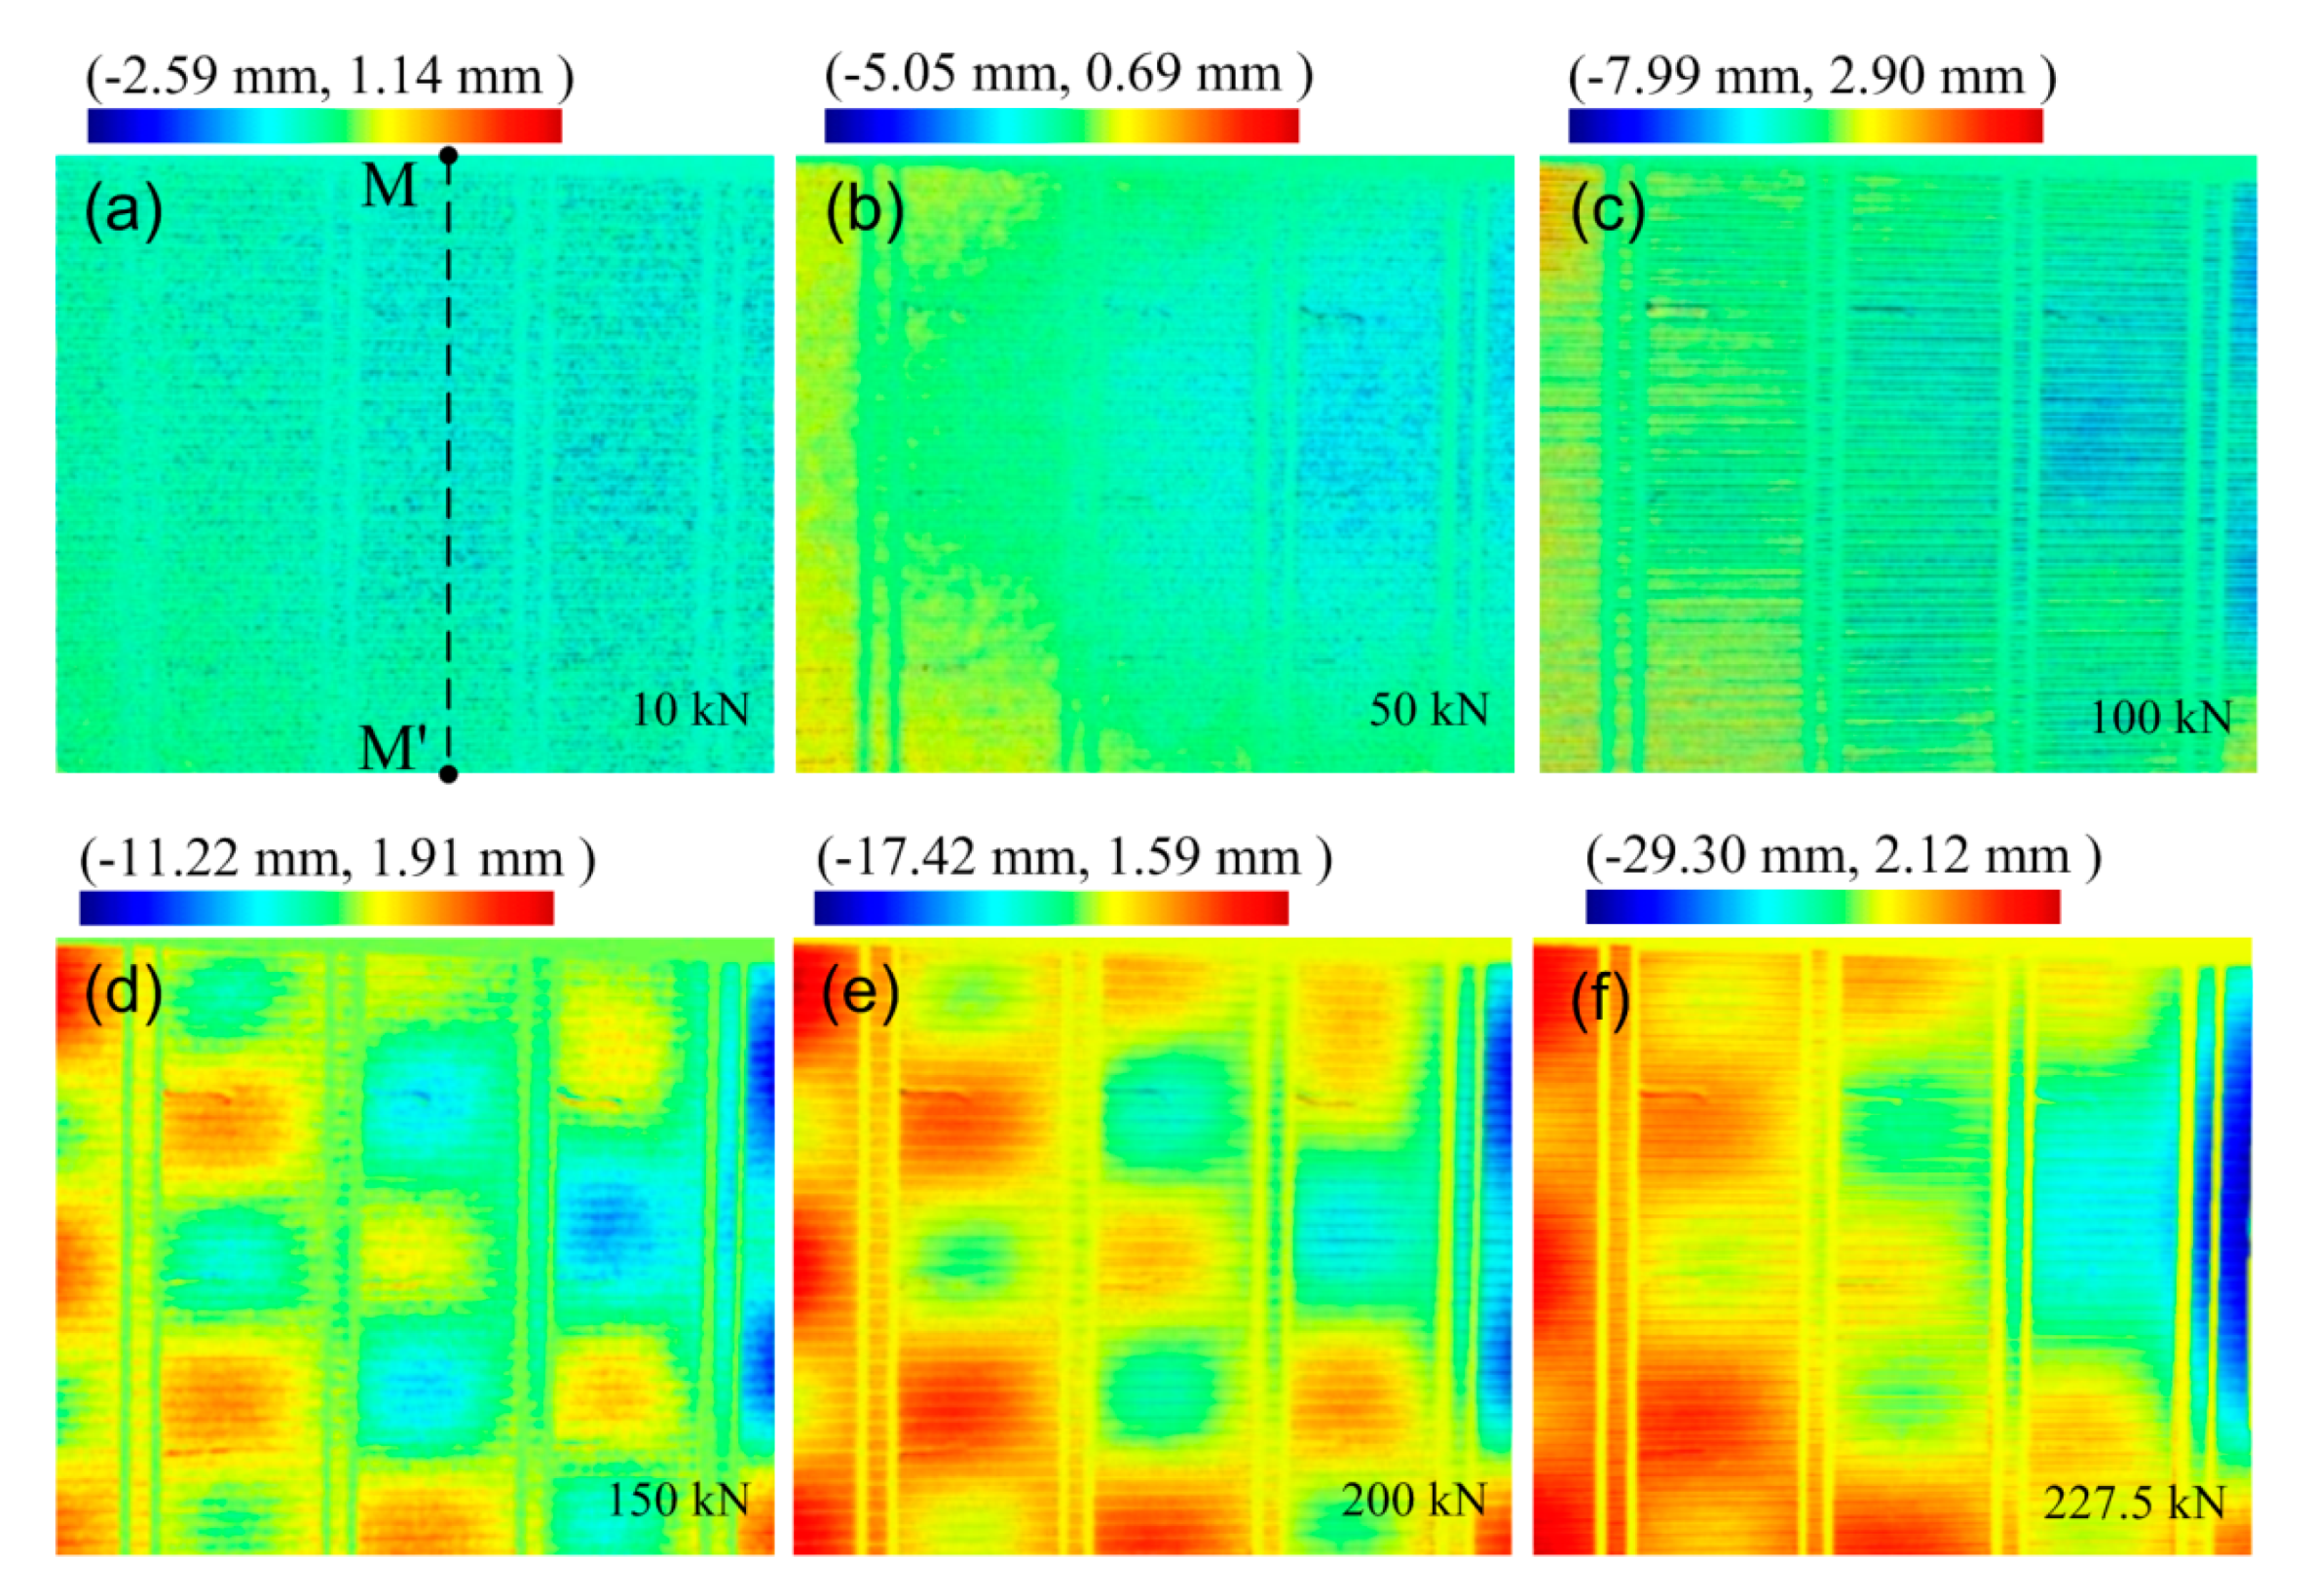
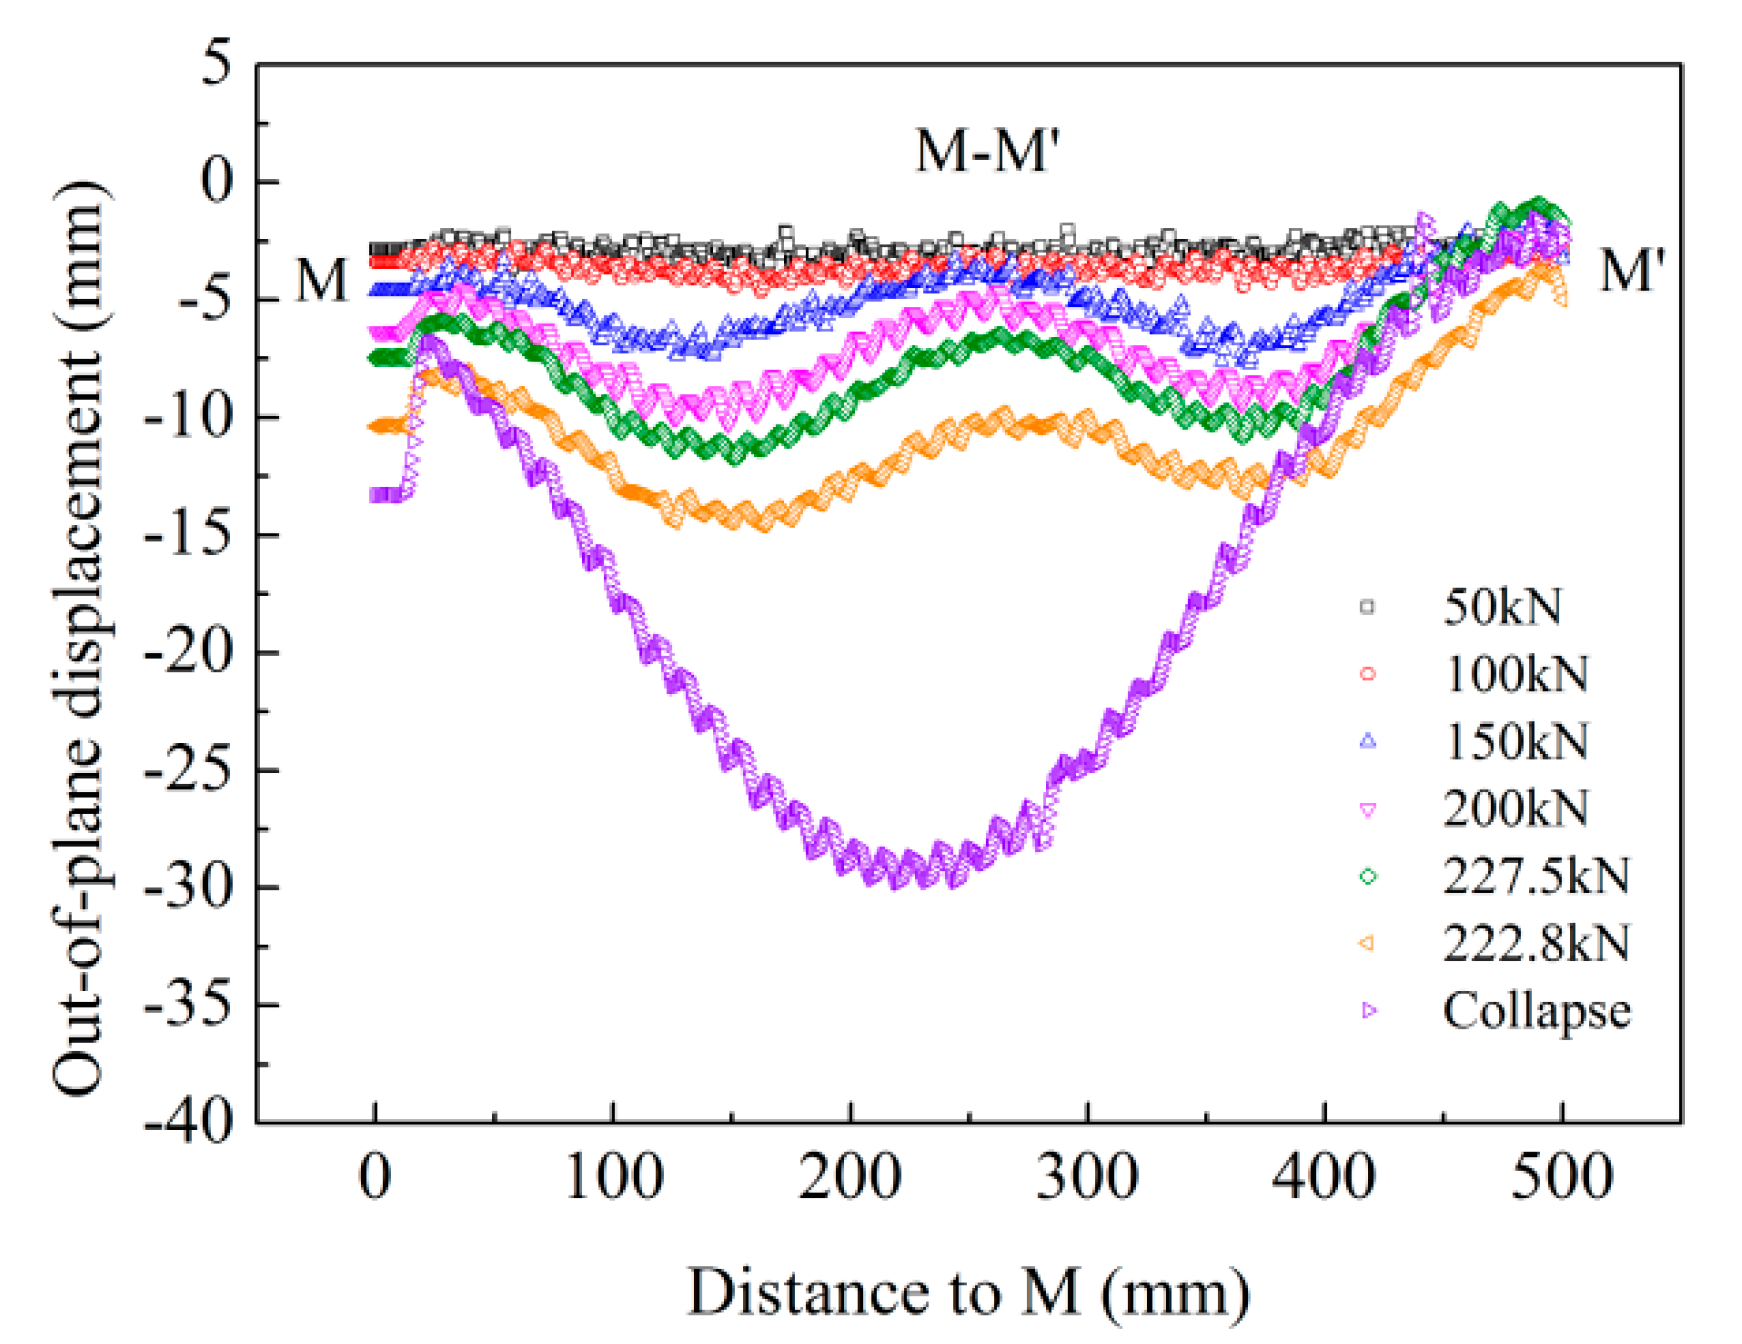
4.2. Local Buckling Results
4.3. Buckling Deflection Curve
4.4. Panel Failure Mechanism
5. Buckling Analysis by FEM
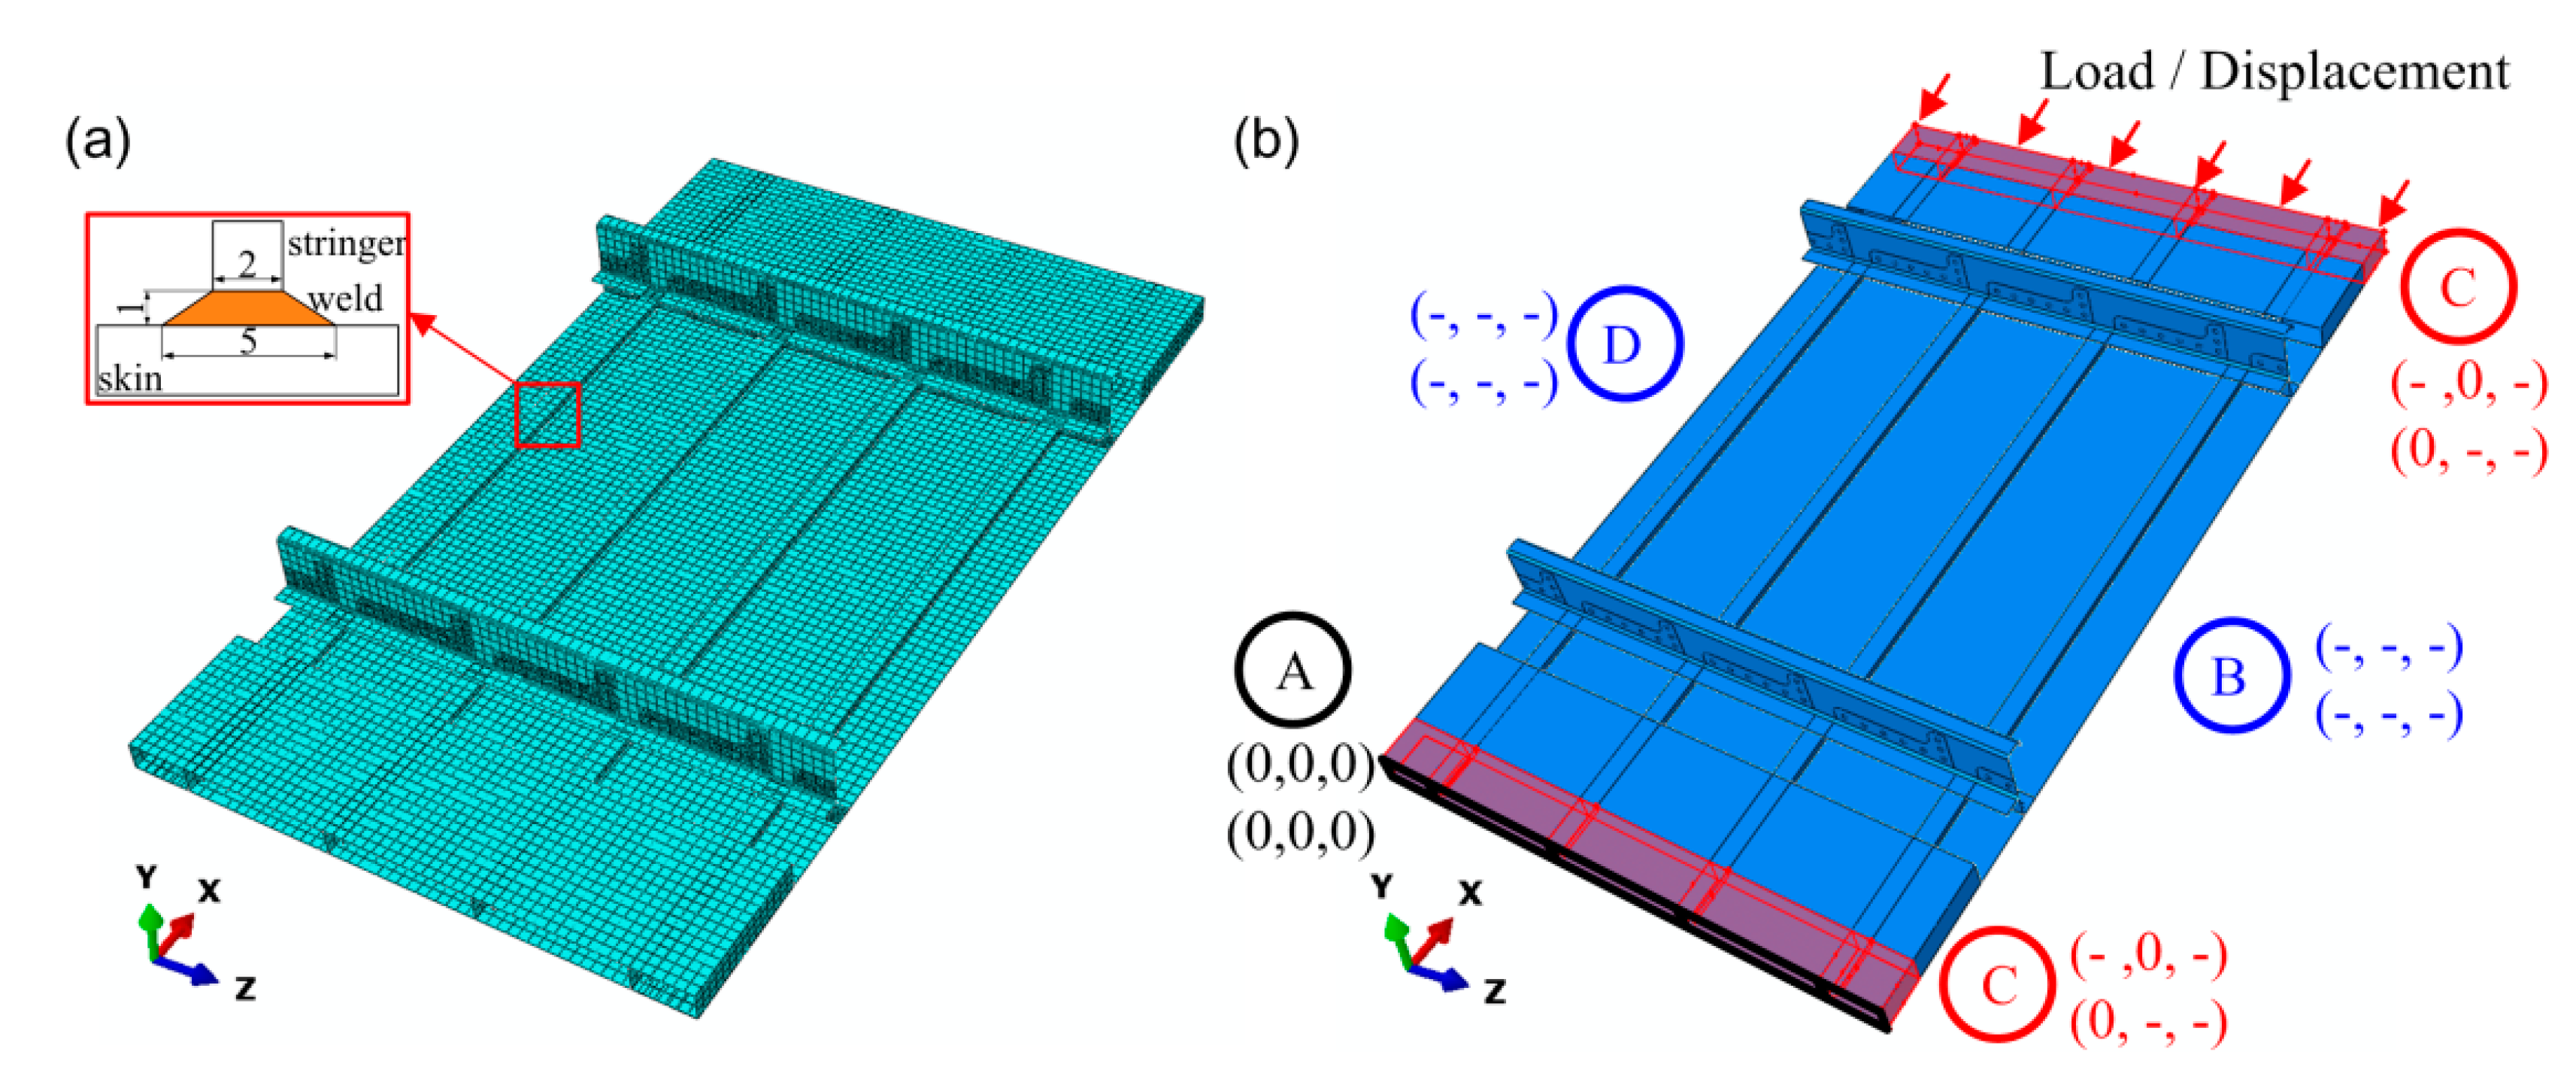
5.1. FEM Models
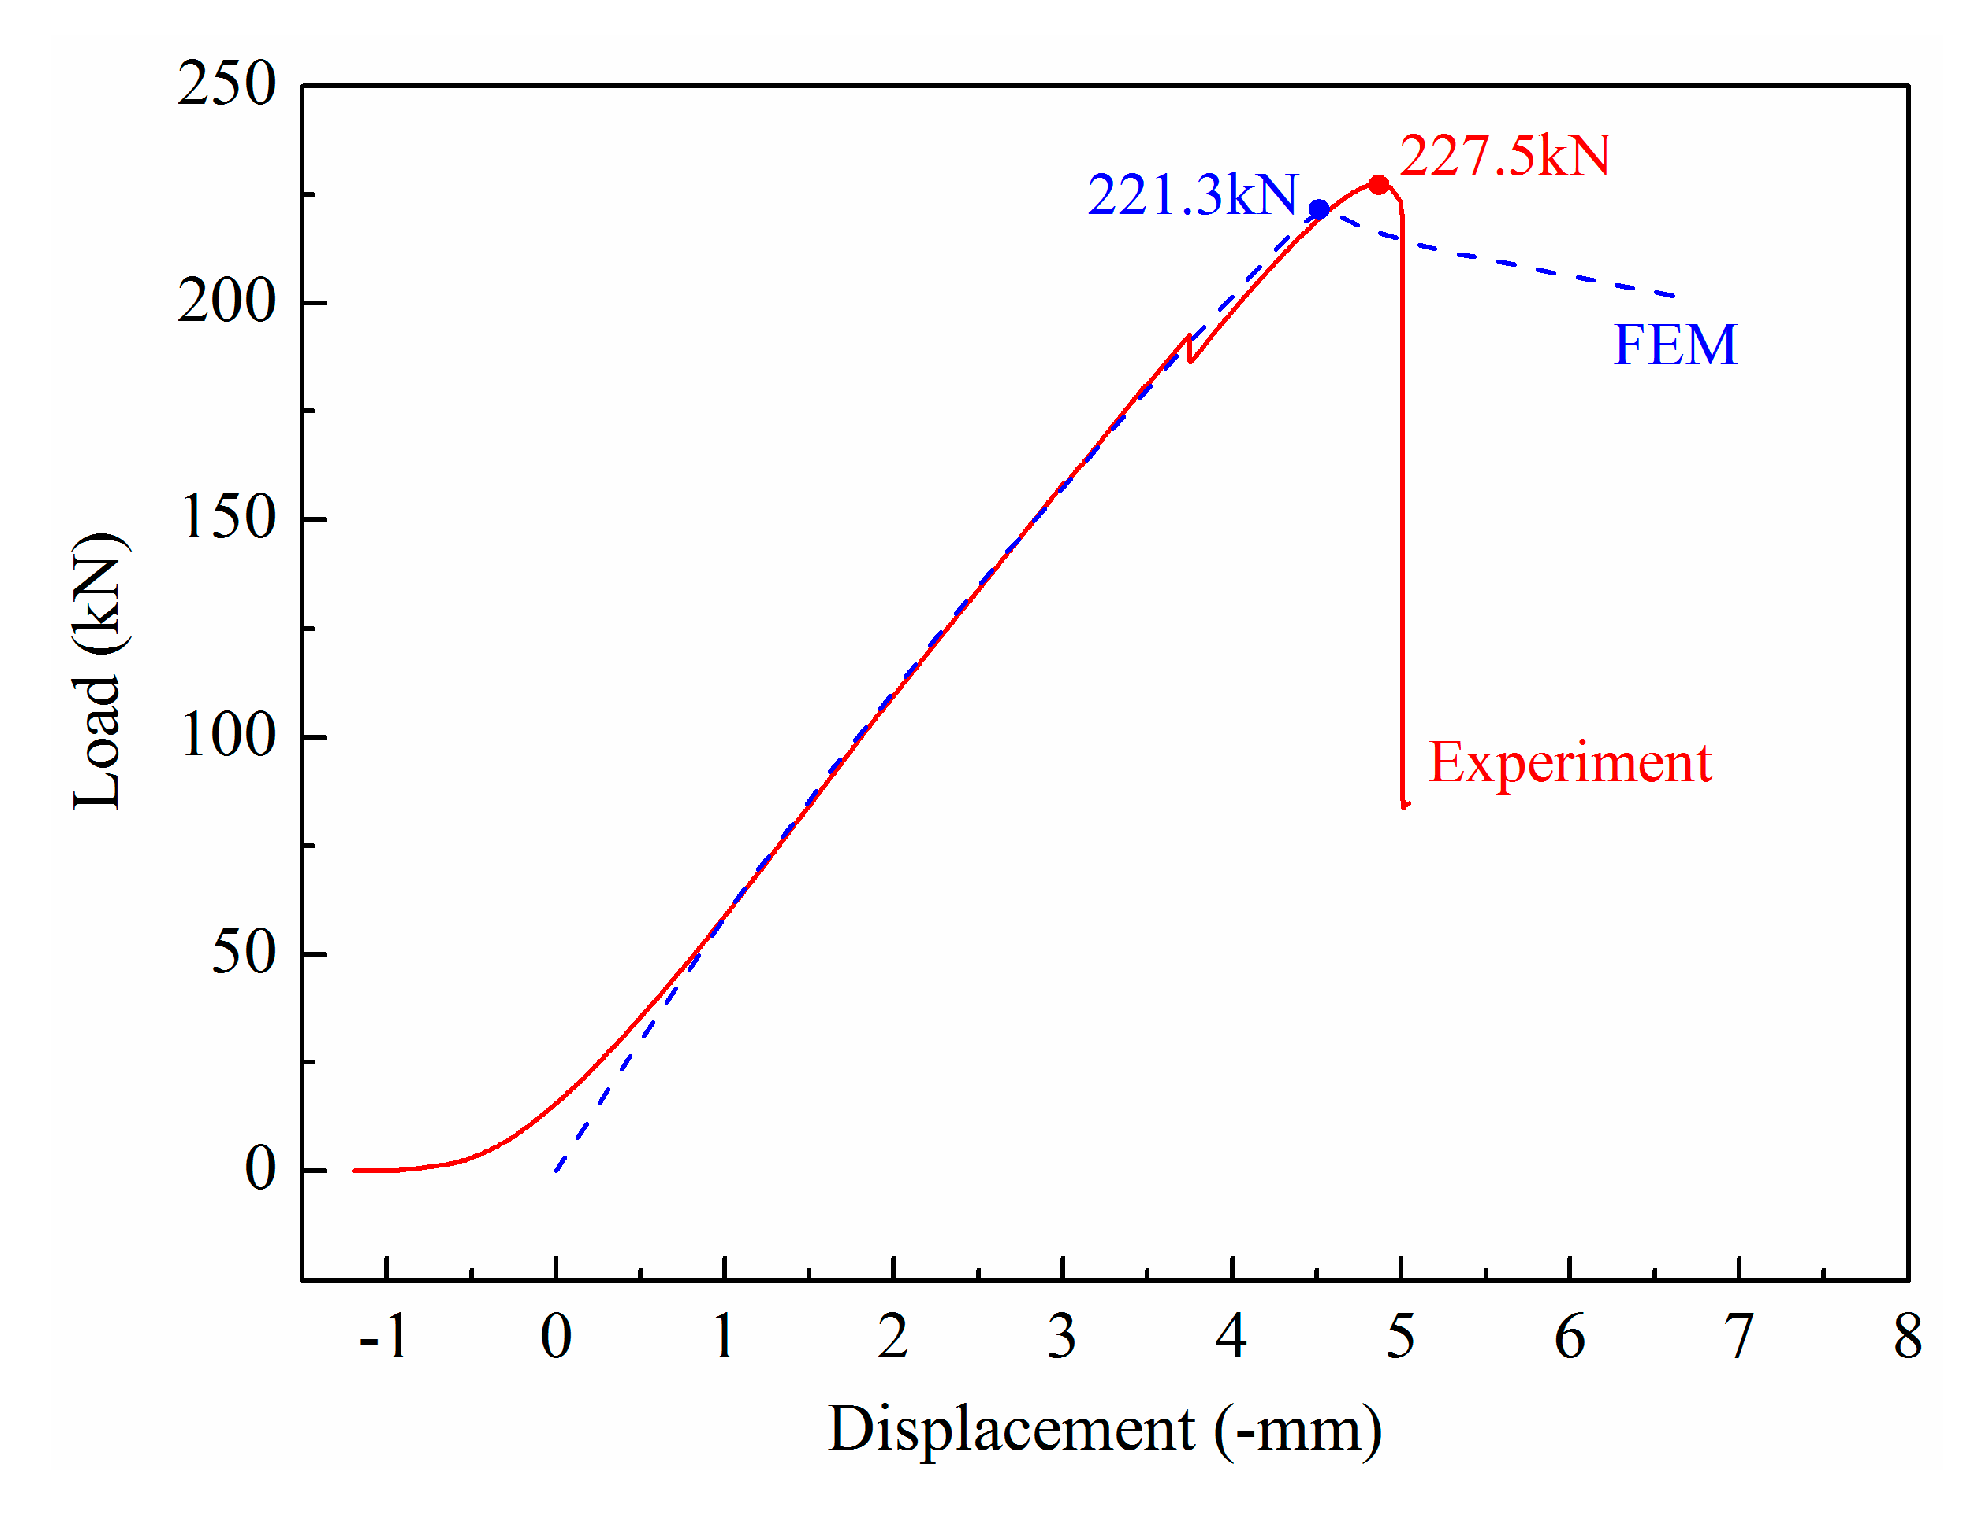
5.2. Buckling and Post-Buckling Analysis
6. Conclusions
Author Contributions
Funding
Acknowledgments
Conflicts of Interest
References
- Li, Z.; Gobbi, S.L. Laser welding for lightweight structures. J. Mater. Process. Tech. 1997, 70, 137–144. [Google Scholar] [CrossRef]
- Zink, W. Advanced aircraft fuselage structures. In The European Symposium on Assessment of Power Beam Welds; GKSS Research Centre: Geesthact, Germany, 1999. [Google Scholar]
- Rötzer, I. Laser-beam welding makes aircraft lighter. Fraunhofer Mag. 2005, 1, 36–37. [Google Scholar]
- Kashaev, N.; Ventzke, V.; Gürel Çam. Prospects of laser beam welding and friction stir welding processes for aluminum airframe structural applications. J. Manuf. Process. 2018, 36, 571–600. [Google Scholar] [CrossRef]
- Zink, W. Welding fuselage shells. Ind. Laser Solut. Manuf. 2001, 16, 7–10. [Google Scholar]
- Brenner, B.; Standfuβ, J.; Morgenthal, L. New Technological Aspects of Laser Beam Welding of Aircraft Structures; DVS: Düsseldorf, Germany, 2004; pp. 19–24. [Google Scholar]
- Gupta, R.K.; Nayanb, N.; Nagasireesha, G.; Sharma, S.C. Development and characterization of Al-Li alloys. Mater. Sci. Eng. A 2006, 420, 228–234. [Google Scholar] [CrossRef]
- Dursun, T.; Soutis, C. Recent developments in advanced aircraft aluminum alloys. Mater. Des. 2014, 56, 862–871. [Google Scholar] [CrossRef]
- Dittrich, D.; Standfuss, J.; Liebscher, J.; Brenner, B.; Beyer, E. Laser beam welding of hard to weld Al alloys for a regional aircraft fuselage design—First results. Phys. Proced. 2011, 12, 113–122. [Google Scholar] [CrossRef]
- Xia, H.B.; Tao, W.; Li, L.Q.; Tan, C.W.; Zhang, K.P.; Ma, N.S. Effect of laser beam models on laser welding-brazing Al to steel. Opt. Laser Technol. 2020, 122, 105845. [Google Scholar] [CrossRef]
- Zhang, X.Y.; Yang, W.X.; Xiao, R.S. Microstructure and mechanical properties of laser beam welded Al–Li alloy 2060 with Al–Mg filler wire. Mater. Des. 2015, 88, 446–450. [Google Scholar] [CrossRef]
- Zhang, X.Y.; Huang, T.; Yang, W.X.; Xiao, R.S.; Liu, Z.; Li, L. Microstructure and mechanical properties of laser beam-welded AA2060 Al-Li alloy. J. Mater. Process. Tech. 2016, 237, 301–308. [Google Scholar] [CrossRef]
- Zhang, Y.L.; Tao, W.; Chen, Y.B.; Nan, T.T. Effects of heat treatment on microstructure and mechanical properties of double-sided laser-welded AA2060/AA2099 T-joint. J. Mater. Process. Tech. 2020, 285, 116777. [Google Scholar] [CrossRef]
- Han, B.; Tao, W.; Chen, Y.B.; Li, H. Double-sided laser beam welded T-joints for aluminum-lithium alloy aircraft fuselage panels: Effects of filler elements on microstructure and mechanical properties. Opt. Laser Technol. 2017, 93, 99–108. [Google Scholar] [CrossRef]
- Ning, J.; Zhang, L.J.; Bai, Q.L.; Yin, X.Q.; Niu, J.; Zhang, J.X. Comparison of the microstructure and mechanical performance of 2A97 Al-Li alloy joints between autogenous and non-autogenous laser welding. Mater. Des. 2017, 120, 144–156. [Google Scholar] [CrossRef]
- Lynch, C.; Murphy, A.; Price, M.; Gibson, A. The computational post buckling analysis of fuselage stiffened panels loaded in compression. Thin Walled Struct. 2004, 42, 1445–1464. [Google Scholar] [CrossRef] [Green Version]
- Murphy, A.; Ekmekyapar, T.; Quinn, D.; Özakça, M.; Poston, K.; Moore, G.; Niblock, J. The influence of assembly friction stir weld location on wing panel static strength. Thin Walled Struct. 2014, 76, 56–64. [Google Scholar] [CrossRef] [Green Version]
- Wilson, R.; Murphy, A.; Price, M.A.; Glazebrook, C. A preliminary structural design procedure for laser beam welded airframe stiffened panels. Thin Walled Struct. 2012, 55, 37–50. [Google Scholar] [CrossRef] [Green Version]
- Han, B.; Chen, Y.B.; Tao, W.; Lei, Z.L.; Li, H.; Guo, S.; Li, P. Nano-indentation investigation on the local softening of equiaxed zone in 2060-T8/2099-T83 aluminum-lithium alloys T-joints welded by double-sided laser beam welding. J. Alloys Compd. 2018, 756, 145–162. [Google Scholar] [CrossRef]
- Murphy, A.; Price, M.; Lynch, C.; Gibson, A. The computational post buckling analysis of fuselage stiffened panels loaded in shear. Thin Walled Struct. 2005, 43, 1455–1474. [Google Scholar] [CrossRef] [Green Version]
- Tweedy, B.; Sellmeyer, S.; Jahn, A.; Burford, D. Static strength comparison of riveted versus friction stir welded stiffened panels. In Proceedings of the 47th AIAA/ASME/ASCE/AHS/ASC Structures, Structural Dynamics, and Materials Conference, Newport, RI, USA, 1–4 May 2006. [Google Scholar]
- Zhu, S.H.; Yan, J.Y.; Wang, Y.Q.; Tong, M.B. Buckling and Postbuckling Experiments of Integrally Stiffened Panel Under Compression–Shear Loads. J. Aircr. 2015, 52, 680–691. [Google Scholar] [CrossRef]
- Lei, Z.K.; Bai, R.X.; Tao, W.; Wei, X.; Leng, R.J. Optical measurement on dynamic buckling behavior of stiffened composite panels under in-plane shear. Opt. Laser Eng. 2016, 87, 111–119. [Google Scholar] [CrossRef]
- Hoffman, E.K.; Hafley, R.A.; Wagner, J.A.; Jegley, D.C.; Pecquet, R.W.; Blum, C.M.; Arbegast, W.J. Compression Buckling Behavior of Large-Scale Friction Stir Welded and Riveted 2090-T83 Al-Li Alloy Skin-Stiffener Panels. Available online: http://www.researchgate.net/publication/24325063 (accessed on 26 May 2014).
- Ge, D.Y.; Mo, Y.M.; He, B.L.; Wu, Y.T.; Du, X.Z. Experimental and numerical investigation of stiffened composite curved panel under shear and in-plane bending. Compos. Struct. 2016, 137, 185–195. [Google Scholar] [CrossRef]
- Liu, X.Y.; Han, K.; Bai, R.X.; Lei, Z.K.; Wang, H. Buckling measurement and numerical analysis of M-type ribs stiffened composite panel. Thin Walled Struct. 2014, 85, 117–124. [Google Scholar] [CrossRef]
- Wang, Z.Y.; Nguyen, D.A.; Barnes, J.C. Some practical considerations in fringe projection profilometry. Opt. Laser. Eng. 2010, 48, 218–225. [Google Scholar] [CrossRef]
- Zuo, C.; Huang, L.; Zhang, M.L.; Chen, Q.; Asundi, A. Temporal phase unwrapping algorithms for fringe projection profilometry: A comparative review. Opt. Laser. Eng. 2016, 85, 84–103. [Google Scholar] [CrossRef]
- Gorji, N.E.; Saxena, P.; Corfield, M.; Clare, A.; Rueff, J.-P.; Bogan, J.; González, P.G.M.; Snelgrove, M.; Hughes, G.; O’Connor, R.; et al. A new method for assessing the utility of powder bed fusion (PBF) feedstock through life. Mater. Charact. 2020, 161, 110167. [Google Scholar] [CrossRef]
- ISO 13919-2. Welding-Electron and Laser Beam Welded Joints-Guidance on Quality Levels for Imperfections-Part 2, Aluminium and Its Weldable Alloys; International Standard Organization: Geneva, Switzerland, 2001. [Google Scholar]
- Murphy, A.; Price, M.; Gibson, A.; Armstrong, C.G. Efficient non-linear idealisations of aircraft fuselage panels in compression. Finite Elem. Anal. Des. 2004, 40, 1977–1993. [Google Scholar] [CrossRef] [Green Version]
- Yang, B.; Shen, L.; Kang, S.B.; Elchalakani, M.; Nie, S.D. Load bearing capacity of welded Q460GJ steel H-columns under eccentric compression. J. Constr. Steel Res. 2018, 143, 320–330. [Google Scholar] [CrossRef]
- ASTM E 8M-04. Standard Test Methods for Tension Testing of Metallic Materials; ASTM International: West Conshohocken, PA, USA, 2004. [Google Scholar]
- ABAQUS. ABAQUS/Standard User’s Manual and ABAQUS CAE Manual; Dassault Systèmes Simulia Corporation: Vélizy-Villacoublay, France, 2014; Volume 1–3. [Google Scholar]


| Welding Parameters | Values |
|---|---|
| Laser power | 3 kW |
| Welding speed | 10 m/min |
| Wire feeding rate | 4 m/min |
| Incident beam angle | 22° |
| Wire feeding angle | 20° |
| Protecting gas angle | 20° |
| Focal position | Specimen surface |
| Protecting gas | Ar |
| Protecting gas flow rate | 15 L/min |
| Panel Components | Young’s Modulus | Poisson’s Ratio |
|---|---|---|
| Skin | 81 GPa | 0.3 |
| Stringer | 81 GPa | 0.3 |
| Weld | 81 GPa | 0.3 |
| Other components | 72 GPa | 0.3 |
| Failure Load (kN) | Percentage Difference (%) 1 | |
|---|---|---|
| Experiment | 227.5 | --- |
| FEM | 221.3 | −2.7% |
© 2020 by the authors. Licensee MDPI, Basel, Switzerland. This article is an open access article distributed under the terms and conditions of the Creative Commons Attribution (CC BY) license (http://creativecommons.org/licenses/by/4.0/).
Share and Cite
Zhang, Y.; Tao, W.; Chen, Y.; Lei, Z.; Bai, R.; Lei, Z. Experiment and Numerical Simulation for the Compressive Buckling Behavior of Double-Sided Laser-Welded Al–Li Alloy Aircraft Fuselage Panel. Materials 2020, 13, 3599. https://0-doi-org.brum.beds.ac.uk/10.3390/ma13163599
Zhang Y, Tao W, Chen Y, Lei Z, Bai R, Lei Z. Experiment and Numerical Simulation for the Compressive Buckling Behavior of Double-Sided Laser-Welded Al–Li Alloy Aircraft Fuselage Panel. Materials. 2020; 13(16):3599. https://0-doi-org.brum.beds.ac.uk/10.3390/ma13163599
Chicago/Turabian StyleZhang, Yunlong, Wang Tao, Yanbin Chen, Zhenkun Lei, Ruixiang Bai, and Zhenglong Lei. 2020. "Experiment and Numerical Simulation for the Compressive Buckling Behavior of Double-Sided Laser-Welded Al–Li Alloy Aircraft Fuselage Panel" Materials 13, no. 16: 3599. https://0-doi-org.brum.beds.ac.uk/10.3390/ma13163599