Synthesis and Adsorption Properties of Novel Bacterial Cellulose/Graphene Oxide/Attapulgite Materials for Cu and Pb Ions in Aqueous Solutions

Abstract
:1. Introduction
2. Materials and Methods
2.1. Materials
2.2. Preparation of Composite Materials
2.3. Characterization
2.4. Cu2+ and Pb2+ Adsorption by the Composite Hydrogels
2.4.1. Adsorption Kinetics
2.4.2. Effect of pH and Initial Concentration
2.4.3. Reusability of the Hydrogels
3. Results and Discussion
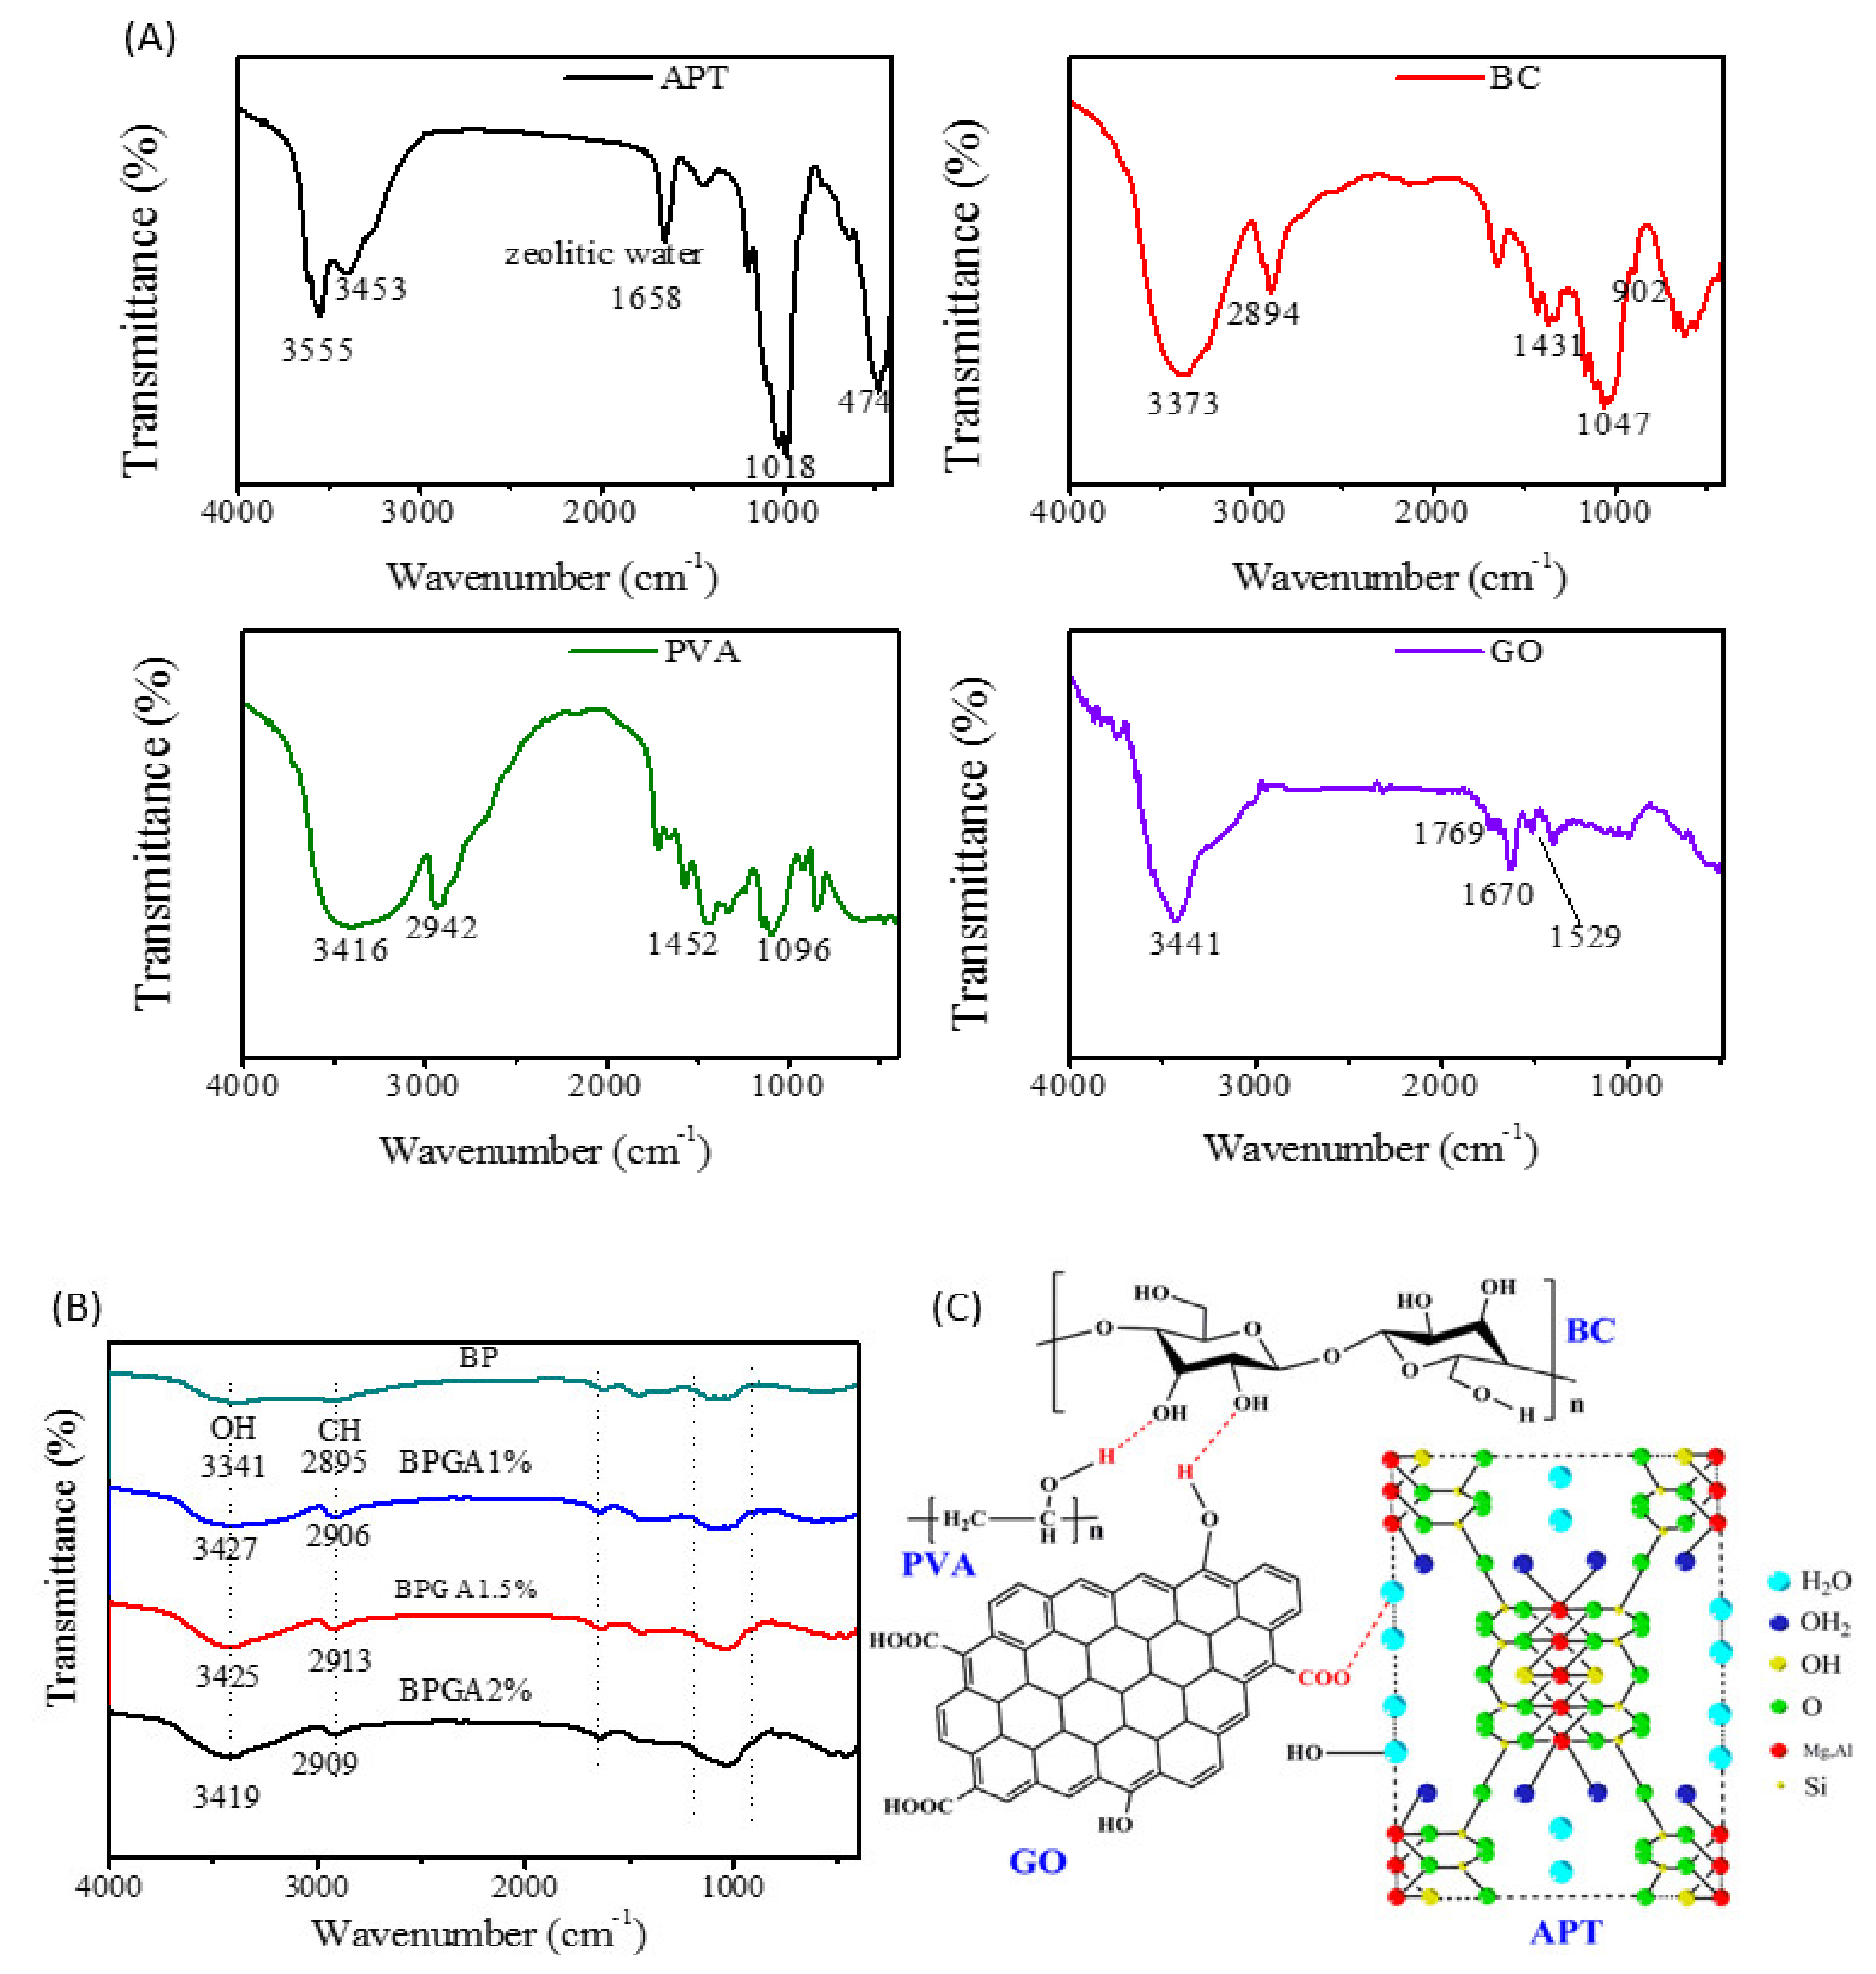
3.1. FTIR Analysis
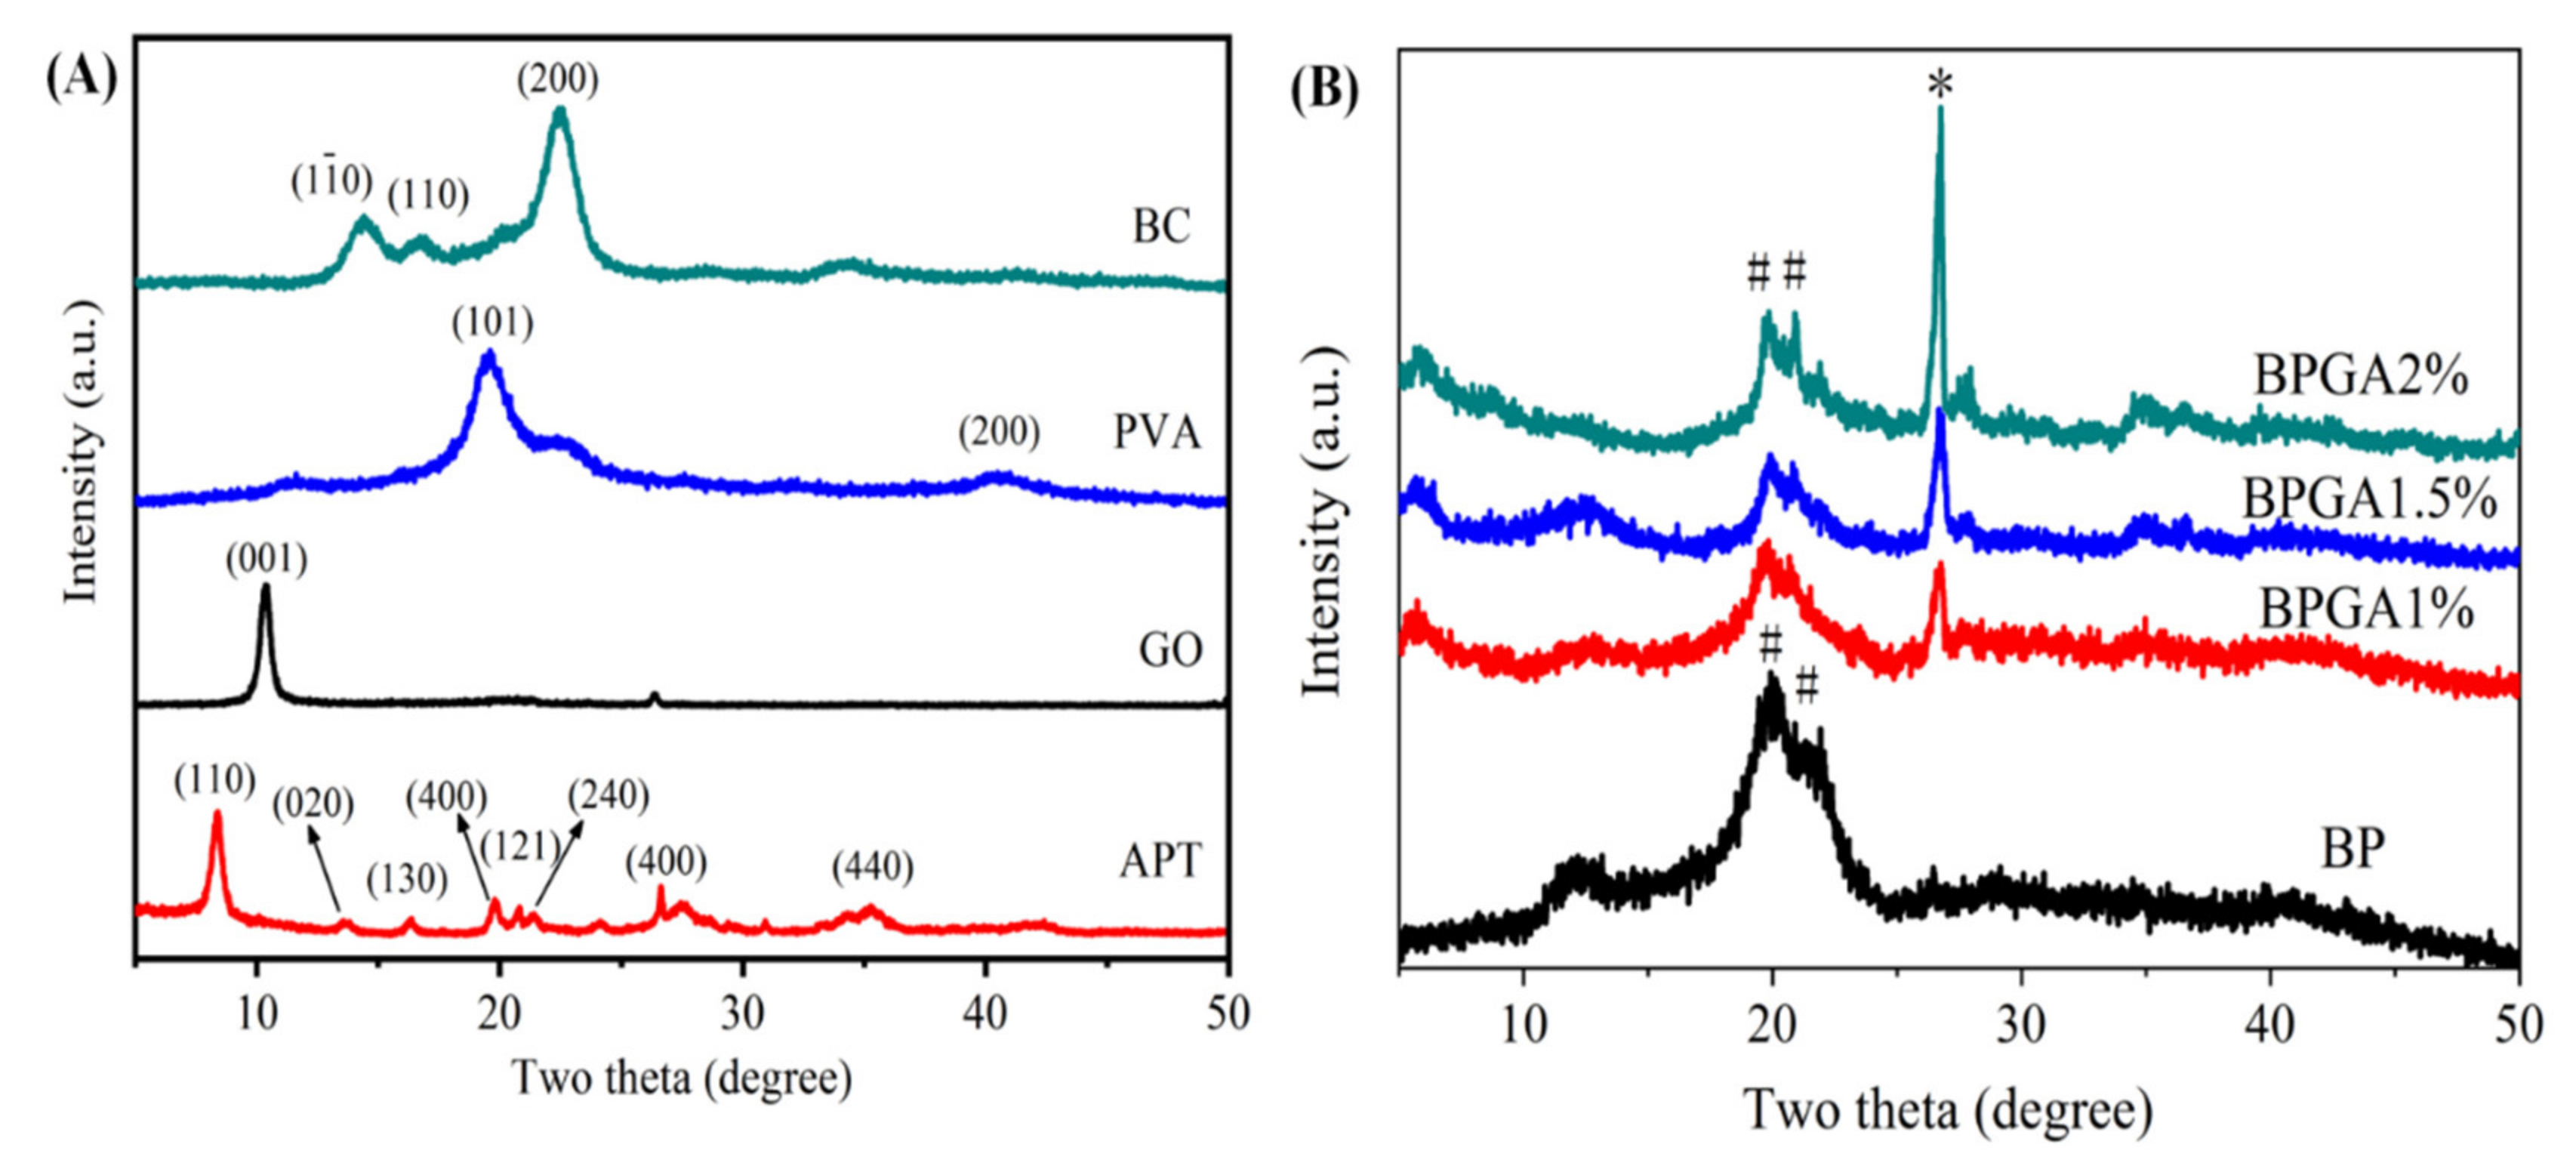
3.2. XRD Analysis
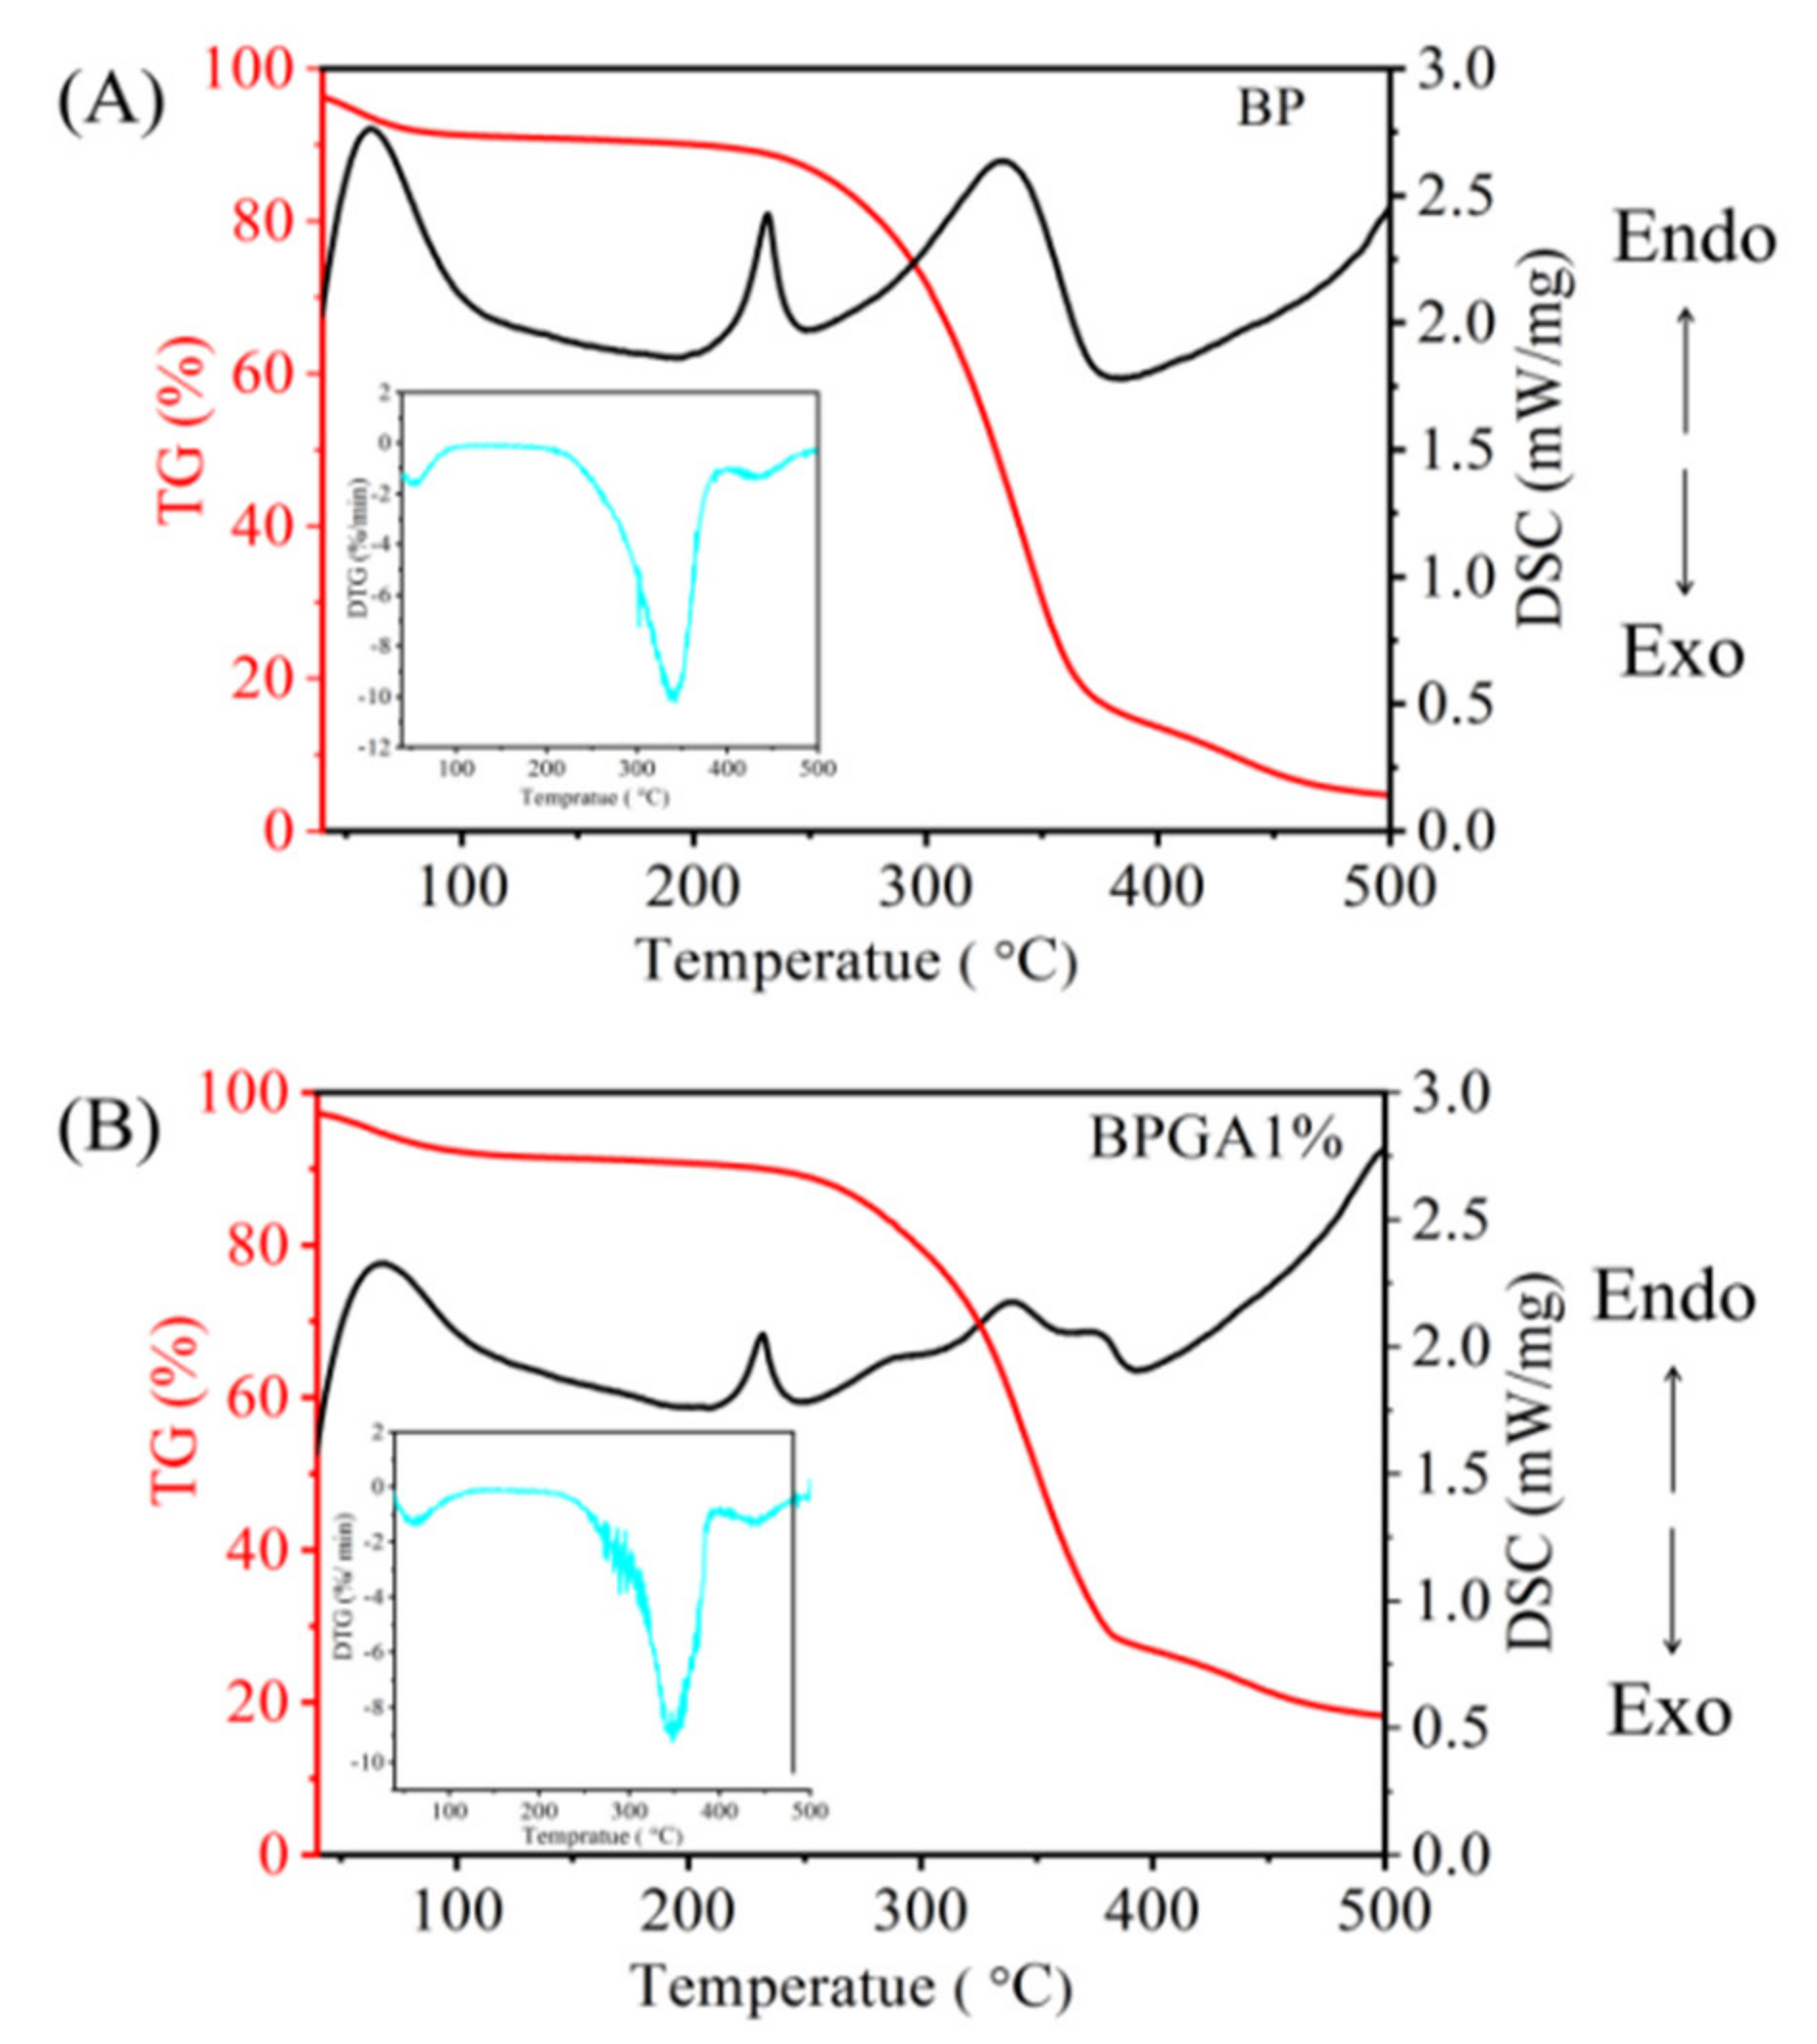
3.3. TG-DSC Analysis
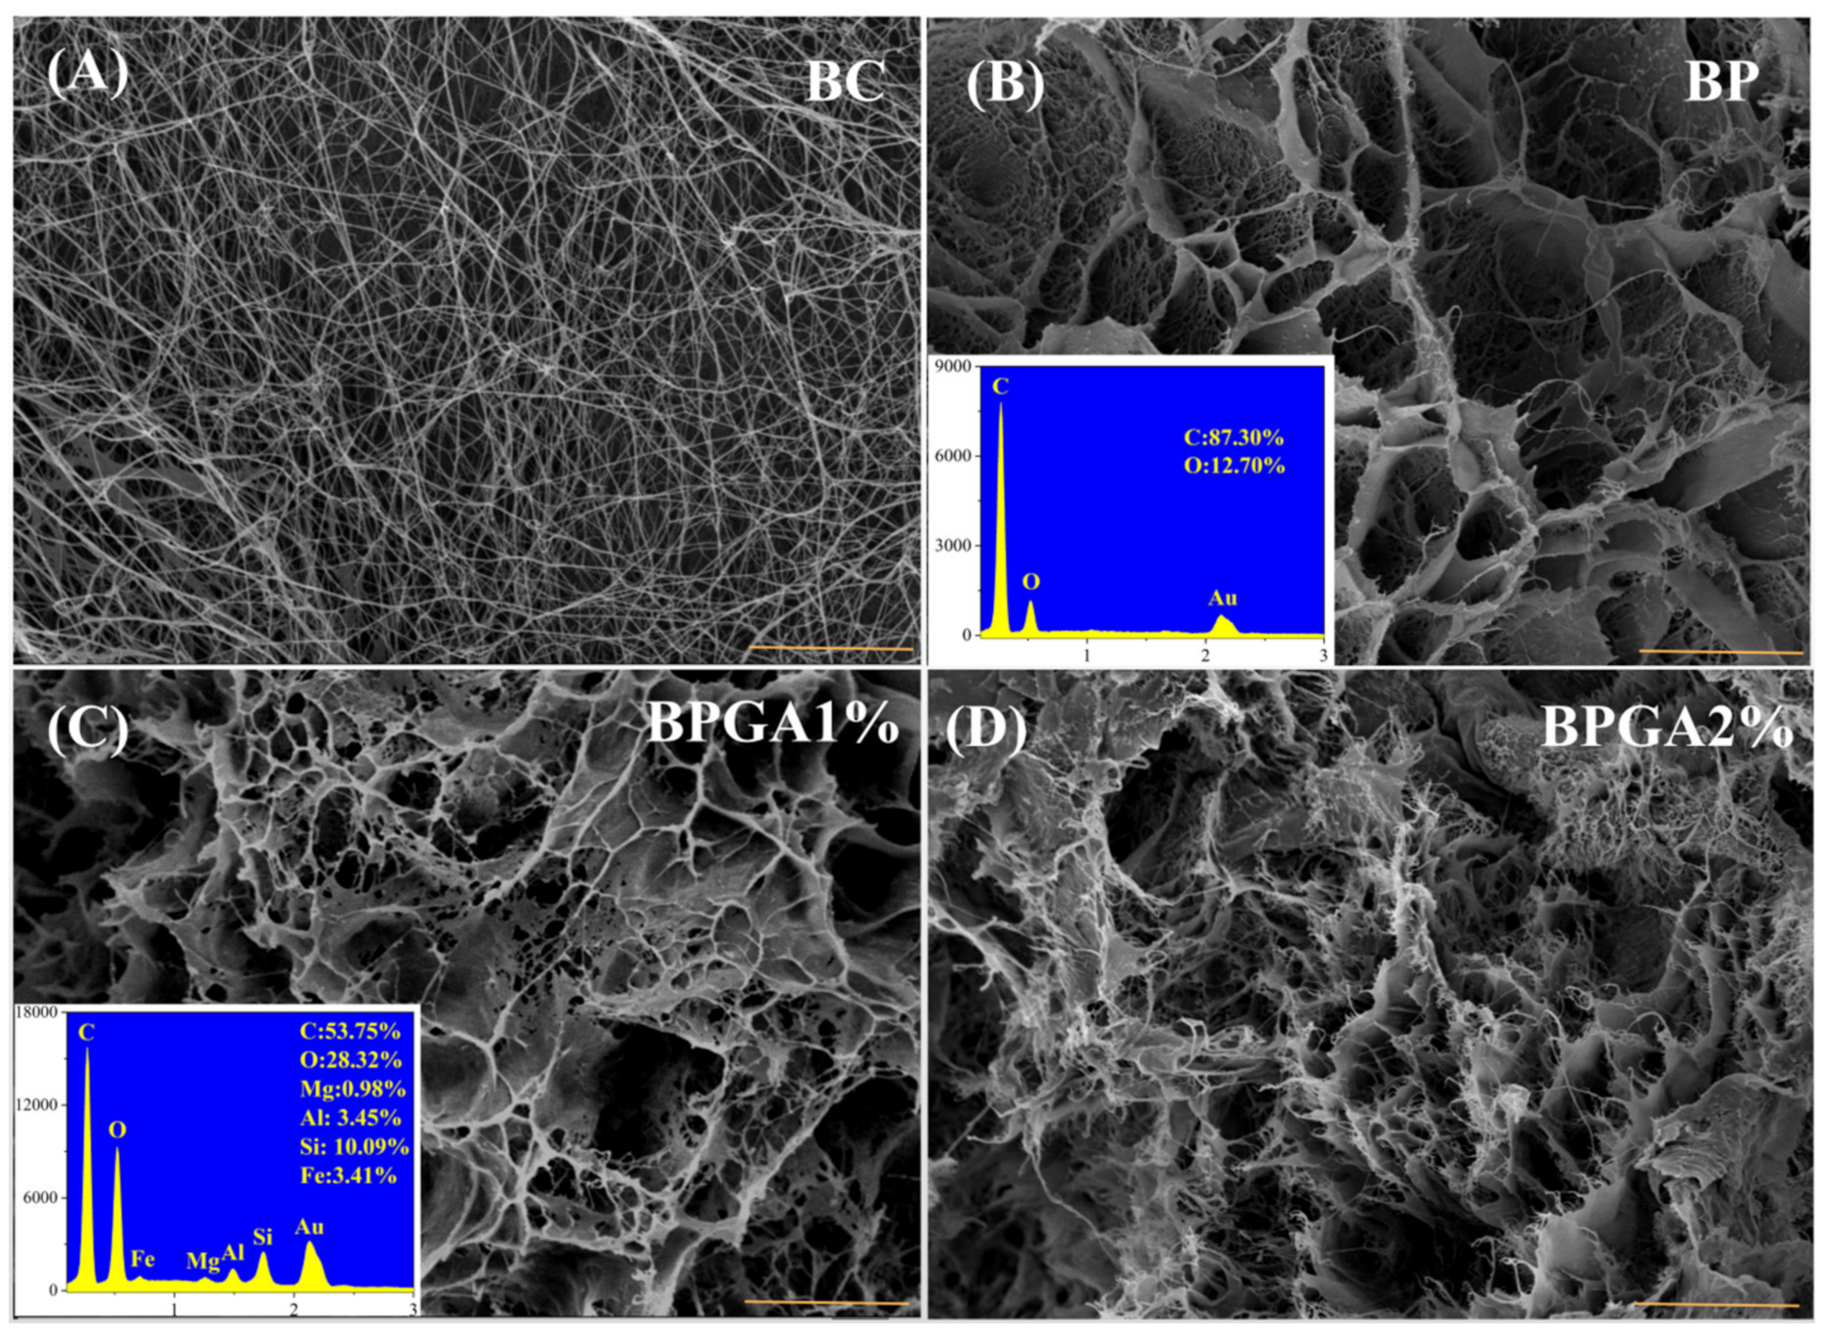
3.4. SEM-EDS Characterization
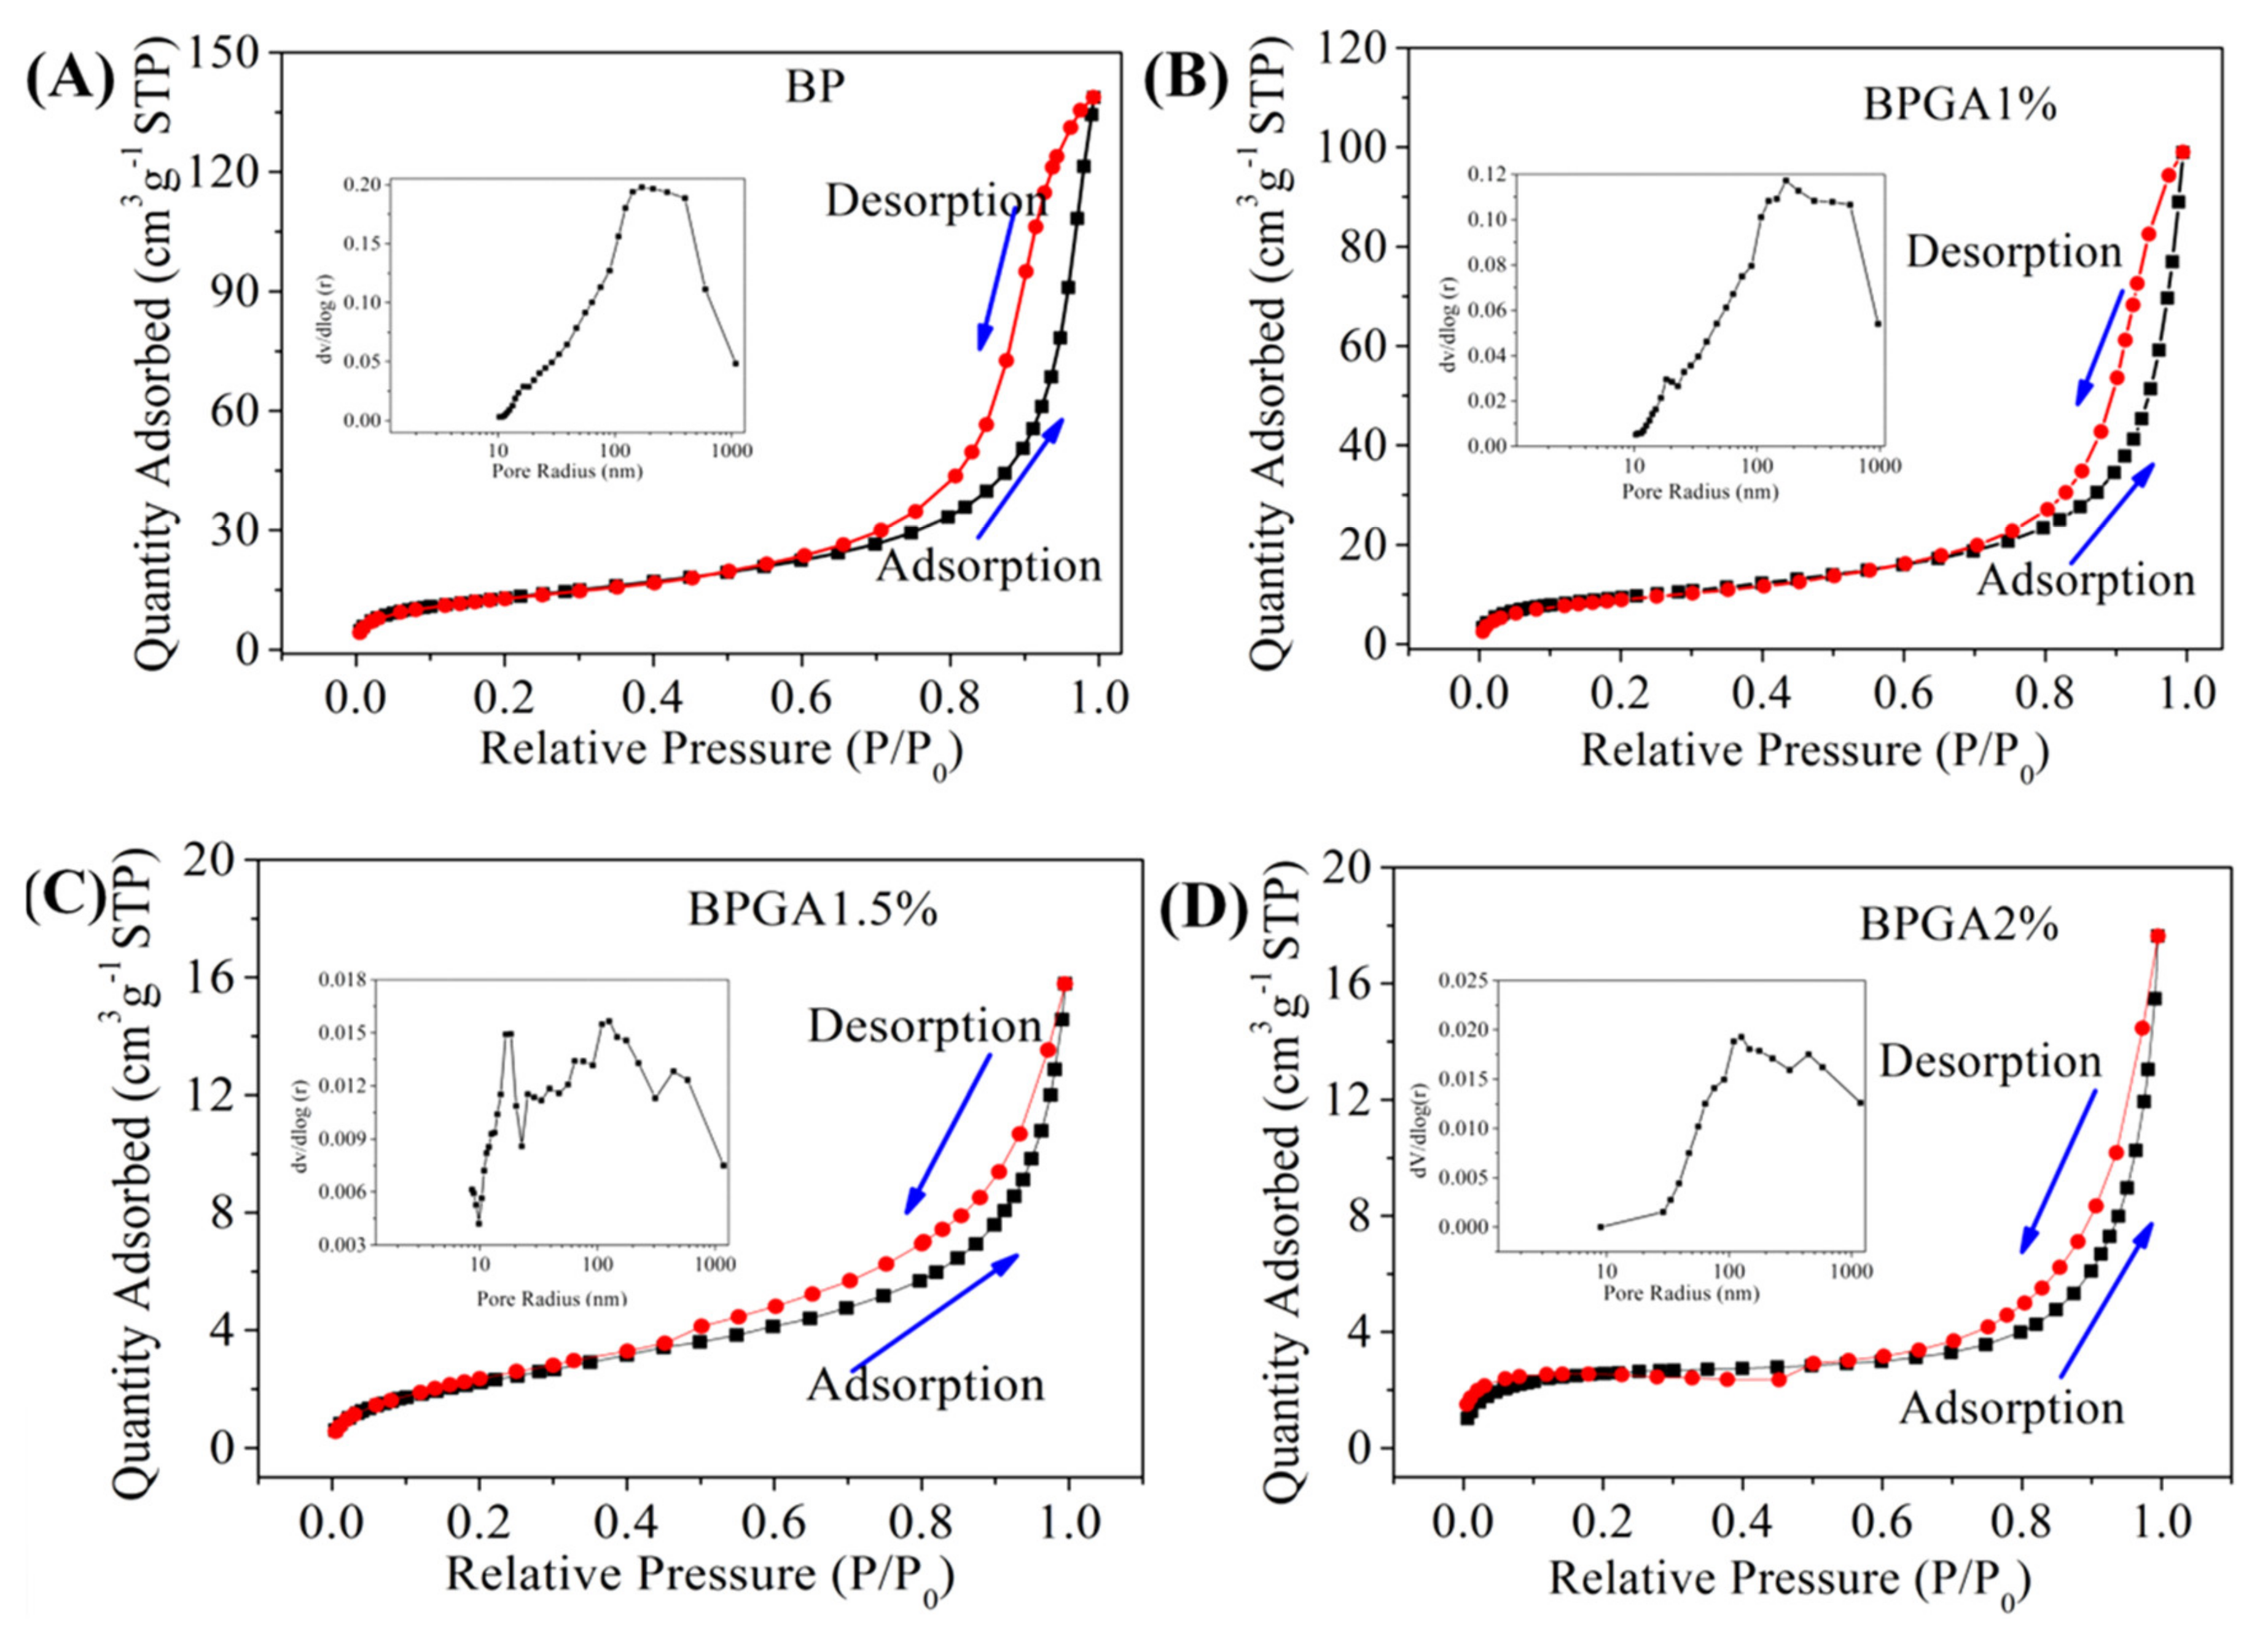
3.5. BET Analysis
3.6. The Adsorption of Cu2+ and Pb2+ Ions by the Composite Materials
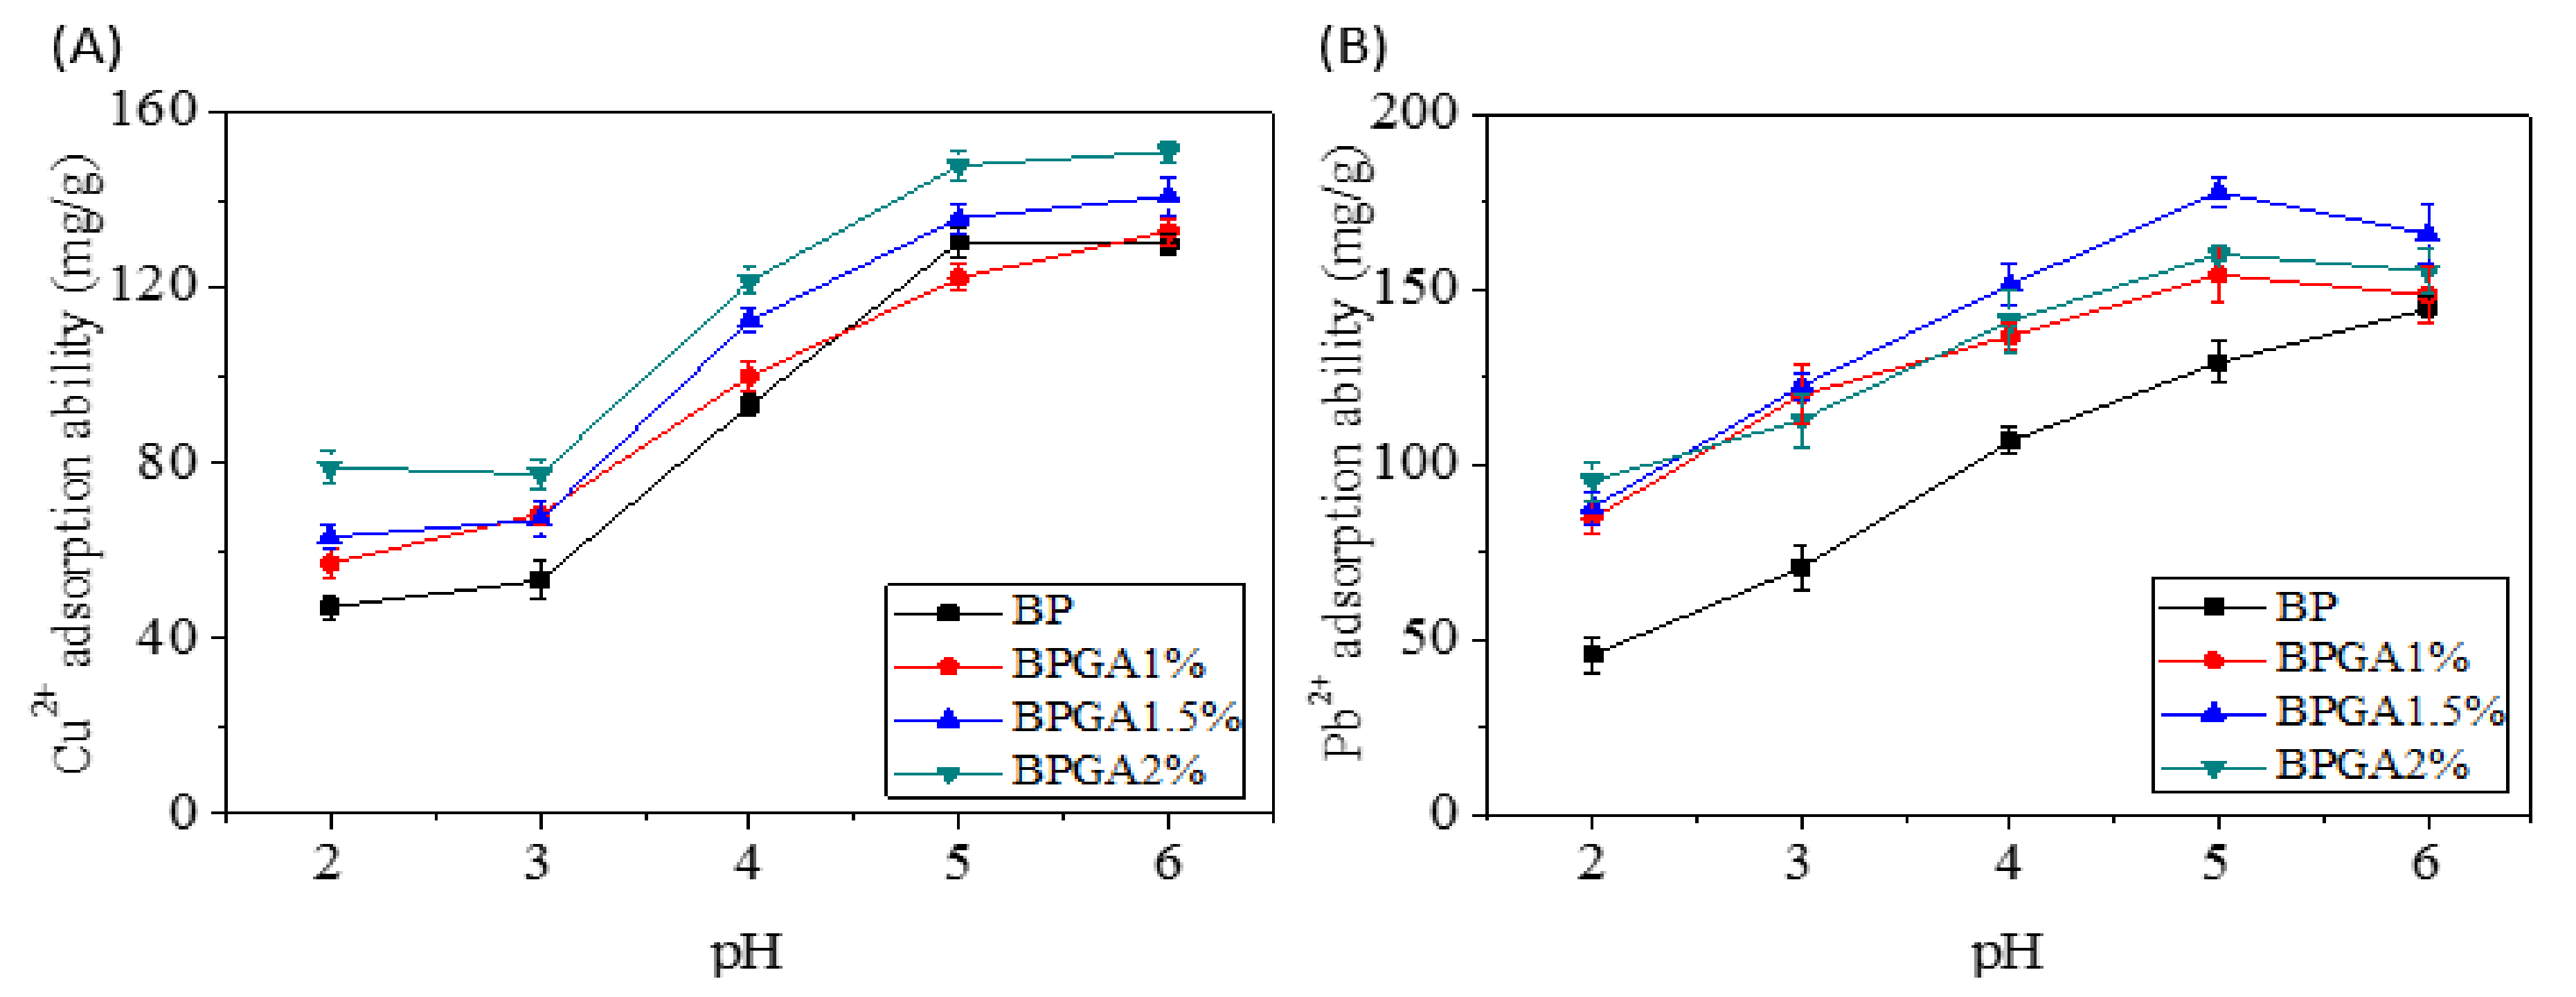
3.6.1. The Effect of pH on the Adsorption Performance
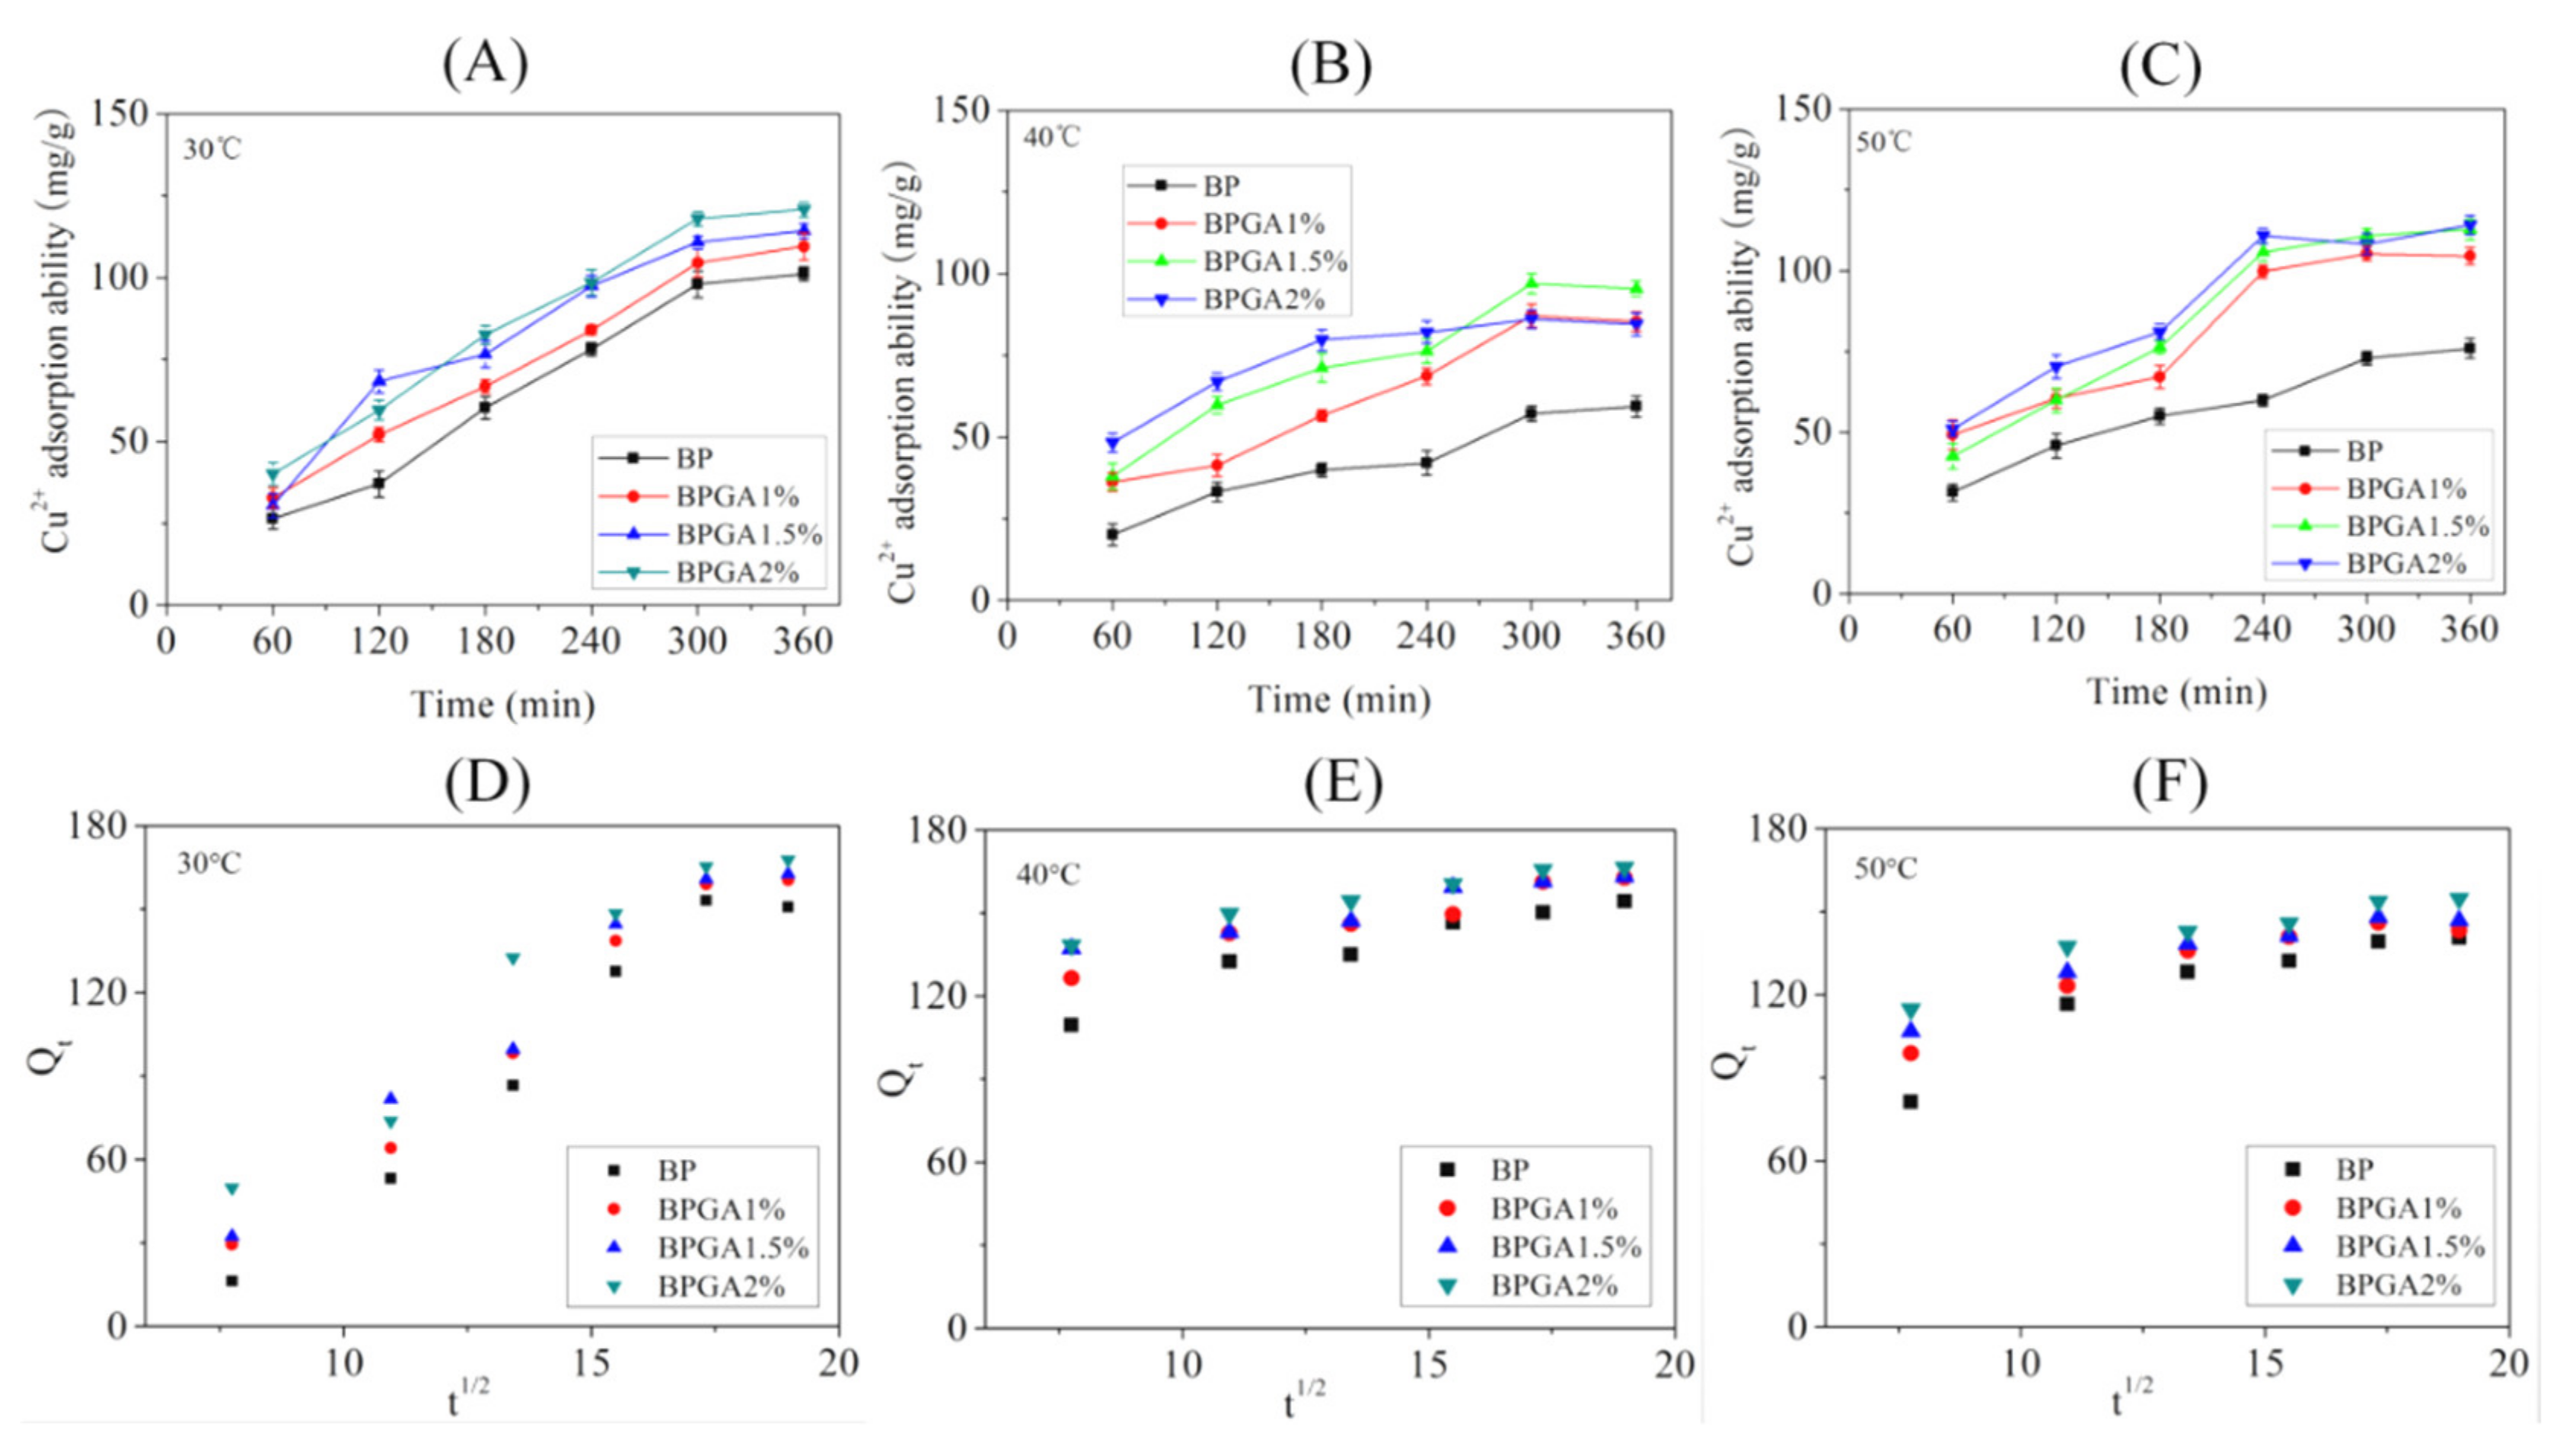
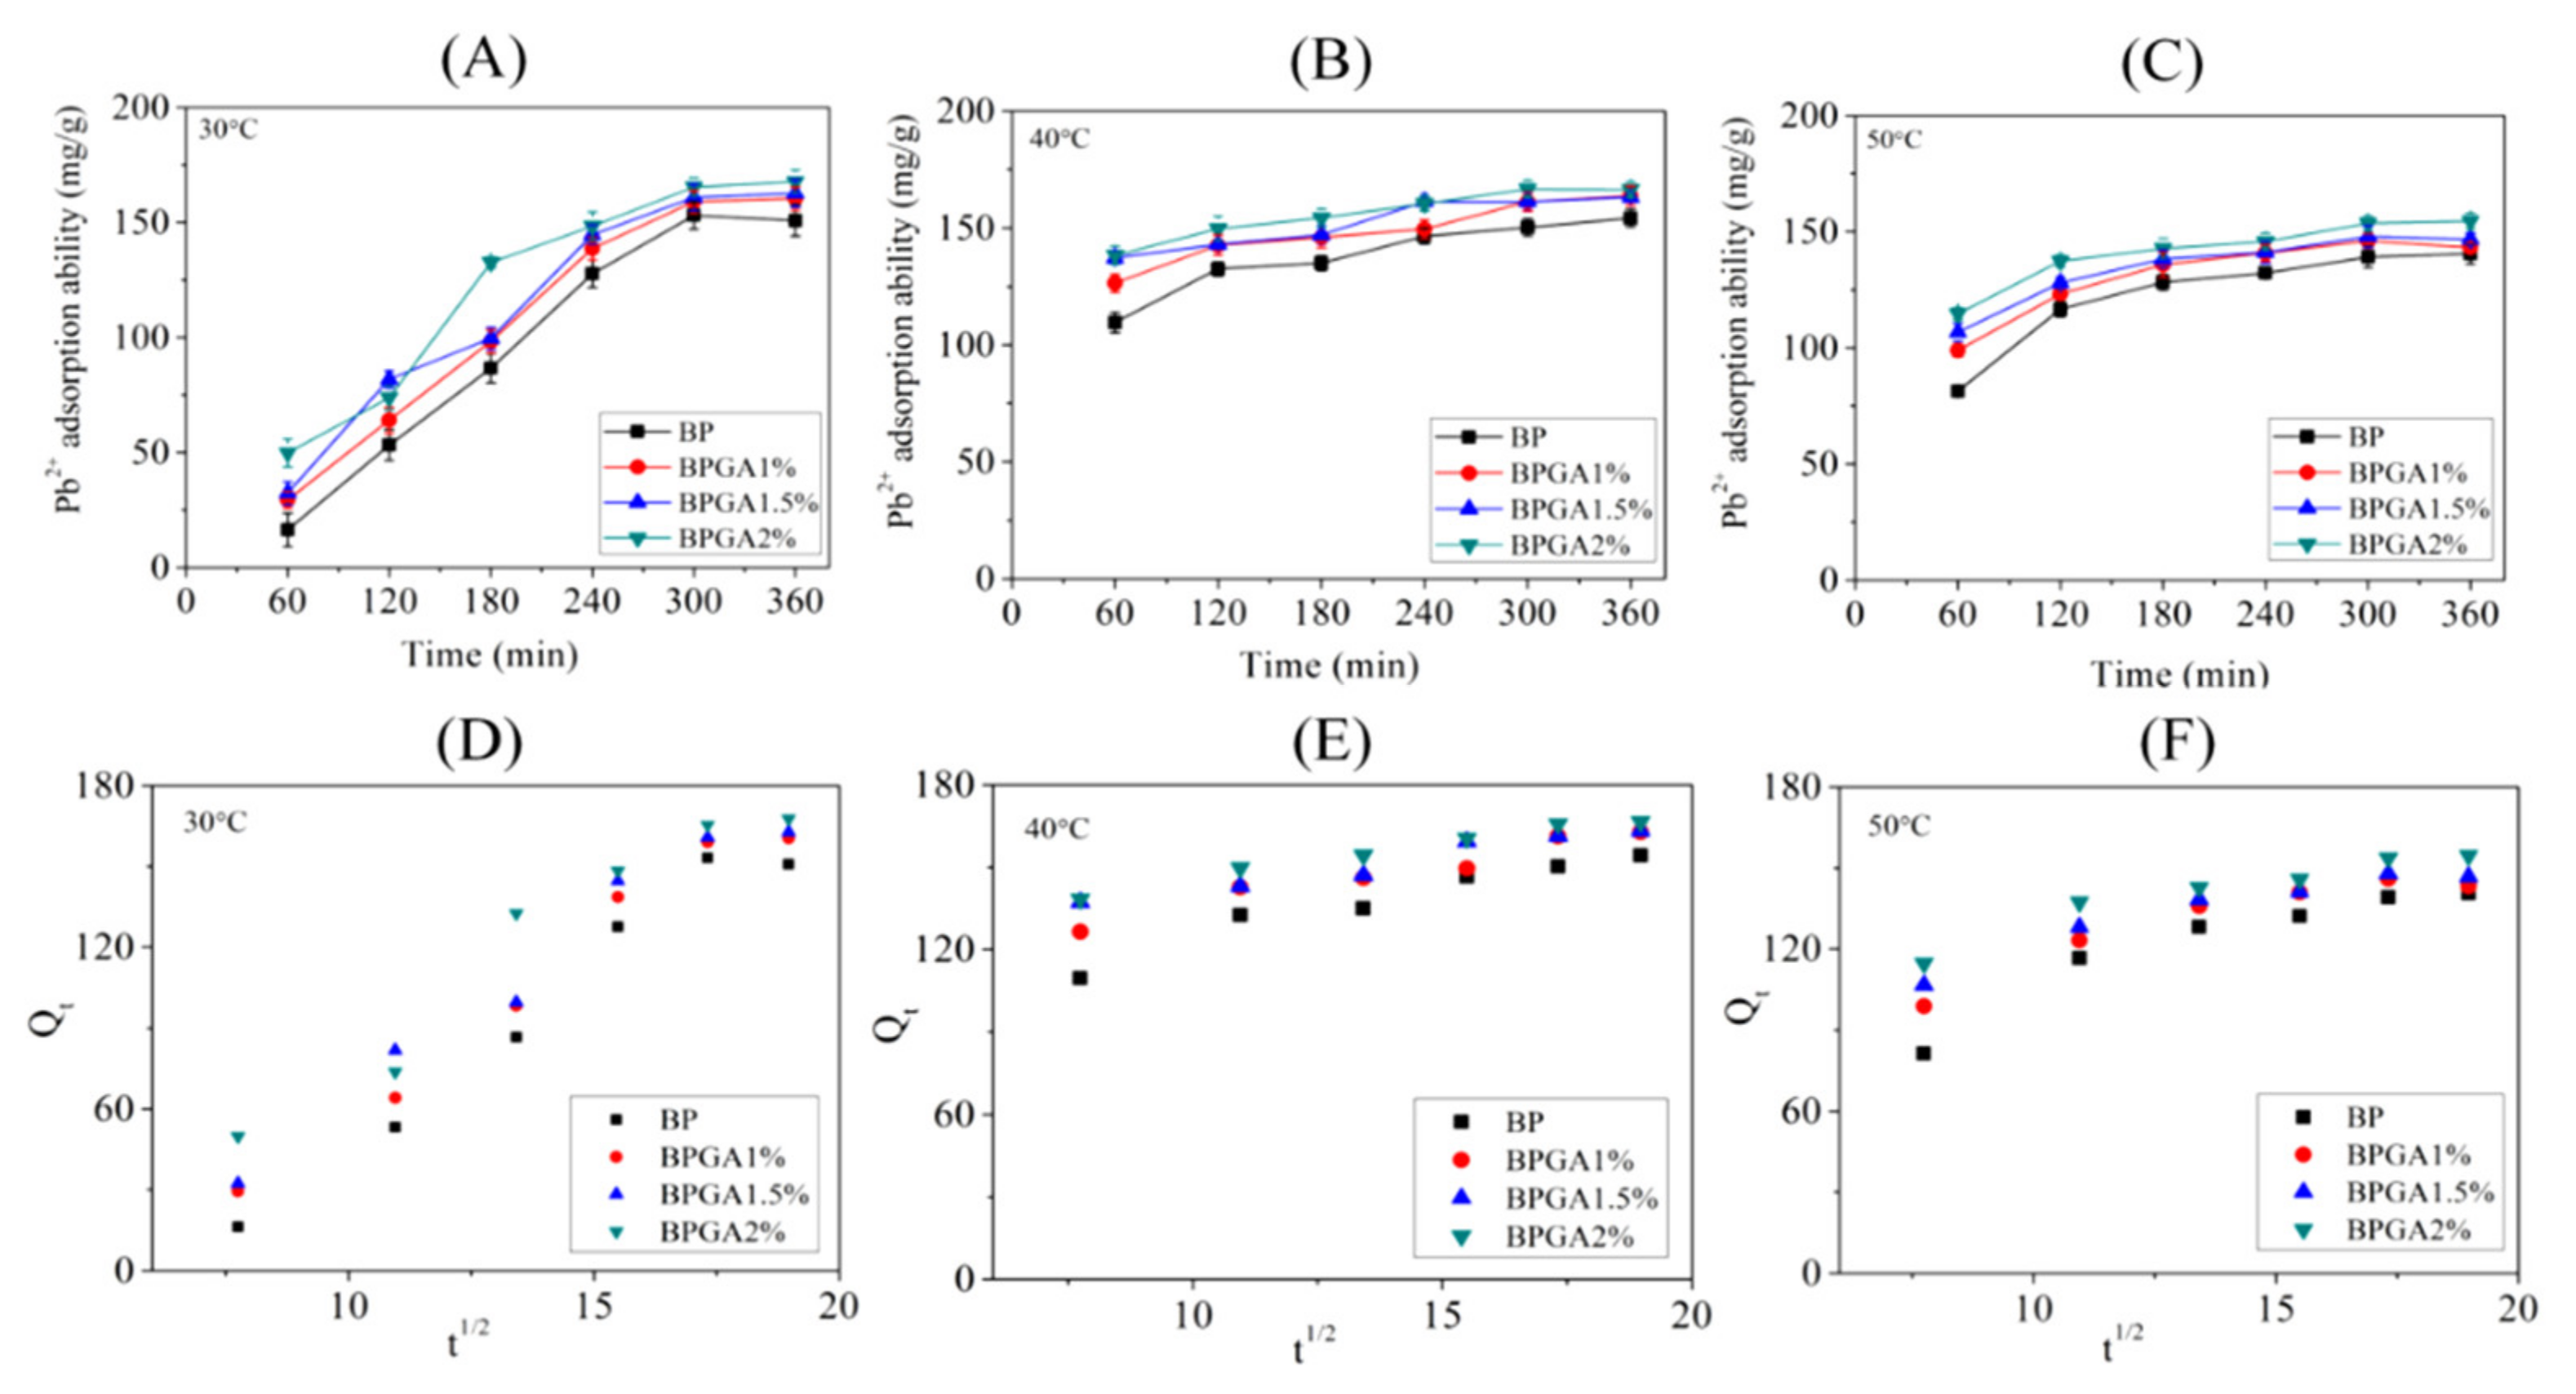
3.6.2. Adsorption Kinetics
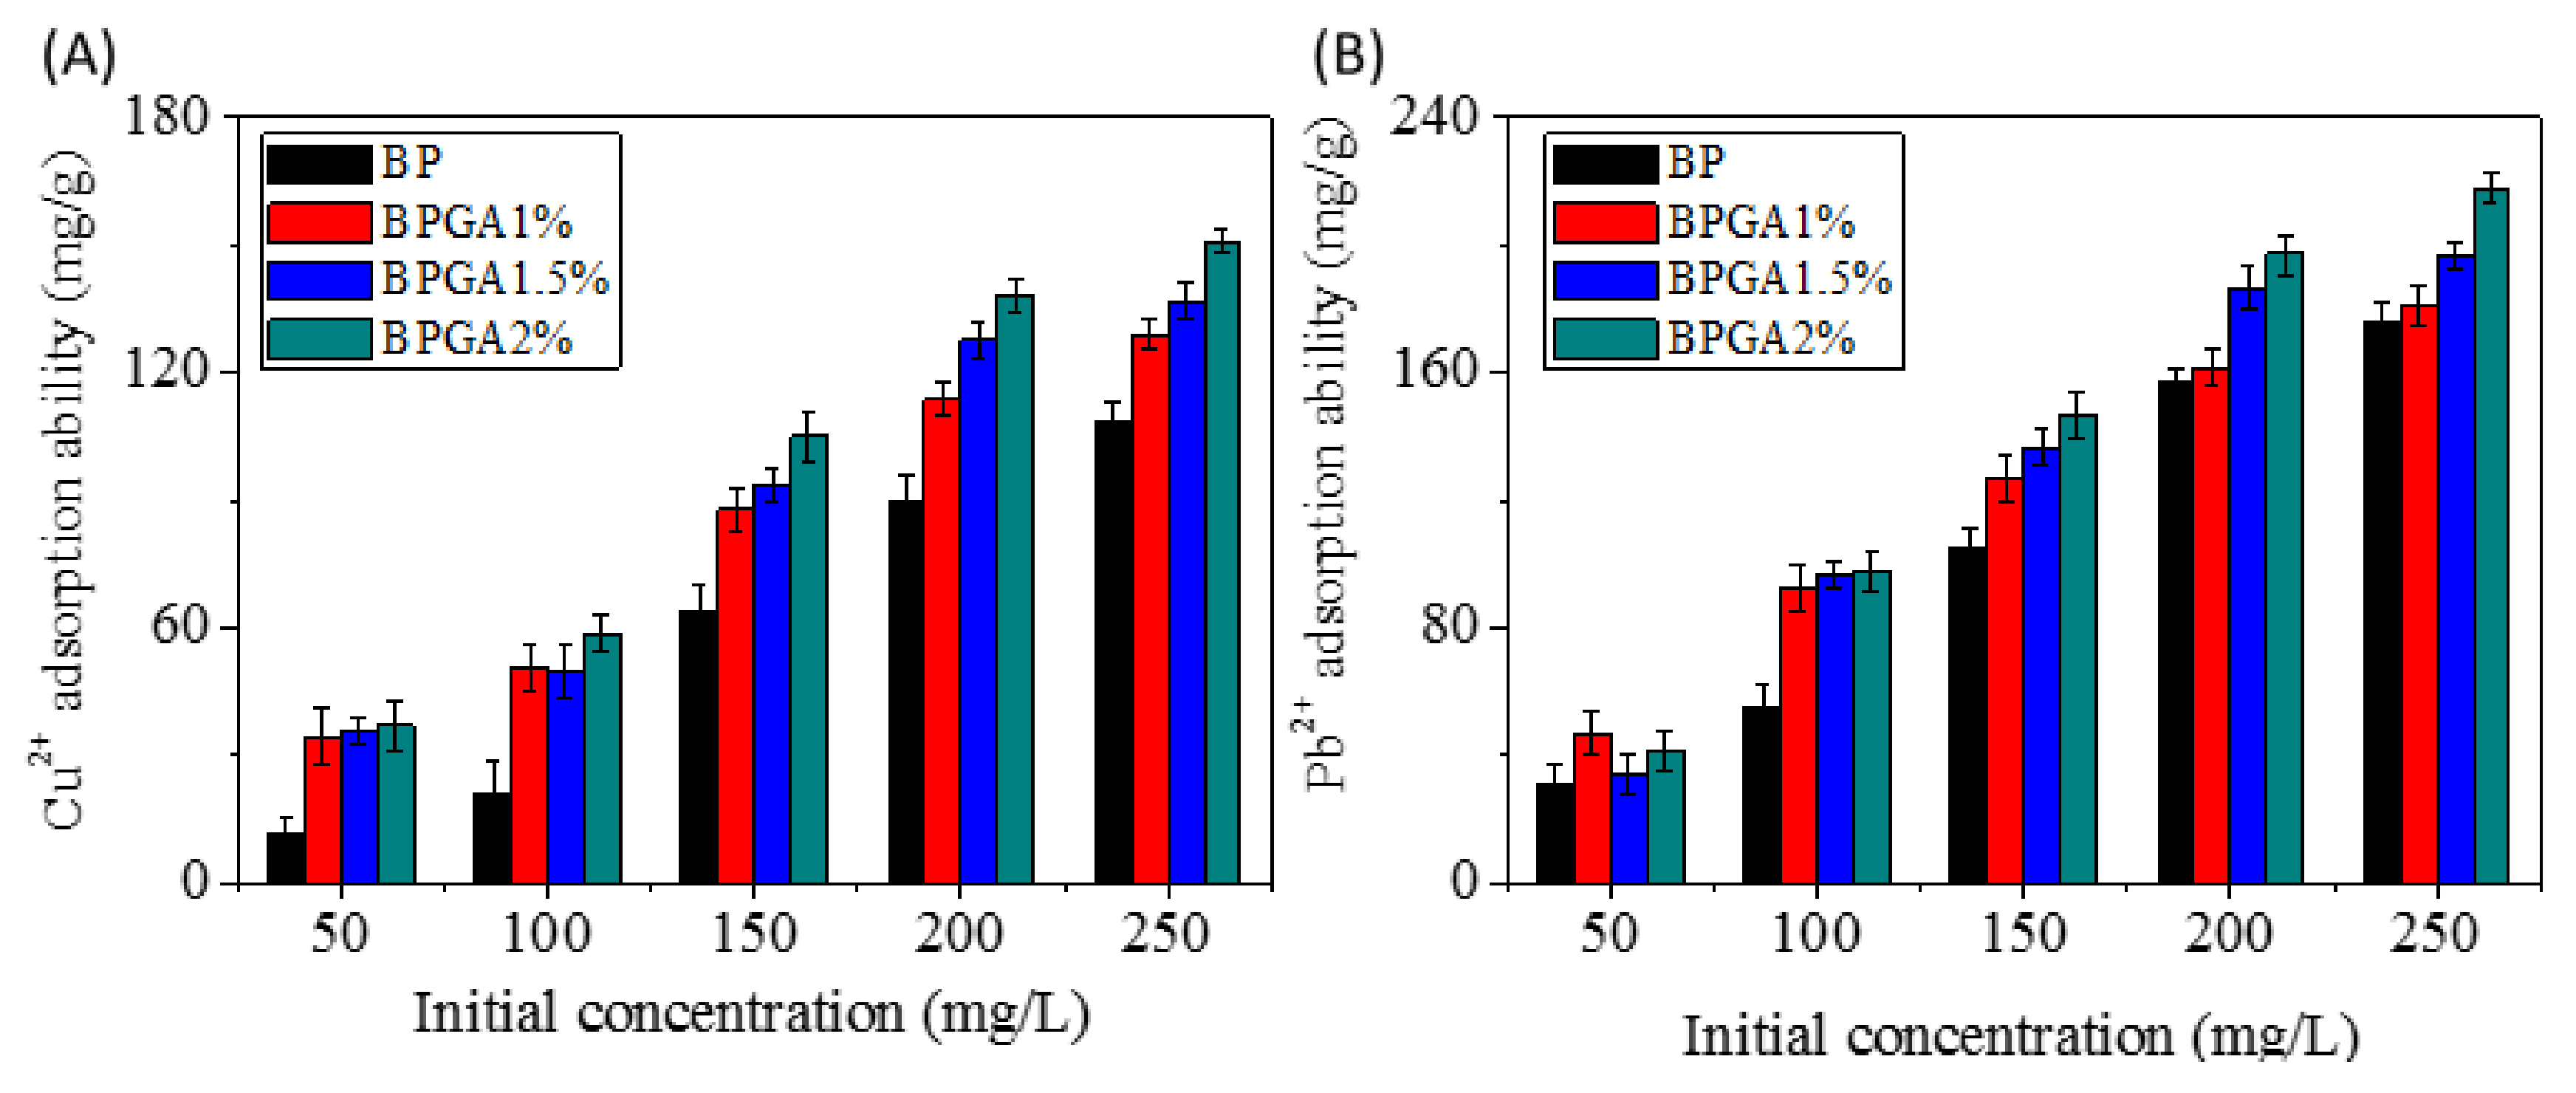
3.6.3. Effect of the Initial Concentration of the Cu2+ and Pb2+ Solution on the Adsorption Performance
3.6.4. Study of the Moderate-Temperature Adsorption Model of the Cu2+ and Pb2+ Ion Adsorption Process
3.6.5. Analysis of the Thermodynamic Parameters during Adsorption of Cu2+ and Pb2+ Ions
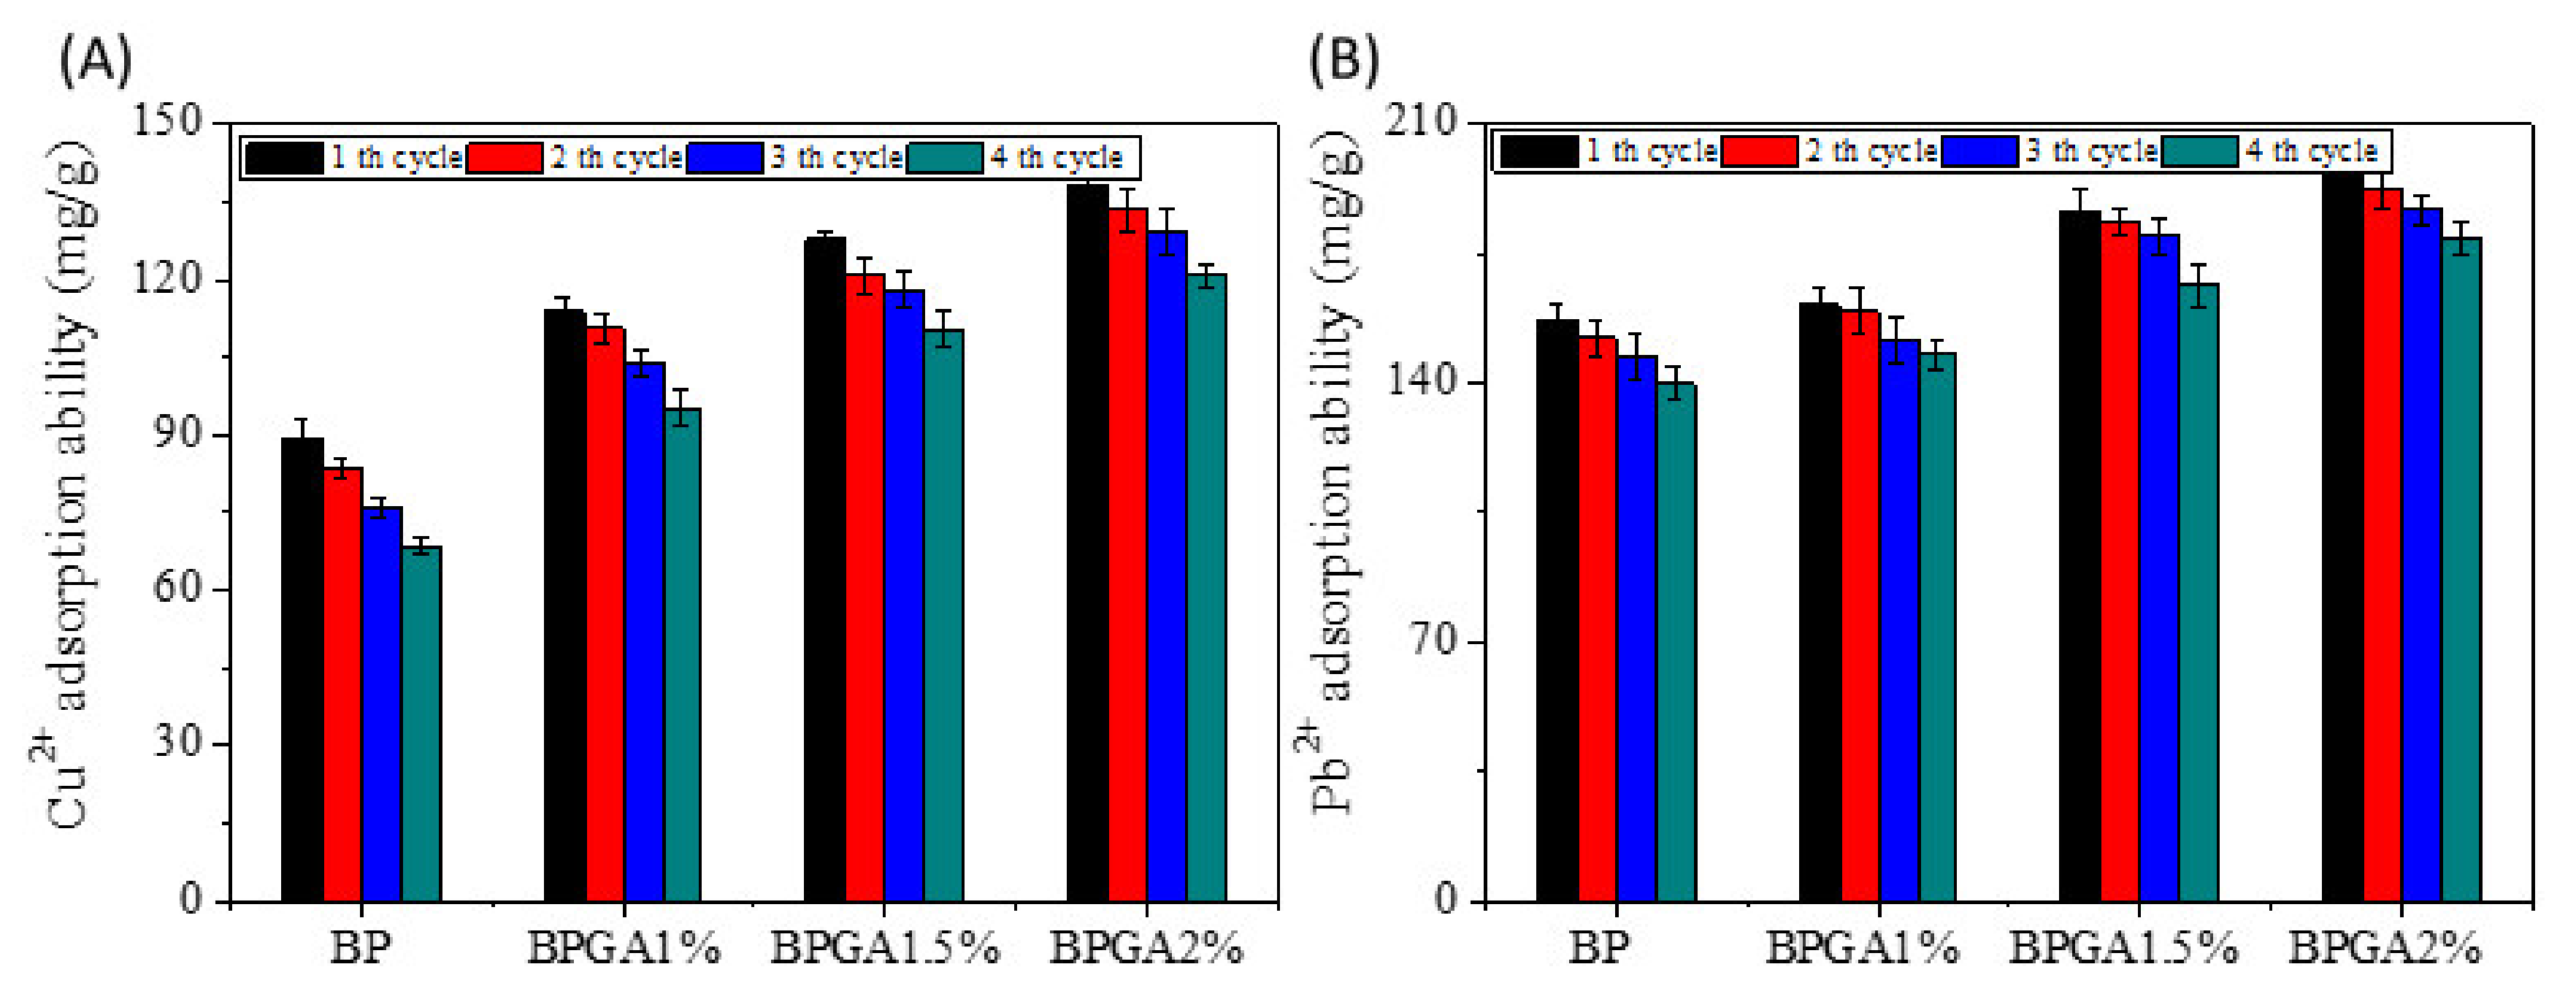
3.6.6. Reuse Performance
4. Conclusions
Author Contributions
Funding
Acknowledgments
Conflicts of Interest
References
- Sharma, S.K. Green Chemistry for Dyes Removal from Wastewater: Research Trends and Applications. Int. J. Environ. Stud. 2015, 73, 1044–1045. [Google Scholar]
- Wang, C.-Y.; Zeng, W.-J.; Jiang, T.-T.; Chen, X.; Zhang, X. Incorporating attapulgite nanorods into graphene oxide nanofiltration membranes for efficient dyes wastewater treatment. Sep. Purif. Technol. 2019, 214, 21–30. [Google Scholar] [CrossRef]
- Cataldo, S.; Lazzara, G.; Massaro, M.; Muratore, N.; Pettignano, A.; Riela, S. Functionalized halloysite nanotubes for enhanced removal of lead(II) ions from aqueous solutions. Appl. Clay Sci. 2018, 156, 87–95. [Google Scholar] [CrossRef]
- Ge, Q.; Tian, Q.; Moeen, M.; Wang, S. Facile Synthesis of Cauliflflower Leaves Biochar at Low Temperature in the Air Atmosphere for Cu(II) and Pb(II) Removal from Water. Materials 2020, 13, 3163. [Google Scholar] [CrossRef] [PubMed]
- Ye, C.-C.; Zhao, F.-Y.; Wu, J.-K.; Weng, X.-D.; Zheng, P.-Y.; Mi, Y.-F.; An, Q.-F.; Gao, C.-J. Sulfated polyelectrolyte complex nanoparticles structured nanoflitration membrane for dye desalination. Chem. Eng. J. 2017, 307, 526–536. [Google Scholar] [CrossRef]
- Mondal, M.; De, S. Treatment of textile plant effluent by hollow fiber nanofiltration membrane and multi-component steady state modeling. Chem. Eng. J. 2016, 285, 304–318. [Google Scholar] [CrossRef]
- Werber, J.; Osuji, C.O.; Elimelech, M. Materials for next-generation desalination and water purification membranes. Nat. Rev. Mater. 2016, 1, 16018. [Google Scholar] [CrossRef]
- Wang, F.; Pan, Y.; Cai, P.; Guo, T.; Xiao, H. Single and binary adsorption of heavy metal ions from aqueous solutions using sugarcane cellulose-based adsorbent. Bioresour. Technol. 2017, 241, 482–490. [Google Scholar] [CrossRef] [PubMed]
- Jin, X.; Xiang, Z.; Liu, Q.; Chen, Y.; Lu, F. Polyethyleneimine-bacterial cellulose bioadsorbent for effective removal of copper and lead ions from aqueous solution. Bioresour. Technol. 2017, 244, 844–849. [Google Scholar] [CrossRef]
- Yakout, A.A.; El-Sokkary, R.H.; Shreadah, M.A.; Hamid, O.G.A. Cross-linked graphene oxide sheets via modified extracted cellulose with high metal adsorption. Carbohydr. Polym. 2017, 172, 20–27. [Google Scholar] [CrossRef]
- Ramteke, L.P.; Gogate, P.R. Treatment of water containing heavy metals using a novel approach of immobilized modified sludge biomass based adsorbents. Sep. Purif. Technol. 2016, 163, 215–227. [Google Scholar] [CrossRef]
- Yang, R.; Li, H.; Huang, M.; Yang, H.; Li, A. A review on chitosan-based flocculants and their applications in water treatment. Water Res. 2016, 95, 59–89. [Google Scholar] [CrossRef] [PubMed]
- Tao, X.; Li, K.; Yan, H.; Yang, H.; Li, A. Simultaneous removal of acid green 25 and mercury ions from aqueous solutions using glutamine modified chitosan magnetic composite microspheres. Environ. Pollut. 2016, 209, 21–29. [Google Scholar] [CrossRef] [PubMed]
- Sun, X.; Yang, L.; Li, Q.; Zhao, J.; Li, X.; Wang, X.; Liu, H. Amino-functionalized magnetic cellulose nanocomposite as adsorbent for removal of Cr(VI): Synthesis and adsorption studies. Chem. Eng. J. 2014, 241, 175–183. [Google Scholar] [CrossRef]
- Li, Y.; Li, L.; Cao, L.; Yang, C. Promoting dynamic adsorption of Pb2+, in a single pass flow using fibrous nano-TiO2/cellulose membranes. Chem. Eng. J. 2016, 283, 1145–1153. [Google Scholar] [CrossRef]
- Miretzky, P.; Cirelli, A.F. Cr(VI) and Cr(III) removal from aqueous solution by raw and modified lignocellulosic materials: A review. J. Hazard. Mater. 2010, 180, 1–19. [Google Scholar] [CrossRef]
- Chen, S.; Huang, Y. Bacterial cellulose nanofibers decorated with phthalocyanine: Preparation, characterization and dye removal performance. Mater. Lett. 2015, 142, 235–237. [Google Scholar] [CrossRef]
- Oshima, T.; Kondo, K.; Ohto, K.; Inoue, K.; Baba, Y. Preparation of phosphorylated bacterial cellulose as an adsorbent for metal ions. React. Funct. Polym. 2008, 68, 376–383. [Google Scholar] [CrossRef]
- Shen, W.; Zhang, M.; Shi, S.; Li, X.; Zhang, X.; Hu, W.; Wang, H. Adsorption of Cu(II) and Pb(II) onto diethylenetriamine-bacterial cellulose. Carbohydr. Polym. 2009, 75, 110–114. [Google Scholar] [CrossRef]
- Ion, V.A.; Pârvulescu, O.C.; Dobre, T. Volatile organic compounds adsorption onto neat and hybrid bacterial cellulose. Appl. Surf. Sci. 2015, 335, 137–146. [Google Scholar] [CrossRef]
- Li, G.; Sun, K.; Li, D.; Lv, P.; Wang, Q.; Huang, F.; Wei, Q. Biosensor based on bacterial cellulose-Au nanoparticles electrode modified with laccase for hydroquinone detection. Colloids Surf. A Physicochem. Eng. Asp. 2016, 509, 408–414. [Google Scholar] [CrossRef]
- Stoica-Guzun, A.; Stroescu, M.; Jinga, S.I.; Mihalache, N.; Botez, A.; Matei, C.; Berger, D.; Damian, C.M.; Ionita, V.; Cristian, M. Box-Behnken experimental design for chromium(VI) ions removal by bacterial cellulose-magnetite composites. Int. J. Biol. Macromol. 2016, 91, 1062–1072. [Google Scholar] [CrossRef] [PubMed]
- Kim, T.H.; An, D.B.; Oh, S.H.; Kang, M.K.; Song, H.H.; Lee, J.H. Creating stiffness gradient polyvinyl alcohol hydrogel using a simple gradual freezing–thawing method to investigate stem cell differentiation behaviors. Biomaterials 2015, 40, 51–60. [Google Scholar] [CrossRef] [PubMed]
- Deshmukh, K.; Ahamed, M.B.; Deshmukh, K.; Bhagat, P.R.; Pasha, S.K.K.; Bhagat, A.; Shirbhate, R.; Telare, F.; Lakhani, C. Influence of K2CrO4Doping on the Structural, Optical and Dielectric Properties of Polyvinyl Alcohol/K2CrO4Composite Films. Polym. Technol. Eng. 2016, 55, 231–241. [Google Scholar] [CrossRef]
- Fernández, P.S.; Rozada, R.; Paredes, J.I.; Villar-Rodil, S.; Fernández-Merino, M.; Guardia, L.; Martínez-Alonso, A.; Tascón, J.M.D. Chemical and microscopic analysis of graphene prepared by different reduction degrees of graphene oxide. J. Alloys Compd. 2012, 536, S532–S537. [Google Scholar] [CrossRef] [Green Version]
- Kyzas, G.Z.; Deliyanni, E.A.; Matis, K.A. Graphene oxide and its application as an adsorbent for wastewater treatment. J. Chem. Technol. Biotechnol. 2014, 89, 196–205. [Google Scholar] [CrossRef]
- Kyzas, G.Z.; Deliyanni, E.A.; Bikiaris, D.N.; Mitropoulos, A. Graphene composites as dye adsorbents: Review. Chem. Eng. Res. Des. 2018, 129, 75–88. [Google Scholar] [CrossRef]
- Travlou, N.A.; Kyzas, G.Z.; Lazaridis, N.K.; Deliyanni, E.A. Graphite oxide/chitosan composite for reactive dye removal. Chem. Eng. J. 2013, 217, 256–265. [Google Scholar] [CrossRef]
- Dai, H.; Huang, Y.; Huang, H. Eco-friendly polyvinyl alcohol/carboxymethyl cellulose hydrogels reinforced with graphene oxide and bentonite for enhanced adsorption of methylene blue. Carbohydr. Polym. 2018, 185, 1–11. [Google Scholar] [CrossRef]
- García-Romero, E.; Suárez, M. Sepiolite–palygorskite: Textural study and genetic considerations. Appl. Clay Sci. 2013, 86, 129–144. [Google Scholar] [CrossRef]
- Frost, R.L.; Xi, Y.; He, H. Synthesis, characterization of palygorskite supported zero-valent iron and its application for methylene blue adsorption. J. Colloid Interface Sci. 2010, 341, 153–161. [Google Scholar] [CrossRef] [PubMed] [Green Version]
- Sheikhhosseini, A.; Shirvani, M.; Shariatmadari, H.; Zvomuya, F.; Najafic, B. Kinetics and thermodynamics of nickel sorption to calcium-alygorskite and calcium-epiolite: A batch study. Geodermas 2014, 217–218, 111–117. [Google Scholar] [CrossRef]
- Wang, Y.; Feng, Y.; Zhang, X.-F.; Zhang, X.; Jiang, J.; Yao, J. Alginate-based attapulgite foams as efficient and recyclable adsorbents for the removal of heavy metals. J. Colloid Interface Sci. 2018, 514, 190–198. [Google Scholar] [CrossRef] [PubMed]
- Zhang, Z.; Wang, W.; Wang, A. Highly effective removal of Methylene Blue using functionalized attapulgite via hydrothermal process. J. Environ. Sci. 2015, 33, 106–115. [Google Scholar] [CrossRef]
- Hestrin, S.; Schramm, M. Synthesis of cellulose by Acetobacter xylinum. 2. Preparation of freeze-dried cells capable of polymerizing glucose to cellulose. Biochem. J. 1954, 58, 345–352. [Google Scholar] [CrossRef] [Green Version]
- Hummers, W.; Offeman, R.E. Preparation of graphitic oxide. J. Am. Chem. Soc. 1958, 80, 1339. [Google Scholar] [CrossRef]
- Wang, W.; Tian, G.; Zhang, Z.; Wang, A. A simple hydrothermal approach to modify palygorskite for high-efficient adsorption of Methylene blue and Cu(II) ions. Chem. Eng. J. 2015, 265, 228–238. [Google Scholar] [CrossRef]
- Qiao, K.; Zheng, Y.; Guo, S.; Tan, J.; Chen, X.; Li, J.; Xu, D.; Wang, J. Hydrophilic nanofiber of bacterial cellulose guided the changes in the micro-structure and mechanical properties of nf-BC/PVA composites hydrogels. Compos. Sci. Technol. 2015, 118, 47–54. [Google Scholar] [CrossRef]
- Kuila, U.; Prasad, M.; Derkowski, A.; McCarty, D.K. Compositional controls on mud rock pore-size distribution: An example from niobrara formation. In Proceedings of the SPE Annual Technical Conference and Exhibition, San Antonio, TX, USA, 8–10 October 2012. [Google Scholar]
- Boruah, A.; Rasheed, A.; Mendhe, V.A.; Ganapathi, S. Specific surface area and pore size distribution in gas shales of Raniganj Basin, India. J. Pet. Explor. Prod. Technol. 2019, 9, 1041–1050. [Google Scholar] [CrossRef] [Green Version]
- Kuila, U.; Prasad, M. Specific surface area and pore-size distribution in clays and shales. Geophys. Prospect. 2013, 61, 341–362. [Google Scholar] [CrossRef]
- Chaukura, N.; Murimba, E.C.; Gwenzi, W. Synthesis, characterisation and methyl orange adsorption capacity of ferric oxide–biochar nano-composites derived from pulp and paper sludge. Appl. Water Sci. 2017, 7, 2175–2186. [Google Scholar] [CrossRef] [Green Version]
- Liu, X.; Xu, X.; Sun, J.; Alsaedi, A.; Hayat, T.; Li, J.; Wang, X. Insight into the impact of interaction between attapulgite and graphene oxide on the adsorption of U(VI). Chem. Eng. J. 2018, 343, 217–224. [Google Scholar] [CrossRef]
- Wang, X.; Guo, C.; Hao, W.; Ullah, N.; Chen, L.; Li, Z.; Feng, X. Development and characterization of agar-based edible films reinforced with nano-bacterial cellulose. Int. J. Biol. Macromol. 2018, 118, 722–730. [Google Scholar] [CrossRef] [PubMed]
- Dai, H.; Ou, S.; Liu, Z.; Huang, H. Pineapple peel carboxymethyl cellulose/polyvinyl alcohol/mesoporous silica SBA-15 hydrogel composites for papain immobilization. Carbohydr. Polym. 2017, 169, 504–514. [Google Scholar] [CrossRef] [PubMed]
- Liu, D.; Bian, Q.; Li, Y.; Wang, Y.; Tian, H.; Tian, H. Effect of oxidation degrees of graphene oxide on the structure and properties of poly (vinyl alcohol) composite films. Compos. Sci. Technol. 2016, 129, 146–152. [Google Scholar] [CrossRef]
- Du, R.; Zhao, F.; Peng, Q.; Zhou, Z.; Han, Y. Production and characterization of bacterial cellulose produced by Gluconacetobacter xylinus isolated from Chinese persimmon vinegar. Carbohydr. Polym. 2018, 194, 200–207. [Google Scholar] [CrossRef]
- Abral, H.; Hartono, A.; Hafizulhaq, F.; Handayani, D.; Sugiarti, E.; Pradipta, O. Characterization of PVA/cassava starch biocomposites fabricated with and without sonication using bacterial cellulose fifiber loadings. Carbohydr. Polym. 2019, 206, 593–601. [Google Scholar] [CrossRef]
- Guan, Y.; Bian, J.; Peng, F.; Zhang, X.; Sun, R.-C. High strength of hemicelluloses based hydrogels by freeze/thaw technique. Carbohydr. Polym. 2014, 101, 272–280. [Google Scholar] [CrossRef]
- Wang, Y.; Zhou, R.; Wang, C.; Zhou, G.; Hua, C.; Cao, Y.; Song, Z. Novel environmental-friendly nano-composite magnetic attapulgite functionalized by chitosan and EDTA for cadmium (II) removal. J. Alloys Compd. 2020, 817, 153286. [Google Scholar] [CrossRef]
- Oh, S.Y.; Yoo, D.I.; Shin, Y.; Kim, H.C.; Kim, H.Y.; Chung, Y.S.; Park, W.H.; Youk, J.H. Crystalline structure analysis of cellulose treated with sodium hydroxide and carbon dioxide by means of X-ray diffraction and FTIR spectroscopy. Carbohydr. Res. 2005, 340, 2376–2391. [Google Scholar] [CrossRef]
- Bourlinos, A.B.; Gournis, D.; Petridis, D.; Szabó, T.; Szeri, A.; Dékány, I. Graphite Oxide: Chemical Reduction to Graphite and Surface Modification with Primary Aliphatic Amines and Amino Acids. Langmuir 2003, 19, 6050–6055. [Google Scholar] [CrossRef]
- Guo, Y.; Yang, S.; Fu, W.; Qi, J.; Li, R.; Wang, Z.; Xu, H. Adsorption of malachite green on micro- and mesoporous rice husk-based active carbon. Dyes Pigments 2003, 56, 219–229. [Google Scholar] [CrossRef]
- Kruk, M.; Jaroniec, M. Gas Adsorption Characterization of Ordered Organic−Inorganic Nanocomposite Materials. Chem. Mater. 2001, 13, 3169–3183. [Google Scholar] [CrossRef]
- Stoeckli, F.; Centeno, T. On the determination of surface areas in activated carbons. Carbon 2005, 43, 1184–1190. [Google Scholar] [CrossRef] [Green Version]
- Liu, X.; Luo, J.; Zhu, Y.; Yang, Y.; Yang, S. Removal of methylene blue from aqueous solutions by an adsorbent based on metal-organic framework and polyoxometalate. J. Alloys Compd. 2015, 648, 986–993. [Google Scholar] [CrossRef]
- Vijayalakshmi, K.; Devi, B.M.; Latha, S.; Gomathi, T.; Sudha, P.; Venkatesan, J.; Anil, S. Batch adsorption and desorption studies on the removal of lead (II) from aqueous solution using nanochitosan/sodium alginate/microcrystalline cellulose beads. Int. J. Biol. Macromol. 2017, 104, 1483–1494. [Google Scholar] [CrossRef]
- Wang, W.; Tian, G.; Zhang, Z.; Wang, A. From naturally low-grade palygorskite to hybrid silicate adsorbent for efficient capture of Cu(II) ions. Appl. Clay Sci. 2016, 132, 438–448. [Google Scholar] [CrossRef]
- Liu, Y.; Wang, W.; Wang, A. Adsorption of lead ions from aqueous solution by using carboxymethyl cellulose-g-poly (acrylic acid)/attapulgite hydrogel composites. Desalination 2010, 259, 258–264. [Google Scholar] [CrossRef]
- Chen, S.; Zou, Y.; Yan, Z.; Shen, W.; Shi, S.; Zhang, X.; Wang, H. Carboxymethylated-bacterial cel-lulose for copper and lead ion removal. J. Hazard. Mater. 2009, 161, 1355–1359. [Google Scholar] [CrossRef]
- Luo, J.; Fan, C.; Xiao, Z.; Sun, T.; Zhou, X. Novel graphene oxide/carboxymethyl chitosan aerogels via vacuum-assisted self-assembly for heavy metal adsorption capacity. Colloids Surf. A Physicochem. Eng. Asp. 2019, 578, 123584. [Google Scholar] [CrossRef]
- He, Y.Q.; Zhang, N.N.; Wang, X.D. Adsorption of graphene oxide/chitosan porous materials for metal ions. Chin. Chem. Lett. 2011, 22, 859–862. [Google Scholar] [CrossRef]
- Feng, Y.; Wang, Y.; Wang, Y.; Liu, S.; Jiang, J.; Cao, C.; Yao, J. Simple fabrication of easy handling millimeter-sized porous attapulgite/polymer beads for heavy metal removal. J. Colloid Interface Sci. 2017, 502, 52–58. [Google Scholar] [CrossRef] [PubMed]
- Chahkandi, M. Mechanism of Congo red adsorption on new sol-gel-derived hydroxyapatite nano-particle. Mater. Chem. Phys. 2017, 202, 340–351. [Google Scholar] [CrossRef]
- Chen, H.; Wang, A. Adsorption characteristics of Cu (II) from aqueous solution onto poly (acrylamide)/attapulgite composite. J. Hazard. Mater. 2009, 165, 223–231. [Google Scholar] [CrossRef]


| Sample | Qe–Exp (mg/g) | Pseudo-First-Order | Pseudo-Second-Order | Intraparticle Diffusion Model | |||||
|---|---|---|---|---|---|---|---|---|---|
| R2 | Qe,cal (mg/g) | k1 (min−1) | R2 | Qe,cal (mg/g) | k2 (mg/g min−1) | R2 | Kt (mmol·g−1·min−1/2) | ||
| 30 °C (Cu2+) | |||||||||
| BP | 101.10 | 0.8750 | 86.89 | 0.0191 | 0.5309 | 102.56 | 0.82 × 10⁻⁴ | 0.9955 | 7.36 |
| BPGA1% | 109.55 | 0.9203 | 99.54 | 0.0179 | 0.6529 | 109.82 | 0.92 × 10⁻⁴ | 0.9984 | 7.17 |
| BPGA1.5% | 114.31 | 0.9448 | 105.27 | 0.0213 | 0.6154 | 113.33 | 1.1 × 10⁻⁴ | 0.9966 | 7.46 |
| BPGA2% | 120.79 | 0.9086 | 108.48 | 0.0215 | 0.6073 | 121.84 | 0.98 × 10⁻⁴ | 0.9986 | 7.70 |
| 40 °C (Cu2+) | |||||||||
| BP | 59.39 | 0.9039 | 54.72 | 0.0186 | 0.6888 | 60.28 | 1.87 × 10⁻⁴ | 0.9964 | 3.48 |
| BPGA1% | 87.36 | 0.8802 | 77.53 | 0.0215 | 0.4864 | 91.00 | 1.24 × 10⁻⁴ | 0.9946 | 5.04 |
| BPGA1.5% | 97.01 | 0.8980 | 89.15 | 0.0231 | 0.5613 | 98.79 | 1.48 × 10⁻⁴ | 0.9974 | 5.27 |
| BPGA2% | 86.06 | 0.9981 | 86.06 | 0.0307 | 0.3634 | 88.27 | 3.65 × 10⁻⁴ | 0.9960 | 3.27 |
| 50 °C (Cu2+) | |||||||||
| BP | 75.93 | 0.9514 | 72.69 | 0.0200 | 0.7543 | 76.13 | 1.98 × 10⁻⁴ | 0.9991 | 3.99 |
| BPGA1% | 105.22 | 0.9000 | 92.47 | 0.0296 | 0.3910 | 114.48 | 1.15 × 10⁻⁴ | 0.9931 | 5.71 |
| BPGA1.5% | 112.71 | 0.9369 | 101.02 | 0.0256 | 0.4685 | 117.75 | 1.11 × 10⁻⁴ | 0.9958 | 6.94 |
| BPGA2% | 114.15 | 0.9350 | 107.99 | 0.0245 | 0.5692 | 117.48 | 1.43 × 10⁻⁴ | 0.9959 | 6.00 |
| Sample | Qe–Exp (mg/g) | Pseudo-First-Order | Pseudo-Second-Order | Intraparticle Diffusion Model | |||||
|---|---|---|---|---|---|---|---|---|---|
| R2 | Qe,cal (mg/g) | k1 (min−1) | R2 | Qe,cal (mg/g) | k2 (mg/g min−1) | R2 | Kt (mmol·g−1·min−1/2) | ||
| 30 °C (Pb2+) | |||||||||
| BP | 153.10 | 0.8372 | 122.55 | 0.0221 | 0.3726 | 153.42 | 0.44 × 10⁻⁴ | 0.9955 | 13.22 |
| BPGA1% | 160.39 | 0.8415 | 130.24 | 0.0249 | 0.3985 | 164.08 | 0.51 × 10⁻⁴ | 0.9957 | 12.76 |
| BPGA1.5% | 162.65 | 0.8765 | 137.07 | 0.0249 | 0.4275 | 166.18 | 0.58 × 10⁻⁴ | 0.9951 | 12.23 |
| BPGA2% | 167.69 | 0.9225 | 148.23 | 0.0253 | 0.4458 | 171.83 | 0.71 × 10⁻⁴ | 0.9931 | 11.56 |
| 40 °C (Pb2+) | |||||||||
| BP | 154.21 | 0.9039 | 54.72 | 0.0186 | 0.8556 | 154.00 | 3.27 × 10⁻⁴ | 0.9993 | 3.81 |
| BPGA1% | 162.70 | 0.8802 | 77.53 | 0.0215 | 0.8125 | 164.54 | 3.31 × 10⁻⁴ | 0.9996 | 3.13 |
| BPGA1.5% | 163.19 | 0.8980 | 89.15 | 0.0231 | 0.7490 | 165.38 | 4.19 × 10⁻⁴ | 0.9998 | 2.54 |
| BPGA2% | 166.43 | 0.9981 | 86.06 | 0.0307 | 0.7963 | 167.27 | 4.97 × 10⁻⁴ | 0.9999 | 2.55 |
| 50 °C (Pb2+) | |||||||||
| BP | 140.54 | 0.9878 | 140.35 | 0.0322 | 0.6870 | 140.05 | 2.92 × 10⁻⁴ | 0.9966 | 4.98 |
| BPGA1% | 145.99 | 0.9949 | 149.70 | 0.0321 | 0.7598 | 145.26 | 3.77 × 10⁻⁴ | 0.9985 | 4.05 |
| BPGA1.5% | 147.96 | 0.9880 | 151.16 | 0.0347 | 0.7675 | 147.67 | 4.18 × 10⁻⁴ | 0.9991 | 3.56 |
| BPGA2% | 154.58 | 0.9736 | 158.12 | 0.0351 | 0.7949 | 154.69 | 4.11 × 10⁻⁴ | 0.9992 | 3.36 |
| Adsorbents | Heavy Mental Ions | Adsorption Capacity (mg/g) | Reference |
|---|---|---|---|
| BC | Cu and Pb | 9.67 and 22.56 | [60] |
| CMBC | Cu and Pb | 12.63 and 60.42 | [60] |
| CMC/GO | Cu | 95.37 | [61] |
| GO/CS | Pb | 99 | [62] |
| ATP/PES | Cu | 25.3 | [63] |
| SA/APT | Cu | 119 | [33] |
| This work | Cu and Pb | 150.79 and 217.81 | - |
| Sample | Langmuir | Freundlich | Temkin | ||||||
|---|---|---|---|---|---|---|---|---|---|
| R2 | Qmax (mg/g) | KL (L/mg) | R2 | KF (mg/g)(L/mg)1/n | n | R2 | KT (L/g) | bT (J/mol) | |
| Cu2+ | |||||||||
| BP | 0.9040 | - | - | 0.9925 | 0.0116 | 0.54 | 0.9412 | 0.0256 | 32.7004 |
| BPGA1% | 0.9679 | 283.88 | 0. 0067 | 0.9987 | 4.9822 | 1.48 | 0.9745 | 0.1069 | 53.6006 |
| BPGA1.5% | 0.9319 | 315.49 | 0.0065 | 0.9972 | 5.3215 | 1.46 | 0.9563 | 0.1153 | 50.0054 |
| BPGA2% | 0.9981 | - | - | 0.9999 | 1.0525 | 0.99 | 0.9979 | 0.0417 | 30.4552 |
| Pb2+ | |||||||||
| BP | 0.8891 | - | - | 0.9937 | 0.7393 | 0.78 | 0.9133 | 0.0675 | 24.7694 |
| BPGA1% | 0.9983 | 206.39 | 0.0937 | 0.9996 | 34.7633 | 2.44 | 0.9988 | 1.1320 | 60.7305 |
| BPGA1.5% | 0.6402 | 267.66 | 0.0326 | 0.9831 | 66.2883 | 5.12 | 0.8612 | 4.9339 | 81.6019 |
| BPGA2% | 0.6973 | 252.81 | 0.0926 | 0.9849 | 104.4456 | 12.08 | 0.8410 | 179.3227 | 124.7592 |
| Sample | ΔG0 (J/mol) | ΔH0 (J/mol) | ΔS0 (J/mol−1·k) | R2 | |||
|---|---|---|---|---|---|---|---|
| 303 K | 313 K | 323 K | |||||
| Cu2+ | |||||||
| BP | −55.47 | −44.11 | −19.53 | −21433.75 | −72.18 | 0.7405 | |
| BPGA1% | −482.63 | −75.66 | −280.88 | −3892.62 | −12.33 | 0.4360 | |
| BPGA1.5% | −726.52 | −155.59 | −686.91 | −1613.94 | −3.81 | 0.5191 | |
| BPGA2% | −1063.66 | −730.51 | −765.19 | −6135.45 | −18.42 | 0.2128 | |
| Pb2+ | |||||||
| BP | −2981.85 | −3161.13 | −2310.79 | −12982.00 | −32.46 | 0.9928 | |
| BPGA1% | −3525.01 | −3834.60 | −2671.68 | −16214.46 | −41.10 | 0.9898 | |
| BPGA1.5% | −3707.99 | −3877.31 | −2807.23 | −17154.83 | −43.72 | 0.9931 | |
| BPGA2% | −4150.19 | −4167.74 | −3291.18 | −17021.82 | −41.99 | 0.9971 | |
© 2020 by the authors. Licensee MDPI, Basel, Switzerland. This article is an open access article distributed under the terms and conditions of the Creative Commons Attribution (CC BY) license (http://creativecommons.org/licenses/by/4.0/).
Share and Cite
Song, S.; Liu, Z.; Zhang, J.; Jiao, C.; Ding, L.; Yang, S. Synthesis and Adsorption Properties of Novel Bacterial Cellulose/Graphene Oxide/Attapulgite Materials for Cu and Pb Ions in Aqueous Solutions. Materials 2020, 13, 3703. https://0-doi-org.brum.beds.ac.uk/10.3390/ma13173703
Song S, Liu Z, Zhang J, Jiao C, Ding L, Yang S. Synthesis and Adsorption Properties of Novel Bacterial Cellulose/Graphene Oxide/Attapulgite Materials for Cu and Pb Ions in Aqueous Solutions. Materials. 2020; 13(17):3703. https://0-doi-org.brum.beds.ac.uk/10.3390/ma13173703
Chicago/Turabian StyleSong, Shen, Zhao Liu, Ji Zhang, Caizhen Jiao, Ling Ding, and Shengrong Yang. 2020. "Synthesis and Adsorption Properties of Novel Bacterial Cellulose/Graphene Oxide/Attapulgite Materials for Cu and Pb Ions in Aqueous Solutions" Materials 13, no. 17: 3703. https://0-doi-org.brum.beds.ac.uk/10.3390/ma13173703