Optimization of Cutting Process Parameters in Inclined Drilling of Inconel 718 Using Finite Element Method and Taguchi Analysis


Abstract
:1. Introduction
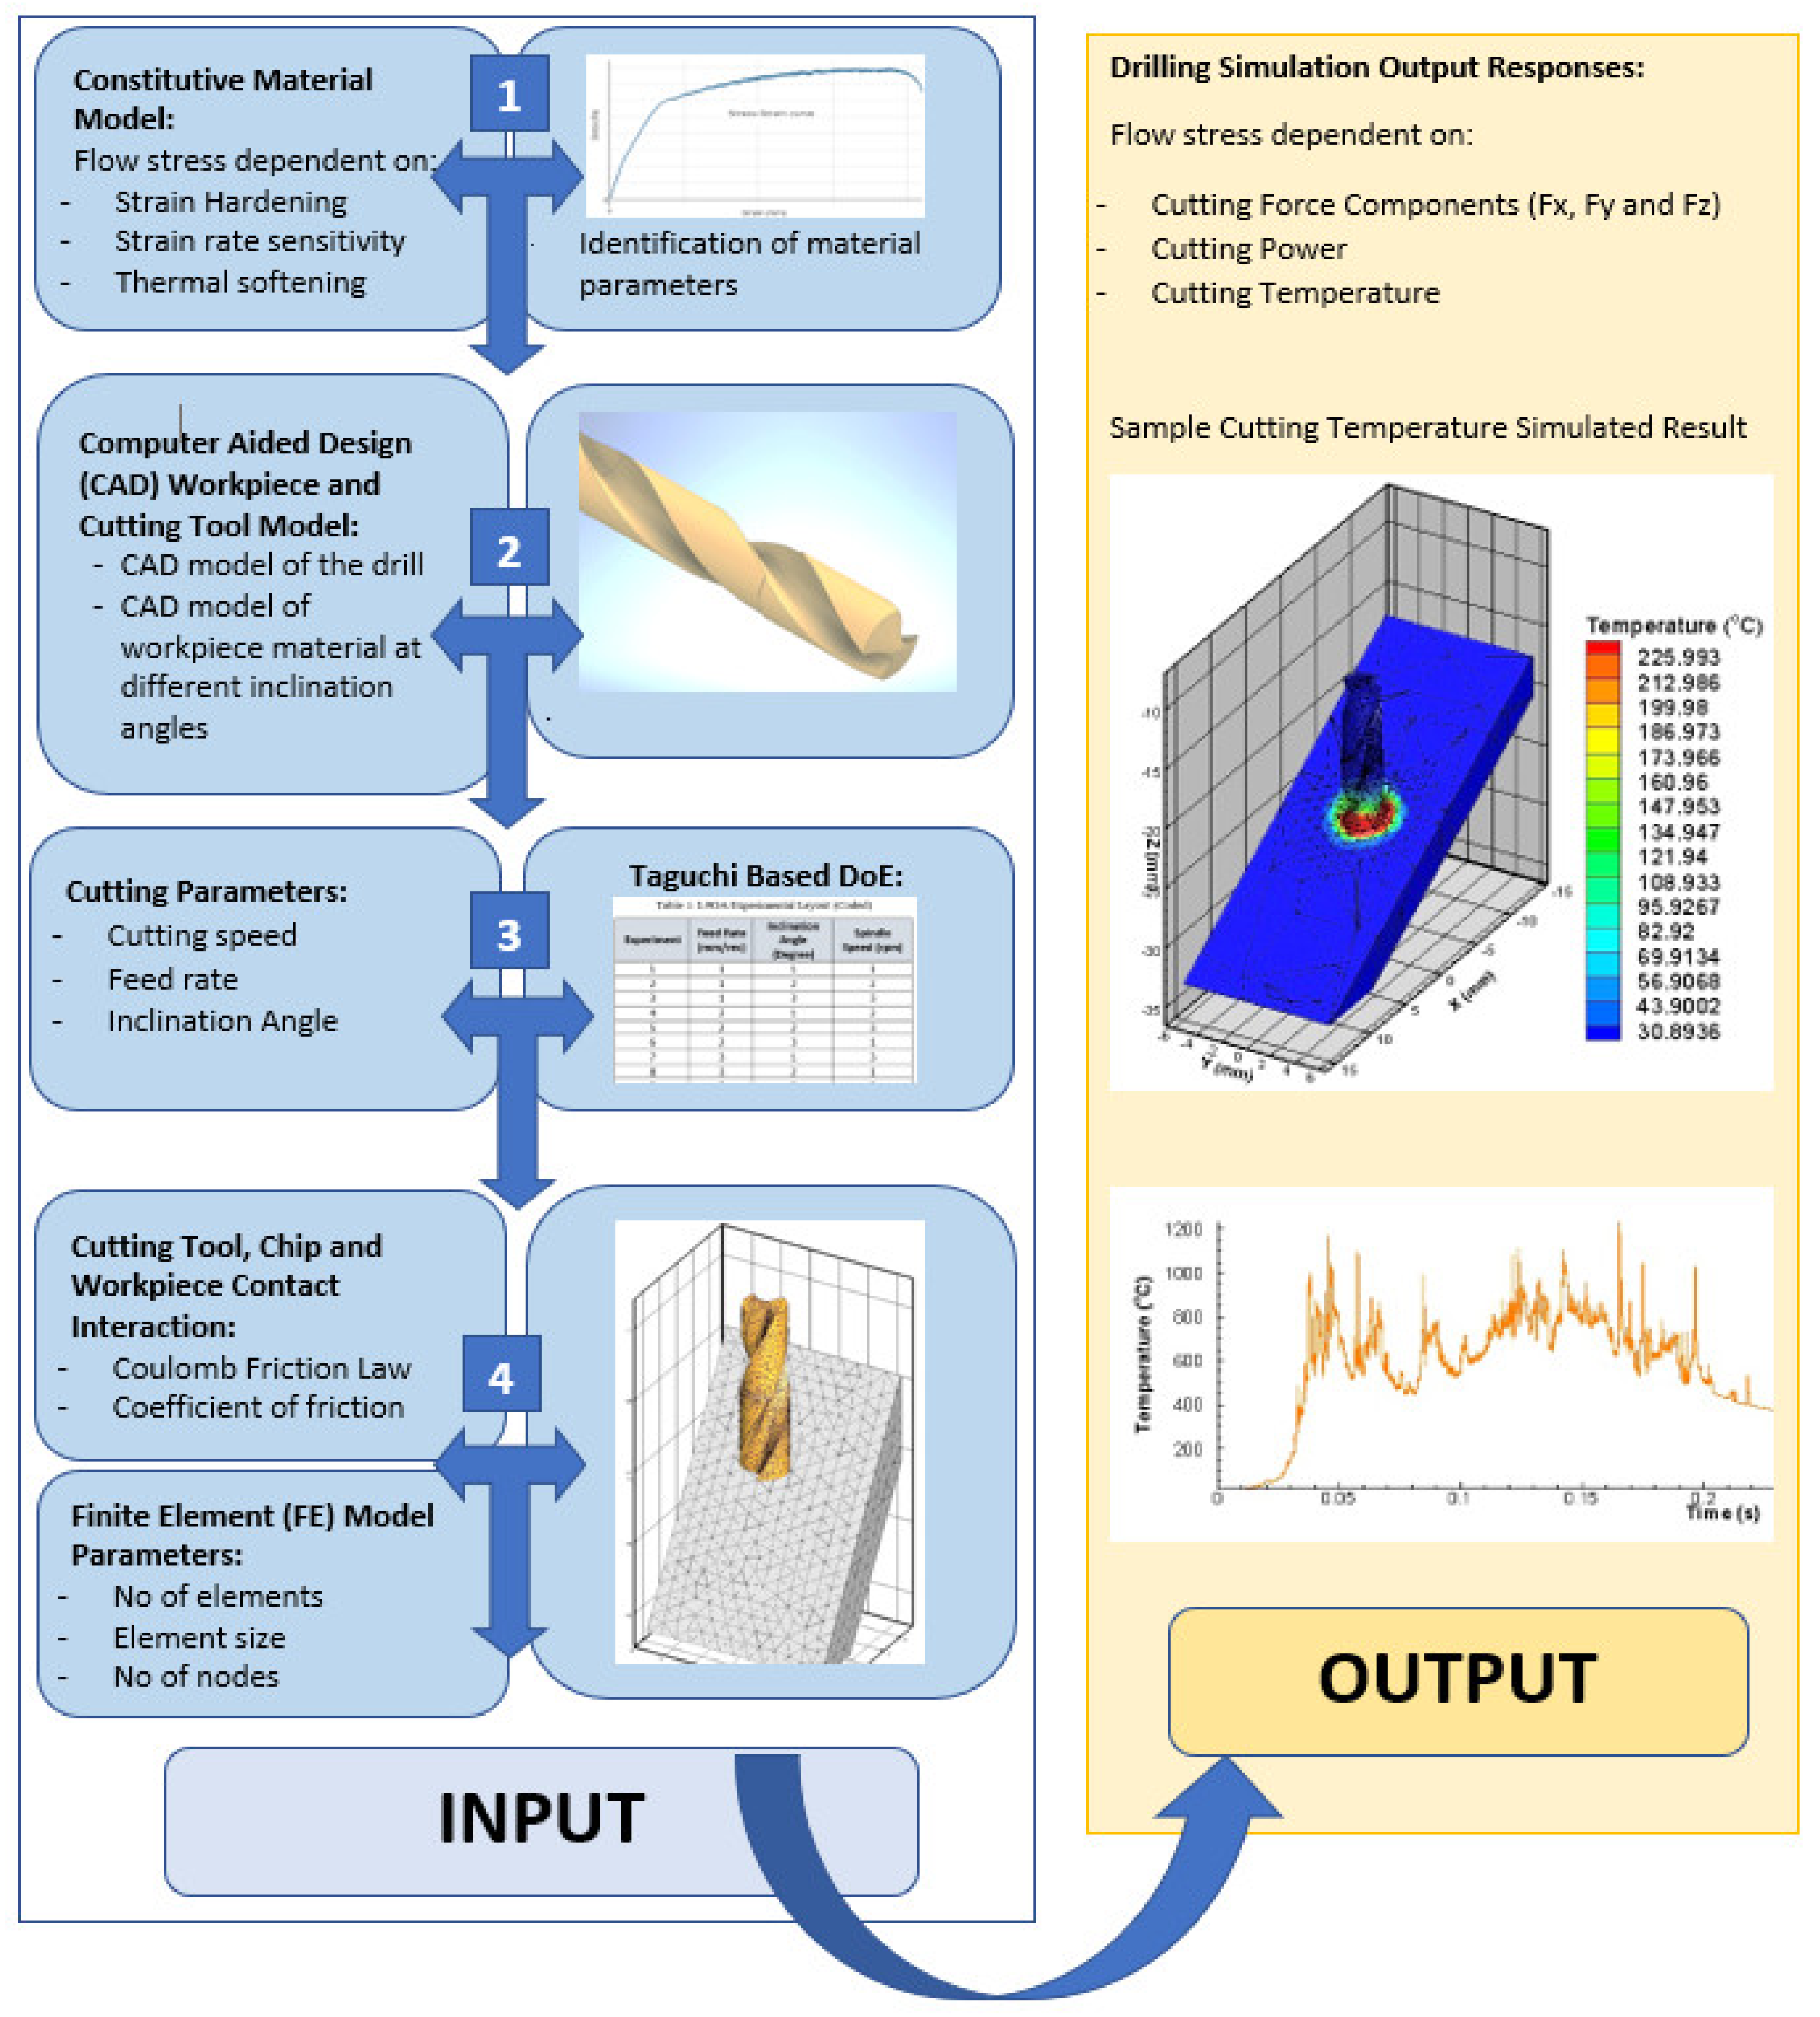
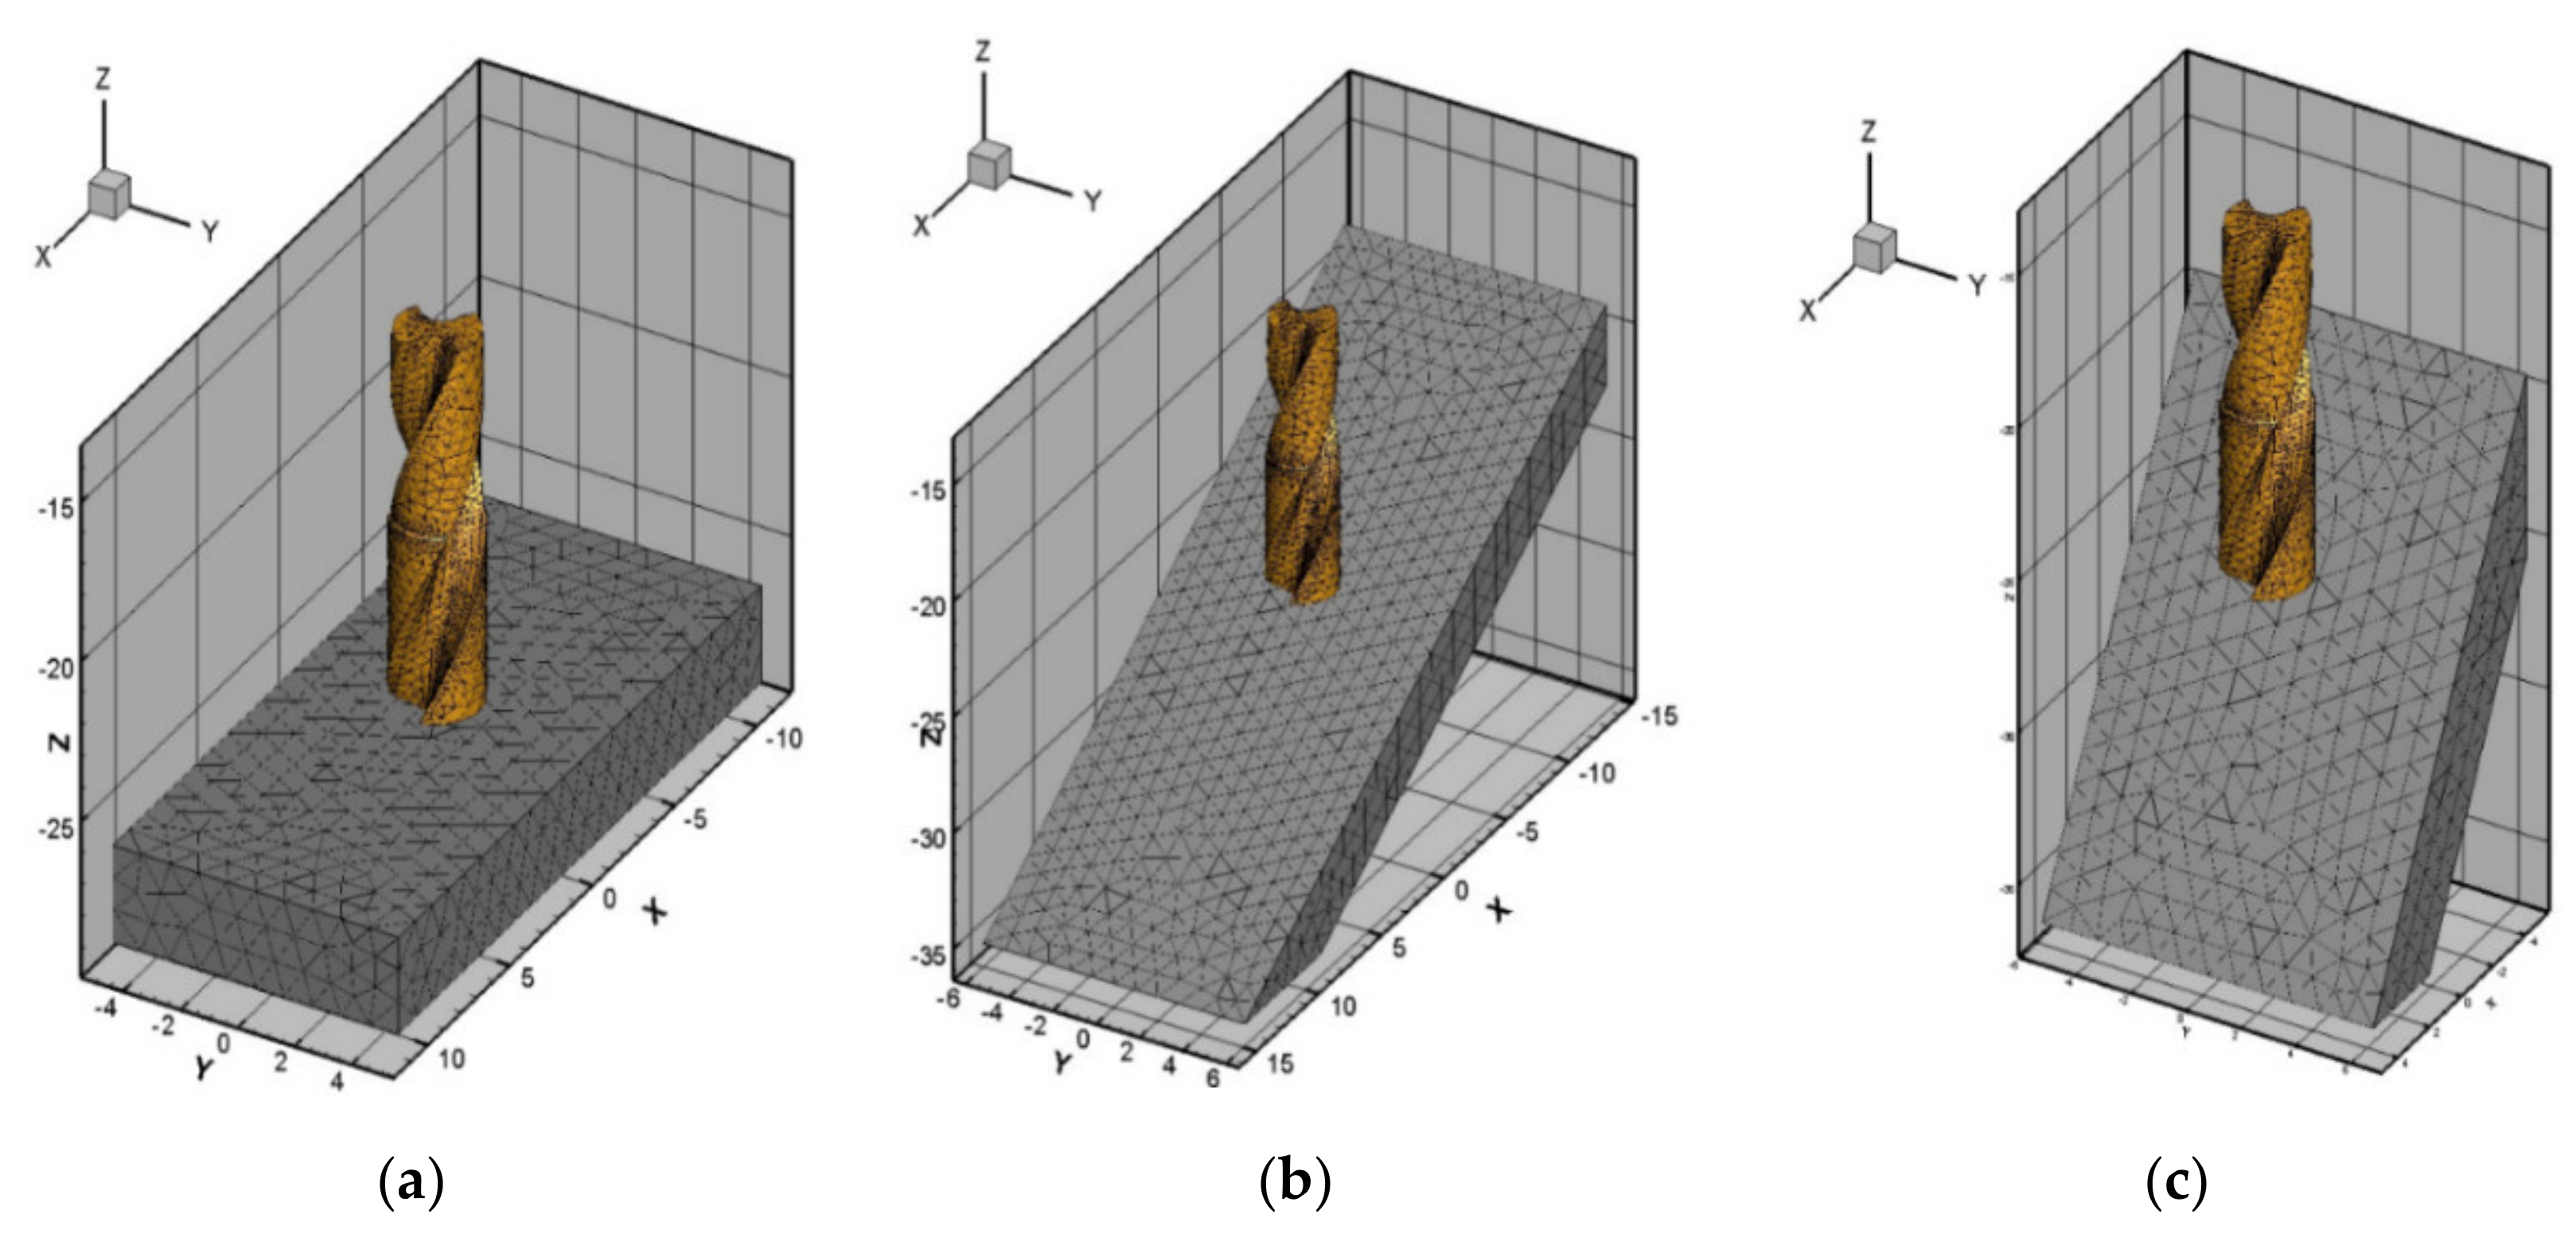
2. Three-Dimensional (3D) Finite Element (FE) Drilling Simulation Setup
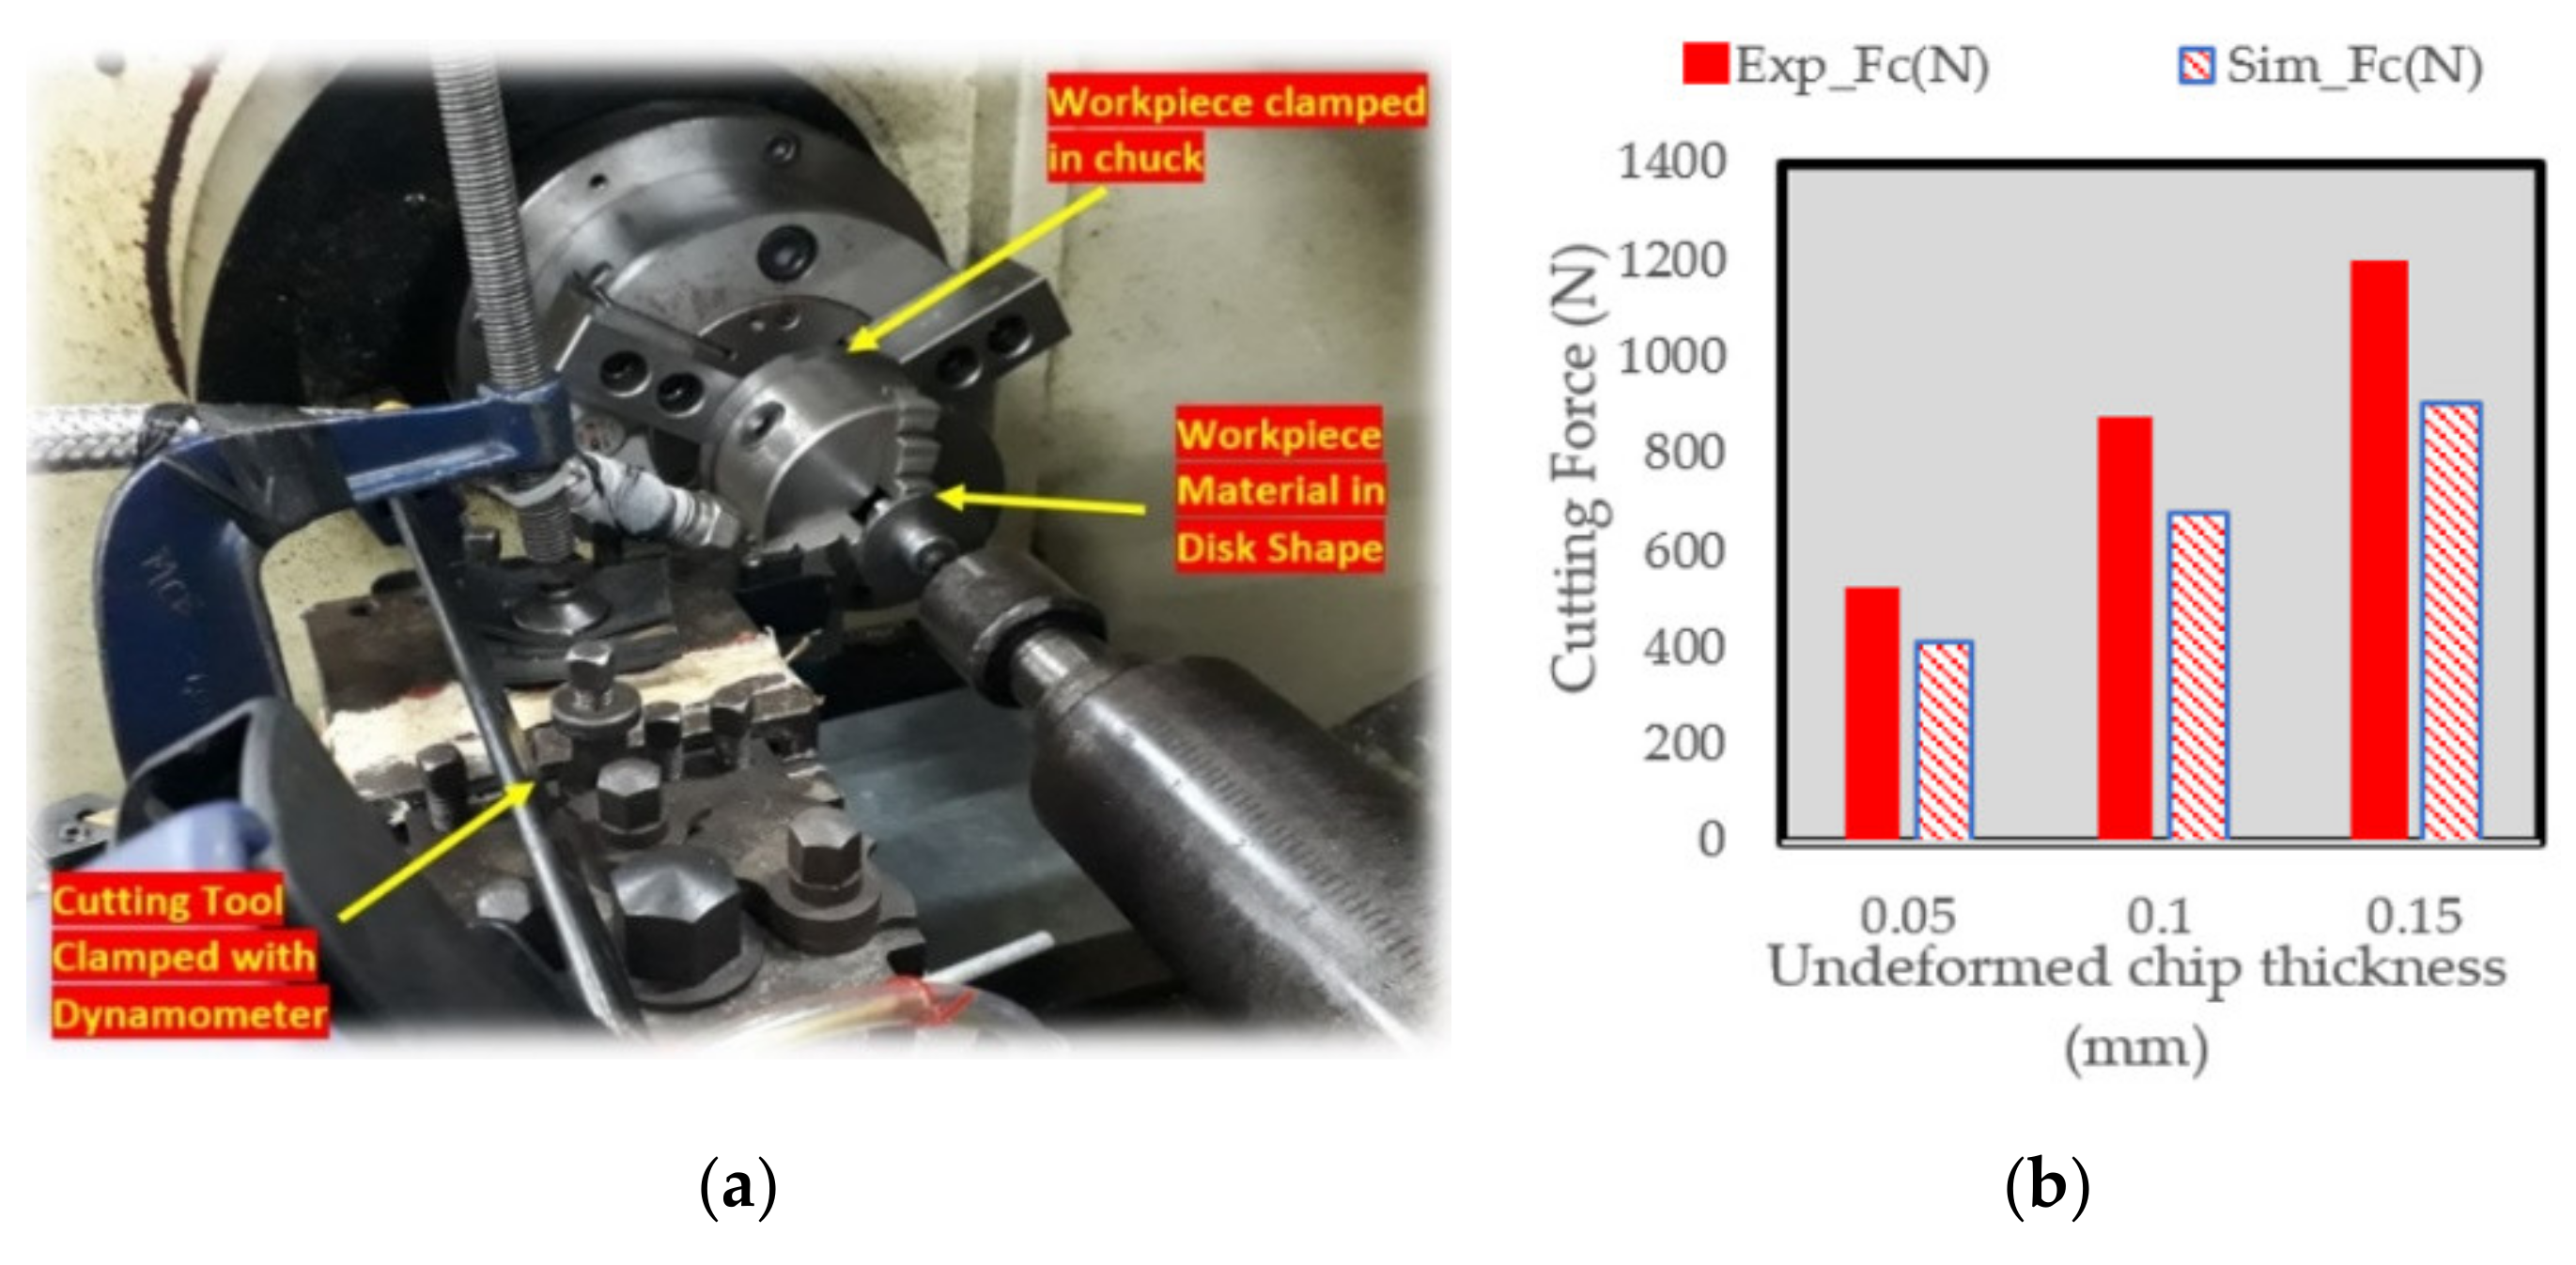
Experimental Validation of Material Model Using Orthogonal Cutting
3. Experimental Design
4. Results and Discussion
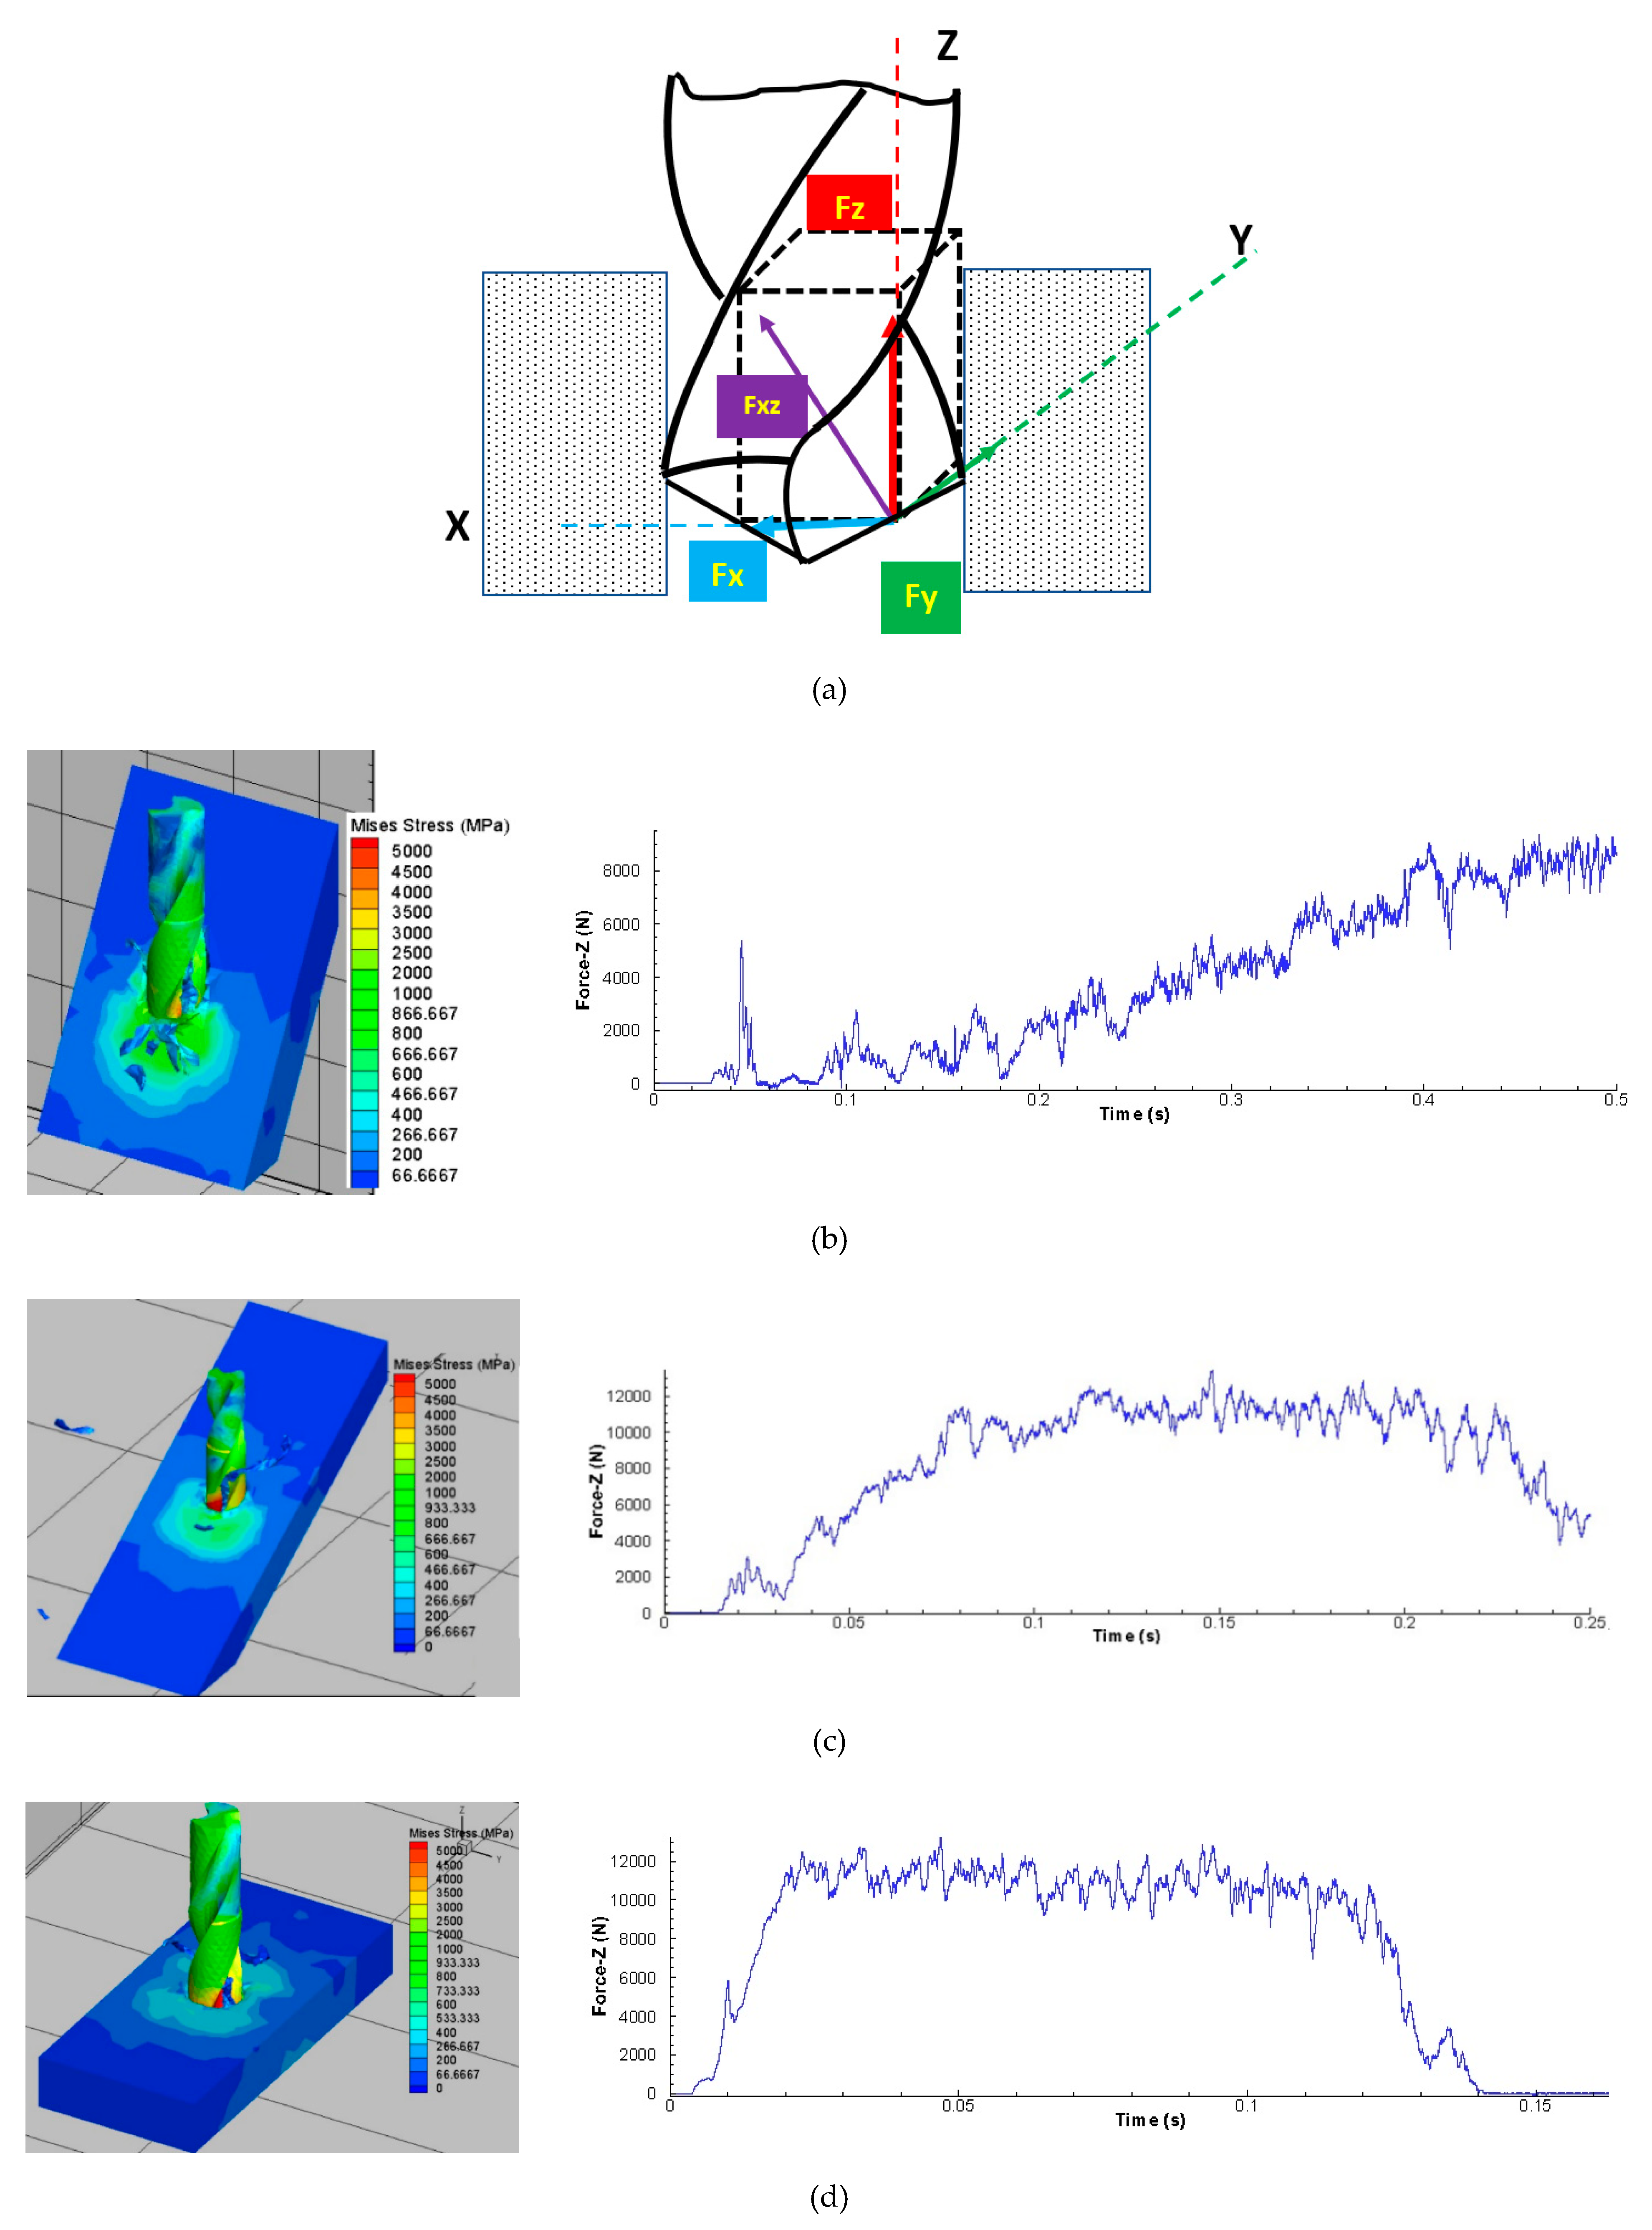
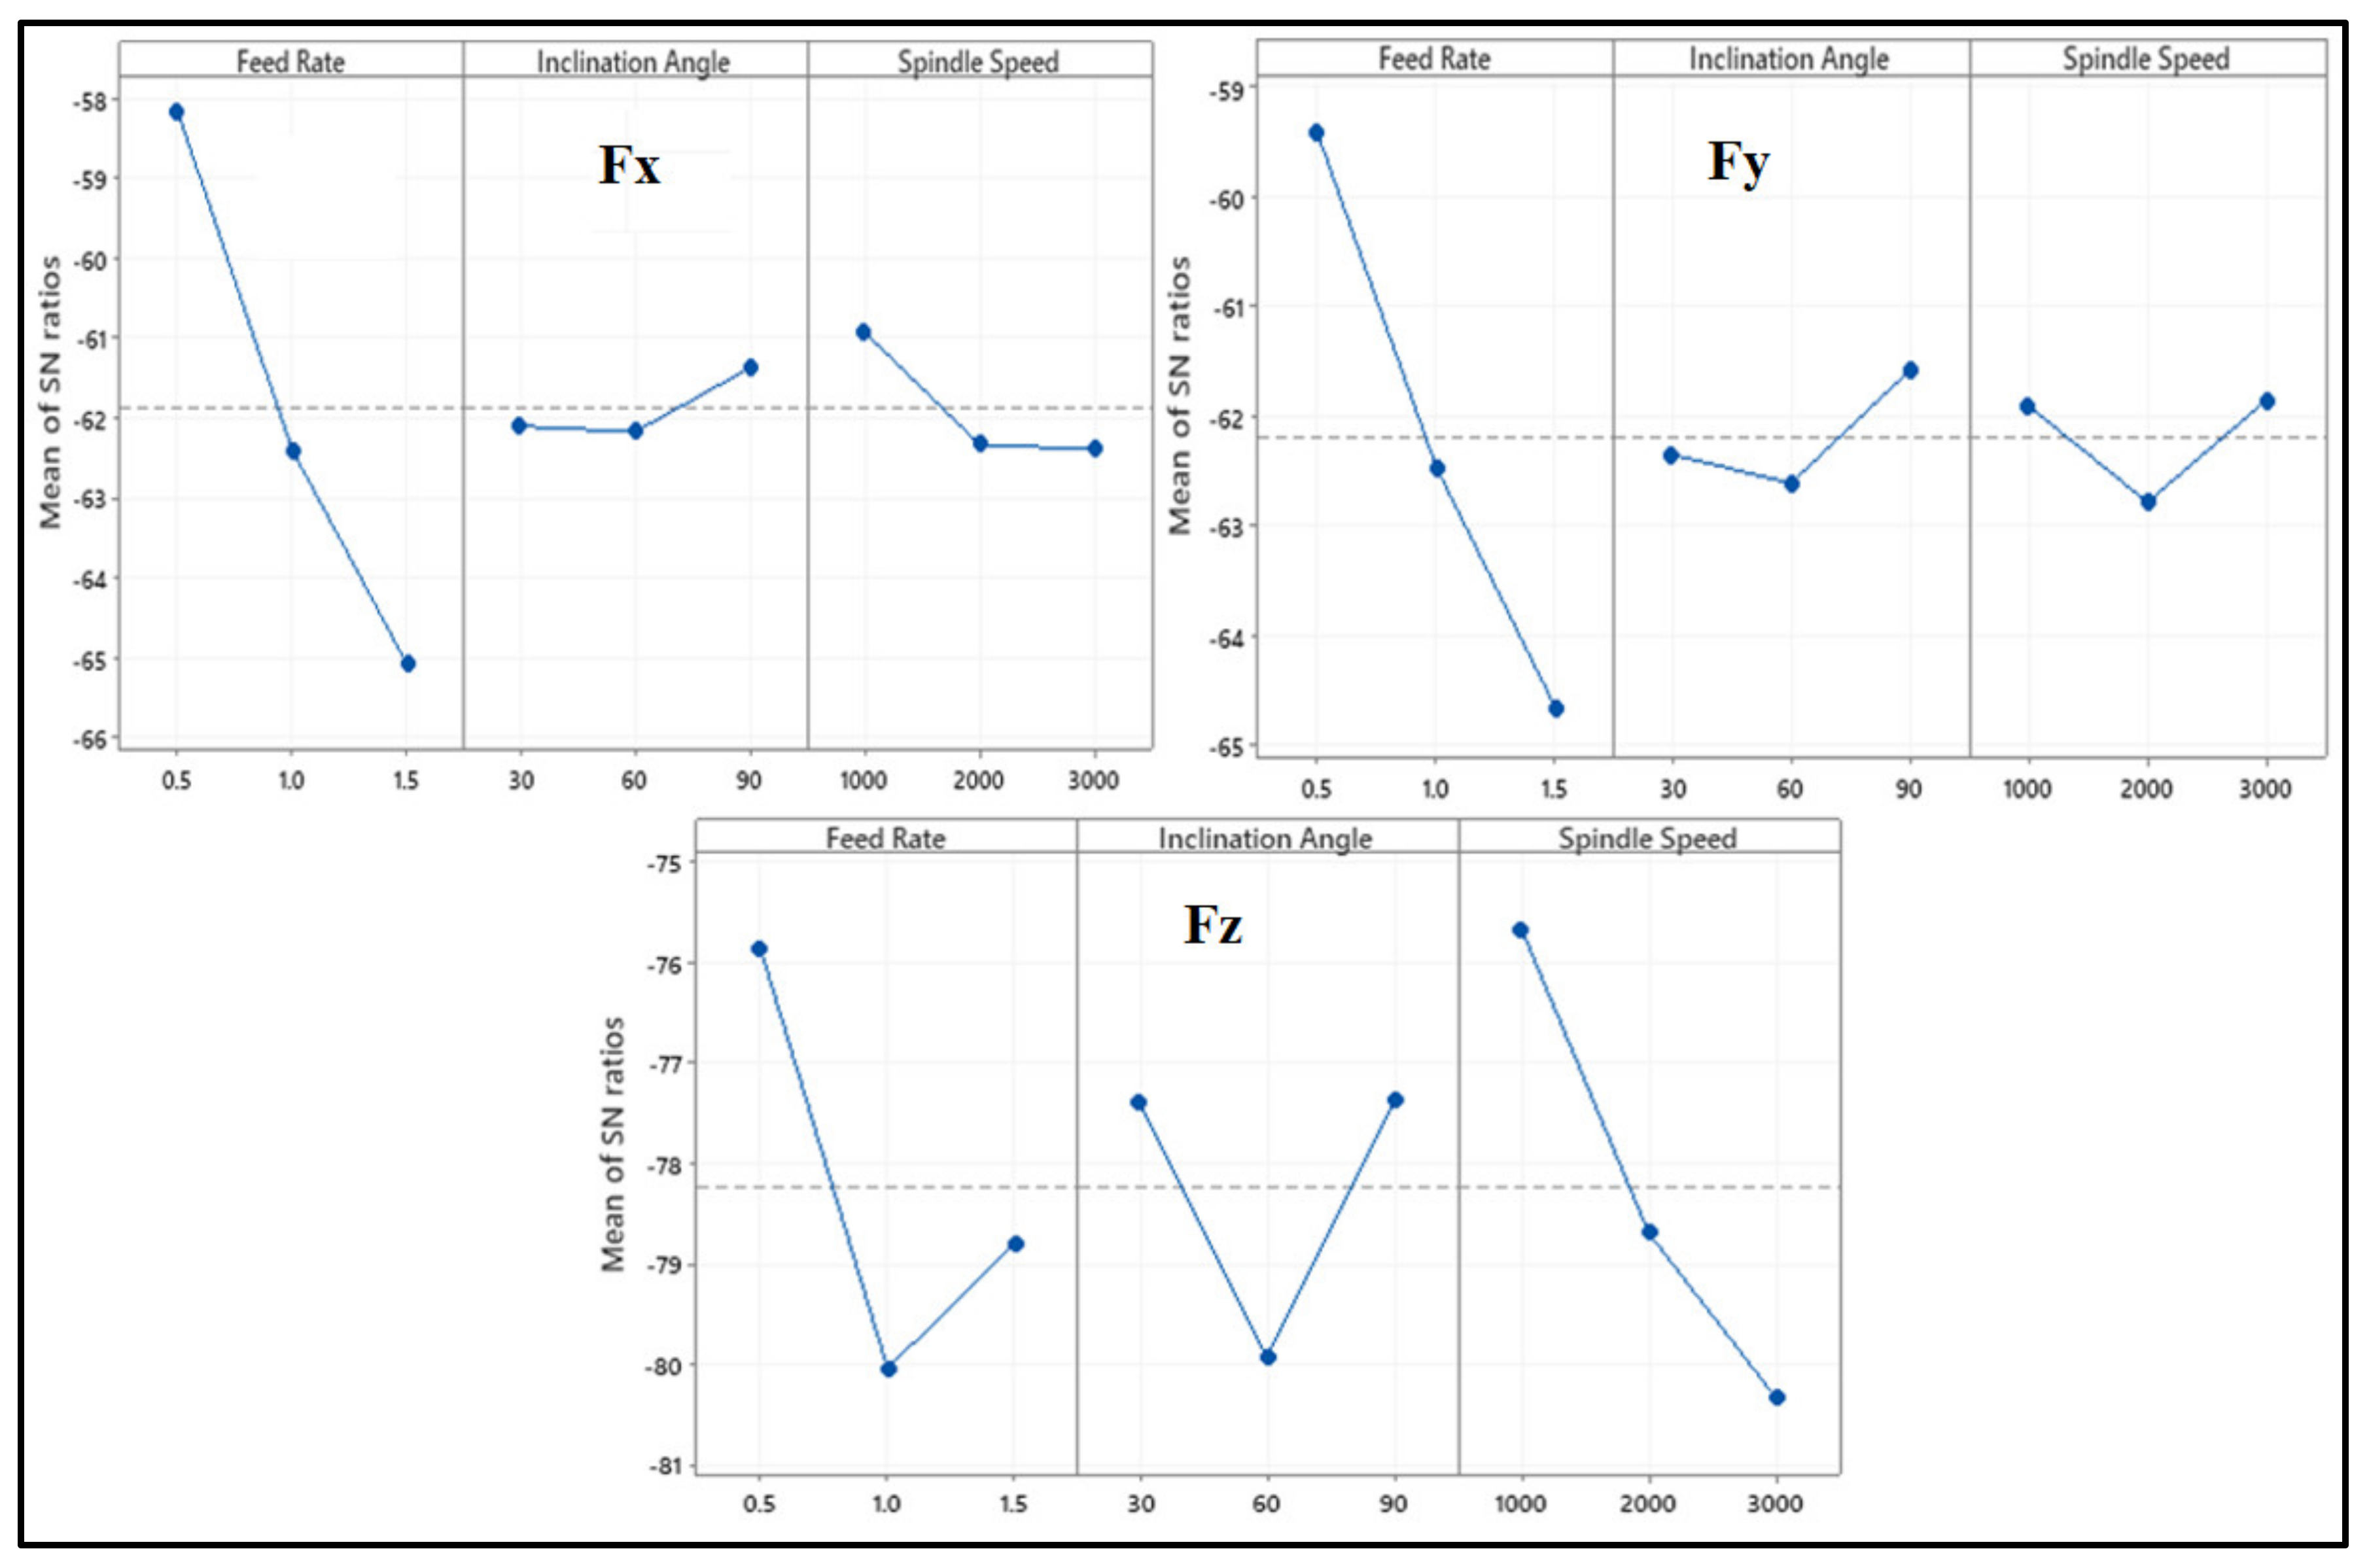
4.1. Analysis of Cutting Forces
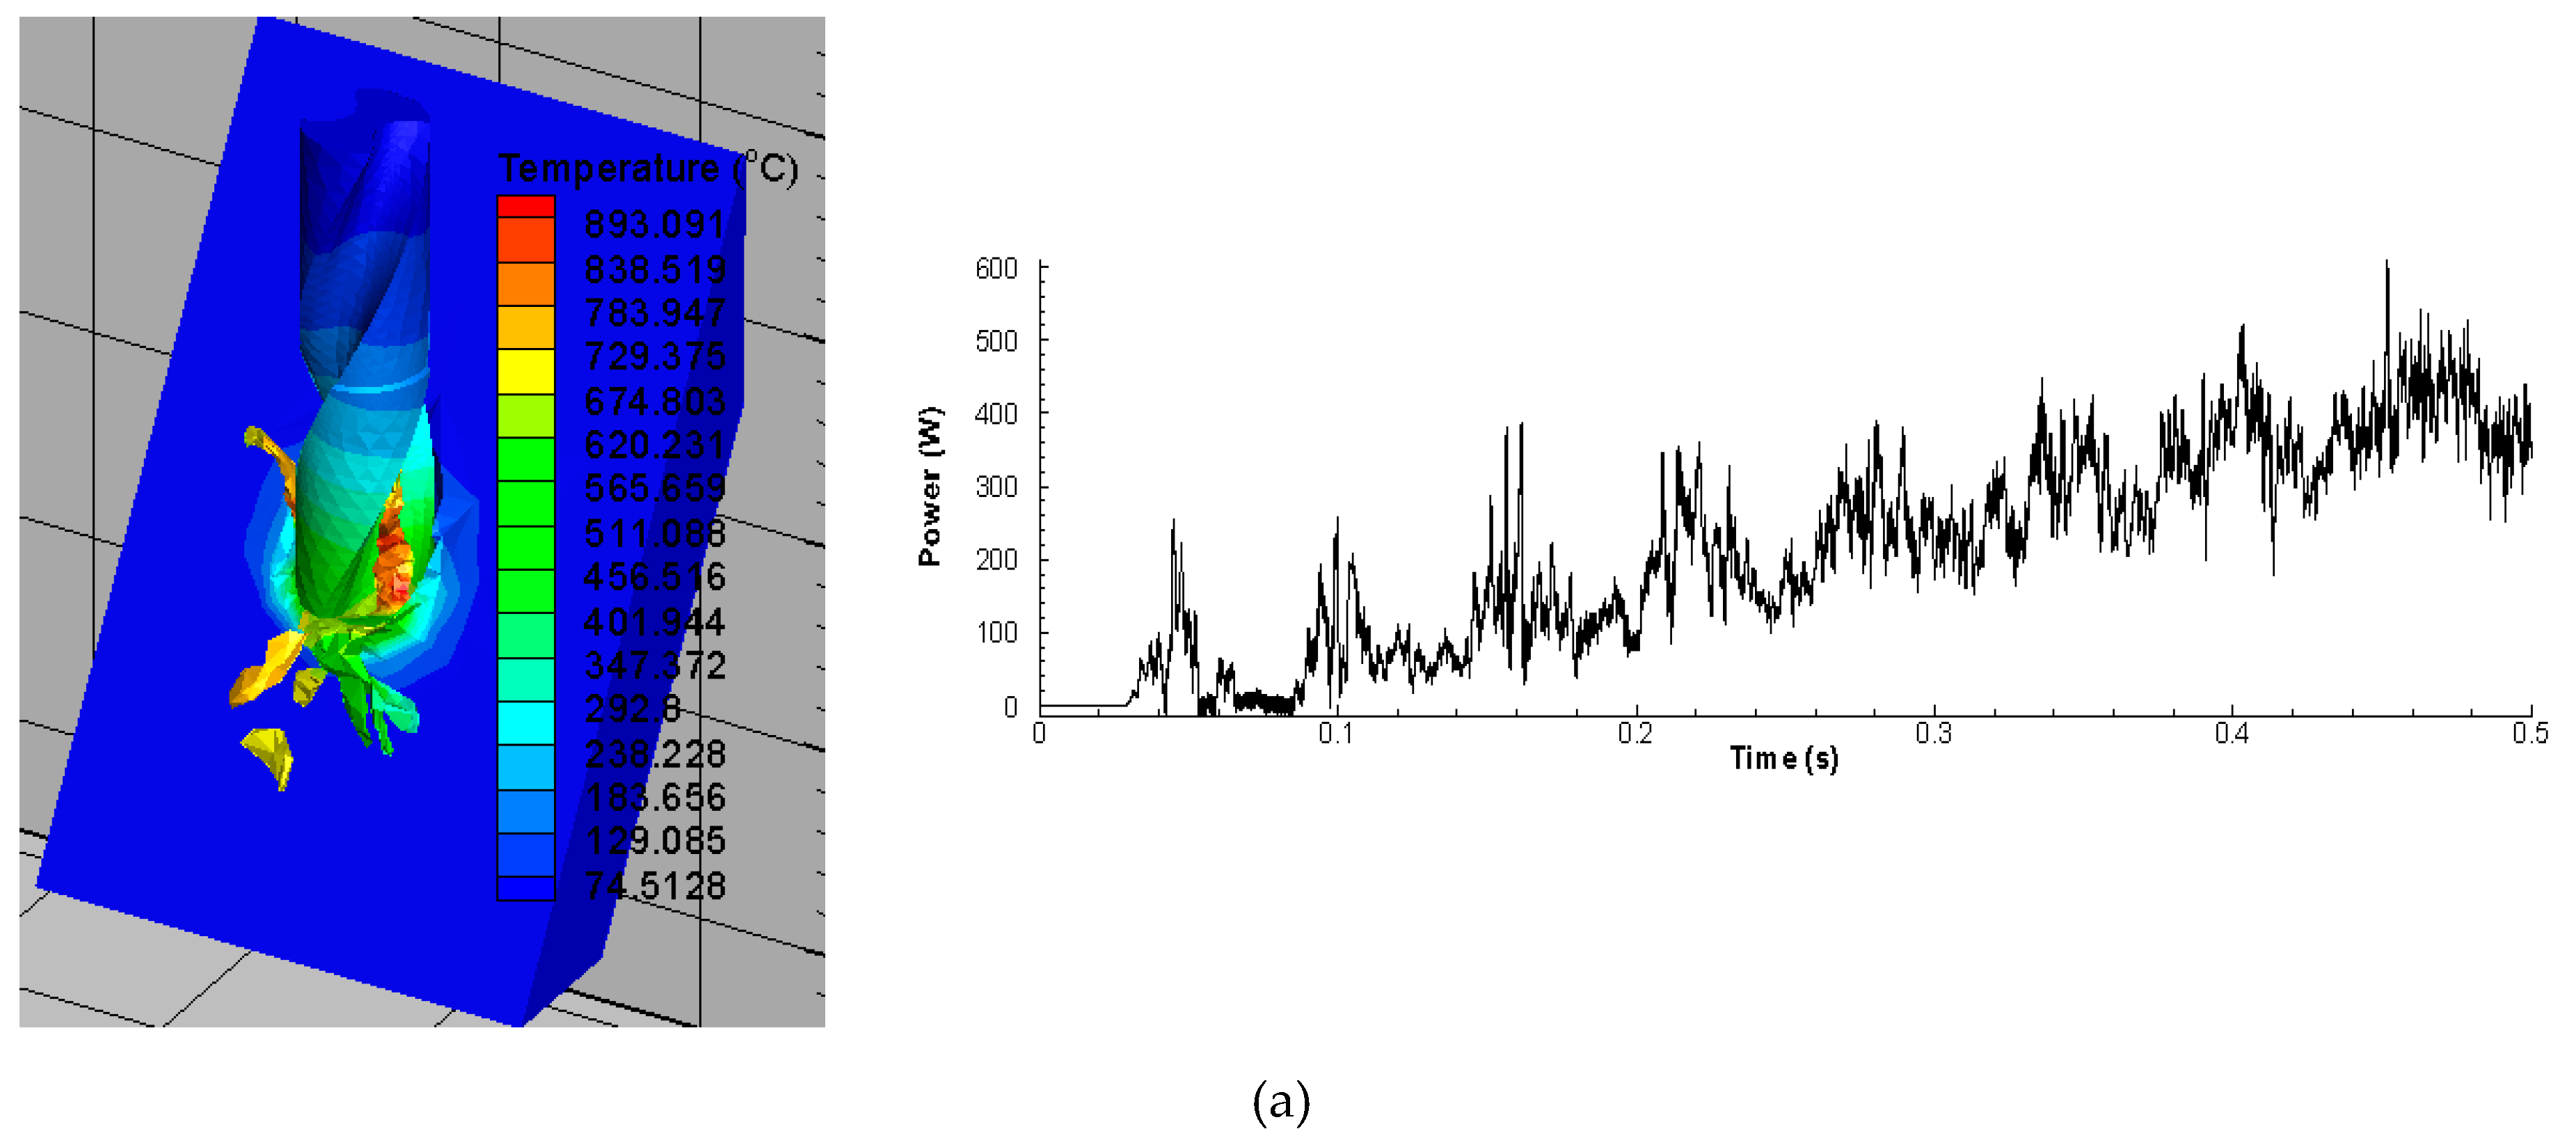
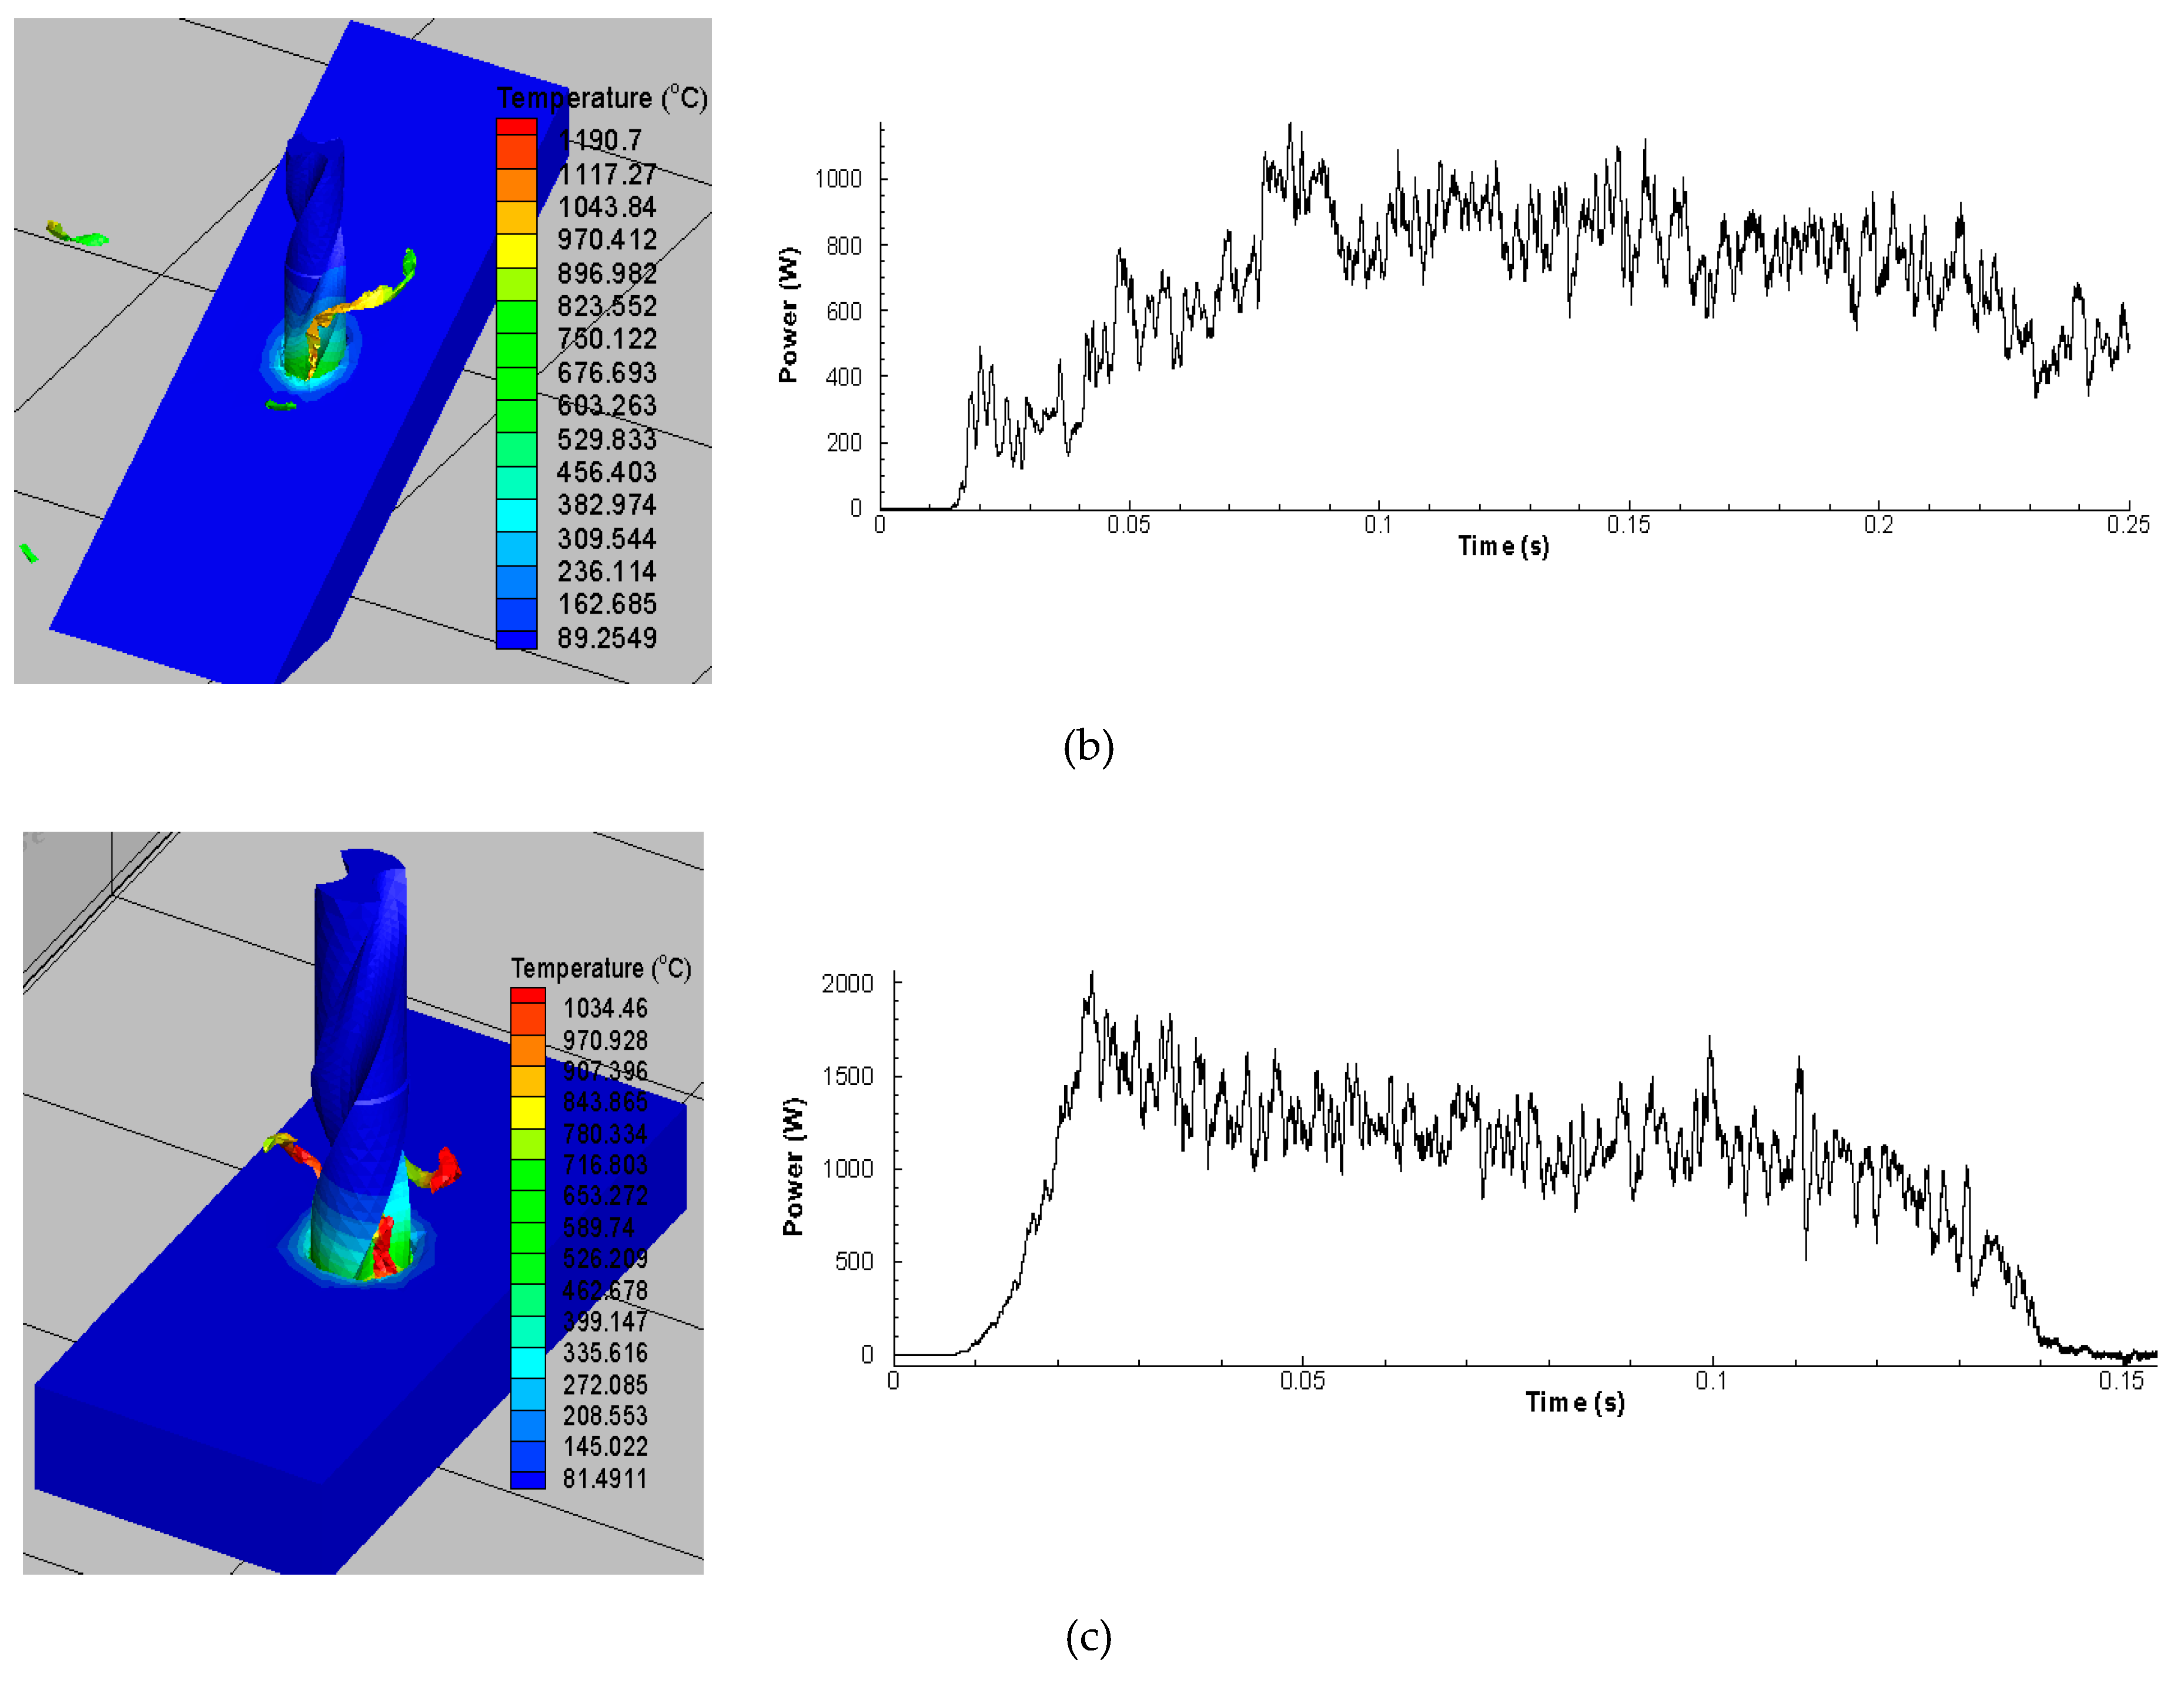
4.2. Analysis of Cutting Power
4.3. Analysis of Cutting Temperature
5. Conclusions
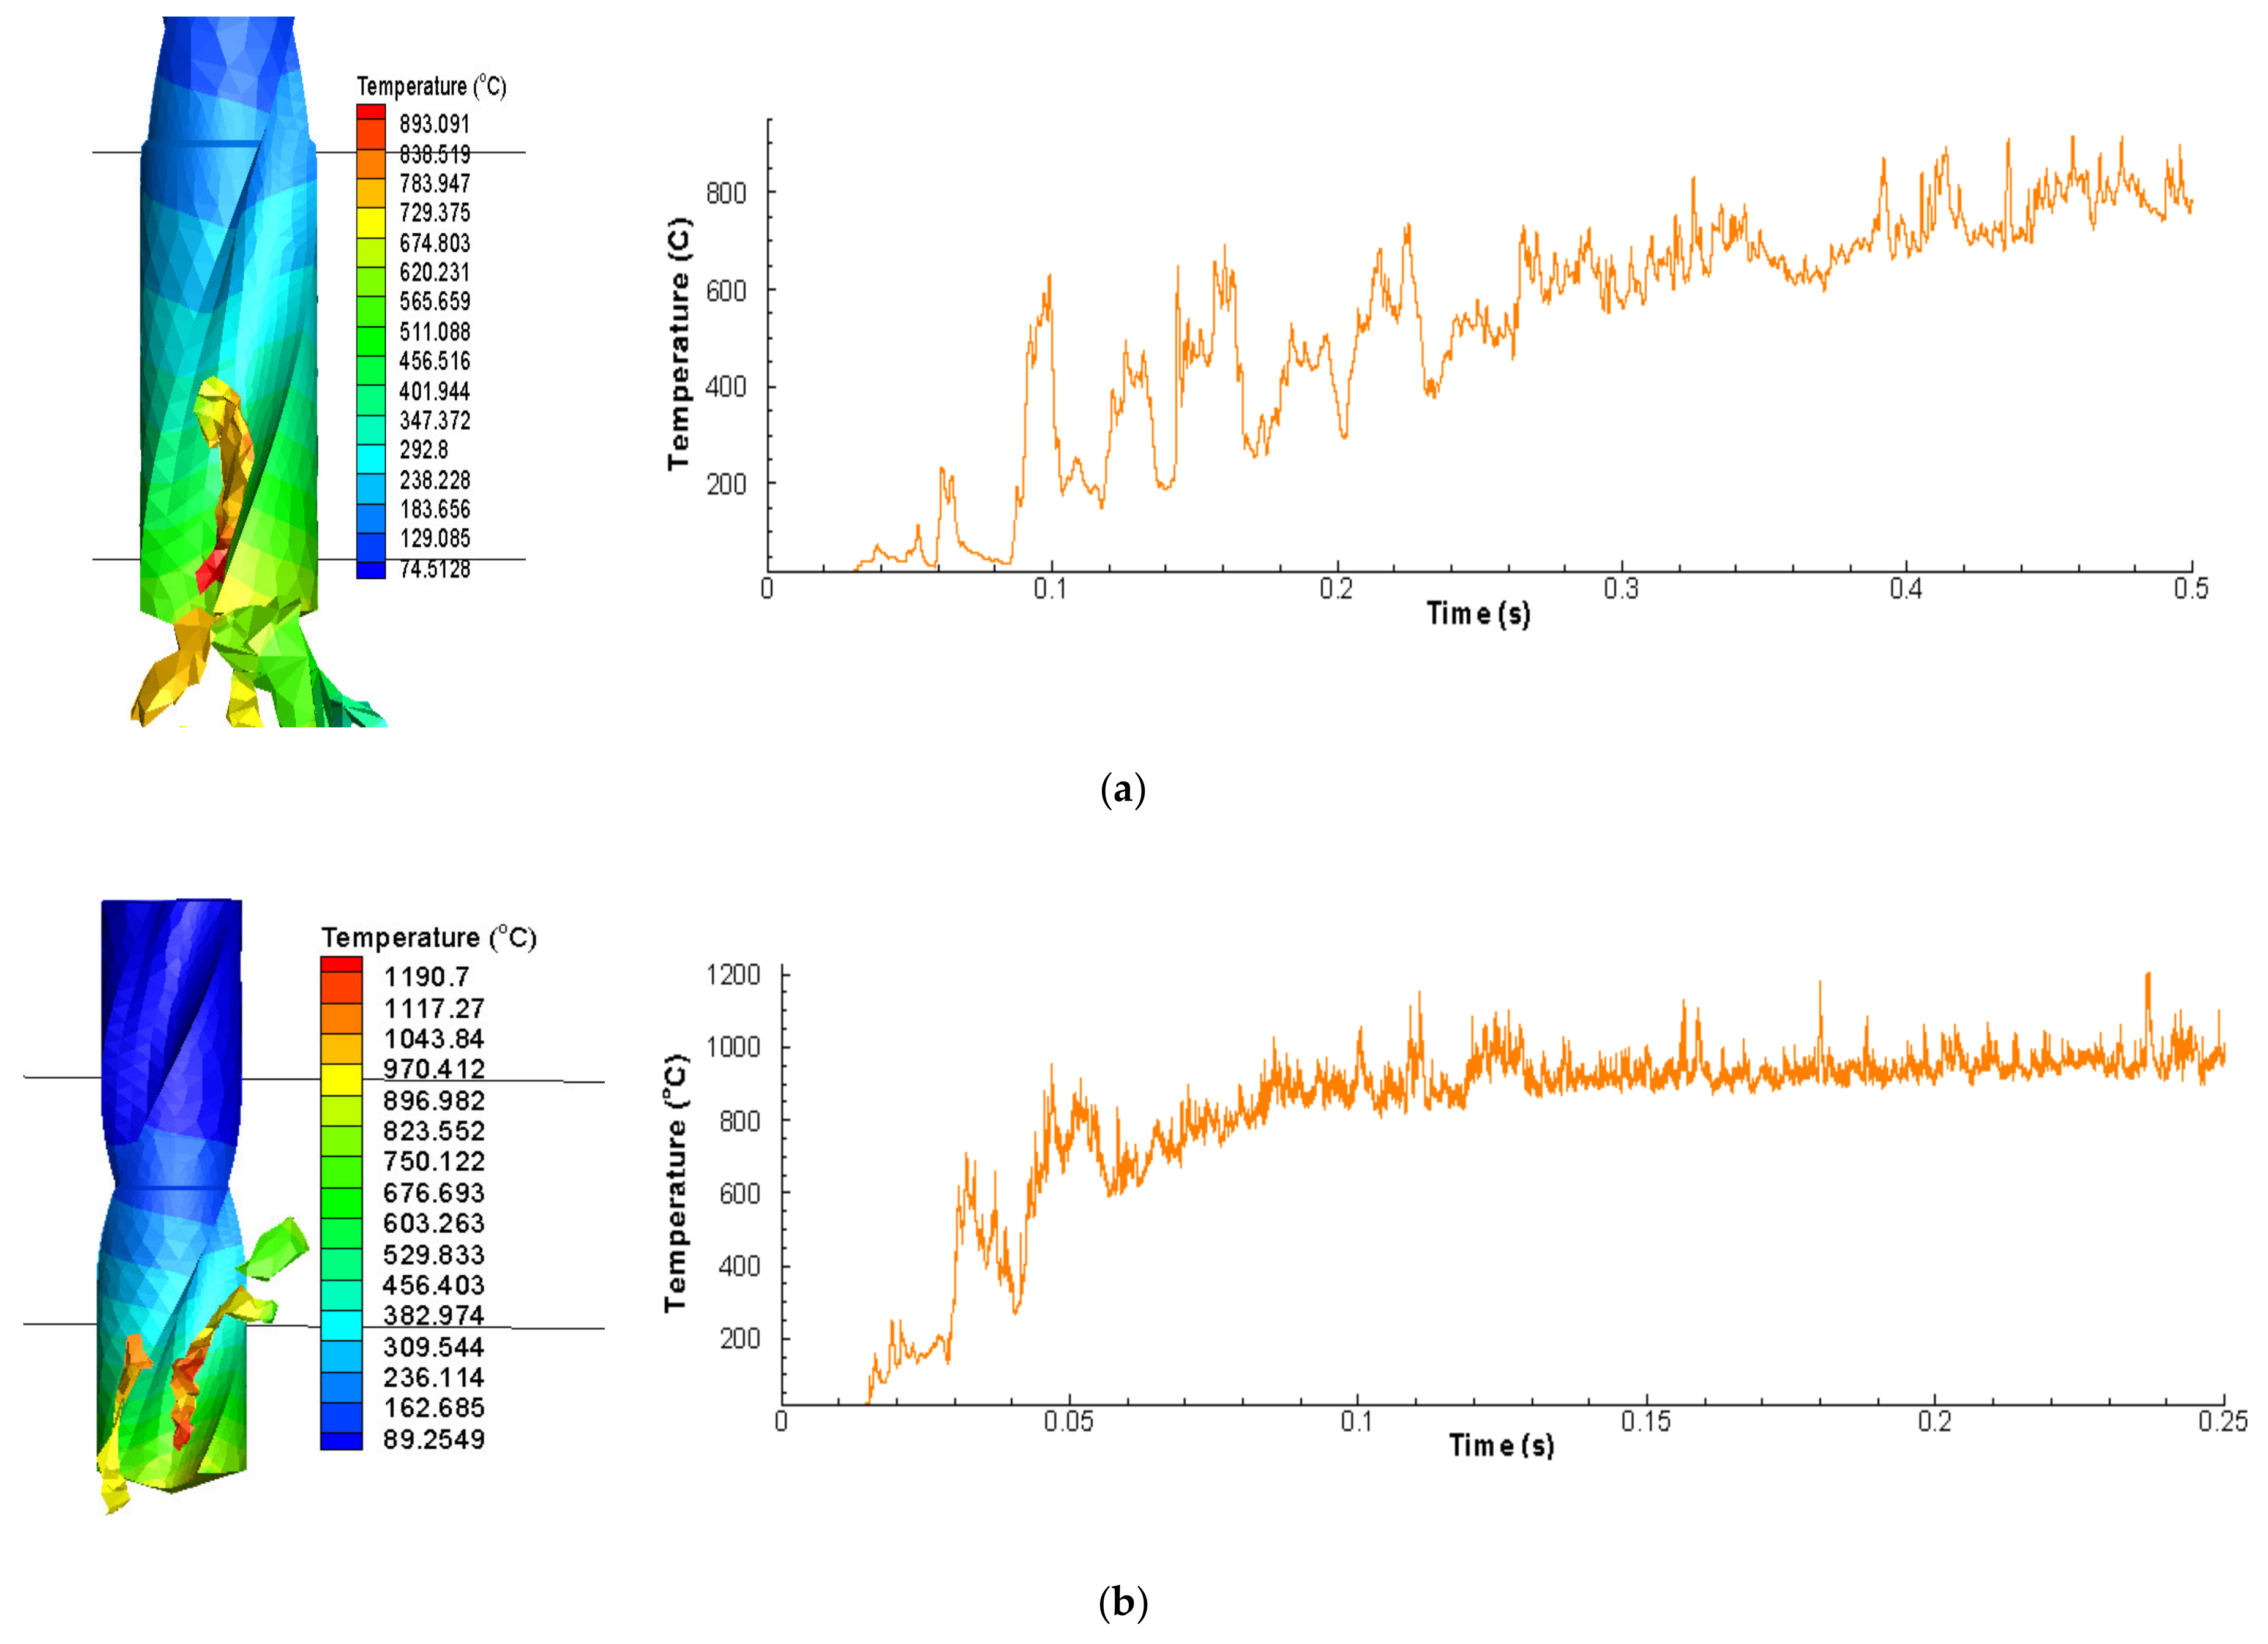
- In 30° inclination angle, the thrust force has a ramping signature throughout the cutting process that represents the ramping increase in chip load starting from the entry of drill. Also represents engagement of chisel and cutting edge with the workpiece material.
- The magnitude of thrust force increased when inclination angle is changed from 30° to 60°. It can be linked with the higher chip load initially in this case as compared to the 30° inclination angle.
- For cutting force component in x-direction (Fx), feed rate found to be more dominant and has the highest contribution (92.95%) followed by spindle speed (5.26%) and inclination angle (1.48%). In the y-direction, cutting force (Fy) is affected mainly by feed rate which has a percent contribution of 84.55, followed by inclination angle (3.5%) and then spindle speed (3.34%). It can be observed that the feed rate affects Fx and Fy the most out of the three input parameters while spindle speed affects Fz the most.
- For lower thrust cutting force, the setting with low feed rate of 0.5 mm/rev, inclination angle of 90° and low spindle speed of 1000 rpm was optimal.
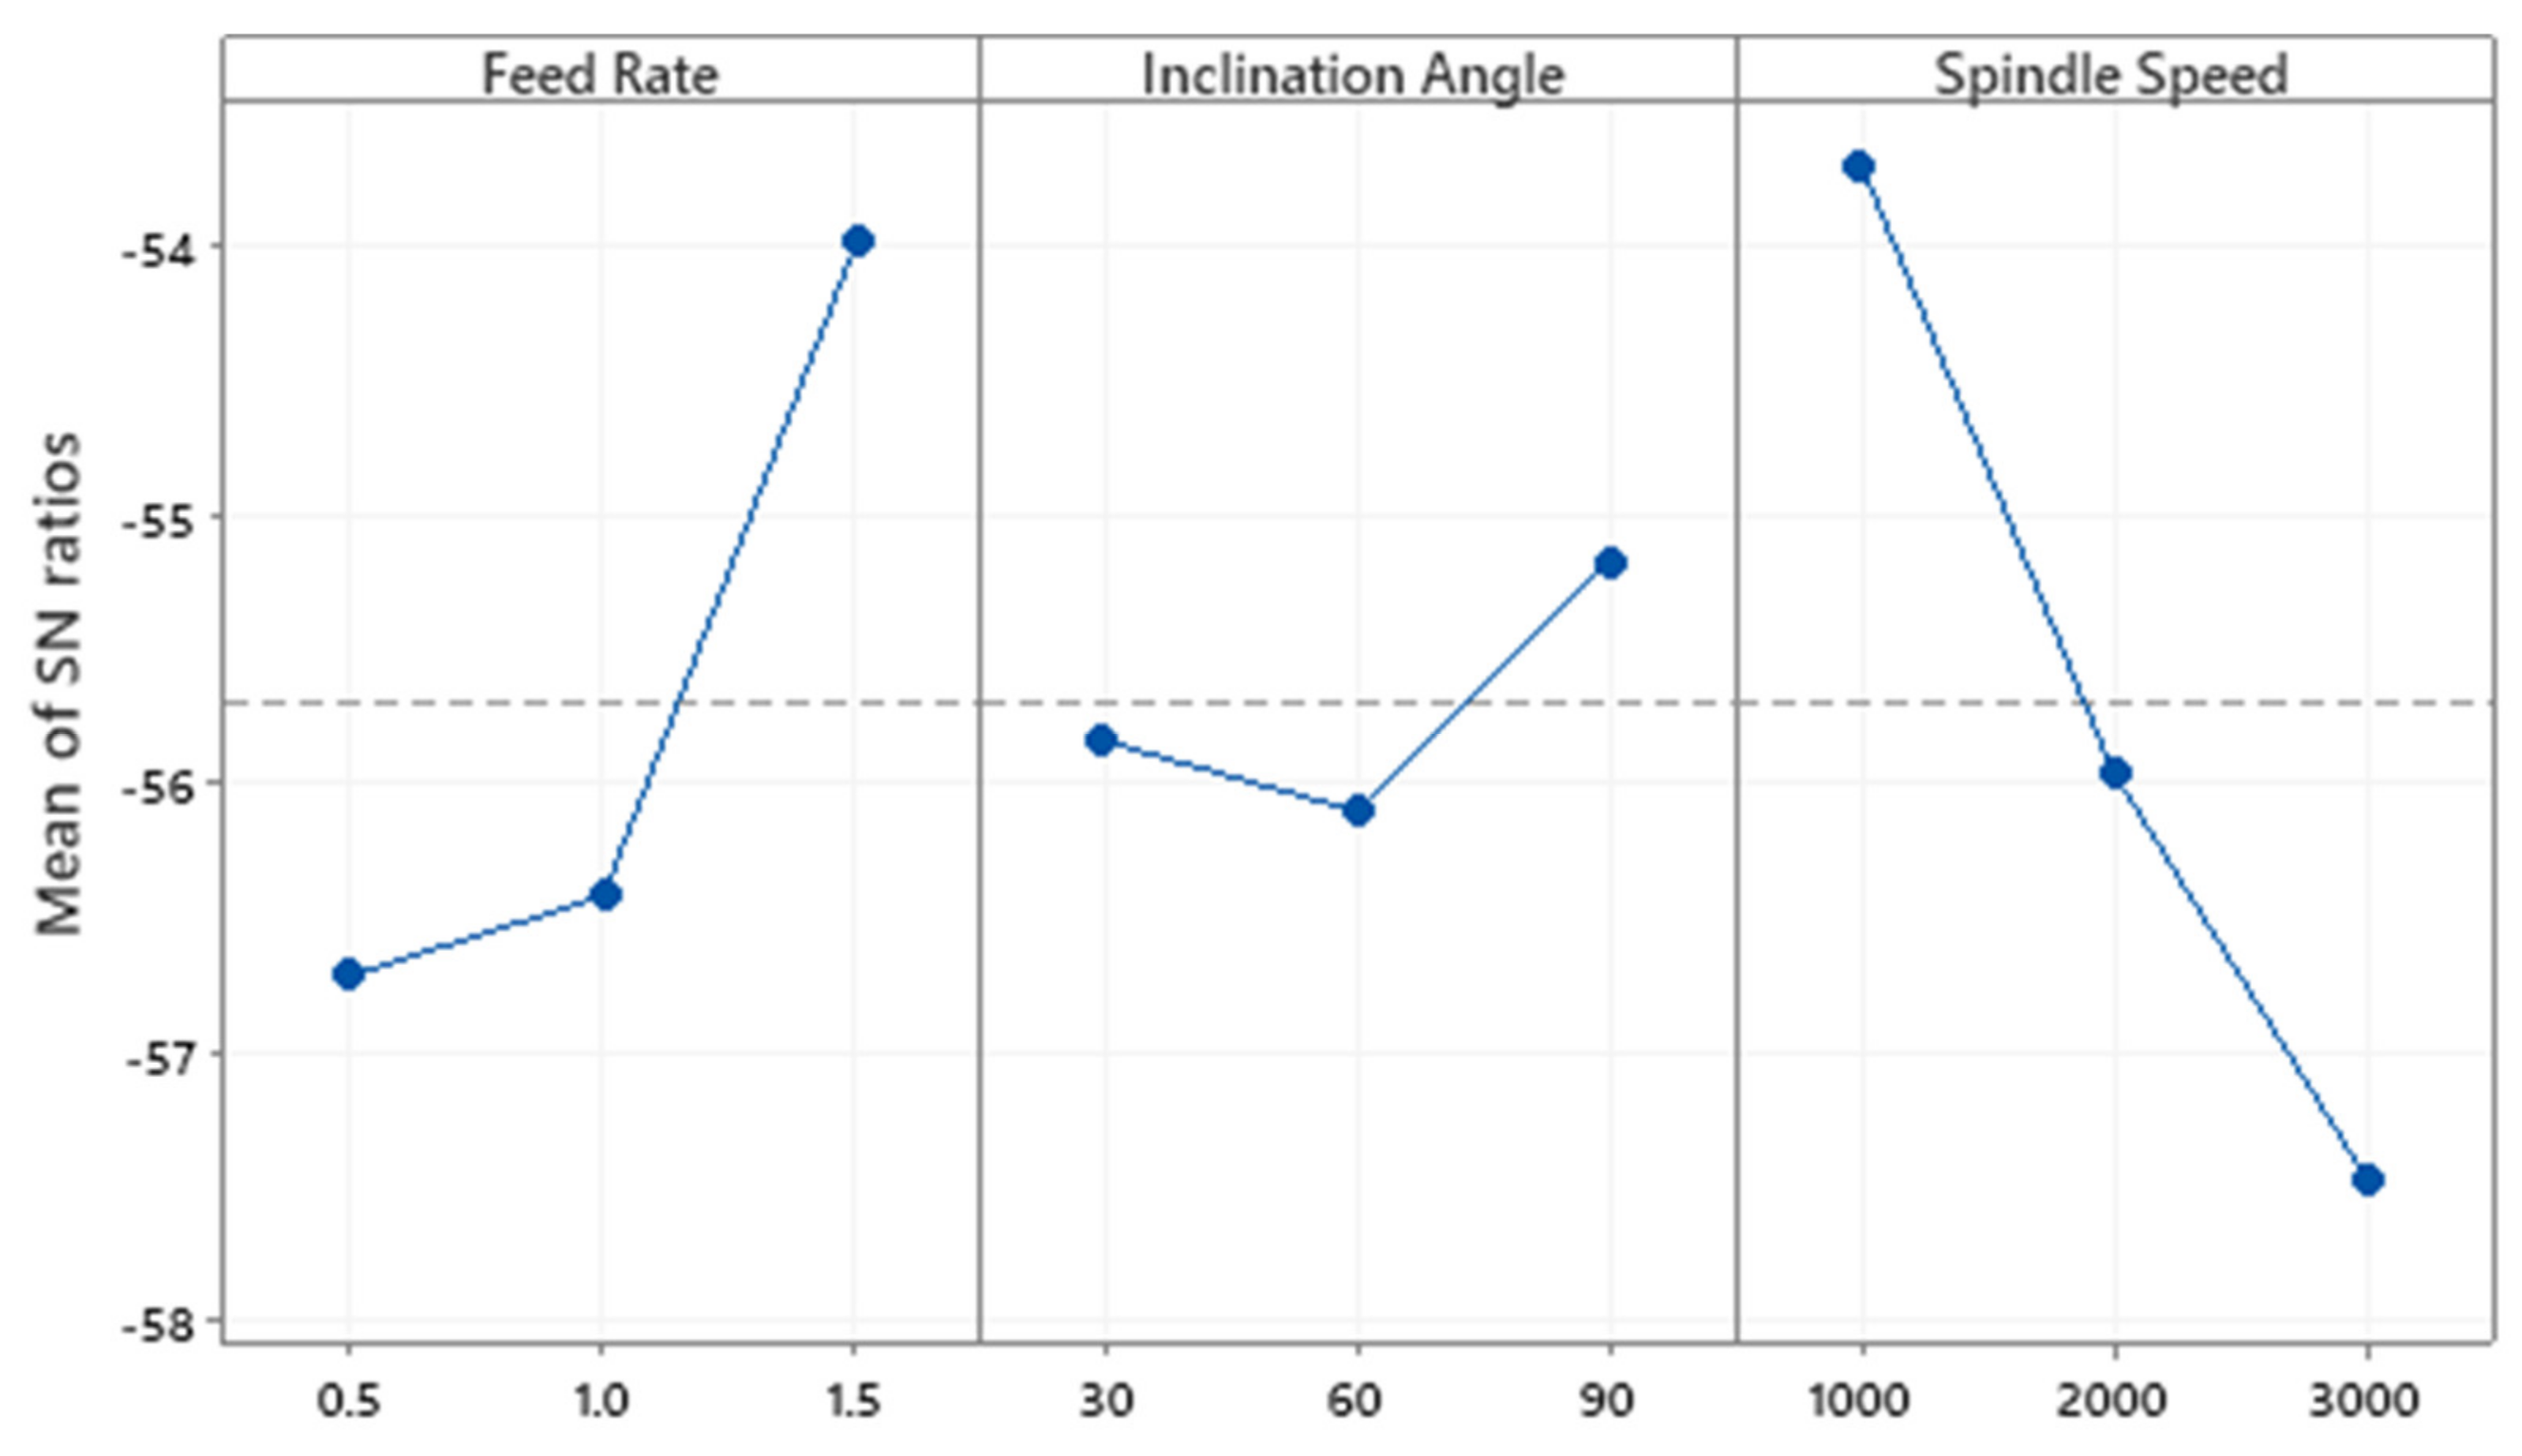
- The spindle speed has the highest contribution to power (85.58%), followed by feed rate (9.22%) and inclination angle (4.22%).
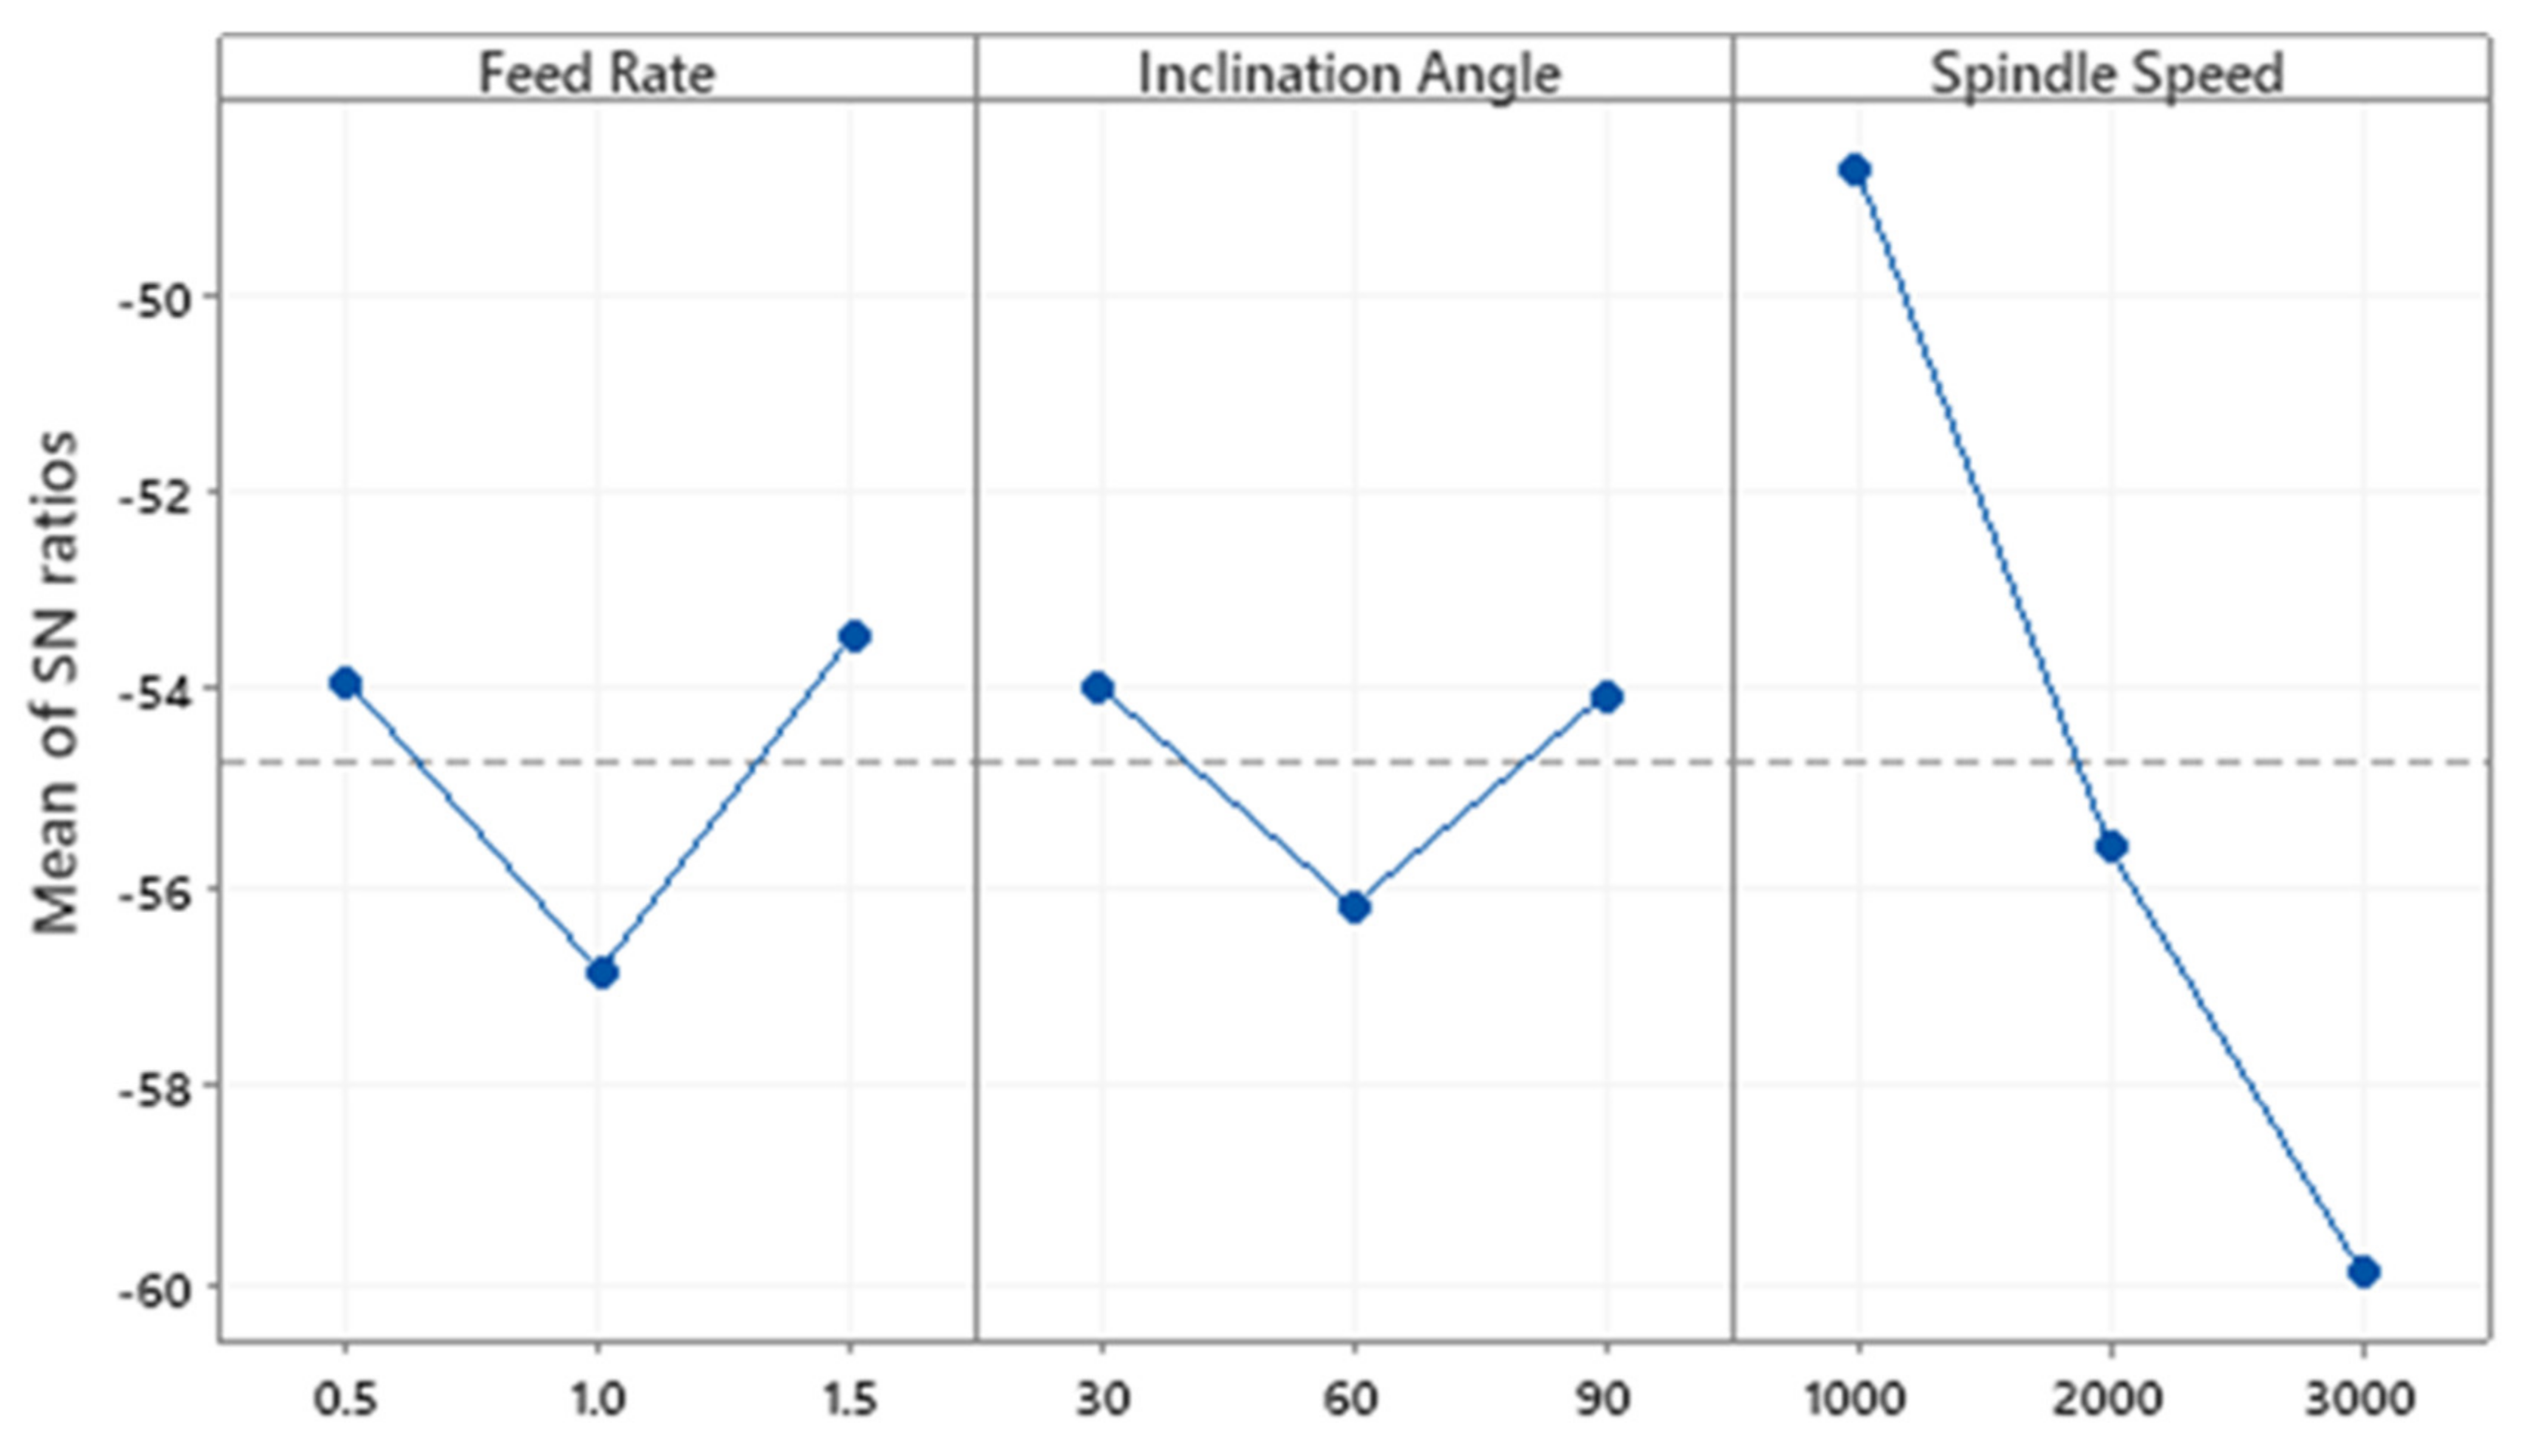
- The cutting temperature was affected by spindle speed (53.7%), followed by feed rate (33.31%) and inclination angle (3.44%).
- The study will be beneficial for different industrial sectors as more output performance parameters such as tool wear and energy consumption can be predicted using the force, temperature, and power data available in this work.
Author Contributions
Funding
Conflicts of Interest
References
- D’Addona, D.M.; Raykar, S.J.; Narke, M.M. High Speed Machining of Inconel 718: Tool Wear and Surface Roughness Analysis. Procedia CIRP 2017, 62, 269–274. [Google Scholar] [CrossRef]
- Shokrani, A.; Dhokia, V.; Newman, S.T. Hybrid Cooling and Lubricating Technology for CNC Milling of Inconel 718 Nickel Alloy. Procedia Manuf. 2017, 11, 625–632. [Google Scholar] [CrossRef] [Green Version]
- Marques, A.; Suarez, M.P.; Sales, W.F.; Machado, Á.R. Turning of Inconel 718 with whisker-reinforced ceramic tools applying vegetable-based cutting fluid mixed with solid lubricants by MQL. J. Mater. Process. Technol. 2019, 266, 530–543. [Google Scholar] [CrossRef]
- Chandrasekharan, V.; Kapoor, S.G.; DeVor, R.E. A Mechanistic Approach to Predicting the Cutting Forces in Drilling: With Application to Fiber-Reinforced Composite Materials. J. Eng. Ind. 1995, 117, 559–570. [Google Scholar] [CrossRef]
- Paul, A.; Kapoor, S.G.; DeVor, R.E. A Chisel Edge Model for Arbitrary Drill Point Geometry. J. Manuf. Sci. Eng. 2005, 127, 23–32. [Google Scholar] [CrossRef]
- Anand, R.S.; Patra, K. Mechanistic cutting force modelling for micro-drilling of CFRP composite laminates. CIRP J. Manuf. Sci. Technol. 2017, 16, 55–63. [Google Scholar] [CrossRef]
- Qiu, X.; Li, P.; Li, C.; Niu, Q.; Chen, A.; Ouyang, P.; Ko, T.J. Study on chisel edge drilling behavior and step drill structure on delamination in drilling CFRP. Compos. Struct. 2018, 203, 404–413. [Google Scholar] [CrossRef]
- Yan, X.; Zhang, K.; Cheng, H.; Luo, B.; Hou, G. Force coefficient prediction for drilling of UD-CFRP based on FEM simulation of orthogonal cutting. Int. J. Adv. Manuf. Technol. 2019, 104, 3695–3716. [Google Scholar] [CrossRef]
- Chatterjee, S.; Mahapatra, S.S.; Abhishek, K. Simulation and optimization of machining parameters in drilling of titanium alloys. Simul. Model. Pract. Theory 2016, 62, 31–48. [Google Scholar] [CrossRef]
- Attanasio, A.; Faini, F.; Outeiro, J.C. FEM Simulation of Tool Wear in Drilling. Procedia CIRP 2017, 58, 440–444. [Google Scholar] [CrossRef]
- Yang, H.; Ding, W.; Chen, Y.; Laporte, S.; Xu, J.; Fu, Y. Drilling force model for forced low frequency vibration assisted drilling of Ti-6Al-4V titanium alloy. Int. J. Mach. Tools Manuf. 2019, 146, 103438. [Google Scholar] [CrossRef]
- Geng, D.; Liu, Y.; Shao, Z.; Zhang, M.; Jiang, X.; Zhang, D. Delamination formation and suppression during rotary ultrasonic elliptical machining of CFRP. Compos. Part B Eng. 2020, 183, 107698. [Google Scholar] [CrossRef]
- Khanna, N.; Pušavec, F.; Agrawal, C.; Krolczyk, G.M. Measurement and evaluation of hole attributes for drilling CFRP composites using an indigenously developed cryogenic machining facility. Measurement 2020, 154, 107504. [Google Scholar] [CrossRef]
- Nasralla, K.; Shihab, S.K.; Mahmoud, A.K. Finite Element Modeling and Optimization of Estimated Cutting Forces during Machining of Inconel 718. Int. J. Mater. Sci. Eng. 2018, 4, 1–7. [Google Scholar] [CrossRef]
- Uçak, N.; Çiçek, A.; Oezkaya, E.; Aslantas, K. Finite element simulations of cutting force, torque, and temperature in drilling of Inconel 718. Procedia CIRP 2019, 82, 47–52. [Google Scholar] [CrossRef]
- Niranjan, D.B.; Shivashankar, G.S.; Rao, K.V.S.; Praveen, R. Optimization of Cutting Process Parameters on AL6061 Using ANOVA and TAGUCHI Method. Mater. Today Proc. 2017, 4, 10845–10849. [Google Scholar] [CrossRef]
- Eltaggaz, A.; Deiab, I. Comparison of between direct and peck drilling for large aspect ratio in Ti-6Al-4V alloy. Int. J. Adv. Manuf. Technol. 2019, 102, 2797–2805. [Google Scholar] [CrossRef]
- Eltaggaz, A.; Zawada, P.; Hegab, H.A.; Deiab, I.; Kishawy, H.A. Coolant strategy influence on tool life and surface roughness when machining ADI. Int. J. Adv. Manuf. Technol. 2017, 94, 3875–3887. [Google Scholar] [CrossRef]
- Khanafer, K.; Eltaggaz, A.; Deiab, I.; Agarwal, H.; Abdul-Latif, A. Toward sustainable micro-drilling of Inconel 718 superalloy using MQL-Nanofluid. Int. J. Adv. Manuf. Technol. 2020, 107, 3459–3469. [Google Scholar] [CrossRef]
- Guo, Y.; Loenders, J.; Duflou, J.; Lauwers, B. Optimization of Energy Consumption and Surface Quality in Finish Turning. Procedia CIRP 2012, 1, 512–517. [Google Scholar] [CrossRef]
- Zhou, L.; Li, J.; Li, F.; Mendis, G.; Sutherland, J.W. Optimization Parameters for Energy Efficiency in End milling. Procedia CIRP 2018, 69, 312–317. [Google Scholar] [CrossRef]
- Vankanti, V.K.; Ganta, V. Optimization of process parameters in drilling of GFRP composite using Taguchi method. J. Mater. Res. Technol. 2014, 3, 35–41. [Google Scholar] [CrossRef] [Green Version]
- Gopalsamy, B.; Mondal, B.; Ghosh, S. Taguchi method and ANOVA: An approach for process parameters optimization of hard machining while machining hardened steel. J. Sci. Ind. Res. 2009, 68, 686–695. [Google Scholar]
- Third Wave AdvantEdge, Version 7.0; Third Wave System: Minneapolis, MN, USA, 2015.
- Davoudinejad, A.; Tosello, G.; Parenti, P.; Annoni, M. 3D Finite Element Simulation of Micro End-Milling by Considering the Effect of Tool Run-Out. Micromachines 2017, 8, 187. [Google Scholar] [CrossRef] [Green Version]
- Pal, A.K.; Bhattacharyy, A.; Sen, G.C. Investigation of the Torque in drilling ductile materials. Int. J. Mach. Tool Des. Res. 1965, 4, 205–221. [Google Scholar] [CrossRef]


| Nomenclature | |||
|---|---|---|---|
| A | Yield stress (Ref. condition) | MQL | Minimum quantity lubrication |
| B | Strain hardening constant | DoC | Depth of cut |
| n | Strain hardening coefficient | Vc | Cutting speed |
| C | Strengthening coefficient—strain rate | RPM | Spindle speed |
| m | Thermal softening coefficient | fz | Feed rate |
| µ | Friction coefficient | σ | Equivalent stress |
| D | Damage parameter | ε | Equivalent plastic strain |
| Factors | Symbol | Levels (Coded) | Levels (Uncoded) |
|---|---|---|---|
| Feed Rate (mm/rev) | A | 1 2 3 | 0.5 1 1.5 |
| Inclination Angle (Degree) | B | 1 2 3 | 30 60 90 |
| Spindle Speed (rpm) | C | 1 2 3 | 1000 2000 3000 |
| Experiment | A: Feed Rate (mm/rev) | B: Inclination Angle (Degree) | C: Spindle Speed (rpm) |
|---|---|---|---|
| 1 | 1 | 1 | 1 |
| 2 | 1 | 2 | 2 |
| 3 | 1 | 3 | 3 |
| 4 | 2 | 1 | 2 |
| 5 | 2 | 2 | 3 |
| 6 | 2 | 3 | 1 |
| 7 | 3 | 1 | 3 |
| 8 | 3 | 2 | 1 |
| 9 | 3 | 3 | 2 |
| Exp. No. | Feed Rate (mm/ rev) | Inclination Angle (Degree) | Spindle Speed (rpm) | Fx (N) | Fy (N) | Fz (N) | Power (W) | Temperature (°C) |
|---|---|---|---|---|---|---|---|---|
| 1 | 0.5 | 30 | 1000 | 743.22 | 1029.81 | 3786.83 | 211.34 | 495.99 |
| 2 | 0.5 | 60 | 2000 | 860.08 | 974.40 | 8314.40 | 652.61 | 776.29 |
| 3 | 0.5 | 90 | 3000 | 827.47 | 818.87 | 7614.17 | 885.55 | 834.76 |
| 4 | 1 | 30 | 2000 | 1457.63 | 1412.59 | 10,220.23 | 750.82 | 732.83 |
| 5 | 1 | 60 | 3000 | 1448.24 | 1498.41 | 14,032.19 | 1383.23 | 763.28 |
| 6 | 1 | 90 | 1000 | 1088.13 | 1110.85 | 7078.90 | 325.29 | 519.06 |
| 7 | 1.5 | 30 | 3000 | 1908.80 | 1550.52 | 10,505.76 | 786.87 | 654.49 |
| 8 | 1.5 | 60 | 1000 | 1702.09 | 1692.23 | 8367.29 | 296.48 | 439.51 |
| 9 | 1.5 | 90 | 2000 | 1786.71 | 1904.36 | 7499.99 | 446.26 | 435.51 |
| Feed Rate (mm/rev) | Inclination Angle (Degree) | Spindle Speed (rpm) | Fx (N) | Fy (N) | Fz (N) | S/N Ratio for Fx (dB) | S/N Ratio for Fy (dB) | S/N Ratio for Fz (dB) |
|---|---|---|---|---|---|---|---|---|
| 0.5 | 30 | 1000 | 743.22 | 1029.81 | 3786.83 | −57.4223 | −60.2552 | −71.5655 |
| 0.5 | 60 | 2000 | 860.08 | 974.40 | 8314.40 | −58.6908 | −59.7748 | −78.3966 |
| 0.5 | 90 | 3000 | 827.47 | 818.87 | 7614.17 | −58.3551 | −58.2643 | −77.6325 |
| 1 | 30 | 2000 | 1457.63 | 1412.59 | 10,220.23 | −63.2729 | −63.0003 | −80.1892 |
| 1 | 60 | 3000 | 1448.24 | 1498.41 | 14,032.19 | −63.2168 | −63.5126 | −82.9425 |
| 1 | 90 | 1000 | 1088.13 | 1110.85 | 7078.90 | −60.7336 | −60.9131 | −76.9993 |
| 1.5 | 30 | 3000 | 1908.80 | 1550.52 | 10,505.76 | −65.6152 | −63.8096 | −80.4285 |
| 1.5 | 60 | 1000 | 1702.09 | 1692.23 | 8367.29 | −64.6196 | −64.5692 | −78.4517 |
| 1.5 | 90 | 2000 | 1786.71 | 1904.36 | 7499.99 | −65.0411 | −65.595 | −77.5012 |
| Response | Source | DF | Seq SS | Contribution (%) | Adj SS | Adj MS | F-Value | p-Value |
|---|---|---|---|---|---|---|---|---|
| Fx | Feed Rate | 2.00 | 73.3889 | 92.95 | 73.39 | 36.6944 | 301.36 | 0.003 |
| Inclination Angle | 2.00 | 1.1722 | 1.48 | 1.17 | 0.5861 | 4.81 | 0.172 | |
| Spindle Speed | 2.00 | 4.1535 | 5.26 | 4.15 | 2.0767 | 17.06 | 0.055 | |
| Error | 2.00 | 0.2435 | 0.31 | 0.24 | 0.1218 | |||
| Total | 8.00 | 78.9581 | 100.00 | |||||
| Fy | Feed Rate | 2 | 41.346 | 84.55 | 41.346 | 20.6728 | 9.82 | 0.092 |
| Inclination Angle | 2 | 1.71 | 3.50 | 1.71 | 0.8552 | 0.41 | 0.711 | |
| Spindle Speed | 2 | 1.634 | 3.34 | 1.634 | 0.8168 | 0.39 | 0.721 | |
| Error | 2 | 4.212 | 8.61 | 4.212 | 2.1062 | |||
| Total | 8 | 48.902 | 100.00 | |||||
| Fz | Feed Rate | 2 | 27.603 | 35.49 | 27.603 | 13.802 | 7.54 | 0.117 |
| Inclination Angle | 2 | 12.947 | 16.65 | 12.947 | 6.473 | 3.54 | 0.22 | |
| Spindle Speed | 2 | 33.565 | 43.16 | 33.565 | 16.782 | 9.17 | 0.098 | |
| Error | 2 | 3.66 | 4.71 | 3.66 | 1.83 | |||
| Total | 8 | 77.775 | 100.00 |
| Level | Feed Rate (dB) | Inclination Angle (dB) | Spindle Speed (dB) | |
|---|---|---|---|---|
| Fx | 1 | −58.16 | −62.10 | −60.93 |
| 2 | −62.41 | −62.18 | −62.33 | |
| 3 | −65.09 | −61.38 | −62.40 | |
| Delta | 6.94 | 0.80 | 1.47 | |
| Rank | 1 | 3 | 2 | |
| Fy | 1 | −59.43 | −62.36 | −61.91 |
| 2 | −62.48 | −62.62 | −62.79 | |
| 3 | −64.66 | −61.59 | −61.86 | |
| Delta | 5.23 | 1.03 | 0.93 | |
| Rank | 1 | 2 | 3 | |
| Fz | 1 | −75.86 | −77.39 | −75.67 |
| 2 | −80.04 | −79.93 | −78.70 | |
| 3 | −78.79 | −77.38 | −80.33 | |
| Delta | 4.18 | 2.55 | 4.66 | |
| Rank | 2 | 3 | 1 |
| Feed Rate (mm/rev) | Inclination Angle (Degree) | Spindle Speed (rpm) | Power (W) | S/N Ratio for Power (dB) |
|---|---|---|---|---|
| 0.5 | 30 | 1000 | 211.34 | −46.4997 |
| 0.5 | 60 | 2000 | 652.61 | −56.2931 |
| 0.5 | 90 | 3000 | 885.55 | −58.9442 |
| 1 | 30 | 2000 | 750.82 | −57.5107 |
| 1 | 60 | 3000 | 1383.23 | −62.8179 |
| 1 | 90 | 1000 | 325.29 | −50.2453 |
| 1.5 | 30 | 3000 | 786.87 | −57.9181 |
| 1.5 | 60 | 1000 | 296.48 | −49.4398 |
| 1.5 | 90 | 2000 | 446.26 | −52.9918 |
| Source | DF | Seq SS | Contribution (%) | Adj SS | Adj MS | F-Value | p-Value |
|---|---|---|---|---|---|---|---|
| Feed Rate | 2 | 20.505 | 9.22% | 20.505 | 10.253 | 9.45 | 0.096 |
| Inclination Angle | 2 | 9.388 | 4.22% | 9.388 | 4.694 | 4.33 | 0.188 |
| Spindle Speed | 2 | 190.307 | 85.58% | 190.307 | 95.154 | 87.69 | 0.011 |
| Error | 2 | 2.170 | 0.98% | 2.170 | 1.085 | ||
| Total | 8 | 222.371 | 100.00% |
| Level | Feed Rate (dB) | Inclination Angle (dB) | Spindle Speed (dB) |
|---|---|---|---|
| 1 | −53.91 | −53.98 | −48.73 |
| 2 | −56.86 | −56.18 | −55.60 |
| 3 | −53.45 | −54.06 | −59.89 |
| Delta | 3.41 | 2.21 | 11.17 |
| Rank | 2 | 3 | 1 |
| Feed Rate (mm/rev) | Inclination Angle (deg) | Spindle Speed (rpm) | Temperature (°C) | S/N Ratio for Temperature (dB) |
|---|---|---|---|---|
| 0.5 | 30 | 1000 | 495.9862 | −53.9094 |
| 0.5 | 60 | 2000 | 776.2863 | −57.8004 |
| 0.5 | 90 | 3000 | 834.7598 | −58.4312 |
| 1 | 30 | 2000 | 732.8310 | −57.3001 |
| 1 | 60 | 3000 | 763.2845 | −57.6537 |
| 1 | 90 | 1000 | 519.0556 | −54.3043 |
| 1.5 | 30 | 3000 | 654.4875 | −56.3180 |
| 1.5 | 60 | 1000 | 439.5133 | −52.8594 |
| 1.5 | 90 | 2000 | 435.5083 | 52.7799 |
| Source | DF | Seq SS | Contribution | Adj SS | Adj MS | F-Value | p-Value |
|---|---|---|---|---|---|---|---|
| Feed Rate | 2 | 13.450 | 33.31% | 13.450 | 6.7251 | 3.49 | 0.223 |
| Inclination Angle | 2 | 1.388 | 3.44% | 1.388 | 0.6942 | 0.36 | 0.735 |
| Spindle Speed | 2 | 21.684 | 53.70% | 21.684 | 10.8422 | 5.62 | 0.151 |
| Error | 2 | 3.857 | 9.55% | 3.857 | 1.9286 | ||
| Total | 8 | 40.380 | 100.00% |
| Level | Feed Rate (dB) | Inclination Angle (dB) | Spindle Speed (dB) |
|---|---|---|---|
| 1 | −56.71 | −55.84 | −53.69 |
| 2 | −56.42 | −56.10 | −55.96 |
| 3 | −53.99 | −55.17 | −57.47 |
| Delta | 2.73 | 0.93 | 3.78 |
| Rank | 2 | 3 | 1 |
© 2020 by the authors. Licensee MDPI, Basel, Switzerland. This article is an open access article distributed under the terms and conditions of the Creative Commons Attribution (CC BY) license (http://creativecommons.org/licenses/by/4.0/).
Share and Cite
Pervaiz, S.; Kannan, S.; Subramaniam, A. Optimization of Cutting Process Parameters in Inclined Drilling of Inconel 718 Using Finite Element Method and Taguchi Analysis. Materials 2020, 13, 3995. https://0-doi-org.brum.beds.ac.uk/10.3390/ma13183995
Pervaiz S, Kannan S, Subramaniam A. Optimization of Cutting Process Parameters in Inclined Drilling of Inconel 718 Using Finite Element Method and Taguchi Analysis. Materials. 2020; 13(18):3995. https://0-doi-org.brum.beds.ac.uk/10.3390/ma13183995
Chicago/Turabian StylePervaiz, Salman, Sathish Kannan, and Abhishek Subramaniam. 2020. "Optimization of Cutting Process Parameters in Inclined Drilling of Inconel 718 Using Finite Element Method and Taguchi Analysis" Materials 13, no. 18: 3995. https://0-doi-org.brum.beds.ac.uk/10.3390/ma13183995