1. Introduction
The increasing population, environmental pollution and climate change effects, such as severe droughts, place a heavy burden on water resources. Industry is the sector which exerts the strongest environmental pressure on water quality. Along with its intensive development, increasing amounts of new and complex chemical compounds occur, which together with wastewater, as well as municipal and industrial wastes, infiltrate into the natural environment, usually in the first stage during migration to surface waters [
1,
2]. Since industrial wastewater is characterized by heterogeneous composition and the content of numerous pollutants with a broad spectrum of physicochemical properties (toxic compounds, dyes, pigments, heavy metals), their efficient treatment requires the application and combination of numerous methods [
3]. In this aspect, the results of the latest studies indicate the great potential of technologies based on the process synergy [
4,
5,
6,
7,
8], among which much attention is devoted to the application of sorption with activated carbon as sorbent and the advanced oxidation methods [
9,
10,
11,
12,
13,
14,
15]. Both adsorption [
16,
17,
18] and advanced oxidation processes (AOPs) [
19,
20,
21,
22] are efficient methods for removing hardly-biodegradable compounds from wastewater, however, these technologies have certain limitations. The popularization of the adsorption processes is hindered by the high costs of the applied adsorbents as well as the issues with the regeneration or disposal of the adsorbents spent in the treatment process. In turn, the advanced oxidation methods often require the use of large doses of oxidizers and specialized, expensive devices, including ozone and ultrasound generators, or ultraviolet (UV) lamps. The integration of both processes may significantly mitigate the aforementioned drawbacks. In this case, the removal of pollutants is carried out either as a single or a two-step process. In the former, the removal of pollutants involves sorption and then oxidation resulting in a simultaneous regeneration of the activated carbon. In the latter, simultaneous sorption and oxidation of organic compounds occurs. Such a solution is justified, and the research results indicate that the integration of adsorption with advanced oxidation processes may significantly improve the efficiency and shorten the treatment process, as well as reduce the costs of the conducted technological process [
23,
24,
25]. Additionally, the advanced oxidation processes can be employed for the degradation of the adsorbed organic pollutants, which simultaneously leads to the adsorbent regeneration [
26,
27].
The literature data [
28,
29,
30,
31] indicate that activated carbons catalyze the decomposition of oxidizers, such as hydrogen peroxide or ozone, generating highly reactive hydroxyl radical in the process. This reaction may be successfully used for the oxidation of organic pollutants in aqueous solutions. The system comprising activated carbon-oxidizer-organic pollution, probably involves the sorption and catalytic oxidation processes.
Despite numerous studies, the course of this process is not explained in a clear way. According to Toledo [
30], the organic compounds are first adsorbed onto the activated carbon and then oxidized, whereas Vidic [
32] believes that the catalytic role of the activated carbon in the creation of hydroxyl radicals in the reaction environment is the most important. Sanchez-Polo et al. [
33,
34] and Alvarez et al. [
35] reported that activated carbon acts as a promoter for ozone oxidation, rather than a true catalyst, because it is modified during the ozonation process. The results obtained by Dąbek et al. [
36] confirm that the decomposition of hydrogen peroxide and creation of hydroxyl radicals responsible for the oxidation of dyes occur in the presence of the activated carbon. The concentration of the oxidizer in the solution has to be matched to the amount of the oxidized substances in order to avoid the suppression of radicals. Santos et al. [
37] indicated that the chemism of the activated carbon surface affects the course of this process. Similar conclusions were drawn by Malaika et al. [
38] and Pereira et al. [
39], who indicated that both the sorption and catalytic capacities of carbon xerogel (CX) depend significantly on the chemical structure of its surface. In turn, Faria et al. [
26] noted that the activated carbon is characterized not only by high adsorption capacity but also catalytic properties due to high specific surface. Huang et al. [
31] compared several activated carbon samples before and after processing with the oxidizing agents, which increased the content of acidic surface functional group on the activated carbon. The authors observed that the decomposition activity of the modified activated carbon sample was lower in relation to hydrogen peroxide, whereas the catalytic activity in relation to the decomposition of 4-chlorophenol was slightly higher than when fresh activated carbon was used.
The results of previous research indicate that the removal of organic compounds from aqueous solution using activated carbons and oxidizing agents belonging to AOPs is a more efficient process than in the case where the oxidation and sorption processes are realized separately. However, there is no universal treatment technology using simultaneous processes. In each case, the technology is adjusted to the specific properties of wastewater to be treated. The opinions on the mechanics of this process are mixed. There is no information on the properties that should characterize the activated carbons used in these reactions and what is the influence of the oxidizing agent on the physicochemical properties of activated carbons. As indicated in previous studies [
14], the efficiency of pollution removal in simultaneous adsorption and advanced oxidation processes is governed by a broad range of parameters, the most relevant of which include the sorption and catalytic properties of the adsorbent. These parameters largely determine the process efficiency as well as the possibility of applying a sorbent under specific conditions.
The application of simultaneous methods for their optimization enables to analyze the influence of the properties of selected sorbents as well as the type and dose of the applied oxidizer on the efficiency of pollutant removal.
The application of mathematical models for predicting the course of the adsorption process with set operational sorption parameters was investigated in numerous papers [
40,
41,
42,
43]. The literature sources present numerous methods and mathematical models based on the kinetics and adsorption isotherms enabling to predict the process. The most commonly used kinetic expressions to explain the solid/liquid adsorption processes are the pseudo-first-order kinetics and pseudo-second-order kinetic models [
44,
45,
46,
47]. This approach enables modeling the process dynamics in time. Due to the high costs of conducting experiments, the methods which allow for decreasing the number of measurements, i.e., design of experiments (DoE) are highly useful. Response surface method (RSM) can be mentioned as an example [
48]. The DoE methods reduce the number of necessary measurements, which shortens the required time, decreases the material consumption and the costs of experiments [
49,
50,
51]. Due to the limited application of the models designated by means of RSM, the models devised with the data mining methods, for instance artificial neural networks (ANN), are highly useful [
52,
53,
54].
However, in a majority of cases, the models presented describe the sorption of single pollutants on selected carbon adsorbents. Moreover, greater attention was drawn to the sorption process conditions, rather than to the physicochemical properties of the employed activated carbon. As a result, the practical application of such models is limited, because they cannot be used for predicting sorption of another group of adsorbents. No information on the modeling of sorption in simultaneous processes in the presence of oxidizers was found in the literature. Therefore, devising the models for predicting sorption on activated carbons, which account for the diversity of the physicochemical parameters of a sorbent, different adsorbates and the presence of an oxidizing medium, seems to be reasonable.
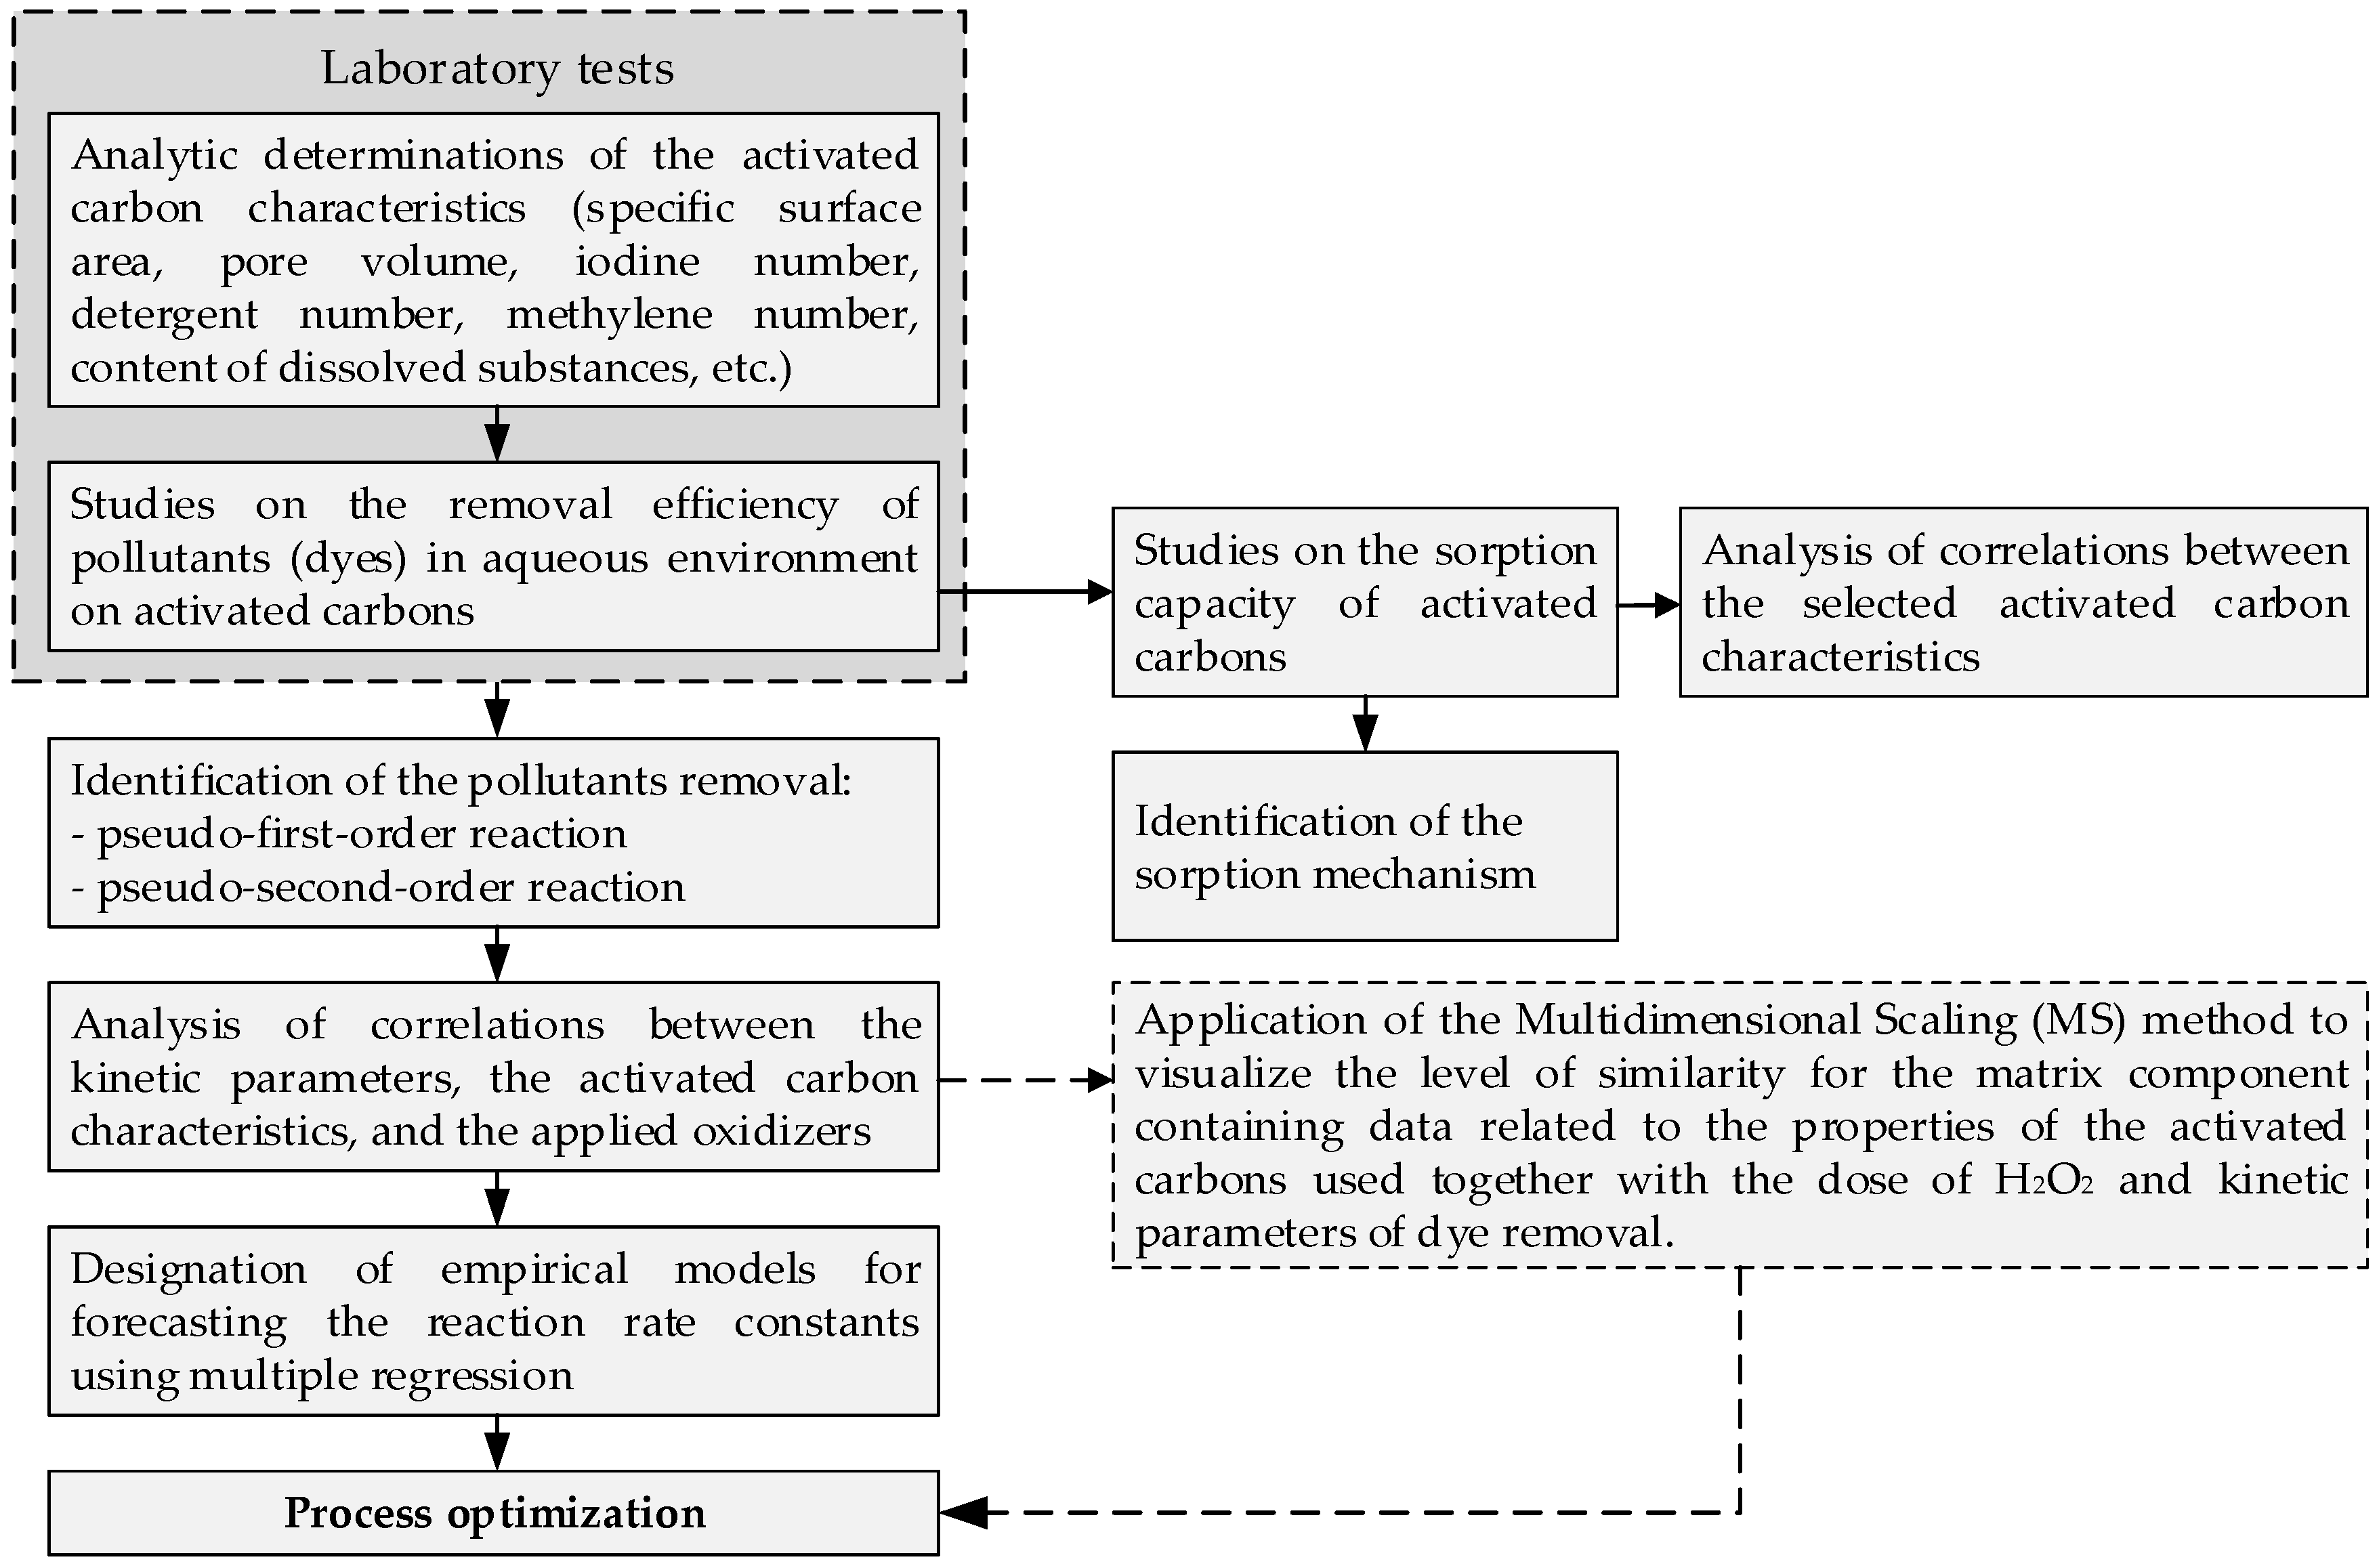
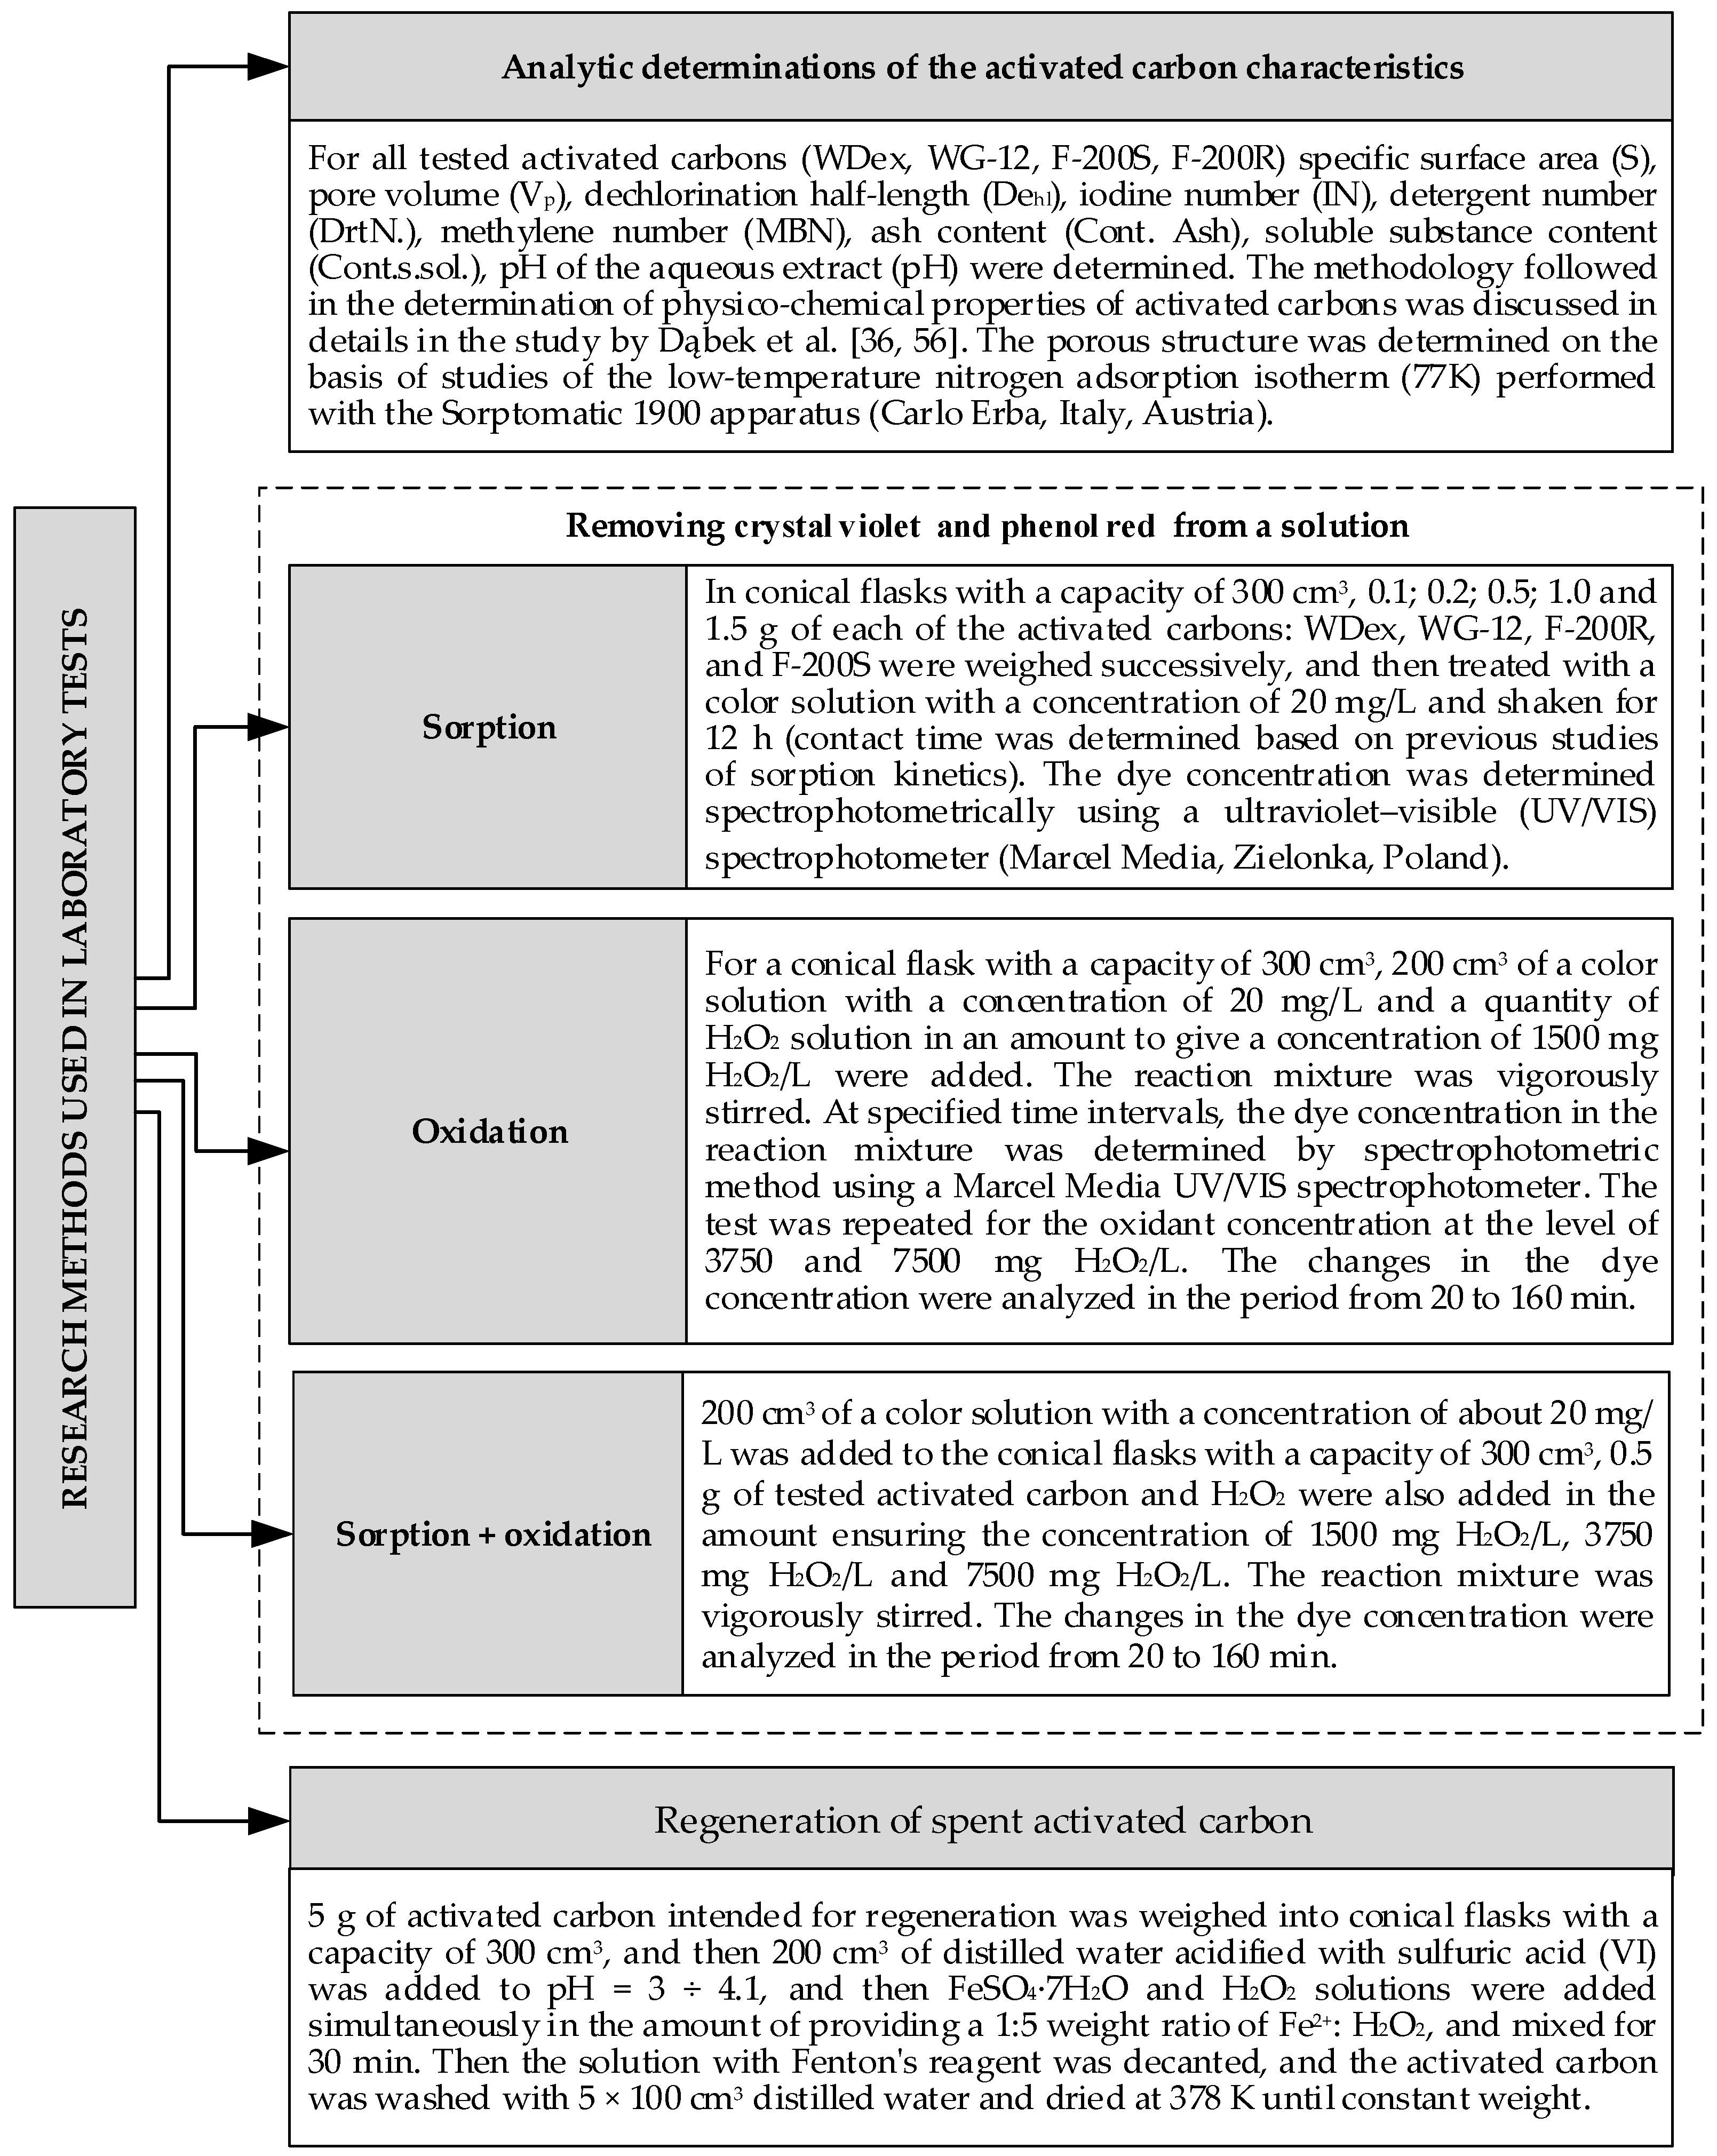
The paper presented the methodology of creating the mathematical models for optimization of a simultaneous sorption process of activated carbon adsorption with chemical oxidation of pollutants from aqueous solutions via hydrogen peroxide, on the example of crystal violet and phenol red. The article showed the methodology of conducting statistical analyses aimed at determining the influence of selected carbon characteristics (dechlorination half-length (D
ehl), methylene number (MBN), iodine number (IN), S, soluble substance content (Cont.s.sol)) and oxidizer dose (H
2O
2) on the dynamics of the sorption process (Freundlich and Langmuir isotherms) and removal of pollutants from aqueous solutions (reaction rate constants in pseudo-first- and pseudo-second-order equations). The obtained results were used to designate mathematical models (by means of the multiple regression method) for calculating the parameters describing the dynamics of sorption and pollutant removal based on the activated carbon characteristics and oxidizer dose. The calculations were performed using the results of laboratory studies as well as identification of sorption and pollutant removal dynamics in aqueous solutions [
36]. The obtained dependencies enable modeling the above-mentioned processes with diversified characteristics and equal oxidizer doses. The obtained models enable optimizing the selected parameters of the simultaneous process of pollutant removal (crystal violet and phenol red) from aqueous solutions by adjusting the oxidizer dose that enables to achieve shortest pollutant reduction time, depending on the activated carbon used.
The practical application of the devised models will enable to optimize the selection of the sorbent and the oxidizer used simultaneously for a given group of pollutants and thus will reduce the process costs of their removal from aqueous environment.
4. Conclusions
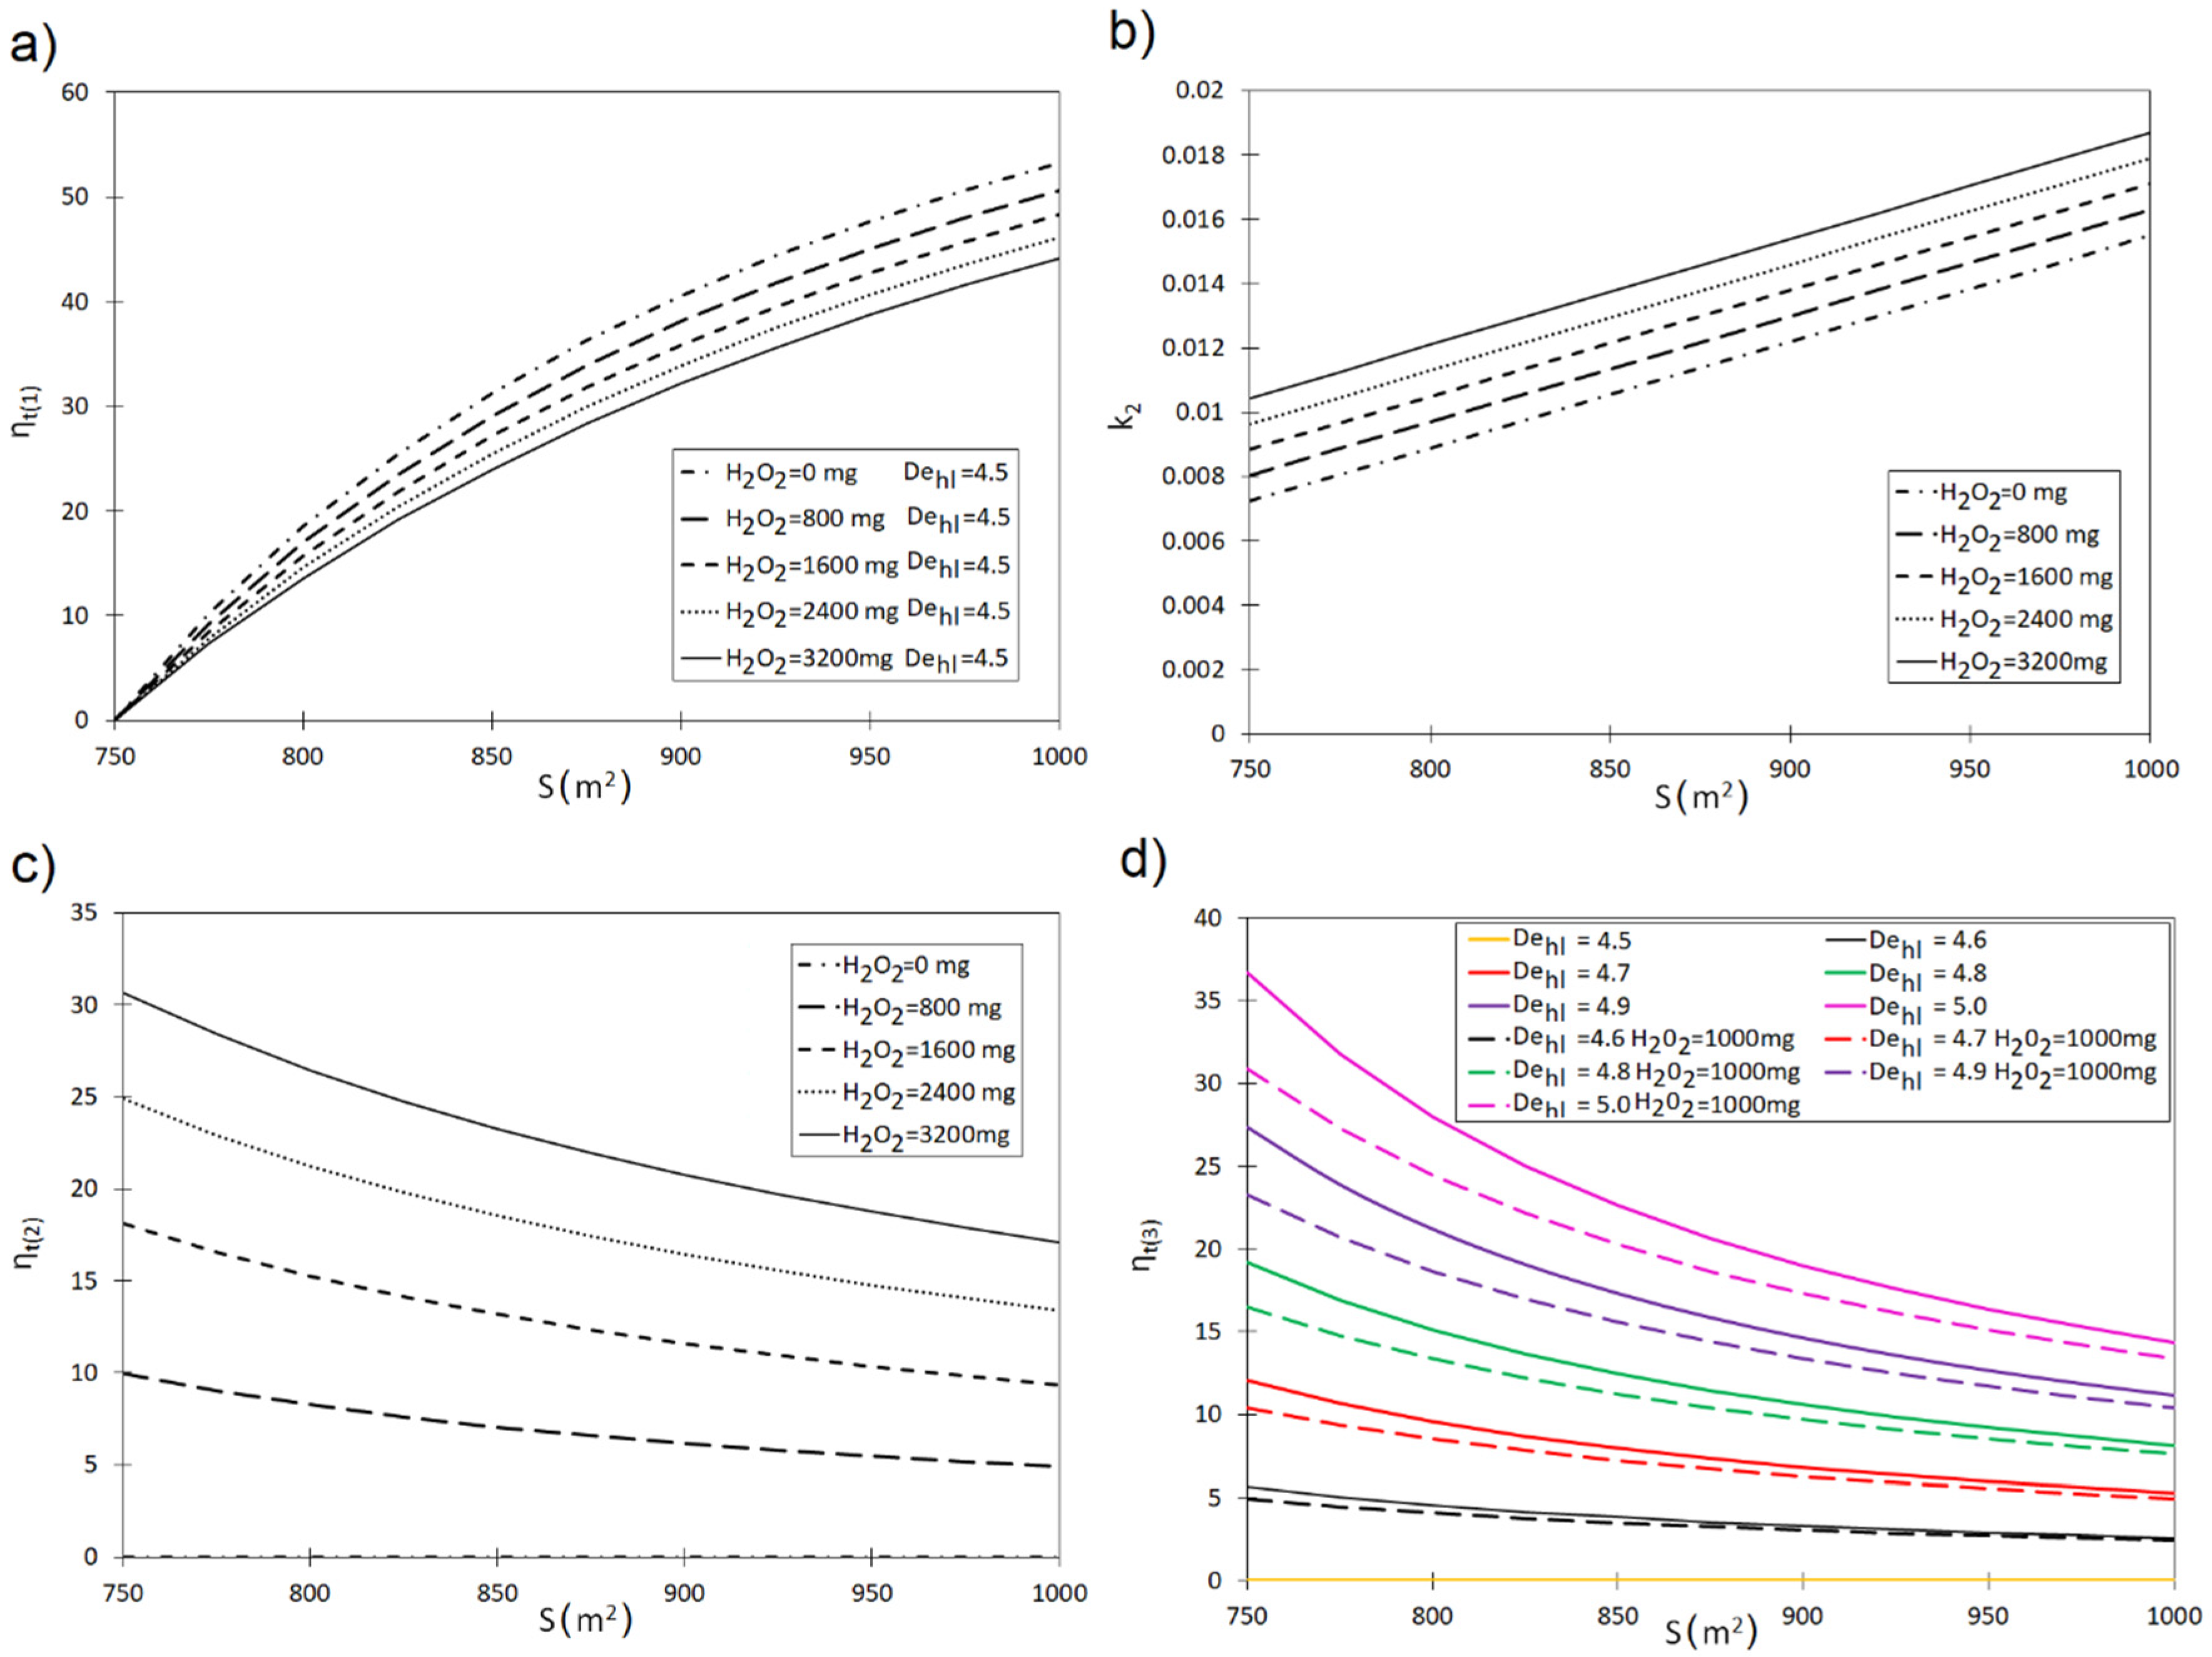
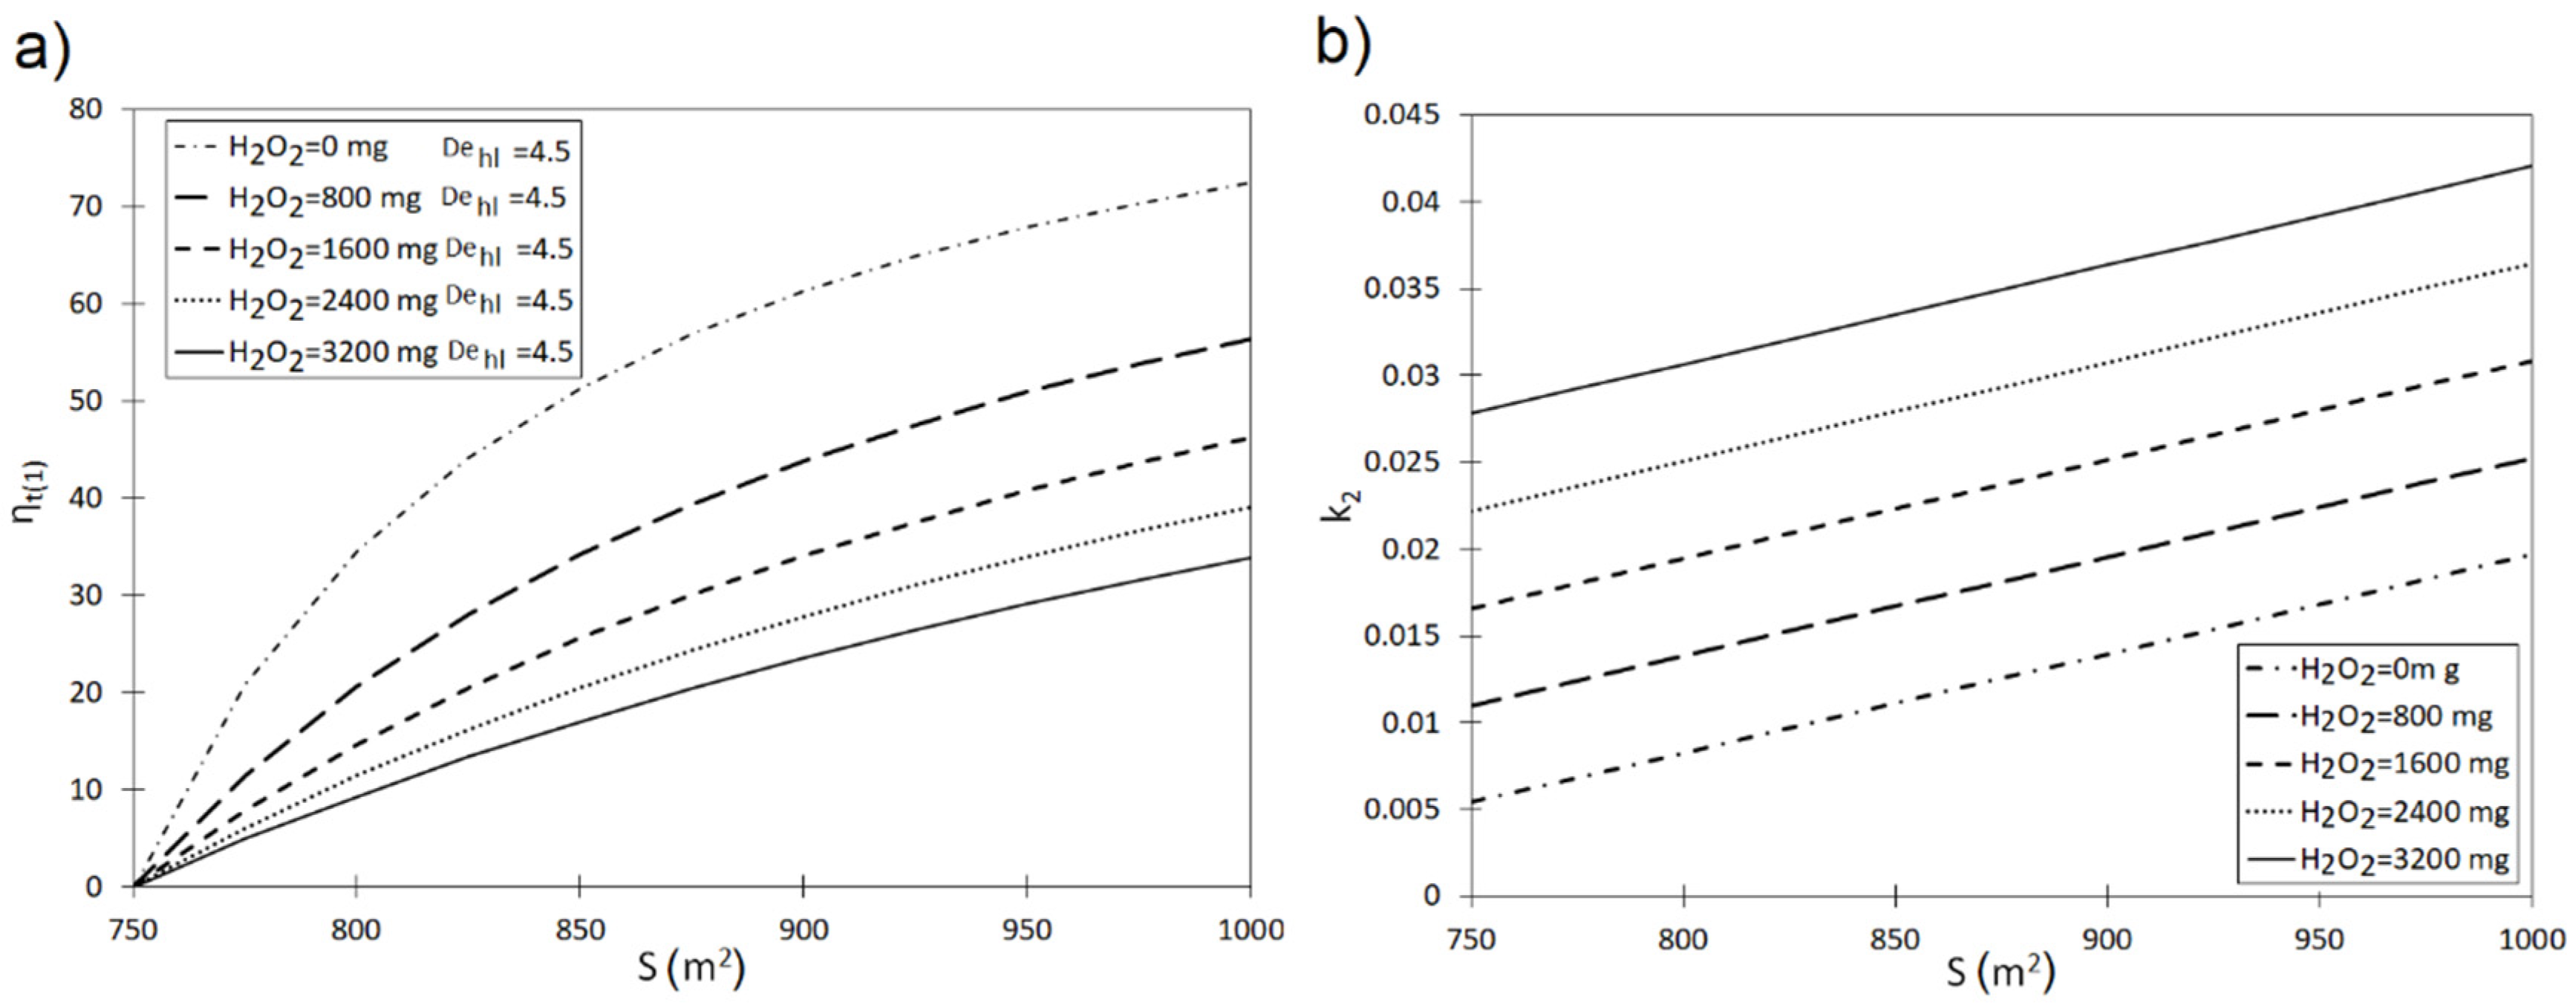
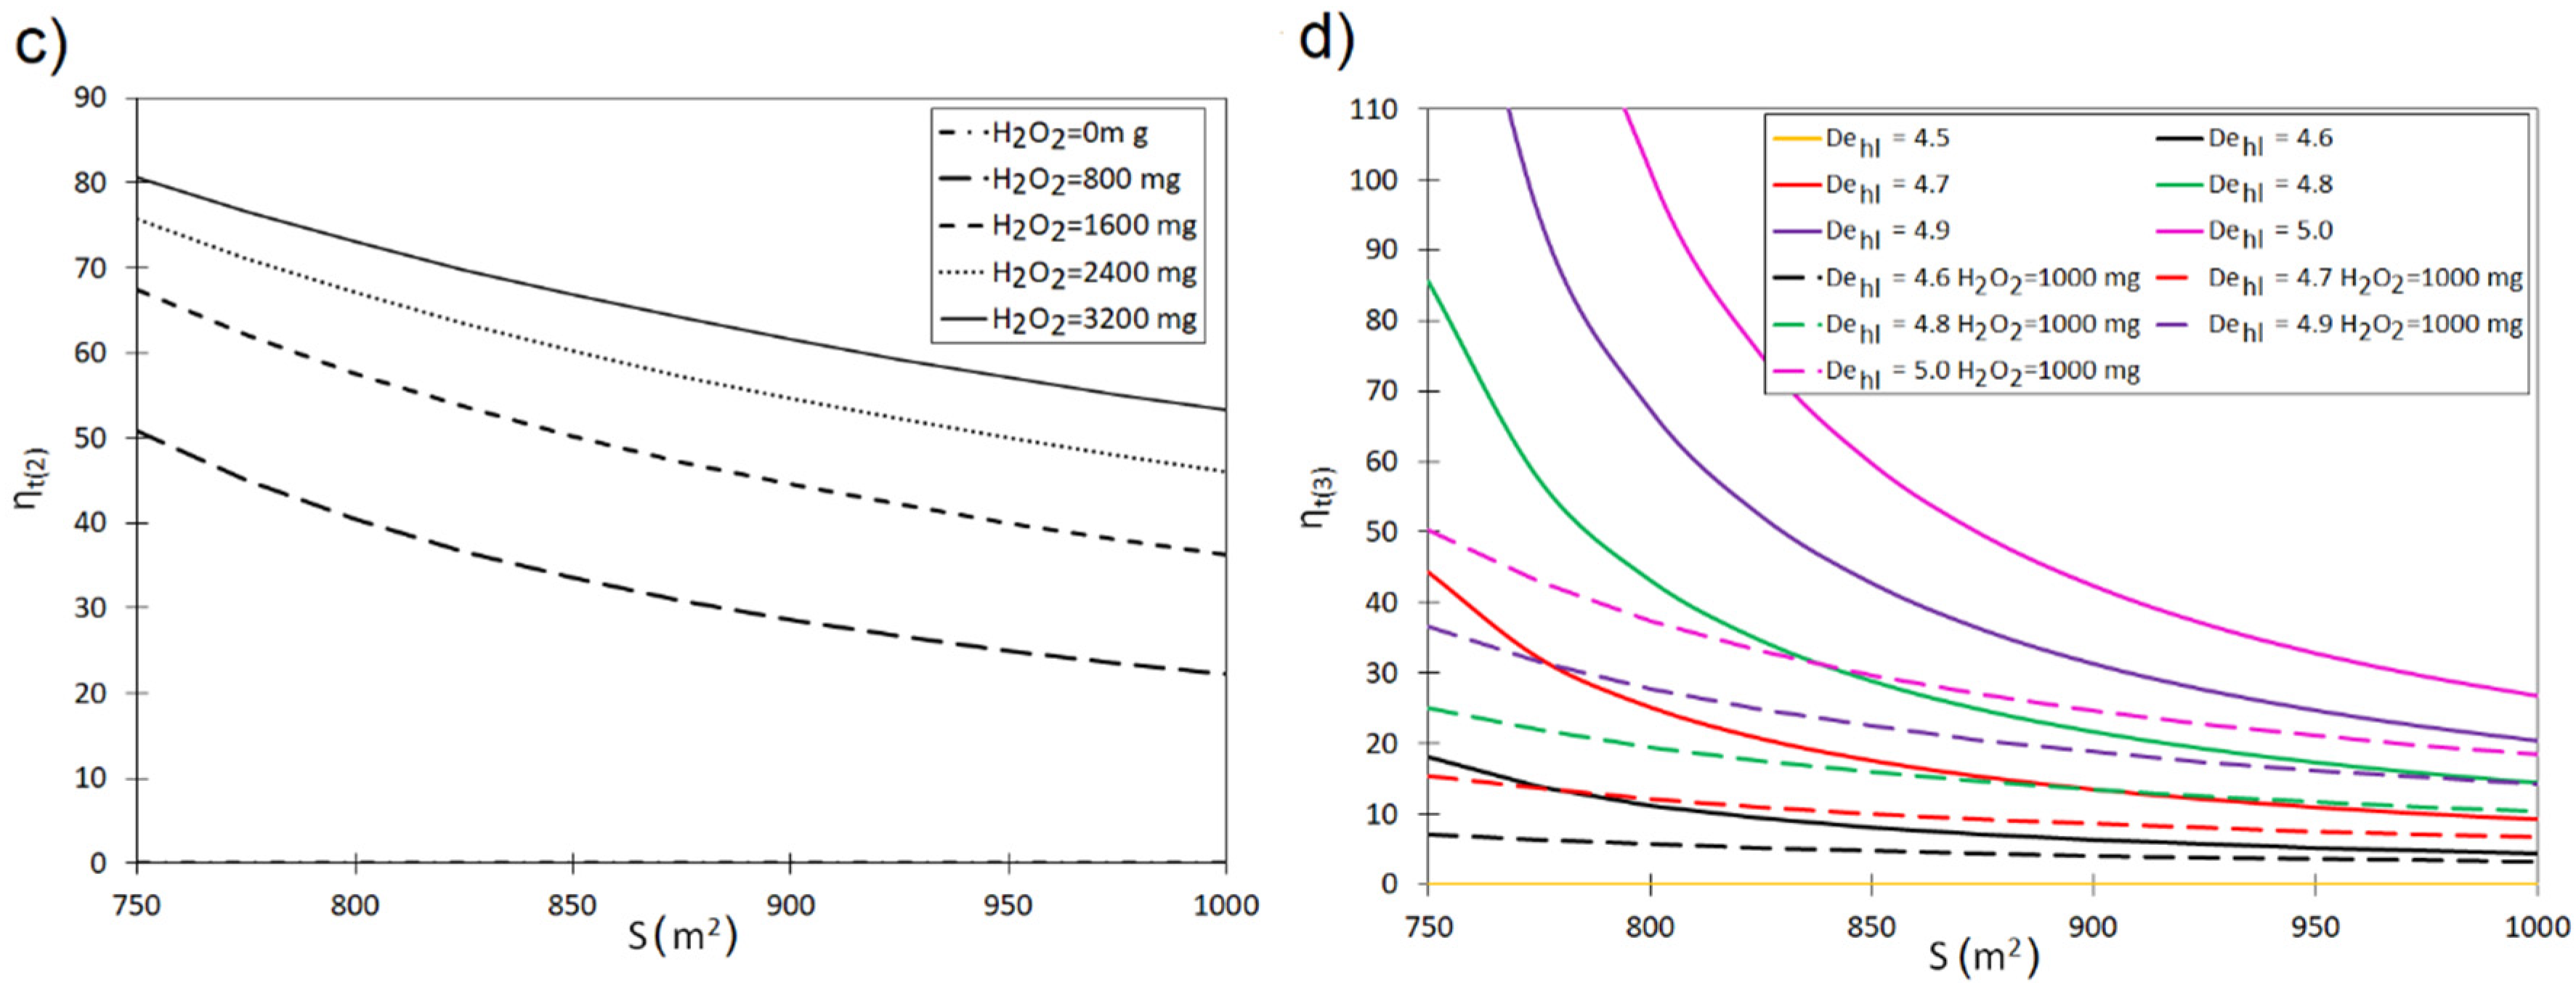
The obtained relations between the parameters in the Freudlich and Langmuir models confirm in most cases that it is possible to develop universal models in which the kinetics of the sorption process is estimated based on the characteristics of the carbons. The conducted analyses show that there is a strong correlation between the pseudo-first and second-order kinetic parameters, and the dose of the oxidizer (H2O2) as well as the characteristics of the carbons: specific surface area (S), methylene number (MBN), dechlorination half-length (Dehl). The conducted laboratory studies showed the key influence of the surface area (S) of active carbon and the dose of oxidizer (H2O2) on the course of the pollutant removal process in the aqueous environment. For example, an increase in the S value from 750 m2 to 850 m2 (phenol red) assuming a dose of H2O2 = 800 mg leads to a decrease in the removal time (required removal ratio of 90%) by 29.10%. Increasing the oxidizer dose to the value of H2O2 = 3200 mg indicates that an increase in S in the range of 750–800 m2 leads to a decrease of the minimum time required to removal the dye by 24.01% (removal ratio 90%). The addition of an oxidizer into the system leads to an increase in the value of the constants rate. For Dehl = 4.5 and S = 850 m2, the constant rate is k2 = 0.0105 (phenol red) k2 = 0.011 (crystal violet). The addition of the oxidizer in the amount of H2O2 = 1600 mg leads to an increase in their values to k2 = 0.012 and k2 = 0.023. This leads to a required degree of removal of pollutants within a shortened time. It was also found that the smaller the surface of the carbon (S), the greater the influence of the oxidizer on the dynamics of the process of dye removal from the aqueous solution. For example, in the case of S = 800 m2 and H2O2 = 1600 mg, 90% dye removal (crystal violet) can be achieved with time shortened by 57% (compared to the system without oxidizer). In turn, for S = 900 m2, the same effect of dye removal can be obtained in time shortened by 44.53%. Dechlorination half-length (Dehl) also has a significant impact on the dynamics of the process. The increase in the Dehl value leads to a decrease in the rate of pollution removal. For example, for S = 850 m2, the increase in Dehl from 4.5 to 4.7 leads to an extension of the removal time of crystal violet from aqueous solution by 17.58% (for removal ratio 90%). For S = 850 m2, the increase in Dehl from 4.5 to 4.7 results in an extension of the removal time of phenol red from solution by 7.96% (removal ratio 90%). The aforementioned correlations give the assumption for further modelling and process optimization.
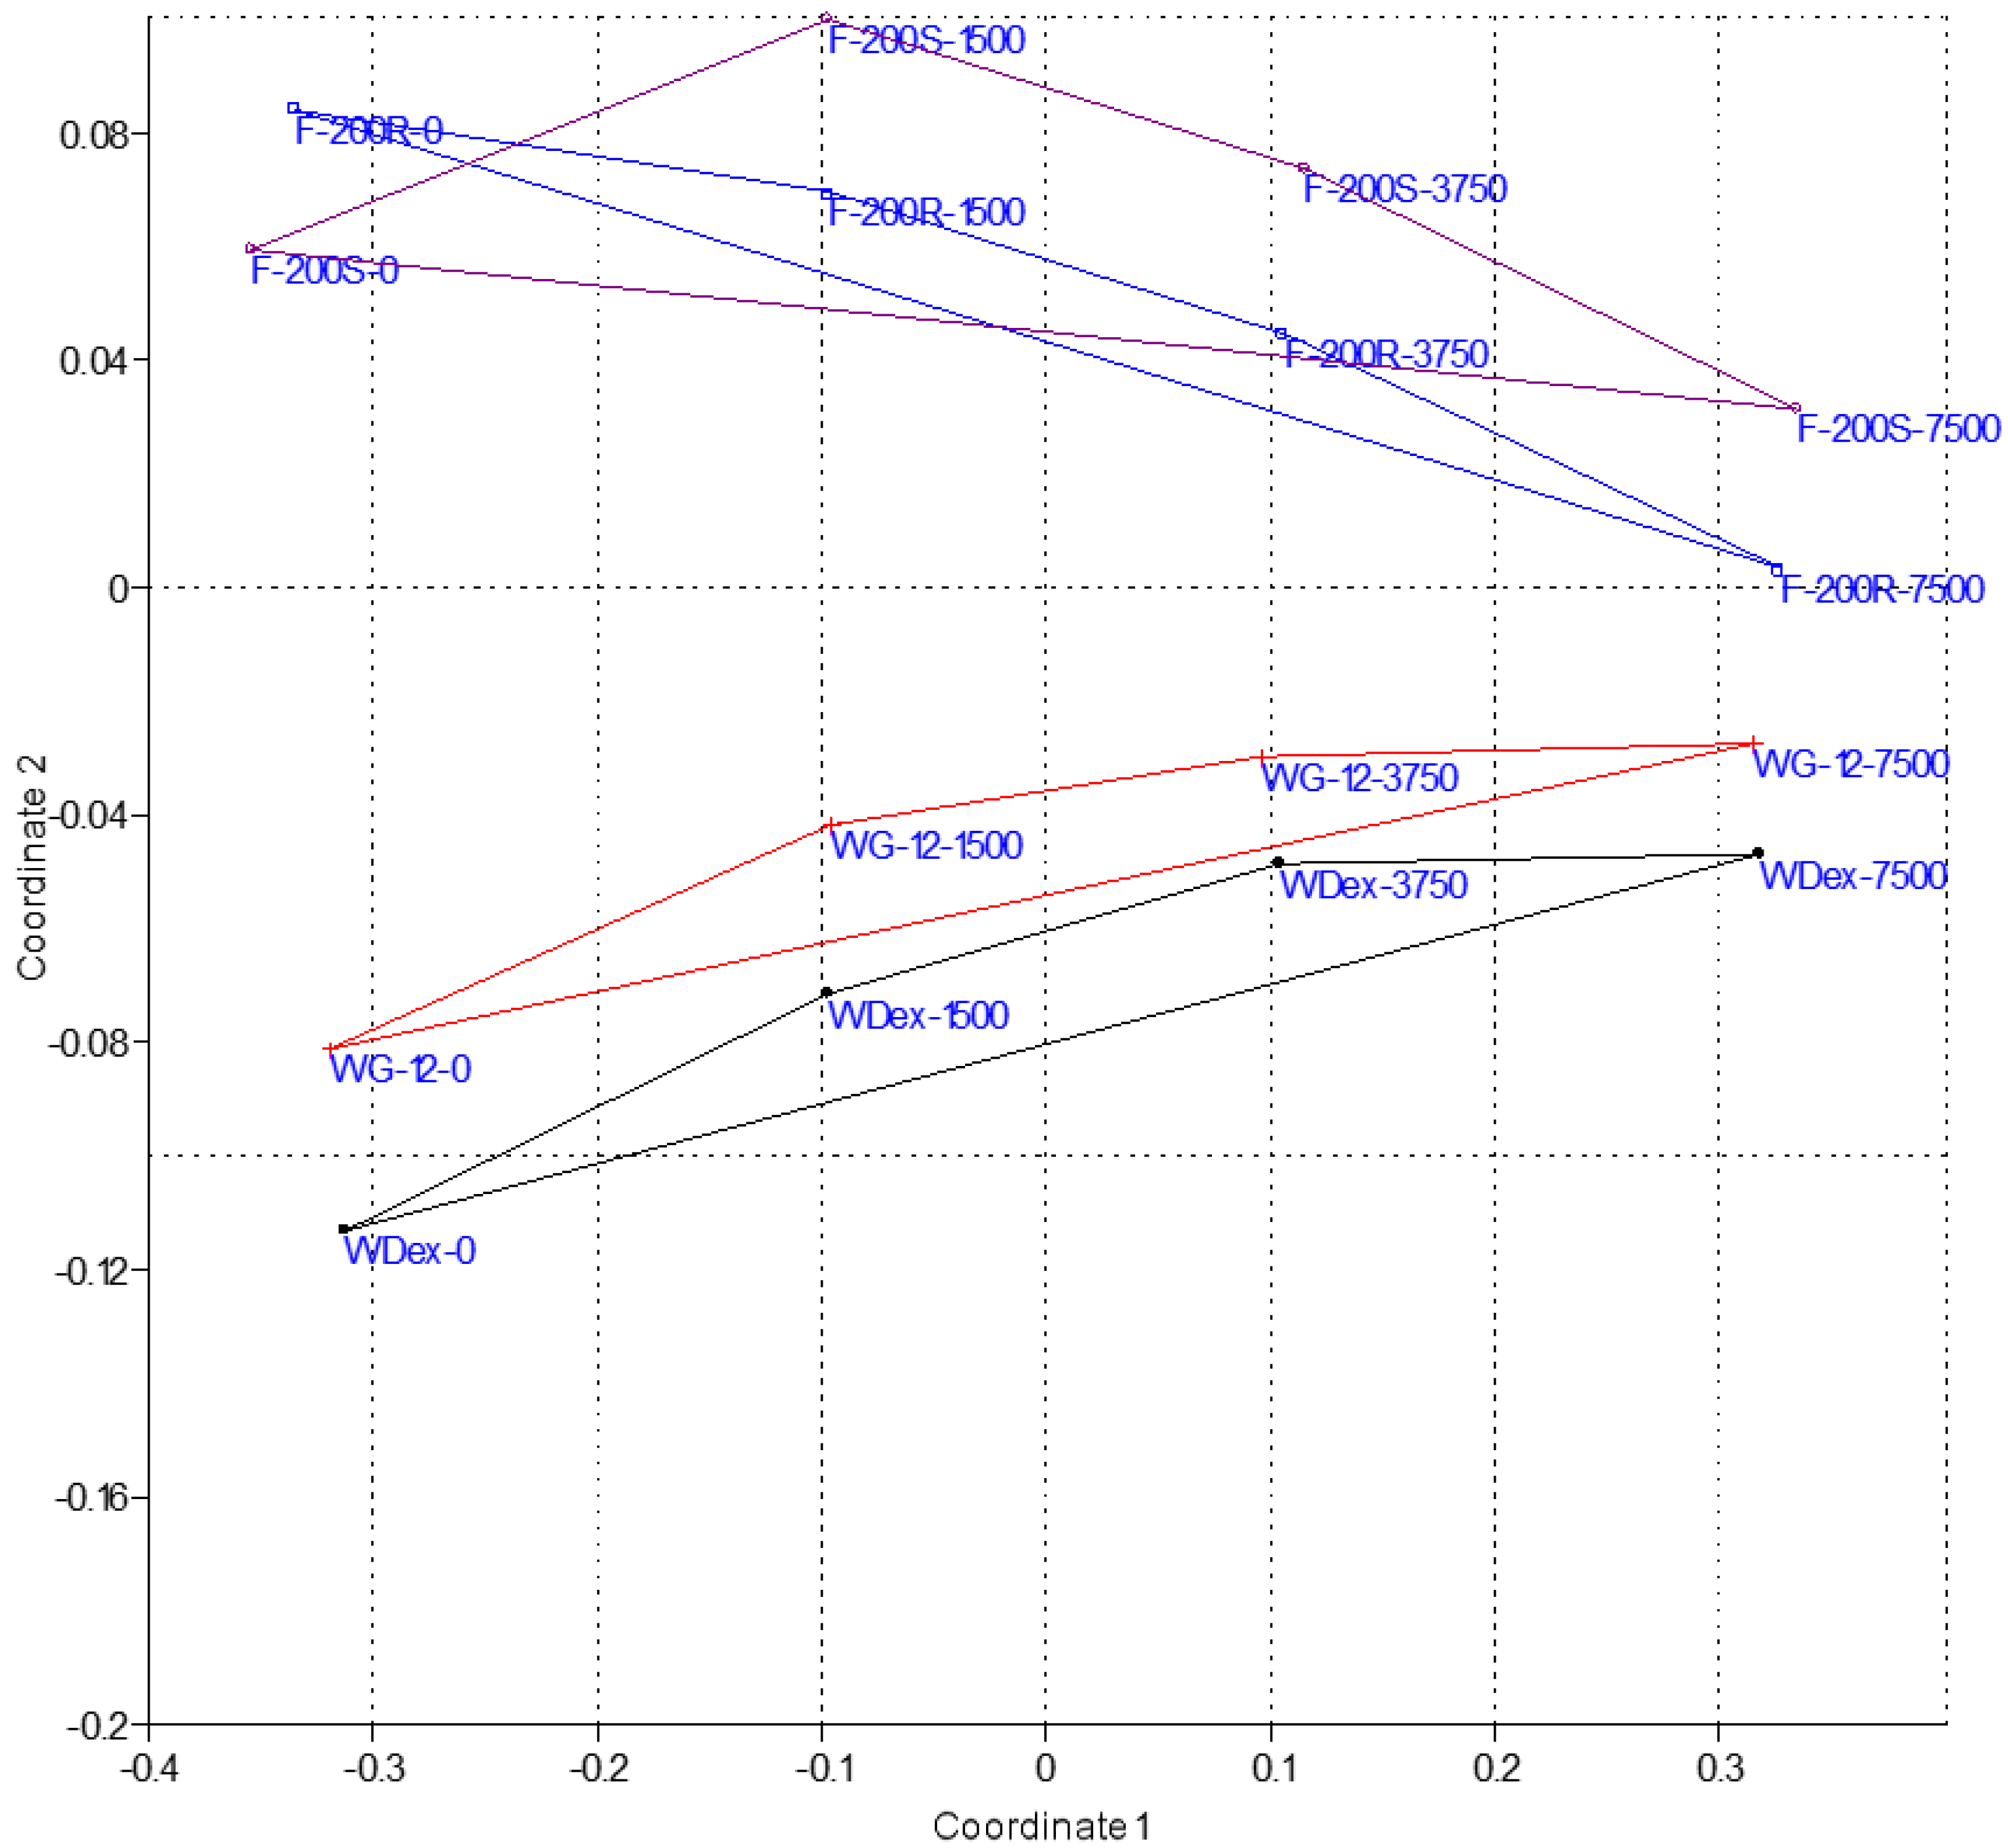
The visualization of the similarity levels for the matrix containing the data related to the properties of the applied activated carbons together with oxidizer as well as the kinetic parameters of dye removal based on the multidimensional scaling method (MDS), indicates that the similarity of the spend carbons to the general characteristics describing fresh carbons increases with the oxidizer dose. The highest dose of the oxidizer used (7500 mg H2O2/L cause that the similarities between the analyzed results of dye removal by all the carbons used (WDex, WG12, F-200S, F-200R) are much greater than in the case of the similarity between the same applied carbons with a high dose oxidizer and no oxidizer.
The developed models allow for analyzing the influence of the specific surface of activated carbon and applied different doses of the oxidizer on the change of the time of pollutants removal from aqueous solution at the required degree. The above-mentioned models also allow for analyzing the influence of the oxidizer dose increase for given surfaces of activated carbons on the decrease of the time of pollutants removal from the aqueous solution until the assumed degree achieved. The models can be also applied for determination of the impact of the change in the Dehl value on the time of pollutants removal for the assumed S values and the oxidizer dose.
The models developed on the basis of the analysis of the correlation between the kinetic parameters of the pollutant removal from the aqueous solution and the characteristics of the carbons together with the doses of the oxidizer used, are universal in nature. They allow for the prediction of simultaneous sorption and oxidation processes, taking into account the diversity of physicochemical properties of the sorbent, various adsorbates as well as the type and dose of the oxidizer. Thus, it will enable to optimize the selection of a sorbent and oxidizer used simultaneously for a given group of pollutants which allows to avoid the costly and time-consuming laboratory tests in order to adapt the process to the changing technological parameters.

 ,
, 


