Synthesis and Characterization of Cu2FeSnS4–Cu2MnSnS4 Solid Solution Microspheres


1
Department of Mineralogy, Petrography, and Geochemistry, AGH University of Science and Technology, al. Mickiewicza 30, 30-059 Kraków, Poland
2
Academic Centre for Materials and Nanotechnology, AGH University of Science and Technology, 30-059 Kraków, Poland
*
Author to whom correspondence should be addressed.
Materials 2020, 13(19), 4440; https://0-doi-org.brum.beds.ac.uk/10.3390/ma13194440
Submission received: 15 September 2020
/
Revised: 1 October 2020
/
Accepted: 3 October 2020
/
Published: 7 October 2020
Abstract
:In this study, we used a hydrothermal method to synthesize microspheres of Cu2(Mn1−xFex)SnS4 solid solution (X = 1, 0.8, 0.6, 0.4, 0.2, 0). The process was optimized to improve the crystallinity, morphology, and purity of the obtained materials. All samples were characterized by X-ray diffraction (XRD), scanning electron microscopy (SEM), energy-dispersive X-ray spectroscopy (EDS), Raman spectroscopy, and Fourier transform infrared (FTIR) spectroscopy. The following conditions were optimized: A mixture of water and ethylene glycol at the ratio of 1:7 as the reaction medium, polyvinylpyrrolidone (PVP) as the surface ligand, and reaction temperature of 195 °C for 7 days. The product of synthesis precipitated in the form of aggregates of nanocrystals, which form homogeneous, often concentric microspheres with a diameter of 1–1.5 μm. The chemical composition of the product can be well controlled by the chemical composition of the reactants. The compound Cu2(Mn1−xFex)SnS4 forms a continuous series of solid solutions.
1. Introduction
In the current era of thin-film solar cells, it is necessary to produce low-cost, high-performance single-connector solar cells with high conversion efficiency. In contrast to most thin-film solar technologies, chalcopyrite-based thin solar cells using CuInxGa1−xS(Se)2 (CIGS) solar panels offer a potentially competitive efficiency to traditional silicon panels [1,2,3]. The highest efficiency of this material achieves 23.35 [4], but they are currently very expensive to produce and the components are rare and not environment friendly. Therefore, quaternary chalcogenide semiconductors of I2-II-IV-VI4 series (where I = Cu and Ag; II = Zn, Cd, Fe, and Mn; IV = Si, Ge, and Sn; and VI = S and Se) have drawn great interest as an alternative absorber material in thin film solar cells that have reached 10% efficiency, and contains only nontoxic and Earth-abundant elements. They have potential applications not only as photovoltaic materials [5,6,7,8,9,10,11,12,13].
In this group, extensive research has been conducted on kesterites (Cu2ZnSnS4 (CZTS)) and stannites (Cu2FeSnS4 (CFTS)) [14,15]. Extensive characterization of the synthetic stannite-type material namely, Cu2MnSnS4 (CMTS), has also been conducted. Similar to CFTS, CMTS is also considered as possible photovoltaic materials, due to its suitable bandgap and the requisite optical characteristics [16]. Several methods have been developed to fabricate these materials [17,18,19,20,21,22,23,24,25,26,27,28,29,30,31,32,33,34,35,36]. A previous review article has described various methods to achieve this goal [37], which need different synthesis times (for example liquid reflux method takes 6–12 h [23], synthesized via microwave needs irradiatiion for 5 min [18] or sonochemical synthesis takes 3 h [38]). Some of these techniques require additional thermal annealing [28], which takes extra time. There is no consensus on the optimal processing method. Among these methods, the hydrothermal method has been widely used due to a simpler procedure, which is eco-friendly and economical in nature. Hydrothermal reactions have been successfully employed in the synthesis of various chemicals. A number of microporous solids have been synthesized using hydrothermal reactions. Various groups of researchers, such as geologists and mineralogists have also been able to determine the conditions necessary for their formation in nature. The use of hydrothermal synthesis facilitates the production of crystals of substances that are usually unstable near the melting point. In addition, it allows for the synthesis of large crystals with high quality. Hydrothermal synthesis can be effective both, at temperatures and pressures below the critical point for a specific solvent and under supercritical conditions. This method allows to control the chemical composition of the final product. One of the disadvantages of this method is the inability to monitor crystals during the process of their growth. Despite this, it is still popular among the industries producing nanomaterials. Although, several studies have used the conventional or microwave solvothermal/hydrothermal route for the synthesis of CZTS or CFTS, this technique still requires more work and optimization [37]. In a typical procedure, the synthesis of quaternary chalcogenide semiconductors takes 24 h [39].
Most I2–II–IV–VI4 compounds crystallize with a zinc-blende (ZB) or wurtzite (WS)-type superstructure, showing the tetragonal stannite (ZB-derived) or the orthorhombic wurtzite–stannite (WS-derived) structure [1]. The crystal structure of phases in the solid solution series of Cu2FeSnS4–Cu2MnSnS4 has been thoroughly examined in a previous study [40]. The authors determined a continuous solid solution in the series. The structure was described in the tetragonal system (the space group I–42m), where each cation is tetrahedrally coordinated to four sulfur anions in a sphalerite-like arrangement. However, several previous investigations have indicated that the formation of a certain crystal structure can be closely related to the reaction conditions [see 1 and the literature cited, therein]. So far, the methods of synthesis of CFTS–CMTS solid solution series are poorly studied. In a previous study [40], the material was synthesized using quartz ampoules sealed under Ar atmosphere and heated to 850 °C for about 72 h. This method may have little use in future industrial applications.
In this study, we prepared a series of compounds of Cu2(Mn1−xFex)SnS4 (X = 1, 0.8, 0.6, 0.4, 0.2, 0) in the form of spherical microparticles by using the hydrothermal synthesis method requiring simple reactants and relatively low temperature. We experimentally identified the optimal conditions for the synthesis of these compounds. This method the morphology and chemical composition of the resulting material to be controlled, which precipitates in the form of uniform microspheres composed of nanocrystals. It contributes to the development of production of photovoltaic materials with the required stoichiometry by means of a convenient synthesis technique by controlling the ratio of precursors.
2. Materials and Methods
2.1. Materials
Analytical grade ethylene glycol (EG), copper (II) chloride dihydrate (CuCl2⋅2H2O), tin (IV) chloride pentahydrate (SnCl4⋅5H2O), ferrous chloride tetrahydrate (FeCl2⋅4H2O), manganese chloride tetrahydrate (MnCl2⋅4H2O), thiourea (Tu), polyvinylpyrrolidone (PVP, Mw = 55 g/mol), and double distilled water were used in the synthesis. All chemicals were purchased from Sigma Aldrich (Merck, Darmstadt, Germany) and were used as received.
2.2. Synthesis of Microspheres
The solutions of 1 mmol copper (II) chloride dihydrate, 0.5 mmol tin (IV) chloride pentahydrate, 0.5 mmol ferrous chloride tetrahydrate, 0.5 mmol manganese chloride tetrahydrate, and 2.5 mmol Tu were mixed in the proportions resulting in a molar ratio of Cu, (Mn + Fe), Sn, and S equal to 2:1:1:4. To obtain solutions with different content of Fe and Mn, the molar ratio of Fe/(Mn + Fe) in the solution was varied (0.0, 0.2, 0.4, 0.6, 0.8, and 1). The solution was mixed with 1.68 g PVP, 24–96 mL EG, and 0–72 mL double distilled water under magnetic stirring. Various concentrations of EG and H2O were prepared in different ratios: 1:0, 7:1, 3:1, 5:3, 1:1, 3:5, and 1:3. The mixture (96 mL) was transferred to two Teflon-lined containers and maintained at various temperatures (in the range of 160–195 °C) for various time intervals (from 1 to 14 days). The products were washed several times with water and acetone, centrifuged, and air-dried at 60 °C.
2.3. Characterization of Microspheres
The morphology of CFTS microspheres was characterized by using scanning electron microscopy (SEM, FEI Quanta 200 FEG and FEI Sirion 200, FEI, Hillsboro, OR, USA) equipped with secondary electron (SE) and back-scattered electron (BSE) detectors. An energy dispersive spectrometer (EDS, FEI Quanta (FEI, Hillsboro, OR, USA) was employed to monitor variations in the chemical composition of the microspheres. Samples of microspheres were fixed on a substrate with double-sided sticky tape and imaged without coating in a low vacuum. The selected samples were immersed in epoxy and polished to reveal the internal structure of the particles. Powder X-ray diffraction (XRD) patterns were recorded with Rigaku SmartLab diffractometer (Neu-Isenburg, Tokyo, Japan) in the range of 2–75° 2θ with a step size of 0.05° using graphite-monochromatized Cu Kα radiation. The phases were identified using the International Centre for Diffraction Data (ICDD) database and XRAYAN software (v 4.0.5, “KOMA” – Henryk Marciniak, Warszawa, Poland) [41]. For Raman spectroscopy, Thermo Scientific DXR Raman Microscope (Thermo Fisher Scientific, Waltham, MA, USA) was used. Spectra were recorded at room temperature with a green laser (k = 532 nm, laser power of 10 mW, slit aperture of 25 μm, resolution of 1.9 cm−1 in the range between 100 and 3579 cm−1). A total of 10 exposures of 3 s were taken for each spectrum. Spectra were interpreted with the aid of OMNIC for Dispersive Raman software (v 8.3.103, Thermo Fisher Scientific, Waltham, MA, USA). Infrared spectra were acquired using Bruker Sensor 27 spectrometer (BRUKER, Ettlingen, Germany) in the range of 400–4000 cm−1 (64 scans at the resolution of 1 cm−1). Prior to analysis, KBr pellets were prepared by homogenizing 200 mg of ground KBr with 4 mg of the sample.
3. Results and Discussion
3.1. Optimization of the EG:H2O Ratio
To obtain the optimum condition for the formation of isomorphic series of Cu2(Mn1−xFex)SnS4 microspheres, the effect of the reaction conditions (including the ratio of EG to H2O, the reaction temperature, and duration of the synthesis) on the morphological and structural properties of as-synthesized CFTS and CMTS microspheres was analyzed. In the next step, the optimum conditions were chosen to synthesize and characterize all the members of the stannite isomorphic series with Mn-Fe substitutions.
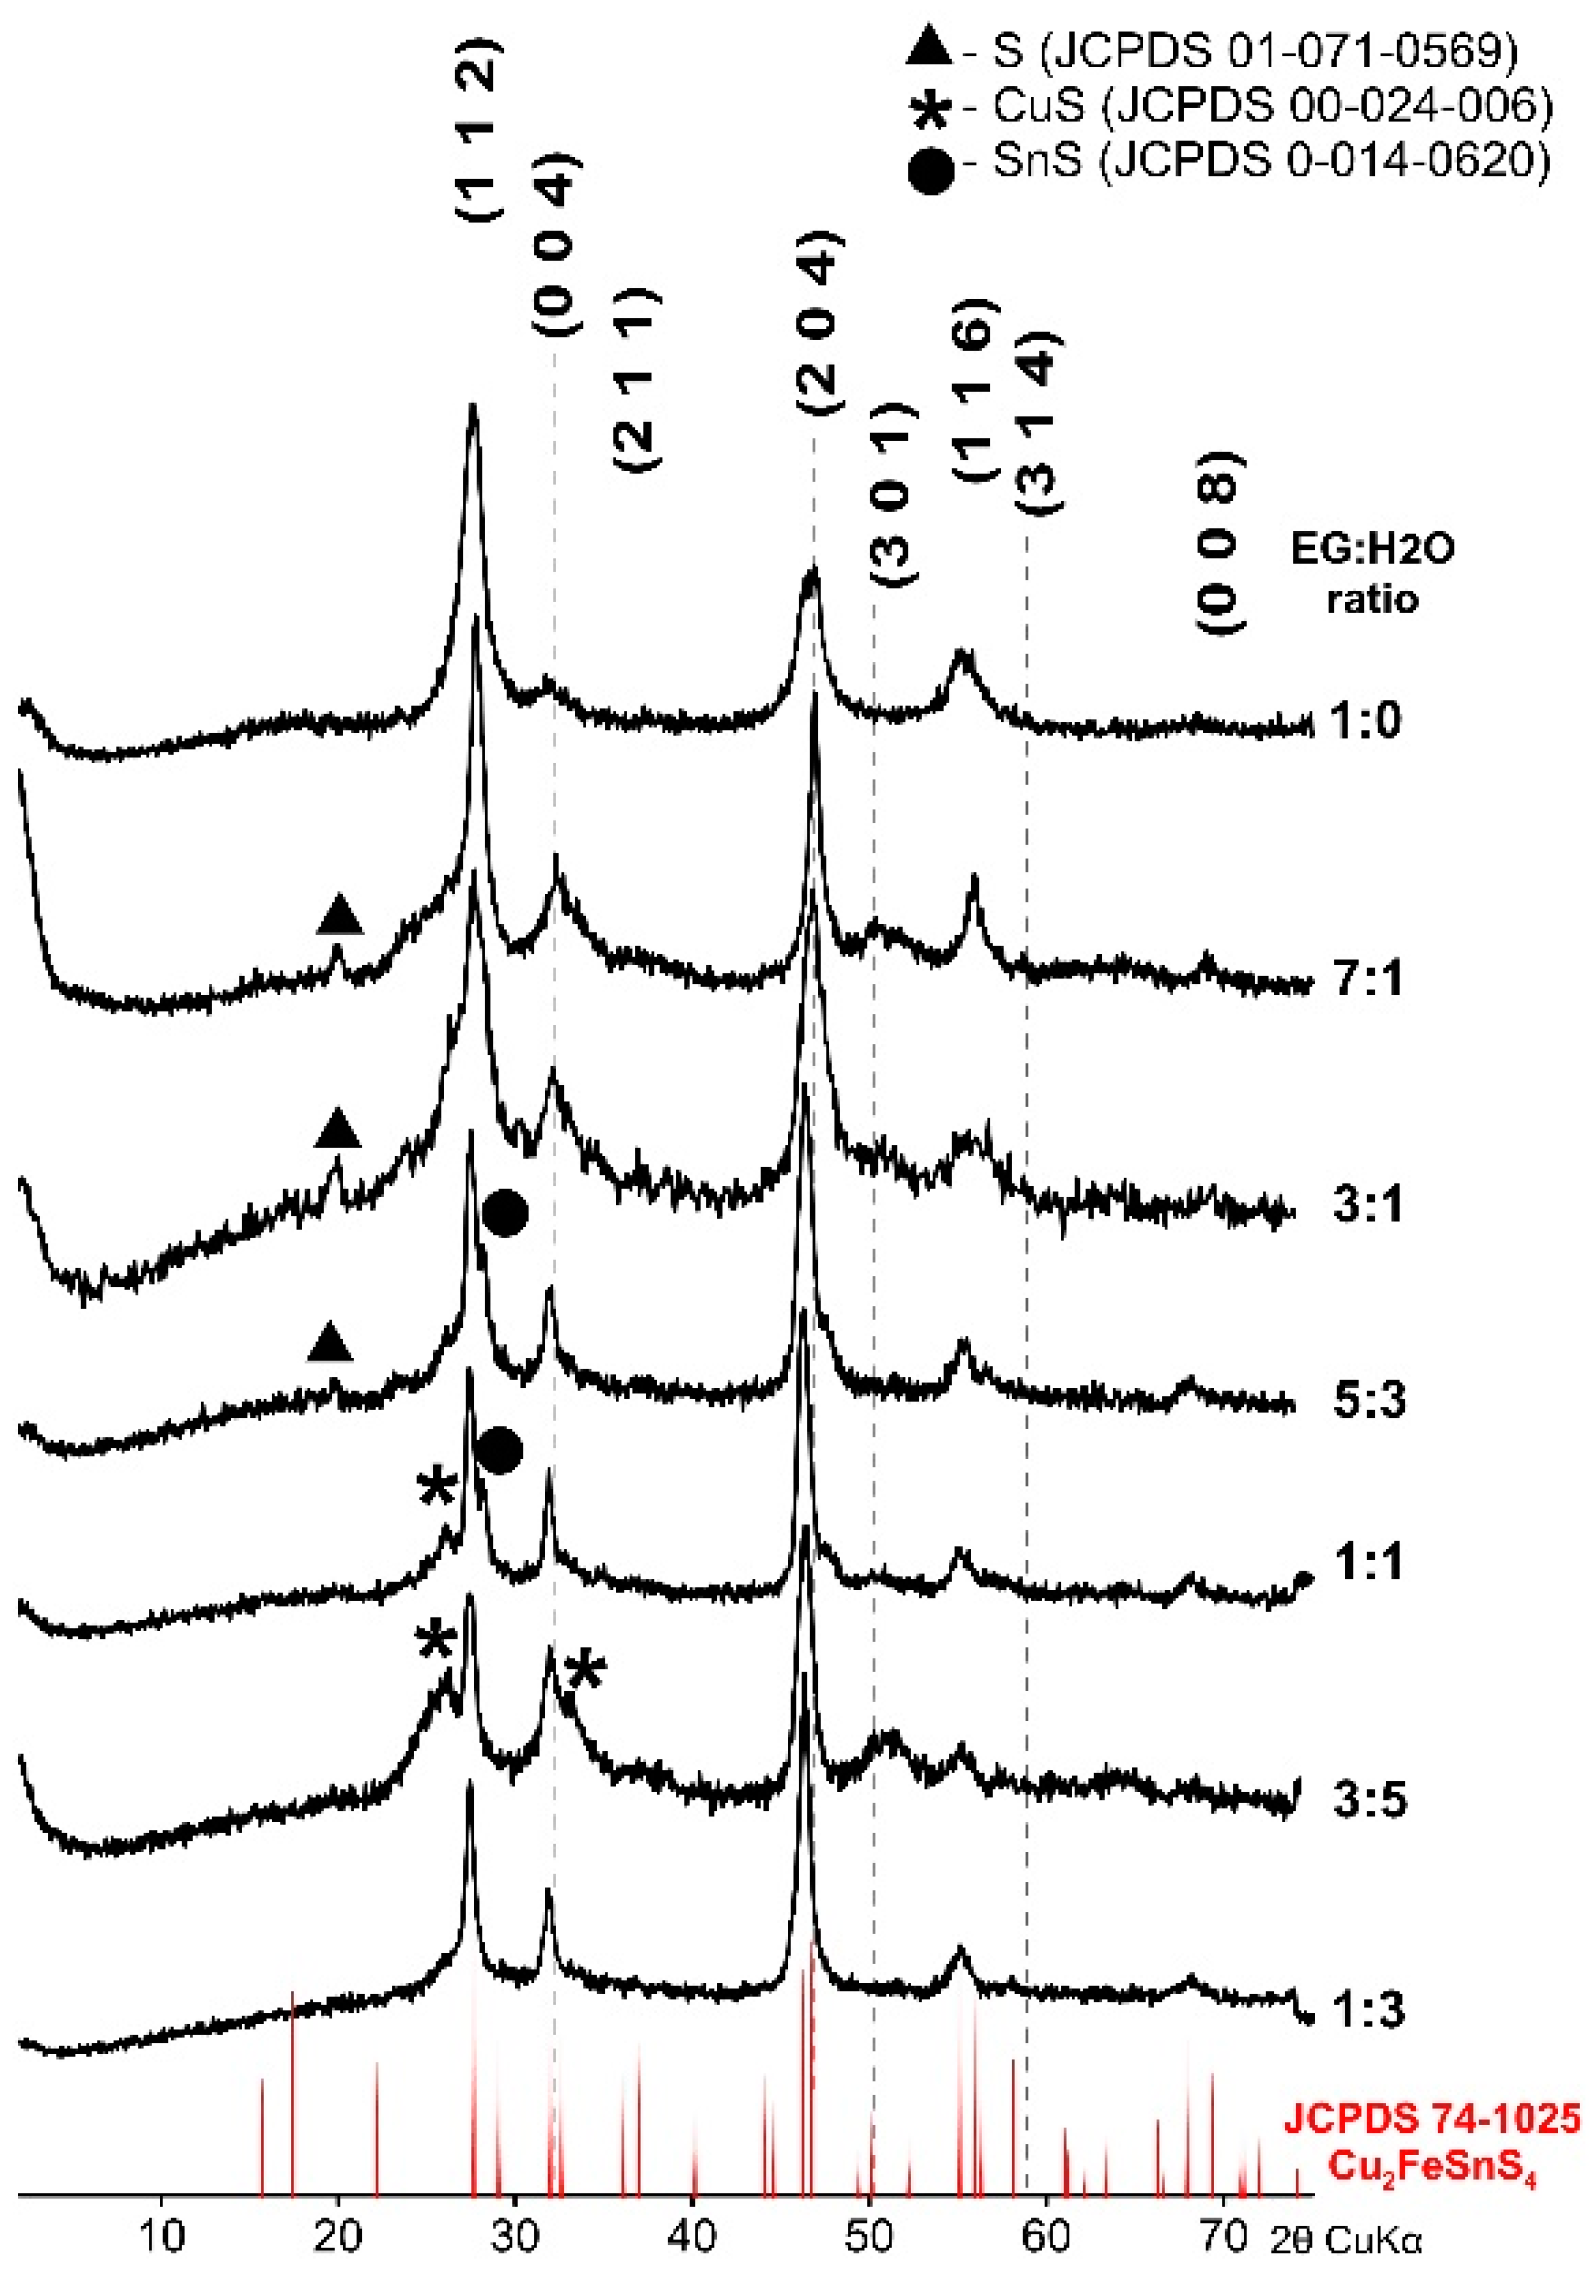
CFTS synthesized for 1 week at 195 °C with different proportions of EG and H2O were characterized by XRD and SEM-EDS. Figure 1 shows the diffraction patterns of the products of the synthesis. All XRD patterns are strongly influenced by the formation of small crystallites and amorphization. The position of main diffraction peaks in all samples correspond to the tetragonal structure of CFTS stannite (JCPDS 74-1025). In some samples, small admixtures of elementary sulfur, CuS, or SnS were detected as artifacts of incomplete reaction. The most intensive patterns with the sharpest peaks and the best match of reflections to the standard stannite pattern resulted from the EG:H2O ratio equal to 1:0 and 7:1, respectively. The products indicate the desired CFTS with the best crystallinity. Products synthesized from EG:H2O ratio of 3:1, 5:3. 1:1, and 3:5 show a good match of reflections with standard patterns but contain more impurities. Furthermore, the products synthesized from EG:H2O at a ratio of 1:3 consisted of a single-phase, but the peaks were of low intensity and their position was shifted toward the lower values of 2θ.
XRD patterns of CMTS obtained at different ratios of EG:H2O by synthesis lasting for 1 week at 195 °C are compared in Figure 2. The synthesis in pure glycol (EG:H2O = 1:0) leads to the formation of a tetragonal CMTS (JCPDS card no. 51-0757). With the ratio EG:H2O = 7:1 a product with mixed tetragonal and hexagonal structure forms. The position of the reflexes at 2θ° = ~18.02, 28.21, 29.56, 32.47, 33.07, 37.37, 44.46, 46.99, 55.31, correspond to the tetragonal structure (JCPDS 51-0757) and the positions at 2θ° = ~26.77, 28.21, 30.32, 39.23, 47.23, 52.26, 55.89 correspond to the hexagonal structure (Liang et al., 2012). The same can be observed for EG:H2O = 3:1. However, in this case the peaks are less intense and broad. As the water content increases, the peaks characteristic of hexagonal CMTS become clearer which indicates that the crystalline structure of CMTS is gradually transforming. Note that the optical band gaps for tetragonal CMTS and hexagonal CMTS are almost the same (ca. 1.1 eV as calculated by Liang et al. [42]) suggesting that both structures have the same potential application in solar cells.
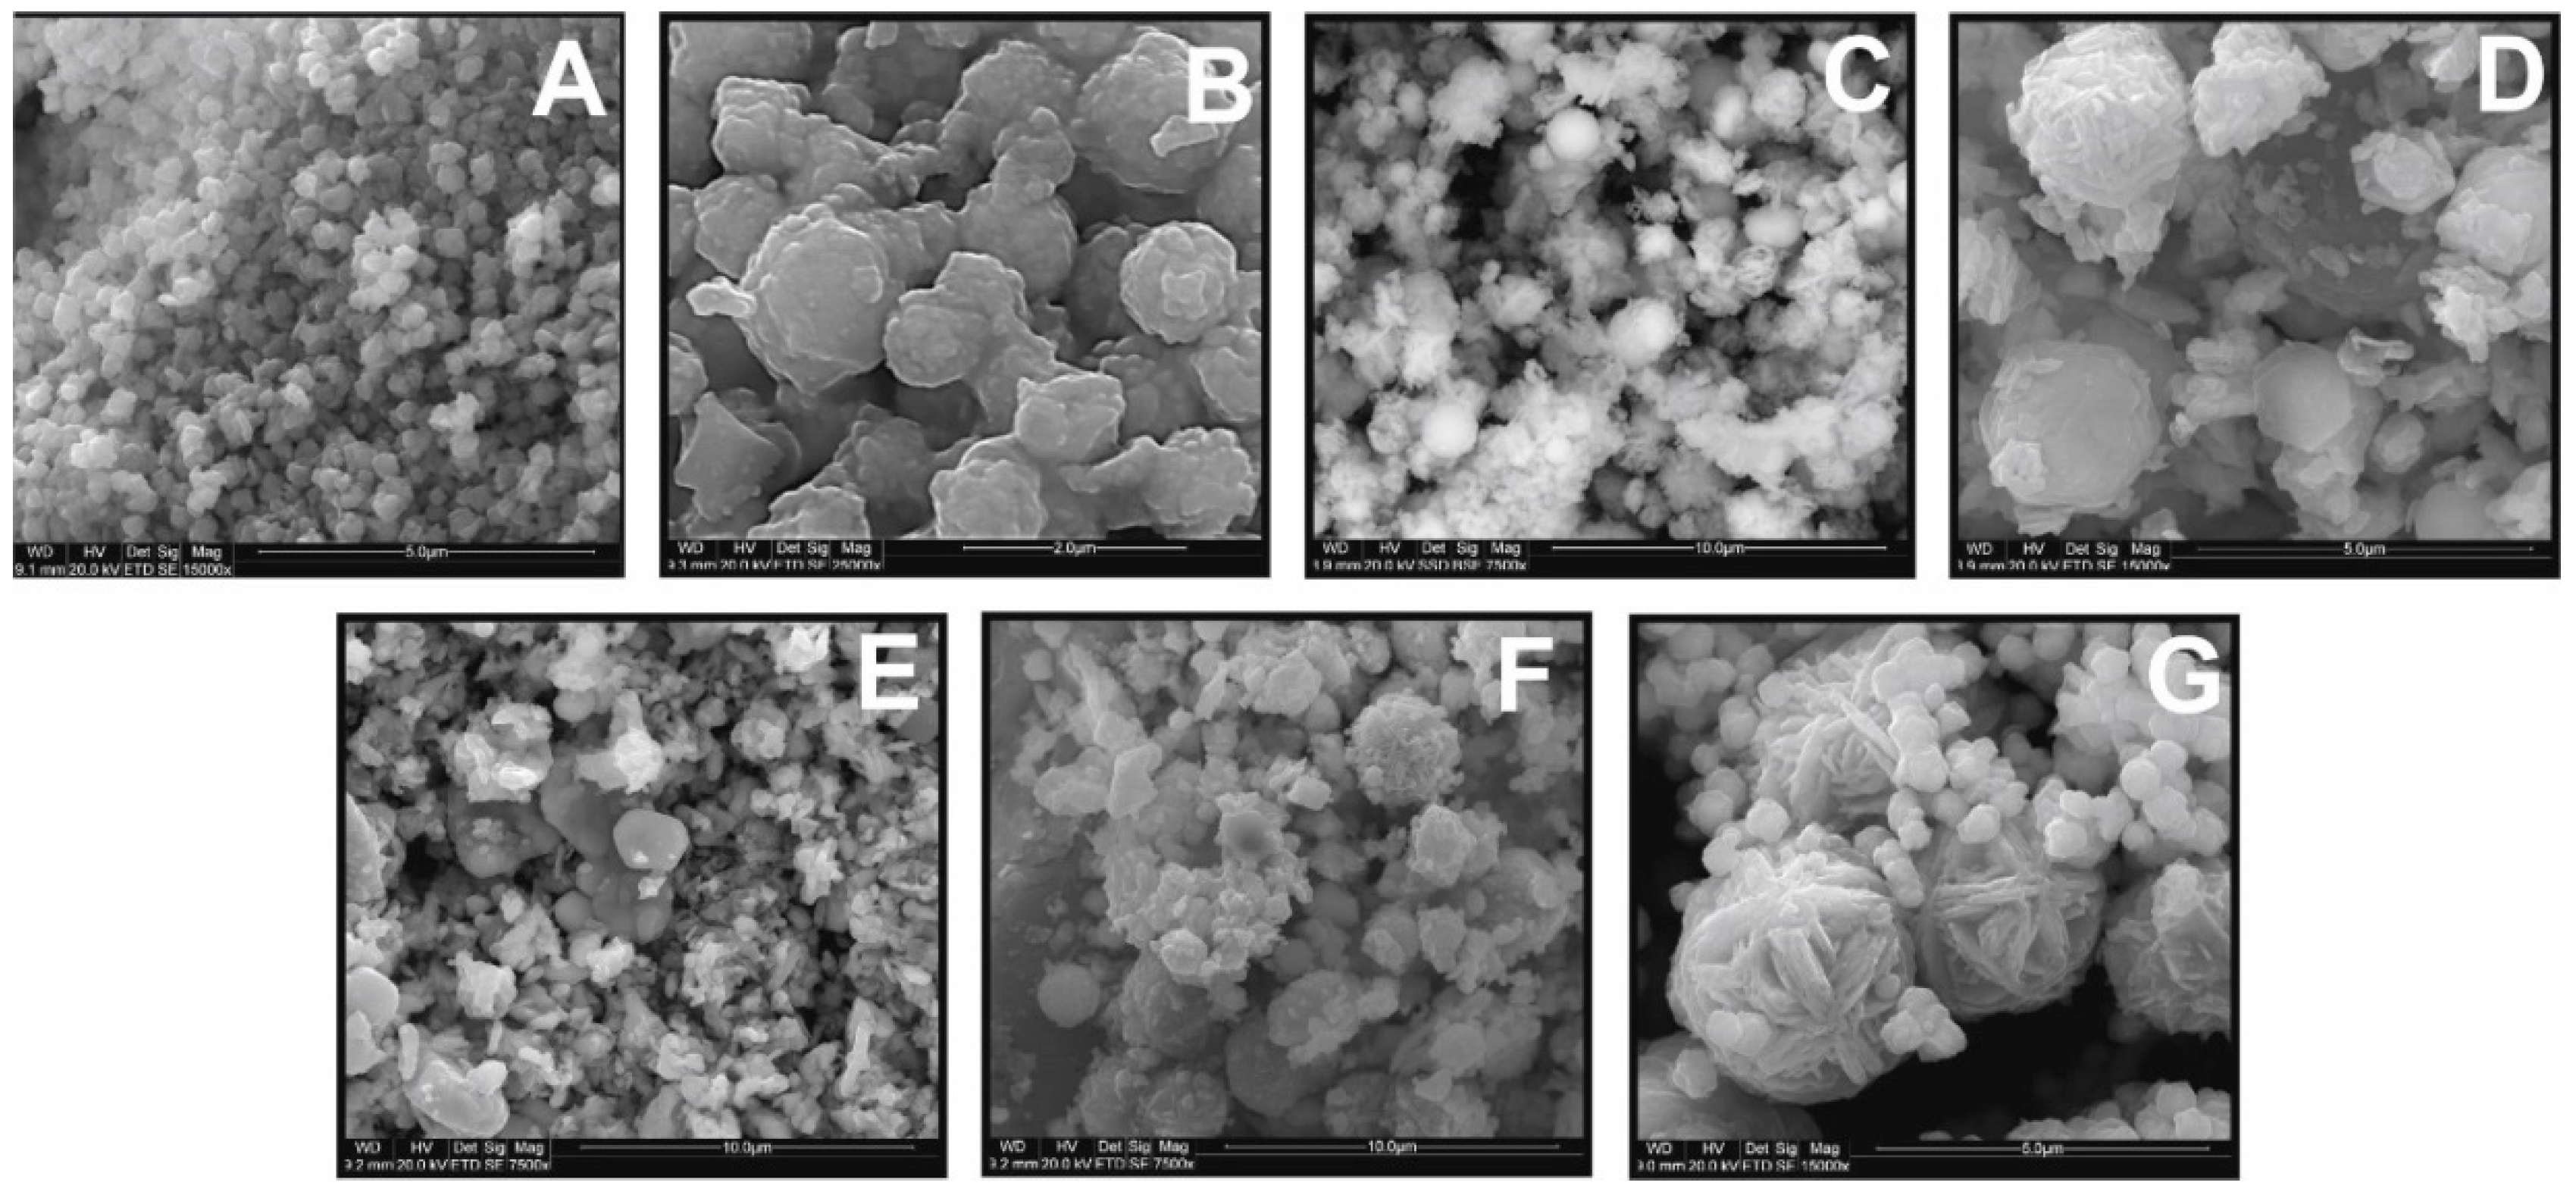
The dependence of CFTS particle morphology on the EG:H2O ratio is apparent in SEM images (Figure 3). The products synthesized from EG:H2O ratios of 1:0 and 7:1 show spherical shapes (Figure 3A,B), whereas those synthesized from 3:1, 5:3, and 1:1 ratio show more irregular morphology (Figure 3C–E). The size of the CMTS particle is similar to that of CFTS (range = 2–3 μm). As the water content increases in the initial batch, two generations of crystallites appear that are characterized by more irregular edges and flower-like particles. This is shown in Figure 3G and F (EG:H2O ratio of 3:5 and 1:3). Larger, flower-like particles, relatively uniform in size (2–3 μm), are accompanied by much smaller spherical particles (about 0.1 μm).
3.2. Optimization of Time of Synthesis
Different times for the synthesis were studied to optimize the synthesis: 1 day, 3 days, 1 week, 2 weeks, and the synthesis repeated twice for 1 week each time in fresh solution. The temperature of the synthesis was maintained at 195 °C (except for 2 weeks experiment when the temperature was 160 °C for technical reasons) and the EG:H2O ratio was always equal to 7:1.
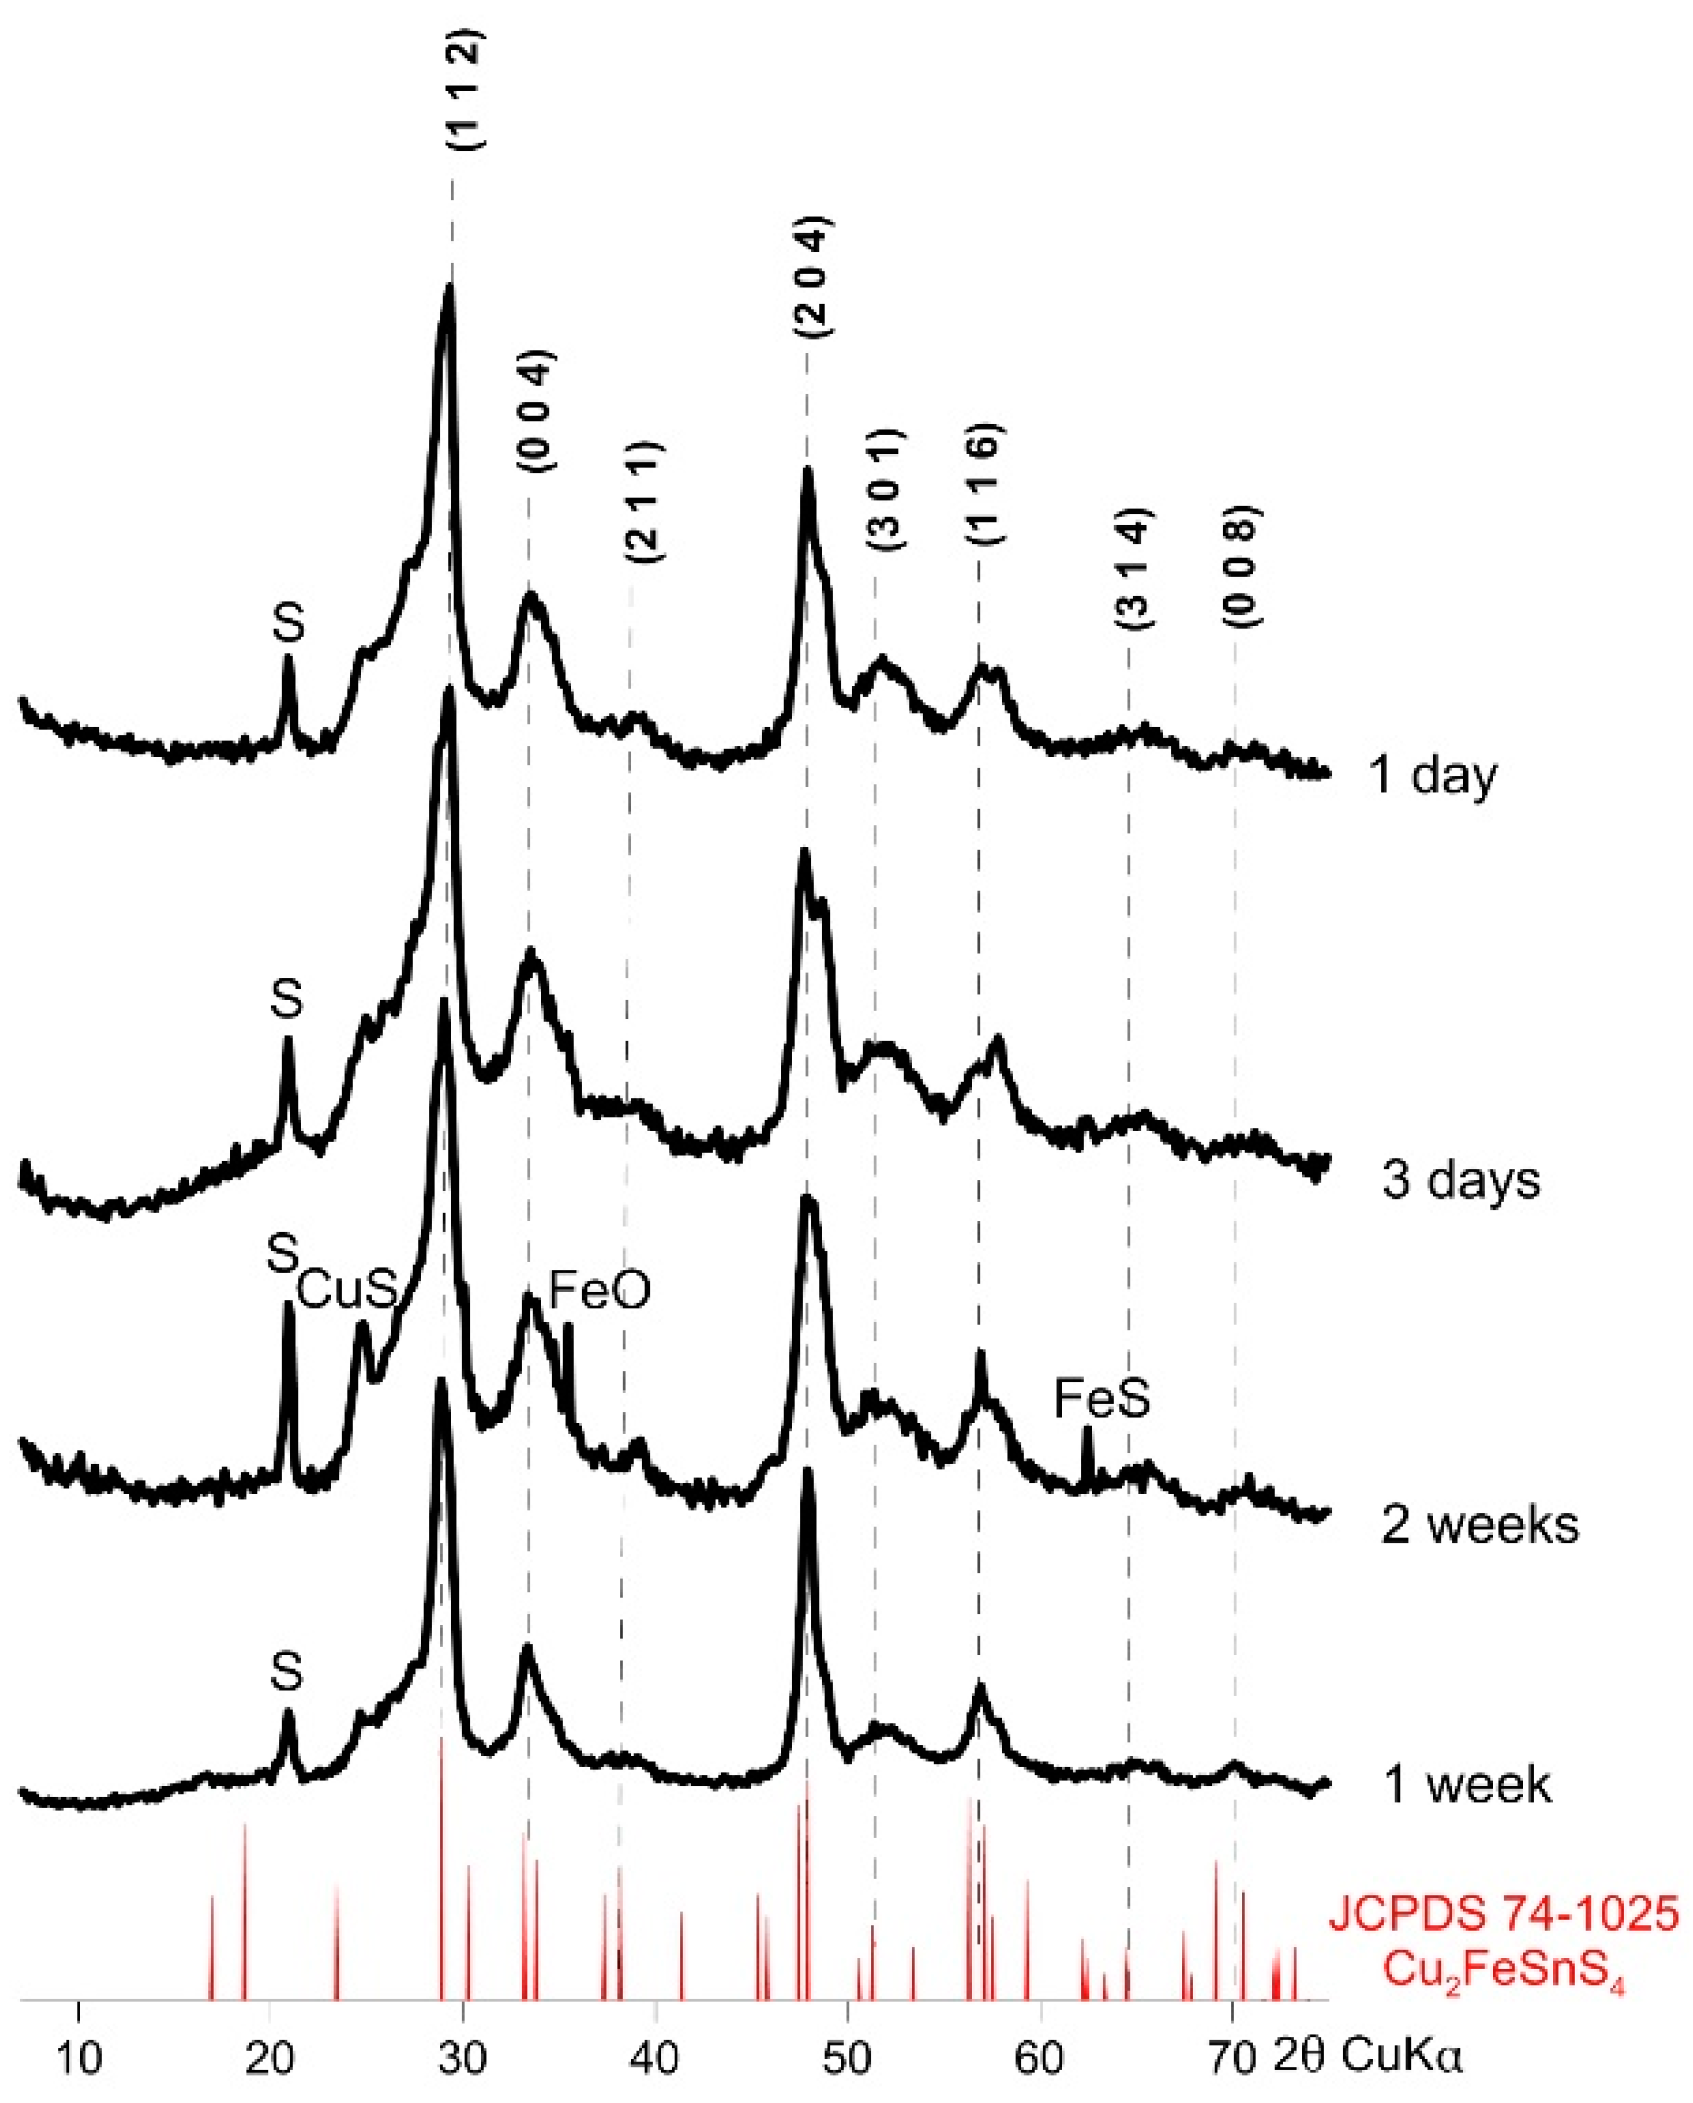
Figure 4 shows the XRD patterns of the resulting CFTS particles. All experiments resulted in a tetragonal stannite identical to JCPDS standard No 74-1025. These patterns are similar in intensity and width of peaks. Small amounts of impurities (CuS, FeO, and FeS) were observed in samples synthesized for 2 weeks. Lower temperatures during synthesis (160 °C) also affected the product formation by decreasing crystallinity and forming impurities. This shows that 195 °C was an optimal temperature, although we found the formation of sulfur impurities in all the samples. After just one day of synthesis in 195 °C it is possible to obtain satisfactory purity and crystallinity of CFTS, but the optimal synthesis time is one week. There were no significant effects resulting from the prolongation of the time of synthesis of CFTS on XRD pattern.
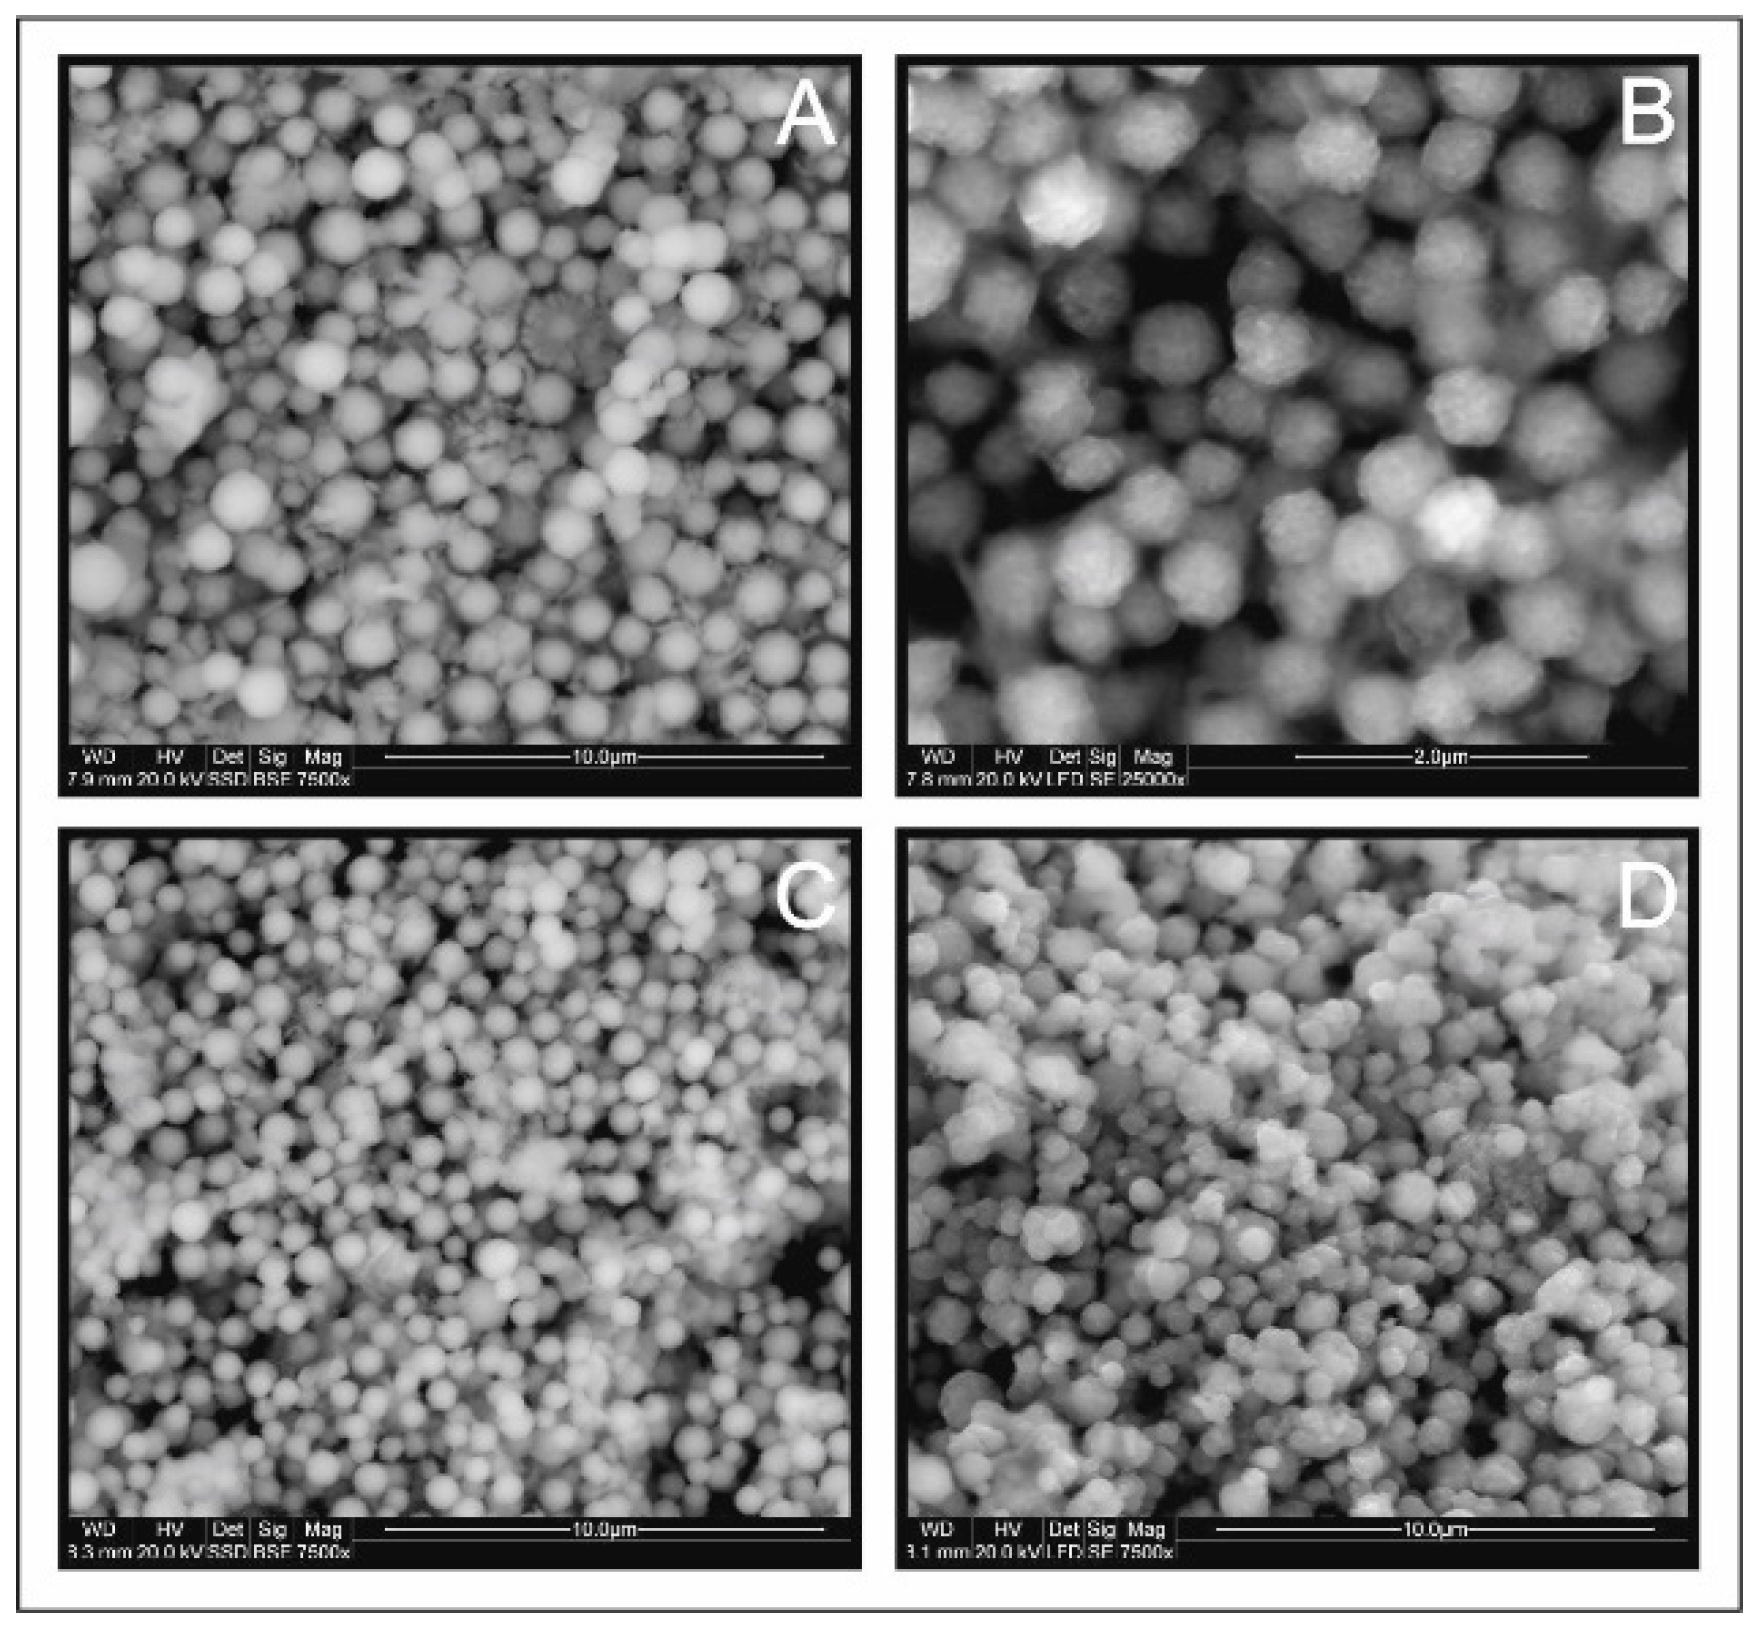
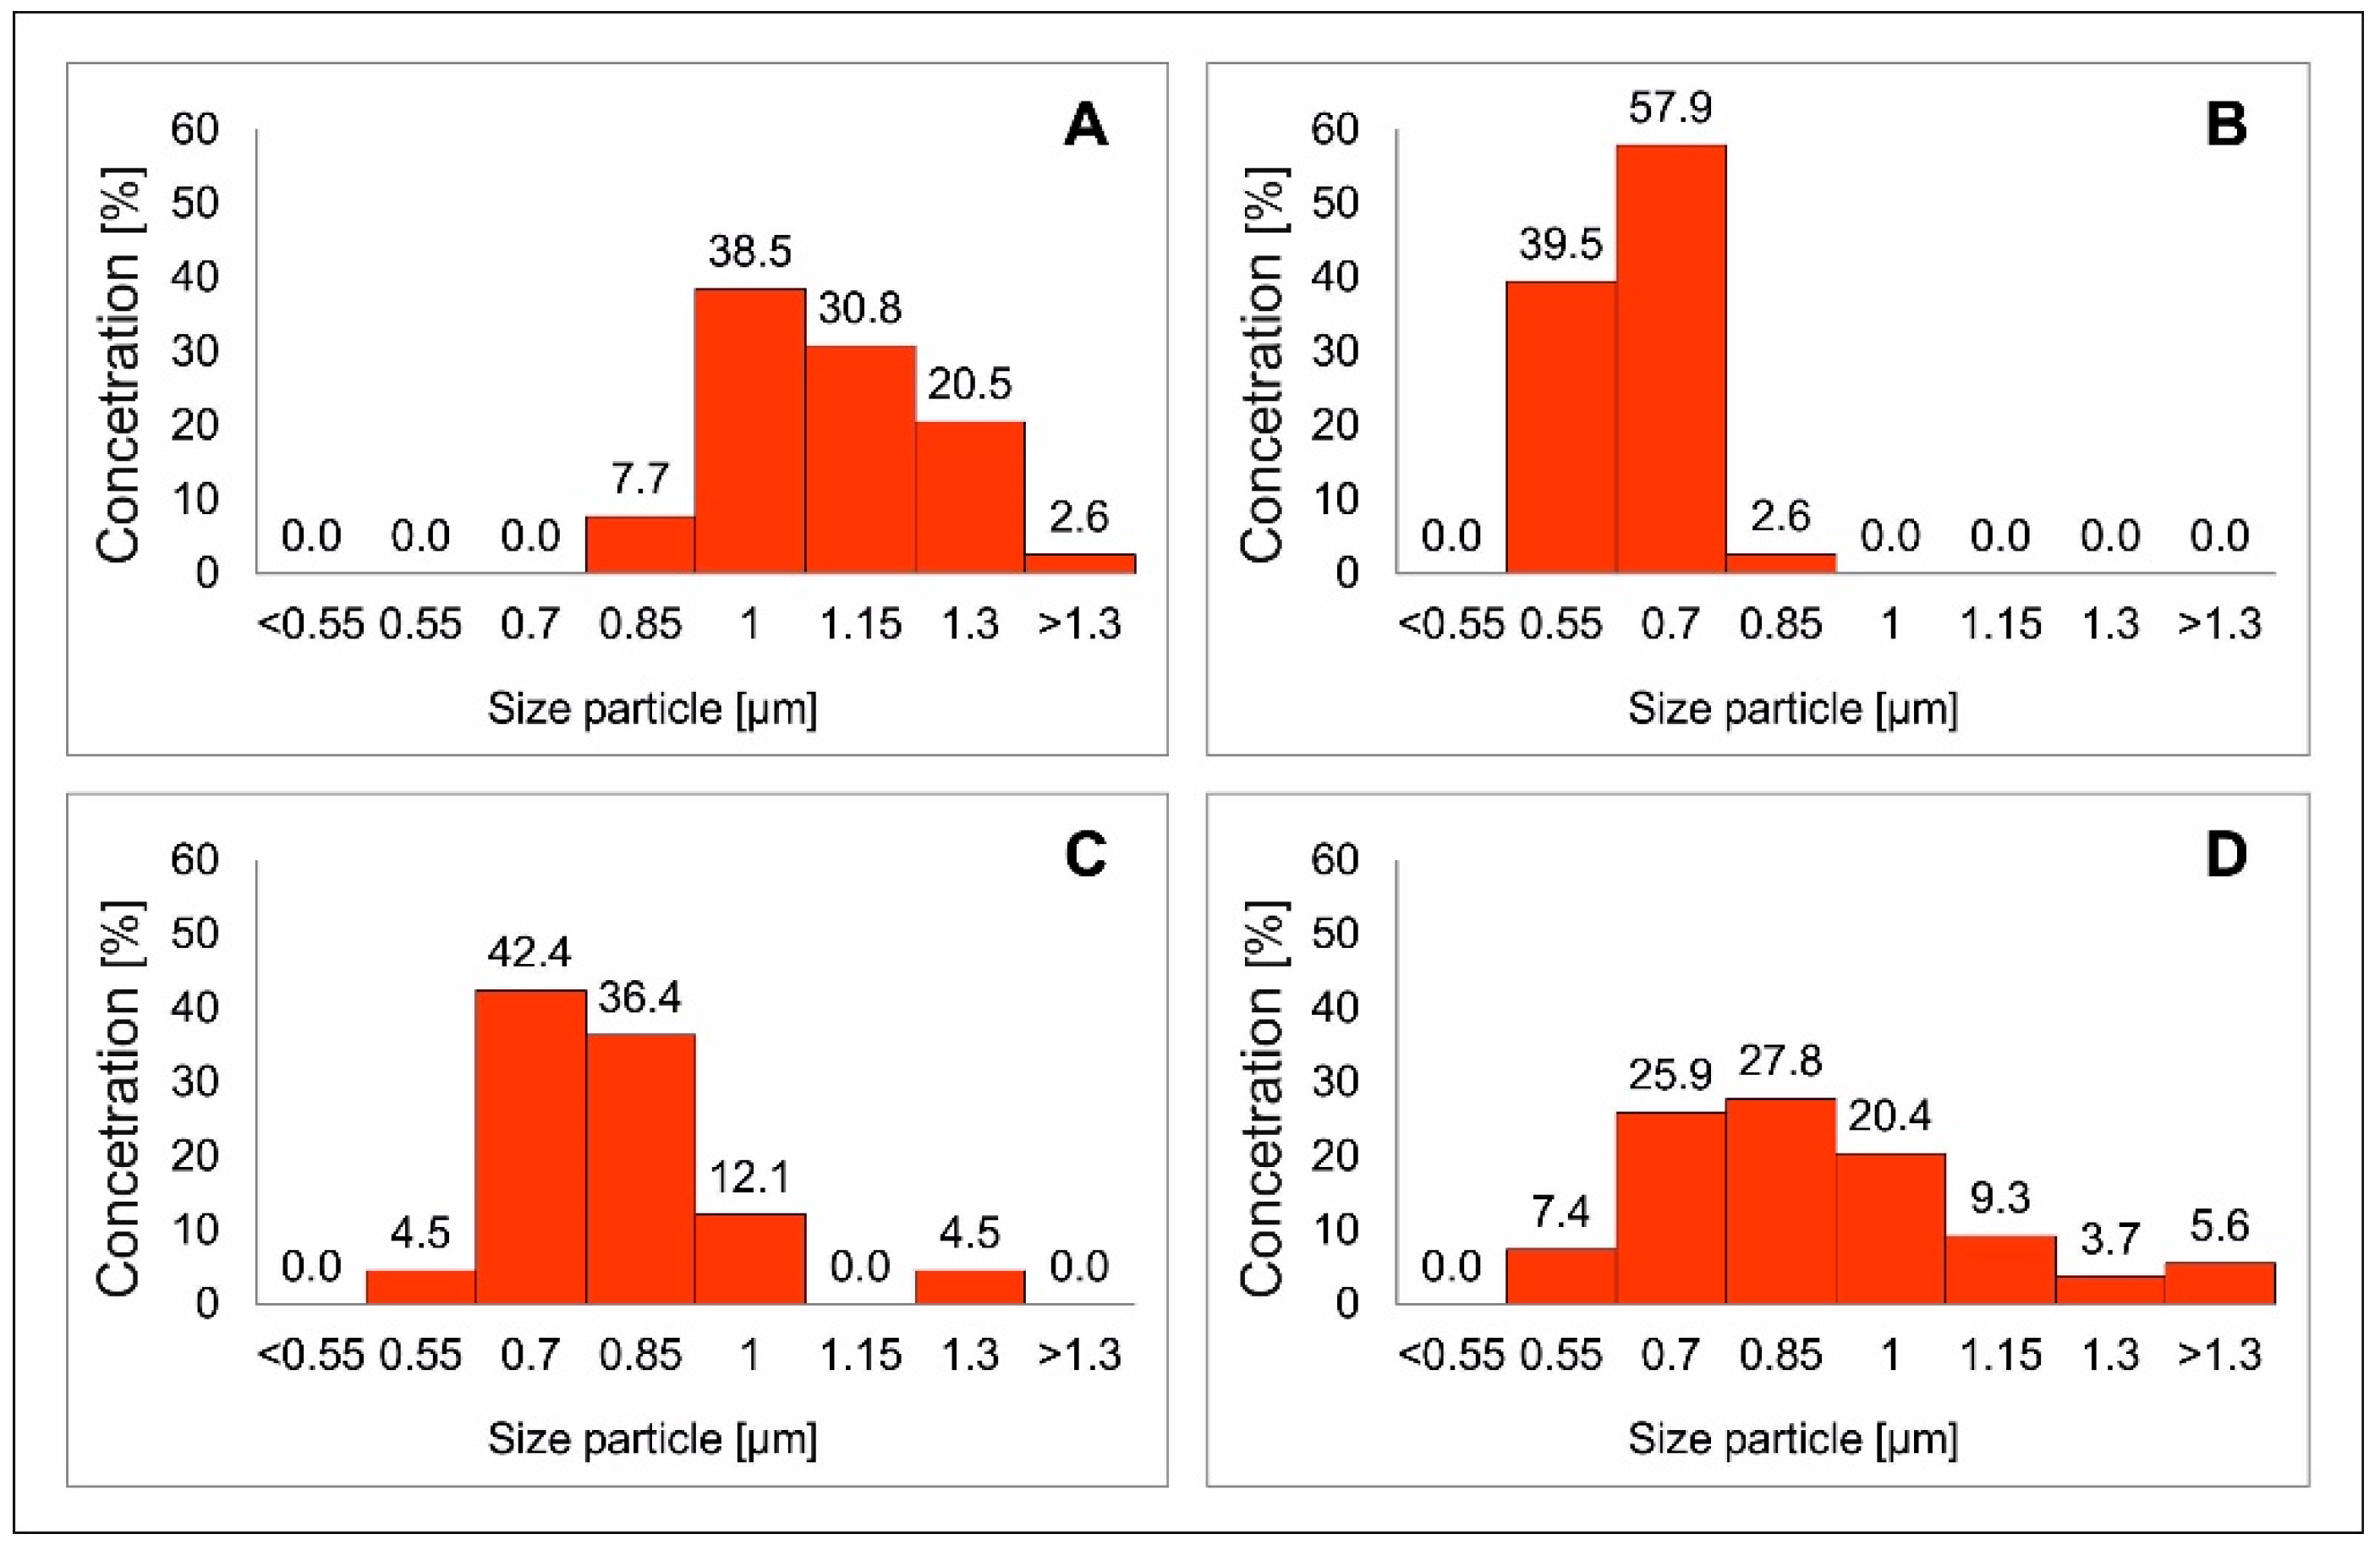
Figure 5 shows the SEM images of CFTS microspheres synthesized at different times. All products consisted of spherical particles of relatively average size from 0.6 to 1.5 µm (Figure 6). No changes were observed in the morphology of CFTS microparticles with extended synthesis time. This shows that CFTS microspheres of uniform particle size can be easily synthesized within 1 day. The exception is an experiment conducted twice for a week, which resulted in the two generations of sharp-edged particles.
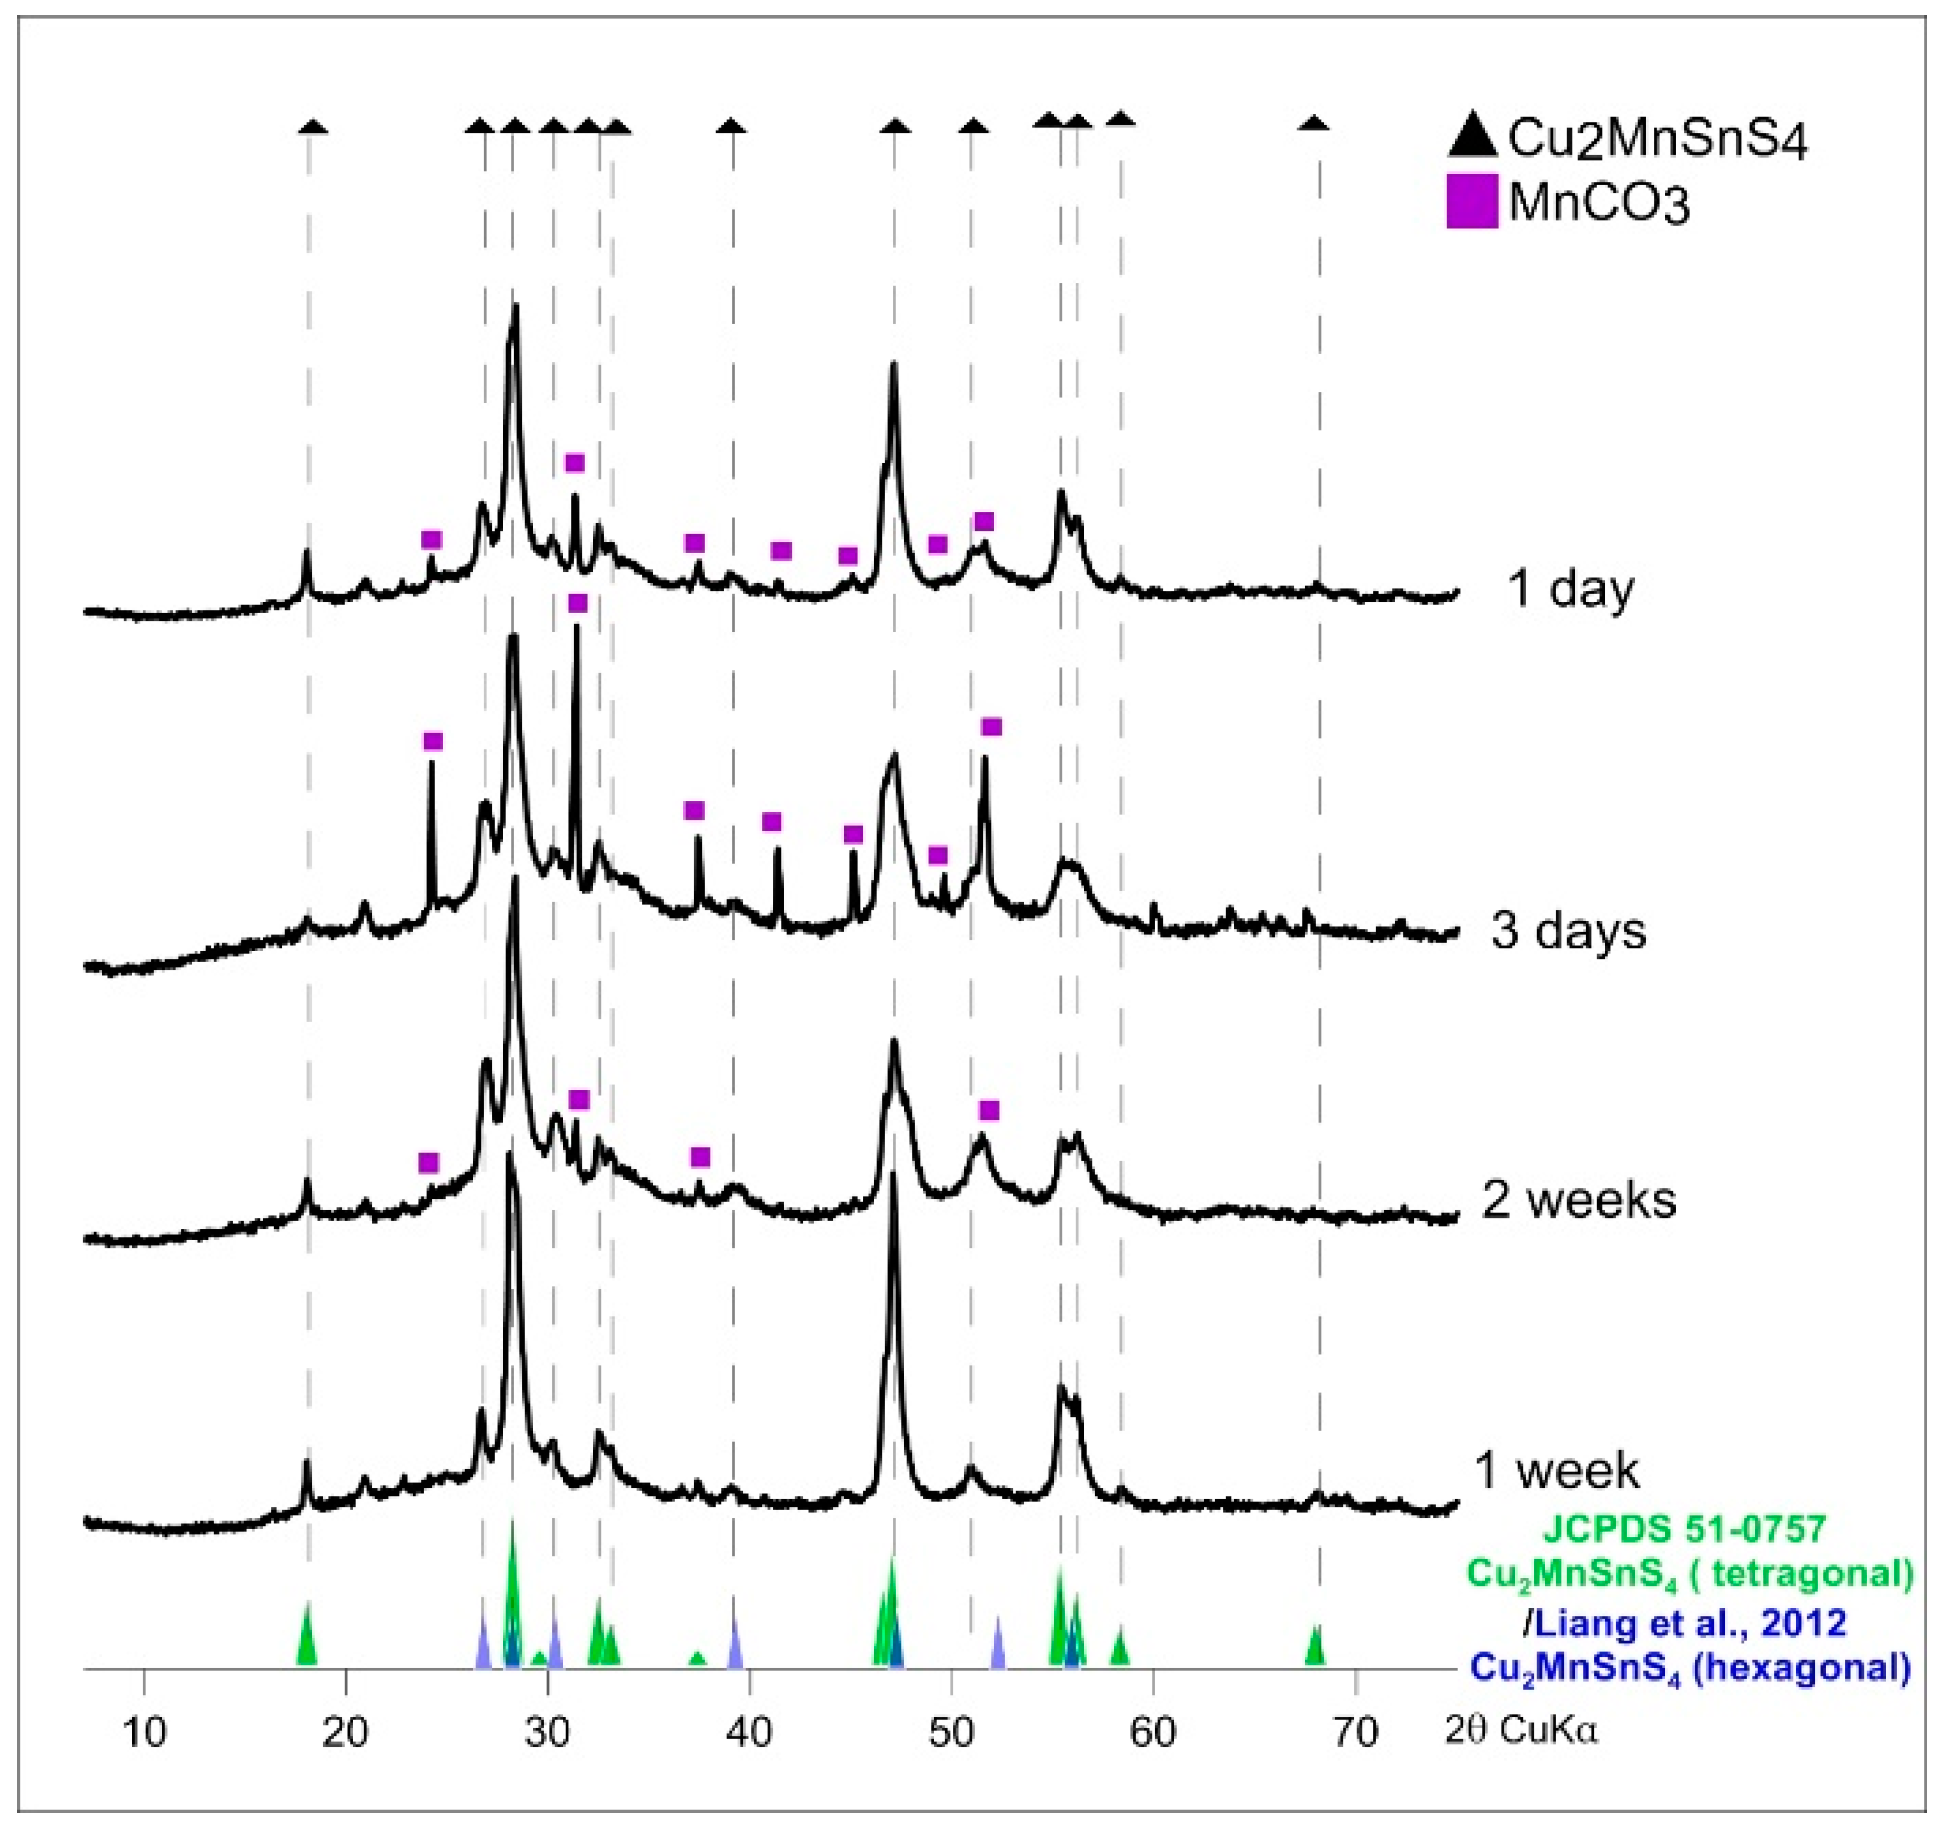
Figure 7 shows the XRD patterns for CMTS synthesized for different times. The dominant peaks are those corresponding to the tetragonal structure (JCPDS sheet No. 51-0757) can be observed at 2θ values ~18.02, 28.21, 29.56, 32.47, 33.07, 37.37, 44.46, 46.99, and 55.31. However, peaks corresponding to the hexagonal structure [42] can also be observed at 2θ values ~26.77, 28.21, 30.32, 39.23, 47.23, 52.26 and 55.89. In addition, small amounts of MnCO3 (rhodochrosite) were detected as undesirable contamination in the product of syntheses lasting 1 day and 3 days and in the product of synthesis at low temperature (160 °C for 2 weeks).
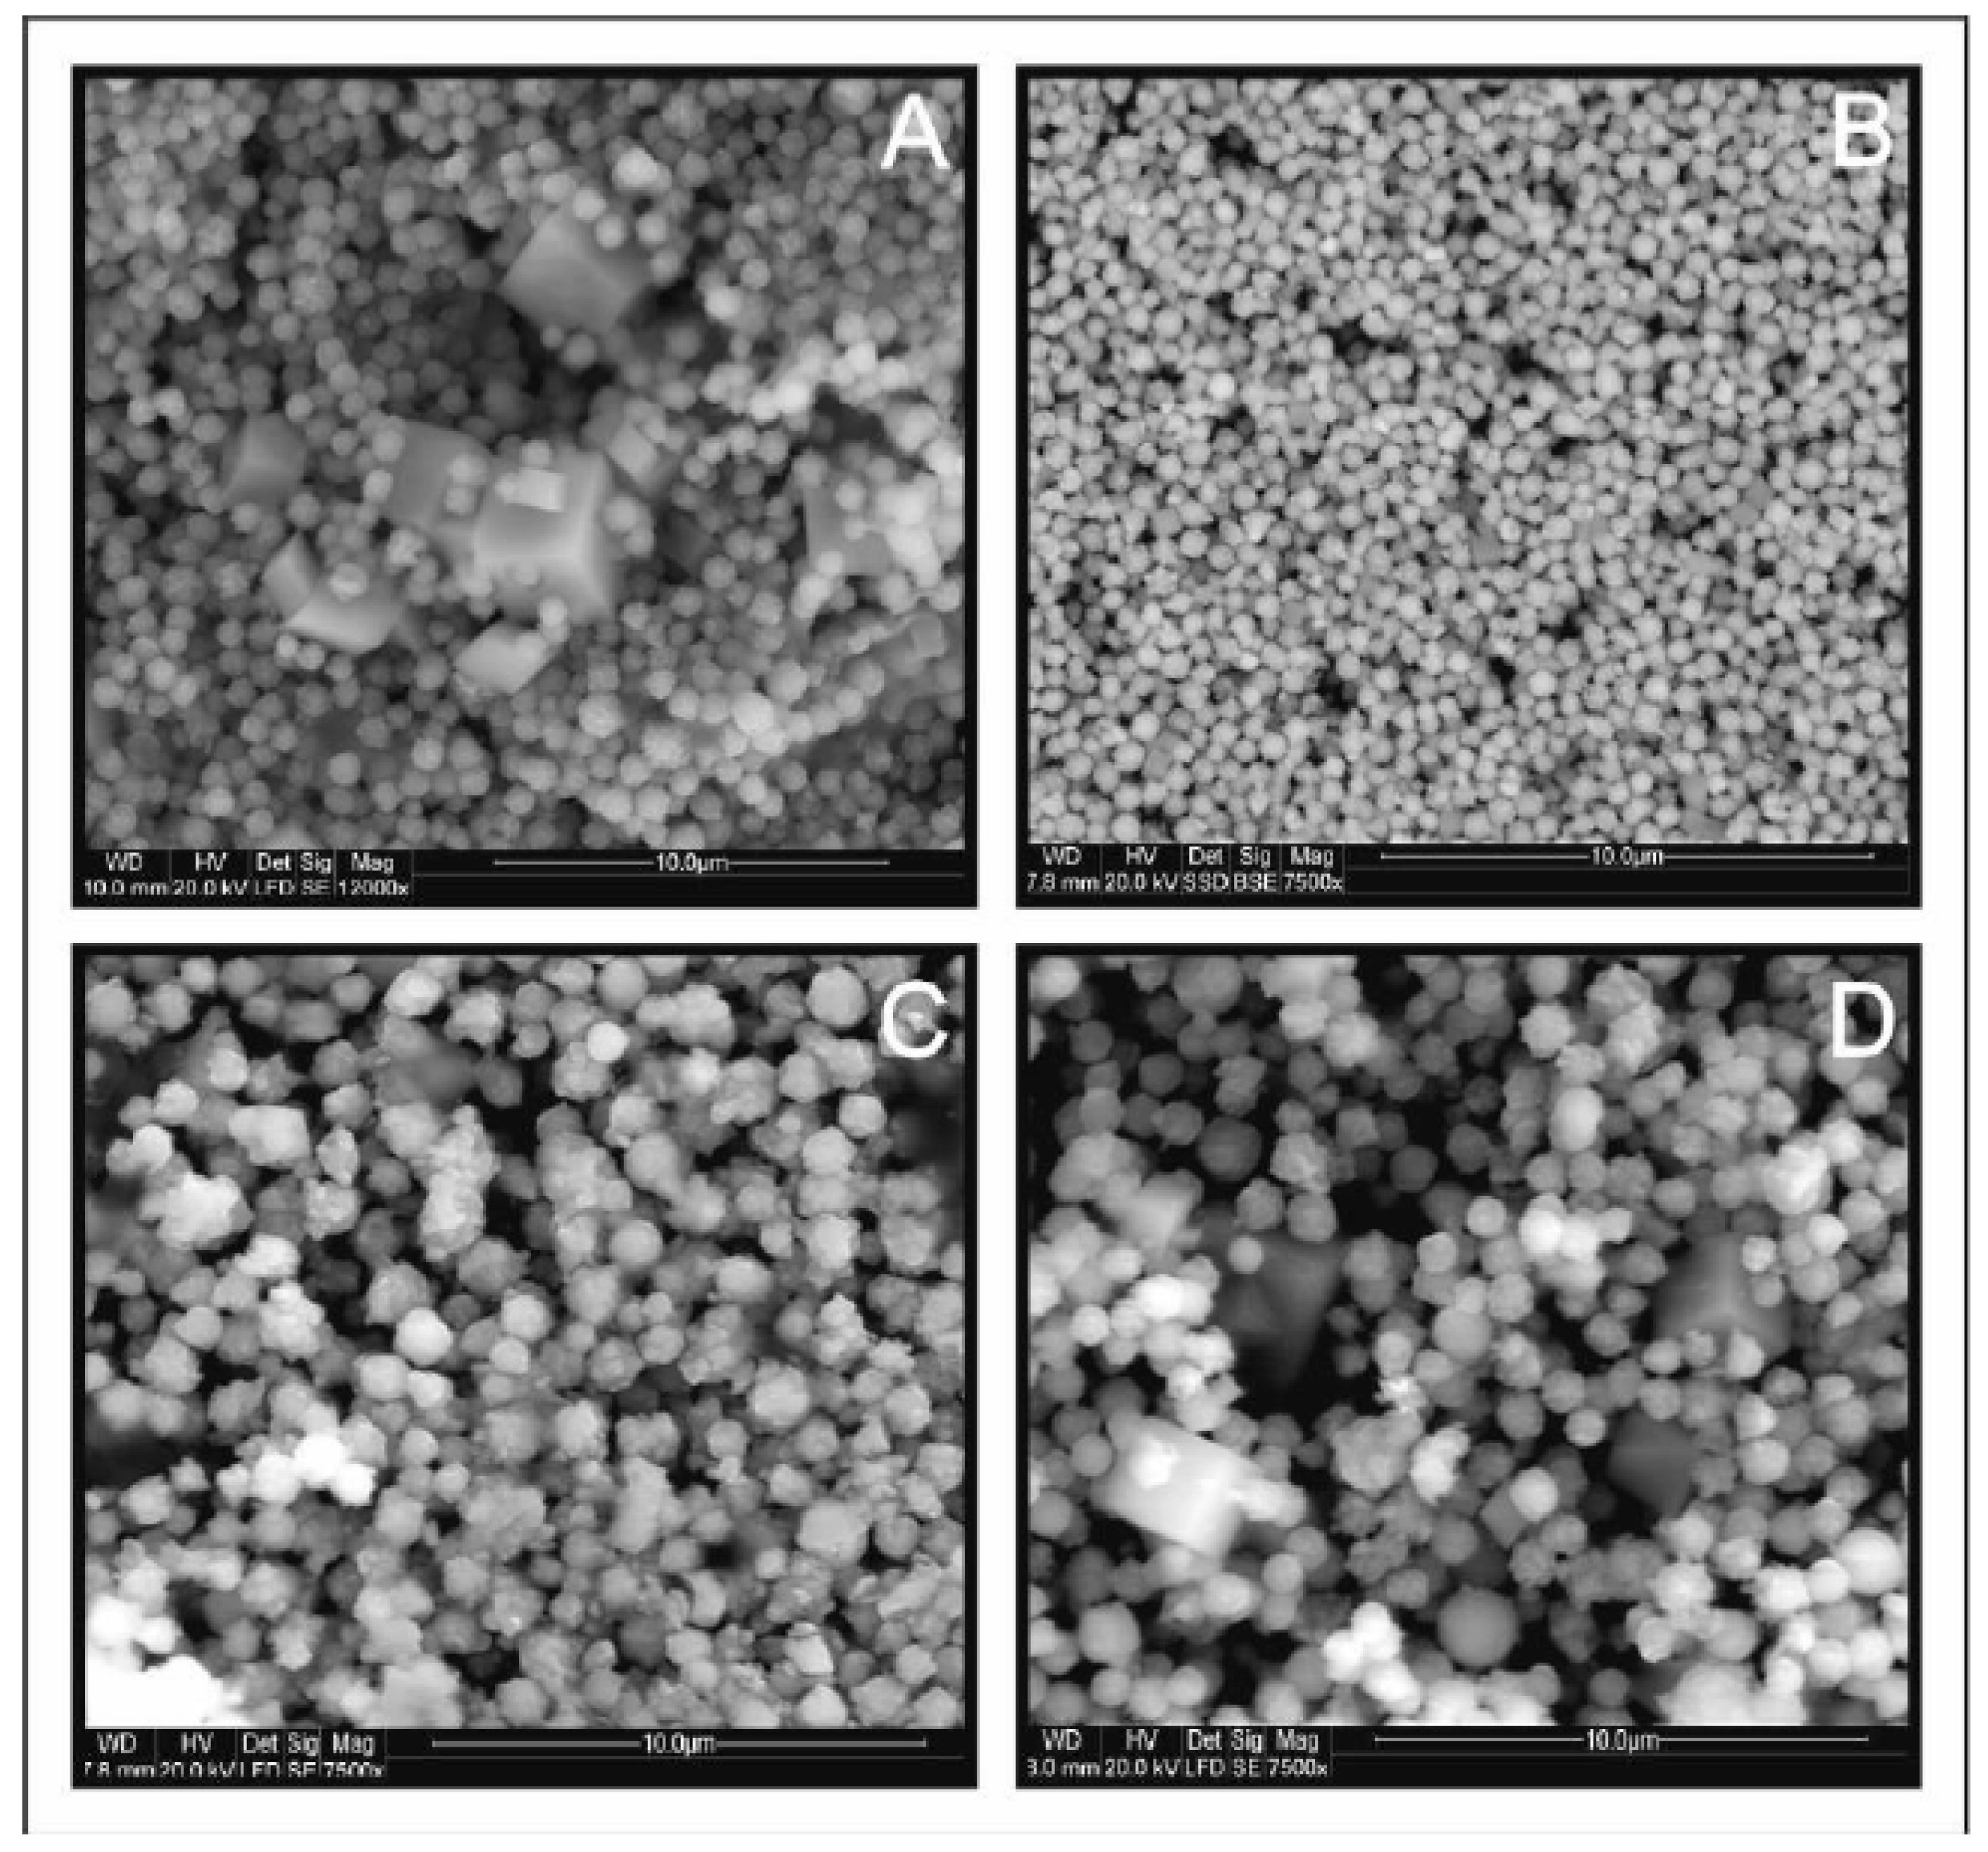
Figure 8 shows SEM images of CMTS depending on the duration of the synthesis. As a result of the shorter time of synthesis (1 day and 3 days), small microparticles of uniform spherical shape with an average size of 0.5–1 µm are produced. Larger microspheres of 1 to 1.5 µm diameter are formed during a long time of synthesis (1 and 2 weeks).
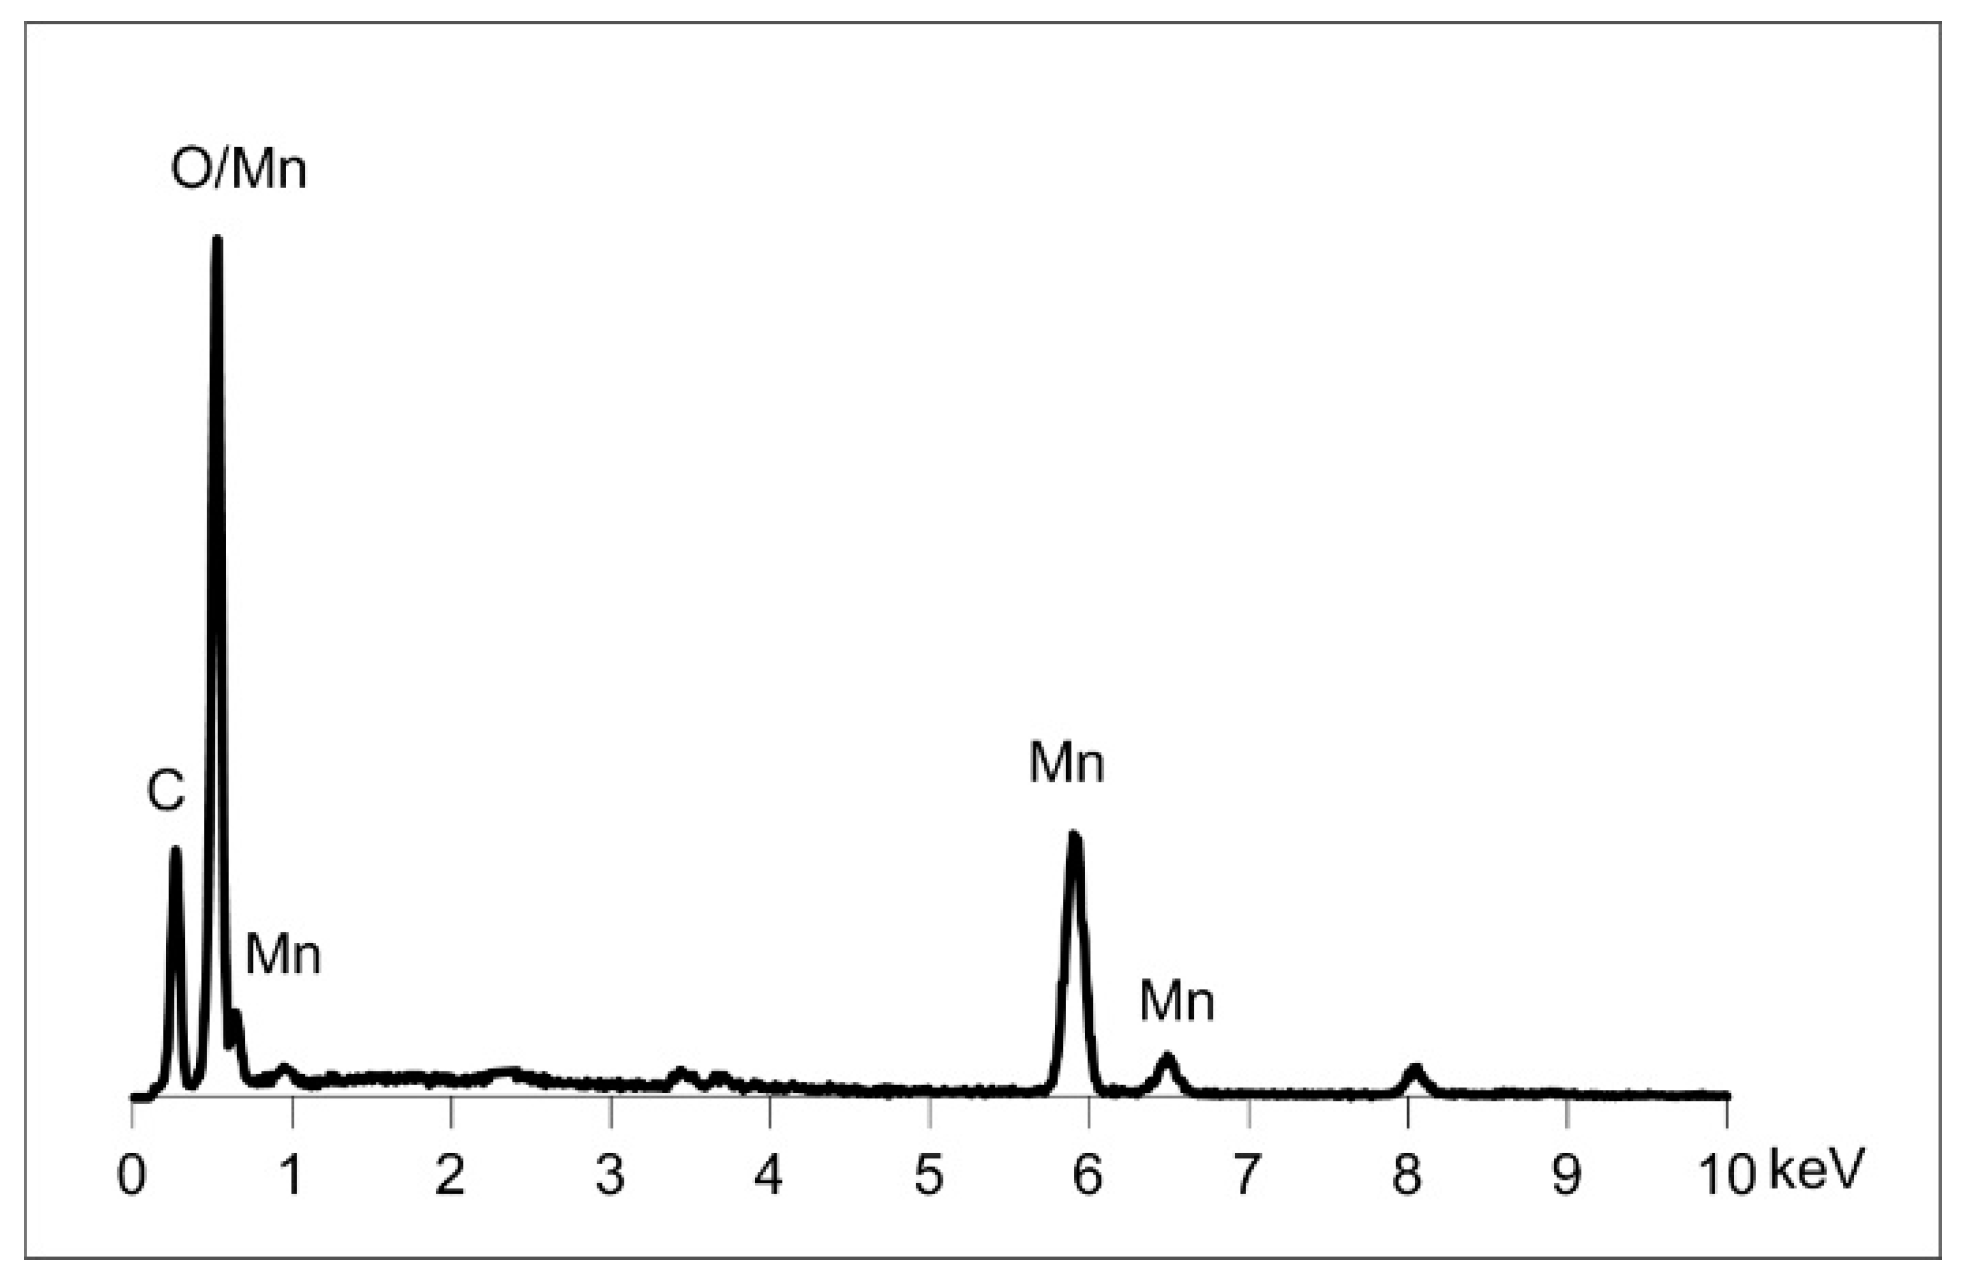
In the products of the syntheses lasting 1 day, 3 days, and twice a week, the presence of an additional phase in the form of larger isometric crystals was observed. The result of elementary EDS (Figure 9) analysis is consistent with the composition of rhodochrosite, which is in line with the results of XRD analysis.
3.3. Synthesis of Cu2(Mn1−xFex)SnS4 Solid Solution Series
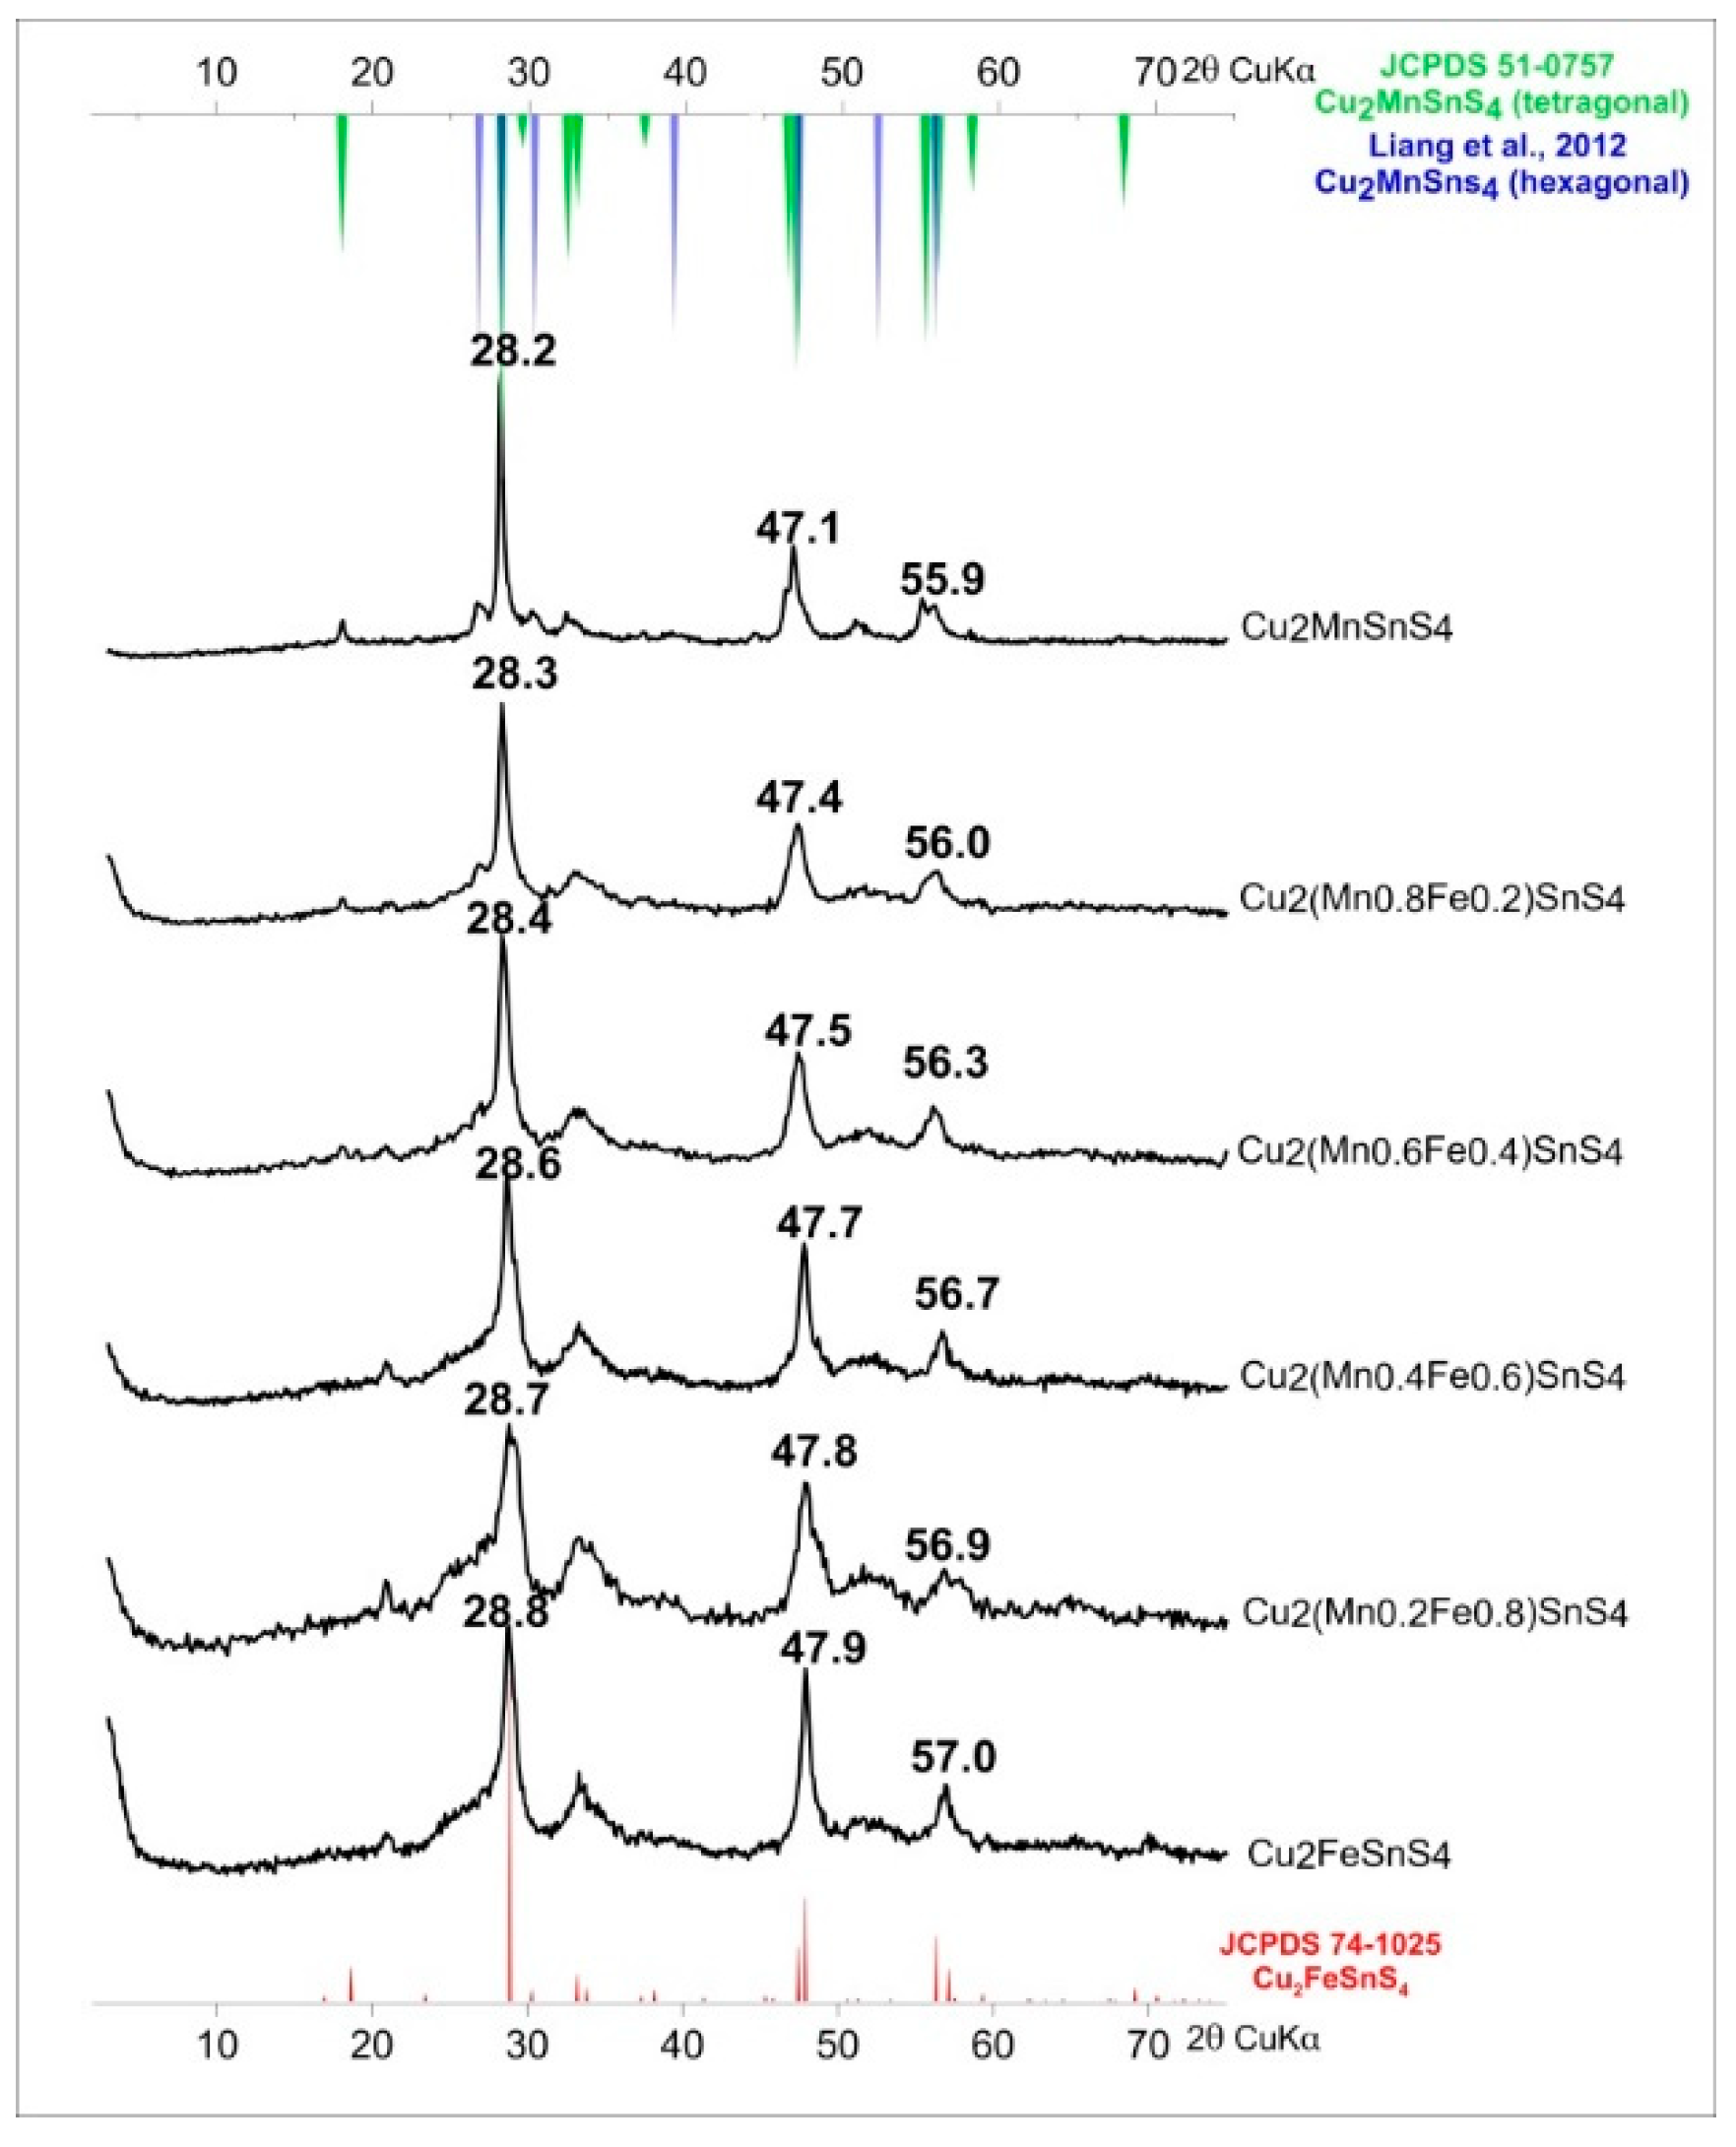
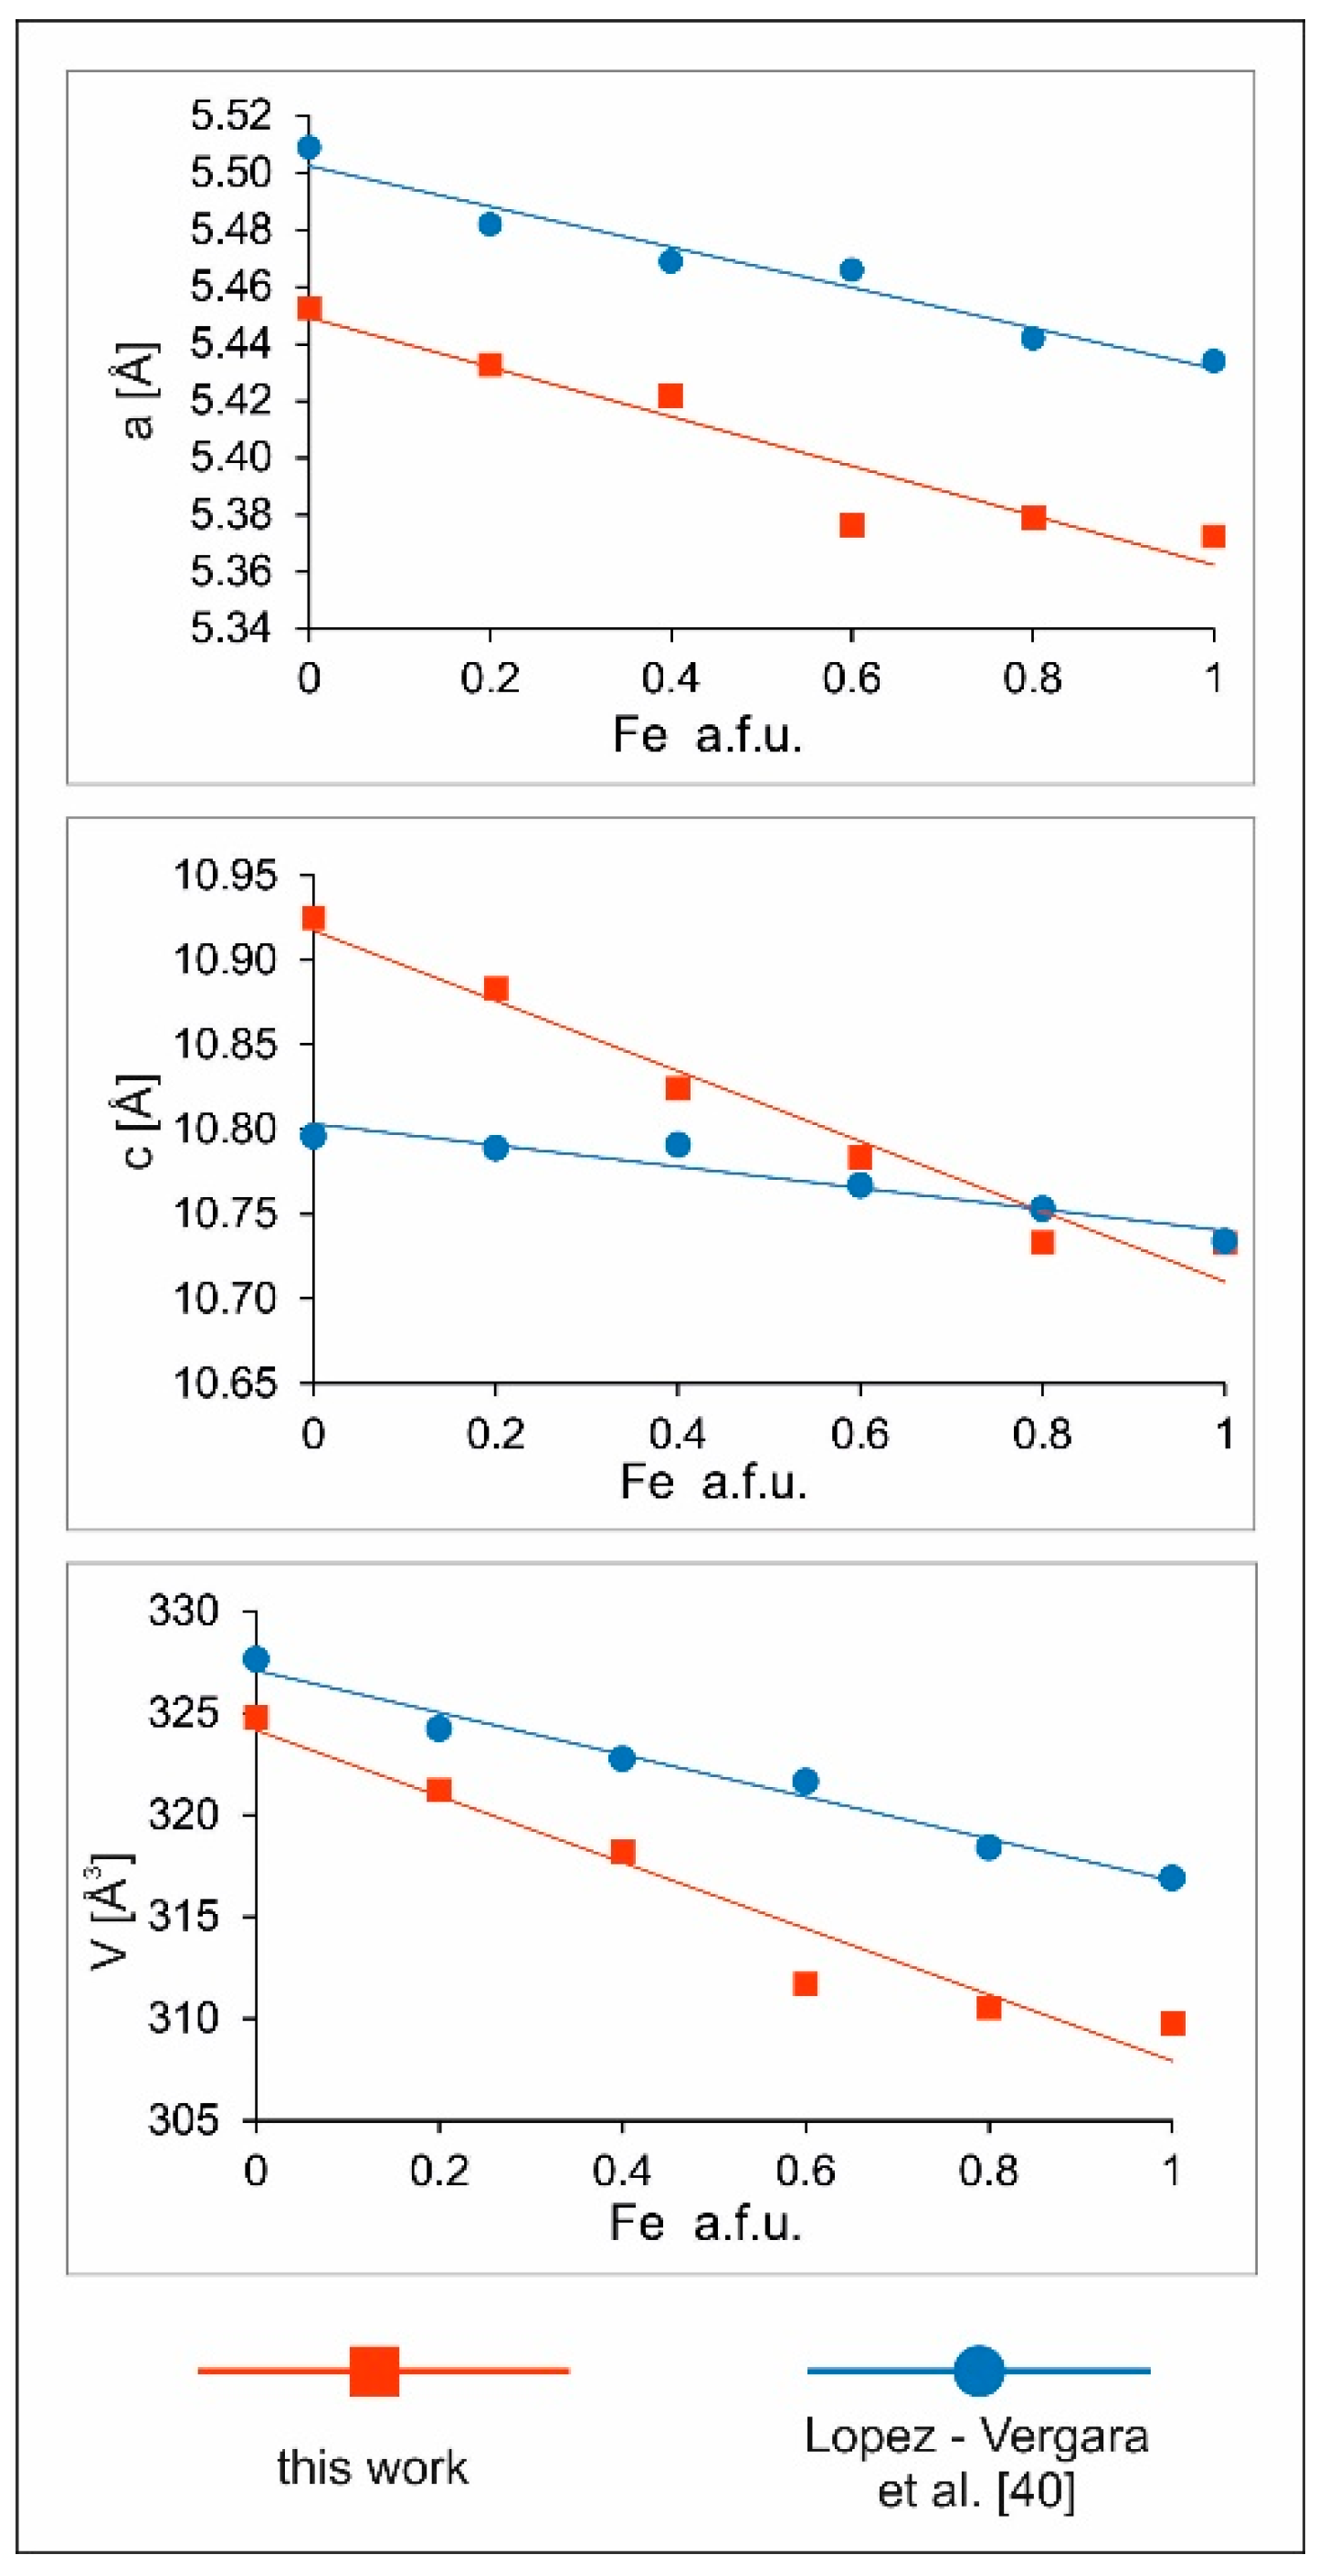
For the synthesis of solid solutions of Cu2(Mn1−xFex)SnS4 series, the synthesis time and EG:H2O ratio have been chosen to obtain the best crystalline products with the least amount of impurities. The EG:H2O ratio of 7:1 and a reaction time of one week at 195 °C met these expectations. The diffraction peaks for both this product and CFTS were the sharpest and most intense. The results are shown in Figure 10. Similar to Lopez-Vergara et al. [40], all samples showed tetragonal structure although the synthesis of CMTS under these conditions resulted in a product composed of a mixture of two phases (tetragonal and hexagonal). The unit cell parameters increased linearly with the increase in Mn content (Figure 11). This is manifested by the systematic shift in the position of diffraction peaks toward lower angles 2θ (from 28.8° 2θ to 28.2° 2θ for the main peak). In addition, the peaks became sharper, indicating an improvement in crystallinity. As the Mn content decreased, the hexagonal phase in the CMTS mixture disappeared. The peaks associated with the hexagonal structure can be observed in samples with Mn:Fe ratios of 1:1, 0.8:0.2, and 0.6:0.4. This suggests that CMTS formed by this method of synthesis can easily form tetragonal and hexagonal forms, whereas CFTS is more likely to precipitate in tetragonal structure.
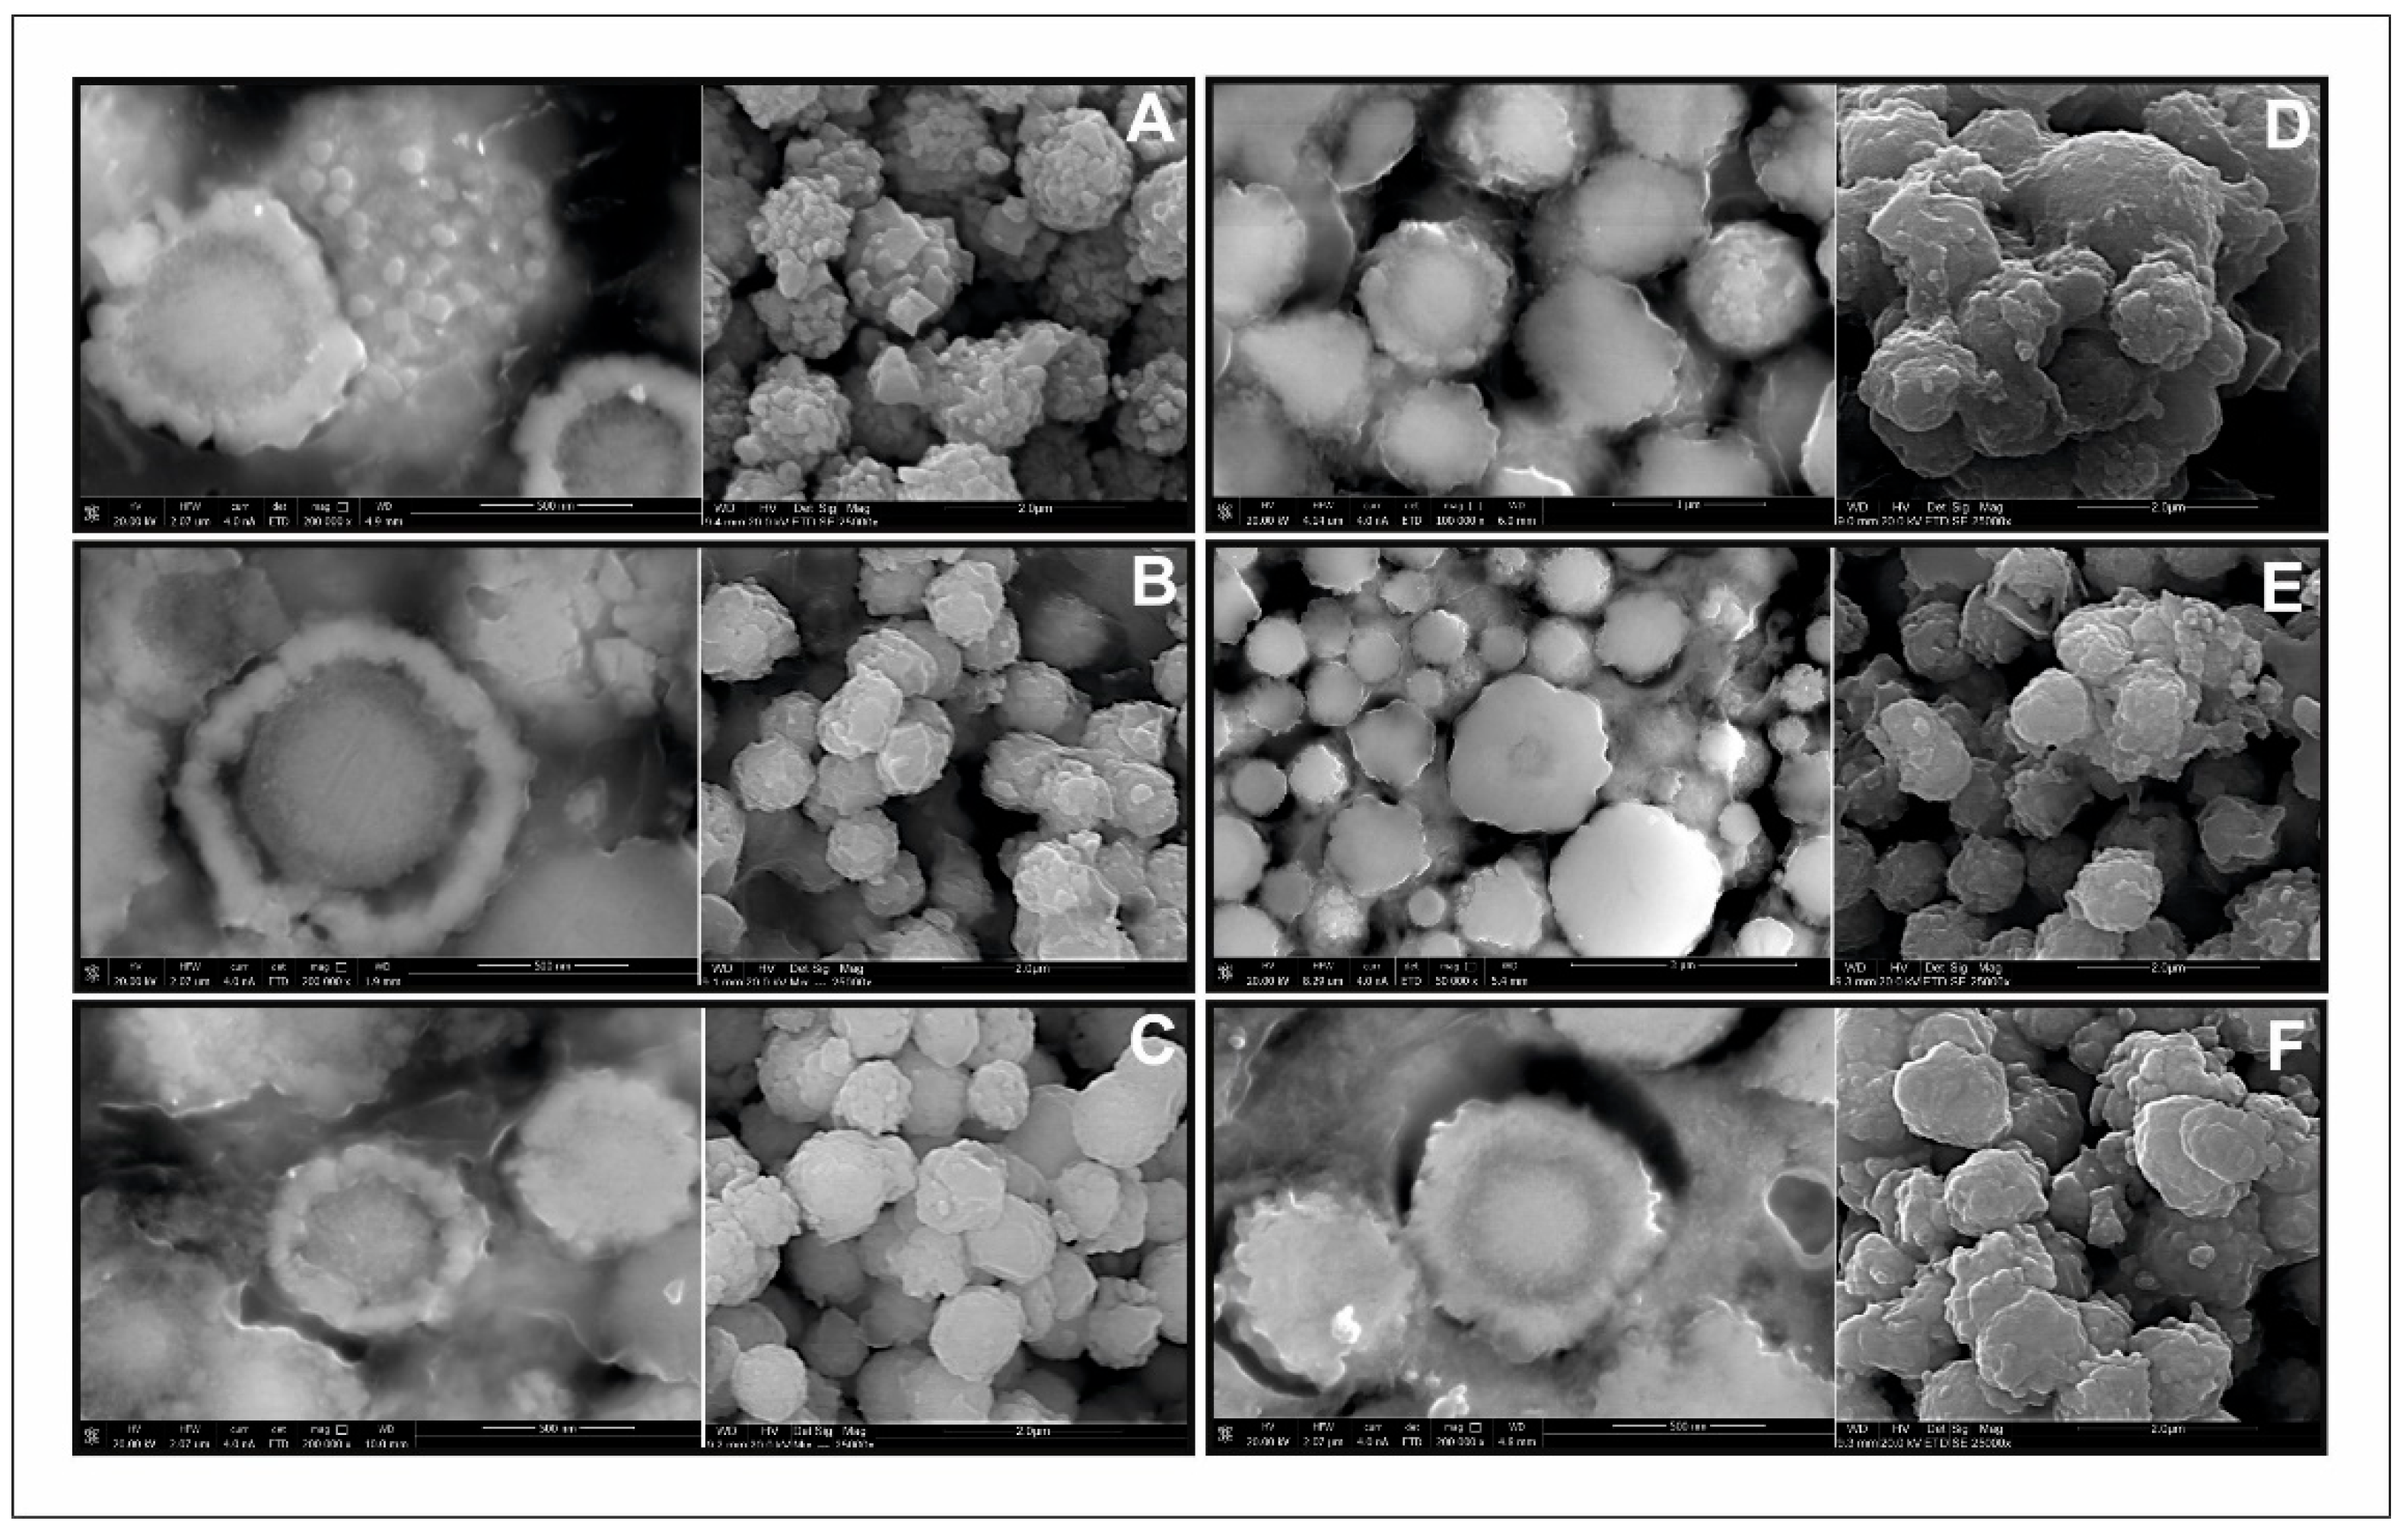
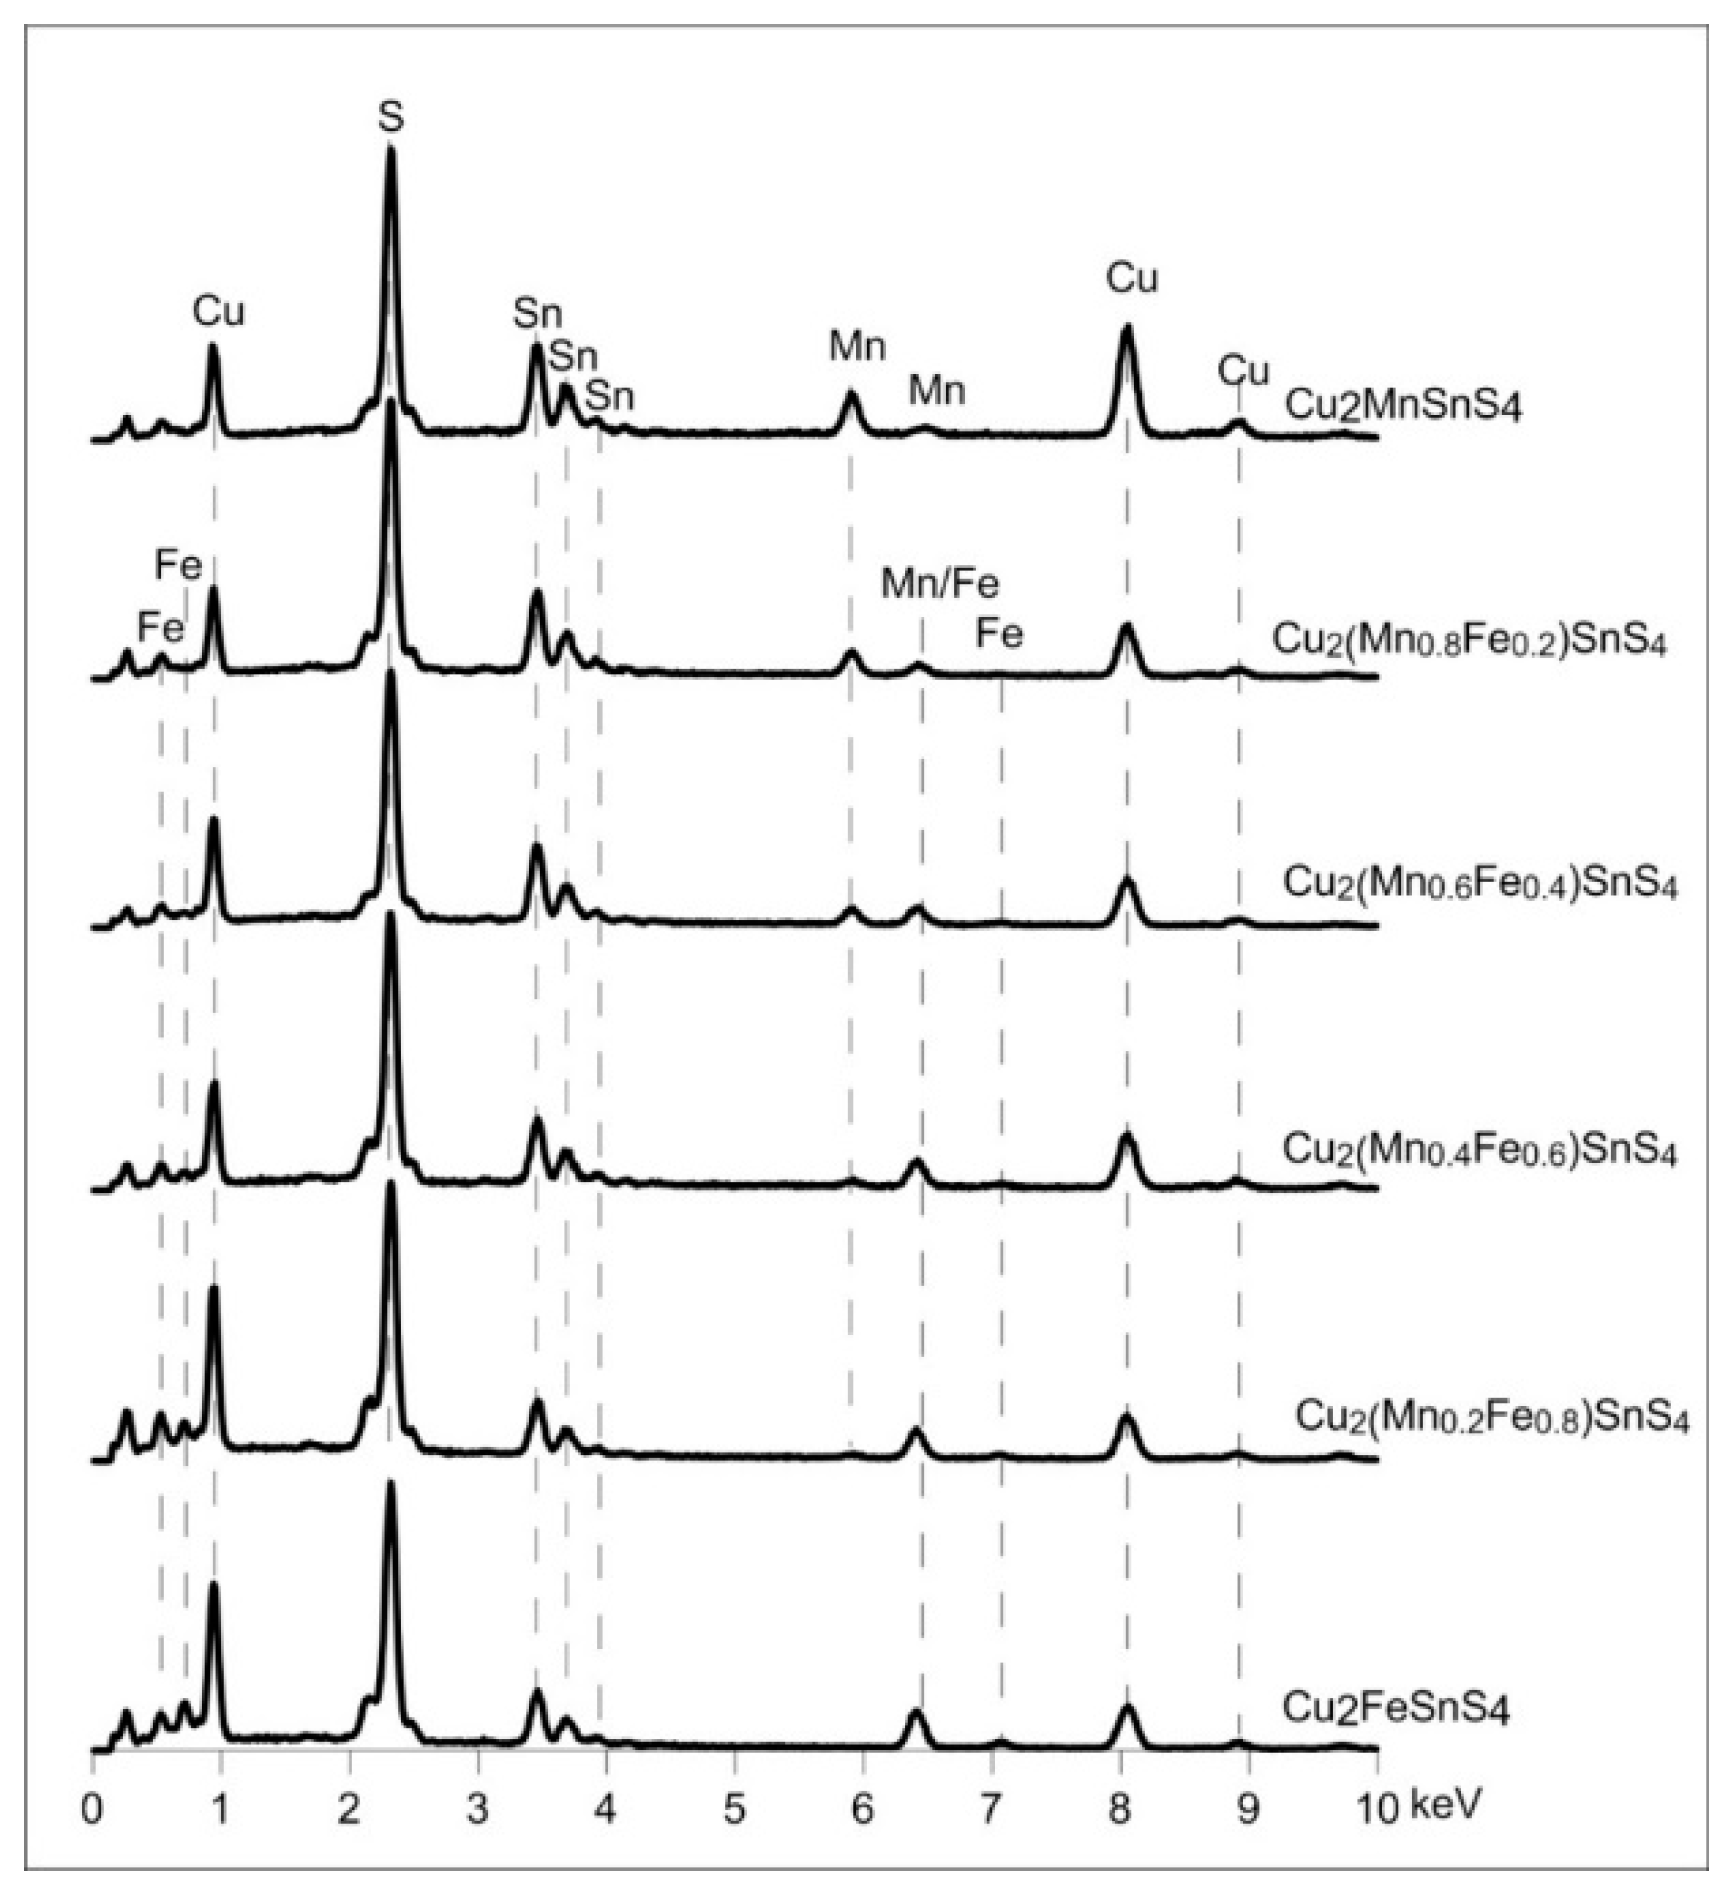
The morphology of all samples in the series was very similar (Figure 12). They consisted of relatively uniform microspheres, ca. 1–1.5 μm in diameter, with a rough surface. The internal structure of the microspheres appeared to be concentric. The outer rim was made of aggregates of small crystals, whereas the core was much more homogeneous. The elemental composition of the members of the series as determined with the use of SEM/EDS microanalysis (Figure 13, Table 1) is very close to what was expected from the synthesis. This indicates that the composition of the synthesis can be precisely controlled by the conditions of the experiment. There was no difference in elemental composition between the rim and the core. However, with Mn-rich samples, it is hypothesized that the structure of the core and the rim may be different. Tiong et al. [39] reported that the material consisting of both hexagonal and tetragonal crystalline structures was obtained by using an organic sulfur precursor such as thioacetamide and Tu in the precursor solution of the hydrothermal reaction. They obtained pure tetragonal kesterite nanocrystals when Na2S was employed as the precursor of sulfur. A mixture of both tetragonal and hexagonal crystalline structure was obtained by using organic Tu as the precursor for sulfur [39,43,44].
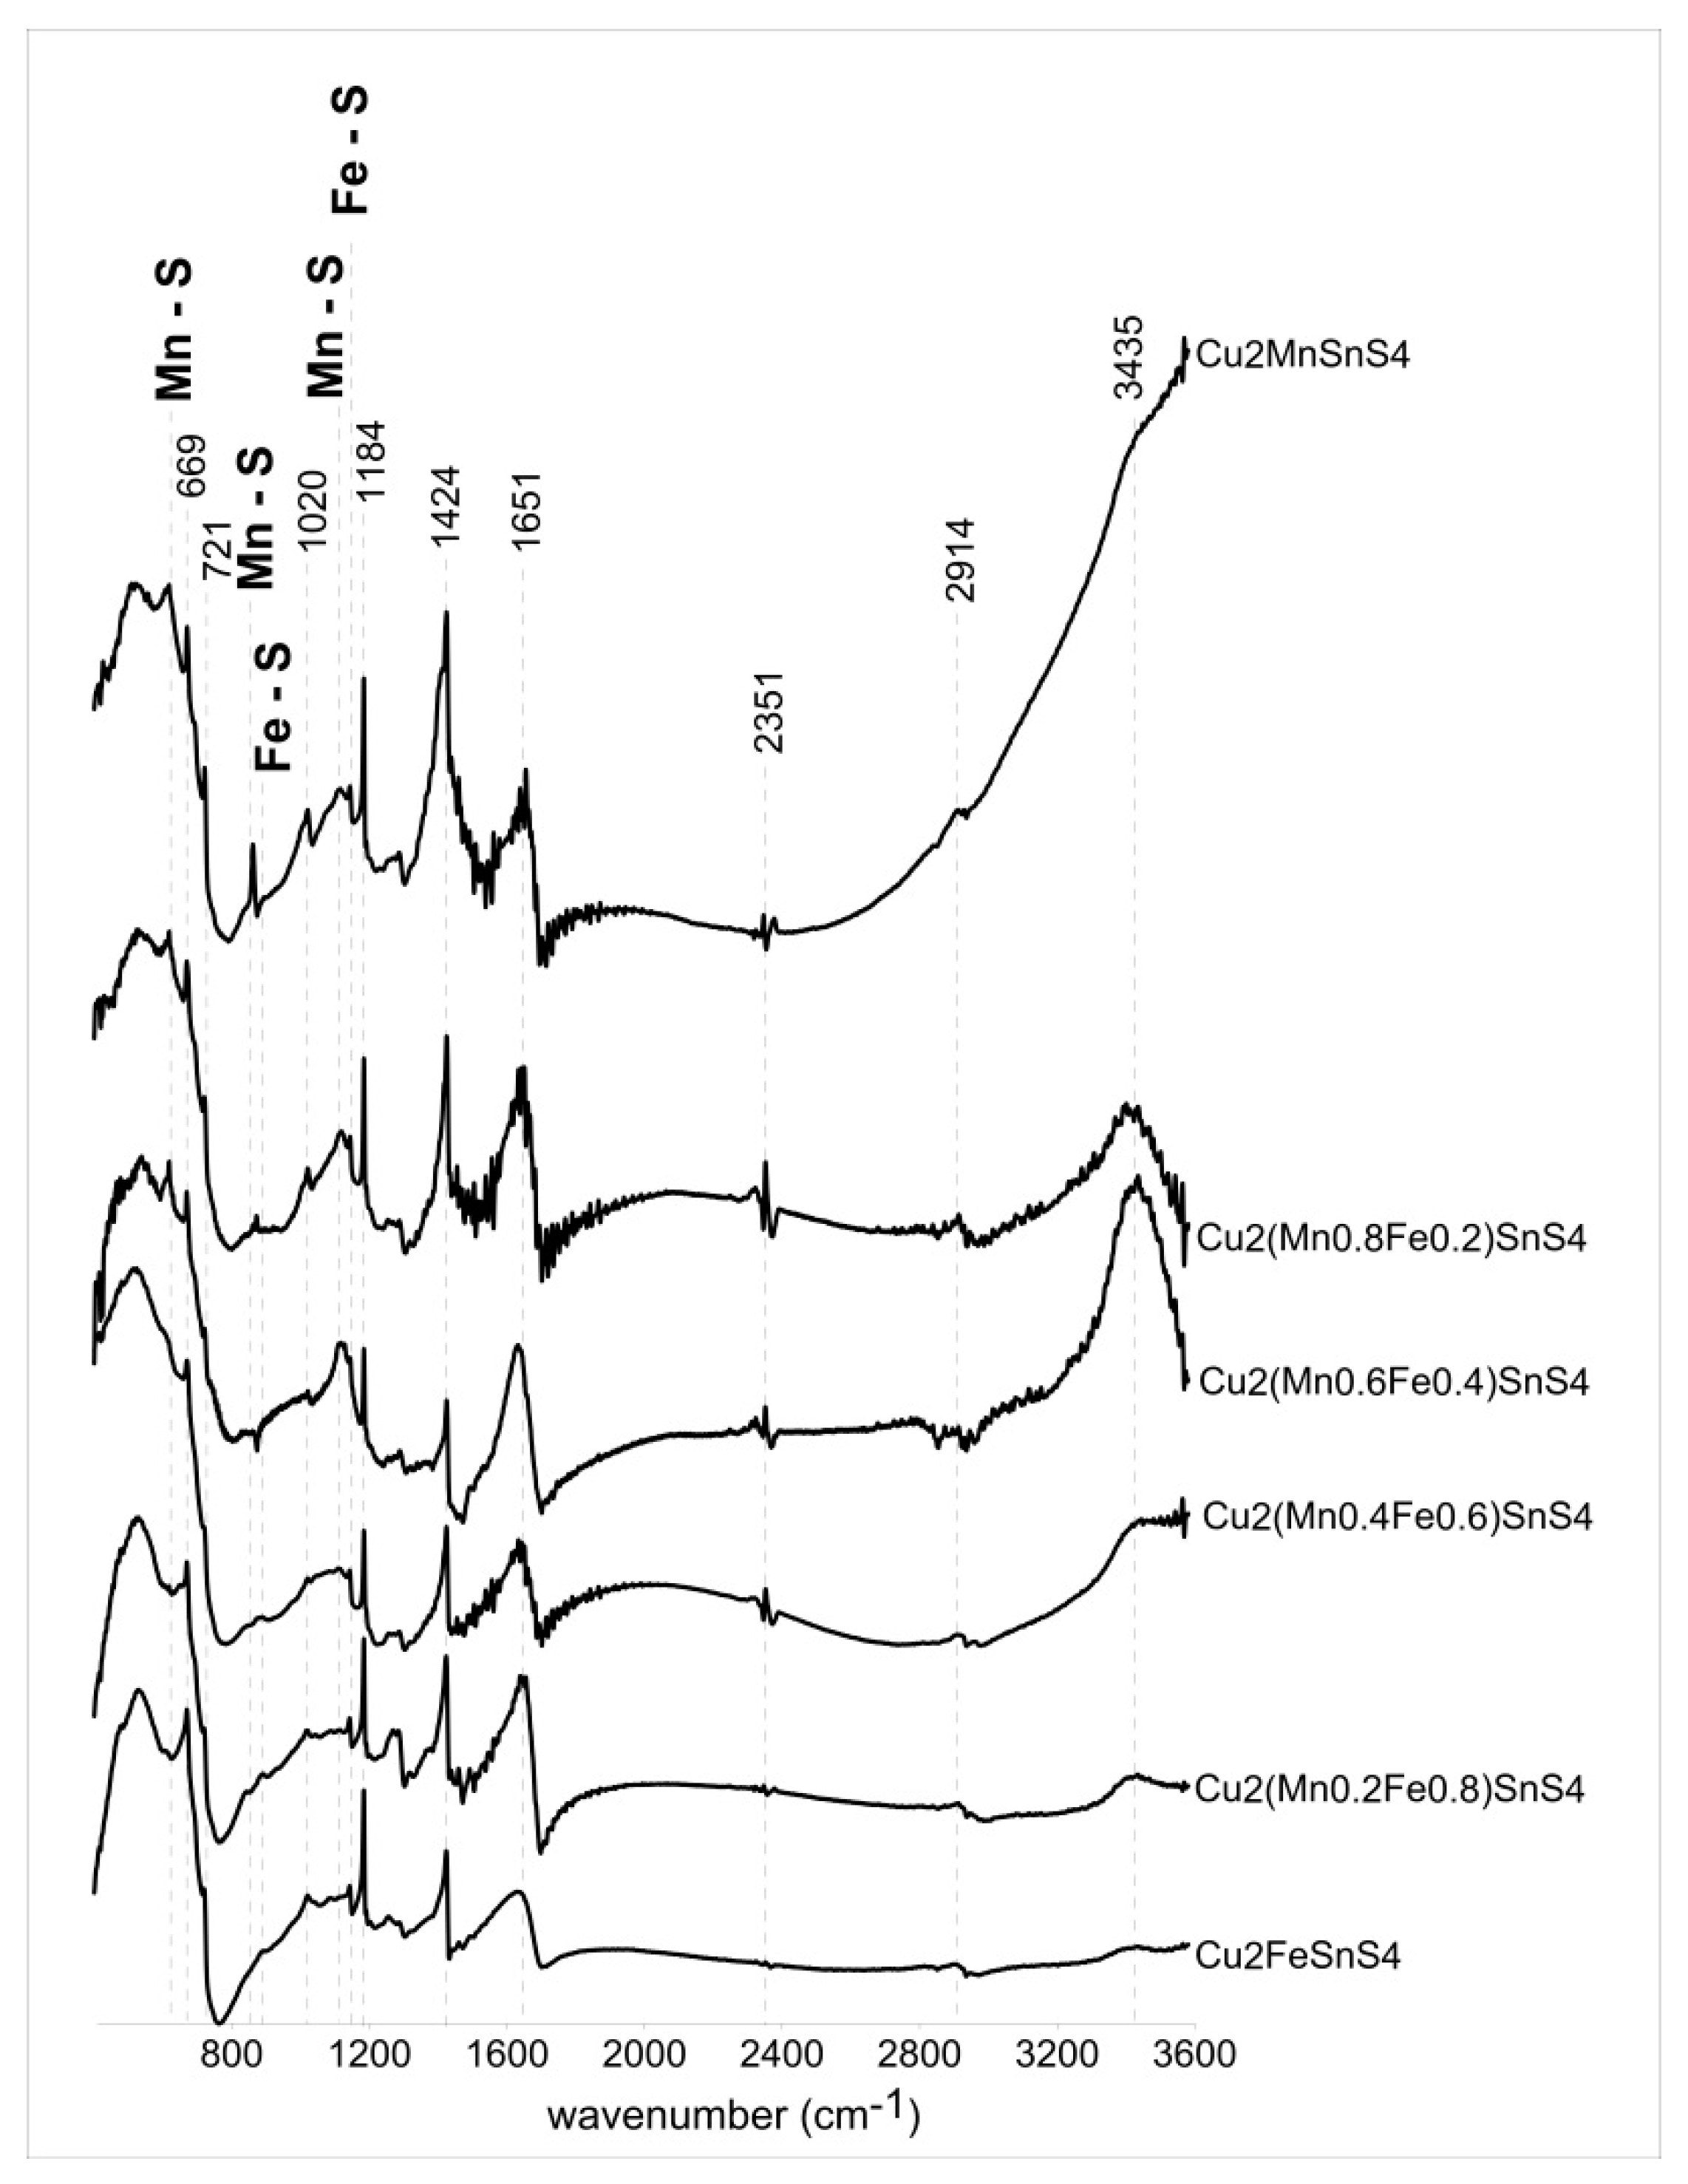
Figure 14 shows the infrared absorption spectra for the six members of the CFTS–CMTS series from 400 to 3600 cm−1. Table 2 shows the band assignments and literature sources. Samples of Cu2MnSnS4, Cu2(Mn0.8Fe0.2)SnS4, and Cu2(Mn0.6Fe0.4)SnS4 show characteristic peaks at 617, 860, and 1114 cm−1 associated with specific Mn–S vibrations. These bands are assigned to the resonance interaction between the vibration modes of the sulfide ions in the crystal. As the Fe content increases, these bands disappear and bands at 880 and 1142 cm−1 show up which corresponds to Fe–S specific vibrations (samples Cu2(Mn0.4Fe0.6)SnS4, Cu2(Mn0.2Fe0.8)SnS4, and Cu2FeSnS4). The intensity of the bands is not very high, but their position is clear. FTIR analysis is very sensitive and allows for the identification of small amounts of contaminants. Therefore, in the presented spectra, many bands do not come directly from the synthesis products, but are an artifact of a small amount of impurity arising from the unreacted components used in the experiments. These reagents are not crystalline and were not detected in XRD analysis. The absorption peak at 3435 cm–1 corresponds to the presence of water, probably from the presence of humidity in the air. Similarly, small amount of CO2 adsorbed from the air results in bands at 2351 cm–1. The characteristic bands at 720 cm–1 are assigned to metal–O–H bending vibrations. The vibration band observed at 2935 cm–1 refers to the tensile strength of C–H bond, whereas the band at 1020 cm–1 corresponds to the tensile strength of C–S bond. The bands observed at 1651, 1424, and 1183 cm–1 were assigned to metal-Tu complexes. A more complete assignment of these peaks was proposed based on the study performed on metal–Tu complexes involving δN–H bending deformation (1651 cm−1), NH2 rocking vibration, C–S stretching vibration or N–C–N stretching vibration (1424 cm−1), C=S, C–N, or NH2 rocking vibration (1185 cm−1). The C=S stretching vibration mode of the Tu molecule is found at 668 cm−1.
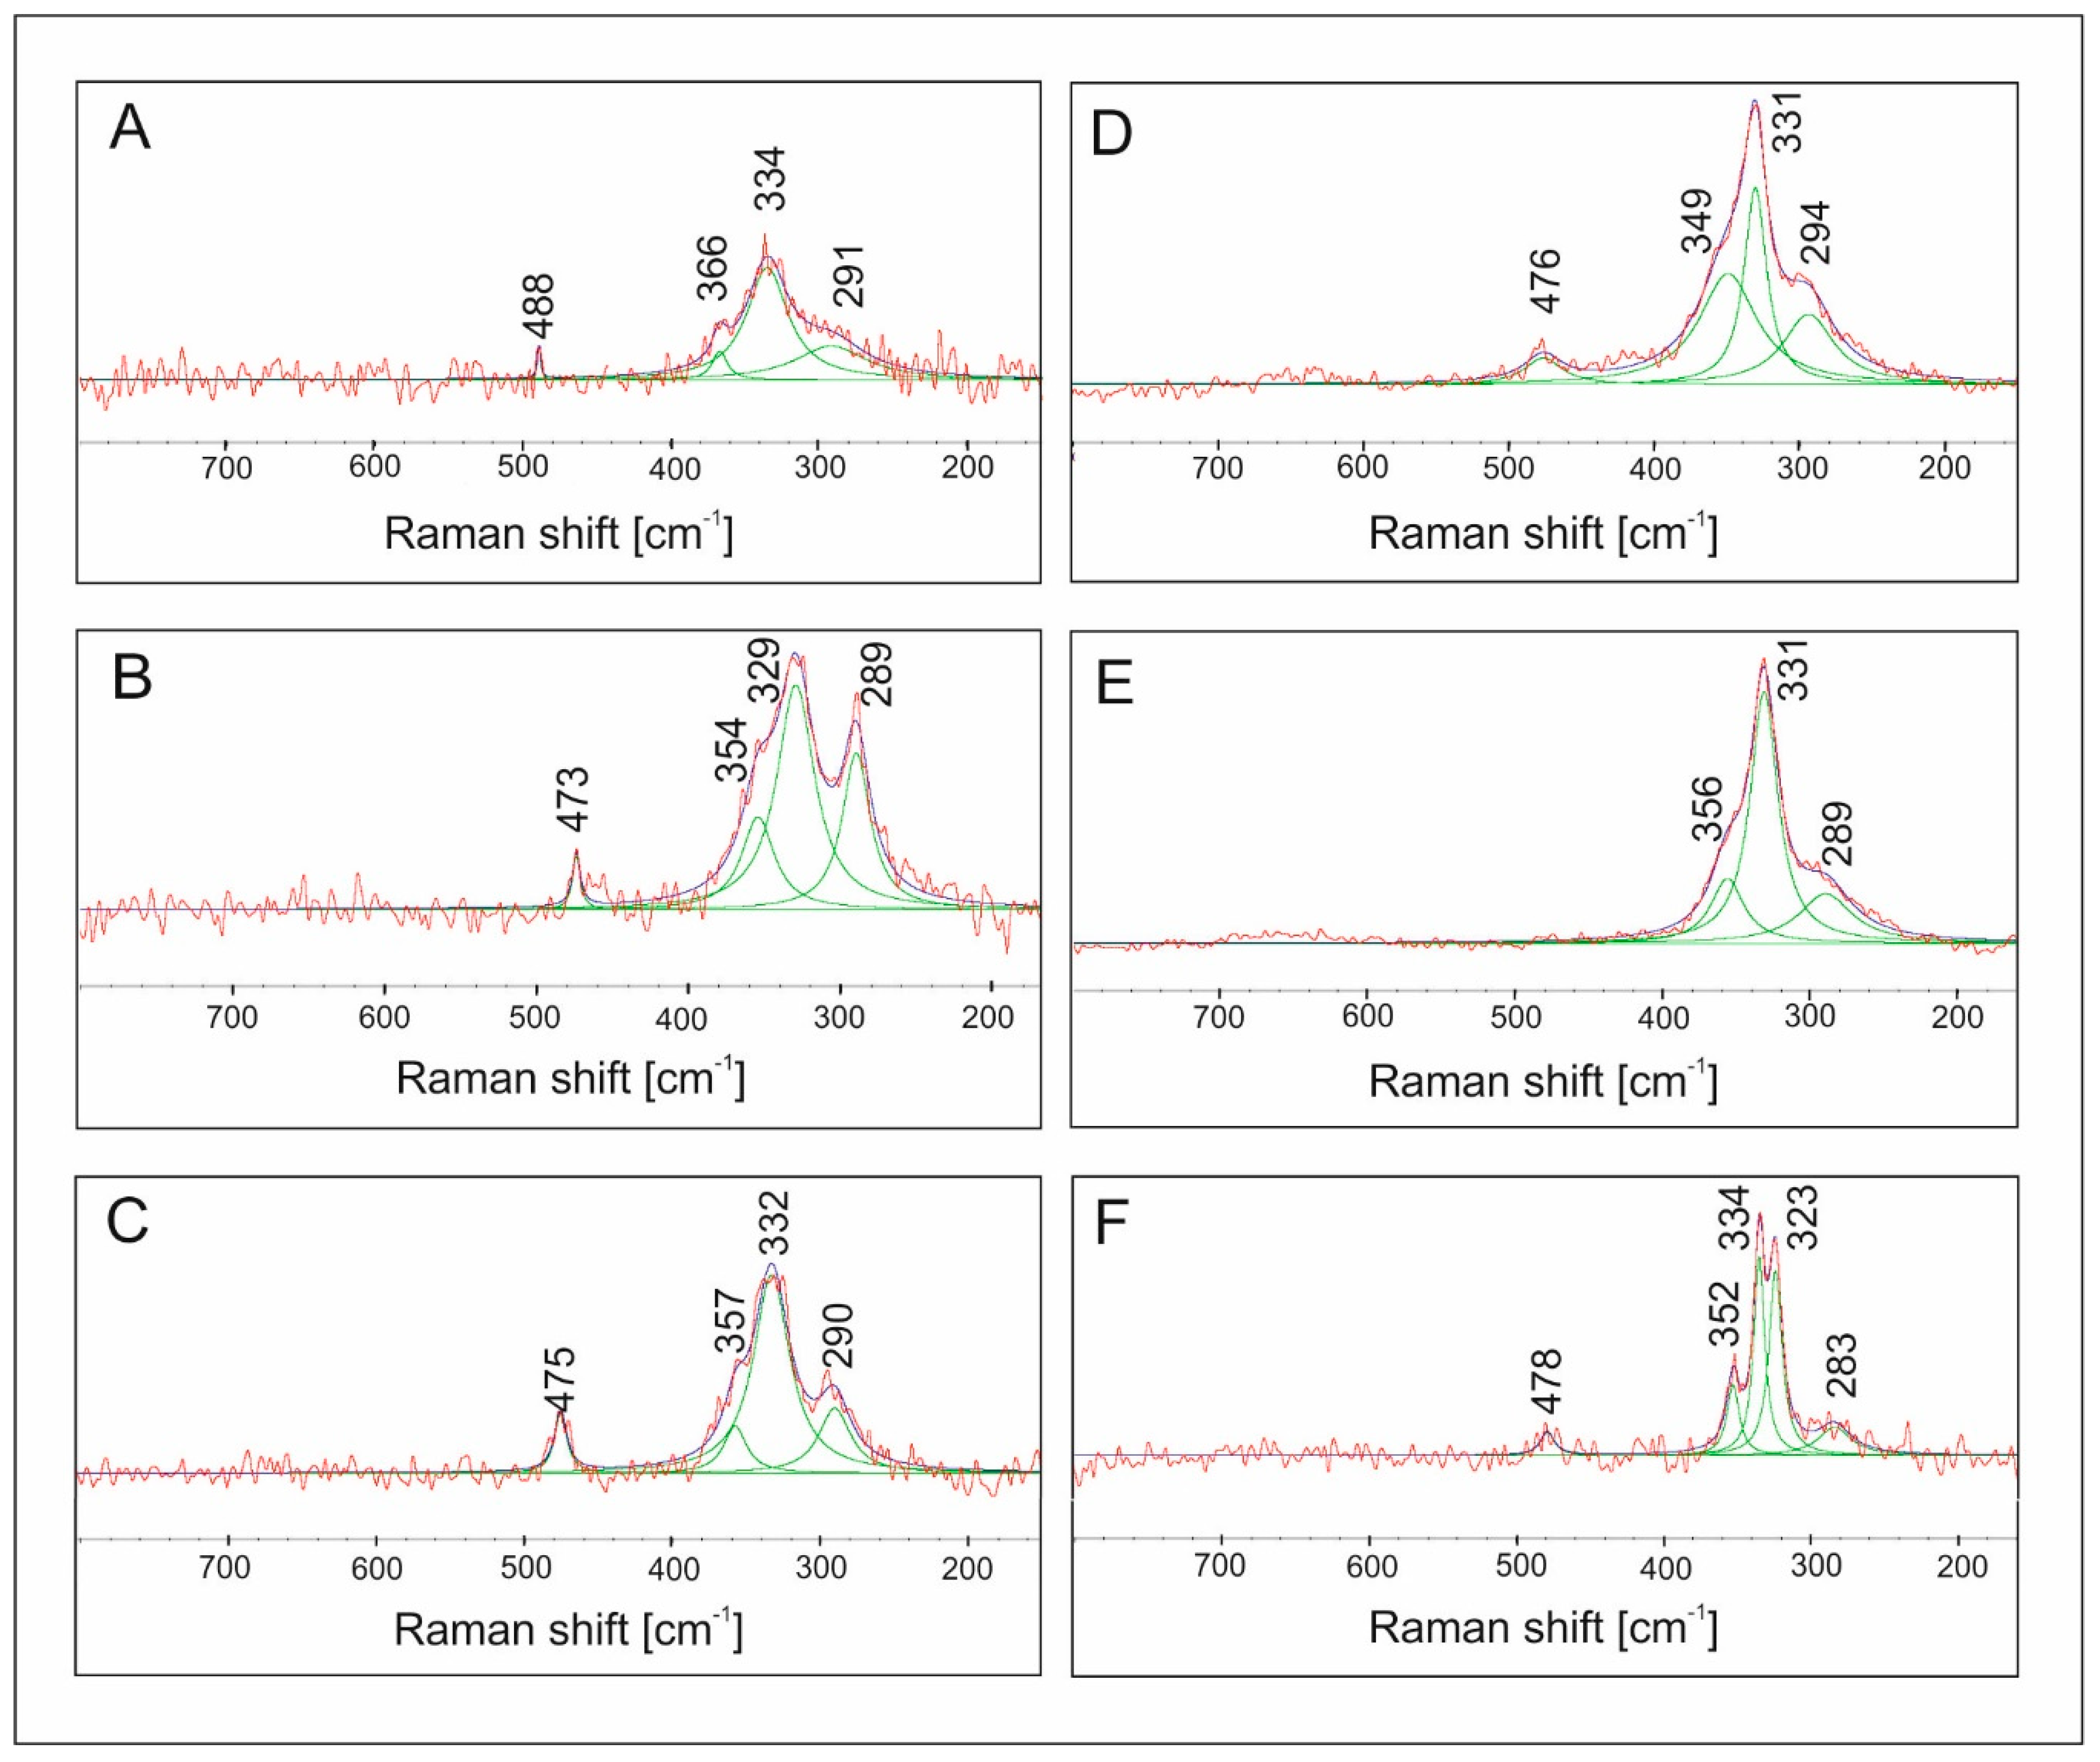
The Raman spectra of the samples analyzed (Figure 15) show bands characteristic of stannite in the range of 200–500 cm−1 [54]. Experimental Raman scattering spectra were analyzed by the deconvolution to Lorentzian curves. The dominant structure at about ~330 cm−1 in the experimental spectra is the vibration of pure anion mode of S anions around solid Sn cations, whereas the mode at about ~290 cm−1 can be considered as the pure S anion mode around Cu cation. Deconvolution shows an additional weaker band at 352–366 cm−1, which is in good agreement with the frequencies reported for this compound [54]. As the Mn content in the samples increases, shifts in positions of some bands toward lower wavenumbers are observed (from 366 to 352 and from 291 to 283 cm−1). This may be related to a slight change in the length and force of the length of the metal–S bond or due to the two kinds of anionic mode of S anions around fixed Sn cations related to a different structure in a single crystal [55]. There is also a variation in the frequency of the main A1 vibration mode at ~330 cm−1. The broadening of the main peaks found in the solid solution with the increasing content of Fe is attributed to disorder effects due to chemical substitutions in M crystallographic positions [56]. The spectrum of CMTS (Figure 12F) shows the splitting of the main peak into 323 and 334 cm−1. This is consistent with XRD results. Typically, the main Raman peak of stannite structure CZTS is reported at 330–339 cm−1 matching the values well reported for crystals and films. Nevertheless, frequencies in the range of 320–334 cm−1 can also be found in the literature for CZTS in the same range where the strongest Raman features of wurtzite and stannite CZTS were often reported [57].
4. Conclusions
In this study, a low-cost and environmentally friendly method of preparation of semiconductors was successfully tested. The hydrothermal synthesis method, requiring simple reactants, and relatively low temperature and reasonable time can be used to obtain CFTS, CMTS, and their solid solutions on a larger scale. Optimal conditions for the synthesis are as follows: A mixture of H2O:EG at the ratio of 1:7 as the reaction medium, PVP as the surface ligand, and temperature of 195 °C for 7 days. The synthesis product precipitates as aggregates of nanocrystals. The aggregates form uniform, often concentric microspheres that are 1–1.5 μm in diameter. The chemical composition of the product can be well controlled by the chemical composition of the reactants, and the compound Cu2(Mn1−xFex)SnS4 forms a continuous solid solution series. Lopez-Vergara et al. [40] have drawn similar conclusions. If the series members rich in Fe are produced, then the product has a tetragonal structure. However, if the series members rich in Mn are produced, then the product is a mixture of phases with a tetragonal and hexagonal structure. We believe this material is a good candidate for the alternative at semiconductor and can be used as an adequate absorber in solar cells or catalyzation in photocatalysis.
Author Contributions
E.W. performed the experimental synthesis, characterization, and data analysis and wrote the paper. M.M. have contributed to the study design and scientific discussions of the results. G.C. SEM formal analysis. All co-authors have contributed to the manuscript. All authors have read and agreed to the published version of the manuscript.
Funding
This research was funded by the Polish Ministry of Higher Education Grant No. DI2016–004946 under the “Diamond Grant” program.
Conflicts of Interest
The authors declare no conflict of interest.
References
- Jiang, H.C.; Dai, P.C.; Feng, Z.Y.; Fan, W.L.; Zhan, J.H. Phase selective synthesis of metastable orthorhombic Cu2ZnSnS4. J. Mater. Chem. 2012, 22, 7502–7506. [Google Scholar] [CrossRef]
- Hsu, W.; Sutter-Fella, C.M.; Hettick, M.; Cheng, L.T.; Chan, S.W.; Chen, Y.F.; Zeng, Y.P.; Zheng, M.; Wang, H.P.; Chiang, C.C.; et al. Electron-Selective TiO2 Contact for Cu(In,Ga)Se2 Solar Cells. Sci. Rep. 2015, 5, 7. [Google Scholar] [CrossRef] [PubMed] [Green Version]
- Guo, Q.; Ford, G.M.; Yang, W.C.; Walker, B.C.; Stach, E.A.; Hillhouse, H.W.; Agrawal, R. Fabrication of 7.2% Efficient CZTSSe Solar Cells Using CZTS Nanocrystals. J. Am. Chem. Soc. 2010, 132, 17384–17386. [Google Scholar] [CrossRef] [PubMed]
- Nakamura, M.; Yamaguchi, K.; Kimoto, Y.; Yasaki, Y.; Kato, T.; Sugimoto, H. Cd-Free Cu(In,Ga)(Se,S)2 Thin-Film Solar Cell with Record Efficiency of 23.35%. IEEE J. Photovolt. 2019, 9, 1863–1867. [Google Scholar] [CrossRef]
- Katagiri, H.; Jimbo, K.; Maw, W.S.; Oishi, K.; Yamazaki, M.; Araki, H.; Takeuchi, A. Development of CZTS-based thin film solar cells. Thin Solid Films 2009, 517, 2455–2460. [Google Scholar] [CrossRef]
- Tanaka, K.; Oonuki, M.; Moritake, N.; Uchiki, H. Cu2ZnSnS4 thin film solar cells prepared by non-vacuum processing. Sol. Energy Mater. Sol.Cells 2009, 93, 583–587. [Google Scholar] [CrossRef]
- Weber, A.; Schmidt, S.; Abou-Ras, D.; Schubert-Bischoff, P.; Denks, I.; Mainz, R.; Schock, H.W. Texture inheritance in thin-film growth of Cu2ZnSnS4. Appl. Phys. Lett. 2009, 95, 3. [Google Scholar] [CrossRef] [Green Version]
- Guo, Q.J.; Hillhouse, H.W.; Agrawal, R. Synthesis of Cu2ZnSnS4 Nanocrystal Ink and Its Use for Solar Cells. J. Am. Chem. Soc. 2009, 131, 11672. [Google Scholar] [CrossRef]
- Steinhagen, C.; Panthani, M.G.; Akhavan, V.; Goodfellow, B.; Koo, B.; Korgel, B.A. Synthesis of Cu2ZnSnS4 Nanocrystals for Use in Low-Cost Photovoltaics. J. Am. Chem. Soc. 2009, 131, 12554. [Google Scholar] [CrossRef]
- Shavel, A.; Arbiol, J.; Cabot, A. Synthesis of Quaternary Chalcogenide Nanocrystals: Stannite Cu2ZnxSnySe1+x+2y. J. Am. Chem. Soc. 2010, 132, 4514. [Google Scholar] [CrossRef]
- Ahn, S.; Jung, S.; Gwak, J.; Cho, A.; Shin, K.; Yoon, K.; Park, D.; Cheong, H.; Yun, J.H. Determination of band gap energy (E-g) of Cu2ZnSnSe4 thin films: On the discrepancies of reported band gap values. Appl. Phys. Lett. 2010, 97, 3. [Google Scholar] [CrossRef]
- Todorov, T.K.; Reuter, K.B.; Mitzi, D.B. High-Efficiency Solar Cell with Earth-Abundant Liquid-Processed Absorber. Adv. Mater. 2010, 22, E156. [Google Scholar] [CrossRef] [PubMed]
- Balaz, P.; Balaz, M.; Zorkovska, A.; Skorvanek, I.; Bujnakova, Z.; Trajic, J. Kinetics of Solid-State Synthesis of Quaternary Cu2FeSnS4 (Stannite) Nanocrystals for Solar Energy Applications. Acta Phys. Pol. A 2017, 131, 1153–1155. [Google Scholar] [CrossRef]
- Oueslati, H.; Ben Rabeh, M.; Kanzari, M. Growth and Characterization of the Evaporated Quaternary Absorber Cu2FeSnS4 for Solar Cell Applications. J. Electron. Mater. 2018, 47, 3577–3584. [Google Scholar] [CrossRef]
- Siebentritt, S. Why are kesterite solar cells not 20% efficient? Thin Solid Films 2013, 535, 1–4. [Google Scholar] [CrossRef] [Green Version]
- Wang, X.; Gu, X.; Guan, H.; Yu, F. Flower-like Cu2MnSnS4 particles synthesized via microwave irradiation method. Chalcogenide Lett. 2015, 12, 99–103. [Google Scholar]
- Nie, L.Y.; Yang, J.D.; Yang, D.D.; Liu, S. Effect of substrate temperature on growth and properties of Cu2MnSnS4 thin films prepared by chemical spray pyrolysis. J. Mater. Sci.-Mater. Electron. 2019, 30, 3760–3766. [Google Scholar] [CrossRef]
- Ai, L.H.; Jiang, J. Hierarchical porous quaternary Cu-Fe-Sn-S hollow chain microspheres: Rapid microwave nonaqueous synthesis, growth mechanism, and their efficient removal of organic dye pollutant in water. J. Mater. Chem. 2012, 22, 20586–20592. [Google Scholar] [CrossRef]
- Ai, L.H.; Jiang, J. Self-sacrificial templating synthesis of porous quaternary Cu-Fe-Sn-S semiconductor nanotubes via microwave irradiation. Nanotechnology 2012, 23, 9. [Google Scholar] [CrossRef]
- An, C.H.; Tang, K.B.; Shen, G.Z.; Wang, C.R.; Huang, L.Y.; Qian, Y.T. The synthesis and characterization of nanocrystalline Cu- and Ag-based multinary sulfide semiconductors. Mater. Res. Bull. 2003, 38, 823–830. [Google Scholar] [CrossRef]
- Yan, C.; Huang, C.; Yang, J.; Liu, F.Y.; Liu, J.; Lai, Y.Q.; Li, J.; Liu, Y.X. Synthesis and characterizations of quaternary Cu2FeSnS4 nanocrystals. Chem. Commun. 2012, 48, 2603–2605. [Google Scholar] [CrossRef] [PubMed]
- Fontane, X.; Izquierdo-Roca, V.; Saucedo, E.; Schorr, S.; Yukhymchuk, V.O.; Valakh, M.Y.; Perez-Rodriguez, A.; Morante, J.R. Vibrational properties of stannite and kesterite type compounds: Raman scattering analysis of Cu2(Fe,Zn)SnS4. J. Alloys Compd. 2012, 539, 190–194. [Google Scholar] [CrossRef]
- Gui, Z.; Fan, R.; Chen, X.H.; Hu, Y.; Wang, Z.Z. A new colloidal precursor cooperative conversion route to nanocrystalline quaternary copper sulfide. Mater. Res. Bull. 2004, 39, 237–241. [Google Scholar] [CrossRef]
- Jiang, X.; Xu, W.; Tan, R.; Song, W.; Chen, J. Solvothermal synthesis of highly crystallized quaternary chalcogenide Cu2FeSnS4 particles. Mater. Lett. 2013, 102, 39–42. [Google Scholar] [CrossRef]
- Khadka, D.B.; Kim, J. Structural, optical and electrical properties of Cu2FeSnX4 (X = S, Se) thin films prepared by chemical spray pyrolysis. J. Alloys Compd. 2015, 638, 103–108. [Google Scholar] [CrossRef]
- Meng, X.; Deng, H.; He, J.; Zhu, L.; Sun, L.; Yang, P.; Chu, J. Synthesis of Cu2FeSnSe4 thin film by selenization of RF magnetron sputtered precursor. Mater. Lett. 2014, 117, 1–3. [Google Scholar] [CrossRef]
- Meng, X.; Deng, H.; He, J.; Sun, L.; Yang, P.; Chu, J. Synthesis, structure, optics and electrical properties of Cu2FeSnS4 thin film by sputtering metallic precursor combined with rapid thermal annealing sulfurization process. Mater. Lett. 2015, 151, 61–63. [Google Scholar] [CrossRef]
- Prabhakar, R.R.; Nguyen Huu, L.; Kumar, M.H.; Boix, P.P.; Juan, S.; John, R.A.; Batabyal, S.K.; Wong, L.H. Facile Water-based Spray Pyrolysis of Earth-Abundant Cu2FeSnS4 Thin Films as an Efficient Counter Electrode in Dye-Sensitized Solar Cells. ACS Appl. Mater. Interfaces 2014, 6, 17661–17667. [Google Scholar] [CrossRef]
- Wang, W.; Shen, H.L.; Yao, H.Y.; Li, J.Z. Preparation and properties of Cu2FeSnS4 nanocrystals by ultrasound-assisted microwave irradiation. Mater. Lett. 2014, 125, 183–186. [Google Scholar] [CrossRef]
- Zhang, B.; Cao, M.; Li, L.; Sun, Y.; Shen, Y.; Wang, L. Facile synthesis of Cu2FeSnSe4 sheets with a simple solvothermal method. Mater. Lett. 2013, 93, 111–114. [Google Scholar] [CrossRef]
- Zhou, J.; Ye, Z.; Wang, Y.; Yi, Q.; Wen, J. Solar cell material Cu2FeSnS4 nanoparticles synthesized via a facile liquid reflux method. Mater. Lett. 2015, 140, 119–122. [Google Scholar] [CrossRef]
- Chen, L.L.; Deng, H.M.; Tao, J.H.; Zhou, W.L.; Sun, L.; Yue, F.Y.; Yang, P.X.; Chu, J.H. Influence of annealing temperature on structural and optical properties of Cu2MnSnS4 thin films fabricated by sol-gel. J. Alloys Compd. 2015, 640, 23–28. [Google Scholar] [CrossRef]
- Chen, L.L.; Deng, H.M.; Tao, J.H.; Cao, H.Y.; Sun, L.; Yang, P.X.; Chu, J.H. Strategic improvement of Cu2MnSnS4 films by two distinct post annealing processes for constructing thin film solar cells. Acta Mater. 2016, 109, 1–7. [Google Scholar] [CrossRef]
- Le Donne, A.; Marchionna, S.; Acciarri, M.; Cernuschi, F.; Binetti, S. Relevant efficiency enhancement of emerging Cu2MnSnS4 thin film solar cells by low temperature annealinge. Sol. Energy 2017, 149, 125–131. [Google Scholar] [CrossRef]
- Marchionna, S.; Le Donne, A.; Merlini, M.; Binetti, S.; Acciarri, M.; Cernuschi, F. Growth of Cu2MnSnS4 PV absorbers by sulfurization of evaporated precursors. J. Alloys Compd. 2017, 693, 95–102. [Google Scholar] [CrossRef]
- Prabhakar, R.R.; Su, Z.H.; Xin, Z.; Baikie, T.; Woei, L.S.; Shukla, S.; Batabyal, S.K.; Gunawan, O.; Wong, L.H. Photovoltaic effect in earth abundant solution processed Cu2MnSnS4 and Cu2MnSn(S,Se)4 thin films. Sol. Energy Mater. Sol. Cells 2016, 157, 867–873. [Google Scholar] [CrossRef]
- Yan, X.; Michael, E.; Komarneni, S.; Brownson, J.R.; Yan, Z.F. Microwave-hydrothermal/solvothermal synthesis of kesterite, an emerging photovoltaic material. Ceram. Int. 2014, 40, 1985–1992. [Google Scholar] [CrossRef]
- Liu, Y.; Xu, J.; Ni, Z.; Fang, G.; Tao, W. One-step sonochemical synthesis route towards kesterite Cu2ZnSnS4 nanoparticles. J. Alloys Compd. 2015, 630, 23–28. [Google Scholar] [CrossRef]
- Tiong, V.T.; Zhang, Y.; Bell, J.; Wang, H.X. Phase-selective hydrothermal synthesis of Cu2ZnSnS4 nanocrystals: The effect of the sulphur precursor. Crystengcomm 2014, 16, 4306–4313. [Google Scholar] [CrossRef]
- Lopez-Vergara, F.; Galdamez, A.; Manriquez, V.; Barahona, P.; Pena, O. Magnetic properties and crystal structure of solid-solution Cu2MnxFe1−xSnS4 chalcogenides with stannite-type structure. Phys. Status Solidi B-Basic Solid State Phys. 2014, 251, 958–964. [Google Scholar] [CrossRef]
- Marciniak, H.; Diduszko, R.; Kozak, M. XRAYAN - Program do rentgenowskiej analizyfazowej (in Polish); KOMA: Warszawa, Poland, 2006. [Google Scholar]
- Liang, X.L.; Guo, P.; Wang, G.; Deng, R.P.; Pan, D.C.; Wei, X.H. Dilute magnetic semiconductor Cu2MnSnS4 nanocrystals with a novel zincblende and wurtzite structure. RSC Adv. 2012, 2, 5044–5046. [Google Scholar] [CrossRef]
- Li, Z.G.; Lui, A.L.K.; Lam, K.H.; Xi, L.F.; Lam, Y.M. Phase-Selective Synthesis of Cu2ZnSnS4 Nanocrystals using Different Sulfur Precursors. Inorg. Chem. 2014, 53, 10874–10880. [Google Scholar] [CrossRef] [PubMed]
- Zou, Y.; Su, X.; Jiang, J. Phase-Controlled Synthesis of Cu2ZnSnS4 Nanocrystals: The Role of Reactivity between Zn and S. J. Am. Chem. Soc. 2013, 135, 18377–18384. [Google Scholar] [CrossRef] [PubMed]
- Whiffen, R.M.K.; Jovanovic, D.J.; Antic, Z.; Bartova, B.; Milivojevic, D.; Dramicanin, M.D.; Brik, M.G. Structural, optical and crystal field analyses of undoped and Mn2+-doped ZnS nanoparticles synthesized via reverse micelle route. J. Lumin. 2014, 146, 133–140. [Google Scholar] [CrossRef]
- Patel, M.; Mukhopadhyay, I.; Ray, A. Structural, optical and electrical properties of spray-deposited CZTS thin films under a non-equilibrium growth condition. J. Phys. D-Appl. Phys. 2012, 45, 10. [Google Scholar] [CrossRef]
- Neto, N.F.A.; Oliveira, Y.G.; Bomio, M.R.D.; Motta, F.V. Synthesis and Characterization of Co2+ and Mn2+ Codoped ZnO Nanoparticles Obtained by the Sonochemical Method: Photocatalytic and Antimicrobial Properties. J. Electron. Mater. 2019, 48, 5900–5905. [Google Scholar] [CrossRef]
- Nguyen, T.P.; Le, A.D.; Vu, T.B.; Lam, Q.V. Investigations on photoluminescence enhancement of poly(vinyl alcohol) encapsulated Mn-doped ZnS quantum dots. J. Lumin. 2017, 192, 166–172. [Google Scholar] [CrossRef]
- Rawat, K.; Shishodia, P.K. Structural and optical properties of sol gel derived Cu2ZnSnS4 nanoparticles. Adv. Powder Technol. 2017, 28, 611–617. [Google Scholar] [CrossRef]
- Chirita, P.; Descostes, M.; Schlegel, M.L. Oxidation of FeS by oxygen-bearing acidic solutions. J. Colloid Interface Sci. 2008, 321, 84–95. [Google Scholar] [CrossRef]
- Digraskar, R.V.; Sapner, V.S.; Narwade, S.S.; Mali, S.M.; Ghule, A.V.; Sathe, B.R. Enhanced electrocatalytic hydrogen generation from water via cobalt-doped Cu2ZnSnS4 nanoparticles. RSC Adv. 2018, 8, 20341–20346. [Google Scholar] [CrossRef] [Green Version]
- Zaberca, O.; Oftinger, F.; Chane-Ching, J.Y.; Datas, L.; Lafond, A.; Puech, P.; Balocchi, A.; Lagarde, D.; Marie, X. Surfactant-free CZTS nanoparticles as building blocks for low-cost solar cell absorbers. Nanotechnology 2012, 23, 11. [Google Scholar] [CrossRef] [PubMed]
- Wang, J.; Zhang, P.; Song, X.F.; Gao, L. Sol-gel nanocasting synthesis of kesterite Cu2ZnSnS4 nanorods. RSC Adv. 2015, 5, 1220–1226. [Google Scholar] [CrossRef]
- Gurel, T.; Sevik, C.; Cagin, T. Characterization of vibrational and mechanical properties of quaternary compounds Cu2ZnSnS4 and Cu2ZnSnSe4 in kesterite and stannite structures. Phys. Rev. B 2011, 84, 7. [Google Scholar] [CrossRef]
- Trajic, J.; Romcevic, M.; Petrovic, M.; Gilic, M.; Balaz, P.; Zorkovska, A.; Romcevic, N. Optical properties of the mechanochemically synthesized Cu2FeSnS4 (stannite) nanocrystals: Raman study. Opt. Mater. 2018, 75, 314–318. [Google Scholar] [CrossRef]
- Lopez-Vergara, F.; Galdamez, A.; Manriquez, V.; Gonzales, G. Crystal structure and Raman scattering characterization of Cu2Fe1−xCoxSnS4 chalcogenide compounds. Solid State Sci. 2015, 49, 54–60. [Google Scholar] [CrossRef]
- Havryliuk, Y.; Valakh, M.Y.; Dzhagan, V.; Greshchuk, O.; Yukhymchuk, V.; Raevskaya, A.; Stroyuk, O.; Selyshchev, O.; Gaponik, N.; Zahn, D.R.T. Raman characterization of Cu2ZnSnS4 nanocrystals: Phonon confinement effect and formation of CuxS phases. RSC Adv. 2018, 8, 30736–30746. [Google Scholar] [CrossRef] [Green Version]
Figure 1.
Powder X-ray diffraction pattern of Cu2FeSnS4 (CFTS) nanoparticles synthesized at various EG:H2O ratios with the stannite standard positions marked at the bottom. In some samples impurities were detected as artifacts of an incomplete reaction. The optimal EG:H2O ratio is 7:1.
Figure 1.
Powder X-ray diffraction pattern of Cu2FeSnS4 (CFTS) nanoparticles synthesized at various EG:H2O ratios with the stannite standard positions marked at the bottom. In some samples impurities were detected as artifacts of an incomplete reaction. The optimal EG:H2O ratio is 7:1.

Figure 2.
Powder X-ray diffraction pattern of Cu2MnSnS4 (CMTS) nanoparticles synthesized at various EG:H2O ratios. As the water content increases, the peaks characteristic of the hexagonal structure become clearer.
Figure 2.
Powder X-ray diffraction pattern of Cu2MnSnS4 (CMTS) nanoparticles synthesized at various EG:H2O ratios. As the water content increases, the peaks characteristic of the hexagonal structure become clearer.

Figure 3.
The effect of various EG:H2O ratios on the morphology of Cu2FeSnS4 (CFTS) synthesized for 1 week at 195 °C: (A) 1:0; (B) 7:1; (C) 3:1; (D) 5:3; (E) 1:1; (F) 3:5; (G) 1:3 EG:H2O ratio. With the increase in the water content in the initial batch, two generations of crystallites appear. The optimal EG:H2O ratio is 7:1.

Figure 4.
Powder X-ray diffraction patterns of synthetic Cu2FeSnS4 (CFTS) resulting from different synthesis times (synthesis at 195 °C and EG:H2O = 7:1). All experiments resulted in a tetragonal stannite identical to JCPDS standard No 74-1025. The optimal reaction time is one week.
Figure 4.
Powder X-ray diffraction patterns of synthetic Cu2FeSnS4 (CFTS) resulting from different synthesis times (synthesis at 195 °C and EG:H2O = 7:1). All experiments resulted in a tetragonal stannite identical to JCPDS standard No 74-1025. The optimal reaction time is one week.

Figure 5.
Scanning electron microscopy images of Cu2FeSnS4 (CFTS) resulting from different synthesis times: (A) 1 day, (B) 3 days, (C) 1 week, (D) 2 weeks. All products consisted of spherical particles of relatively uniform average size.
Figure 5.
Scanning electron microscopy images of Cu2FeSnS4 (CFTS) resulting from different synthesis times: (A) 1 day, (B) 3 days, (C) 1 week, (D) 2 weeks. All products consisted of spherical particles of relatively uniform average size.

Figure 6.
Statistical particle size distribution diagrams Cu2FeSnS4 (CFTS) resulting from different synthesis times: (A) 1 day, (B) 3 days, (C) 1 week, (D) 2 weeks. The extended synthesis time generates larger microparticles and the optimal reaction time is one week.
Figure 6.
Statistical particle size distribution diagrams Cu2FeSnS4 (CFTS) resulting from different synthesis times: (A) 1 day, (B) 3 days, (C) 1 week, (D) 2 weeks. The extended synthesis time generates larger microparticles and the optimal reaction time is one week.

Figure 7.
Powder X-ray diffraction patterns of synthetic Cu2MnSnS4 (CMTS) resulting from different synthesis times (synthesis at 195 °C and EG:H2O = 7:1). MnCO3 (rhodochrosite) was detected in the products of syntheses lasting one day and three days and in the product of synthesis at low temperature (160 °C for two weeks).

Figure 8.
Scanning electron microscopy images for Cu2MnSnS4 (CMTS) resulting from different times of synthesis: (A) 1 day, (B) 3 days, (C) 1 week, (D) 2 weeks. The particle size depends on the synthesis time and the optimal reaction time is one week.
Figure 8.
Scanning electron microscopy images for Cu2MnSnS4 (CMTS) resulting from different times of synthesis: (A) 1 day, (B) 3 days, (C) 1 week, (D) 2 weeks. The particle size depends on the synthesis time and the optimal reaction time is one week.

Figure 9.
SEM/EDS spectrum showing the elemental composition of sparse admixtures of rhodochrosite (MnCO3) found in CMTS the products of syntheses lasting 1 day, 3 days, and 2 times a week.
Figure 9.
SEM/EDS spectrum showing the elemental composition of sparse admixtures of rhodochrosite (MnCO3) found in CMTS the products of syntheses lasting 1 day, 3 days, and 2 times a week.

Figure 10.
Powder X-ray diffraction patterns of Cu2(Mn1−xFex)SnS4 solid solution series. The systematic shift in the position of diffraction peaks towards lower angles 2θ with increasing Mn content is observed.
Figure 10.
Powder X-ray diffraction patterns of Cu2(Mn1−xFex)SnS4 solid solution series. The systematic shift in the position of diffraction peaks towards lower angles 2θ with increasing Mn content is observed.

Figure 11.
Linear changes of unit cell parameters in the CMTS-CFTS series as compared to similar results obtained by Lopez–Vergara et al. [40].
Figure 11.
Linear changes of unit cell parameters in the CMTS-CFTS series as compared to similar results obtained by Lopez–Vergara et al. [40].

Figure 12.
Scanning electron microscopy images of Cu2(Mn1−xFex)SnS4 solid solution series: (A) Cu2FeSnS4 (CFTS); (B) Mn0.2Fe0.8; (C) Mn0.4Fe0.6; (D) Mn0.6Fe0.4; (E) Mn0.8Fe0.2; (F) Cu2MnSnS4 (CMTS). The left image in each pair is taken from polished samples immersed in epoxy resin to show the inner nanostructure of the microspheres on the cross-sections, the right one is from raw powders.

Figure 13.
Elemental composition of Cu2(Mn1−xFex)SnS4 solid solution series. All the samples have the composition close to what was expected from the synthesis. All the samples have the composition close to what was expected from the synthesis.
Figure 13.
Elemental composition of Cu2(Mn1−xFex)SnS4 solid solution series. All the samples have the composition close to what was expected from the synthesis. All the samples have the composition close to what was expected from the synthesis.

Figure 14.
Fourier transform infrared spectra of Cu2(Mn1−xFex)SnS4 solid solution series. Several bands do not come directly from the synthesis products, but are an artifact of a small amount of impurity coming from the unreacted components used in the experiments. Specific Mn–S vibrations (617, 860, 1114 cm−1) and Fe–S vibrations (880 and 1142 cm−1) are marked.

Figure 15.
Raman spectra of: (A) Cu2FeSnS4, (B) Cu2(Mn0.2Fe0.8)SnS4, (C) Cu2(Mn0.4Fe0.6)SnS4, (D) Cu2(Mn0.6Fe0.4)SnS4, (E) Cu2(Mn0.8Fe0.2)SnS4, (F) Cu2MnSnS4. There is a variation in the frequency of the characteristic band of stannite: a main vibration mode at ~330 cm−1.
Figure 15.
Raman spectra of: (A) Cu2FeSnS4, (B) Cu2(Mn0.2Fe0.8)SnS4, (C) Cu2(Mn0.4Fe0.6)SnS4, (D) Cu2(Mn0.6Fe0.4)SnS4, (E) Cu2(Mn0.8Fe0.2)SnS4, (F) Cu2MnSnS4. There is a variation in the frequency of the characteristic band of stannite: a main vibration mode at ~330 cm−1.


Table 1.
Chemical composition (wt%) of Cu2(Mn1−xFex)SnS4 microcrystals from SEM/EDS analysis.
| Cu | Mn | Fe | Sn | S | Estimated | Nominal |
|---|---|---|---|---|---|---|
| 26.51 | 26.44 | 0.00 | 8.07 | 39.01 | Cu3.5Mn0.8Sn1.1S4 | Cu2MnSnS4 |
| 24.78 | 31.37 | 6.79 | 3.22 | 33.84 | Cu2.8(Mn0.6Fe0.3)Sn1.4S4 | Cu2(Mn0.8Fe0.2)SnS4 |
| 27.85 | 29.40 | 4.97 | 6.01 | 31.77 | Cu2.3(Mn0.4Fe0.5)Sn1.1S4 | Cu2(Mn0.6Fe0.4)SnS4 |
| 30.83 | 22.51 | 1.54 | 9.11 | 36.01 | Cu2.4(Mn0.1Fe0.7)Sn0.8S4 | Cu2(Mn0.4Fe0.6)SnS4 |
| 28.94 | 25.69 | 1.79 | 11.24 | 32.35 | Cu2.3(Mn0.1Fe0.9)Sn1S4 | Cu2(Mn0.2Fe0.8)SnS4 |
| 29.45 | 0.00 | 26.42 | 11.93 | 32.19 | Cu2.2Fe0.9Sn1S4 | Cu2FeSnS4 |
Table 2.
Fourier transform infrared frequency range and functional groups of Cu2(Mn1−xFex)SnS4 solid solution series.
Table 2.
Fourier transform infrared frequency range and functional groups of Cu2(Mn1−xFex)SnS4 solid solution series.
| Cu2MnSnS4 | Cu2(Mn0.8Fe0.2)SnS4 | Cu2(Mn0.6Fe0.4)SnS4 | Cu2(Mn0.4Fe0.6)SnS4 | Cu2(Mn0.2Fe0.8)SnS4 | Cu2FeSnS4 | Interpretation | Literature |
|---|---|---|---|---|---|---|---|
| 617 | 617 | 617 | x | x | x | Mn-S specific vibrations | [45,46,47,48] |
| 669 | 669 | 669 | 669 | 669 | 669 | metal–thiourea complex – C–S stretching vibration | [49] |
| 721 | 720 | 721 | 719 | 720 | 719 | metal–O–H vibration | [50] |
| 861 | 872 | 860 | x | x | x | attributed to the resonance interaction between vibrational modes of sulfide ions in the crystal | [46,47] |
| x | x | x | 880 | 885 | 890 | attributed to the resonance interaction between vibrational modes of sulfide ions in the crystal - Fe–S specific vibrations | [46,47,50] |
| 1020 | 1020 | 1021 | 1020 | 1020 | 1020 | C-S stretching vibration | [49] |
| 1114 | 1119 | 1117 | x | x | x | Mn-S specific vibrations | [48] |
| x | x | x | 1142 | 1142 | 1142 | Fe-S specific vibrations | [50] |
| 1184 | 1184 | 1184 | 1184 | 1184 | 1184 | metal–thiourea complex - NH2 rocking vibration | [48,51] |
| 1424 | 1424 | 1424 | 1424 | 1423 | 1424 | metal–thiourea complex – N-C–N stretching and NH2 bending vibrational mode | [49,52] |
| 1651 | 1649 | 1647 | 1636 | 1636 | 1632 | metal–thiourea complex – N–C–N stretching and NH2 bending vibrational mode | [49,52] |
| 2351 | 2351 | 2348 | 2351 | 2351 | 2351 | CO2—was not related to the samples | [45] |
| 2914 | 2913 | 2905 | 2909 | 2897 | 2897 | C–H asymmetric stretching vibration | [45] |
| 3435 | 3435 | 3435 | 3435 | 3435 | 3435 | attributed to the O–H stretching vibration of H2O | [47,51,53] |
© 2020 by the authors. Licensee MDPI, Basel, Switzerland. This article is an open access article distributed under the terms and conditions of the Creative Commons Attribution (CC BY) license (http://creativecommons.org/licenses/by/4.0/).
Share and Cite
MDPI and ACS Style
Waluś, E.; Manecki, M.; Cios, G. Synthesis and Characterization of Cu2FeSnS4–Cu2MnSnS4 Solid Solution Microspheres. Materials 2020, 13, 4440. https://0-doi-org.brum.beds.ac.uk/10.3390/ma13194440
AMA Style
Waluś E, Manecki M, Cios G. Synthesis and Characterization of Cu2FeSnS4–Cu2MnSnS4 Solid Solution Microspheres. Materials. 2020; 13(19):4440. https://0-doi-org.brum.beds.ac.uk/10.3390/ma13194440
Chicago/Turabian StyleWaluś, Edyta, Maciej Manecki, and Grzegorz Cios. 2020. "Synthesis and Characterization of Cu2FeSnS4–Cu2MnSnS4 Solid Solution Microspheres" Materials 13, no. 19: 4440. https://0-doi-org.brum.beds.ac.uk/10.3390/ma13194440
Note that from the first issue of 2016, this journal uses article numbers instead of page numbers. See further details here.