Absolute Rheological Measurements of Model Suspensions: Influence and Correction of Wall Slip Prevention Measures


Abstract
:1. Introduction
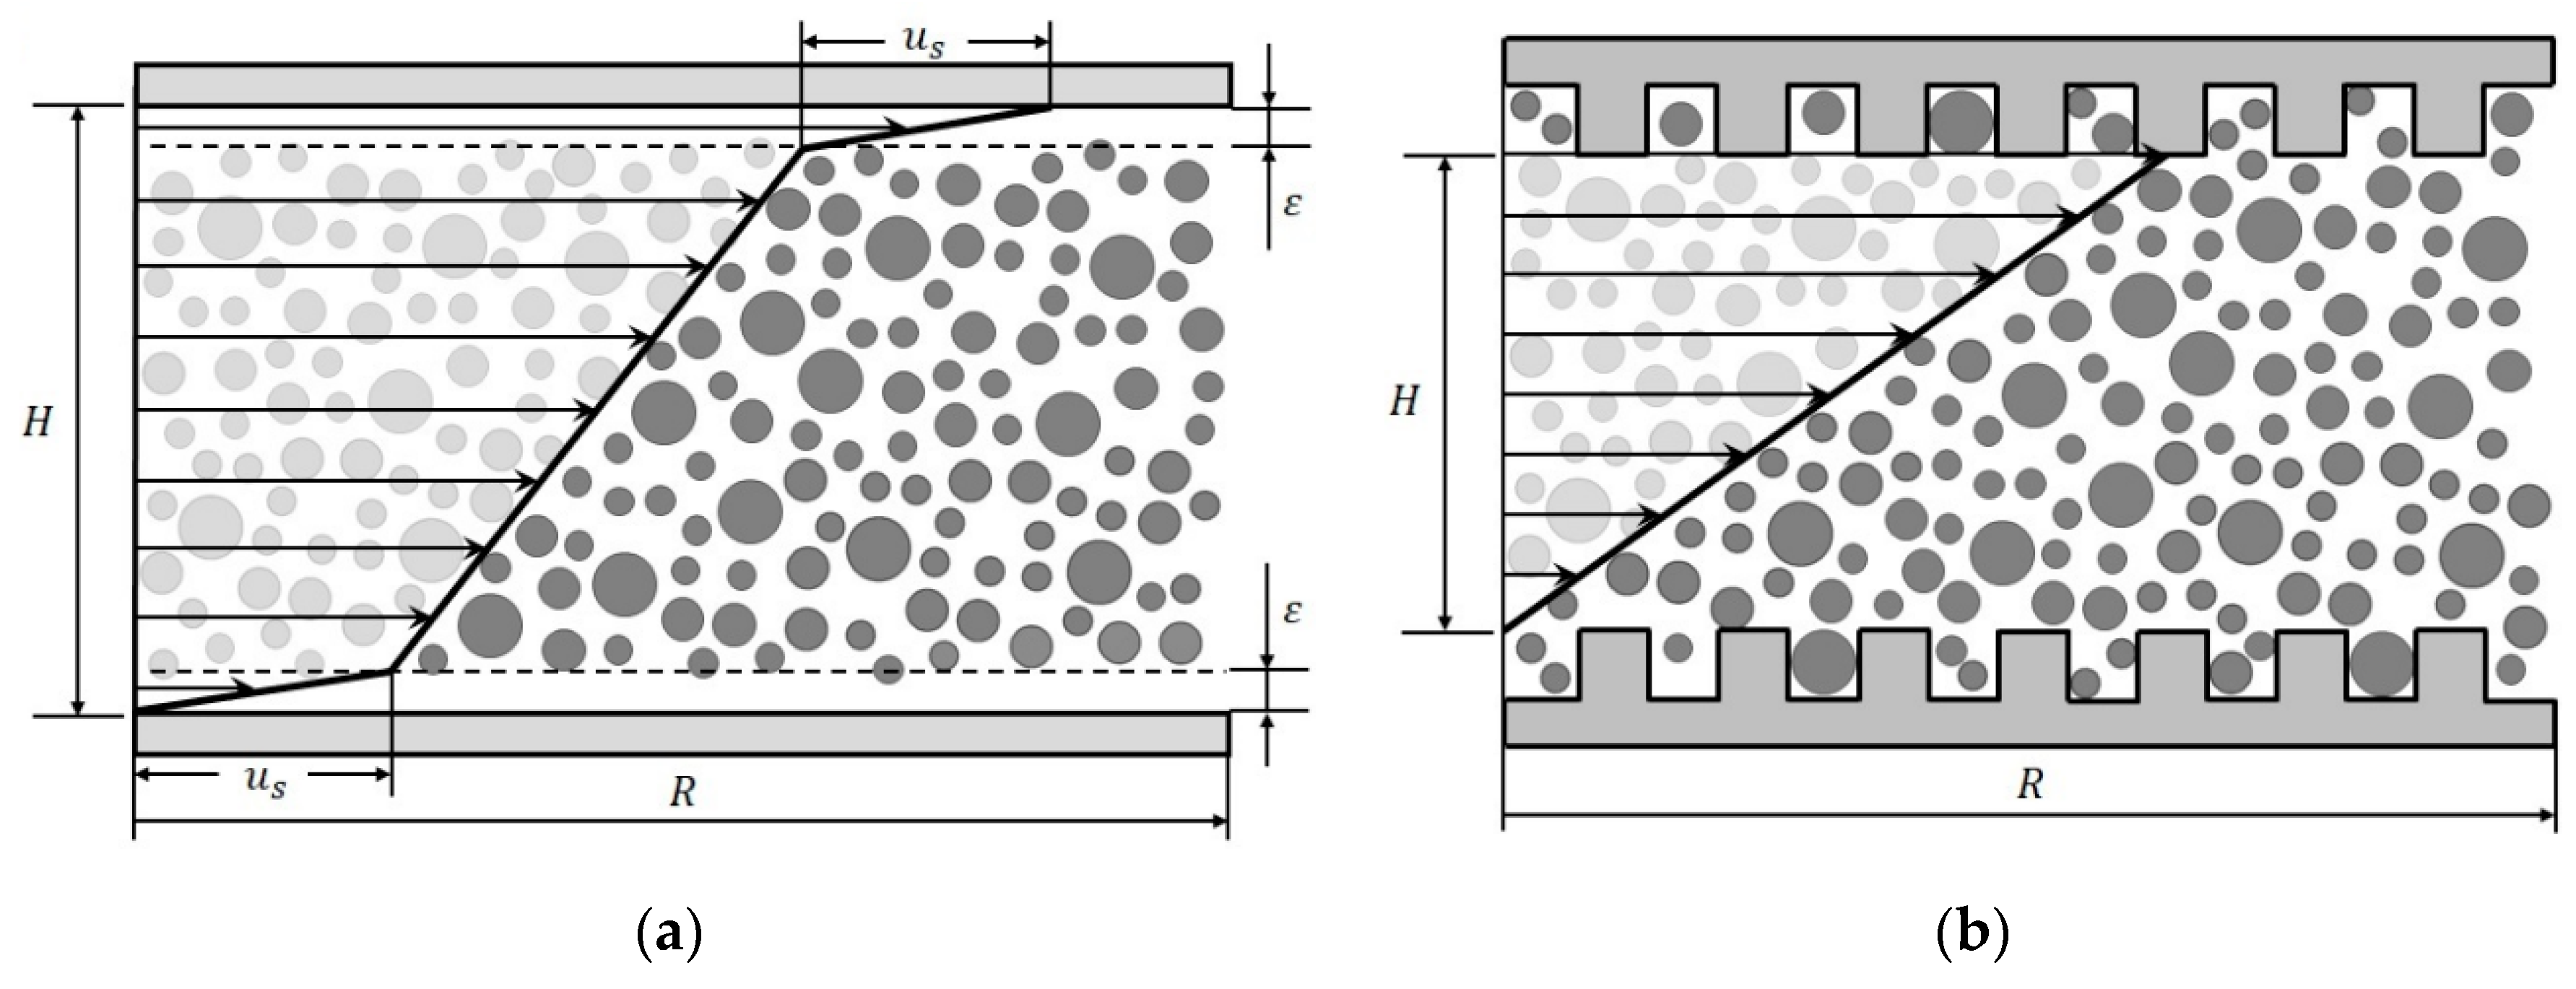
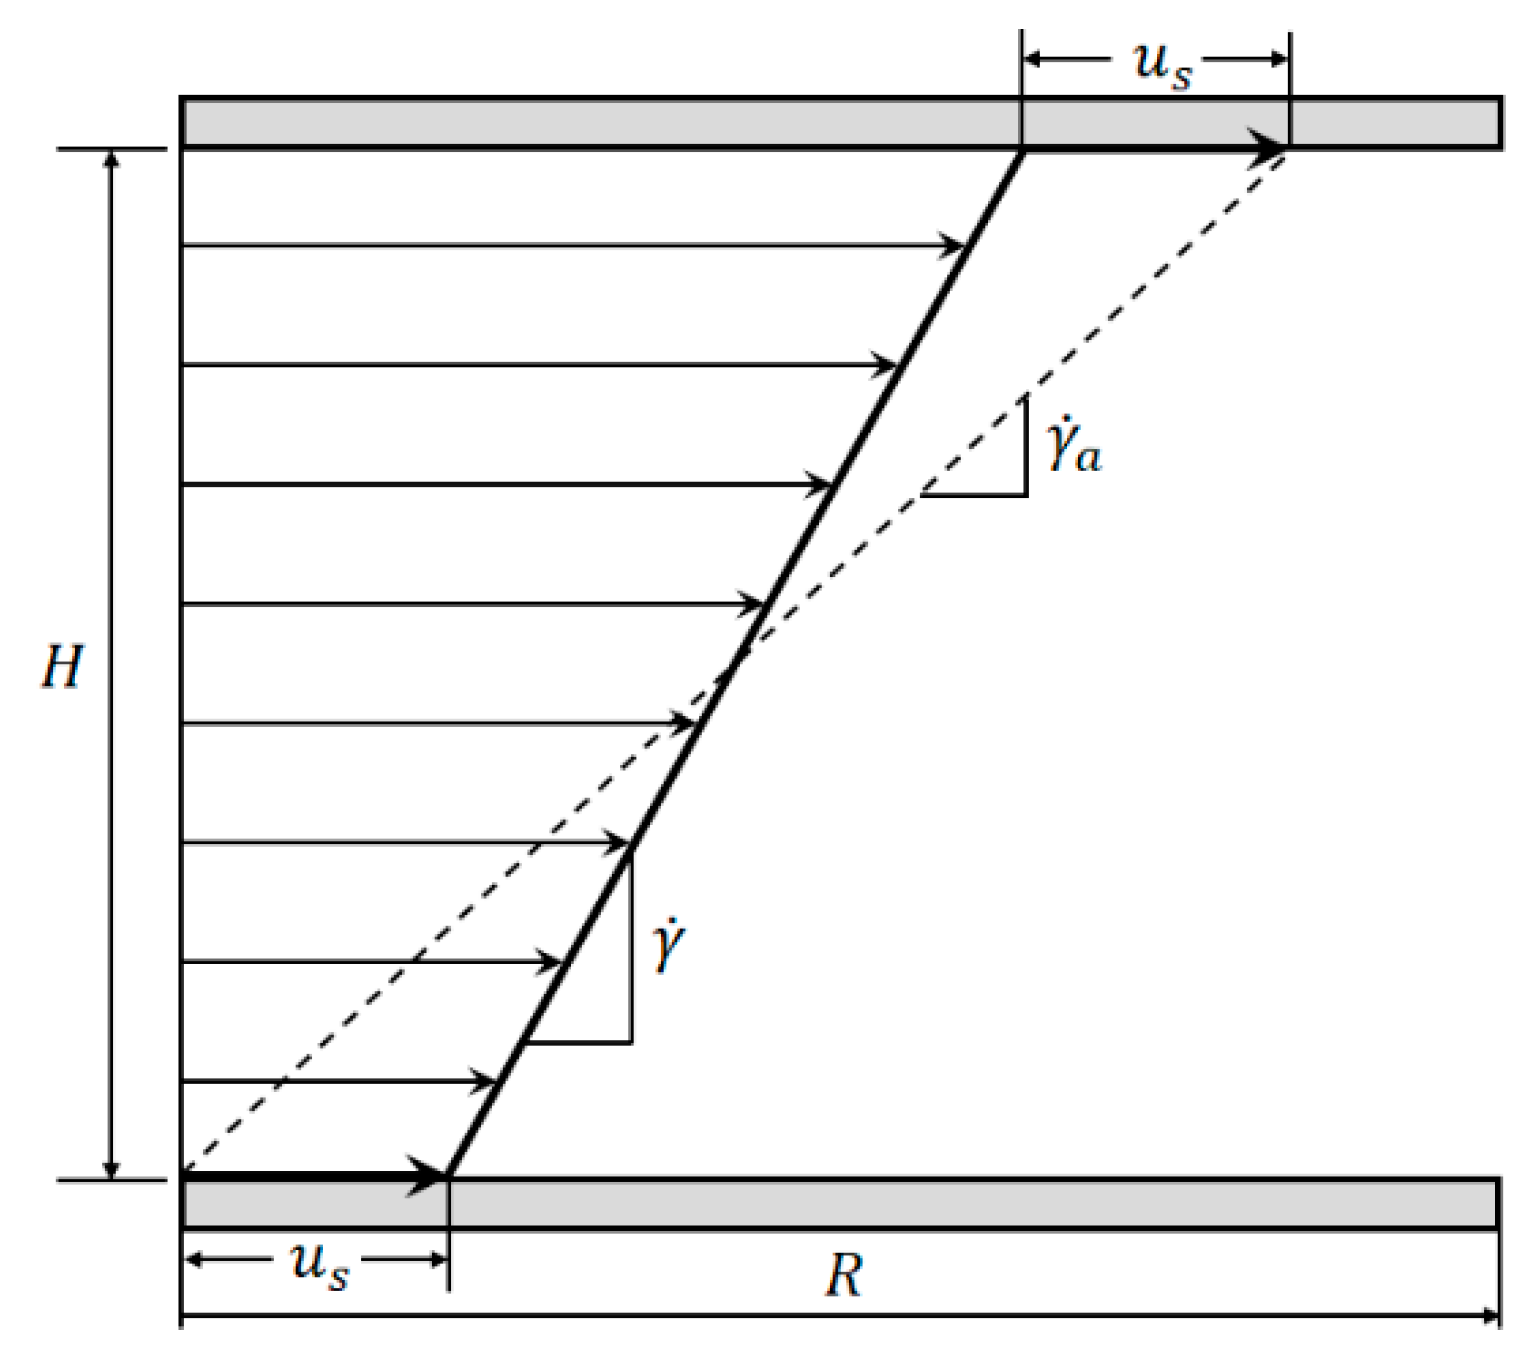
2. Theory
Wall Slip Correction
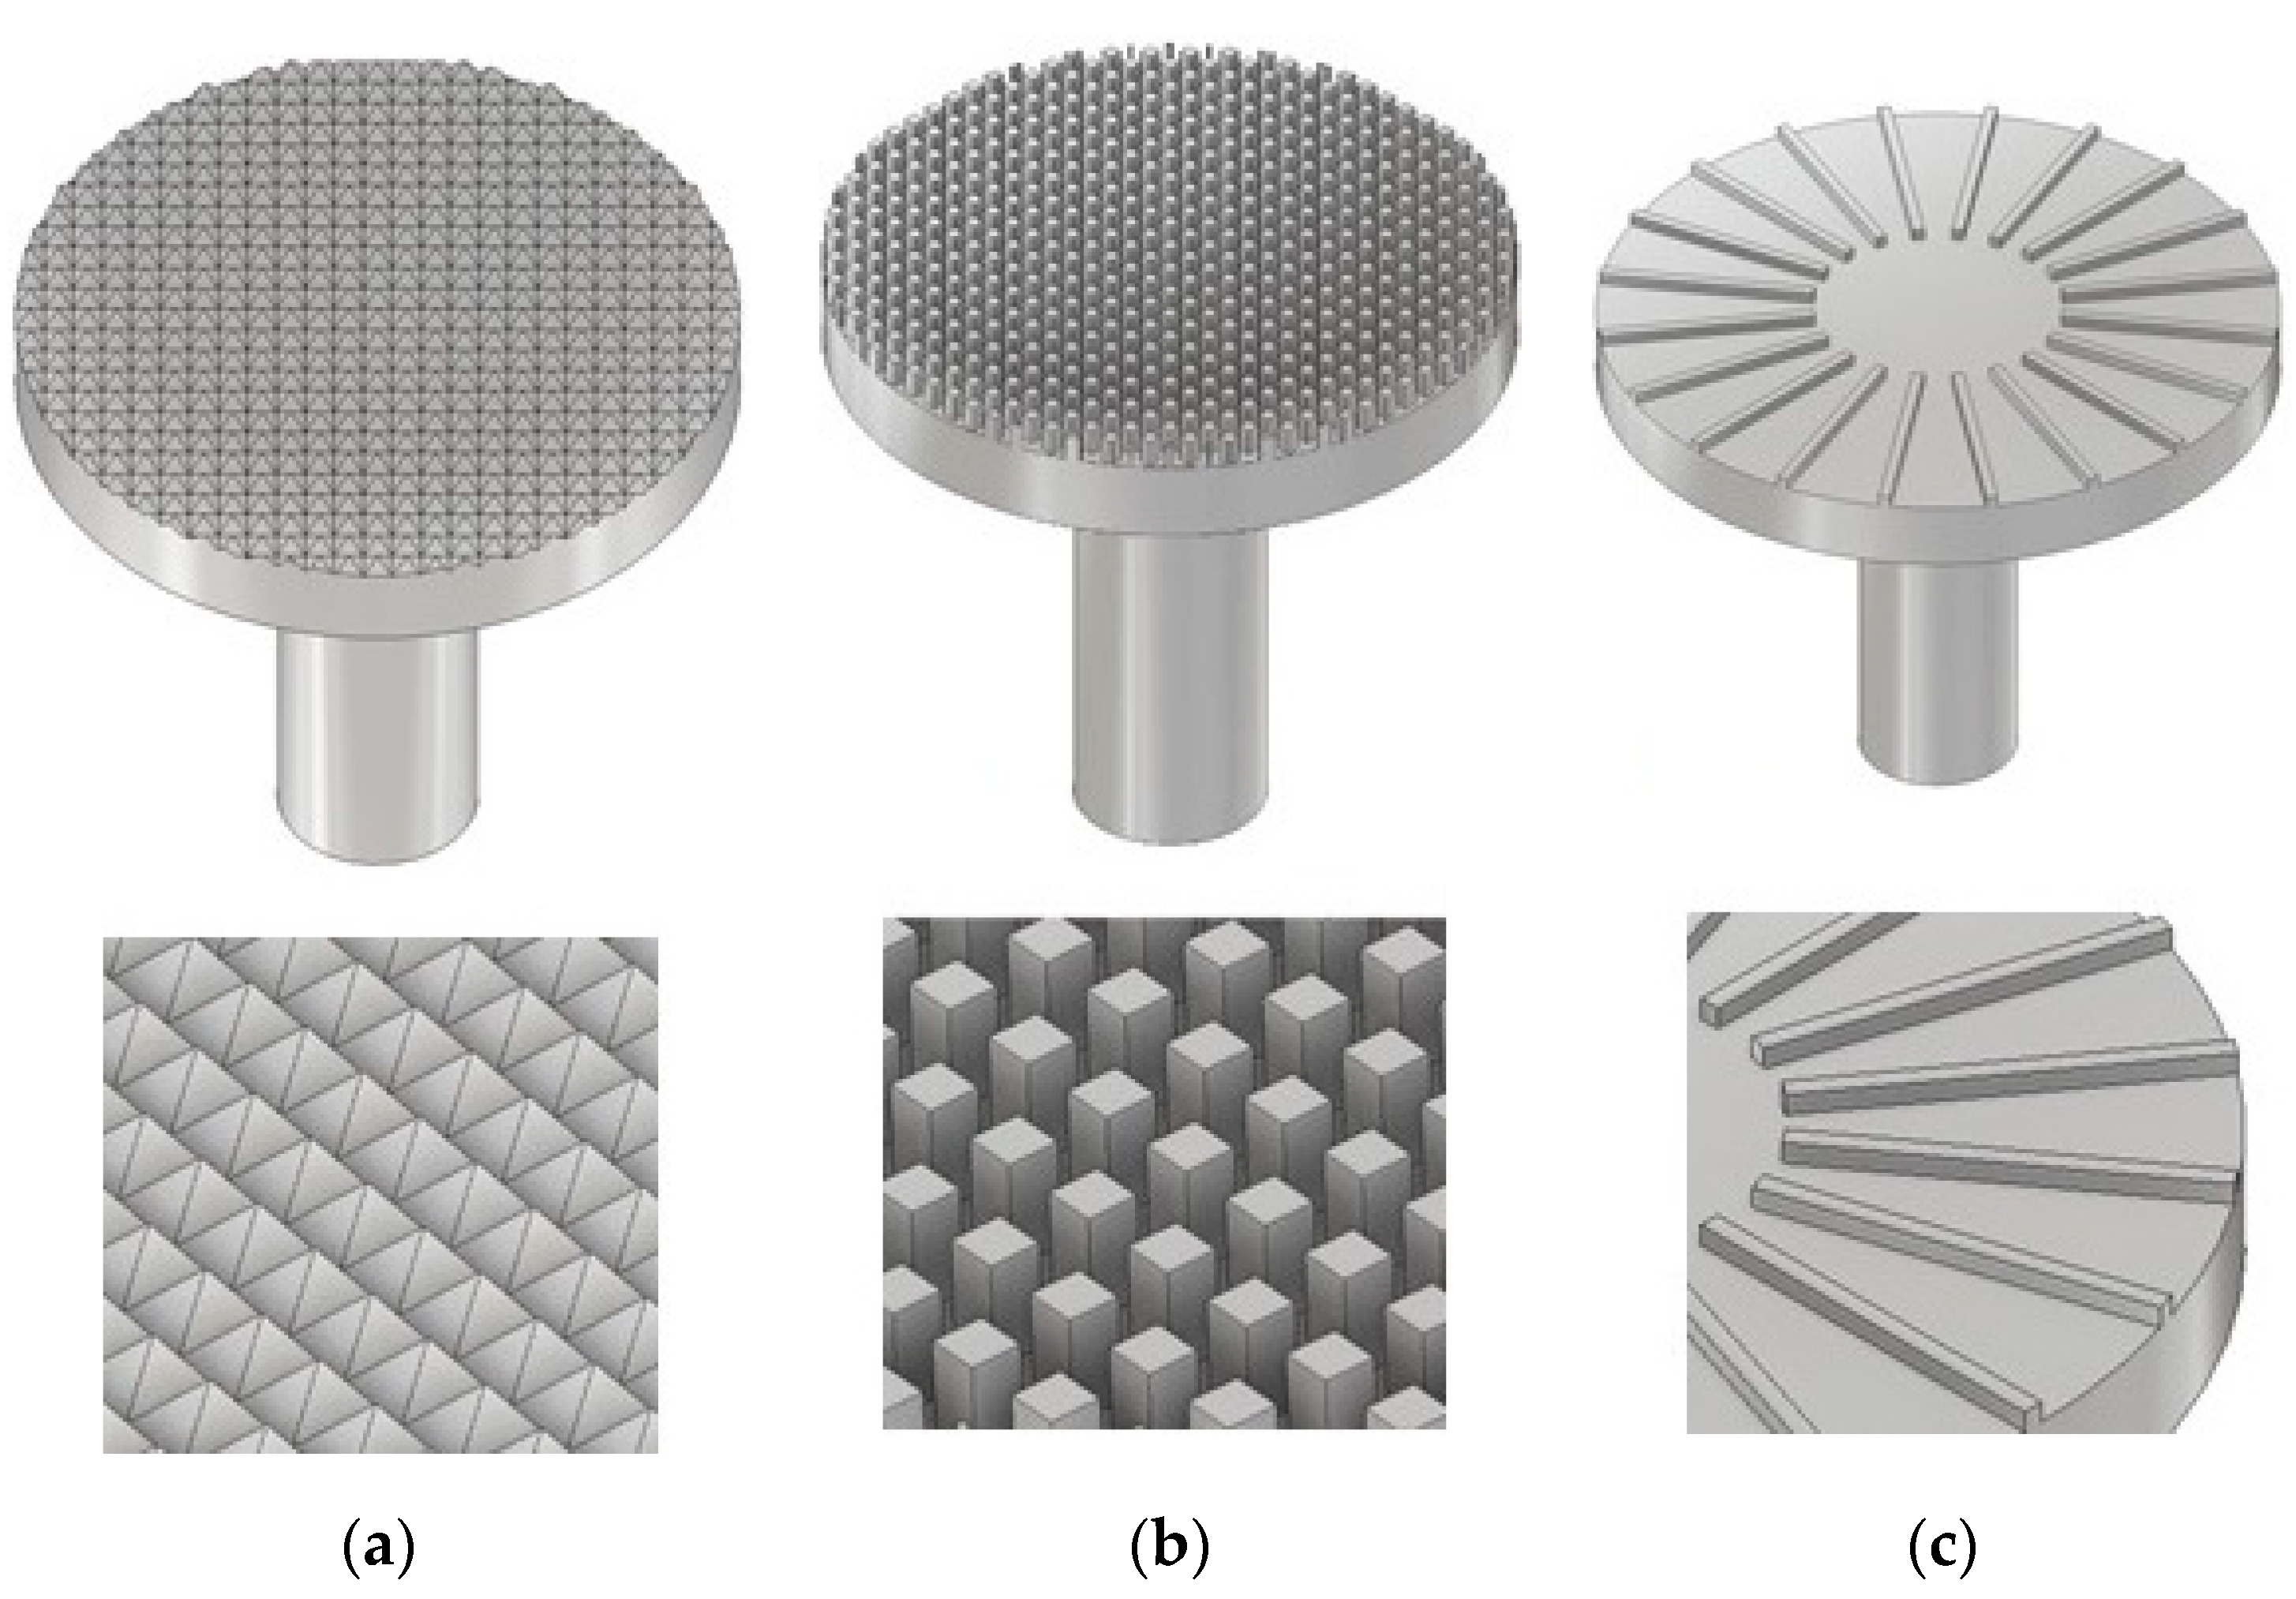
3. Geometries
4. Methods
4.1. Zero Gap Determination
4.2. Measurement Preparation
4.3. Measurement Profile
5. Results and Discussion
5.1. Newtonian Fluids
5.1.1. Influence of Measuring Gap and Material
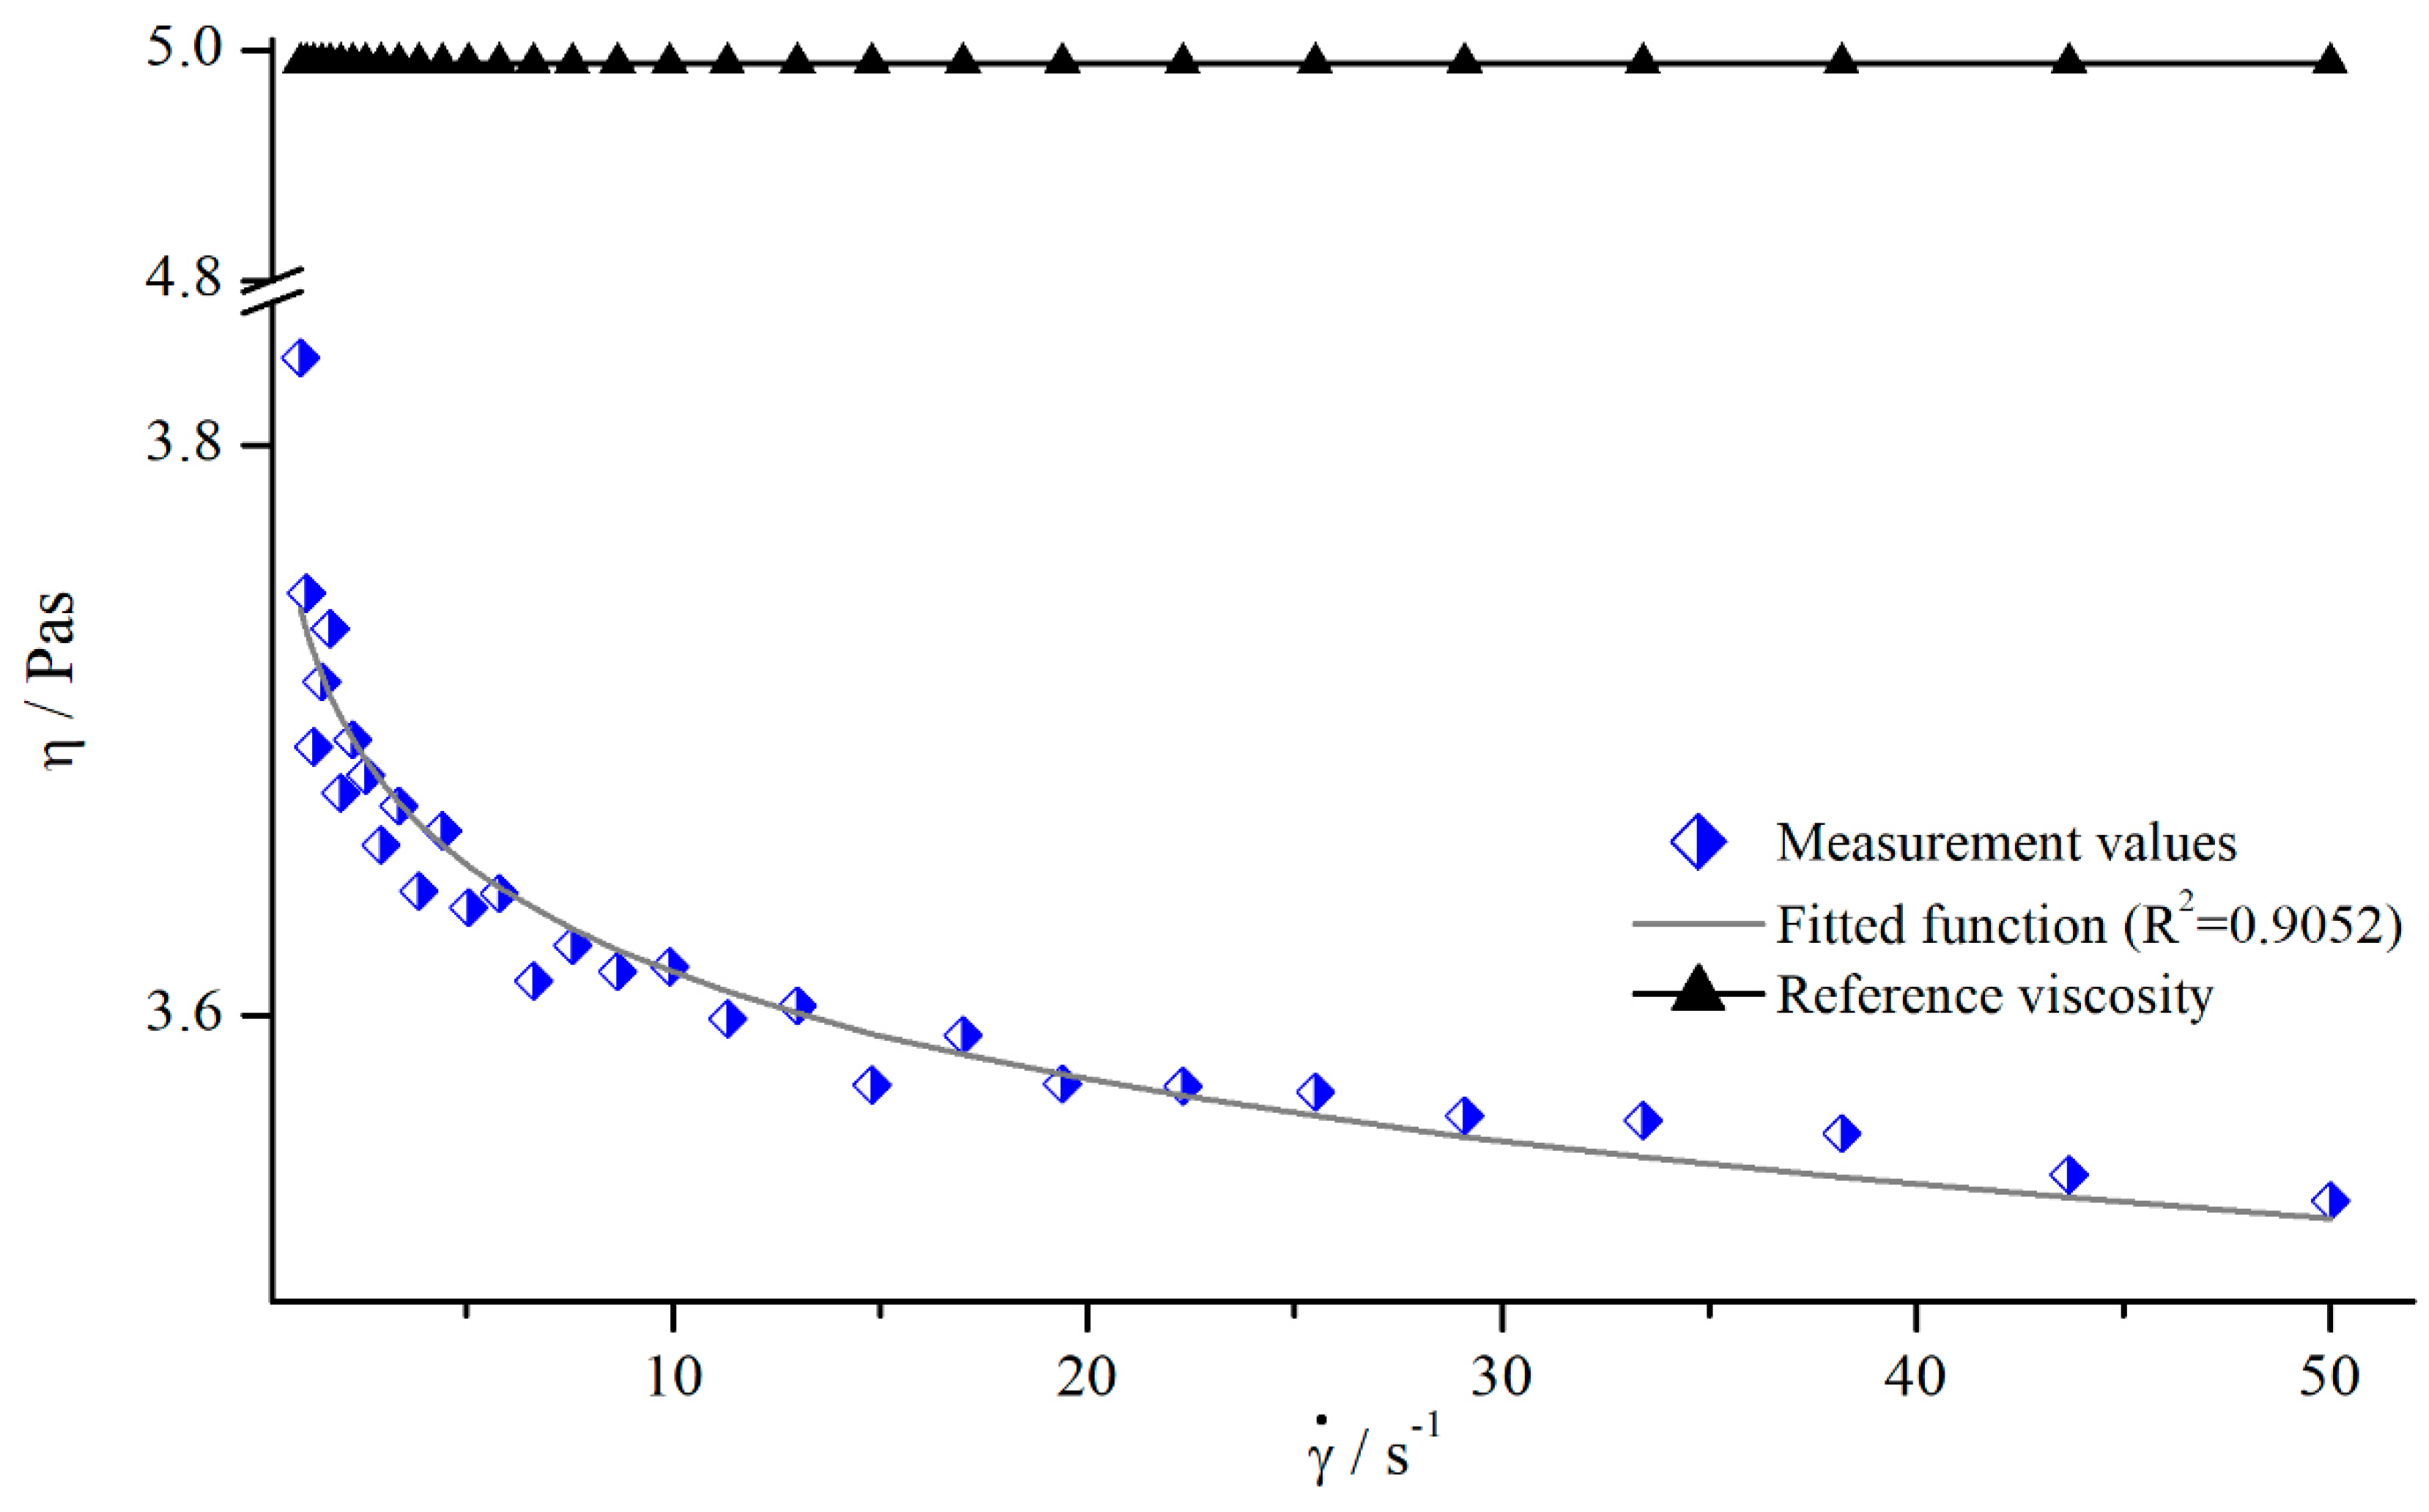
5.1.2. Influence of Shear Rate
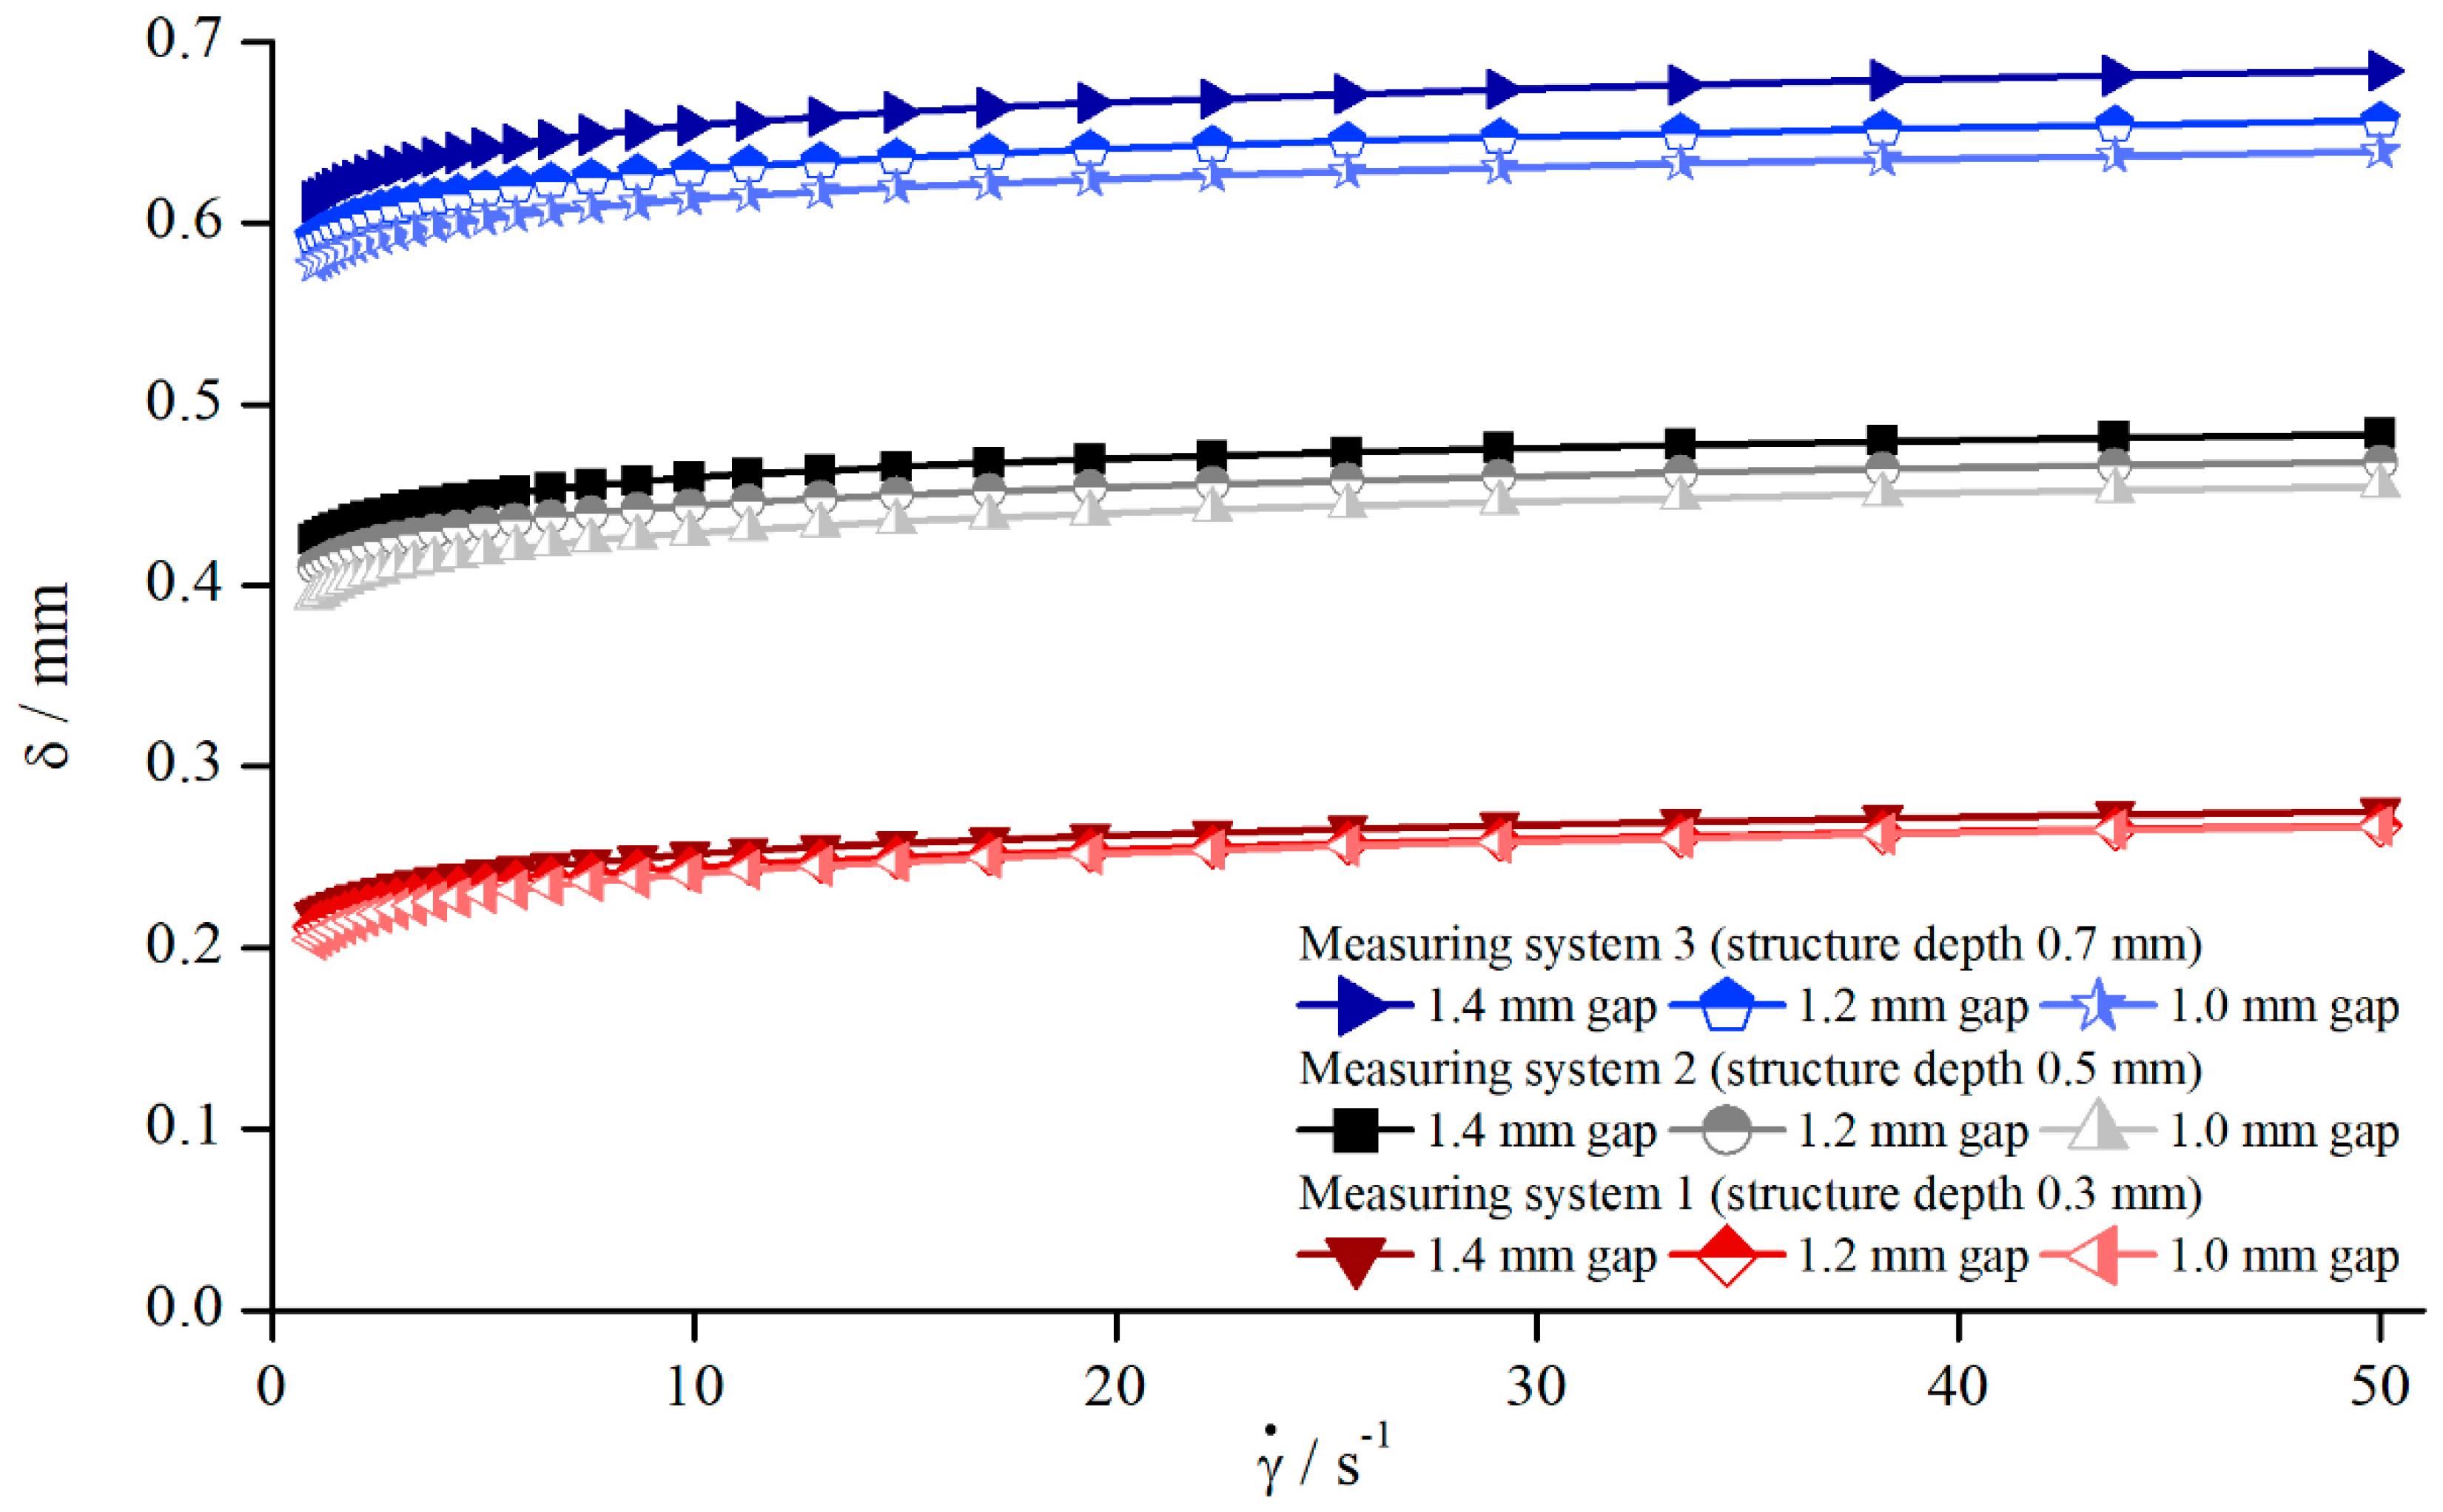
5.1.3. Determination of Gap Extension
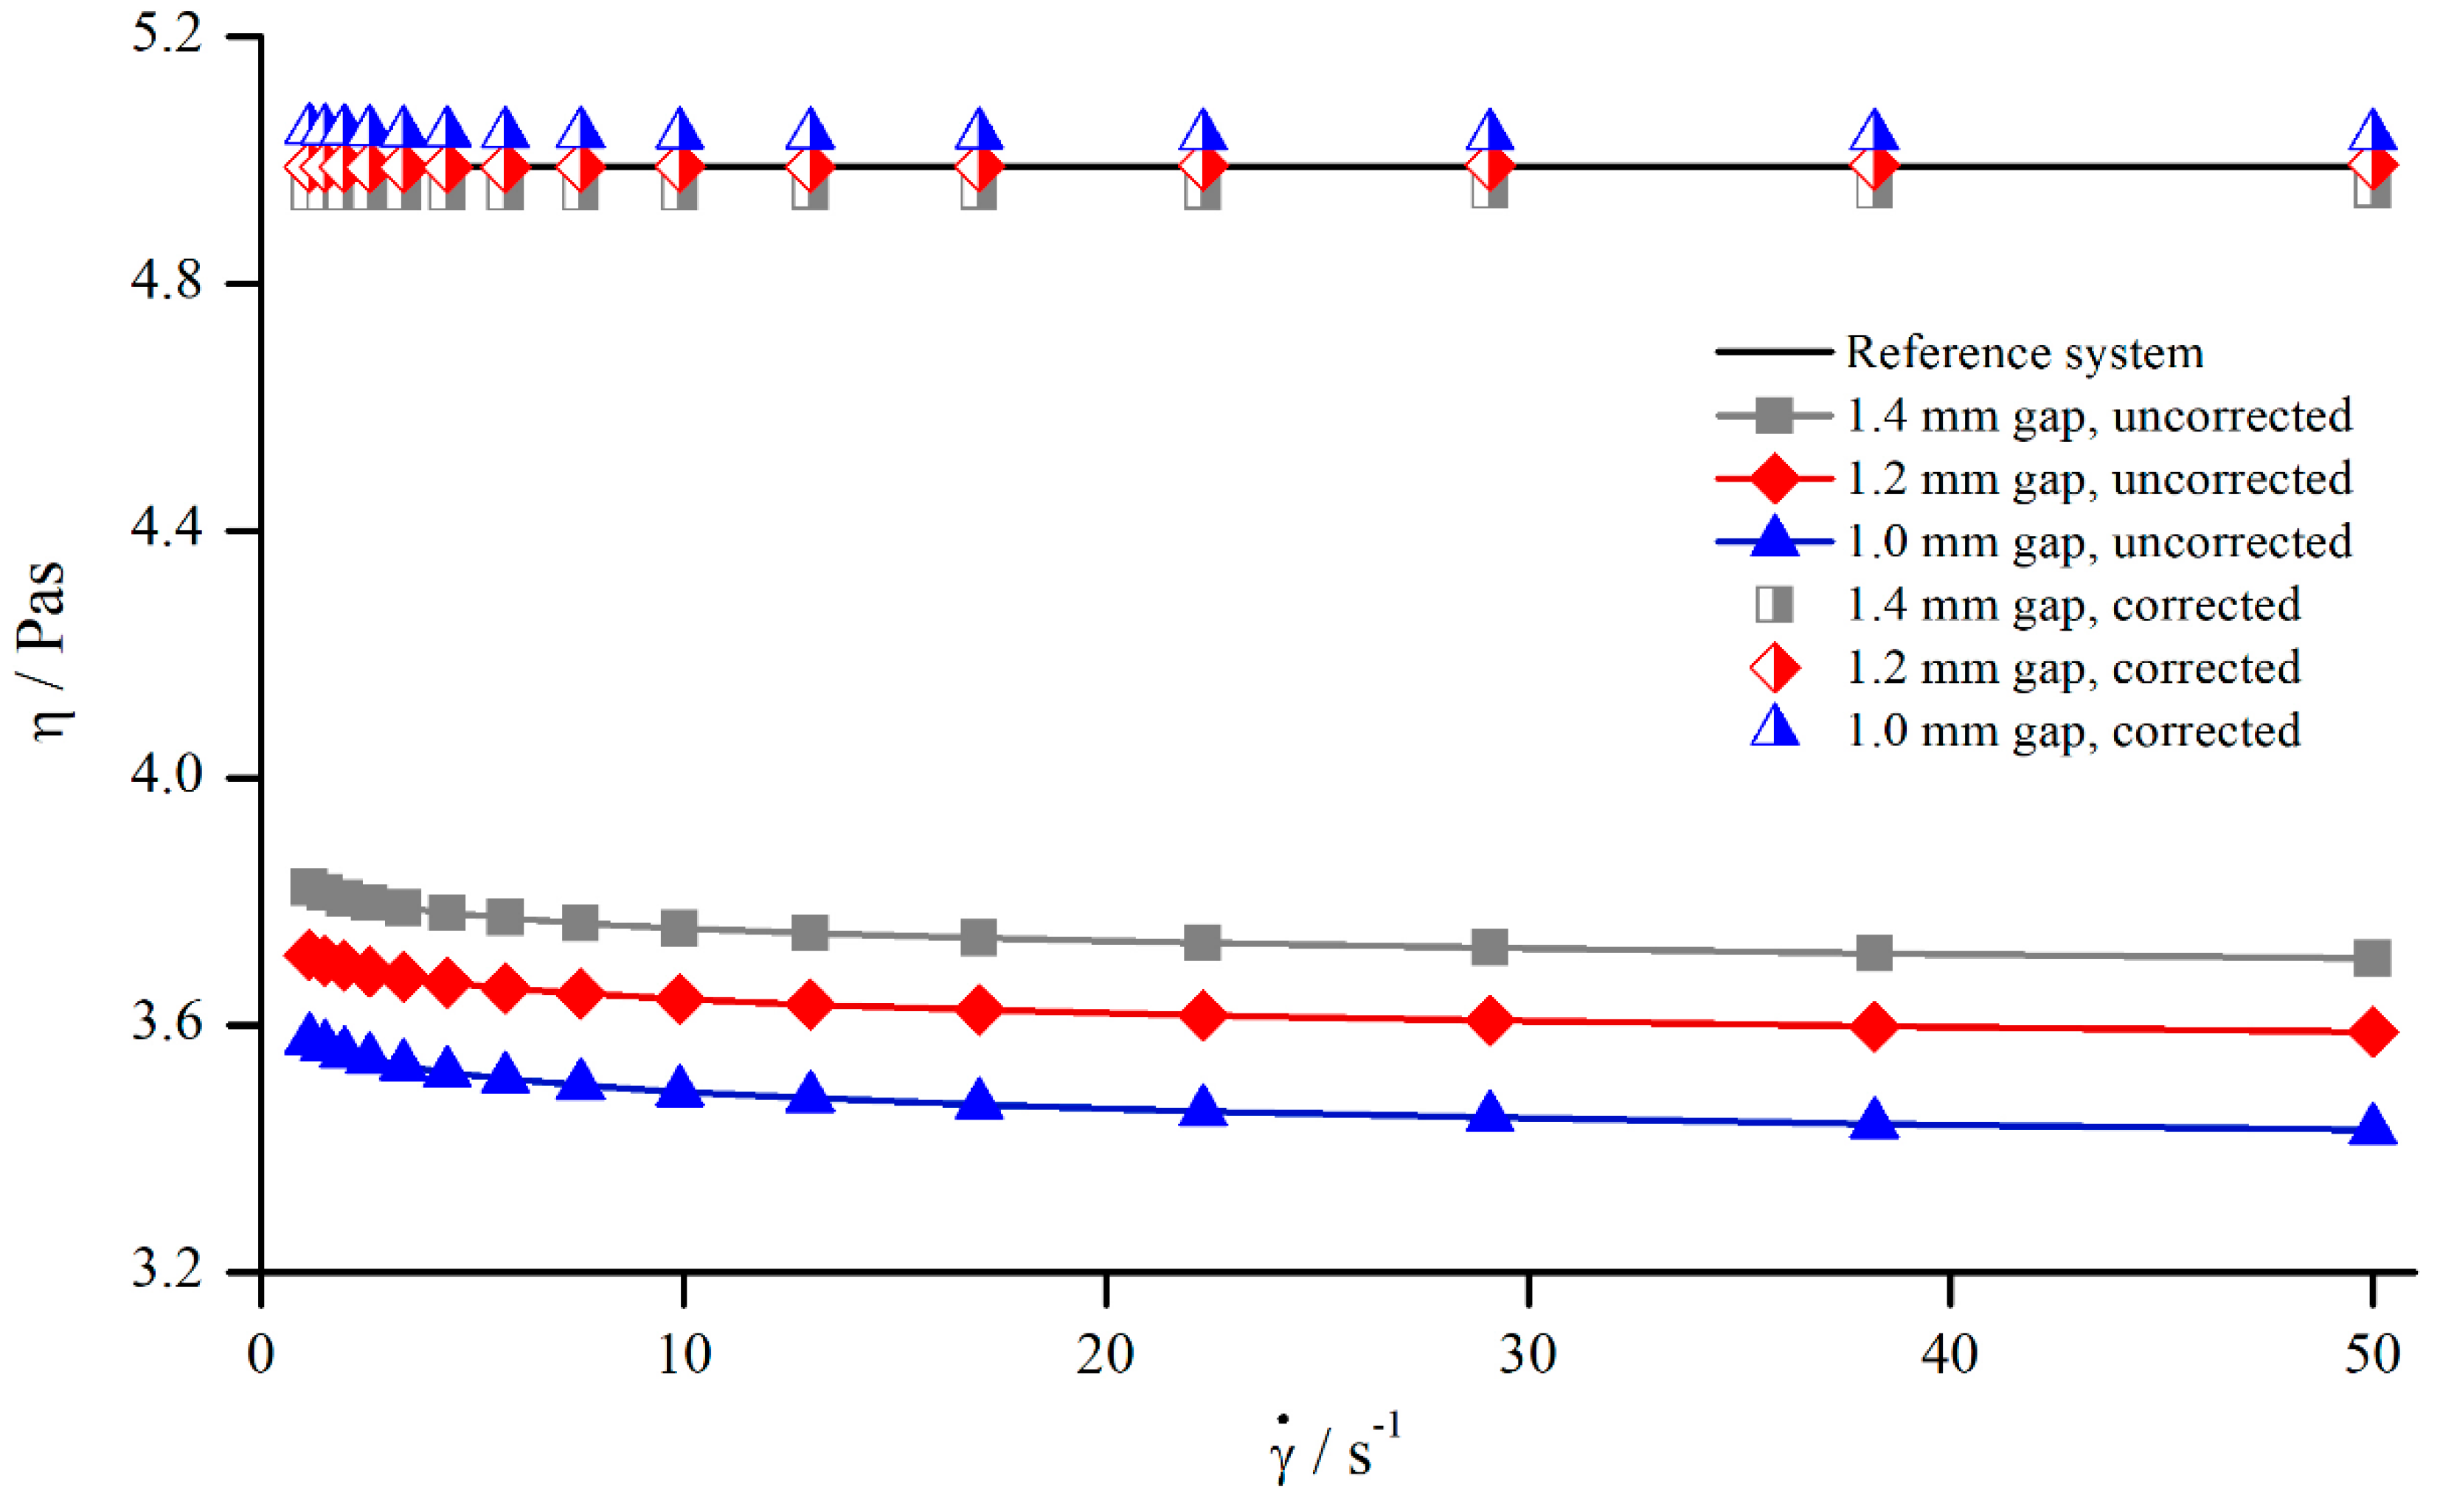
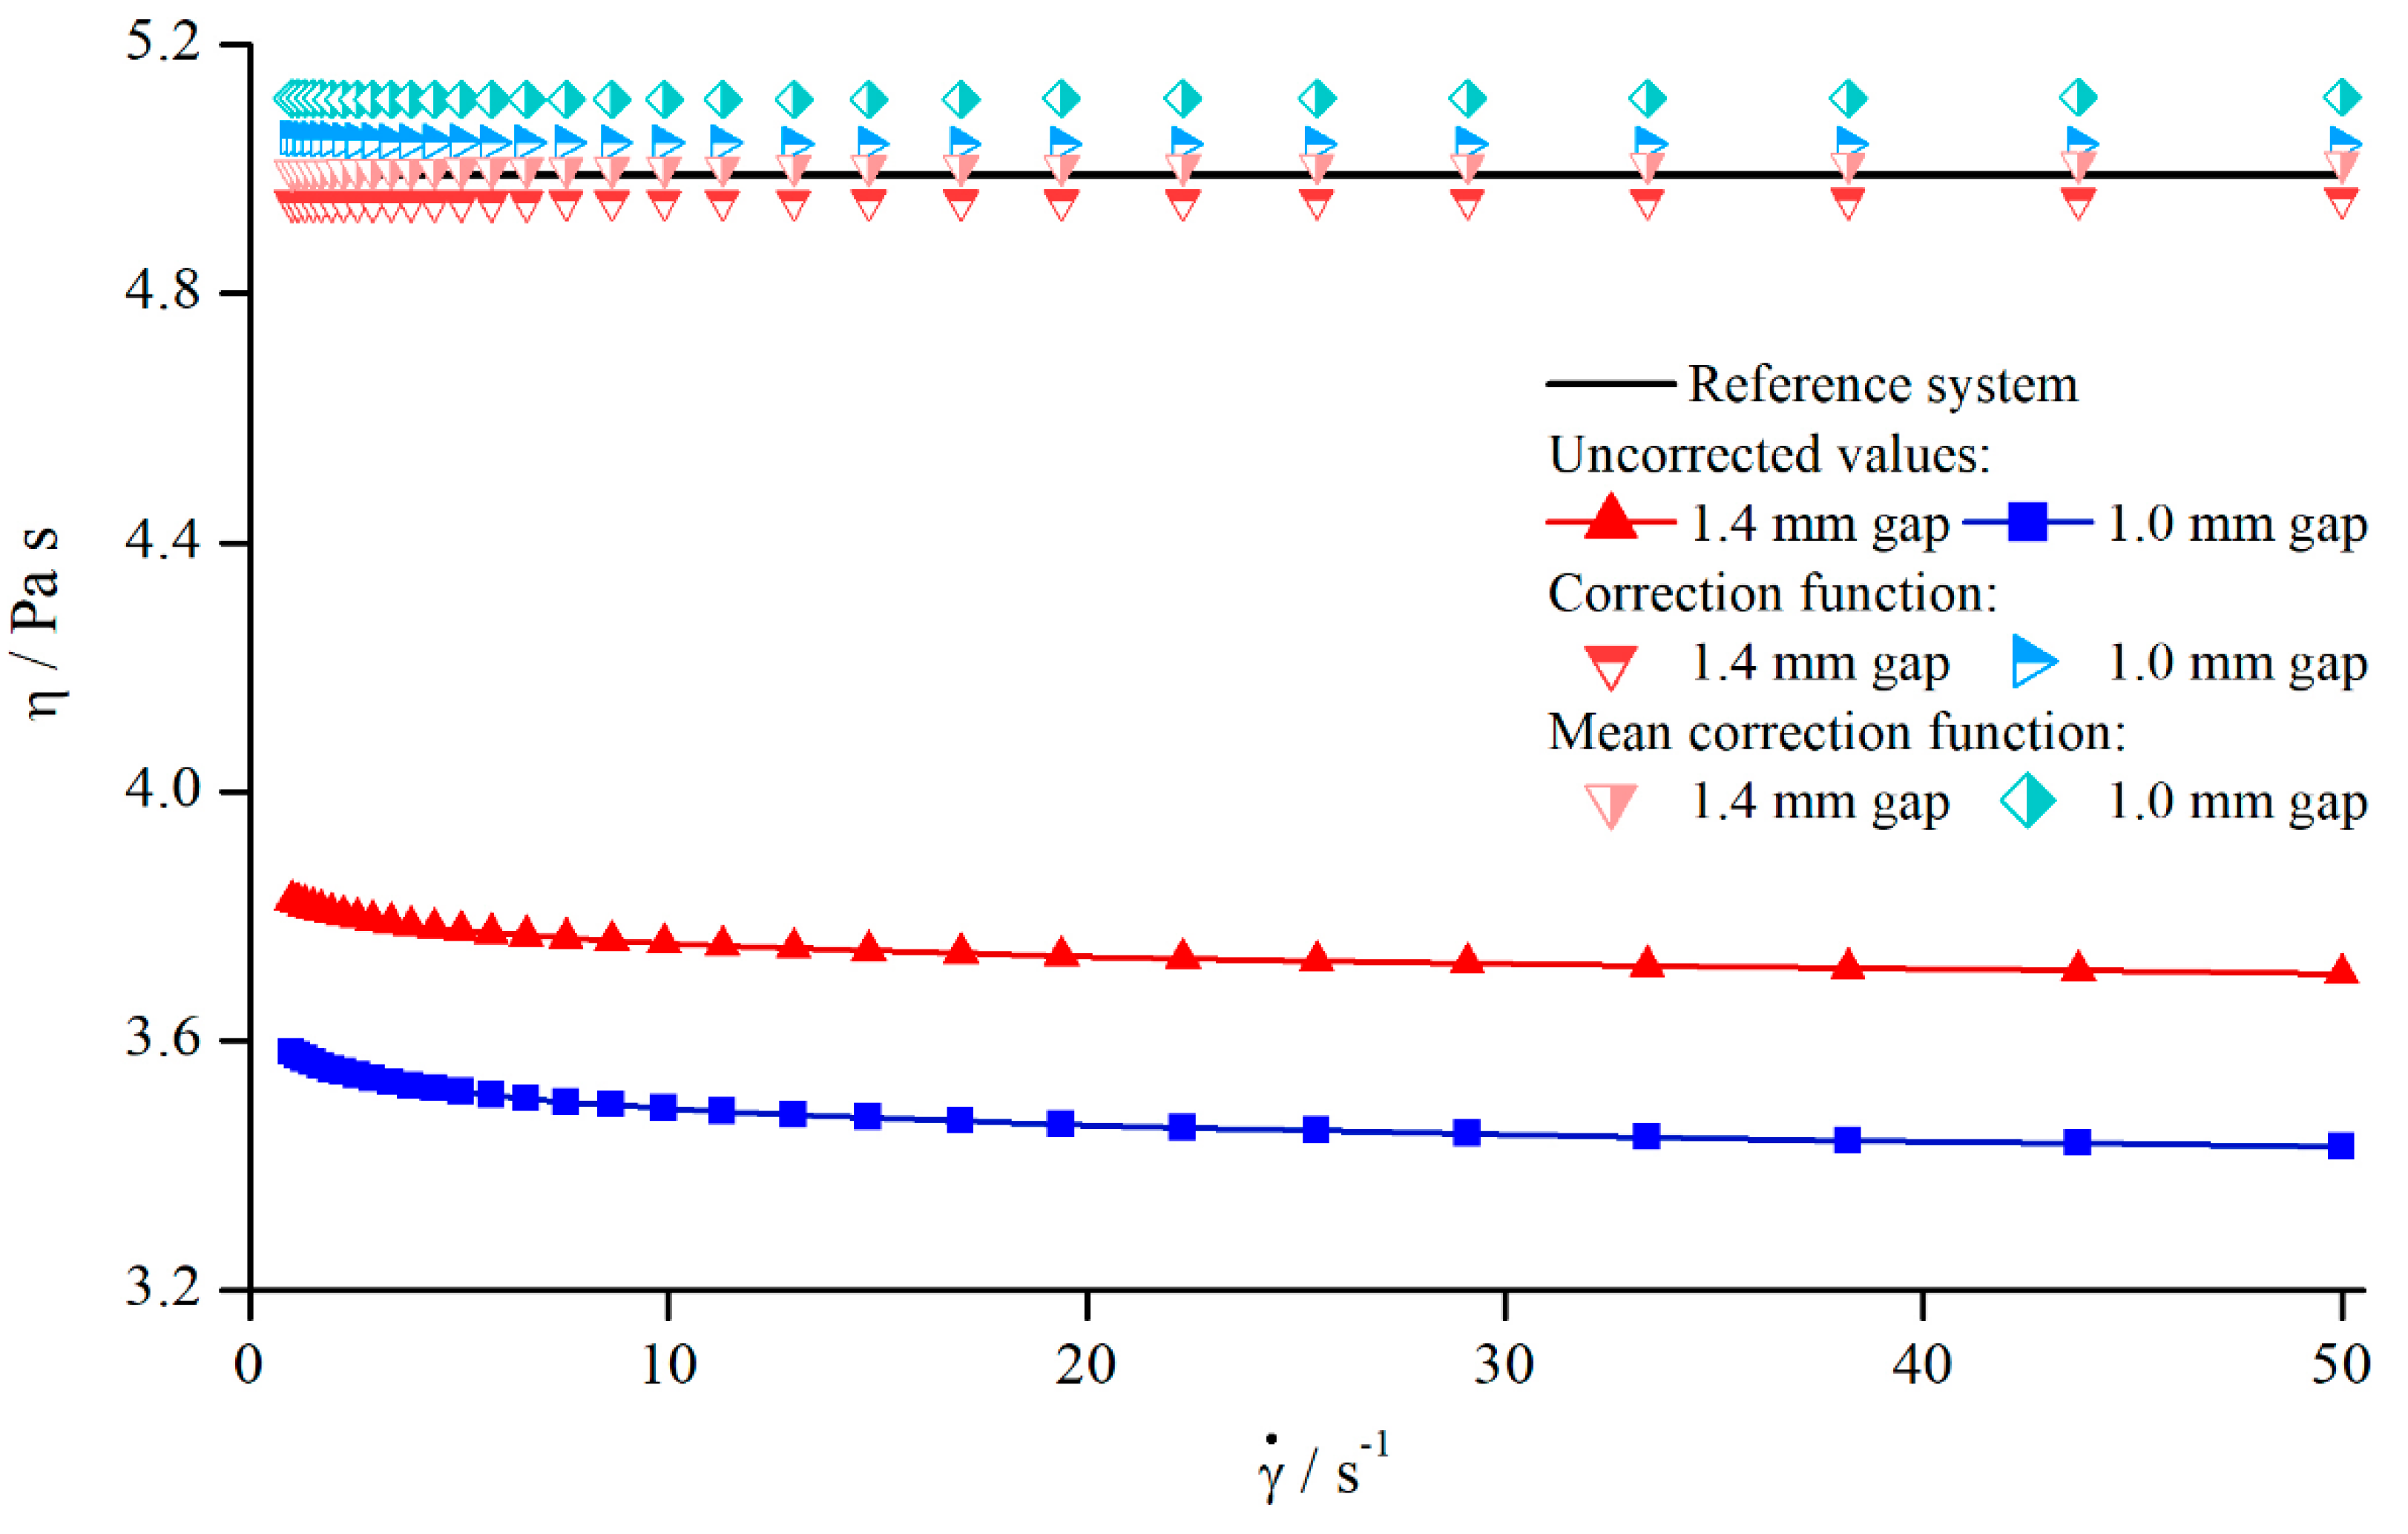
5.1.4. Correction of Viscosity
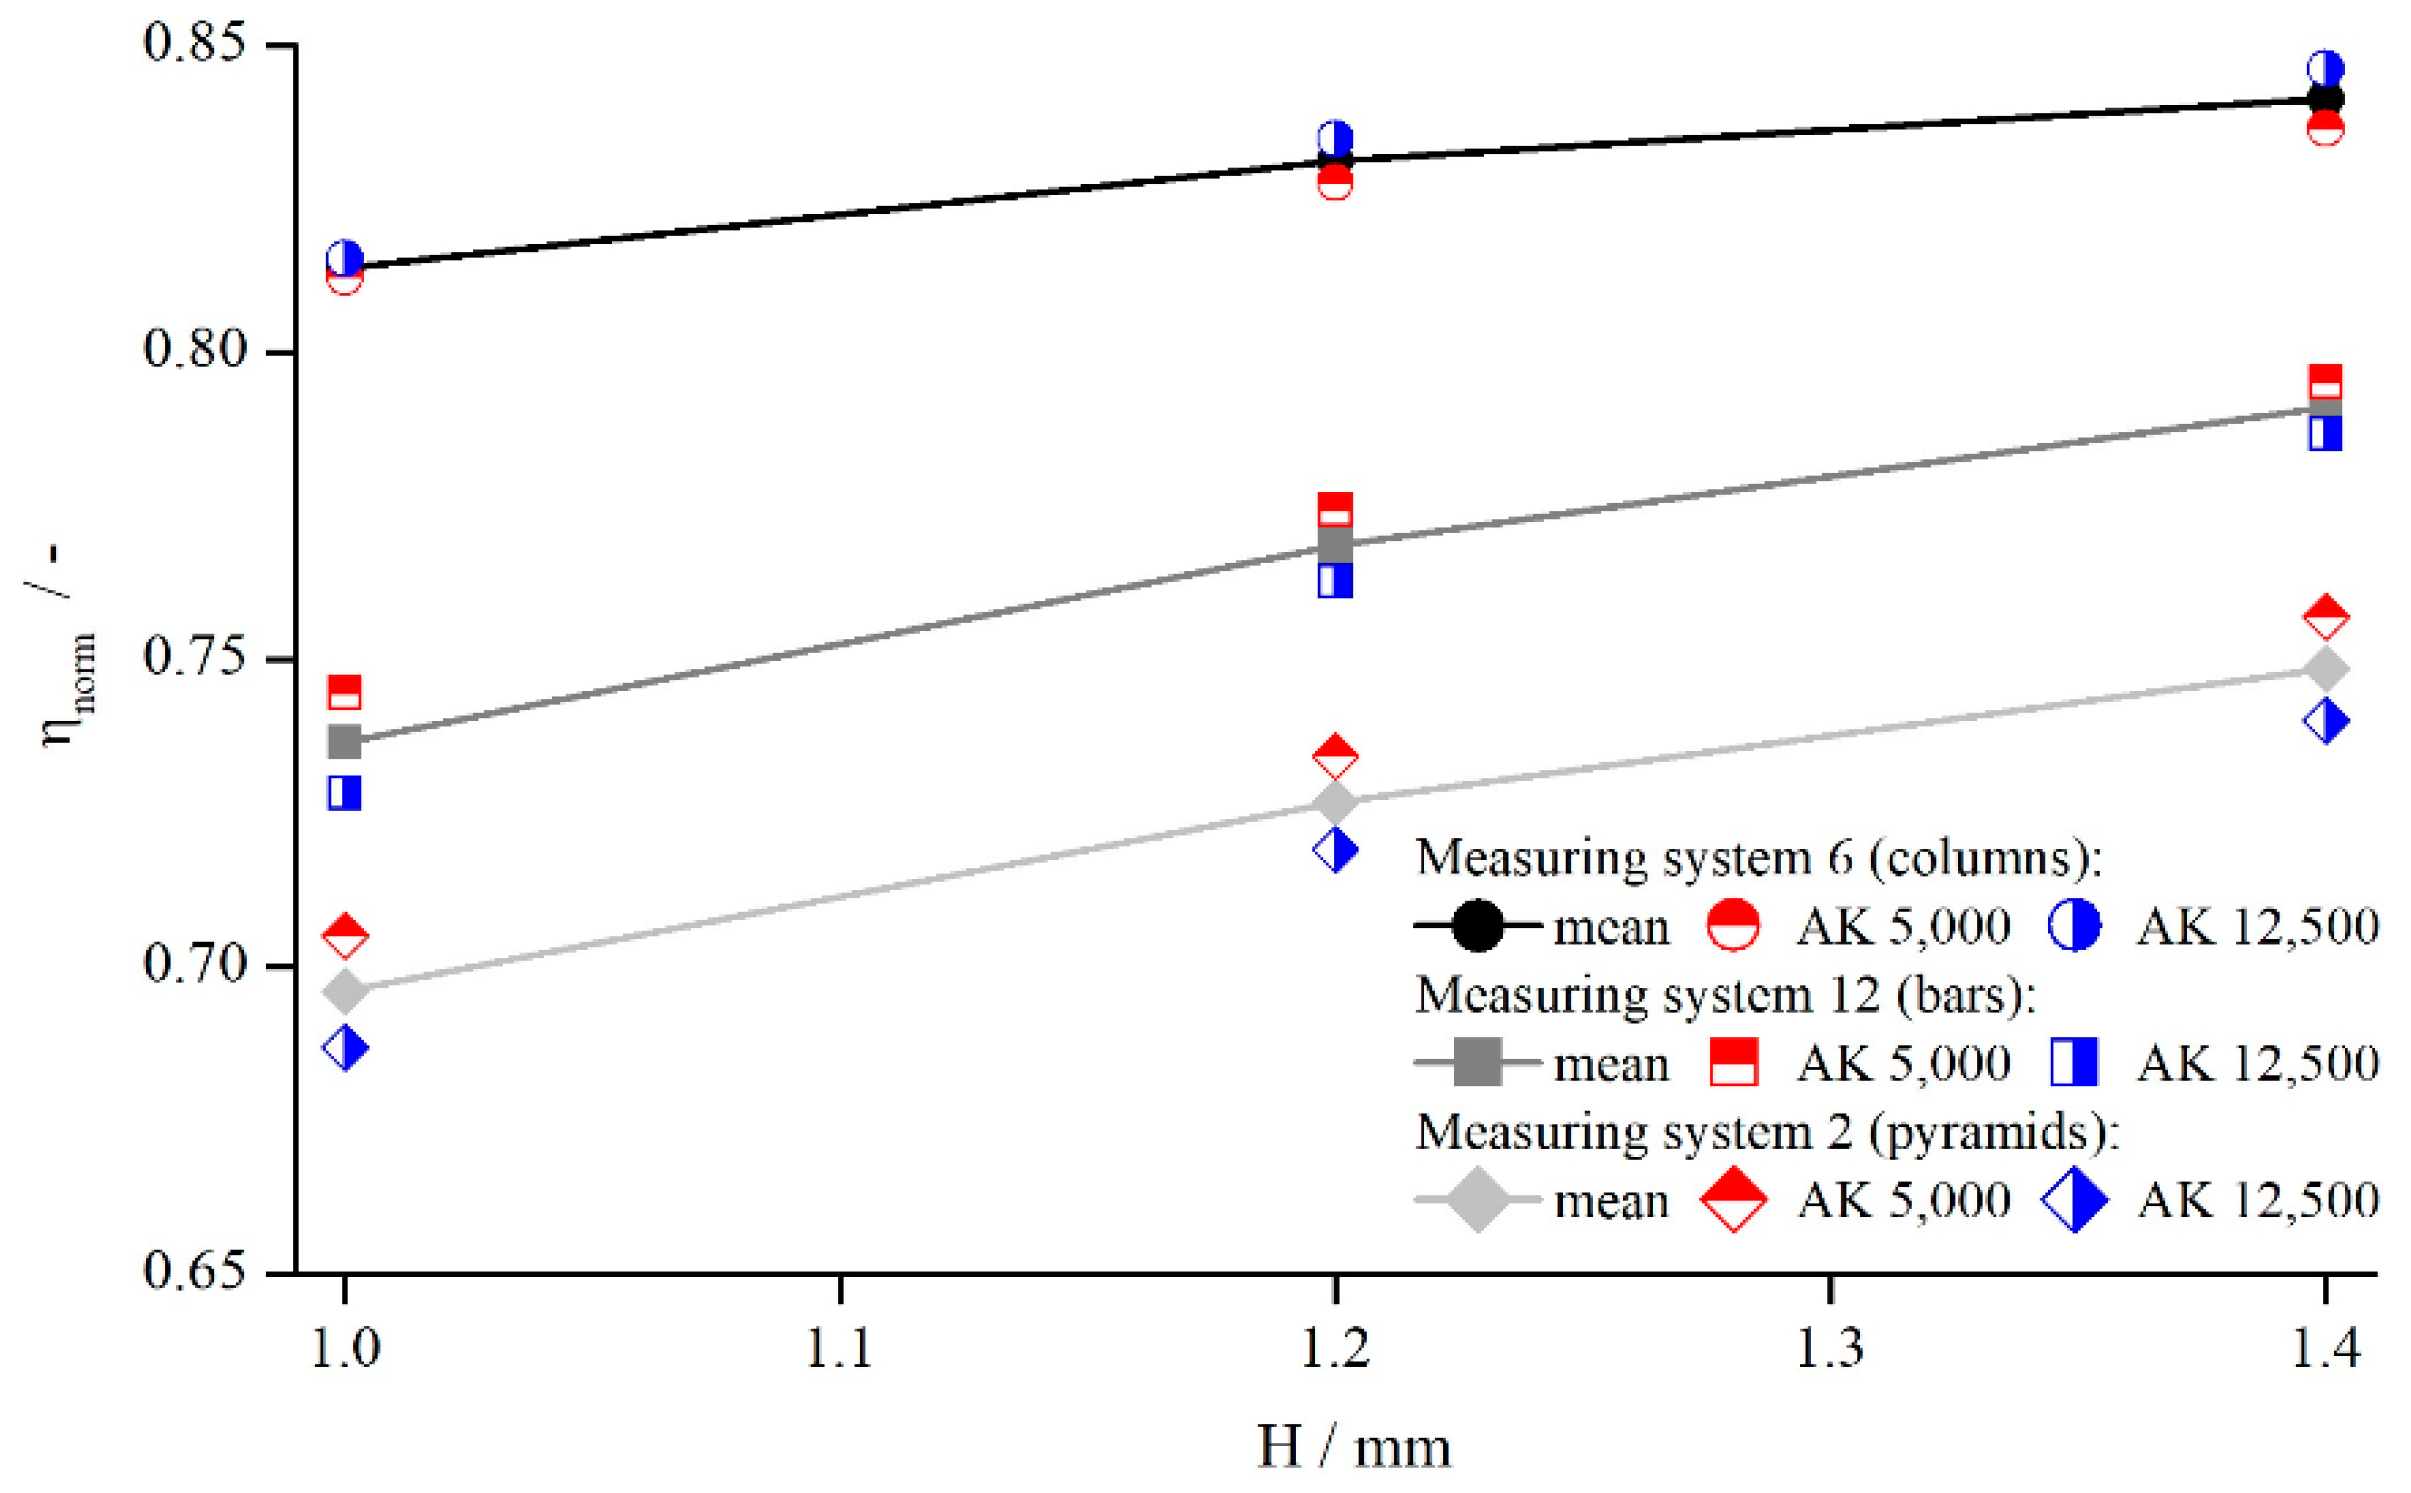
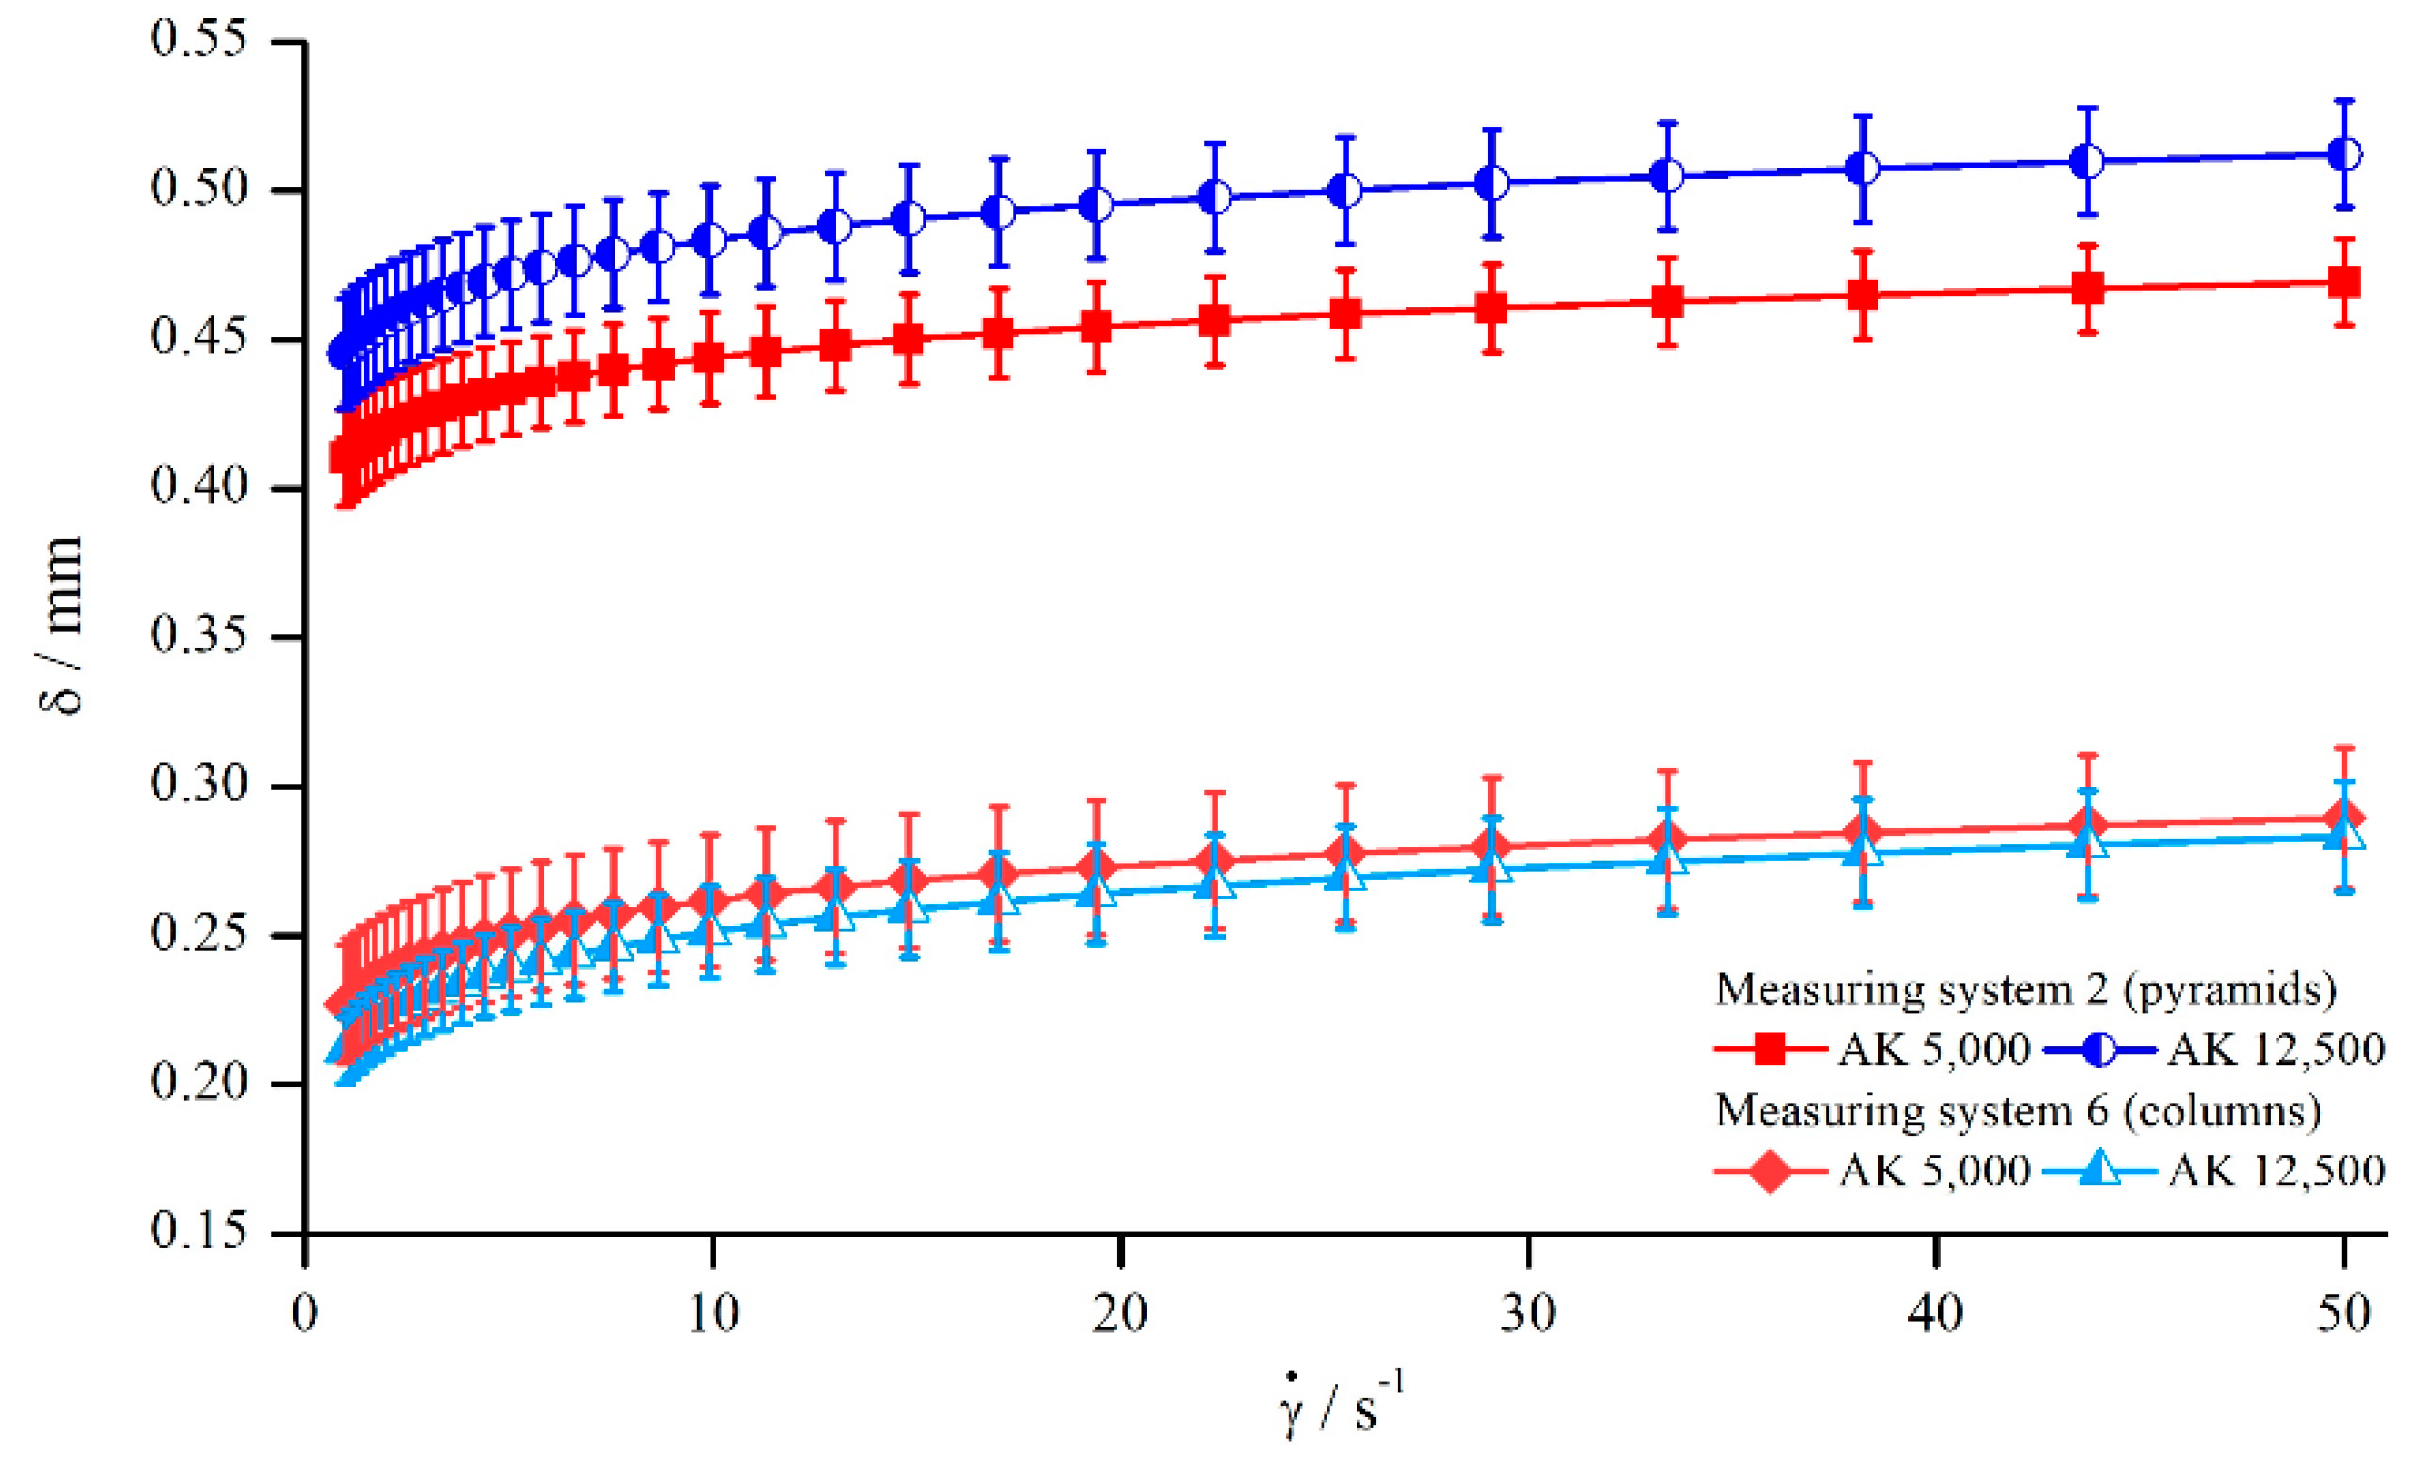
5.1.5. Influence of Different Structural Features
5.1.6. Comparison to Previous Studies
- The relative influence of different modified geometries is viscosity-independent for the investigated range;
- A reduction of the measuring gap decreases the normalised viscosity due to the increasing influence of ;
- The values for increase with increasing shear rate and gap, resulting from increasing angular velocity;
- Since the dependency of from the measuring gap and from the material is small, the development of a gap- and material-independent correction function is reasonable;
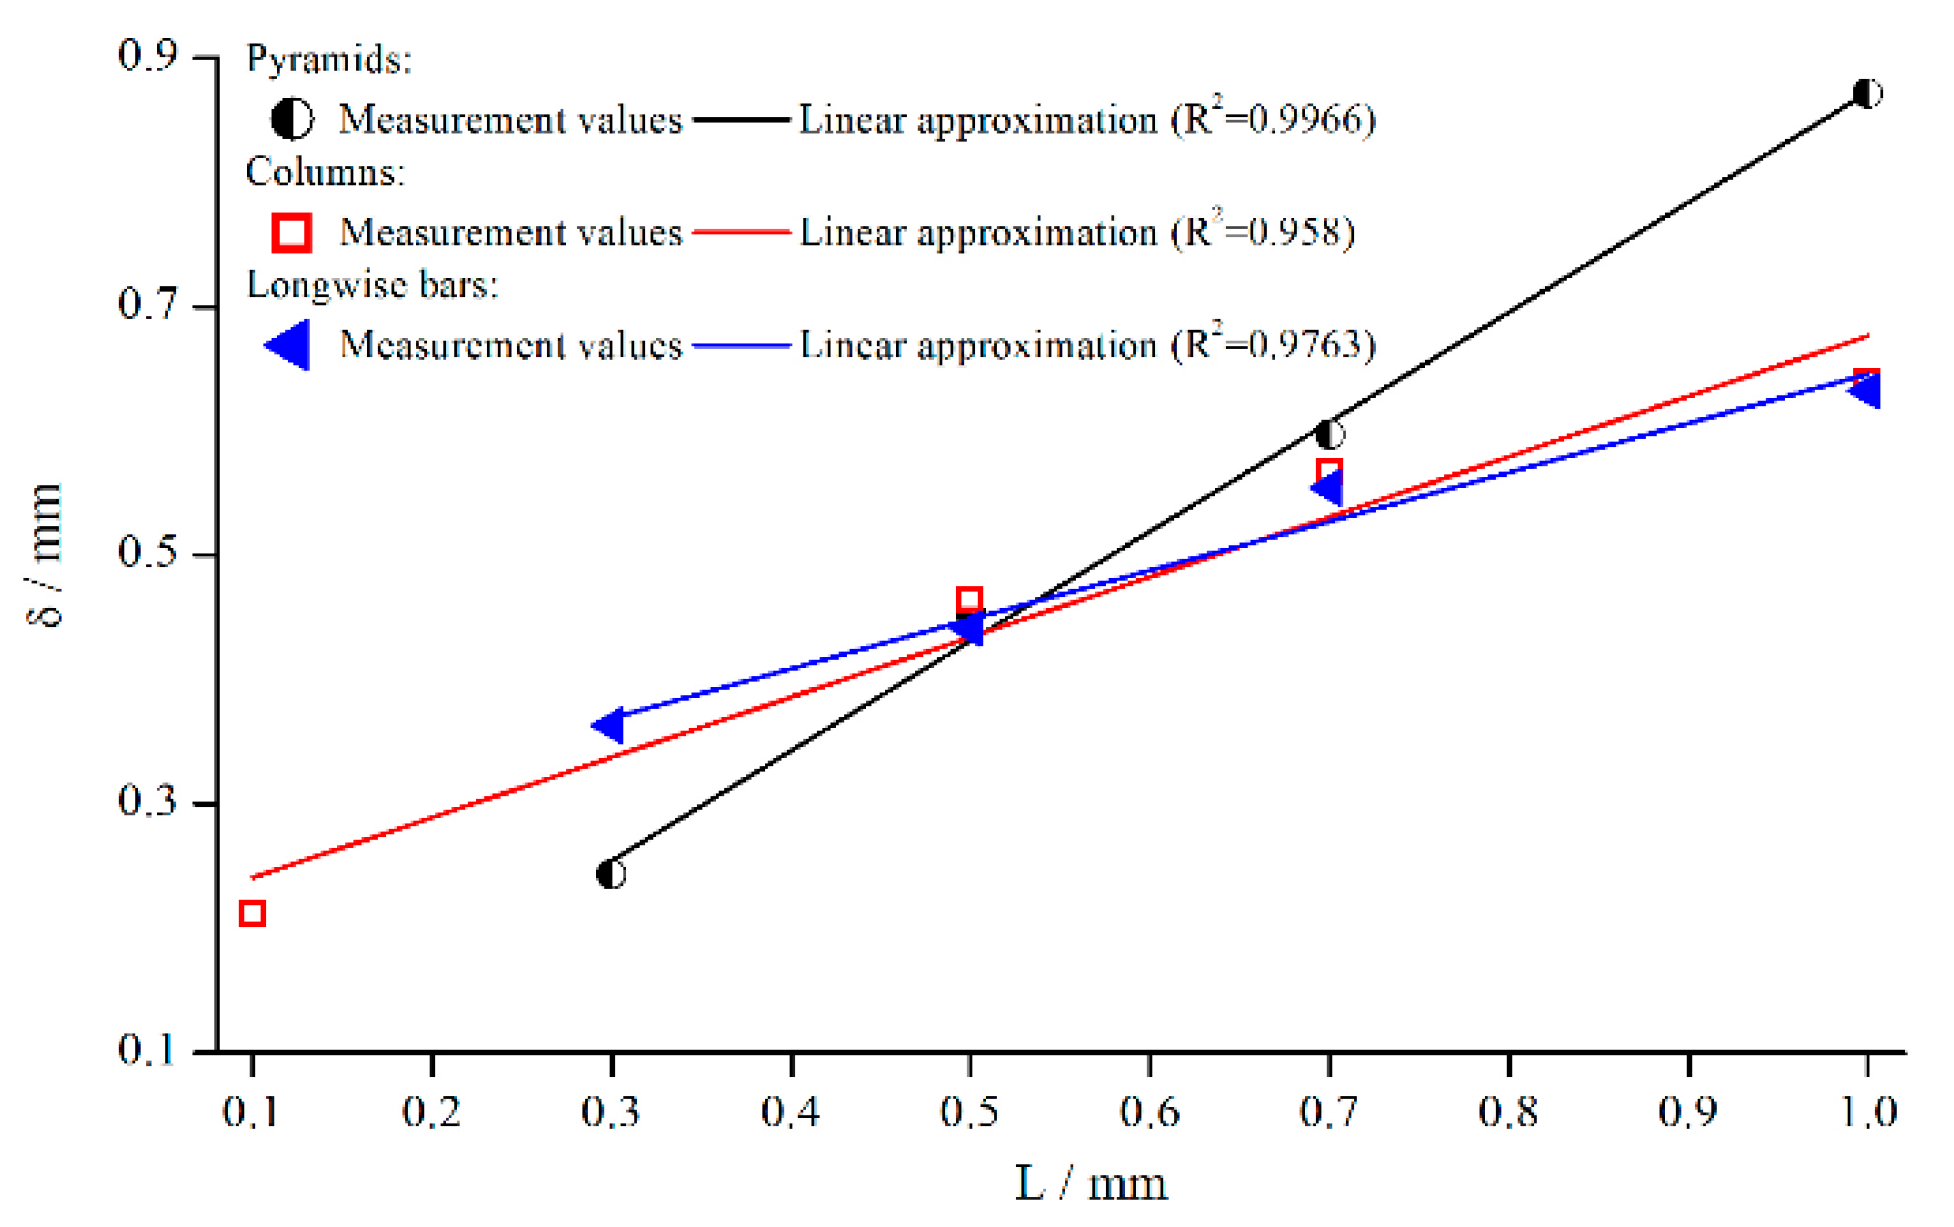
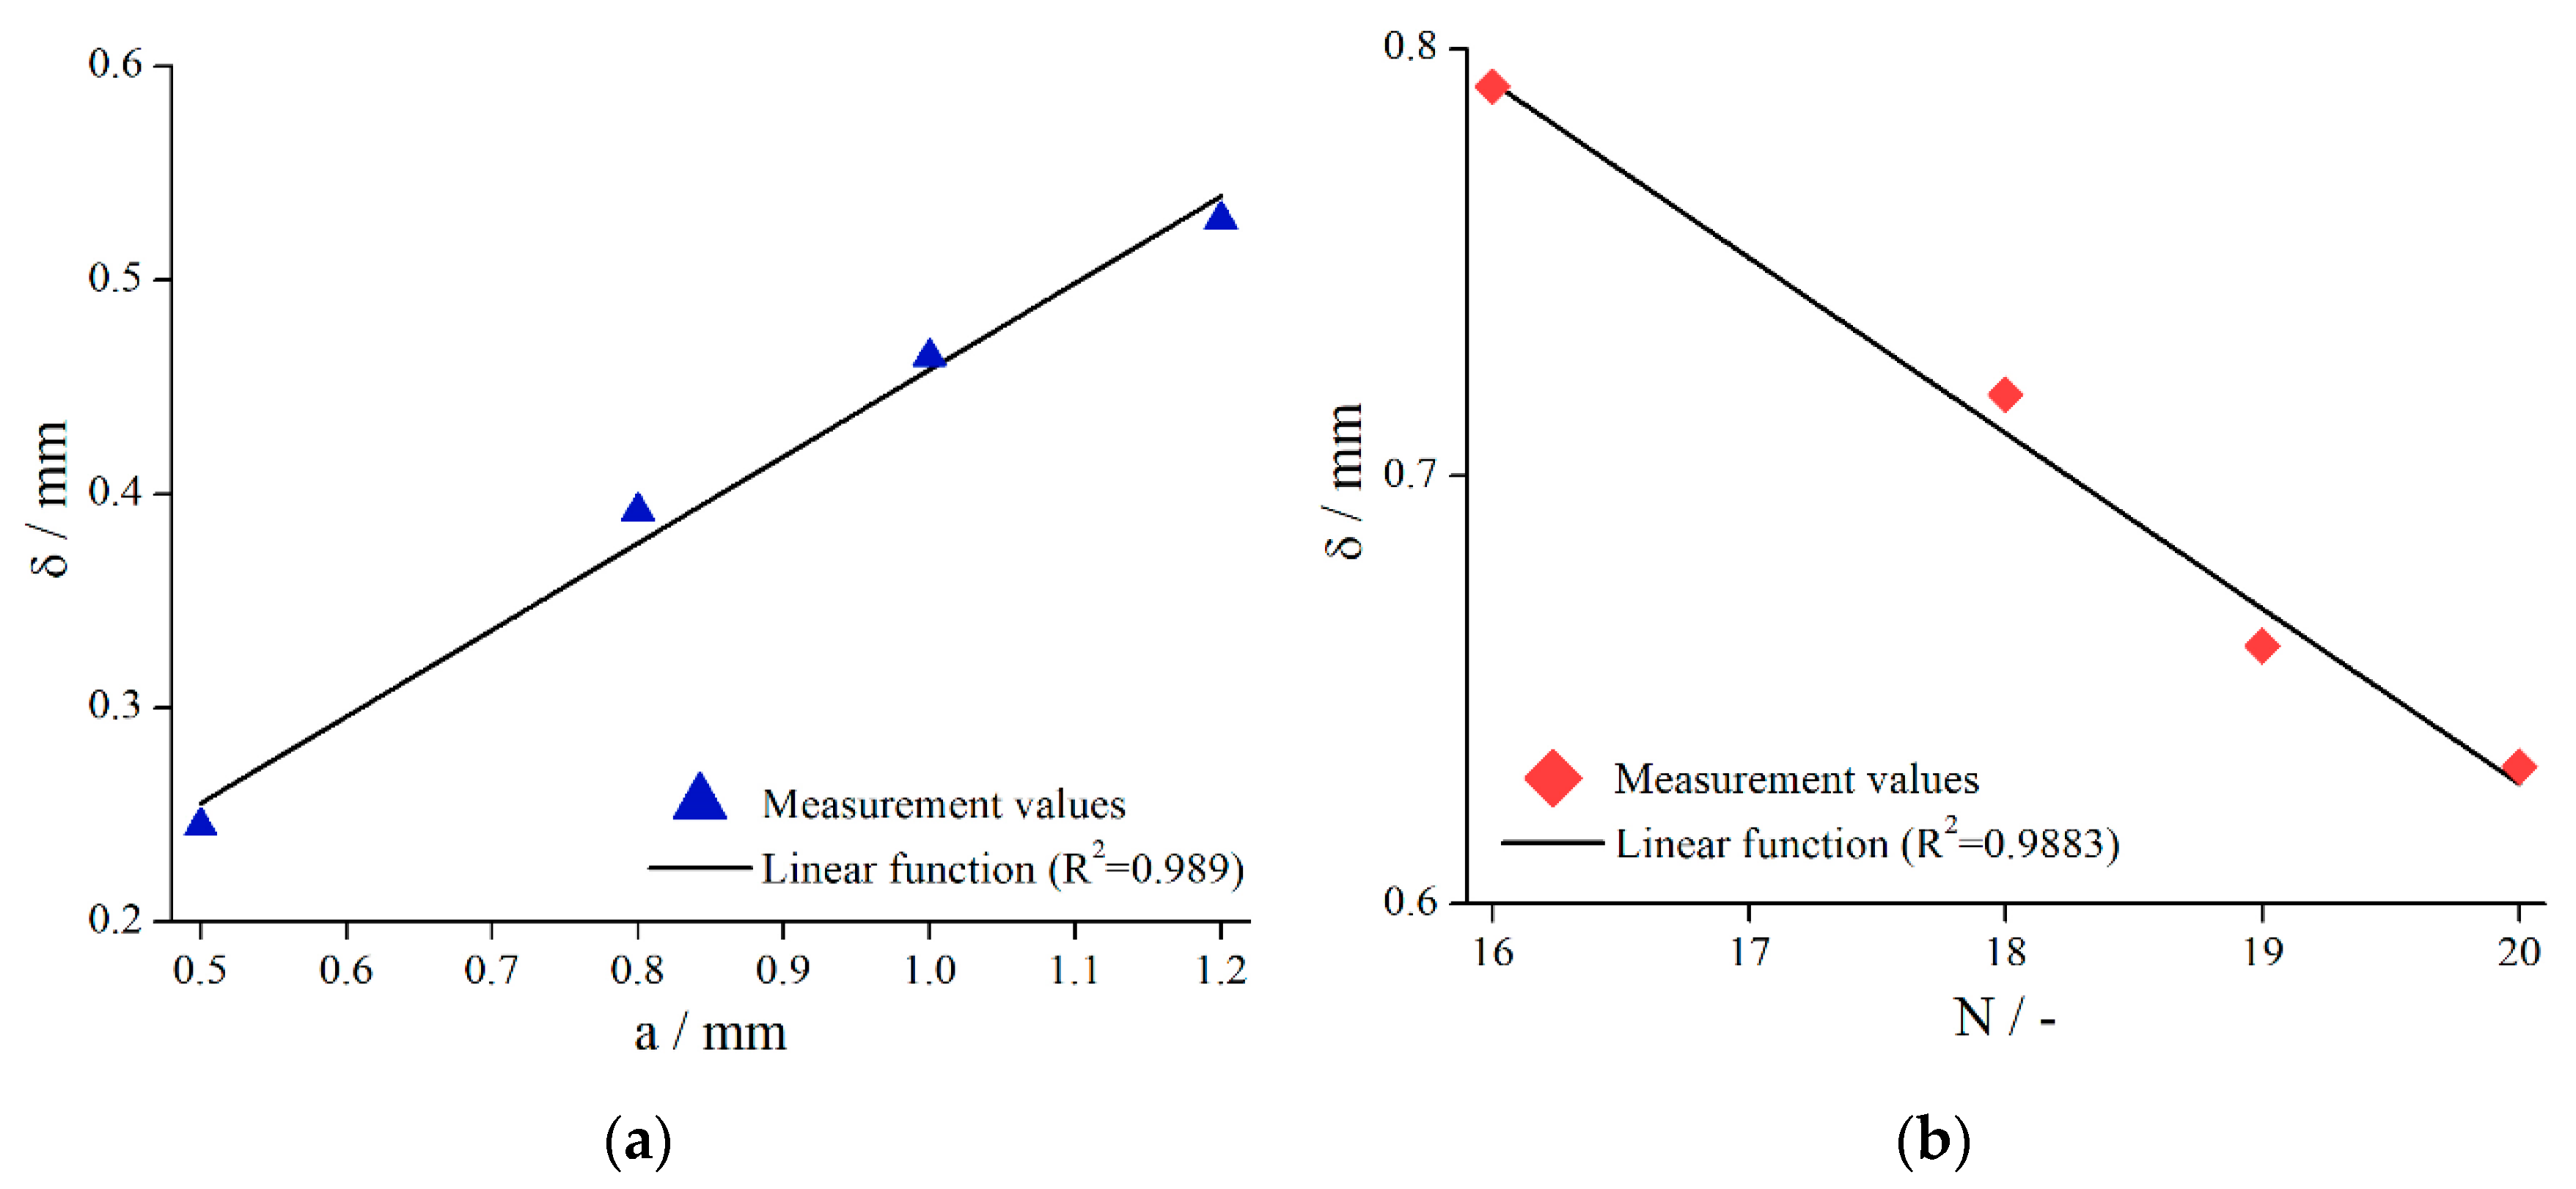
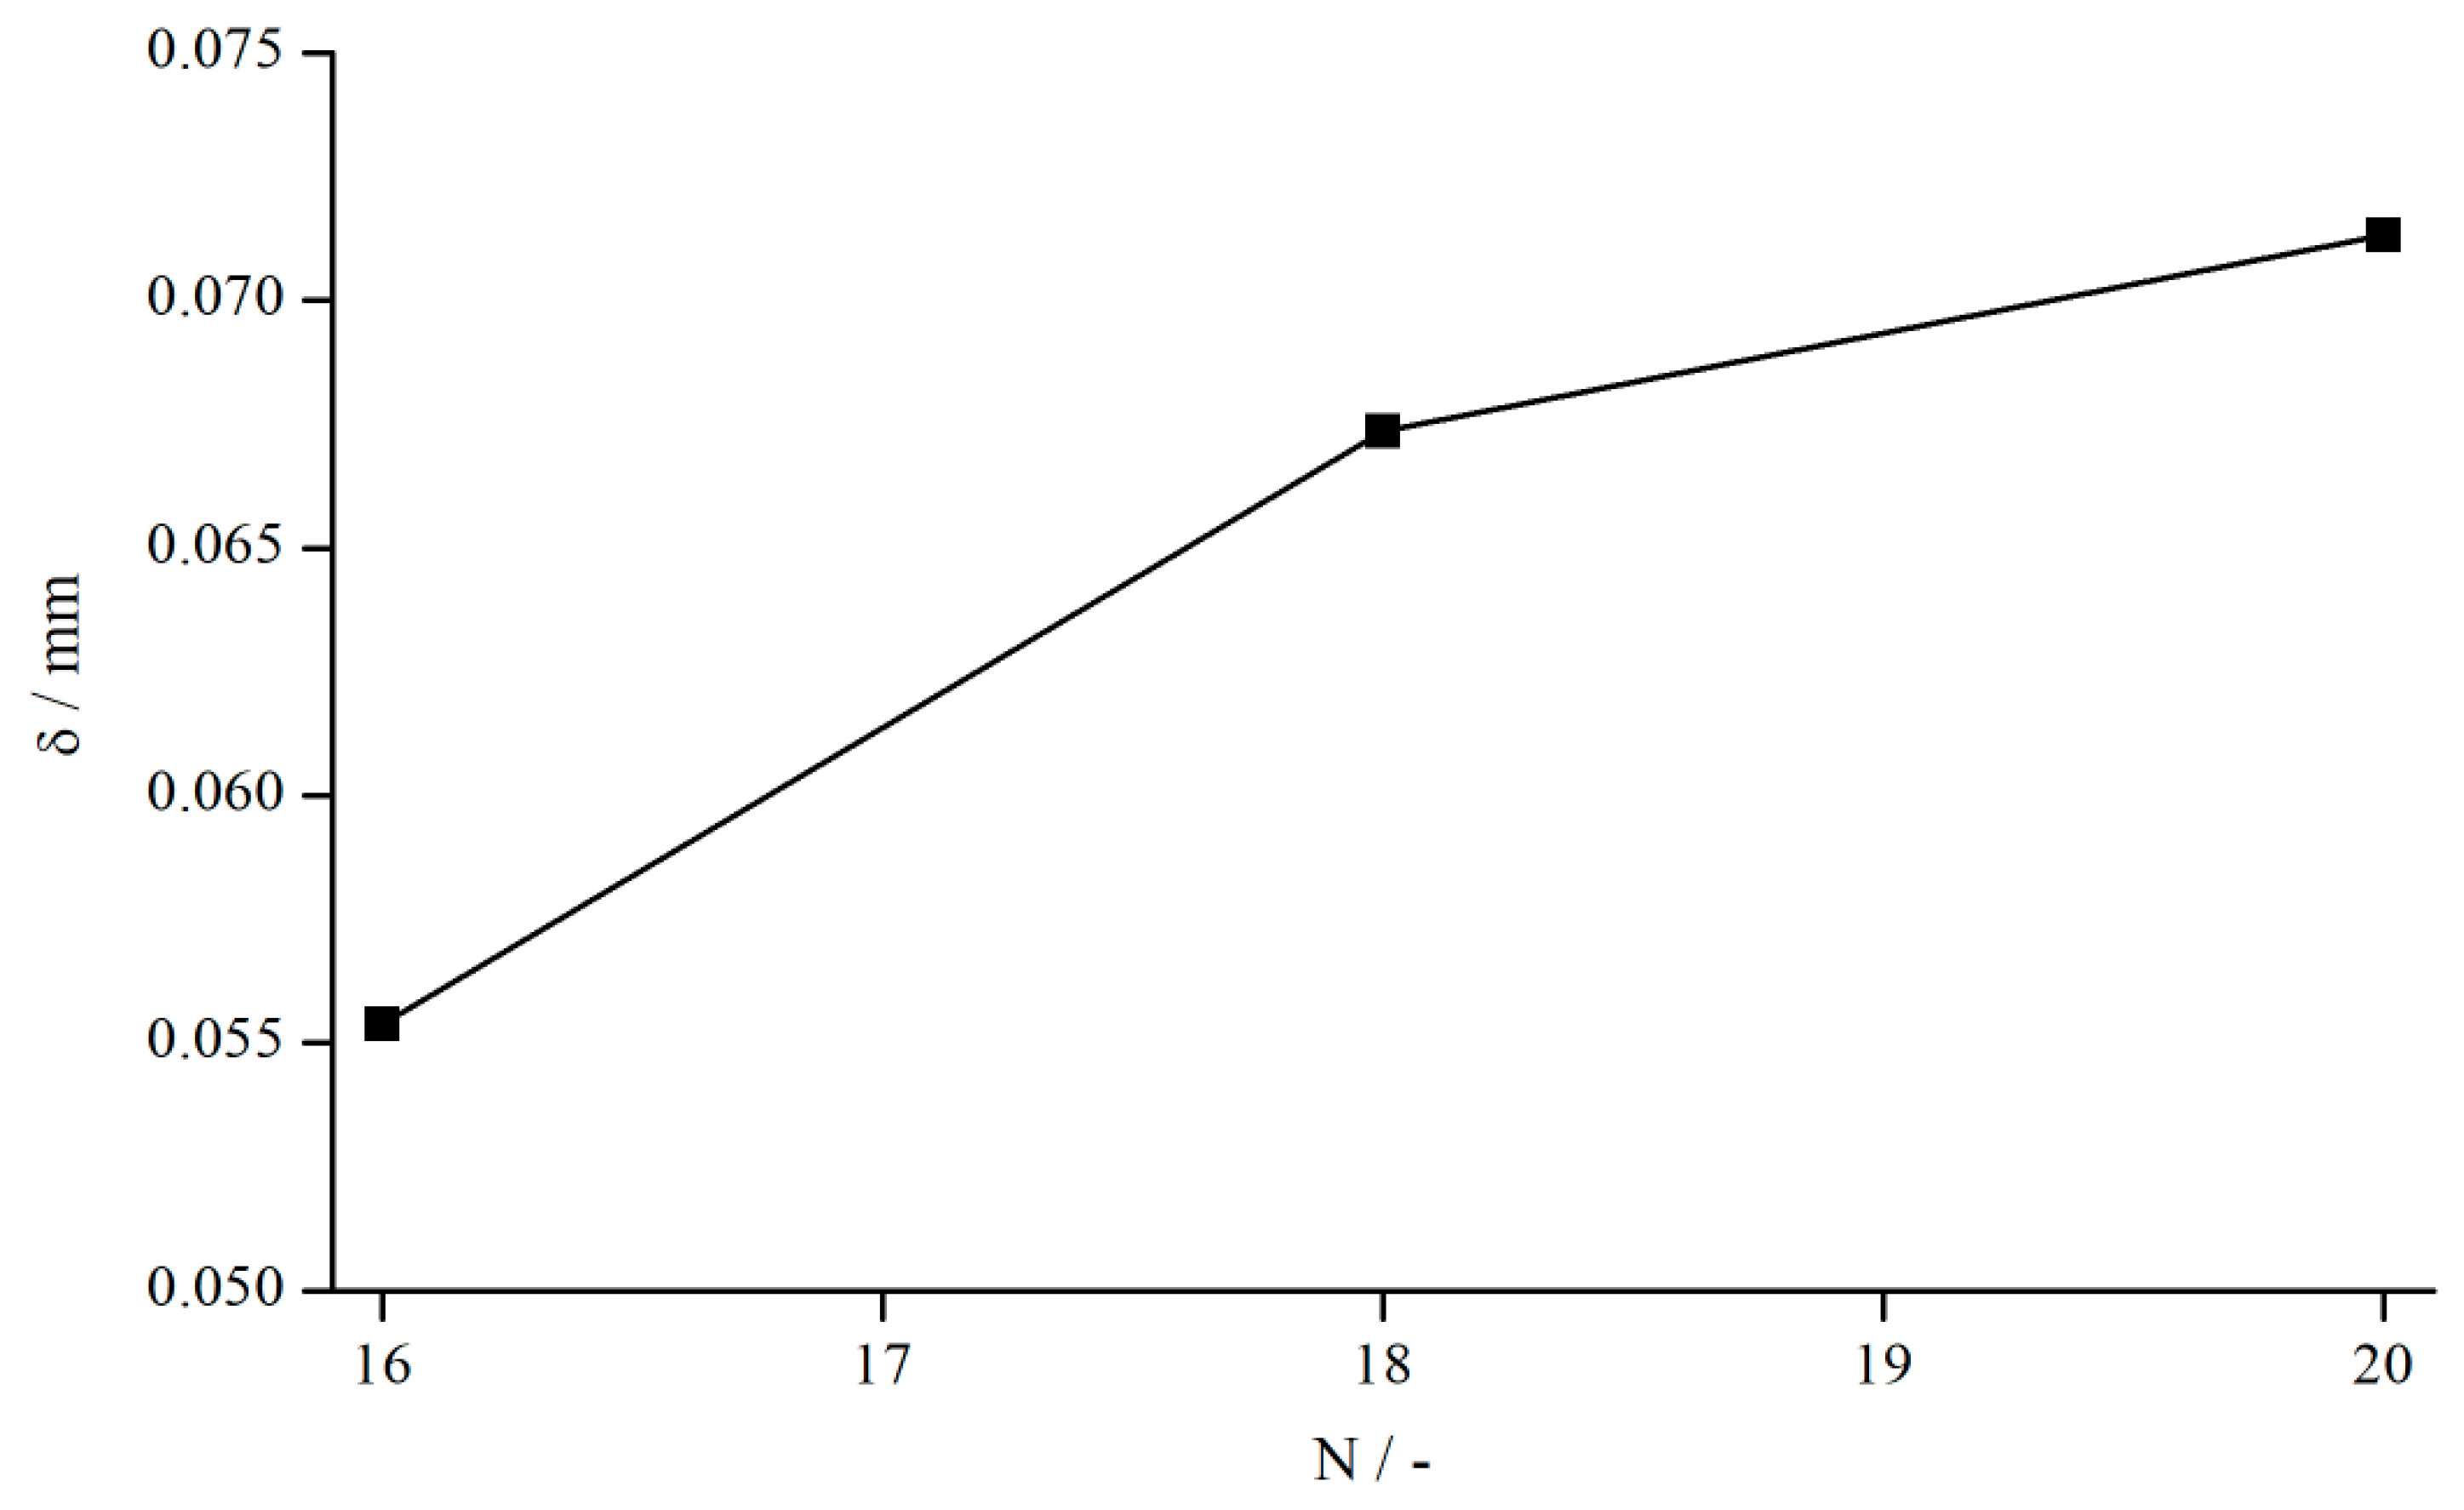
- An increasing structure depth as well as a decreasing number of structure elements lead to increasing values of .
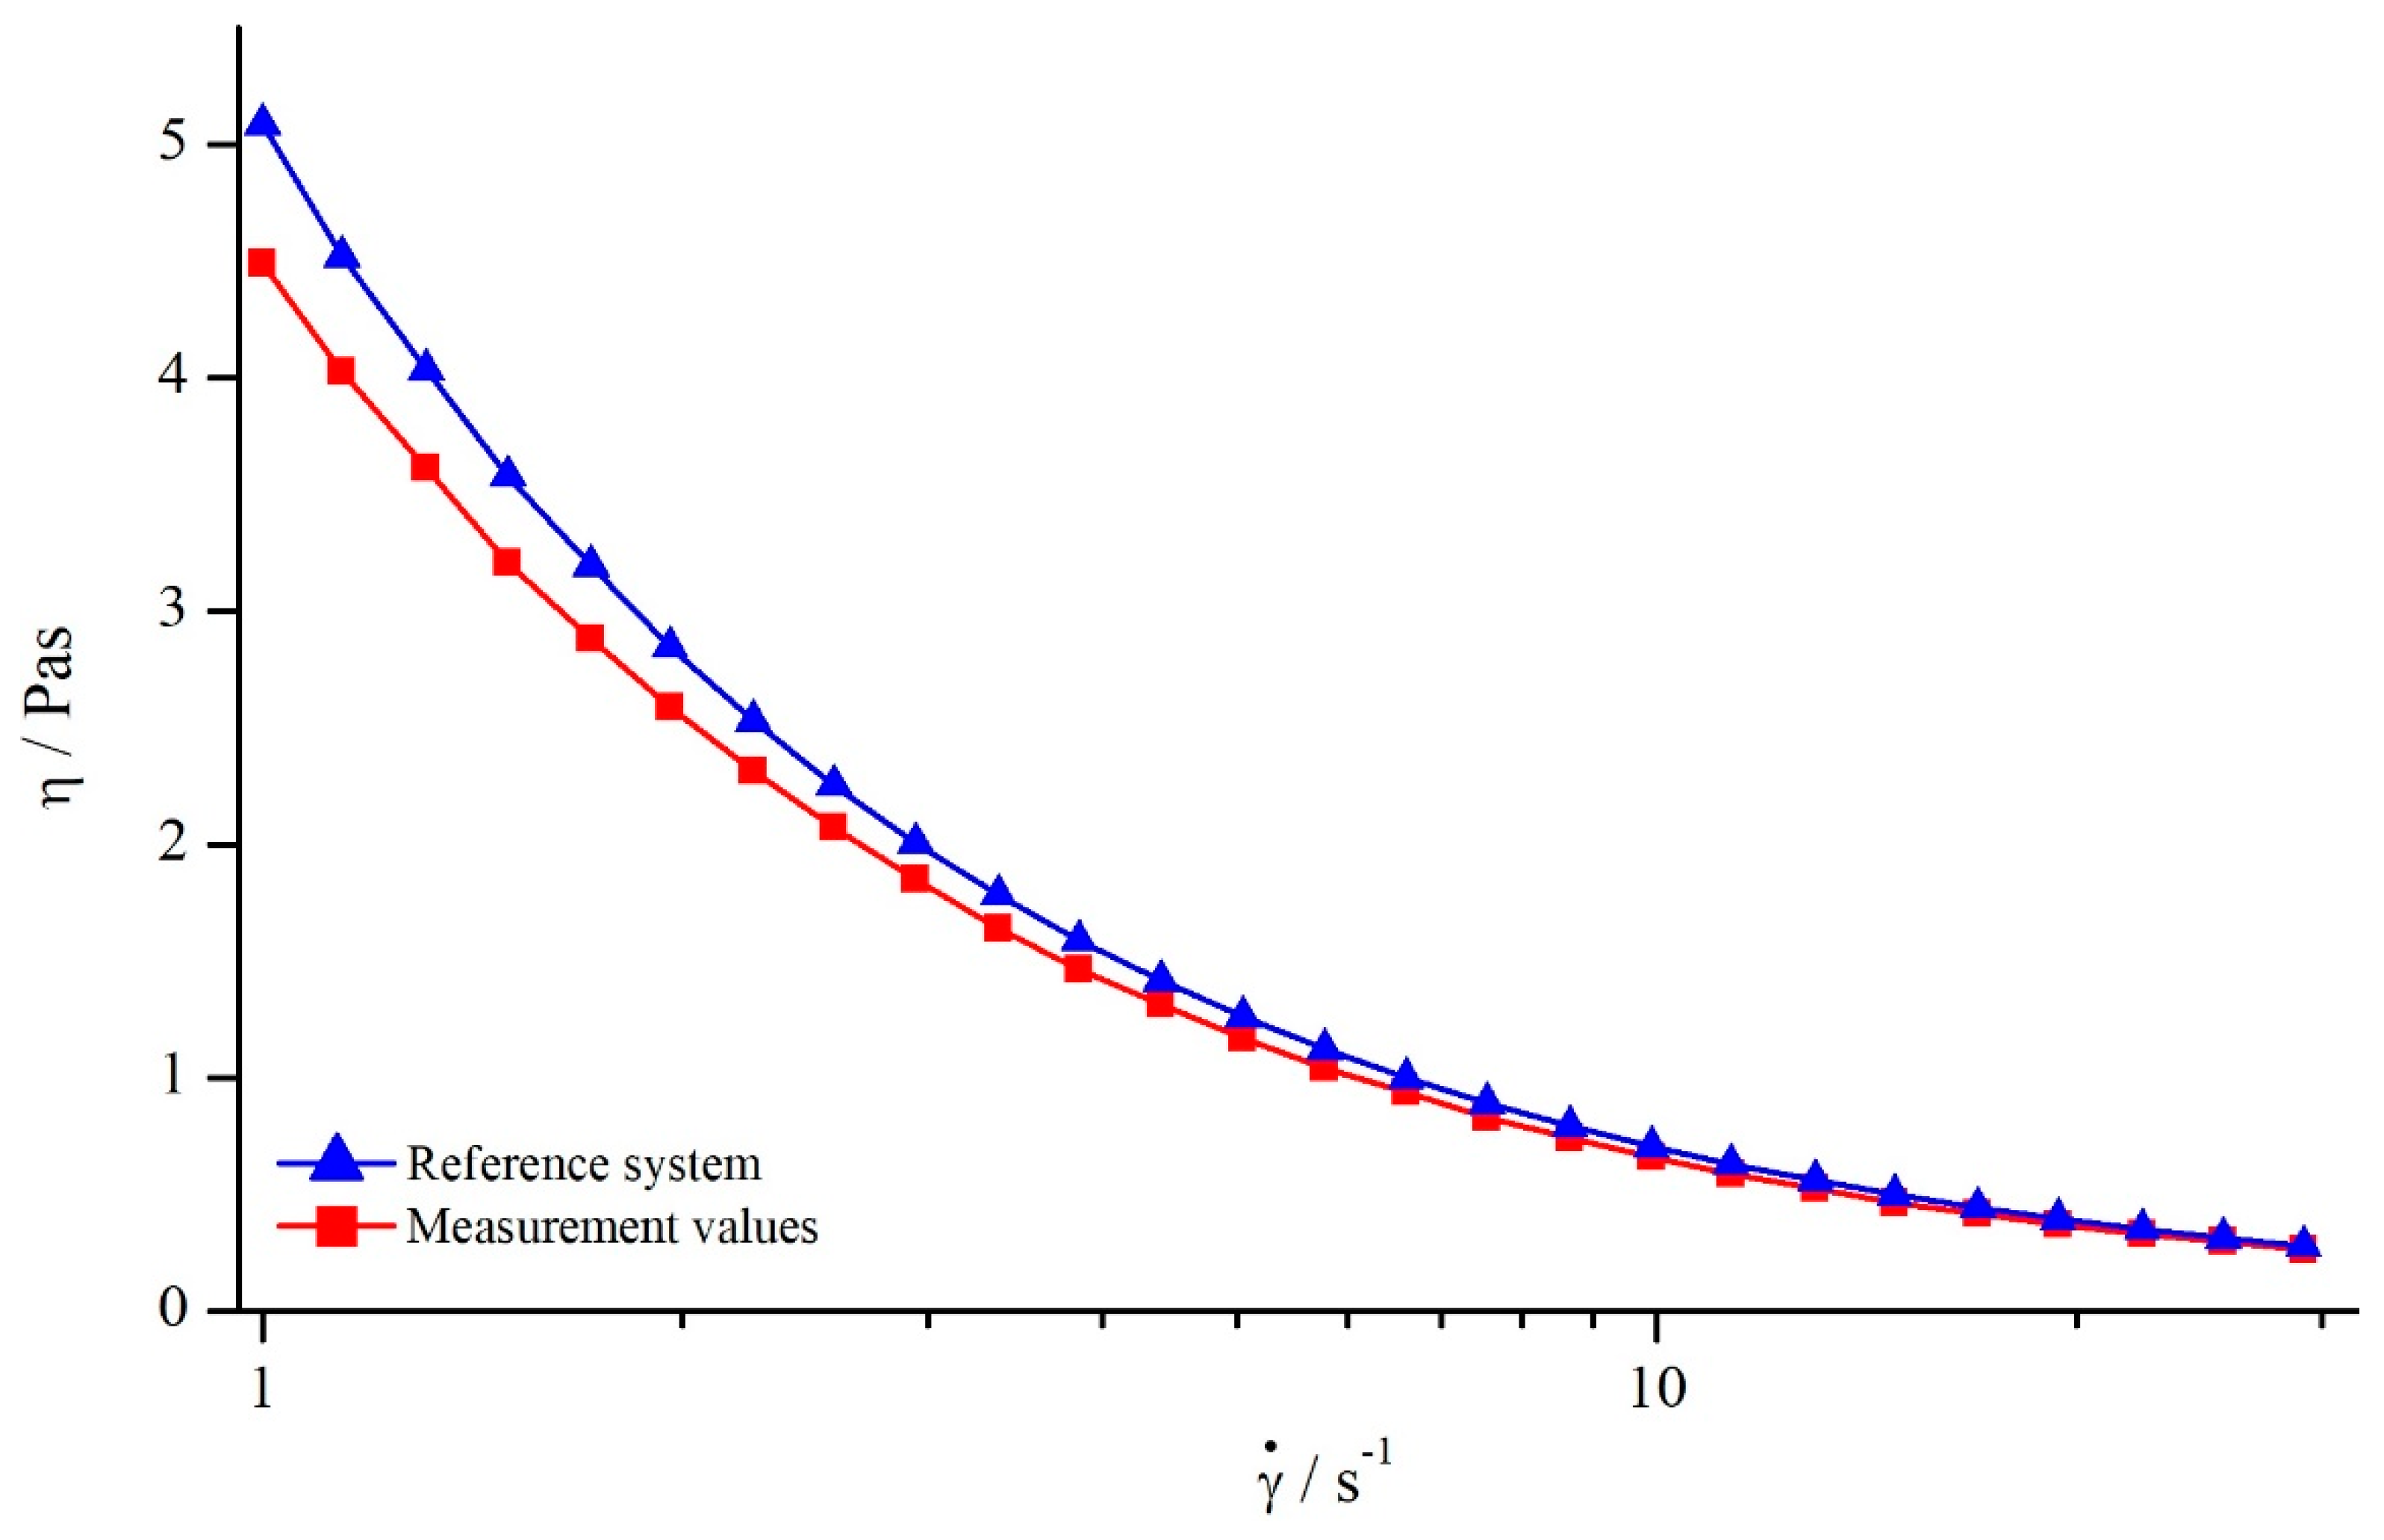
5.2. Shear Thinning Fluid
5.2.1. Comparison to Newtonian Fluids
5.2.2. Influence of Measuring Gap and Material
5.2.3. Influence of Shear Rate
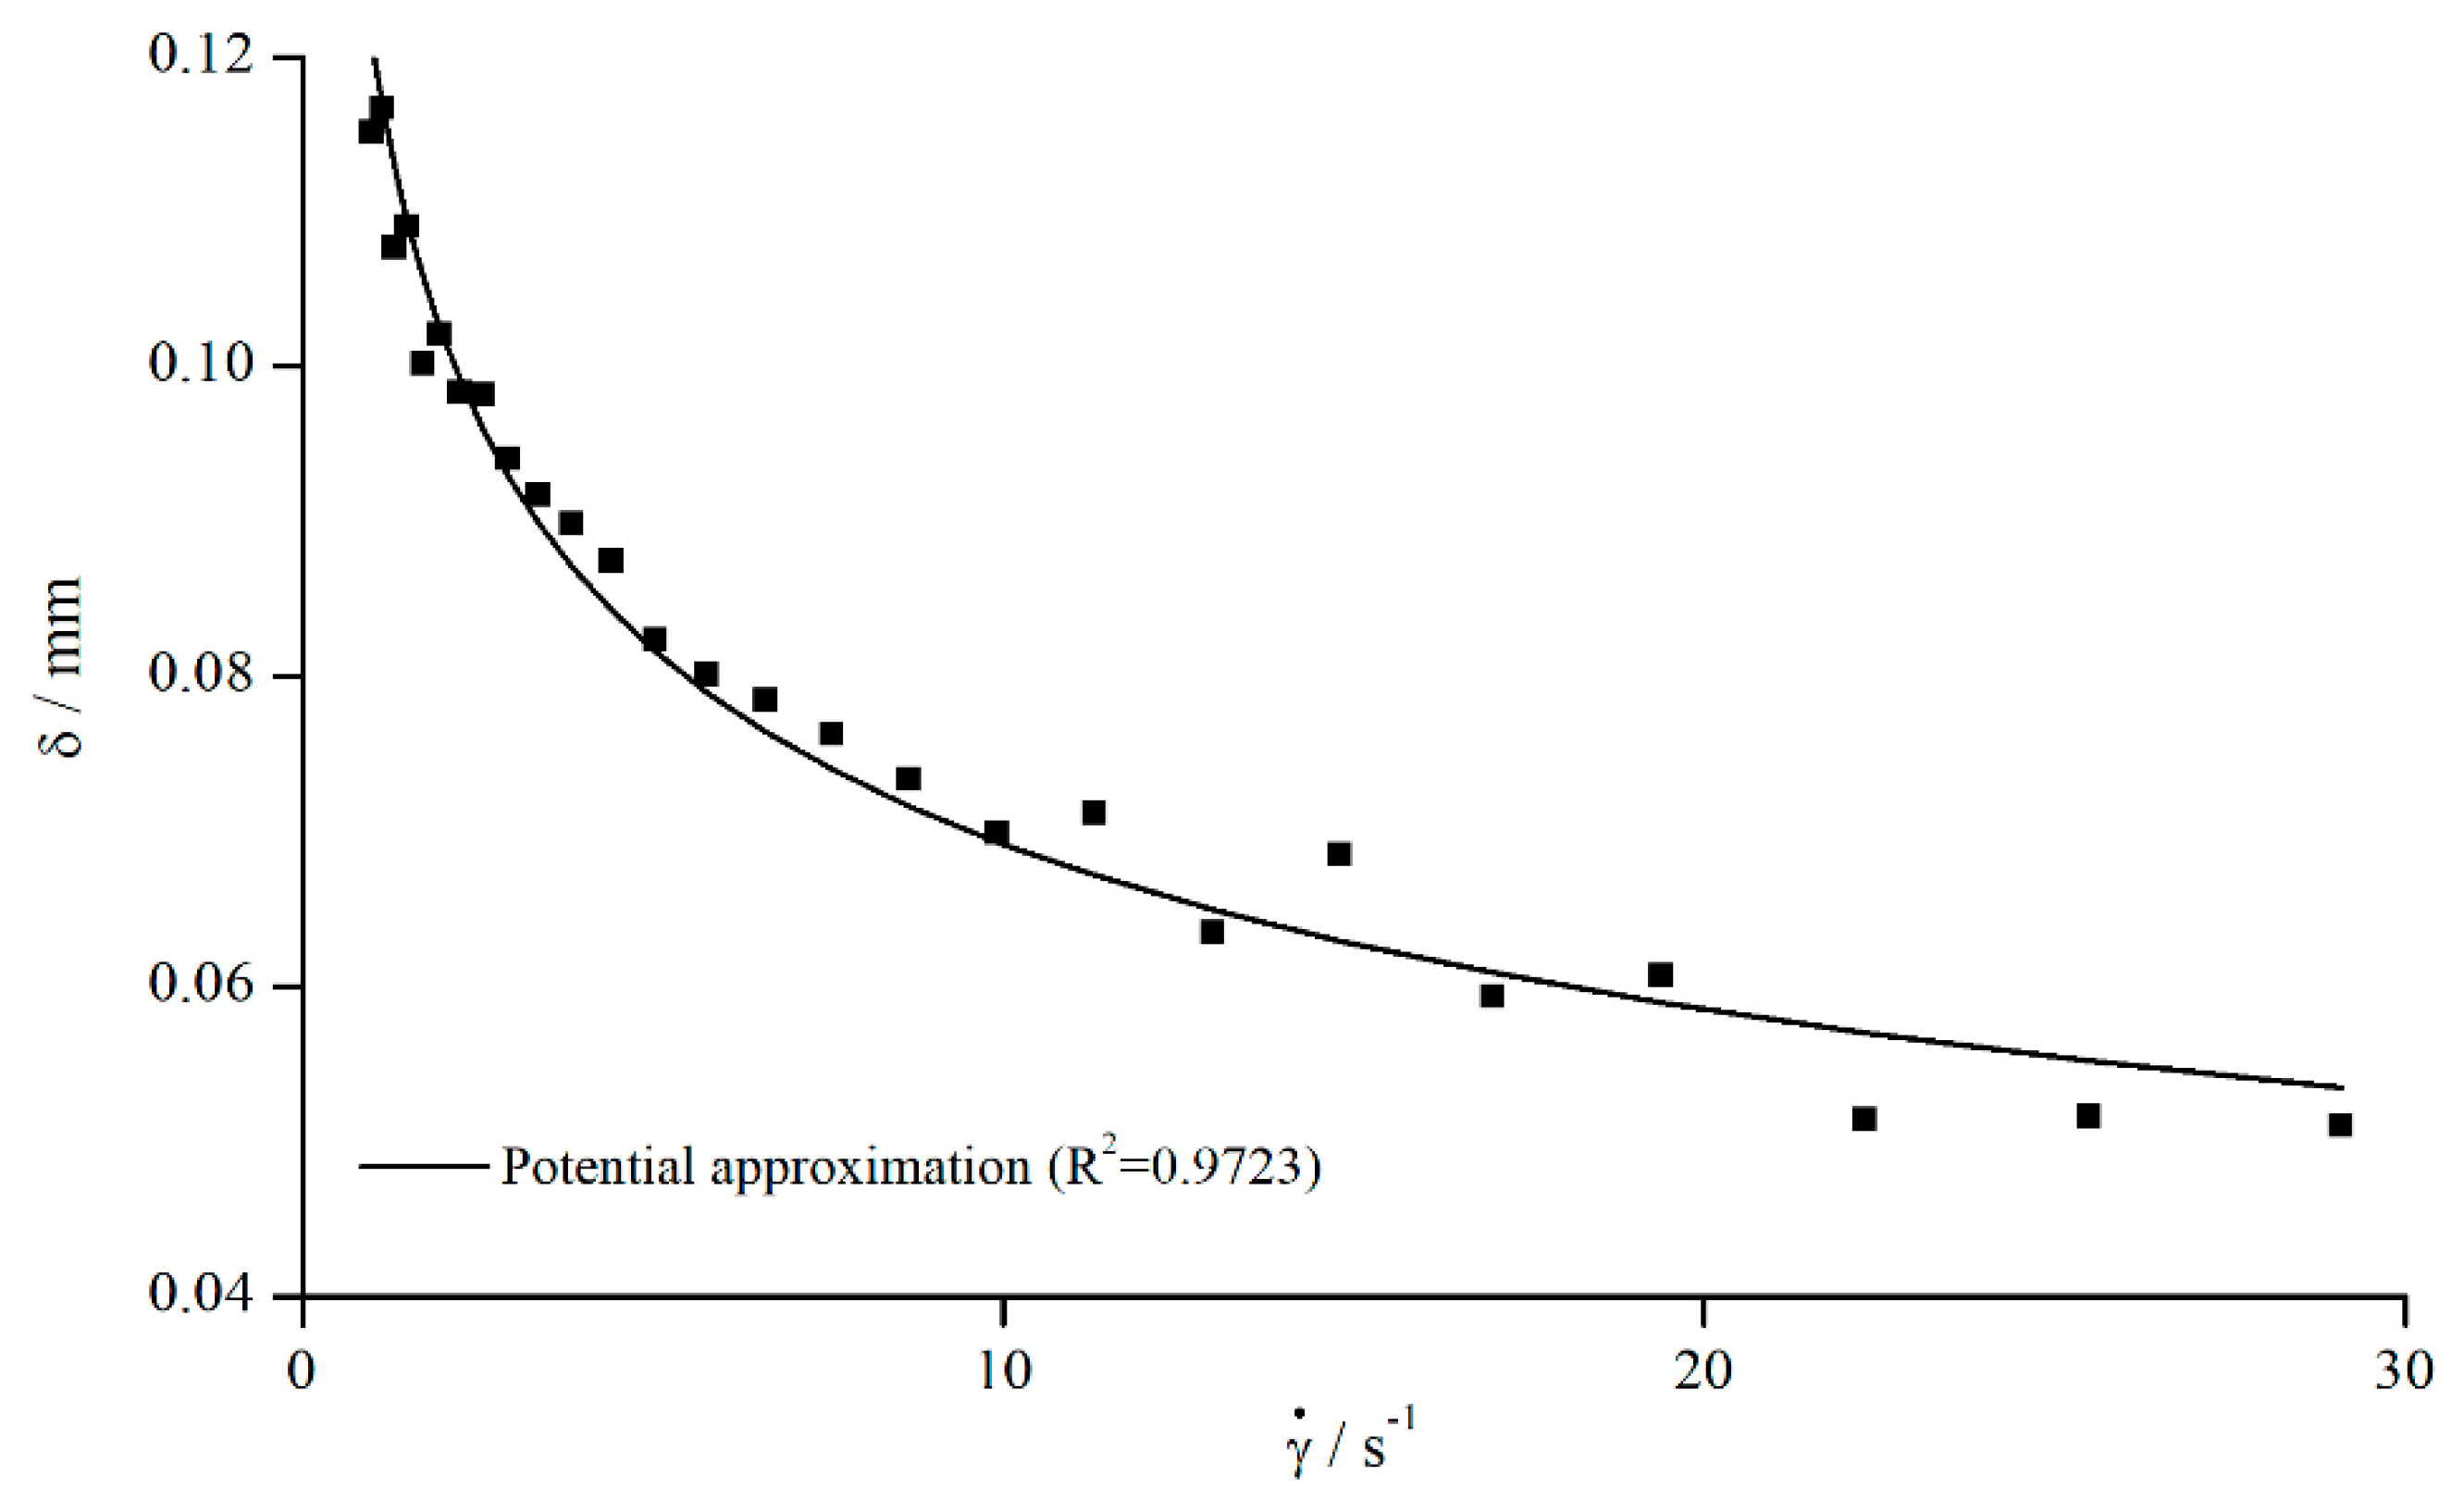
5.2.4. Determination of Gap Extension
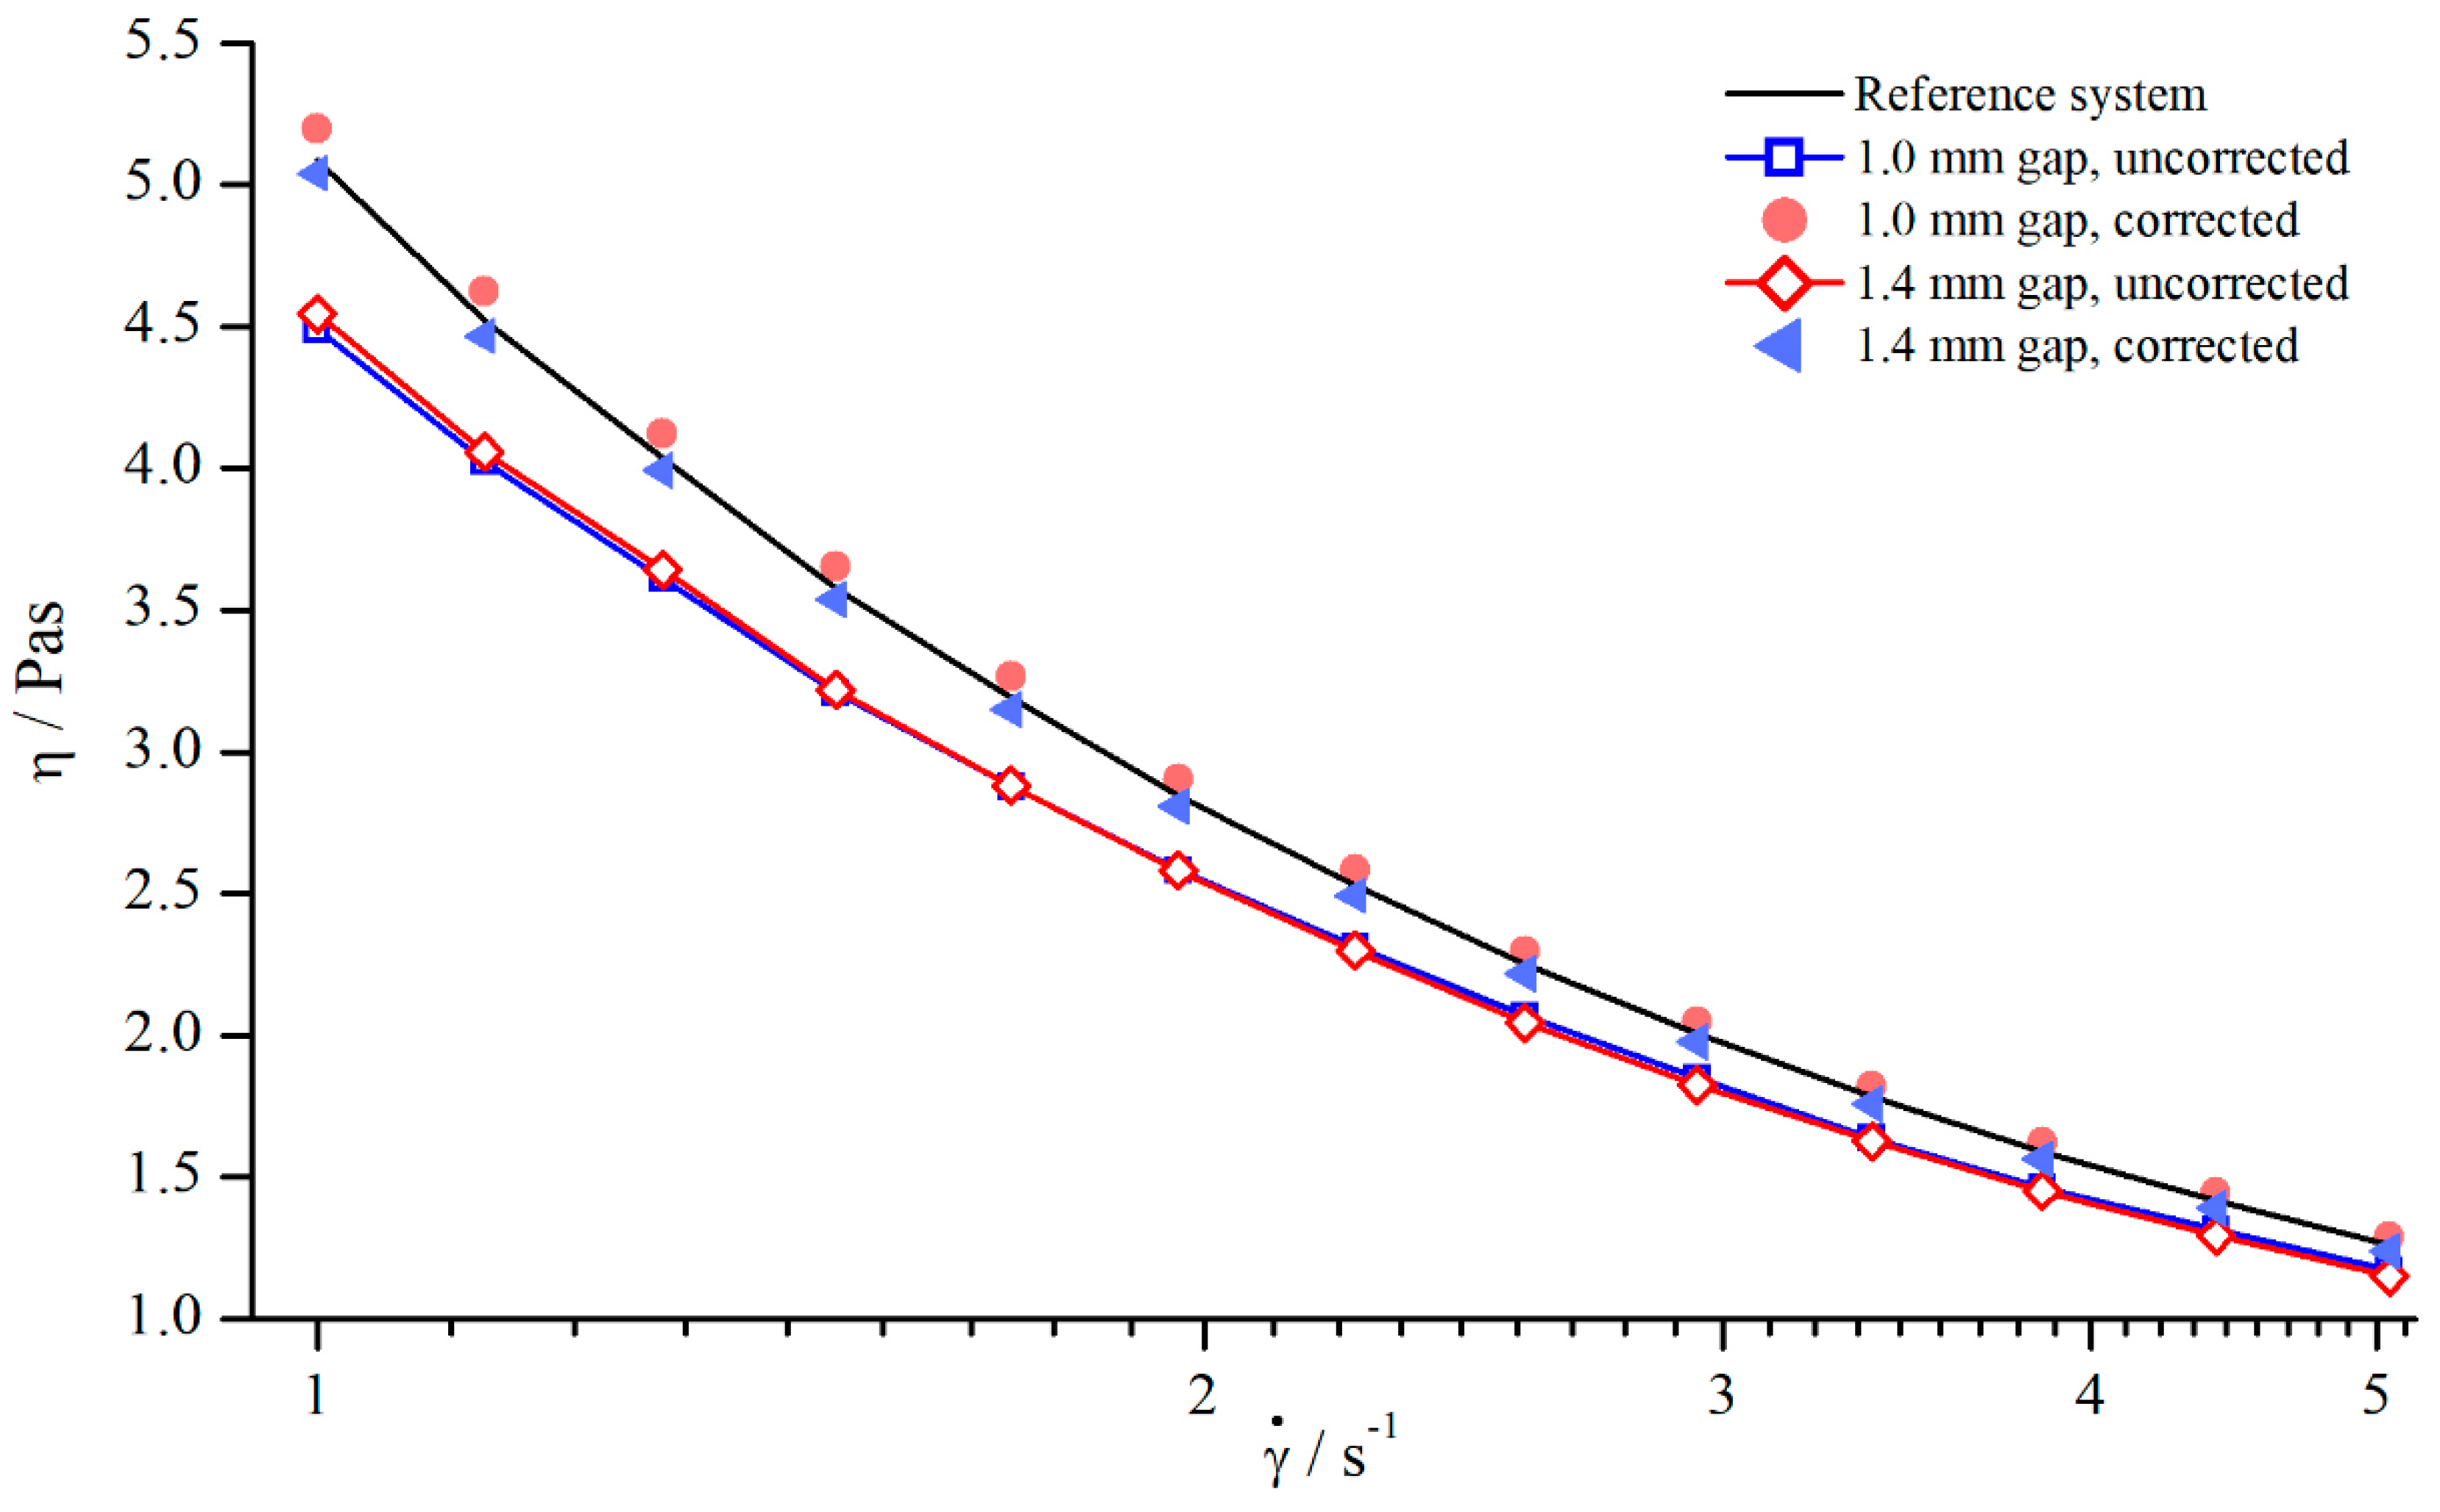
5.2.5. Correction of Viscosity
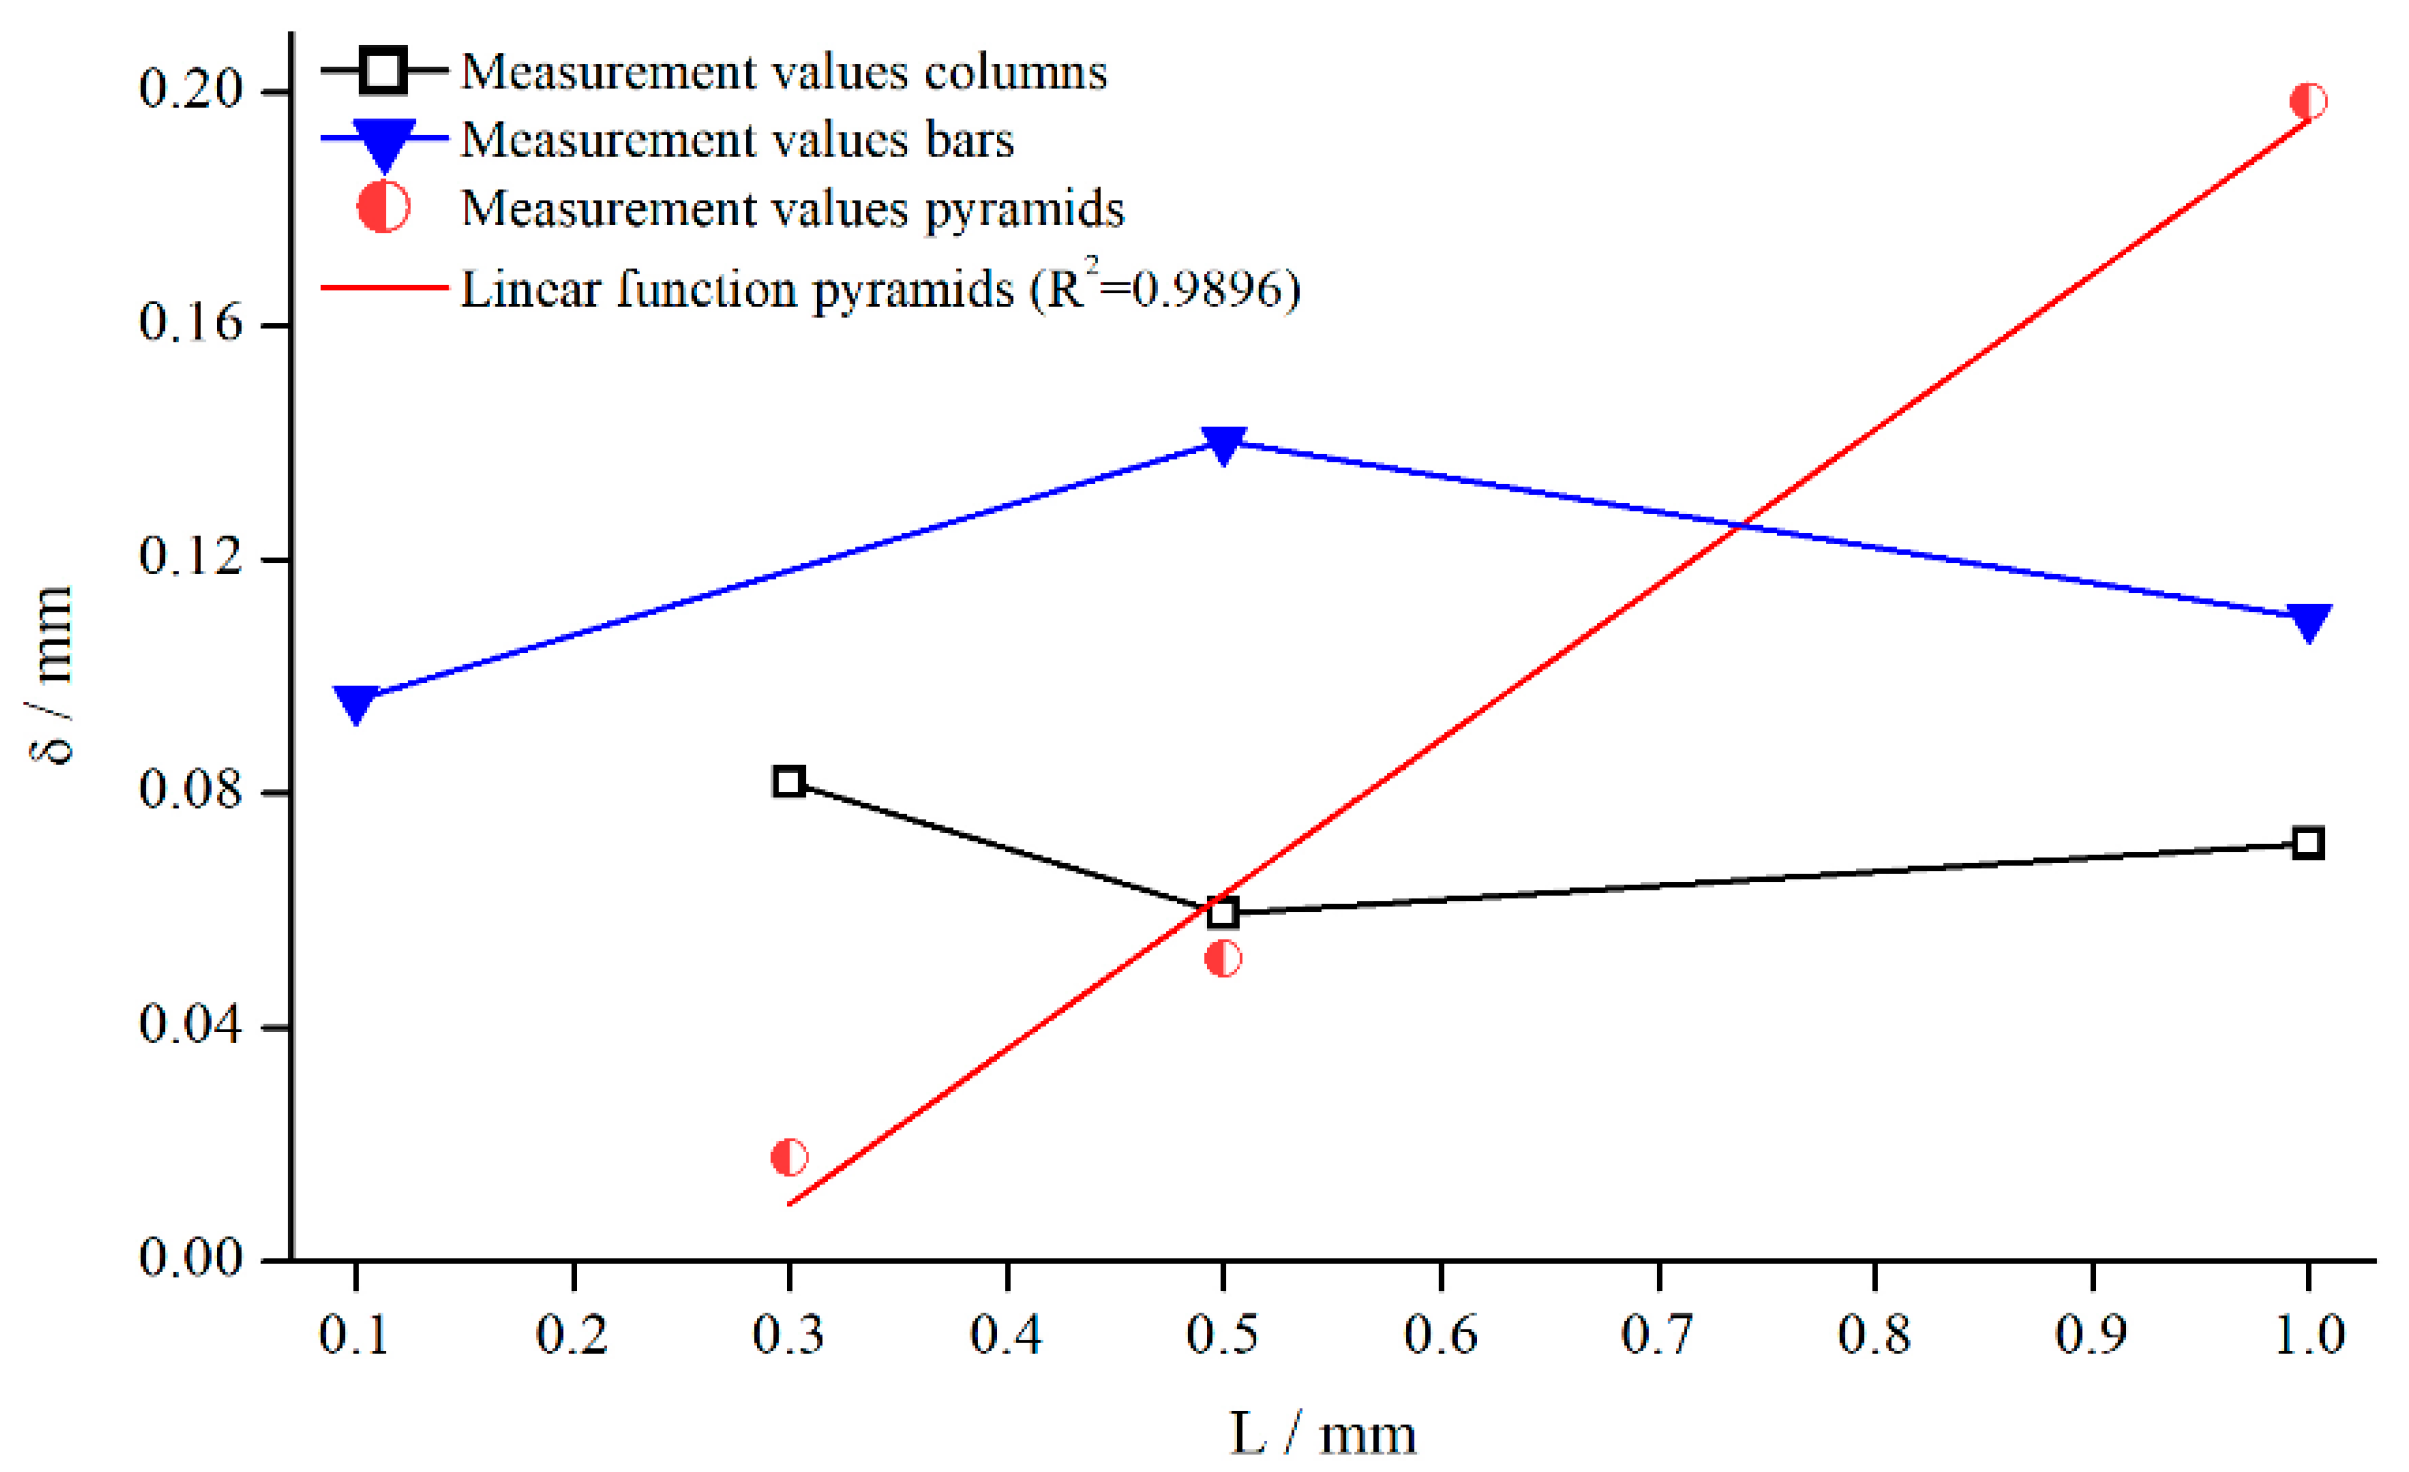
5.2.6. Influence of Different Structural Features
5.2.7. Comparison to Previous Studies
- The relative influence of structured geometries is far smaller than that observed for Newtonian fluids and is also independent of the strength of the shear thinning effect in the range of the investigated fluids;
- In contrast to Newtonian fluids, no exact relationship between measuring gap and normalised viscosity was observed, which is the result of two counteracting effects—gap height and shear thinning—combined with the overall small influence of structured geometries;
- The values for decrease with increasing shear rate, resulting from complex shear fields combined with shear thinning properties of xanthan gum solutions;
- The development of a gap-independent correction function is possible, since observed deviations due to different gaps heights are small;
- Because of the relatively small changes of , it was not possible to reveal if is dependent on changes in structure depth in the case of columnar structures and bars;
- Concerning pyramids, an increase of structure depth, leading to a decrease of number of elements, leads to an increase of ;
- An increase of bars leads to an increase of .
5.3. Suspensions
5.3.1. Comparison to Newtonian Fluids
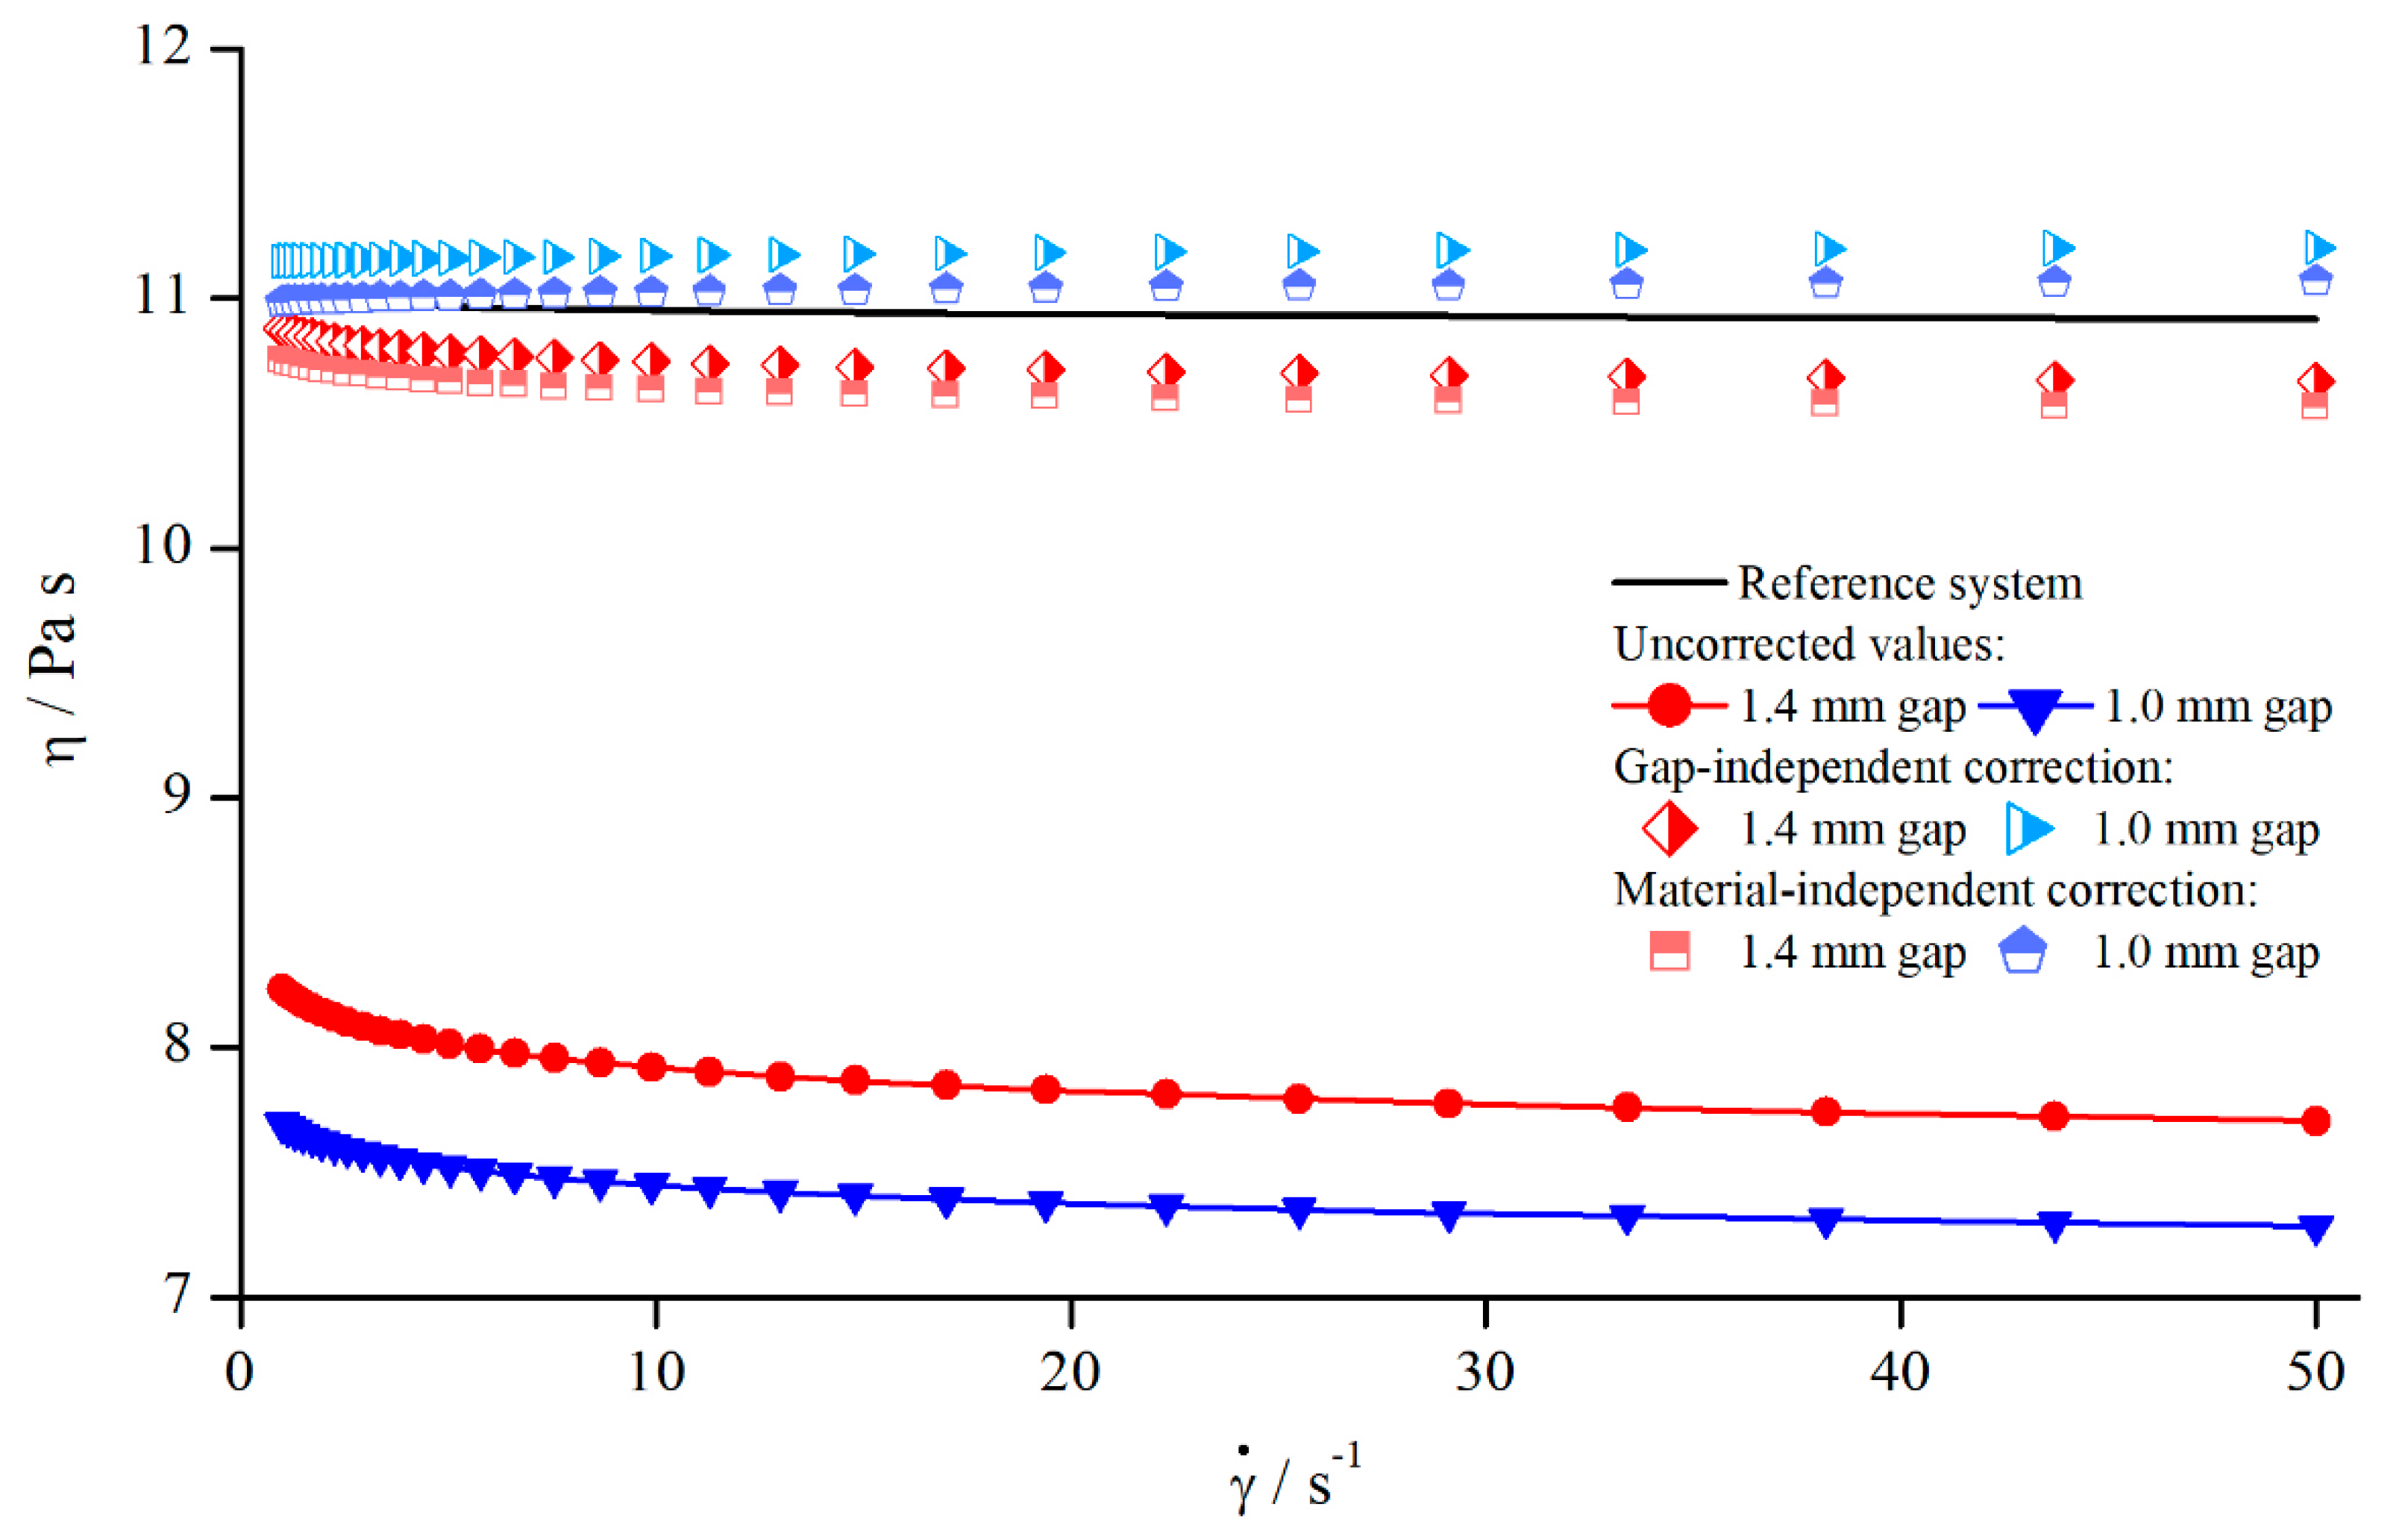
5.3.2. Correction of Viscosity
5.3.3. Comparison to Previous Studies
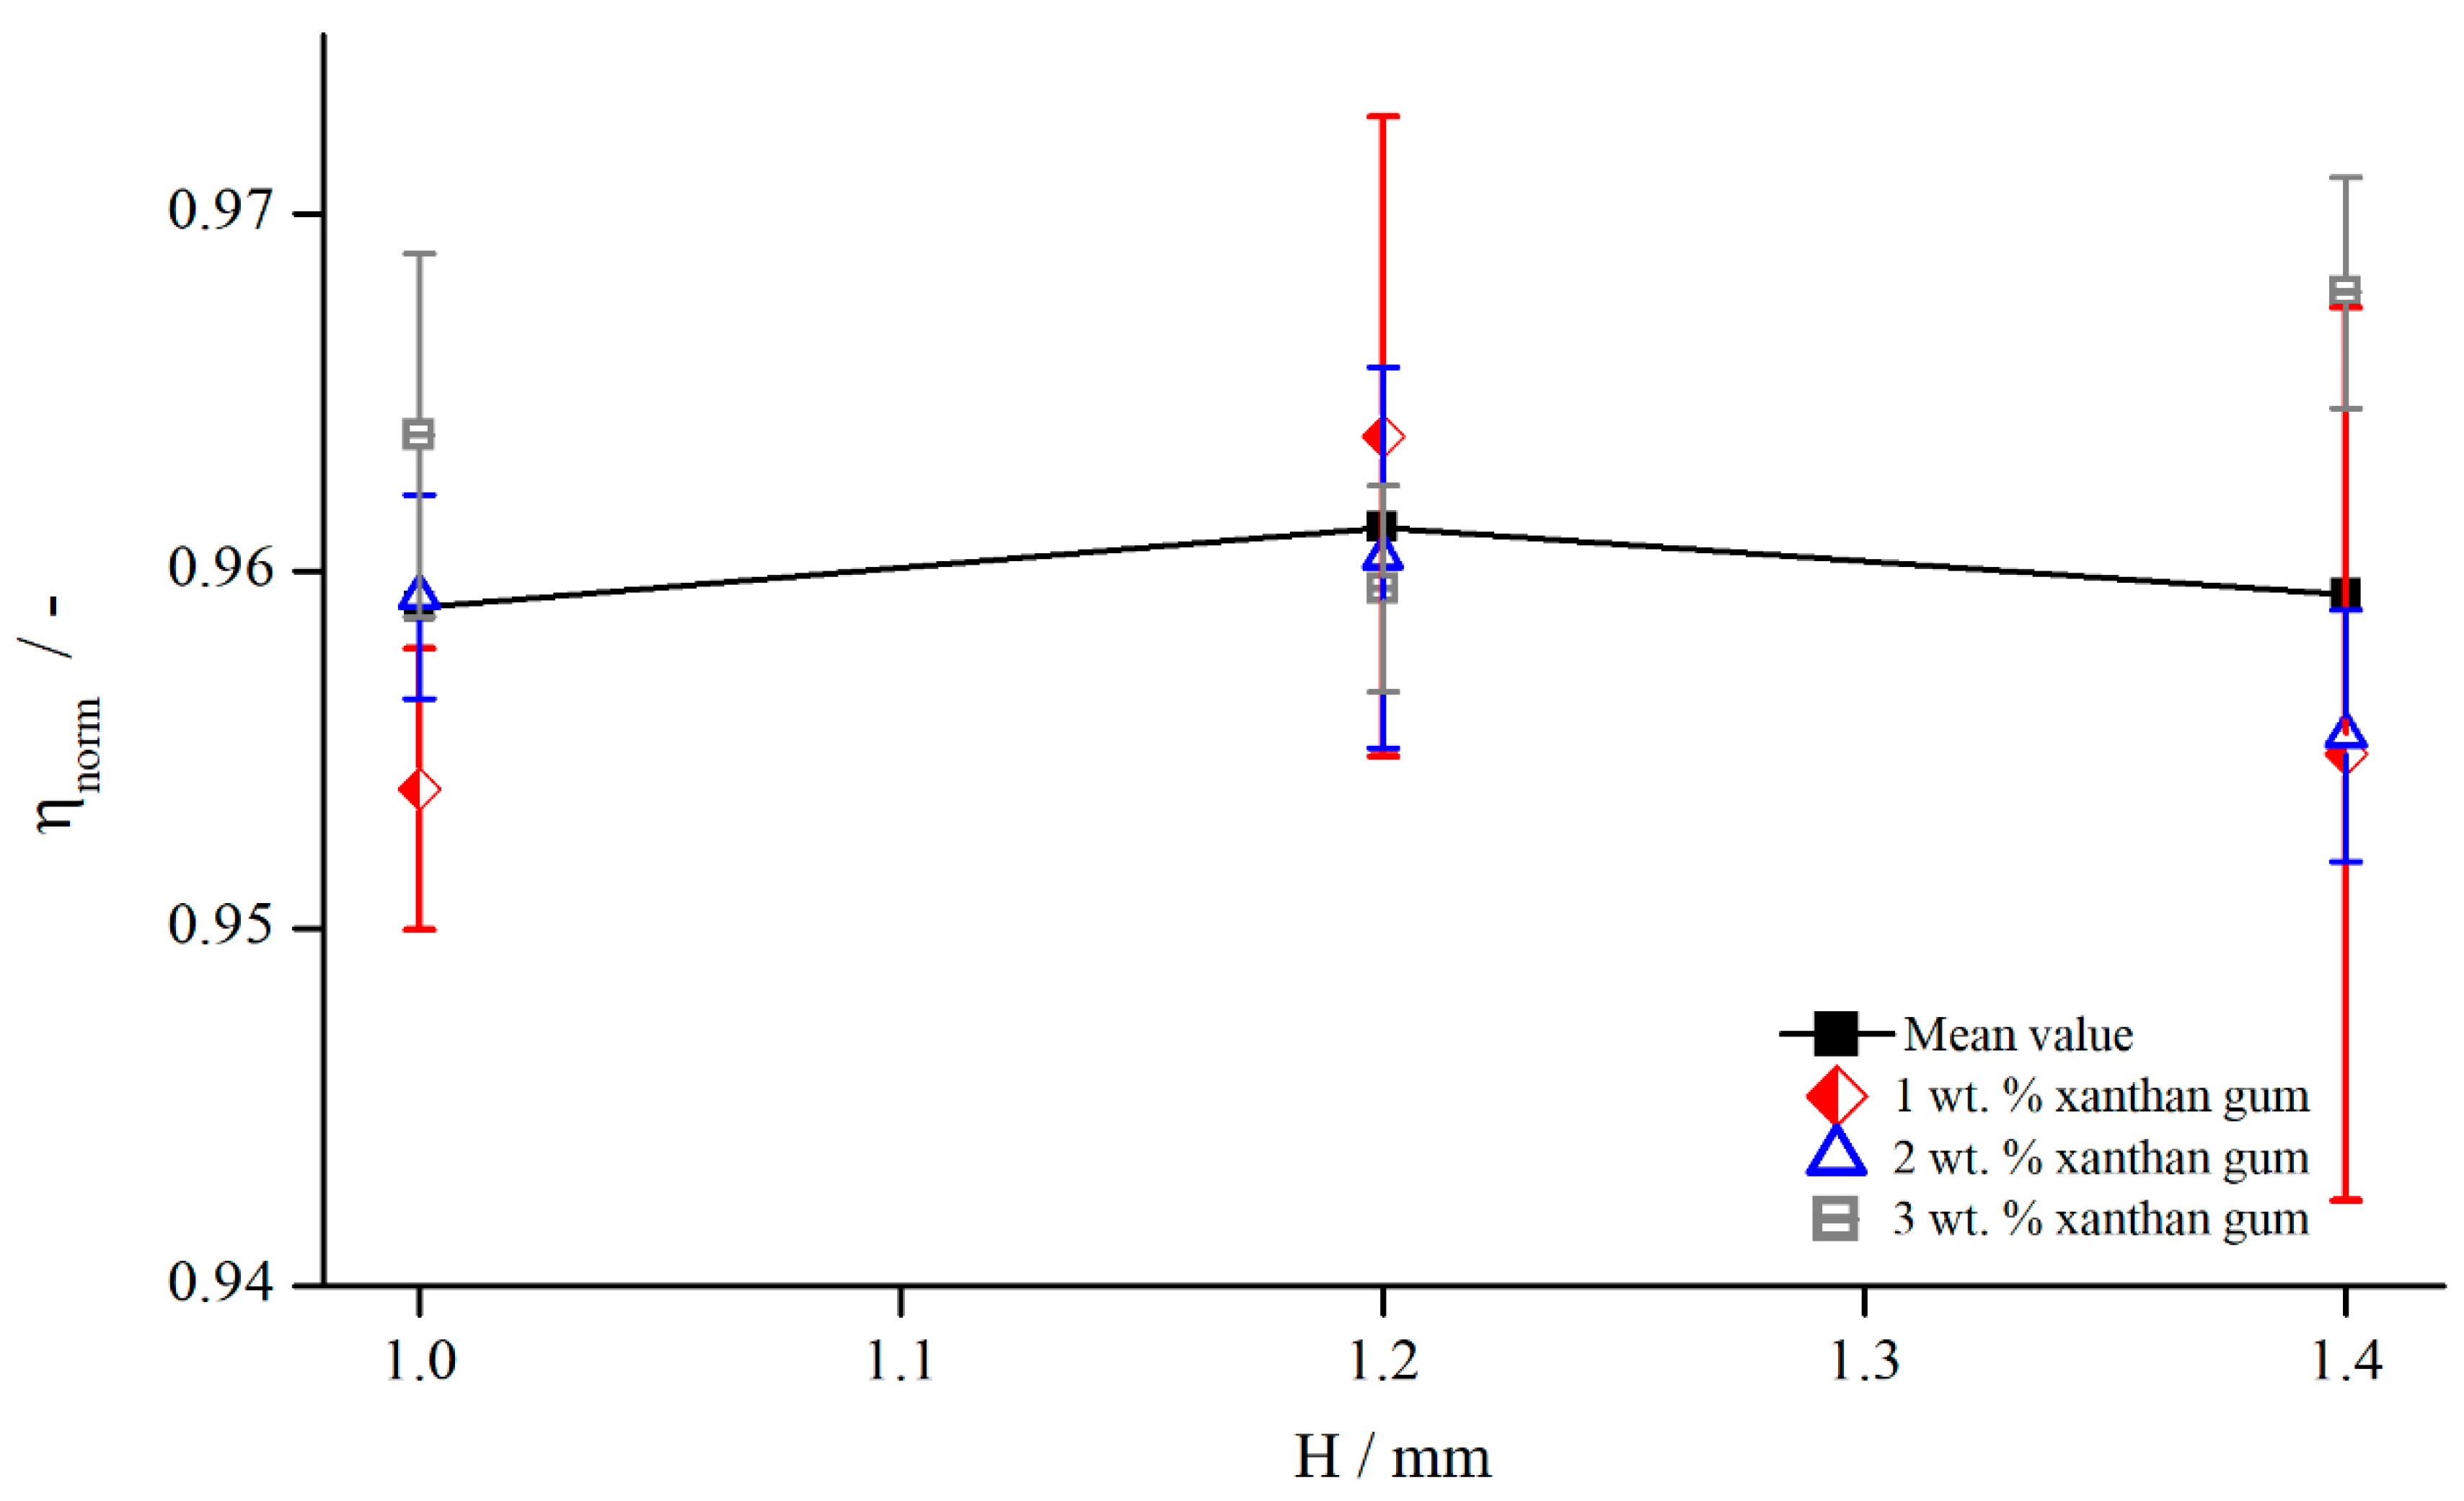
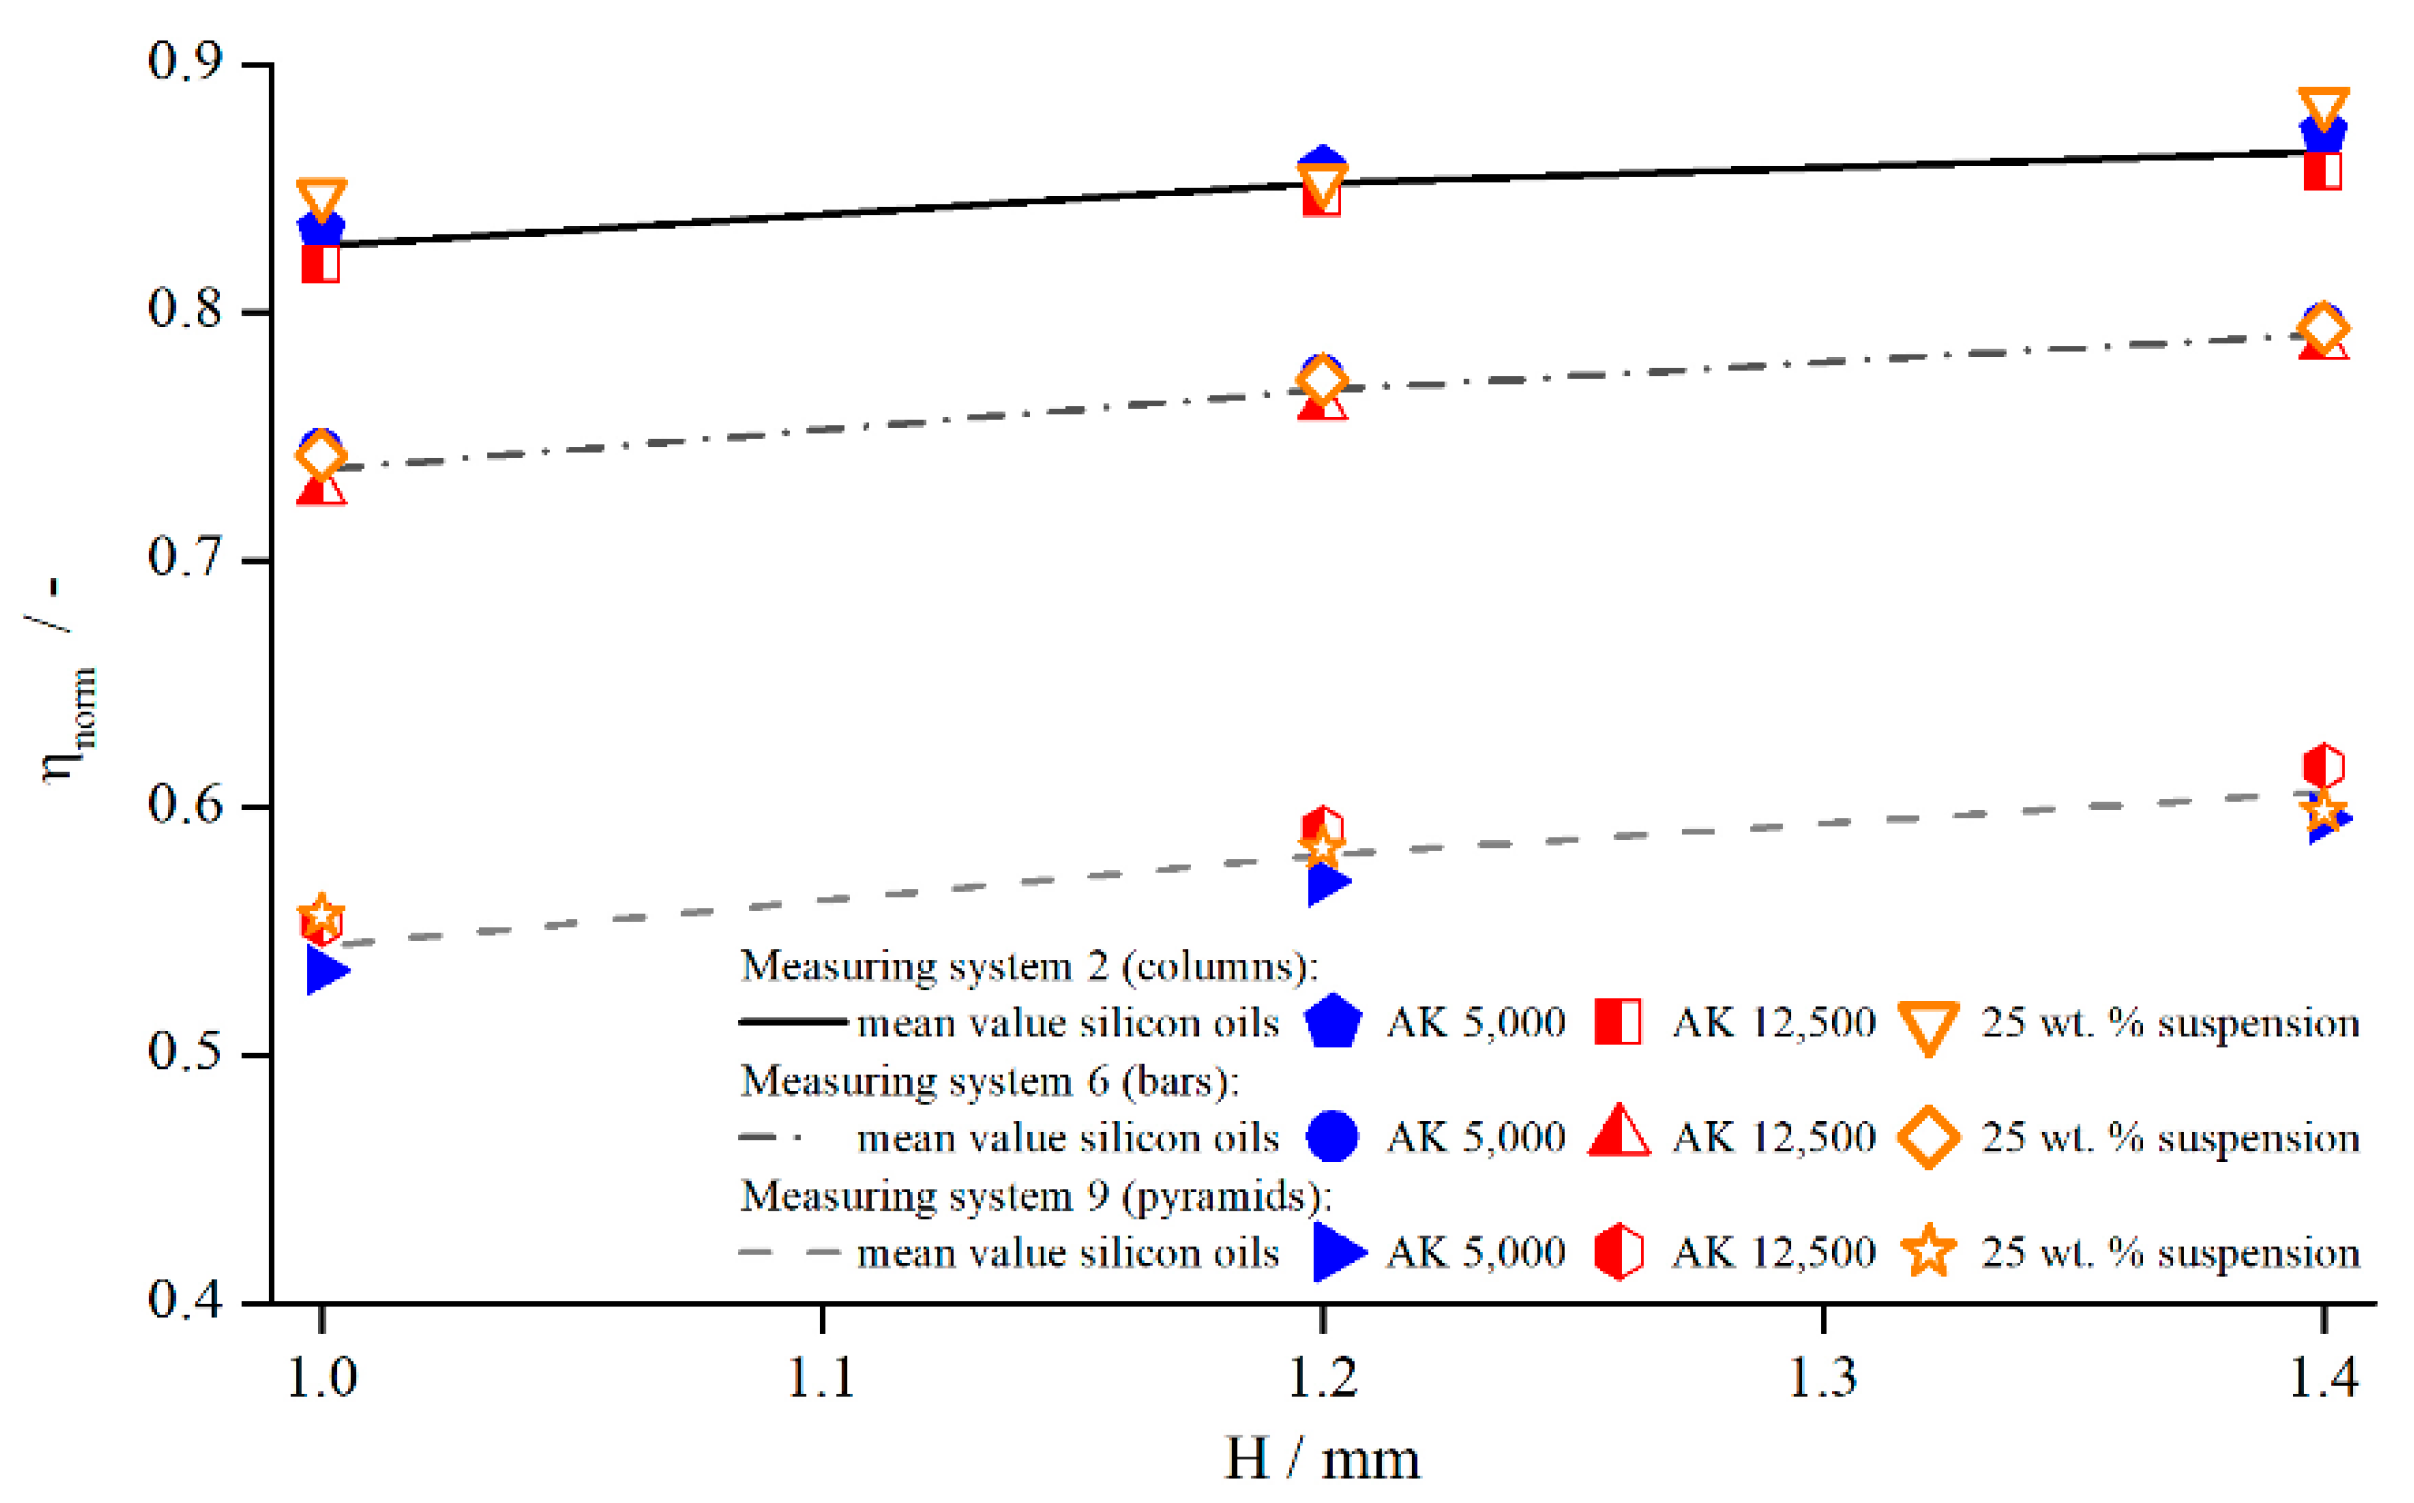
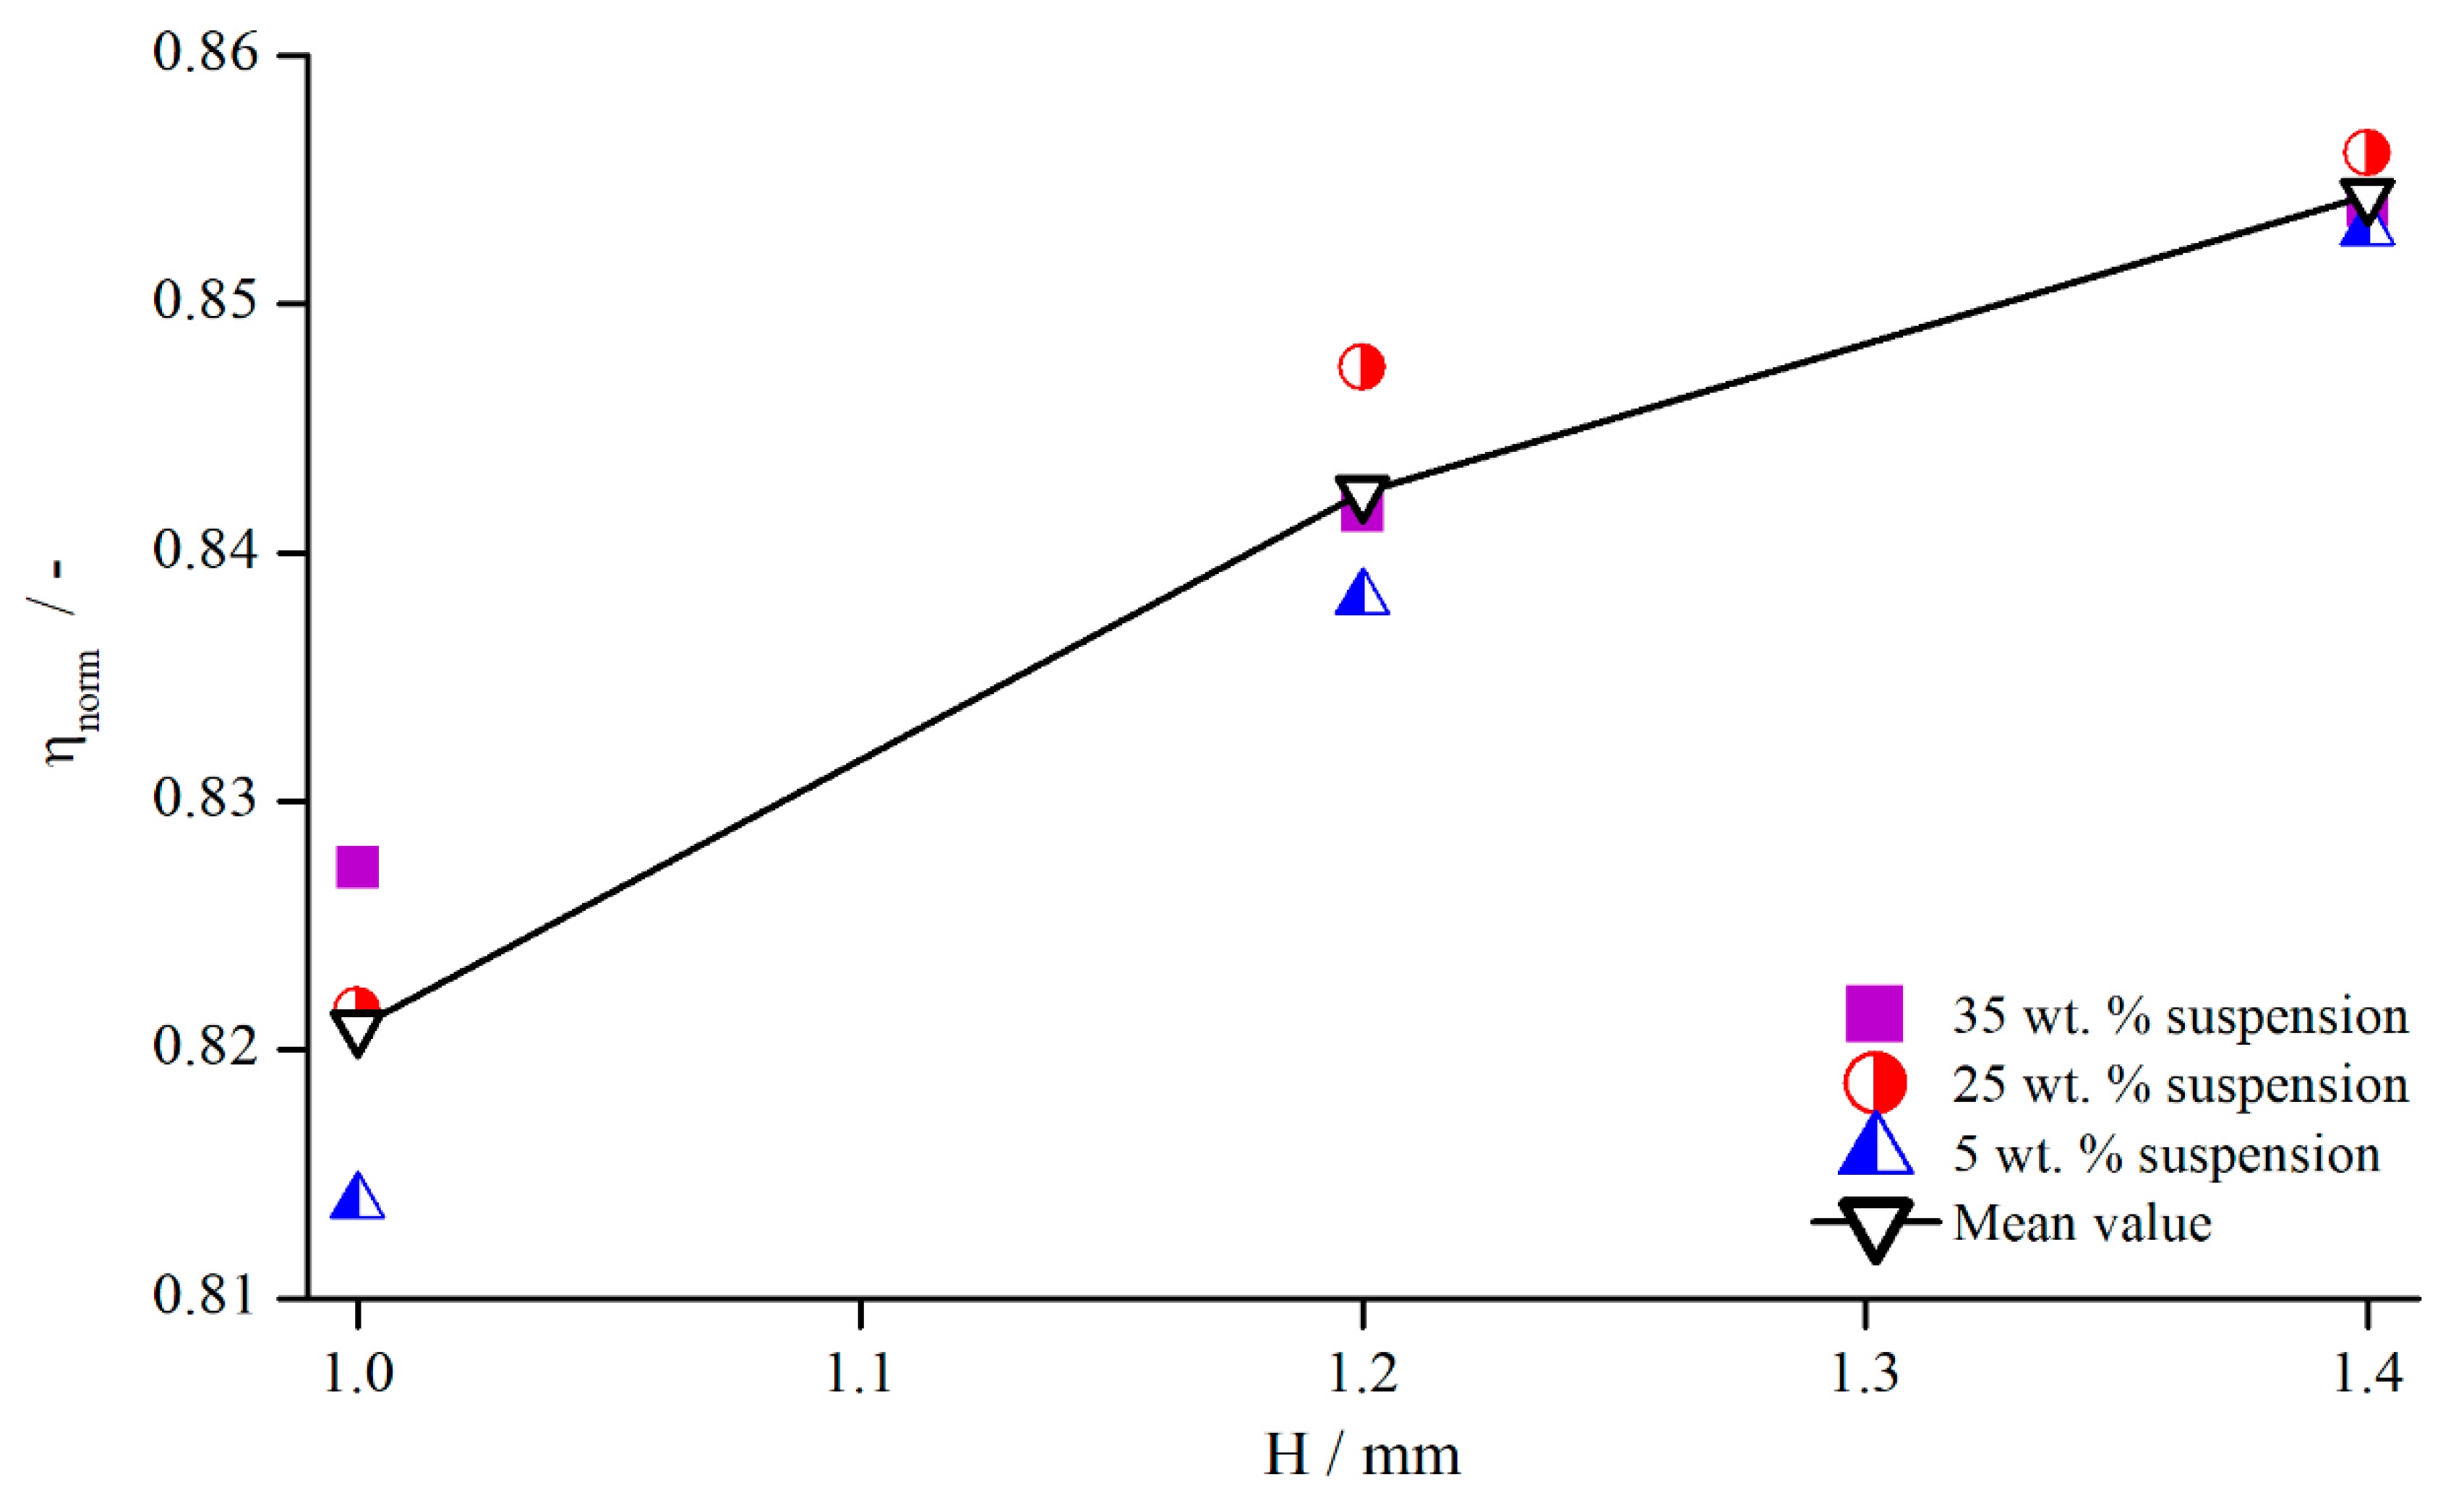
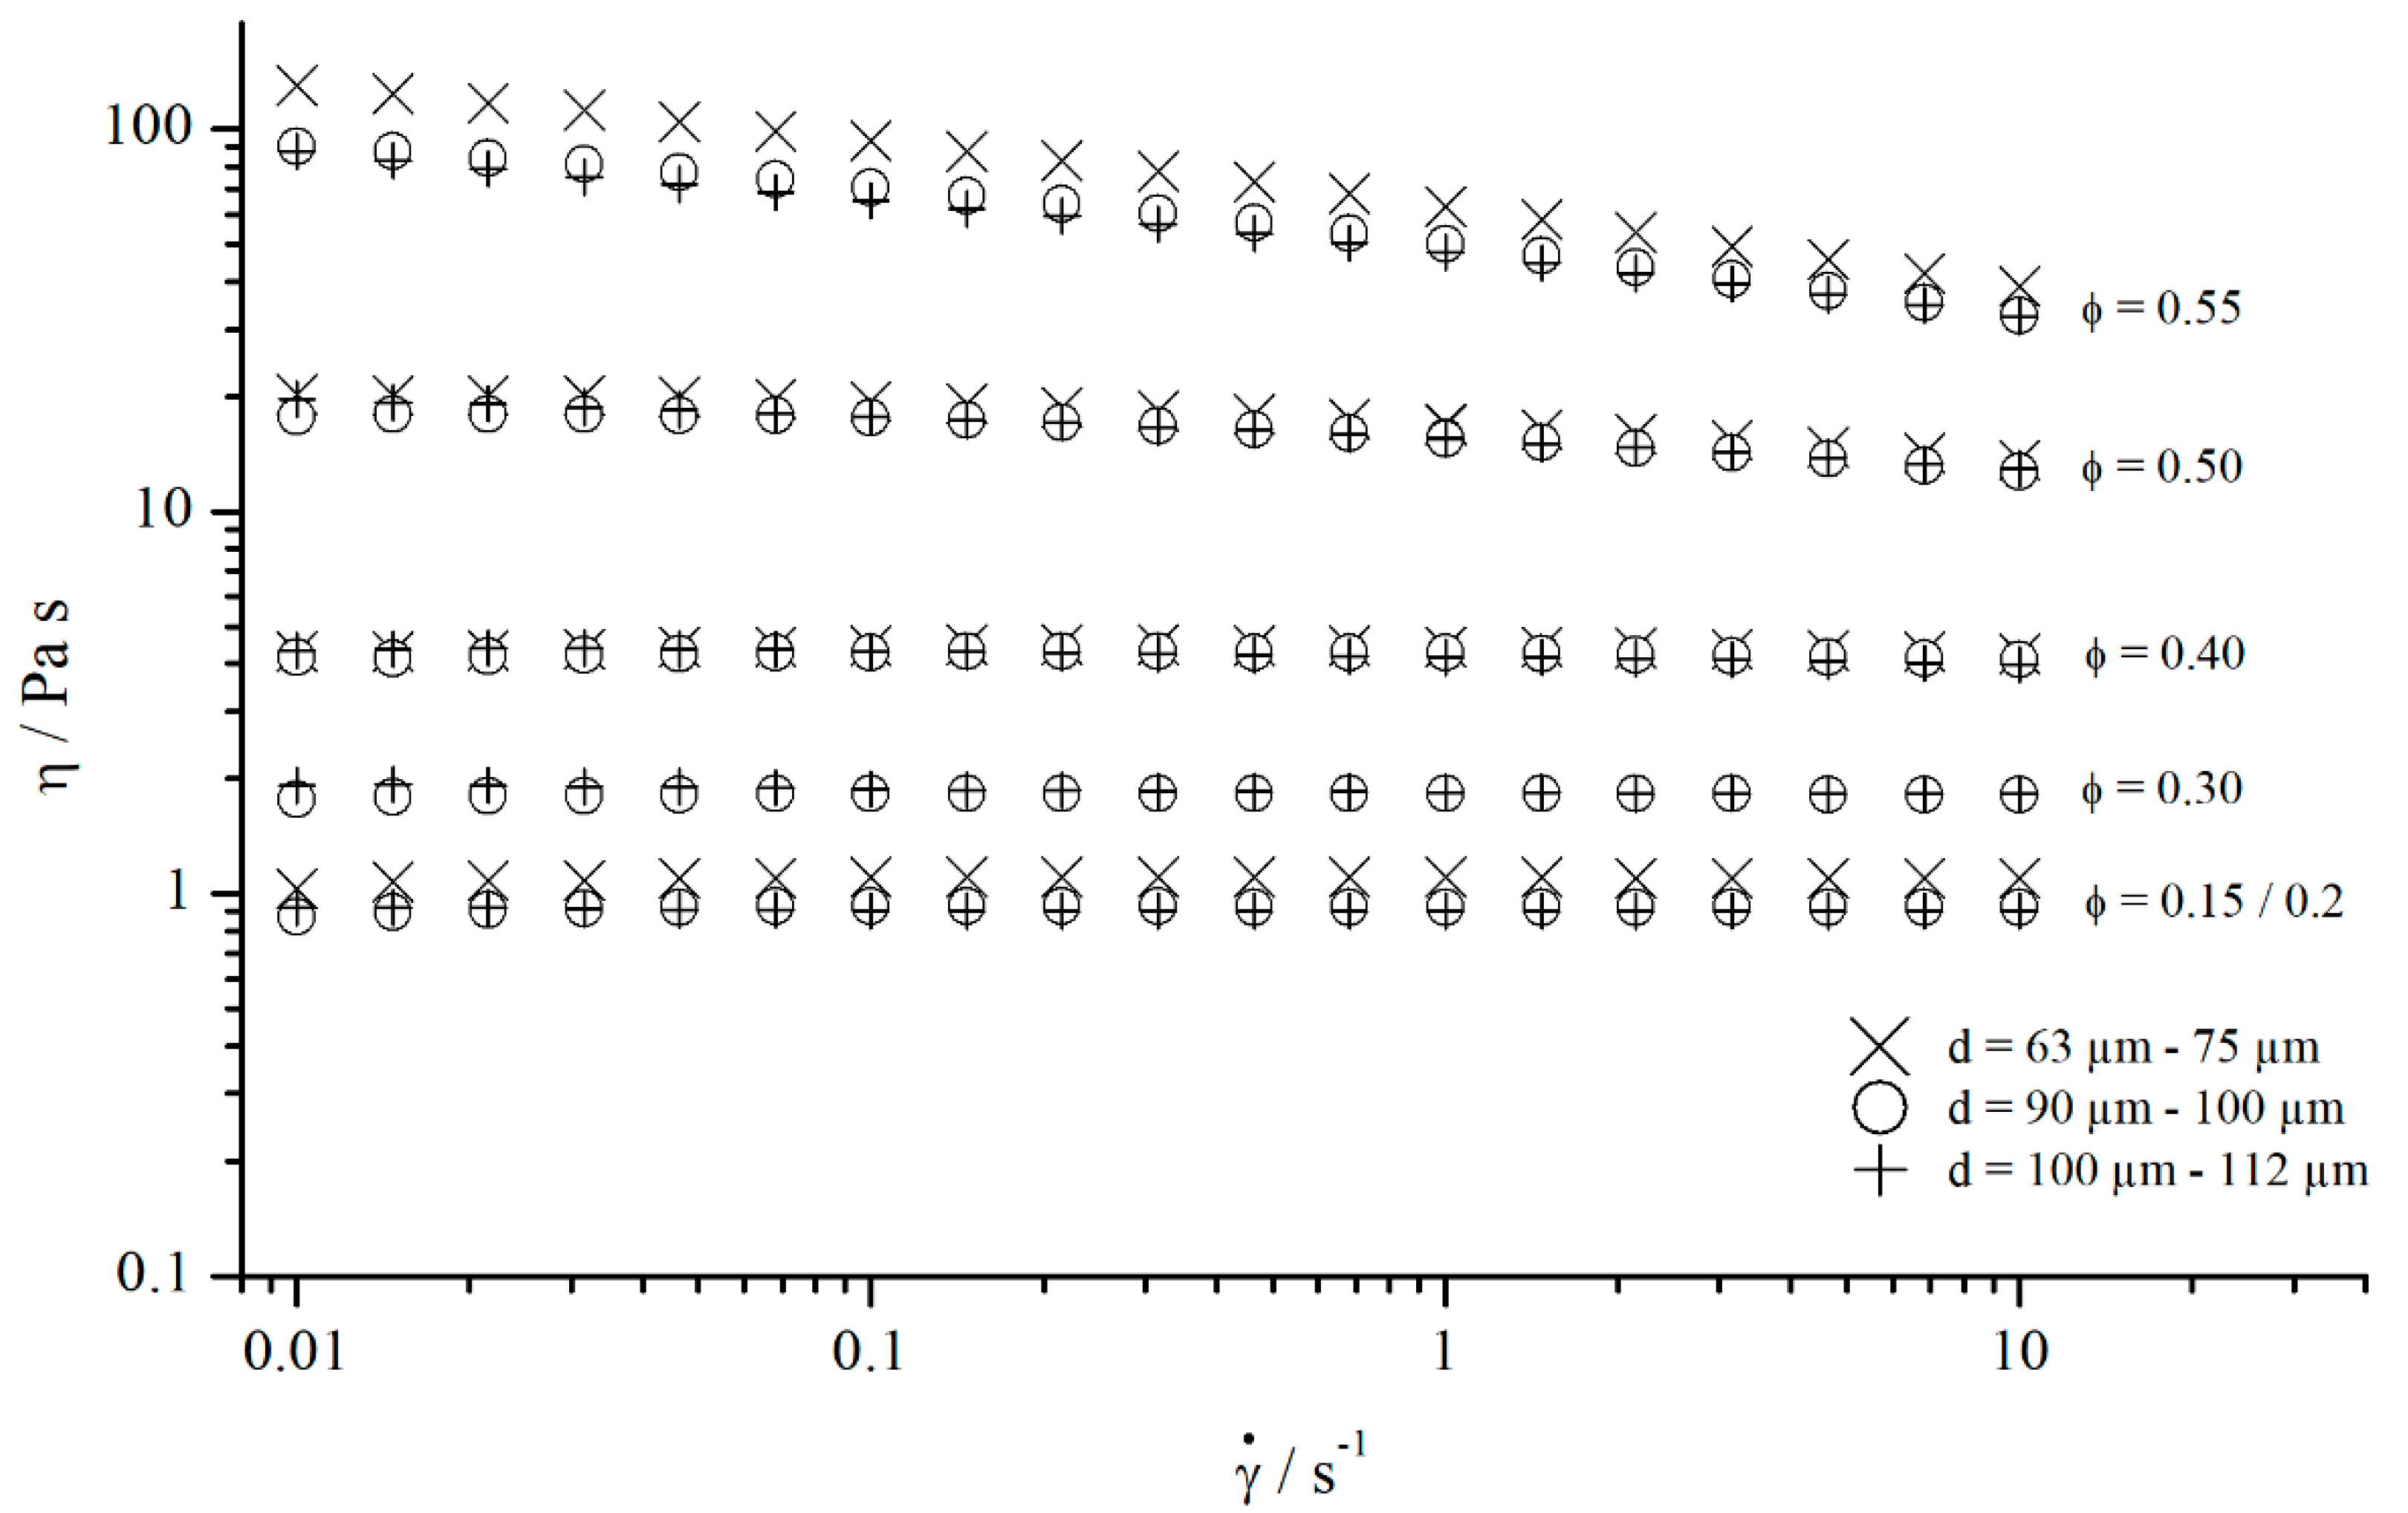
- The normalised viscosities for the investigated concentrations, , , and , do not deviate from the normalised viscosities obtained for silicon oils;
- The normalised viscosity of suspensions shows the same gap dependency as silicon oils;
- For the investigated suspensions, no significant deviation in the effective gap extension from silicon oils could be observed;
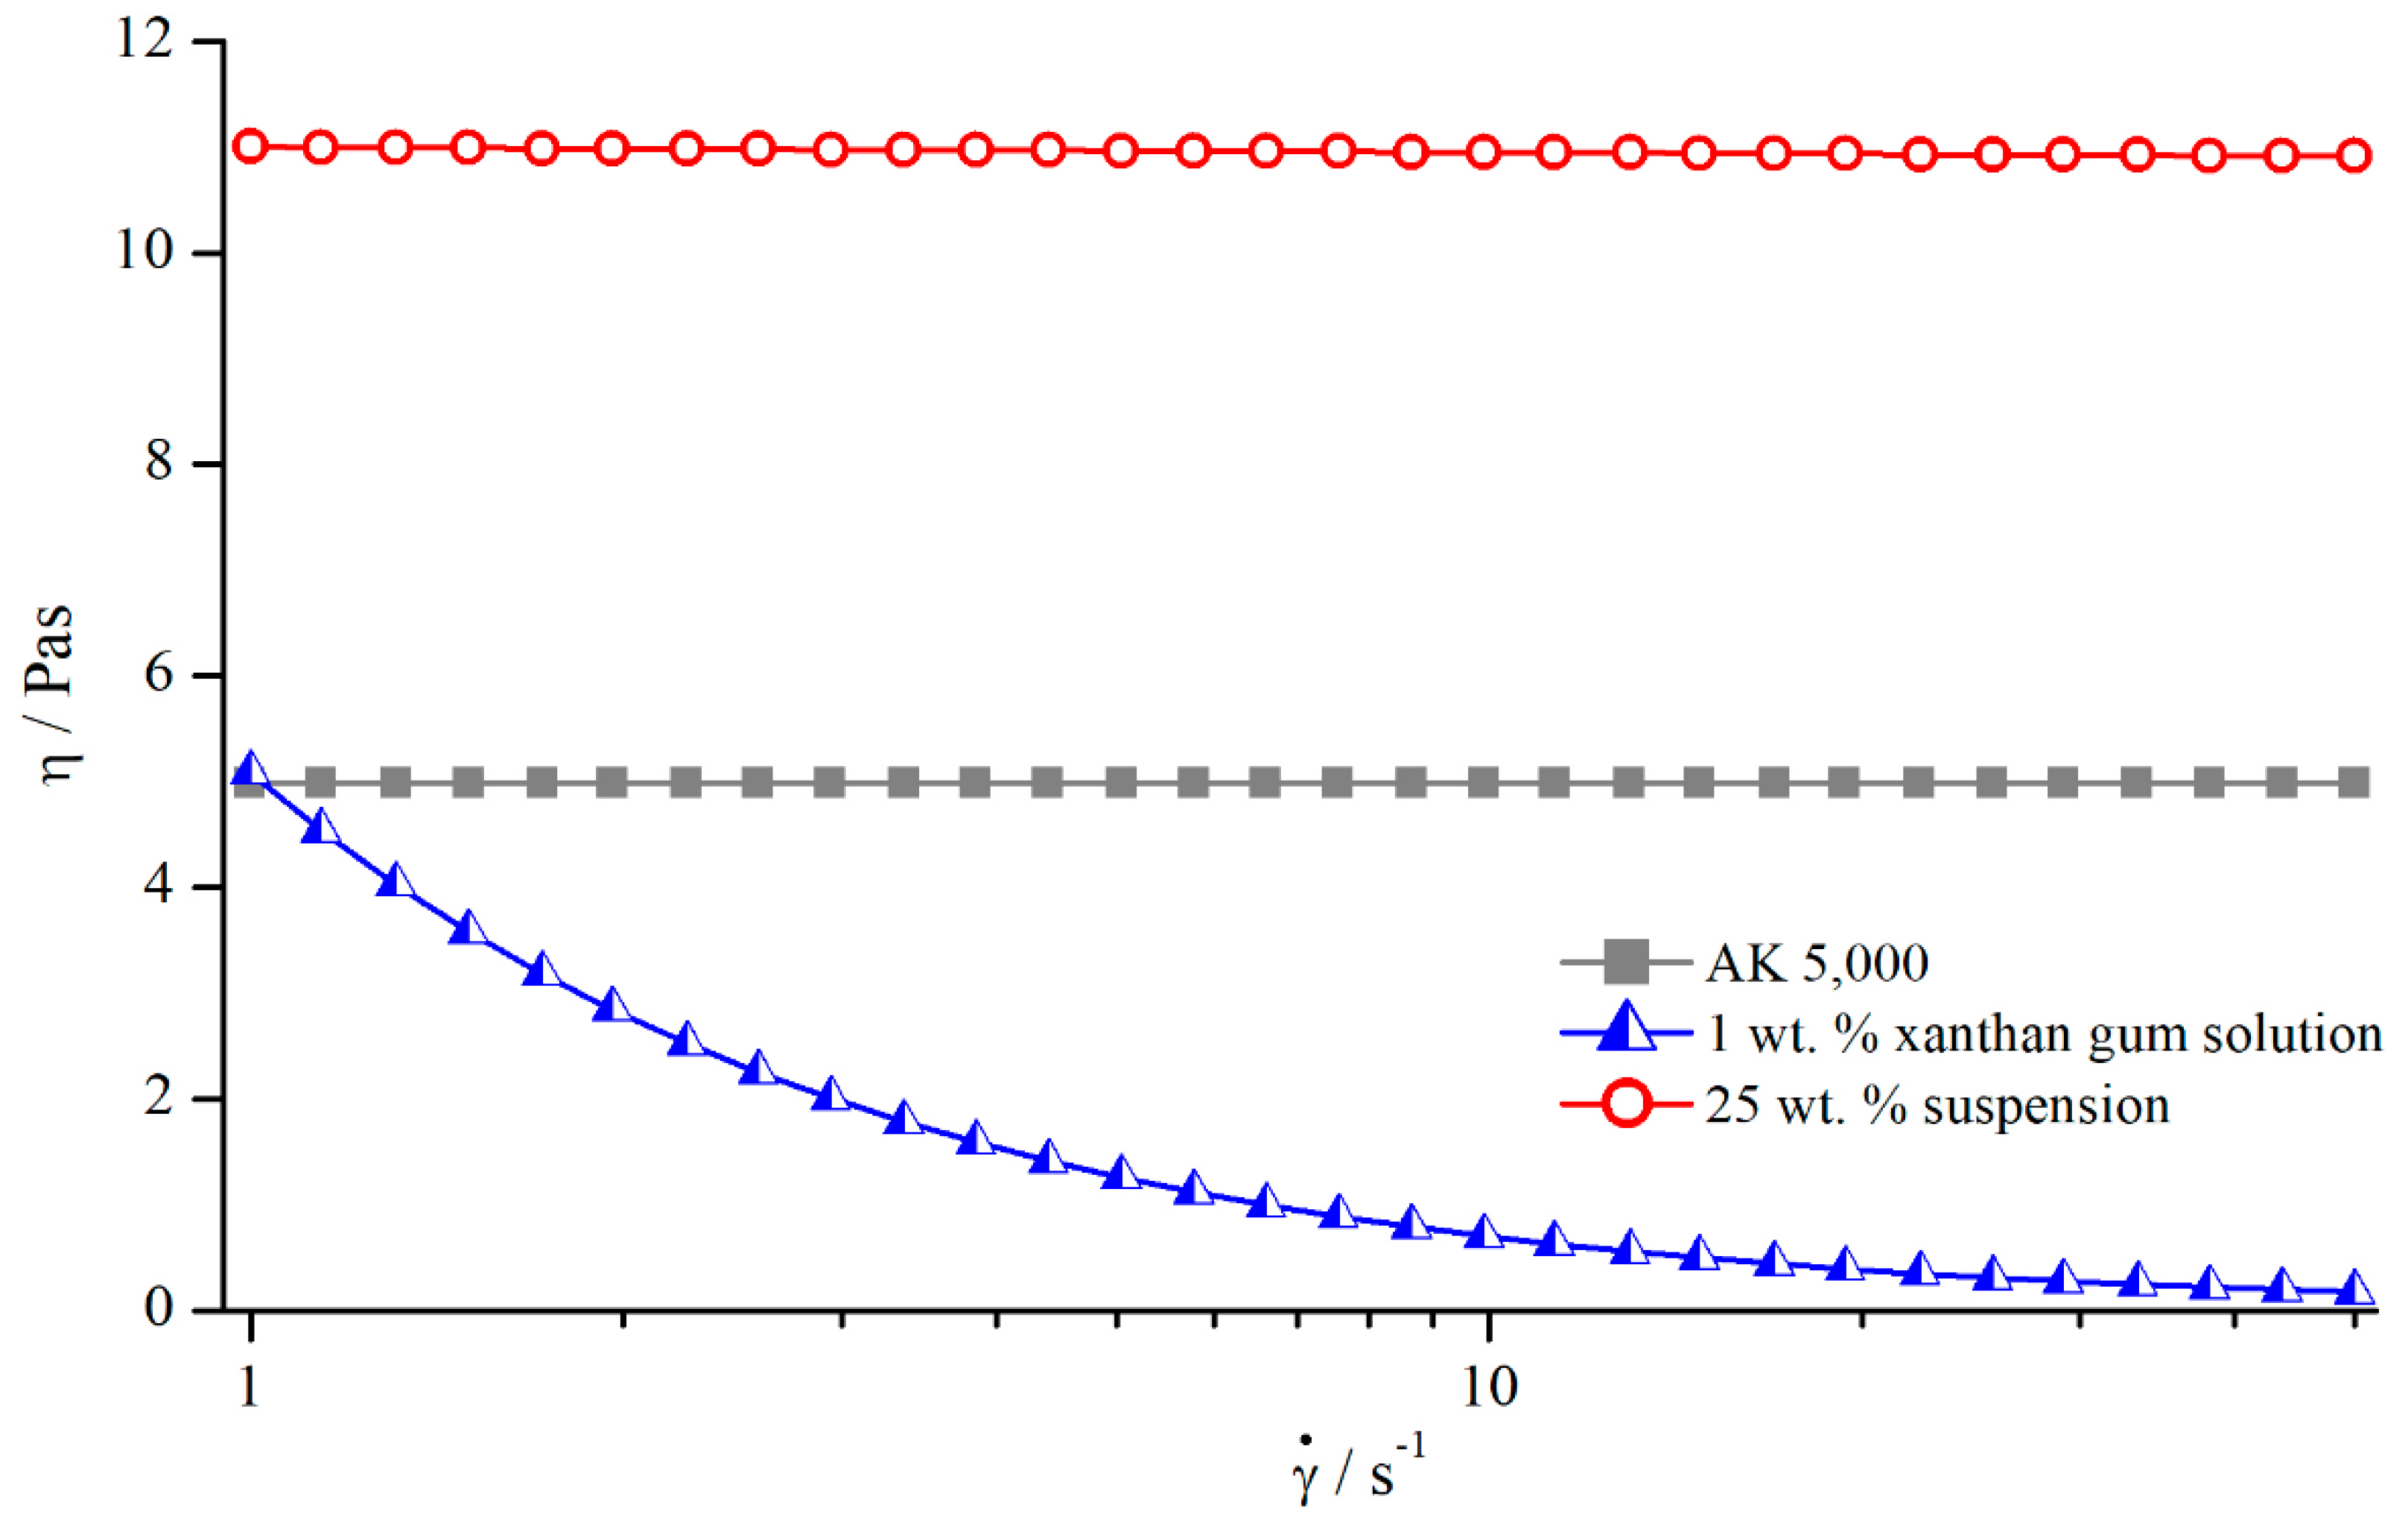
- Since the suspensions behaved only in weakly shear thinning manner, the assumption can be made that the relative influence of structured geometries mainly depends on the flow properties of the investigated materials;
- The viscosity can be corrected using a gap-independent correction function;
- Since the flow behaviour of the suspensions was only weakly shear thinning, the material-independent correction function derived for Newtonian oils could be applied to correct the suspension viscosity values, showing that slight deviations from Newtonian flow behaviour do not pose a problem.
6. Conclusions
Supplementary Materials
Author Contributions
Funding
Conflicts of Interest
References
- Carreau, P.J.; Lavoie, P.A.; Yziquel, F. Rheological properties of concentrated suspensions. In Advances in the Flow and Rheology of Non-Newtonian Fluids; Elsevier: Amsterdam, Netherland, 1999; pp. 1299–1345. ISBN 9780444826794. [Google Scholar]
- Magnin, A.; Piau, J.M. Cone-and-plate rheometry of yield stress fluids. Study of an aqueous gel. J. Non-Newton. Fluid Mech. 1990, 36, 85–108. [Google Scholar] [CrossRef]
- Walls, H.J.; Caines, S.B.; Sanchez, A.M.; Khan, S.A. Yield stress and wall slip phenomena in colloidal silica gels. J. Rheol. 2003, 47, 847–868. [Google Scholar] [CrossRef] [Green Version]
- Roussel, N.; Gram, A. Simulation of Fresh Concrete Flow; Springer: Dordrecht, The Netherlands, 2014; ISBN 978-94-017-8883-0. [Google Scholar]
- Banfill, P.F.G. Rheology of Fresh Cement and Concrete; Taylor & Francis: Abingdon, UK, 1991; ISBN 978-0-203-24017-5. [Google Scholar]
- Banfill, P.F.G.; Beaupre, D.; Chapdelaine, F.; Larrard, F.D.; Domone, P.L.J.; Nachbaur, L.; Sedran, T.; Wallevik, O.; Wallevik, J.E. Comparison of Concrete Rheometers: International Tests at LCPC (Nantes, France) in October, 2000; NISTIR 6819; NIST: Gaithersburg, MD, USA, 2001. [Google Scholar]
- Banfill, P.F.G. Feasibility study of a coaxial cylinders viscometer for mortar. Cem. Concr. Res. 1987, 17, 329–339. [Google Scholar] [CrossRef]
- Beaupre, D.; Chapdelaine, F.; Domone, P.; Koehler, E.; Shen, L.; Sonebi, M.; Struble, L.; Tepke, D.; Wallevik, O.; Wallevik, J.E. Comparison of Concrete Rheometers: International Tests at MB (Cleveland OH, USA) in May, 2003; NISTIR 7154; NIST: Gaithersburg, MD, USA, 2004. [Google Scholar]
- Roussel, N. Understanding the Rheology of Concrete; Woodhead Publishing: Cambridge, UK, 2012; ISBN 978-0-85709-028-7. [Google Scholar]
- Kalyon, D.M. Apparent slip and viscoplasticity of concentrated suspensions. J. Rheol. 2005, 49, 621–640. [Google Scholar] [CrossRef]
- Barnes, H.A. A review of the slip (wall depletion) of polymer solutions, emulsions and particle suspensions in viscometers: Its cause, character, and cure. J. Non-Newton. Fluid Mech. 1995, 56, 221–251. [Google Scholar] [CrossRef]
- Hartman Kok, P.J.A.; Kazarian, S.G.; Lawrence, C.J.; Briscoe, B.J. Near-wall particle depletion in a flowing colloidal suspension. J. Rheol. 2002, 46, 481–493. [Google Scholar] [CrossRef]
- Macosko, C.W. Rheology, Principles, Measurements and Applications by Christopher W. Macosko; Wiley-VCH: Chichester, UK, 1994; ISBN 978-0471185758. [Google Scholar]
- Jesinghausen, S. Rheo-PIV Nichtkolloidaler Suspensionen. Strukturelle Untersuchungen der Strömungsentwicklung in Schlitzdüsen mit Fokus auf Wandgleiten, 1st ed.; Auflage Shaker: Herzogenrath, Germany, 2017; ISBN 978-3-8440-5600-6. [Google Scholar]
- Mooney, M. Explicit Formulas for Slip and Fluidity. J. Rheol. 1931, 2, 210–222. [Google Scholar] [CrossRef]
- Yoshimura, A.; Prud’homme, R.K. Wall Slip Corrections for Couette and Parallel Disk Viscometers. J. Rheol. 1988, 32, 53–67. [Google Scholar] [CrossRef]
- Kiljański, T. A method for correction of the wall-slip effect in a Couette rheometer. Rheol. Acta 1989, 28, 61–64. [Google Scholar] [CrossRef]
- Nickerson, C.S.; Kornfield, J.A. A “cleat” geometry for suppressing wall slip. J. Rheol. 2005, 49, 865–874. [Google Scholar] [CrossRef]
- Beavers, G.S.; Joseph, D.D. Boundary conditions at a naturally permeable wall. J. Fluid Mech. 1967, 30, 197–207. [Google Scholar] [CrossRef]
- Ferraris, C.F.; Geiker, M.; Martys, N.S.; Muzzatti, N. Parallel-plate Rheometer Calibration Using Oil and Computer Simulation. ACT 2007, 5, 363–371. [Google Scholar] [CrossRef] [Green Version]
- Carotenuto, C.; Minale, M. On the use of rough geometries in rheometry. J. Non-Newton. Fluid Mech. 2013, 198, 39–47. [Google Scholar] [CrossRef]
- Mezger, T. Das Rheologie-Handbuch. In Für Anwender von Rotations- und Oszillations-Rheometern, 4th ed.; Aufl. Vincentz Network: Hannover, Germany, 2012; ISBN 978-3-86630-863-3. [Google Scholar]
- Pahl, M.; Gleißle, W.; Laun, H.-M. Praktische Rheologie der Kunststoffe und Elastomere; VDI-Verlag: Düsseldorf, Germany, 1991; ISBN 3-18-234155-3. [Google Scholar]
- Coussot, P. Rheophysics. Matter in All its States; Springer: Cham, Germany, 2014; ISBN 978-3-319-06147-4. [Google Scholar]
- Wierschem, A.; Dakhil, H. Measuring low viscosities and high shear rates with a rotational rheometer in a thin-gap parallel-disk configuration. Appl. Rheol. 2014, 24, 26–31. [Google Scholar] [CrossRef]
- Davies, G.A.; Stokes, J.R. On the gap error in parallel plate rheometry that arises from the presence of air when zeroing the gap. J. Rheol. 2005, 49, 919–922. [Google Scholar] [CrossRef]


| Measuring System No. | ||
|---|---|---|
| 0.3 | 0.6 | |
| 0.5 | 1.0 | |
| 0.7 | 1.4 | |
| 1.0 | 2.0 |
| Measuring System No. | ||
|---|---|---|
| 5 | 0.1 | 1.0 |
| 6 | 0.5 | 0.5 |
| 7 | 0.5 | 0.8 |
| 8 | 0.5 | 1.0 |
| 9 | 0.5 | 1.2 |
| 10 | 0.7 | 1.0 |
| 11 | 1.0 | 1.0 |
| Measuring System No. | ||
|---|---|---|
| 12 | 0.3 | 20 |
| 13 | 0.5 | 20 |
| 14 | 0.7 | 20 |
| 15 | 1.0 | 20 |
| 16 | 1.0 | 19 |
| 17 | 1.0 | 18 |
| 18 | 1.0 | 16 |
| Measuring System | |||
|---|---|---|---|
| Silicon Oil AK 5000 | Silicon Oil AK 12,500 | (AK 5000) | |
| 1 (pyramids) | |||
| 4 (pyramids) | |||
| 5 (pyramids) | |||
| 8 (columns) | |||
| 12 (bars) | |||
| 17 (bars) | |||
| AK 5000 | AK 12,500 | |||
|---|---|---|---|---|
© 2020 by the authors. Licensee MDPI, Basel, Switzerland. This article is an open access article distributed under the terms and conditions of the Creative Commons Attribution (CC BY) license (http://creativecommons.org/licenses/by/4.0/).
Share and Cite
Pawelczyk, S.; Kniepkamp, M.; Jesinghausen, S.; Schmid, H.-J. Absolute Rheological Measurements of Model Suspensions: Influence and Correction of Wall Slip Prevention Measures. Materials 2020, 13, 467. https://0-doi-org.brum.beds.ac.uk/10.3390/ma13020467
Pawelczyk S, Kniepkamp M, Jesinghausen S, Schmid H-J. Absolute Rheological Measurements of Model Suspensions: Influence and Correction of Wall Slip Prevention Measures. Materials. 2020; 13(2):467. https://0-doi-org.brum.beds.ac.uk/10.3390/ma13020467
Chicago/Turabian StylePawelczyk, Sebastian, Marieluise Kniepkamp, Steffen Jesinghausen, and Hans-Joachim Schmid. 2020. "Absolute Rheological Measurements of Model Suspensions: Influence and Correction of Wall Slip Prevention Measures" Materials 13, no. 2: 467. https://0-doi-org.brum.beds.ac.uk/10.3390/ma13020467