Effect of Wall Thickness on Stress–Strain Response and Buckling Behavior of Hollow-Cylinder Rubber Fenders


Abstract
:1. Introduction
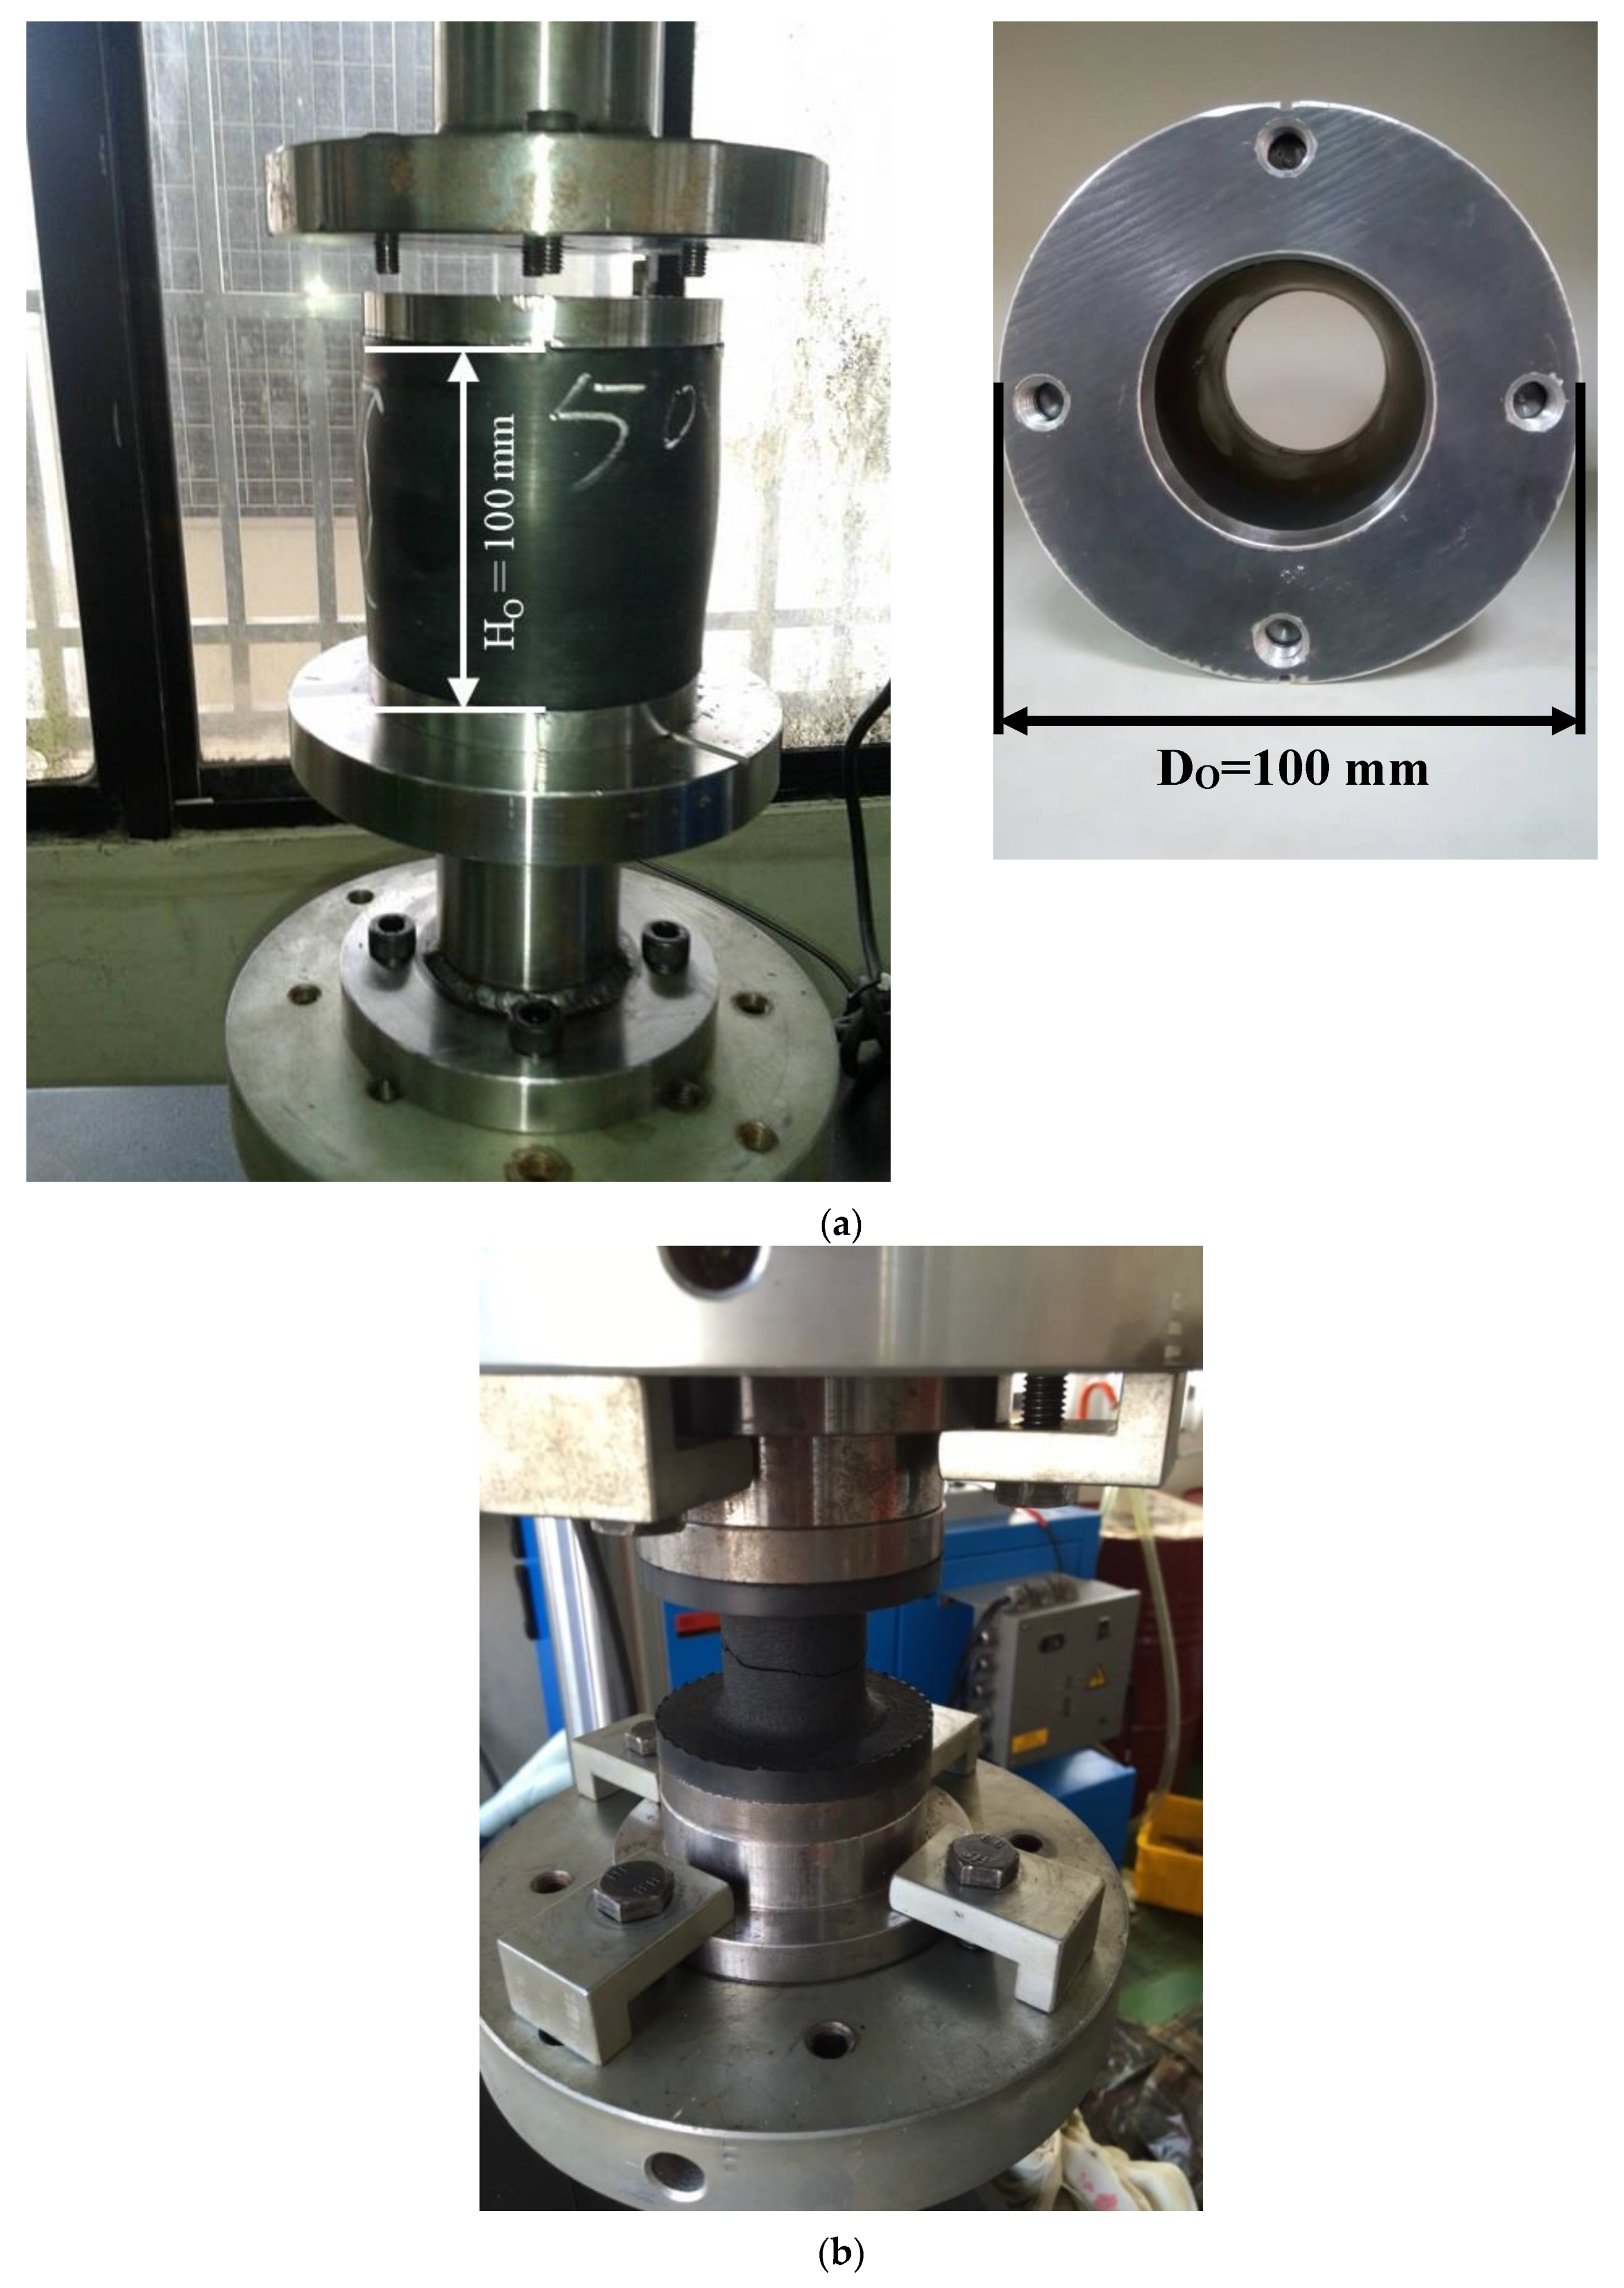
2. Experiment
3. Test Results and Observations
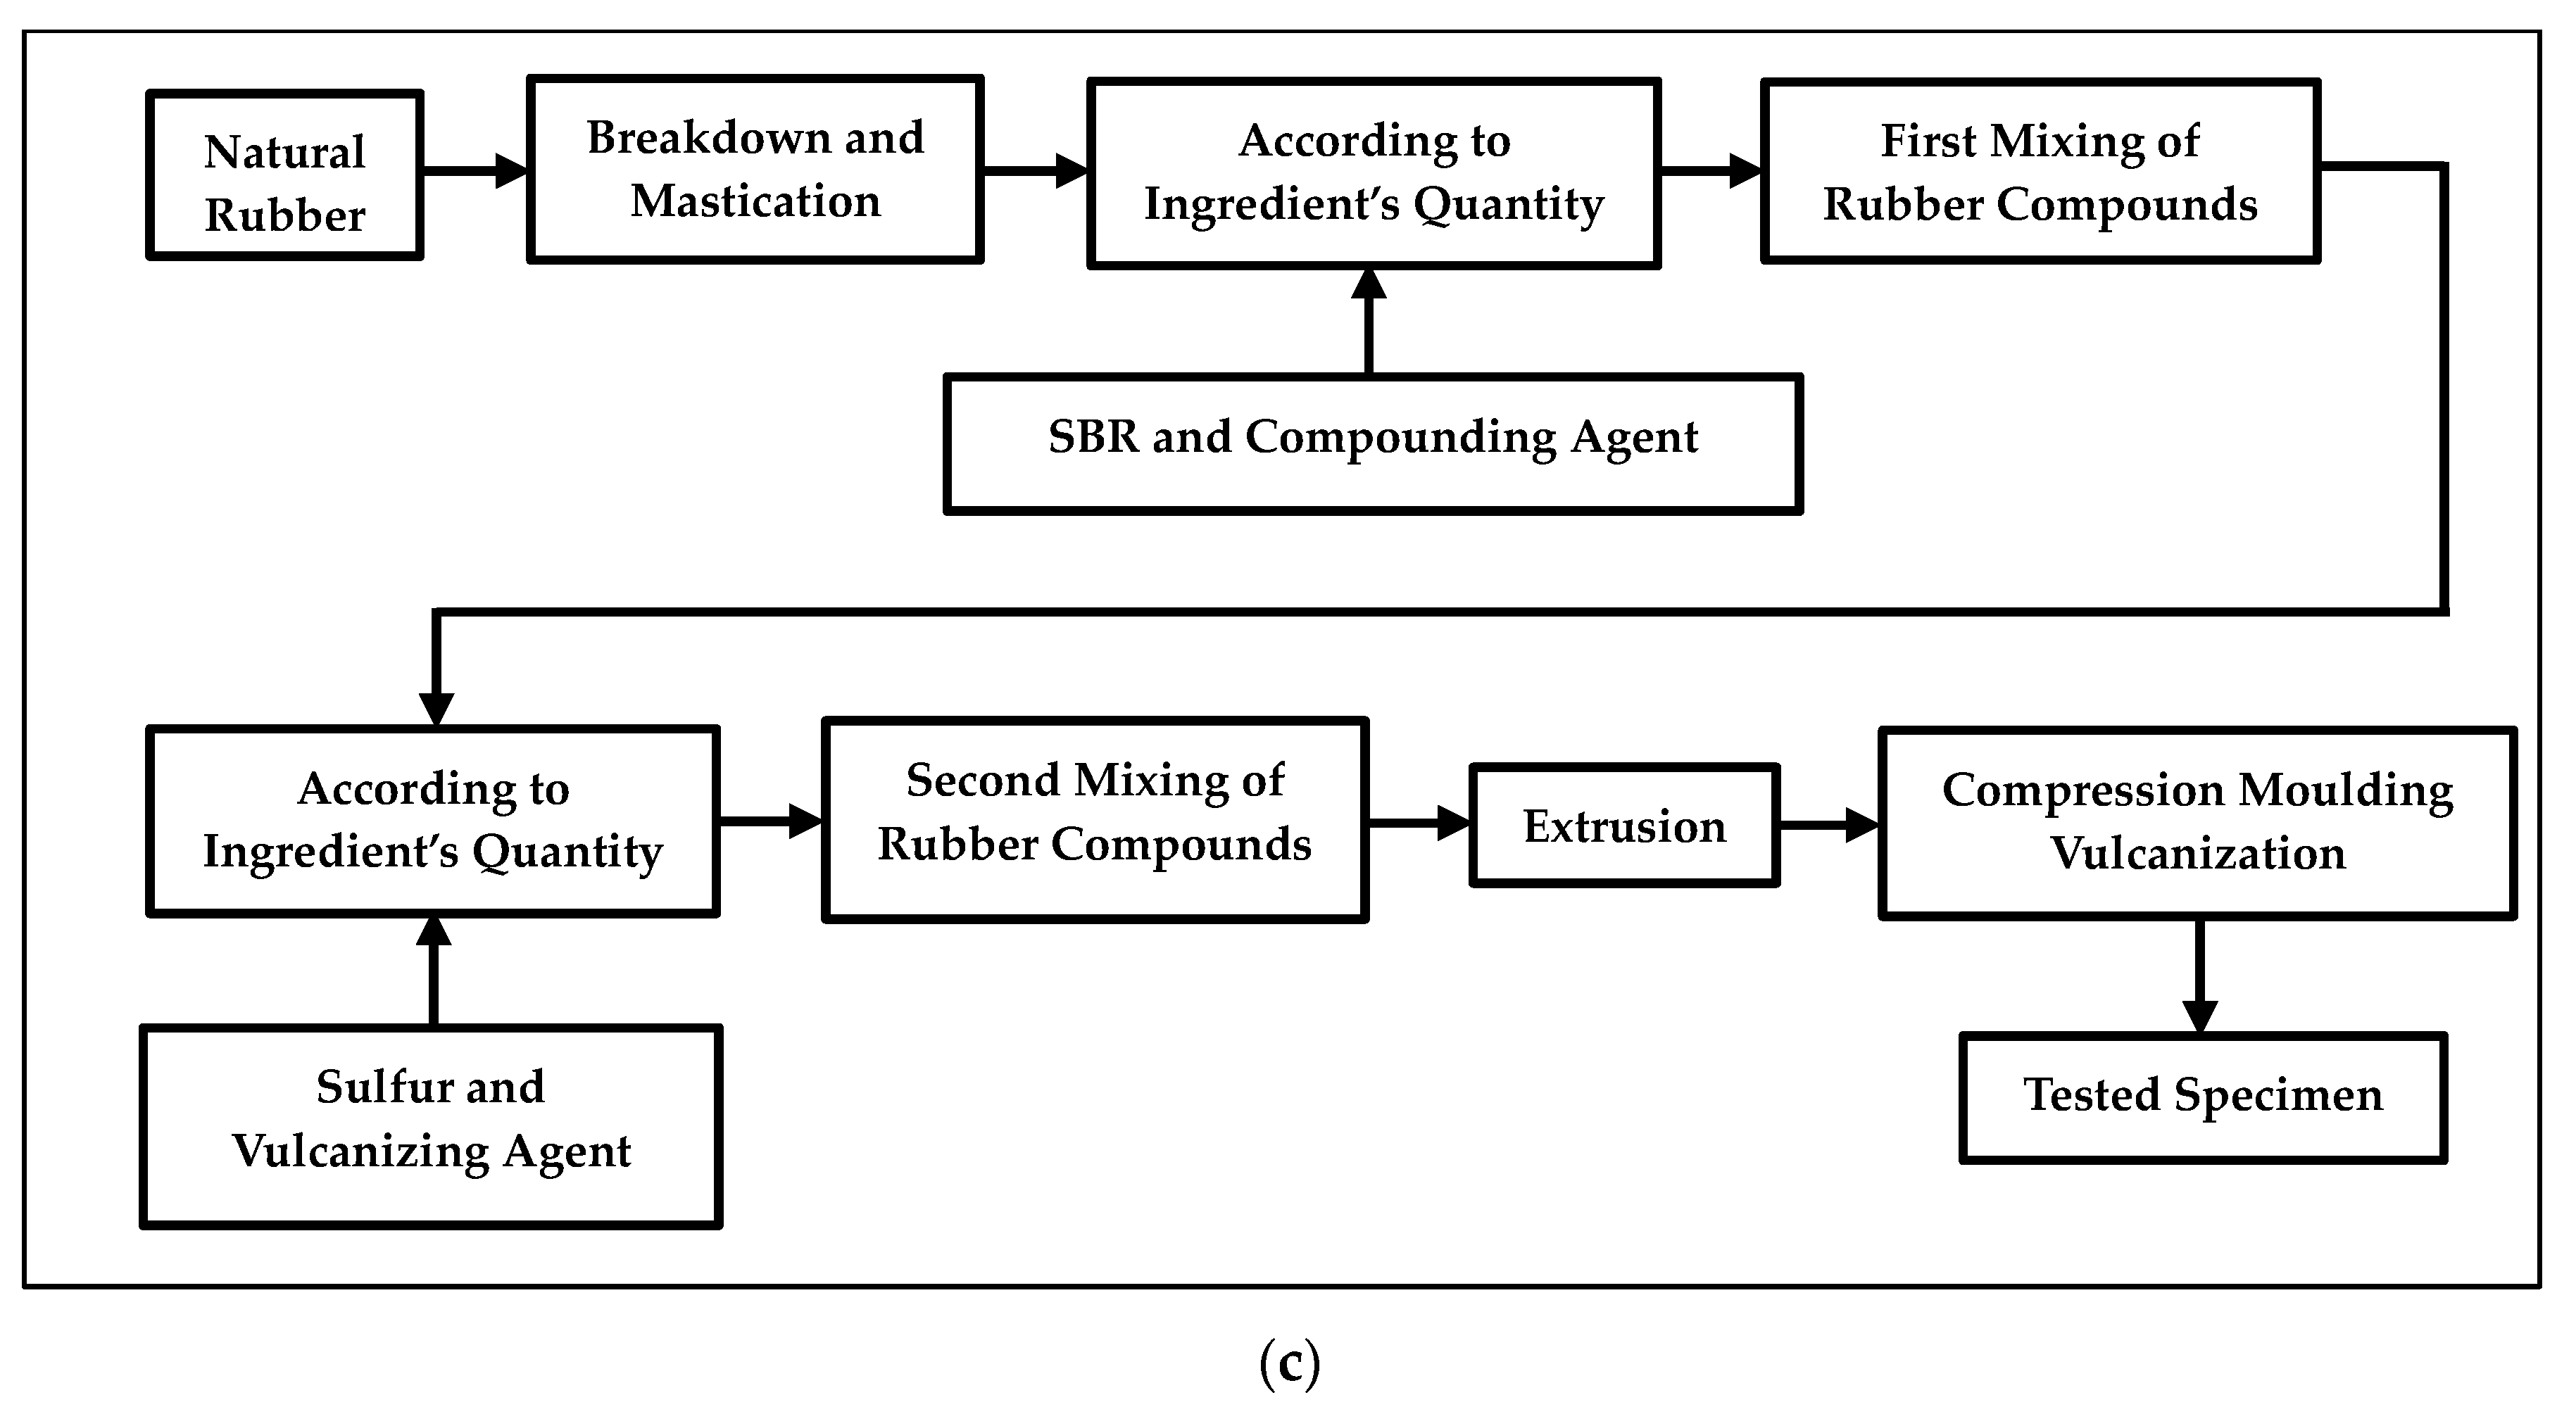
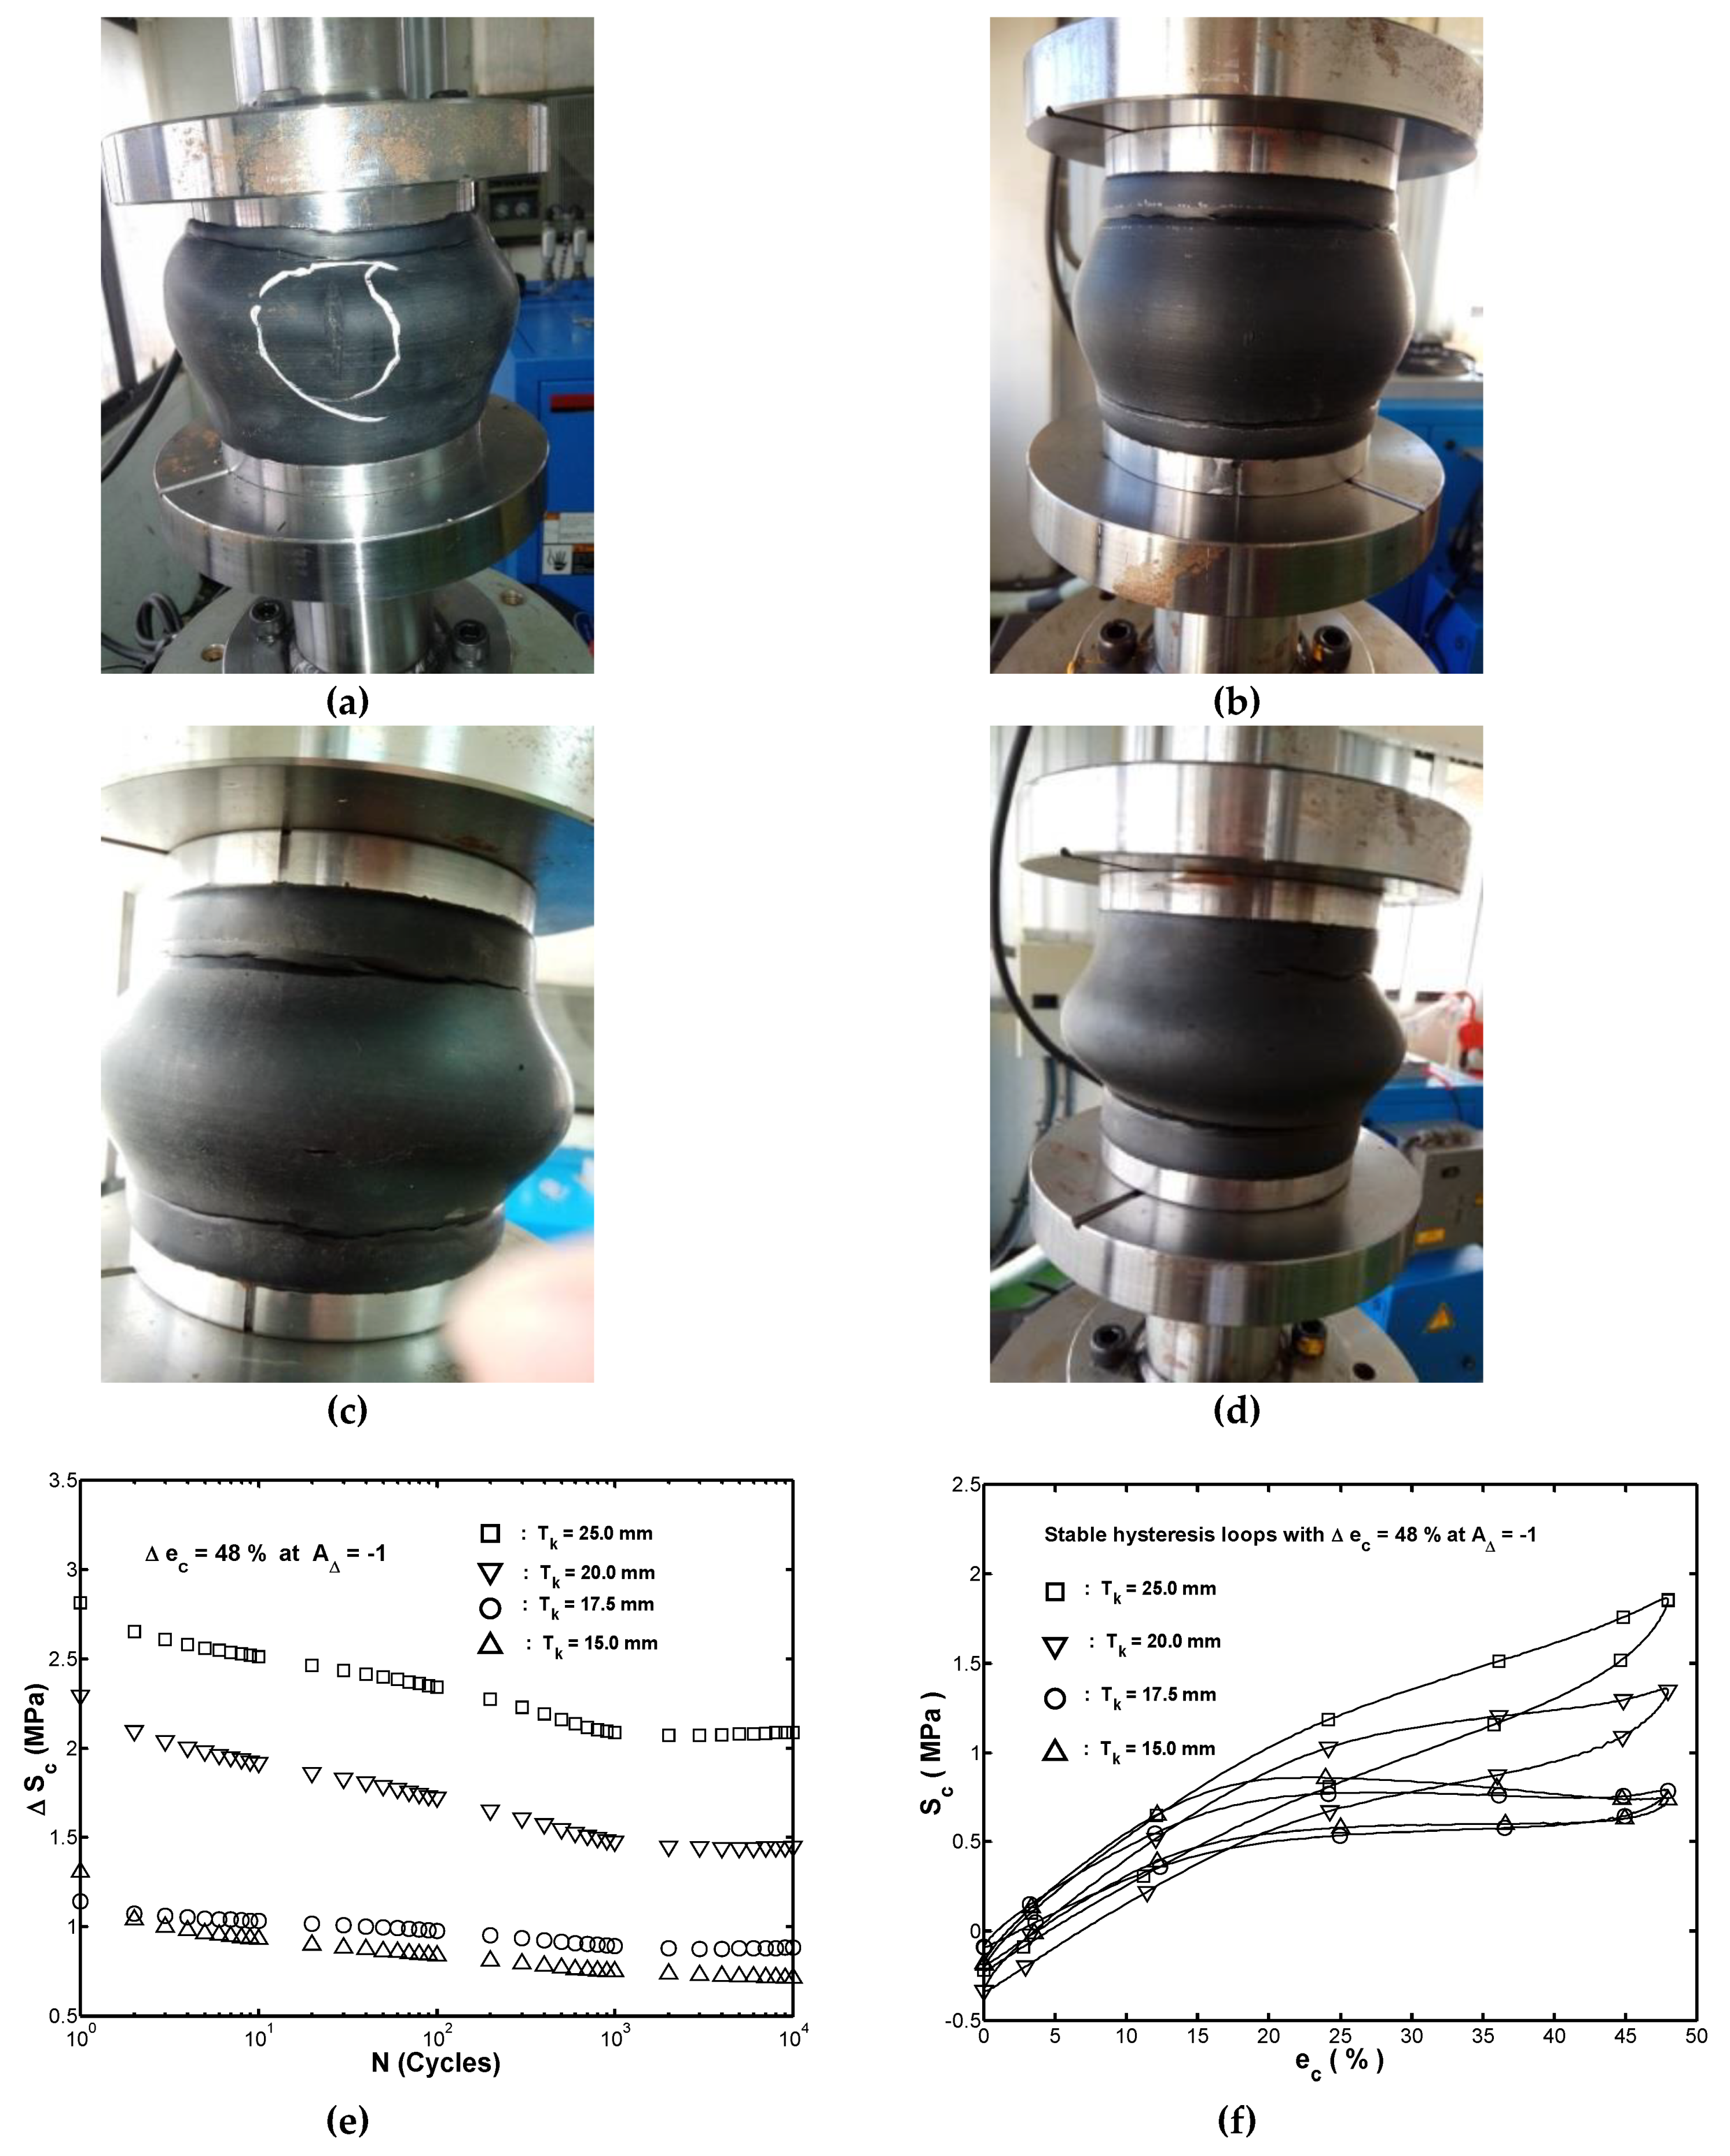
3.1. Observations of Compressive Deformation
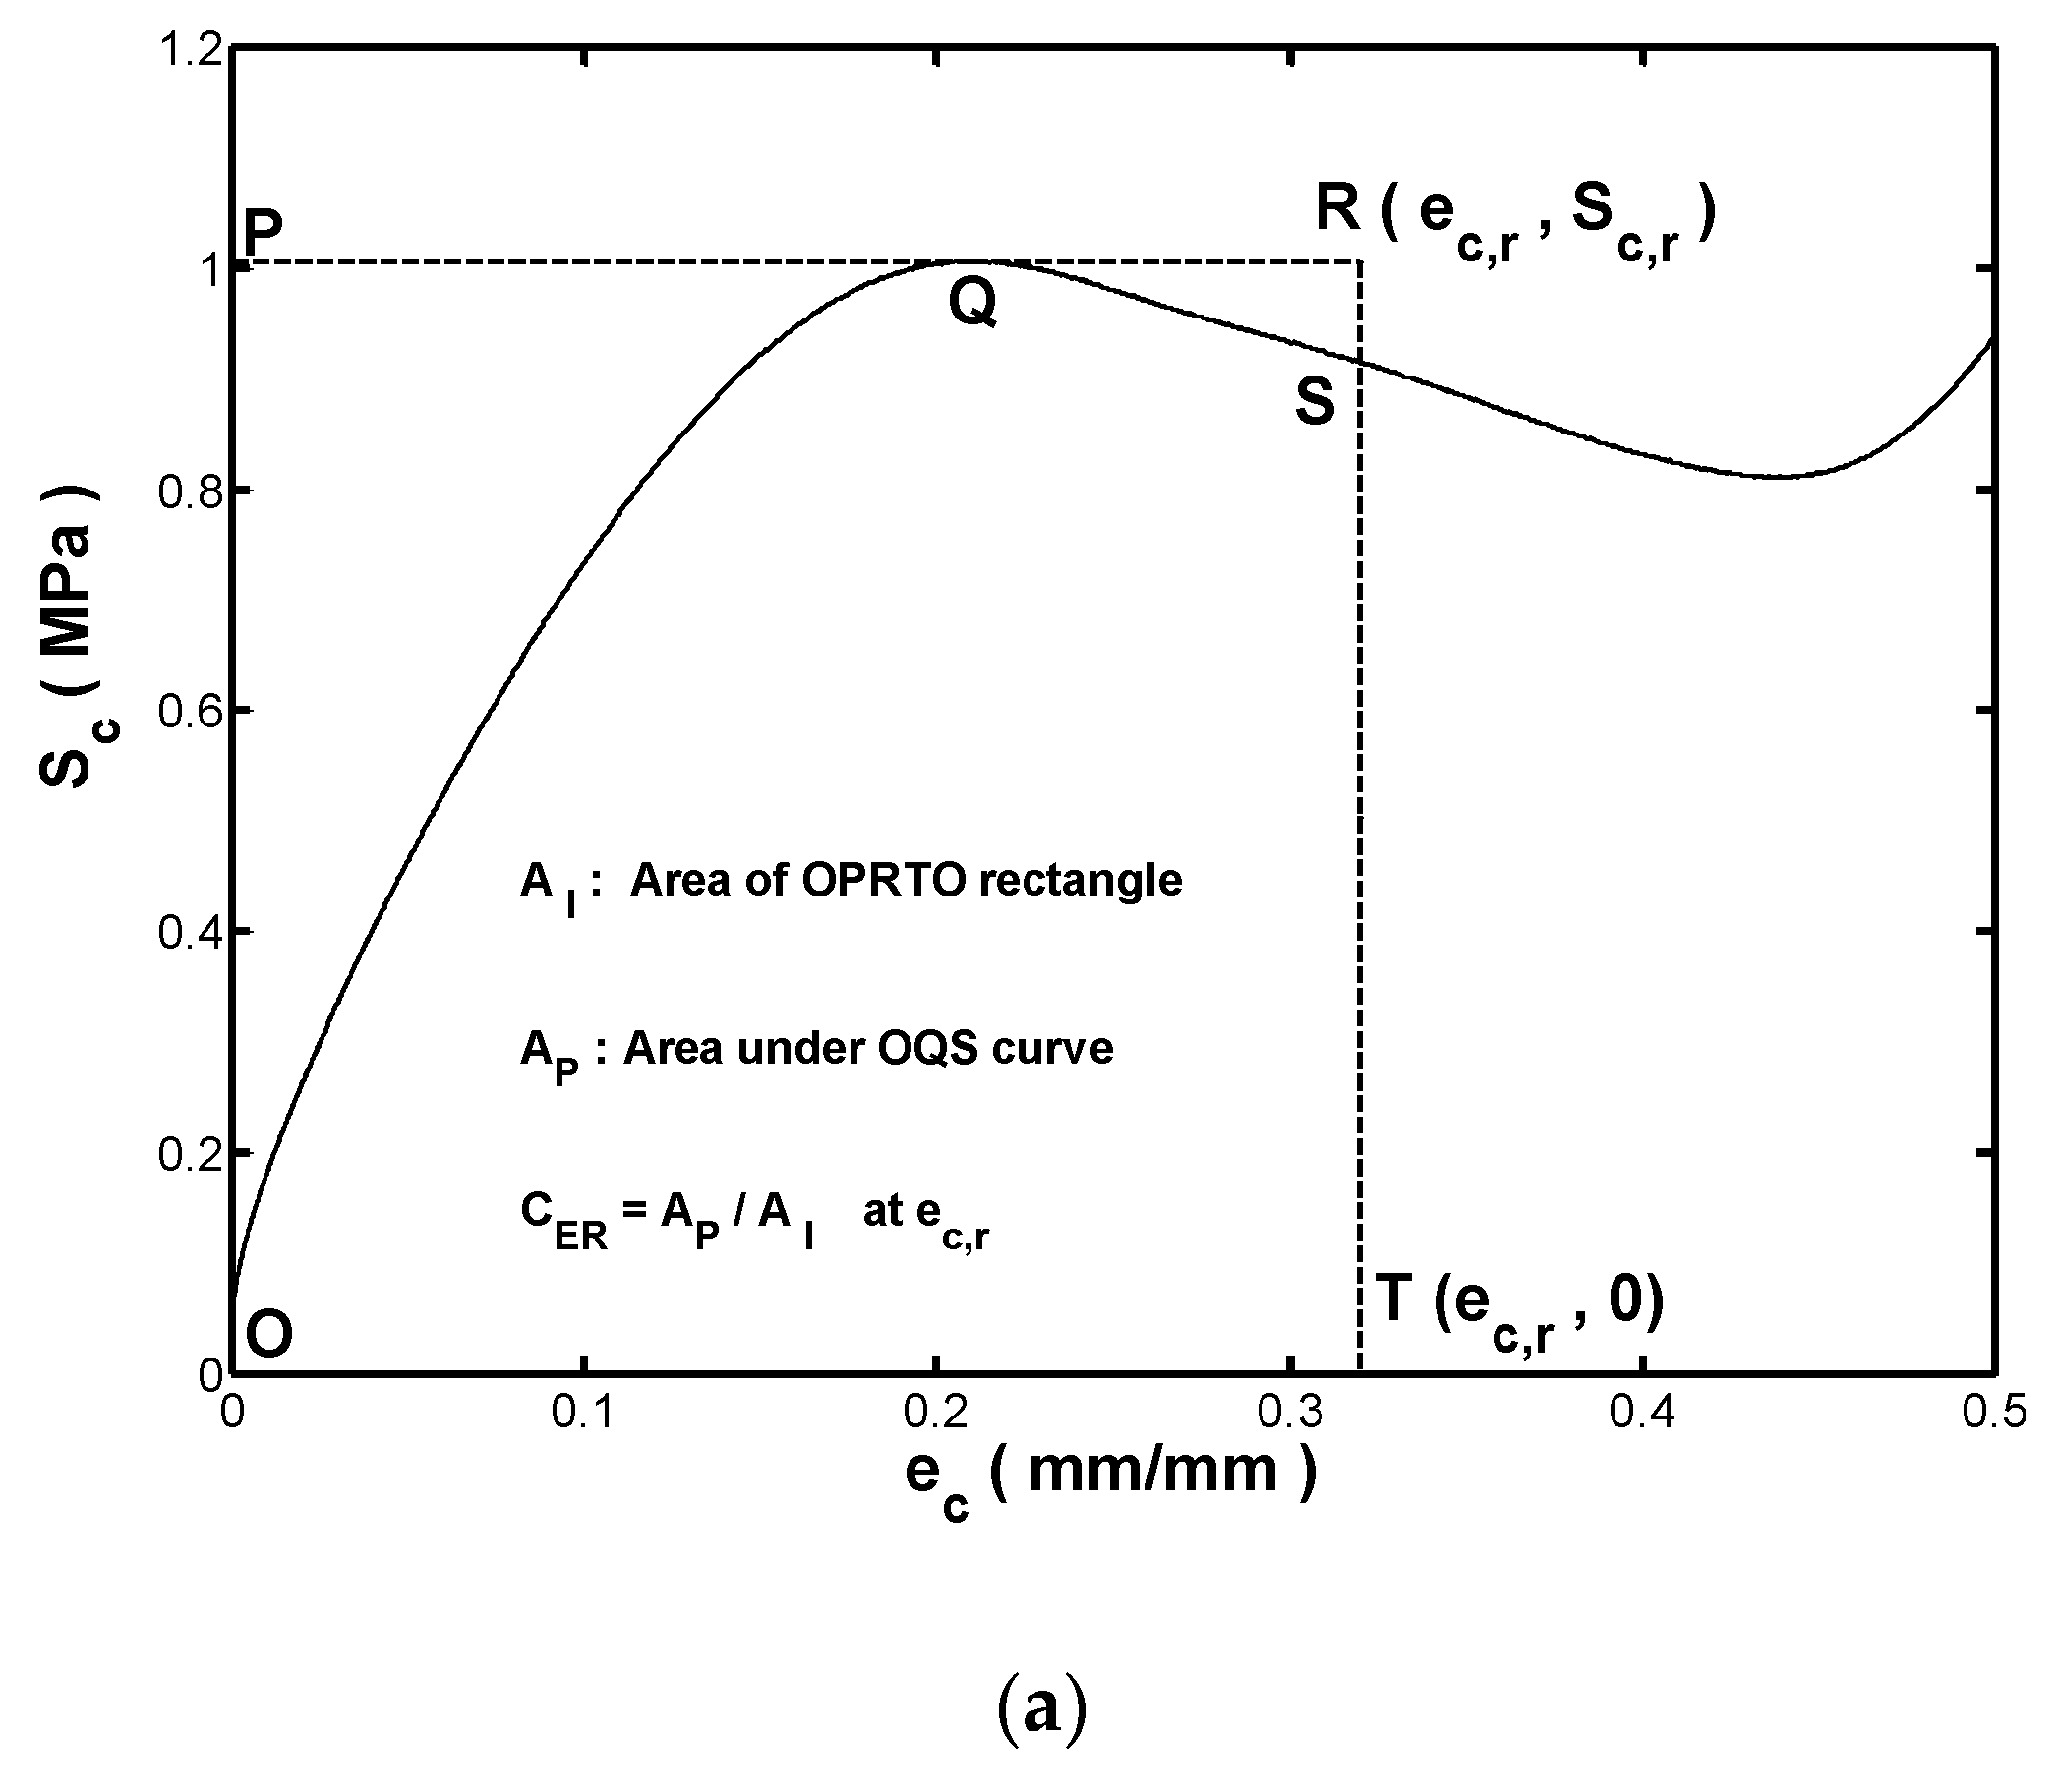
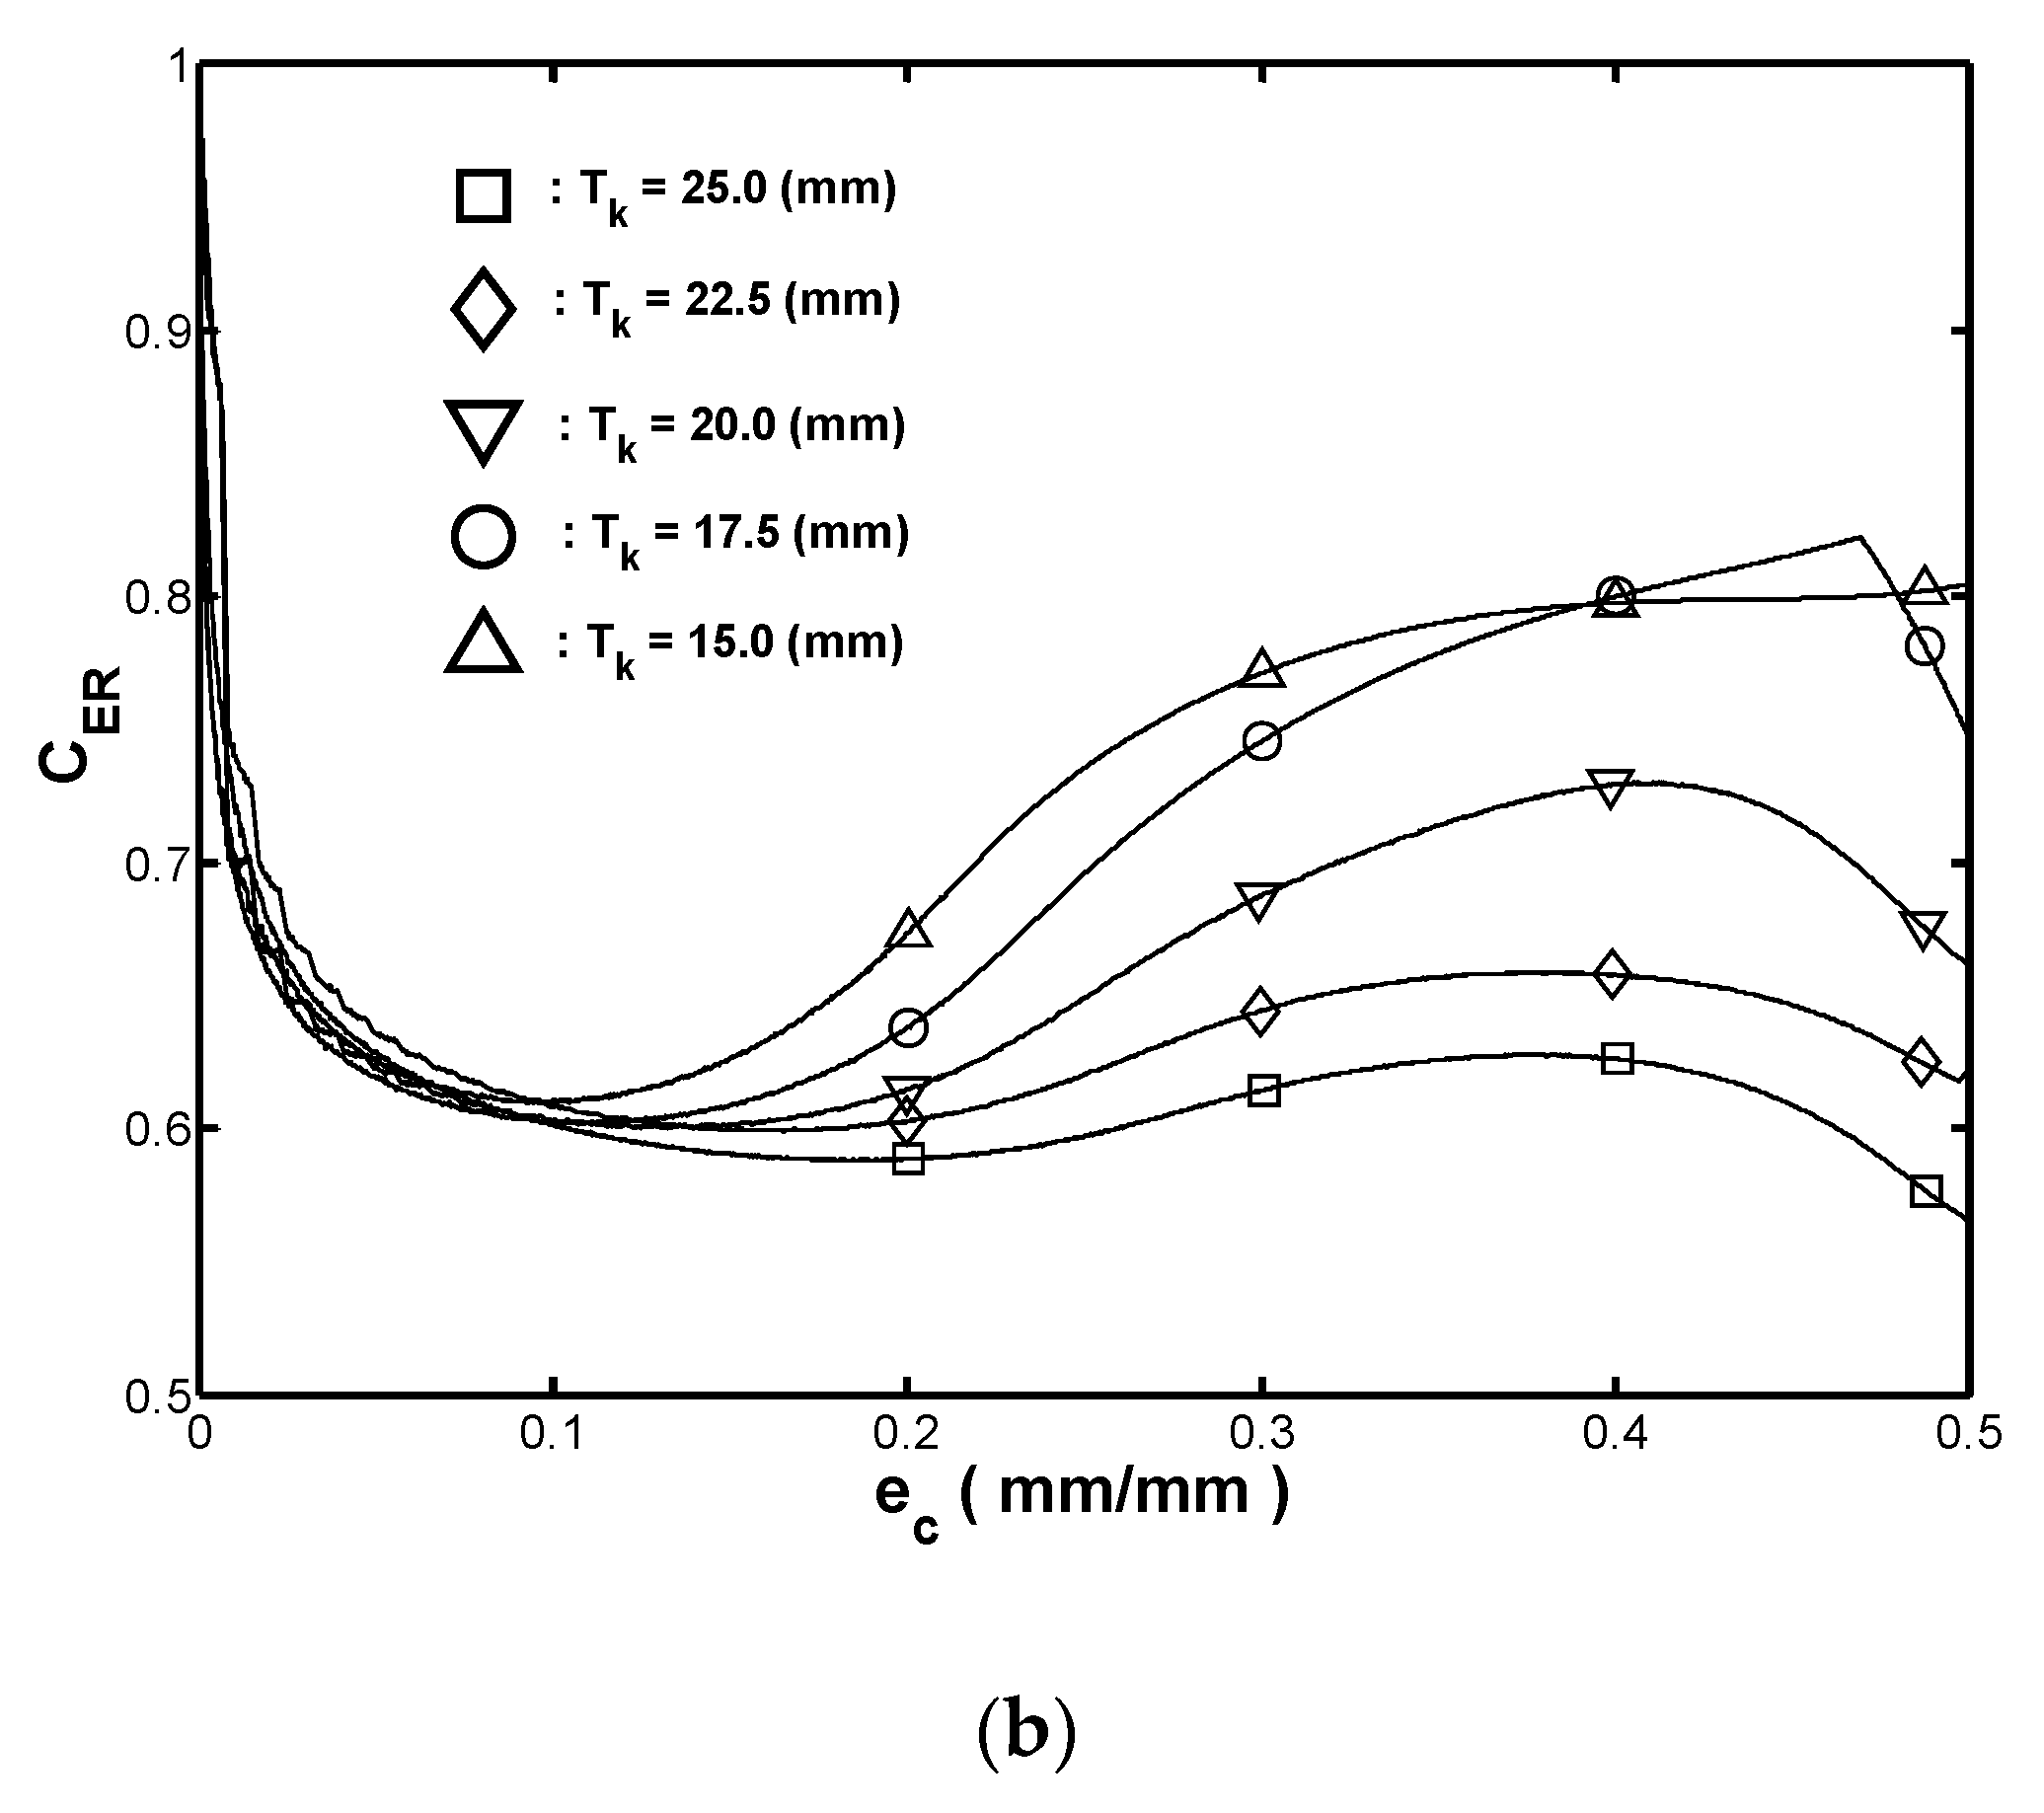
3.2. Estimation on Efficiency of Rubber Fender
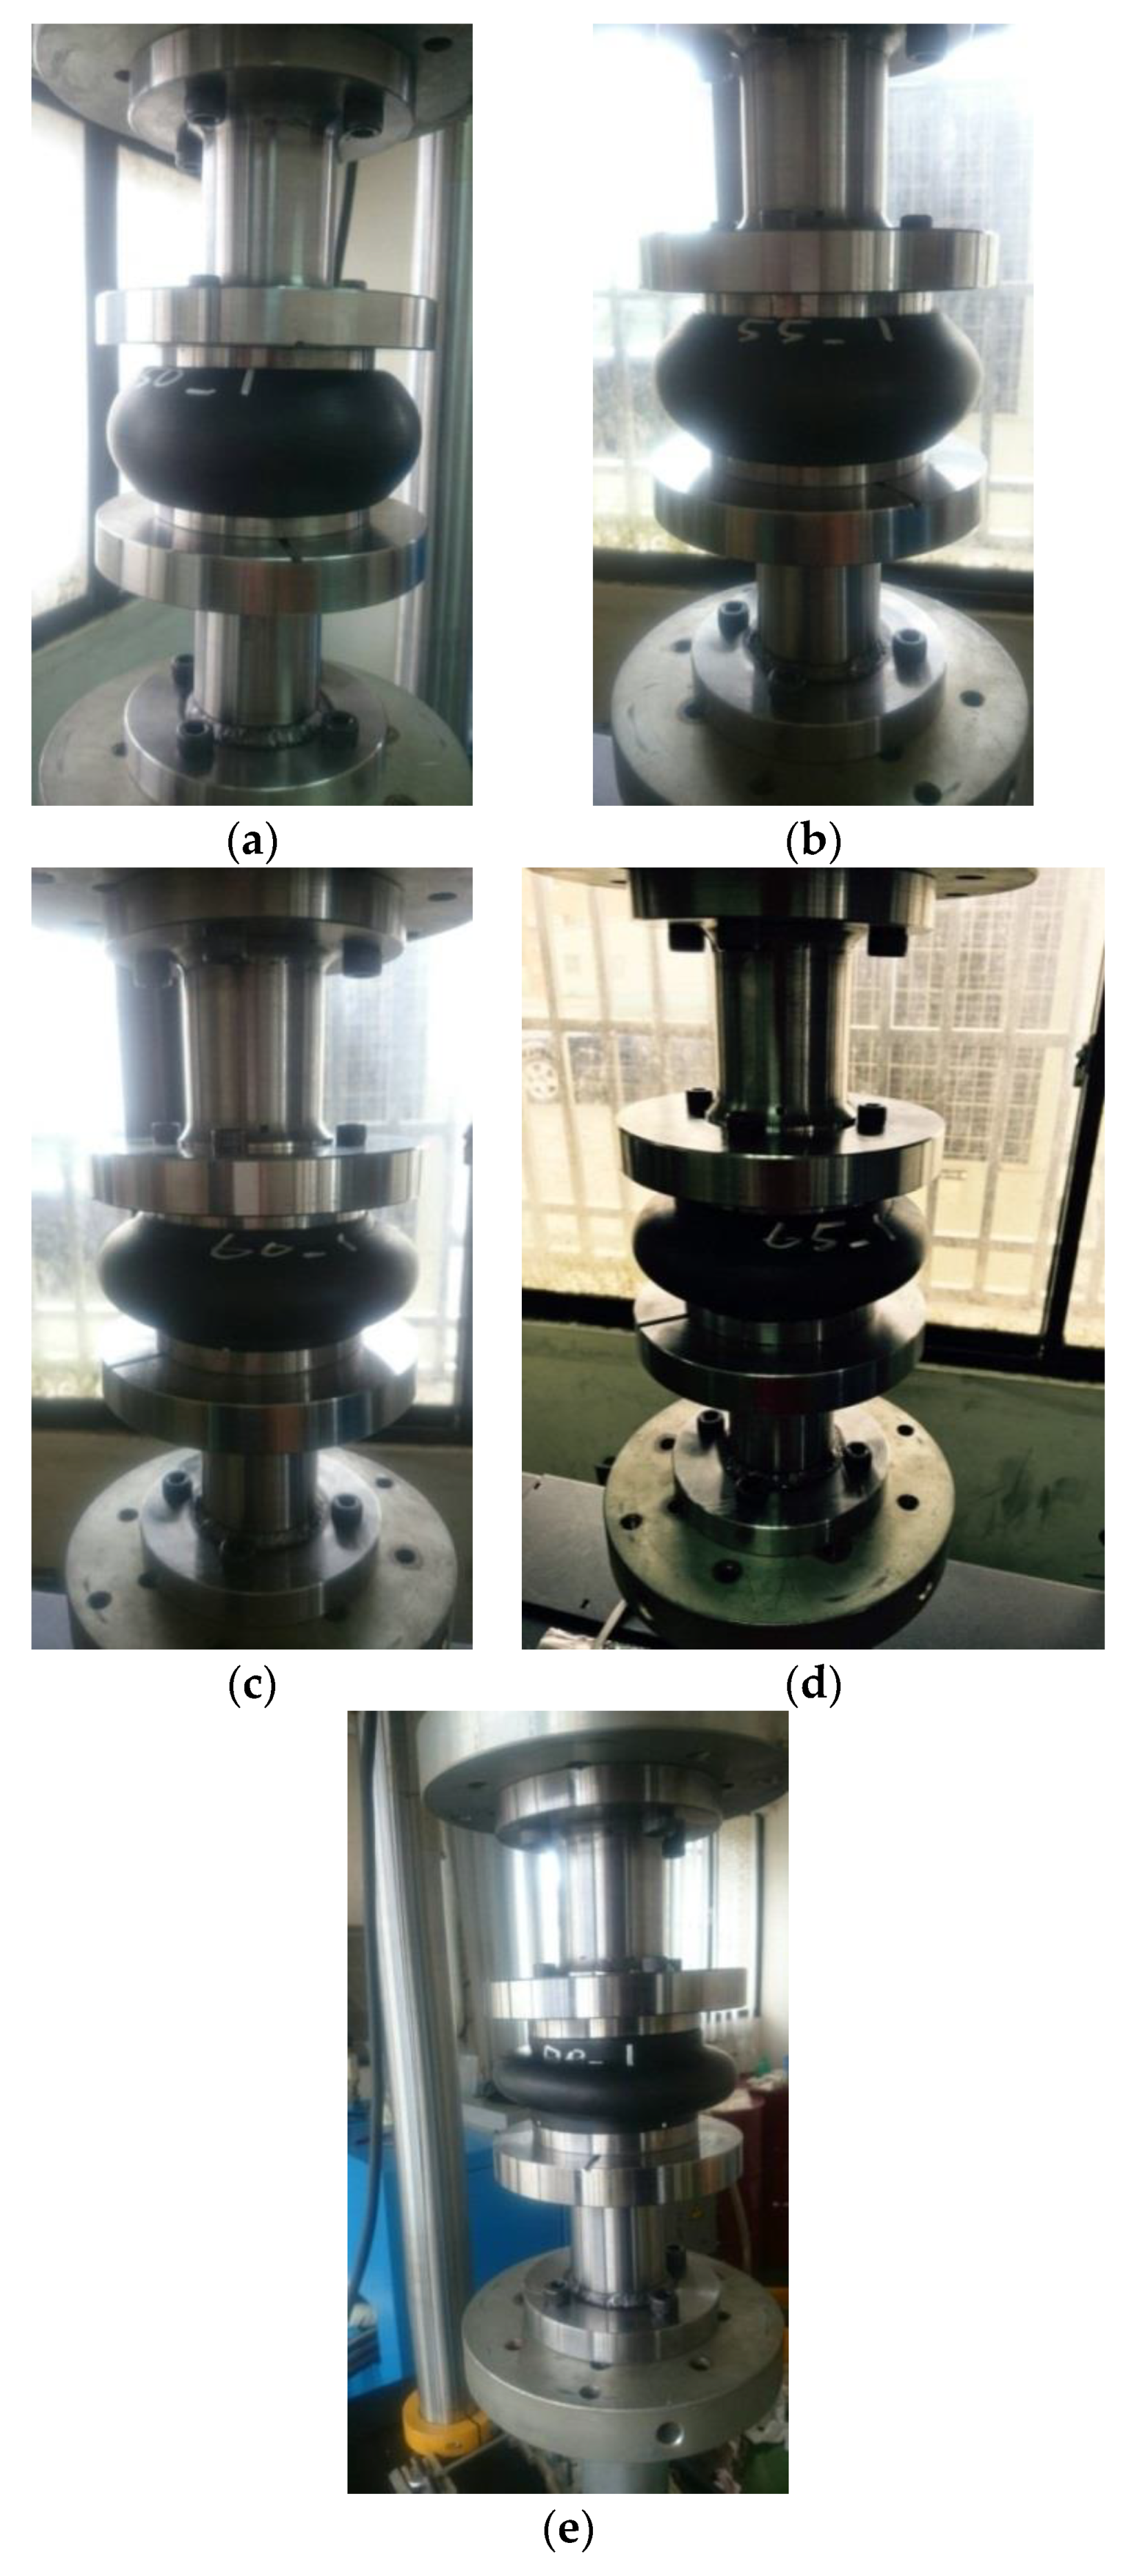
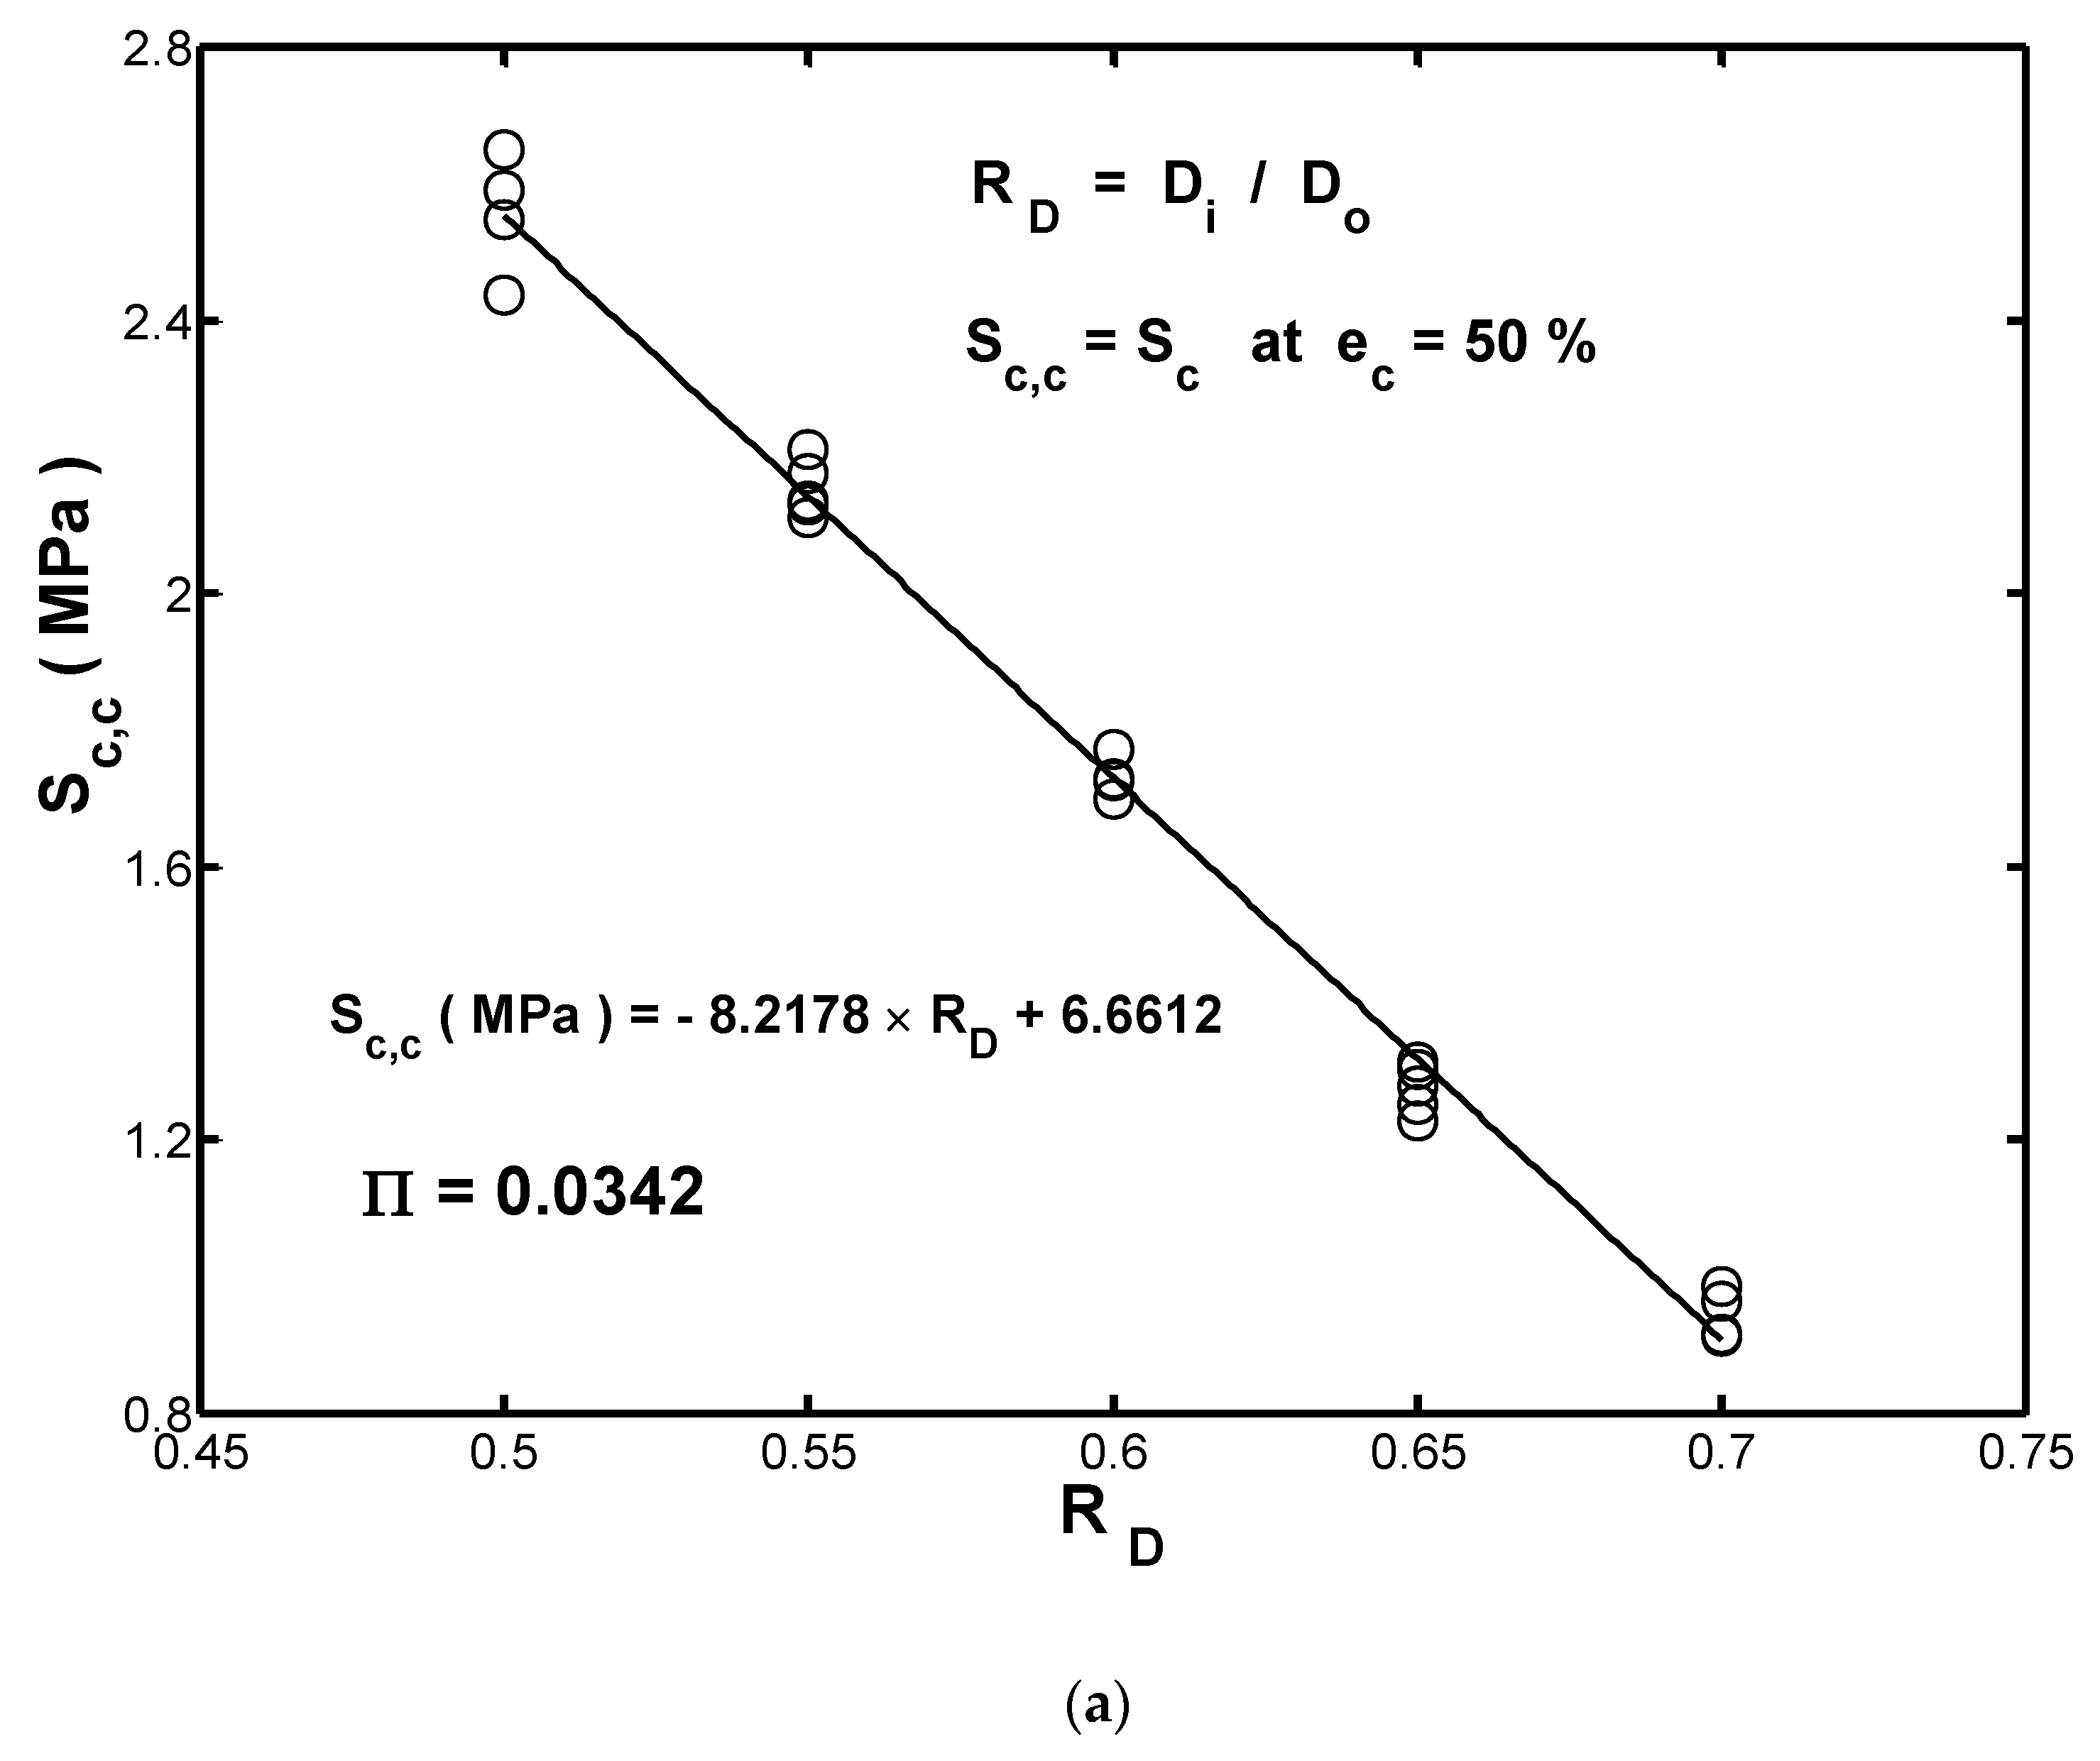
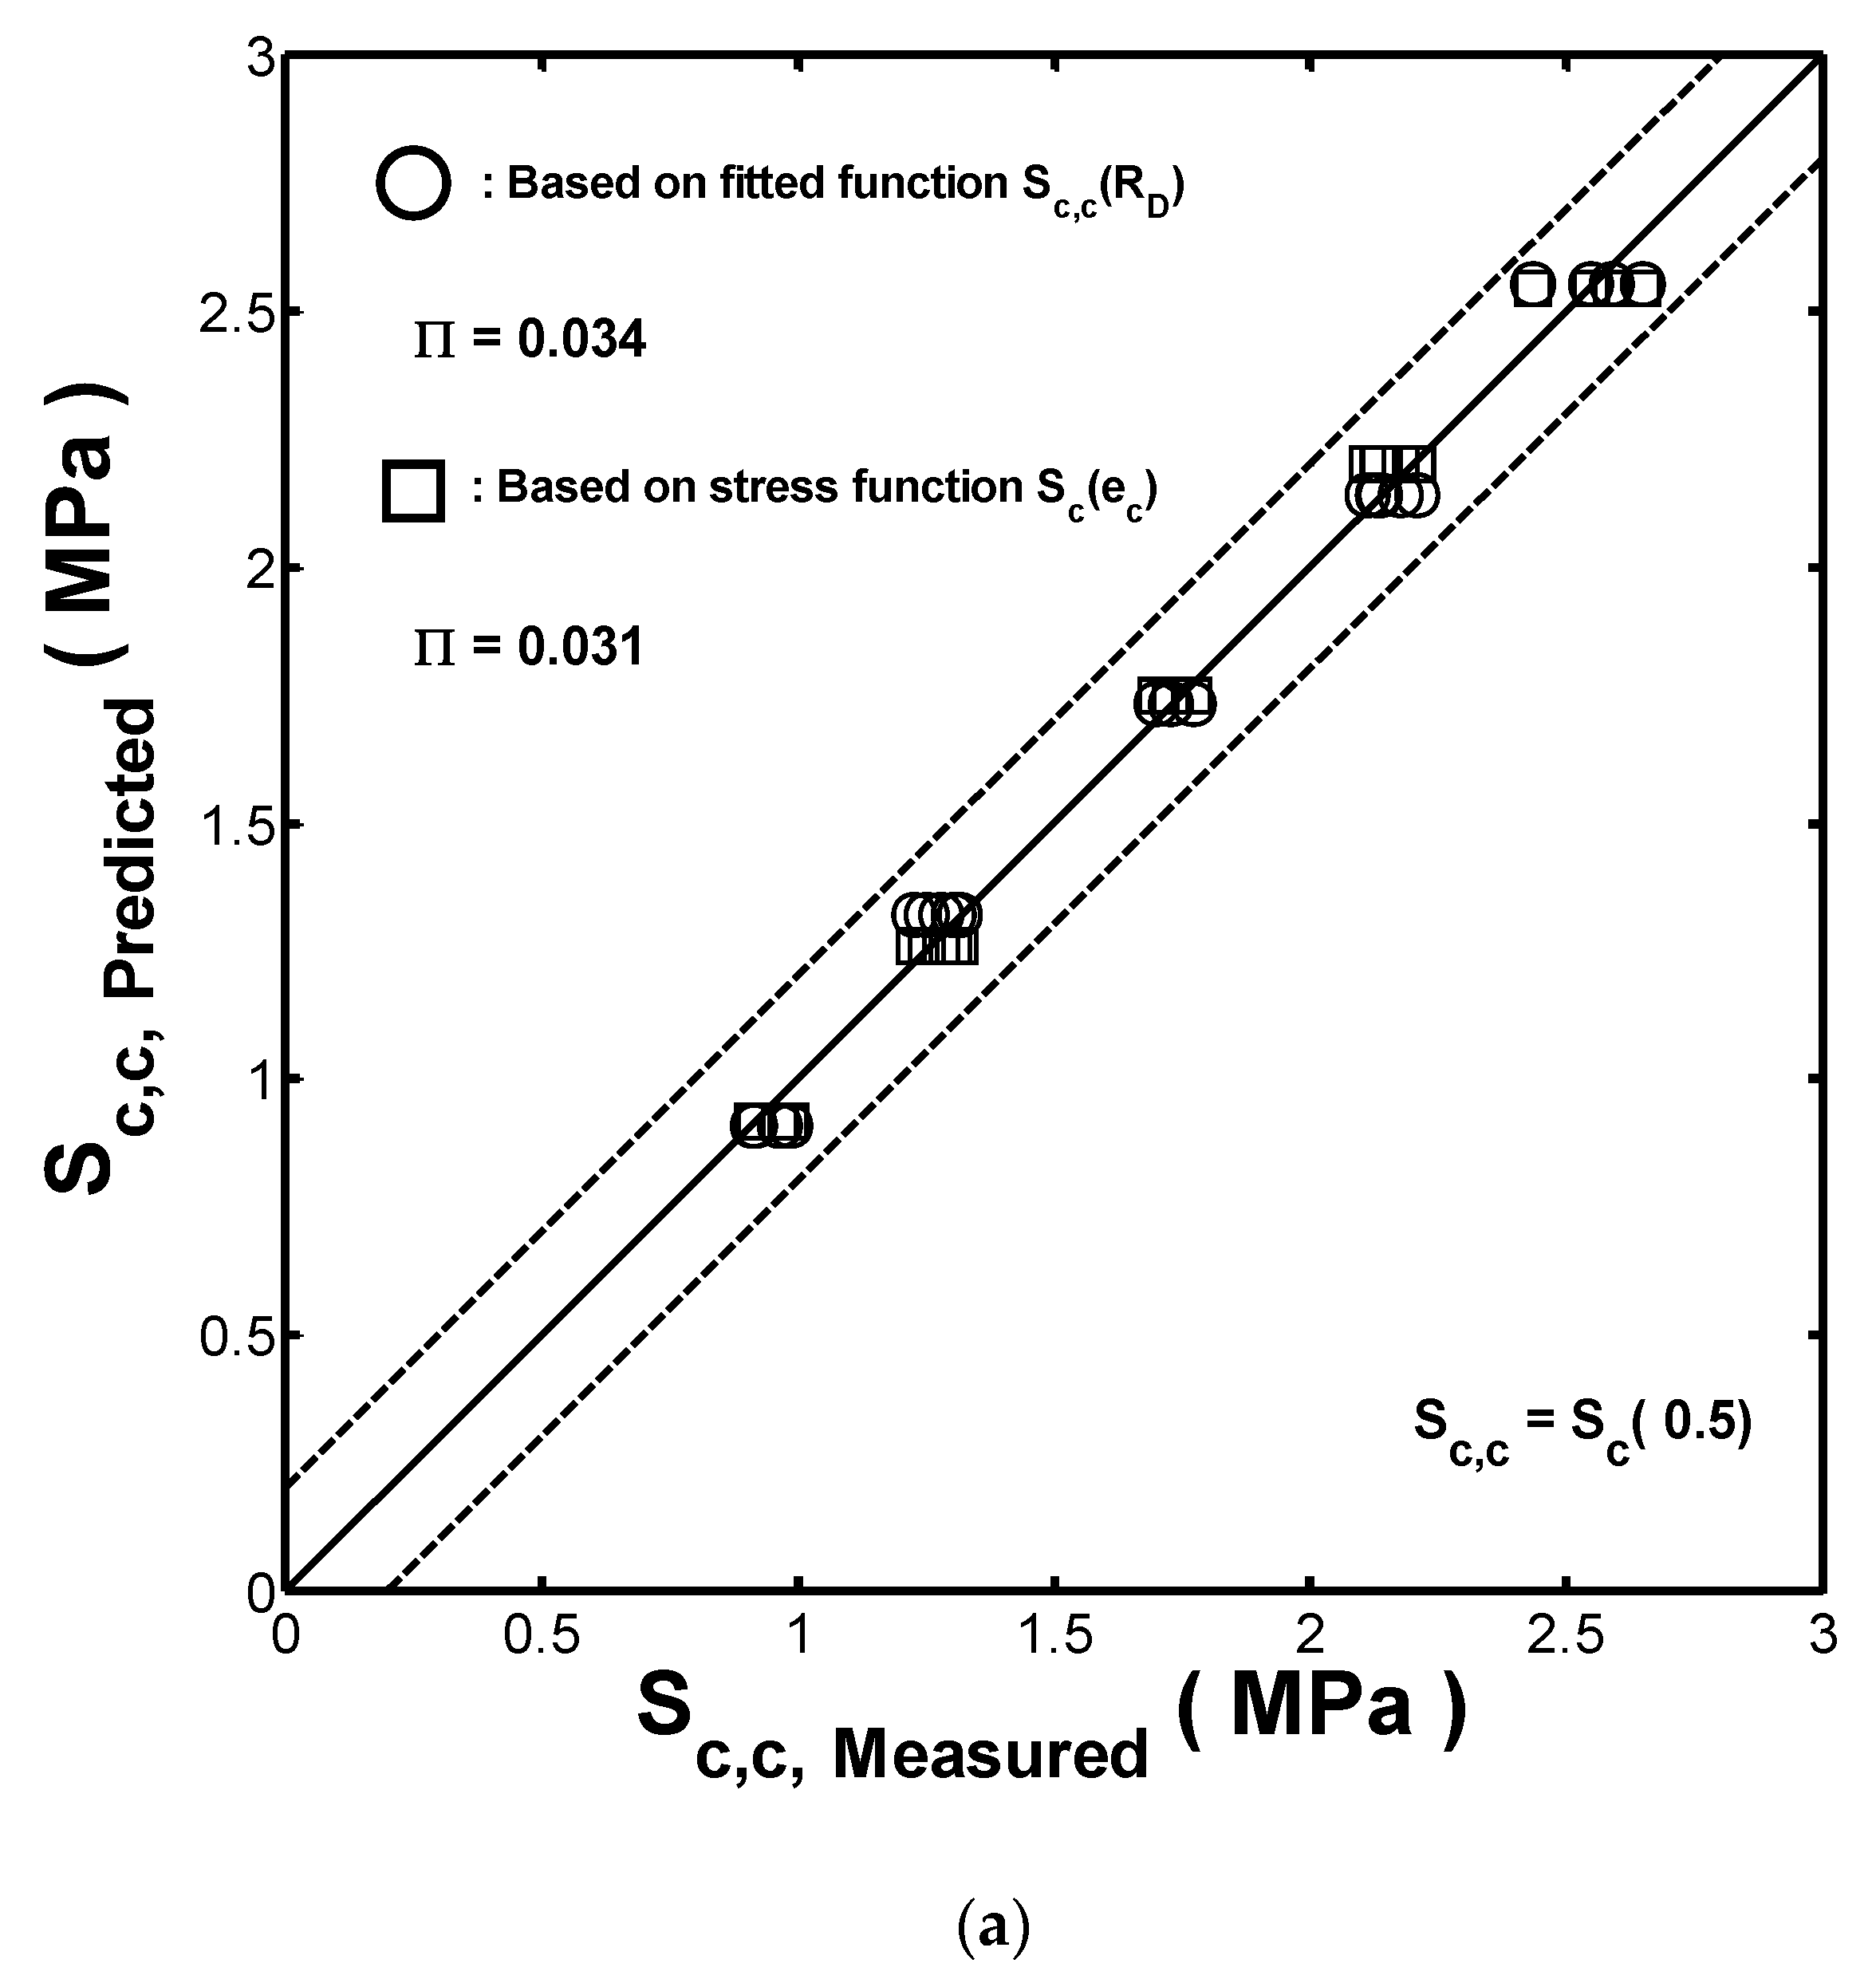
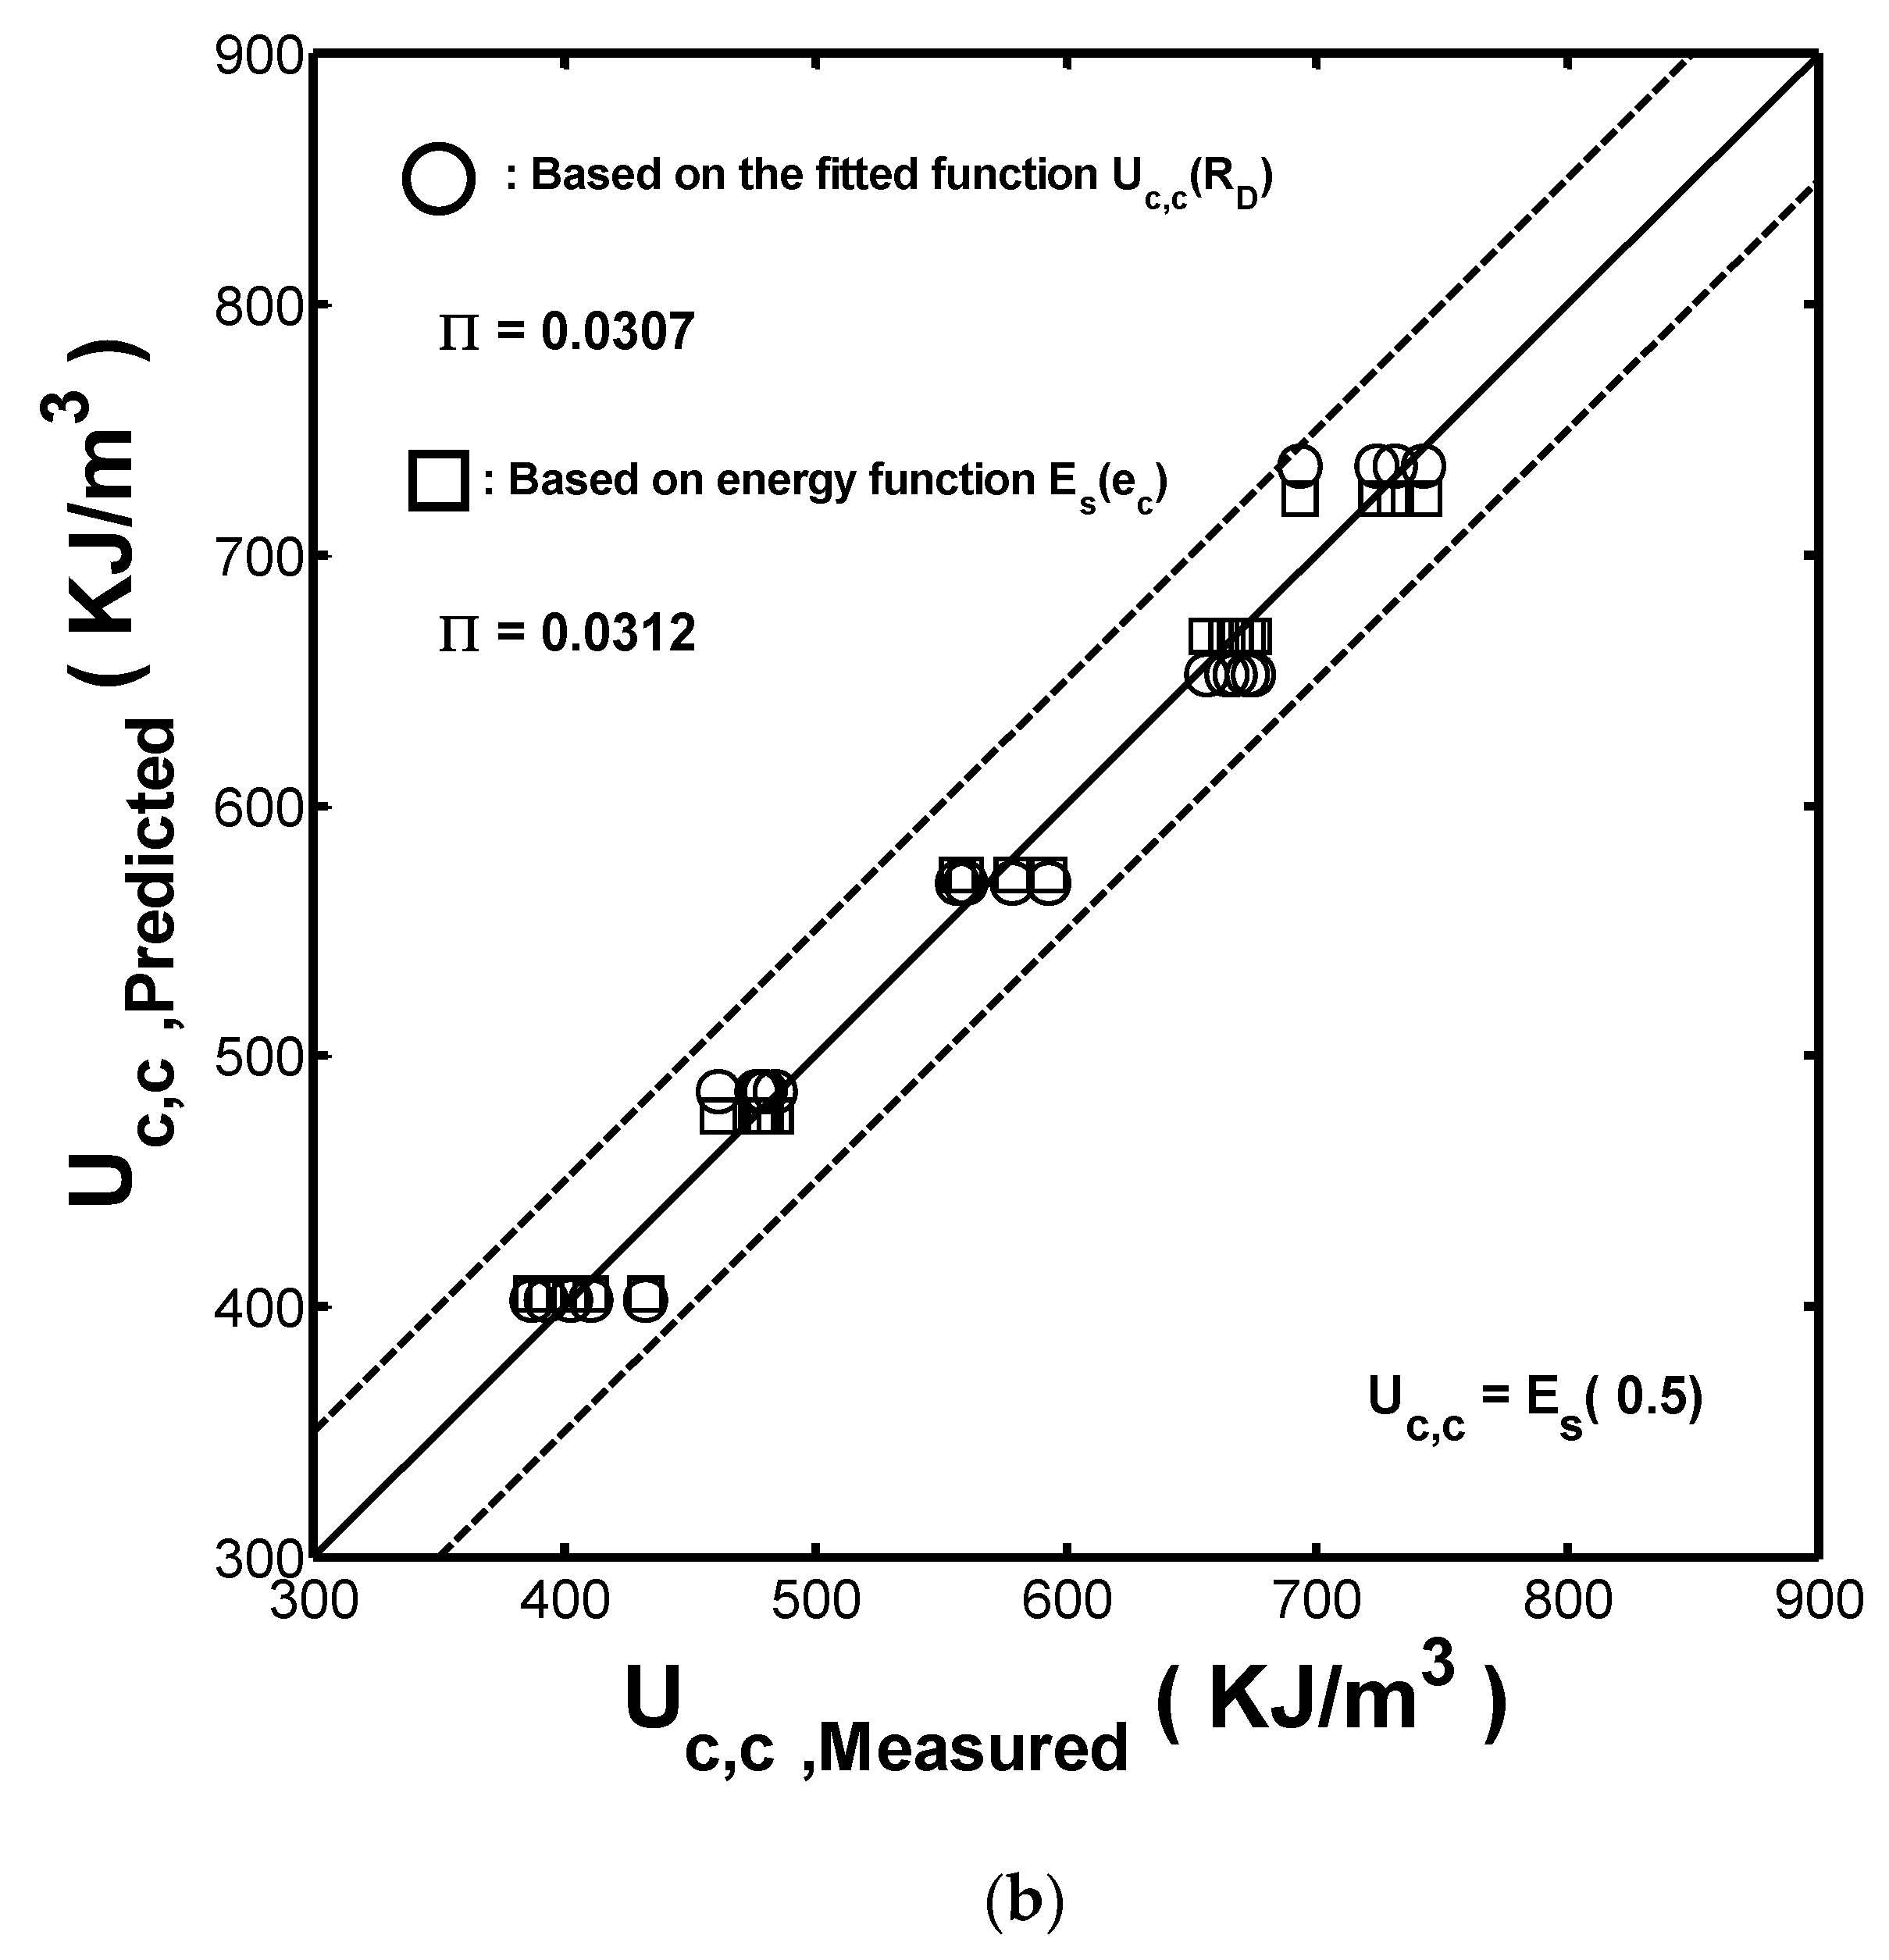
3.3. Estimation on Compression Properties of Rubber Fender
4. Discussion
4.1. Determination of Material Coefficients for Mooney-Rivlin Model
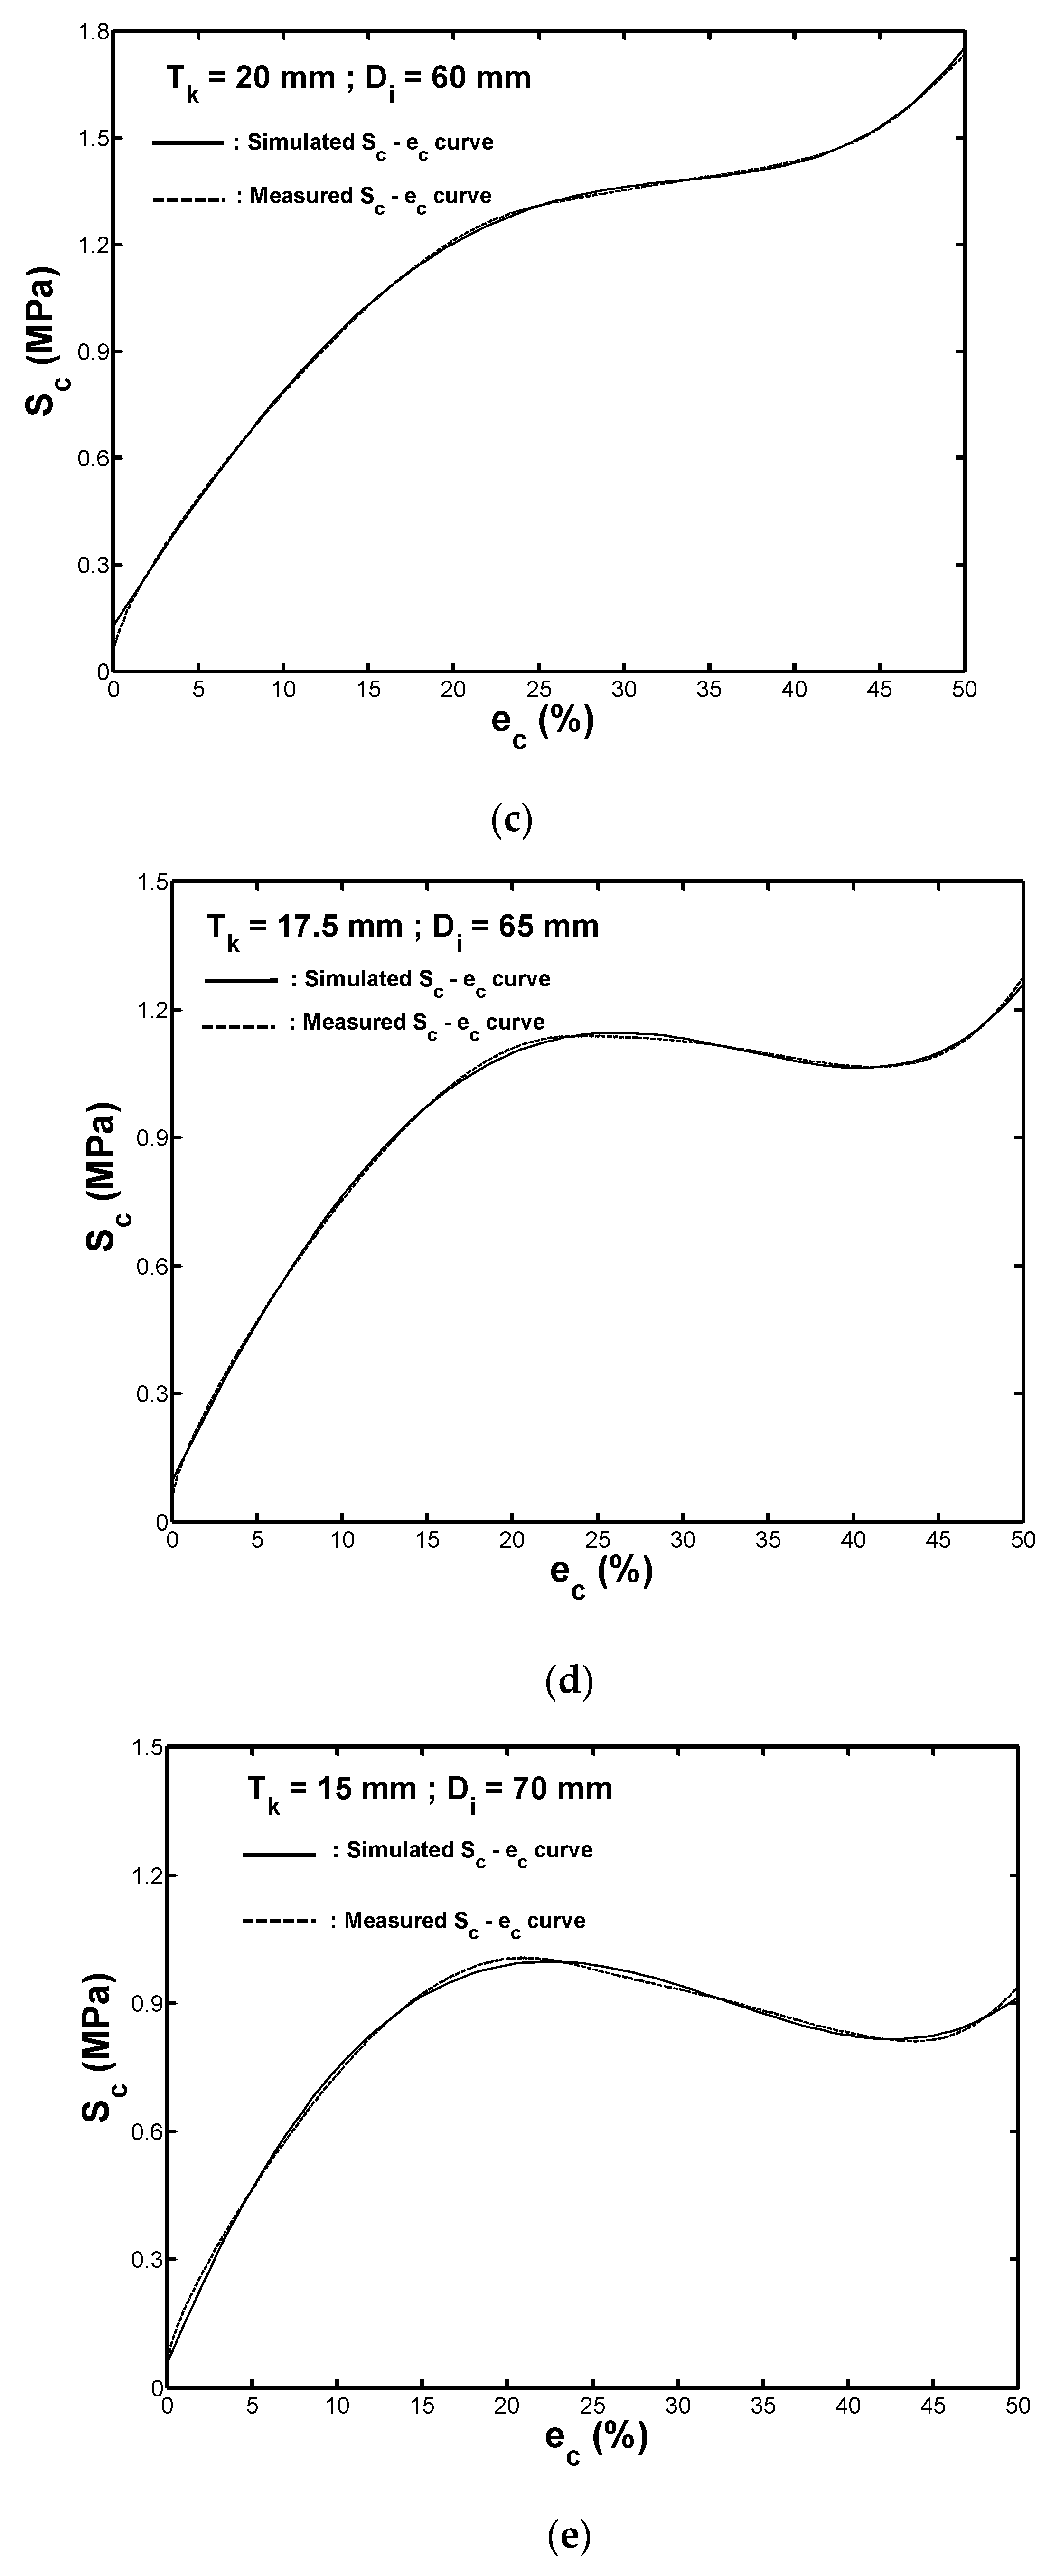
4.2. Simulation Results Based on Mooney-Rivlin Material Model
4.3. Modeling of Stress–Strain Response by Using Energy Polynomial Function
5. Conclusions
Author Contributions
Funding
Conflicts of Interest
References
- Kim, W.D.; Lee, J.H.; Kim, J.Y.; Koh, S.K. Fatigue life estimation of an engine rubber mount. Int. J. Fatigue 2004, 26, 553–560. [Google Scholar] [CrossRef]
- Saintier, N.; Cailletaud, G.; Piques, R. Multiaxial fatigue life prediction for a natural rubber. Int. J. Fatigue 2006, 28, 530–539. [Google Scholar] [CrossRef] [Green Version]
- Le Cam, J.-B.; Huneau, B.; Verron, E. Fatigue damage in carbon black filled natural rubber under uni- and multiaxial loading conditions. Int. J. Fatigue 2013, 52, 82–94. [Google Scholar] [CrossRef] [Green Version]
- Harbor, R.J.; Fatemi, A.; Mars, W.V. Fatigue life analysis and predictions for NR and SBR under variable amplitude and multiaxial loading conditions. Int. J. Fatigue 2008, 30, 1231–1247. [Google Scholar] [CrossRef]
- Brieu, M.; Diani, J.; Mignot, C.; Moriceau, C. Response of a carbon-black filled SBR under large strain cyclic uniaxial tension. Int. J. Fatigue 2010, 32, 1921–1927. [Google Scholar] [CrossRef]
- Poisson, J.-L.; Lacroix, F.; Meo, S.; Berton, G.; Ranganathan, N. Biaxial fatigue behavior of a polychloroprene rubber. Int. J. Fatigue 2011, 33, 1151–1157. [Google Scholar] [CrossRef]
- Chou, H.W.; Huang, J.S. Effects of Cyclic Compression and Thermal Aging on Dynamic Properties of Neoprene Rubber Bearings. J. Appl. Polym. Sci. 2008, 107, 1635–1641. [Google Scholar] [CrossRef]
- Chou, H.W.; Huang, J.S.; Lin, S.T. Effects of Thermal Aging on Fatigue of Carbon Black–Reinforced EPDM Rubber. J. Appl. Polym. Sci. 2007, 103, 1244–1251. [Google Scholar] [CrossRef]
- Neuhaus, C.; Lion, A.; Johlitz, M.; Heuler, P.; Barkhoff, M.; Duisen, F. Fatigue behaviour of an elastomer under consideration of ageing effects. Int. J. Fatigue 2017, 104, 72–80. [Google Scholar] [CrossRef]
- Ha-Anh, T.; Vu-Khanh, T. Prediction of mechanical properties of polychloroprene during thermo-oxidative aging. Polym. Test. 2005, 24, 775–780. [Google Scholar] [CrossRef] [Green Version]
- Abdel-Aziz, M.M.; Basfar, A.A. Aging of ethylene-propylene diene rubber (EPDM) vulcanized by g-radiation. Polym. Test. 2000, 19, 591–602. [Google Scholar] [CrossRef]
- Legorju-jago, K.; Bathias, C. Fatigue initiation and propagation in natural and synthetic rubbers. Int. J. Fatigue 2002, 24, 85–92. [Google Scholar] [CrossRef]
- Mott, P.H.; Roland, C.M. Aging of natural rubber in air and seawater. Rubber Chem. Technol. 2001, 74, 79–88. [Google Scholar] [CrossRef] [Green Version]
- Narynbek Ulu, K.; Huneau, B.; Le Gac, P.Y.; Verron, E. Fatigue resistance of natural rubber in seawater with comparison to air. Int. J. Fatigue 2016, 88, 247–256. [Google Scholar] [CrossRef] [Green Version]
- Chou, H.W.; Huang, J.S. Effects of Ultraviolet Irradiation on the Static and Dynamic Properties of Neoprene Rubbers. J. Appl. Polym. Sci. 2008, 110, 2907–2913. [Google Scholar] [CrossRef]
- Lake, G.J.; Lindley, P.B. Ozone cracking, flex cracking and fatigue of rubber. Rubber J. 1964, 146, 24–36. [Google Scholar]
- Kakavas, P.A. Mechanical properties of bonded elastomer discs subjected to triaxial stress. J. Appl. Polym. Sci. 1996, 59, 251–261. [Google Scholar] [CrossRef]
- Bathias, C.; Legorju, C.; Chuming, L.U.; Menabeuf, L. Fatigue crack growth damage in elastomeric materials. In Fatigue and fracture, 27; Piascik, R.S., Newman, J.C., Dowling, N.E., Eds.; ASTM STP 1296; American Society for Testing and Materials: Philadelphia, PA, USA, 1997; pp. 505–513. [Google Scholar]
- Loo, M.S.; Le Cam, J.-B.; Andriyana, A.; Robin, E.; Afifi, A.M. Fatigue of swollen elastomers. Int. J. Fatigue 2015, 74, 132–141. [Google Scholar] [CrossRef]
- Hibbeler, R.C. Mechanic s of Materials, 8th ed.; Prentice Hall: Upper Saddle River, NJ, USA, 2011. [Google Scholar]
- Hamza, M.N.; Alwan, H.M. Hyperelastic Constitutive Modeling of Rubber and Rubber-Like Materials under Finite Strain. Eng. Technol. J. 2010, 28, 2560–2572. [Google Scholar]
- Nunes, L.C.S. Mechanical characterization of hyperelastic polydimethylsiloxane by simple shear test. Mater. Sci. Eng. A 2011, 528, 1799–1804. [Google Scholar] [CrossRef]
- Lee, K.S. Effects on the various rubber fenders of a tripod offshore wind turbine substructure collision strength due to boat. Ocean Eng. 2013, 72, 188–194. [Google Scholar] [CrossRef]
- Ogden, R.W. Large deformation isotropic elasticity–on the correlation of theory and experiment for incompressible rubberlike solids. Proc. R. Soc. Lond. A 1972, 326, 565–584. [Google Scholar] [CrossRef]
- Jang, W.J.; Lee, J.; Woo, C.S.; Kim, B.K.; Lee, S.B. An Experimental Study and Finite Element Analysis of Weatherstrip. Int. J. Precis. Eng. Manuf. 2011, 12, 97–104. [Google Scholar]
- Woo, C.S.; Park, H.S.; Kim, Y.G.; Shin, W.G.; Joe, D.H. Finite element analysis and evaluation of automotive rubber components. In Proceedings of the Korean Society of Automotive Engineers (KSAE), Seoul, Korea, 1 August 2010. [Google Scholar]
- Wu, Y.; Wang, H.; Li, A. Parameter Identification Methods for Hyperelastic and Hyper-Viscoelastic Models. Appl. Sci. 2016, 6, 386. [Google Scholar] [CrossRef] [Green Version]
- Marckmann, G.; Verron, E. Comparison of hyperelastic models for rubber-like materials. Rubber Chem. Technol. 2006, 79, 835–858. [Google Scholar] [CrossRef] [Green Version]
- Gent, A.N. Engineering with Rubber: How to Design Rubber Components, 2nd ed.; Hanser Gardner: Cincinnati, OH, USA, 2001. [Google Scholar]
- Flamm, M.; Spreckels, J.; Steinweger, T.; Weltin, U. Effects of very high loads on fatigue life of NR elastomer materials. Int. J. Fatigue 2011, 33, 1189–1198. [Google Scholar] [CrossRef]
- Woo, C.S.; Kim, W.D.; Kwon, J.D. A study on the material properties and fatigue life prediction of natural rubber component. Mater. Sci. Eng. A 2008, 483, 376–381. [Google Scholar] [CrossRef]
- Wu, C.C.; Chiou, Y.C. Stress-strain response of cyclical rubber fender under monotonic and cyclic Compression. Materials 2019, 12, 282. [Google Scholar] [CrossRef] [Green Version]


| Sample Ingredients | Quantity (phr 1) |
|---|---|
| Natural rubber | 60.0 |
| Styrene butadiene rubber (SBR) | 40.0 |
| Zinc oxide | 5.0 |
| Aging agent (4020) | 1.5 |
| Aging agent (RD) | 1.5 |
| Microcrystalline wax | 1.0 |
| Resin | 1.5 |
| HAF (high abrasion furnace) carbon blacks | 45 |
| Aromatic oil | 5.0 |
| Sulfur | 2.5 |
| Promoter (DM) | 0.65 |
| 0.50 | 2.5550 | 0.7227 |
| 0.55 | 2.1528 | 0.6670 |
| 0.60 | 1.7314 | 0.5722 |
| 0.65 | 1.2752 | 0.4762 |
| 0.70 | 0.9388 | 0.4051 |
| 25.0 (mm) | 17.5532 | −16.8638 | 3.0513 | 3.0180 | 0.1859 | −0.0008 |
| 22.5 (mm) | 12.3199 | −9.8528 | −0.6615 | 3.6217 | 0.1558 | −0.0003 |
| 20.0 (mm) | 14.9751 | −11.7837 | −1.0947 | 3.6555 | 0.1292 | −0.0002 |
| 17.5 (mm) | 13.9804 | −9.2136 | −3.4634 | 3.9977 | 0.0972 | 0.0000 |
| 15.0 (mm) | 4.9335 | 2.9610 | −9.2480 | 4.7736 | 0.0557 | 0.0006 |
© 2020 by the authors. Licensee MDPI, Basel, Switzerland. This article is an open access article distributed under the terms and conditions of the Creative Commons Attribution (CC BY) license (http://creativecommons.org/licenses/by/4.0/).
Share and Cite
Shen, M.-Y.; Chiou, Y.-C.; Tan, C.-M.; Wu, C.-C.; Chen, W.-J. Effect of Wall Thickness on Stress–Strain Response and Buckling Behavior of Hollow-Cylinder Rubber Fenders. Materials 2020, 13, 1170. https://0-doi-org.brum.beds.ac.uk/10.3390/ma13051170
Shen M-Y, Chiou Y-C, Tan C-M, Wu C-C, Chen W-J. Effect of Wall Thickness on Stress–Strain Response and Buckling Behavior of Hollow-Cylinder Rubber Fenders. Materials. 2020; 13(5):1170. https://0-doi-org.brum.beds.ac.uk/10.3390/ma13051170
Chicago/Turabian StyleShen, Ming-Yuan, Yung-Chuan Chiou, Chung-Ming Tan, Chia-Chin Wu, and Wei-Jen Chen. 2020. "Effect of Wall Thickness on Stress–Strain Response and Buckling Behavior of Hollow-Cylinder Rubber Fenders" Materials 13, no. 5: 1170. https://0-doi-org.brum.beds.ac.uk/10.3390/ma13051170