Enhancing Spectral Reflection through Controlled Phase Distribution Using Doped Polar-Dielectric Metasurfaces


Faculty of Engineering and Natural Science, Sabanci University, Istanbul 34956, Turkey
*
Authors to whom correspondence should be addressed.
Materials 2020, 13(9), 2007; https://0-doi-org.brum.beds.ac.uk/10.3390/ma13092007
Submission received: 20 March 2020
/
Revised: 18 April 2020
/
Accepted: 21 April 2020
/
Published: 25 April 2020
(This article belongs to the Special Issue Design and Development of Plasmonic Functional Materials)
Abstract
:Controlling the phase distribution of wavefronts using optical metasurfaces has led to interesting optical properties and applications. Here, we explore the control of phase distribution through polar-dielectric metasurfaces composed of doped SiC nanosphere arrays. We investigate the impact of doping concentration on the optical properties of SiC nano-spheres. Our results indicate that increasing the doping of SiC nanoparticles influenced electric dipolar resonances, whereas it did not change the dipolar resonances. Using this concept, we numerically studied the extension of this idea to form metasurface arrays of single, dimer and linear trimers of the doped SiC nano-spheres. Using different doping schemes, we studied the improvement of the reflectivity at frequencies greater than the longitudinal optical phonon frequency.
1. Introduction
Optical metasurfaces, composed of metallic resonators, demonstrate exotic optical properties such as bandpass [1,2] bandstop [3,4,5,6,7] frequency selection, right/left handed circular polarizability [8,9,10,11,12], linear to circular conversion [13,14,15,16], conical beam patterning [17,18,19], focused transmission and reflection [20,21,22,23] and flat lensing behaviors [24,25,26,27]. In addition to metasurfaces composed of metallic nanostructures, similar properties have been shown for metasurfaces composed of silicon nanoparticles [27]. The primary goal of these periodic structures is to manipulate the wavefront of the metasurfaces by patterning and shaping the nanoparticles around their resonance frequencies. In other words, controlling the phase of light using the metasurface’s resonances, one can engineer the wavefront and therefore, interesting optical properties can be achieved. By modifying and improving the conventional Snell’s law, Yu et al. [28] and Ni et al. [29] have shown that the gradient of phase discontinuity at the interface of two mediums with different dielectric function can engineer the direction of the reflected and transmitted light. The idea of the phase discontinuity gradient has been established based on the phase shift of the nanoparticle resonators which can be realized through shaping the nanoparticles. One well-known conventional method of shaping nanoparticles is elongation in which the nanoparticles with the same material properties can resonate at different localized surface plasmon resonance (LSPR) frequencies [30].
In the literature, Zetterling et al. [31] have shown that due to their mechanical tolerability and thermal stability the polar dielectrics (especially SiC), are excellent for high temperature and pressure operations such extreme environments applications. Polar dielectric materials, like SiC [32] and GaN [33] can present negative permittivity properties in the infrared (IR) regime between the longitudinal (LO) and transverse (TO) optical phonon frequencies known as the Reststrahlen band [34,35,36,37]. Moreover, it has been shown that an optically small spherical nanoparticle can support the localized surface vibrational phononic mode which is known as the localized surface phonon resonant (LSPhR) mode [37]. In polar dielectrics, or ionic crystals, the LSPhR mode happens in the Reststrahlen band [30]. The scattering cross-section resonance of nanoparticles composed of polar dielectrics is sharp, which is attractive for controlling the phase of light using nanoparticle surfaces.
The idea of controlling the phase fronts is well known by changing the LSPR of metallic nanoparticles through shaping them. While this idea has been explored in plasmonic [21] and dielectric [27] metasurfaces, it has not been studied in the THz regime with thermomechanically stable materials, such as SiC. The use of thermomechanically stable materials is crucial in extreme environment applications because of their attractive properties such as a high melting point and high durability against stress. In this manuscript, we show control of the phase fronts using SiC, a thermomechanically stable material. In the literature, phase control has been achieved through shaping the materials into desired forms. In this manuscript, we propose an alternative method to phase control through doping of the nanoparticles, which can be more suitable for materials such as SiC. We propose, instead of shaping the SiC nanoparticles to control phase fronts, a novel method of increasing the carrier concentrations of spherical nanoparticles. Using this phase control, we demonstrate that high reflection can be achieved using SiC surfaces. This finding can be particularly attractive for the use of SiC in extreme environments with high reflection. In this paper, the improvement of reflection for SiC for frequencies greater than is also shown. It is well known that reflection at the air-SiC surface is substantially reduced for frequencies greater than [37]. In this work, we show that by tailoring the phase distribution of a metasurface, the reflection spectrum can be improved for frequencies greater than .
In this study, using Mie theory and according to the interaction of the plasmons and the optical phonon vibration of the crystalline nanoparticles composed of polar dielectrics, first we show that the localized surface resonances can be controlled by doping a spherical nanoparticle. We selected the size of the nanoparticles as small enough to excite the dipolar modes. As a result, the effects of carrier concentration on the higher order modes are not studied in this manuscript. In this study, using the finite-difference time-domain (FDTD) method, we investigated the interaction of the plasmons and the optical phonon vibration of the crystalline nanoparticles composed of polar dielectrics. We show numerically that localized surface resonances can be controlled by doping a spherical nanoparticle. We extend this idea to achieve enhanced spectral reflection of IR radiation using metasurface arrays of the single, dimer and linear trimers of the doped SiC nano-spheres. Using different doping schemes, we study the improved reflectivity at the frequencies greater than the longitudinal optical phonon frequency.
2. Doping Effects on the SiC Nanoparticles
In this section, we investigate the doping effects on the optical response of the sub-wavelength nanoparticles composed of 4H–SiC and their individual LSPhR frequency shift. Recently, it has been shown that increasing the number carriers in a bulk 4H-SiC and GaN medium can present a wider Reststrahlen band by enhancing the LO resonant frequency [38,39]. The impact of the optical phonon resonances in the complex dielectric function of the polar-dielectrics can be modeled by the classical Lorentzian resonance function and the effect of doped carriers can be added to the Lorentzian function as a Drude term. With this approach, the dielectric function of SiC can be represented as the summation of the Lorentzian and Drude function [33,40,41]:
where, = 6.5 is the high-frequency permittivity constant, 29 THz and 24 THz are the longitudinal and transverse optical phonon frequencies, respectively, with the damping frequency of 0.08 THz [34,42]. The second term of Equation (1), the plasmon frequency, is related to the carrier concentration through with carrier effective mass of where is the electron mass. In Equation (1) the carrier collision frequency is related to the carrier mobility and the effective mass through with [38]. Figure 1a depicts the real (solid-curve), and imaginary (dashed curve) parts of the dielectric function for 4H–SiC with the carrier concentration of n = . As mentioned earlier, the shaping of the metallic nanoparticles to oblate and prolate nano-spheroids, nanorods and V-shapes is a well-investigated method for changing the LSPR frequency [28]. This approach, however, is more suitable for nanoparticles composed of soft metals, such as Au and Ag. For use in extreme environment applications, materials with higher thermomechanical tolerance are desired which normally possess high melting point. Among these materials, polar dielectrics such as SiC are particularly attractive due to their optical response properties. These optical properties are especially interesting in the IR regime, where a sub-wavelength SiC nanoparticle can demonstrate an optically resonant response.
For a spherical nanoparticle with a sub-wavelength size and immersed in air the resonant condition known as the Frölich frequency is only satisfied if = −2 [43]. The Frölich resonant condition arises from the static polarizability formula of that governs for small spheres in the quasi-static approximation regime. Thus, for a doped spherical SiC nanoparticle with a constant radius (for instance 250 nm) it can be shown that two Frölich frequencies [i.e., and ] at separate frequency bands can be obtained:
where, . The latter issue is in contrast with the resonant plasmonic nanoparticles composed of noble metals in which the spectral position of the LSPR frequencies can be varied through the shape factors.
According to Equation (2), for the pure SiC nanoparticle (i.e.,), the only resonant frequency is due to the optical phonon resonances—or in other words —which is spectrally limited between . In addition, according to Equation (2), it is expected that the appearance of is directly related to the carrier concentration and consequently, the individual plasmon frequency. Figure 1 shows the (dashed curve) and (solid-curve) versus doping concentration for a SiC nano-sphere, respectively.
In Figure 1b, it can be seen that for the SiC nano-sphere and the considered doping concentration, the impact of the increasing doping results in a wide region of frequency variation for however; the carrier concentration enhancement leads to small spectral variations for . Here, is affected by the increase of the plasmon frequency as a result of increased doping; and small red-shift of is due to the plasmon-phonon interactions caused by increasing the doped carrier concentration which means that the energy of the phononic part is increased due to higher collisions of extra carriers [38,44,45]. However, as it can be expected, enhancing the number of carriers leads to the blue-shift of the which in fact represents the higher plasmon frequency. Thus, this tunable localized surface resonance mode of the doped SiC nano-sphere can be considered as a localized surface plasmon/surface phonon (LSP/SPh) resonance. Using the extinction and scattering cross-section spectrums obtained from the Mie theory, cannot represent an individual resonant peak in comparison with . Thus, in the rest of the manuscript we focus on the tunable aspects of For an incident TM-mode of electromagnetic field with = and = , the electric and magnetic polarizabilities of a SiC nanoparticle are given as [30]:
where, is the wavenumber in free space, and are the carrier concentration dependent relation of the dipolar term of the scattering Mie coefficients. Using the presented dielectric function of SiC from Equation (1), the scattering Mie coefficients for all of the stimulated multipole electric polarizabilities can be presented as:
with = , = , and = , respectively. In Equation (4), and demonstrate the spherical Bessel functions of the first and third kind, respectively, where the prime shows their individual argument-based derivatives of the Bessel functions. Figure 1c–f show the normalized amplitude of the electric and magnetic polarizabilities and their relevant phase variations for n = (solid-curve), n = (dashed curve), n = (dashed-dotted curve), respectively. Based on Figure 1c,e, increasing the doping value leads to a red-shift for the (or in other words LSPhR); however, increasing the carrier concentration does not affect the resonant frequency. On the other hand, since is located in the Reststrahlen band which can be controlled by increasing the carrier concentration, enhancement of the dopant amounts in the SiC nanoparticle (which results in stronger plasmon-phonon interactions) can influence the electric dipolar resonant frequency. In contrast, since the magnetic dipole resonance is located at the frequency, which is the pole of the dielectric function, it does not experience an effect by increasing the doping amounts. Based on the results in Figure 1d–f, the phase of the resonating dipoles is varied two times at the resonance frequencies, i.e., and ; and at for the electric and magnetic dipoles, respectively, which is in contrast with the noble metals’ nanoparticles. Although the first phase shifts at and are due to the resonance conditions, the second ones that occur at are because of negative permittivity to positive permittivity transition at this frequency.
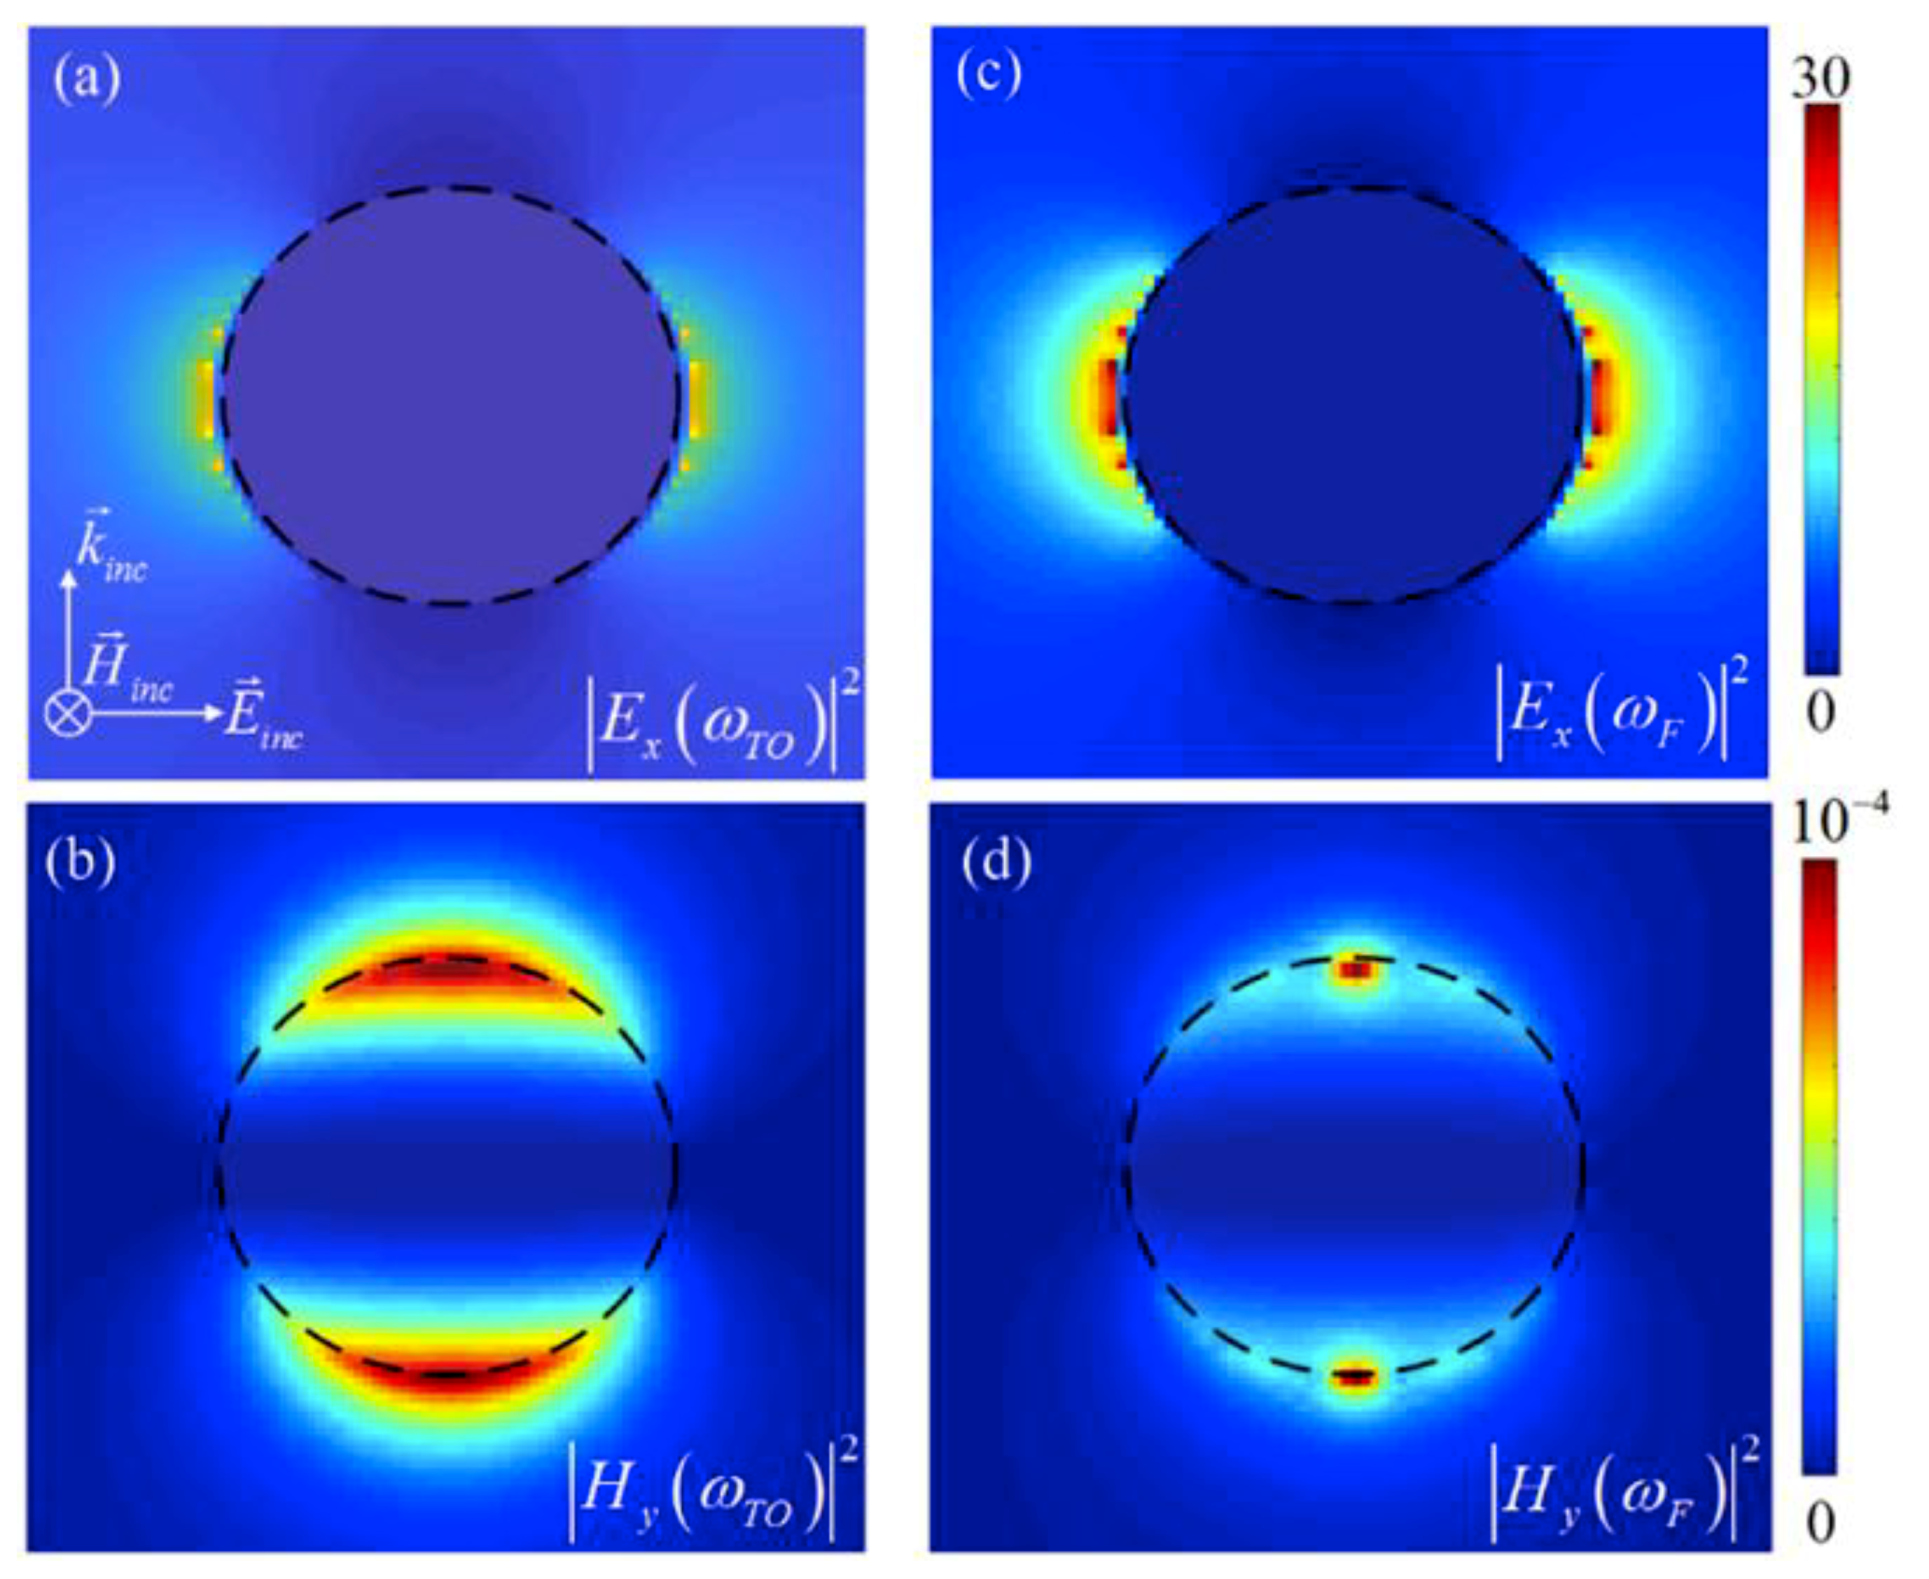
Figure 2a–d illustrates the electric and magnetic field intensities for a carrier concentration of n = at = 24 THz and = 28 THz, respectively. Based on the results in Figure 2a,c, it can be seen that the electric field intensity at is negligible, however it plays an important role at .
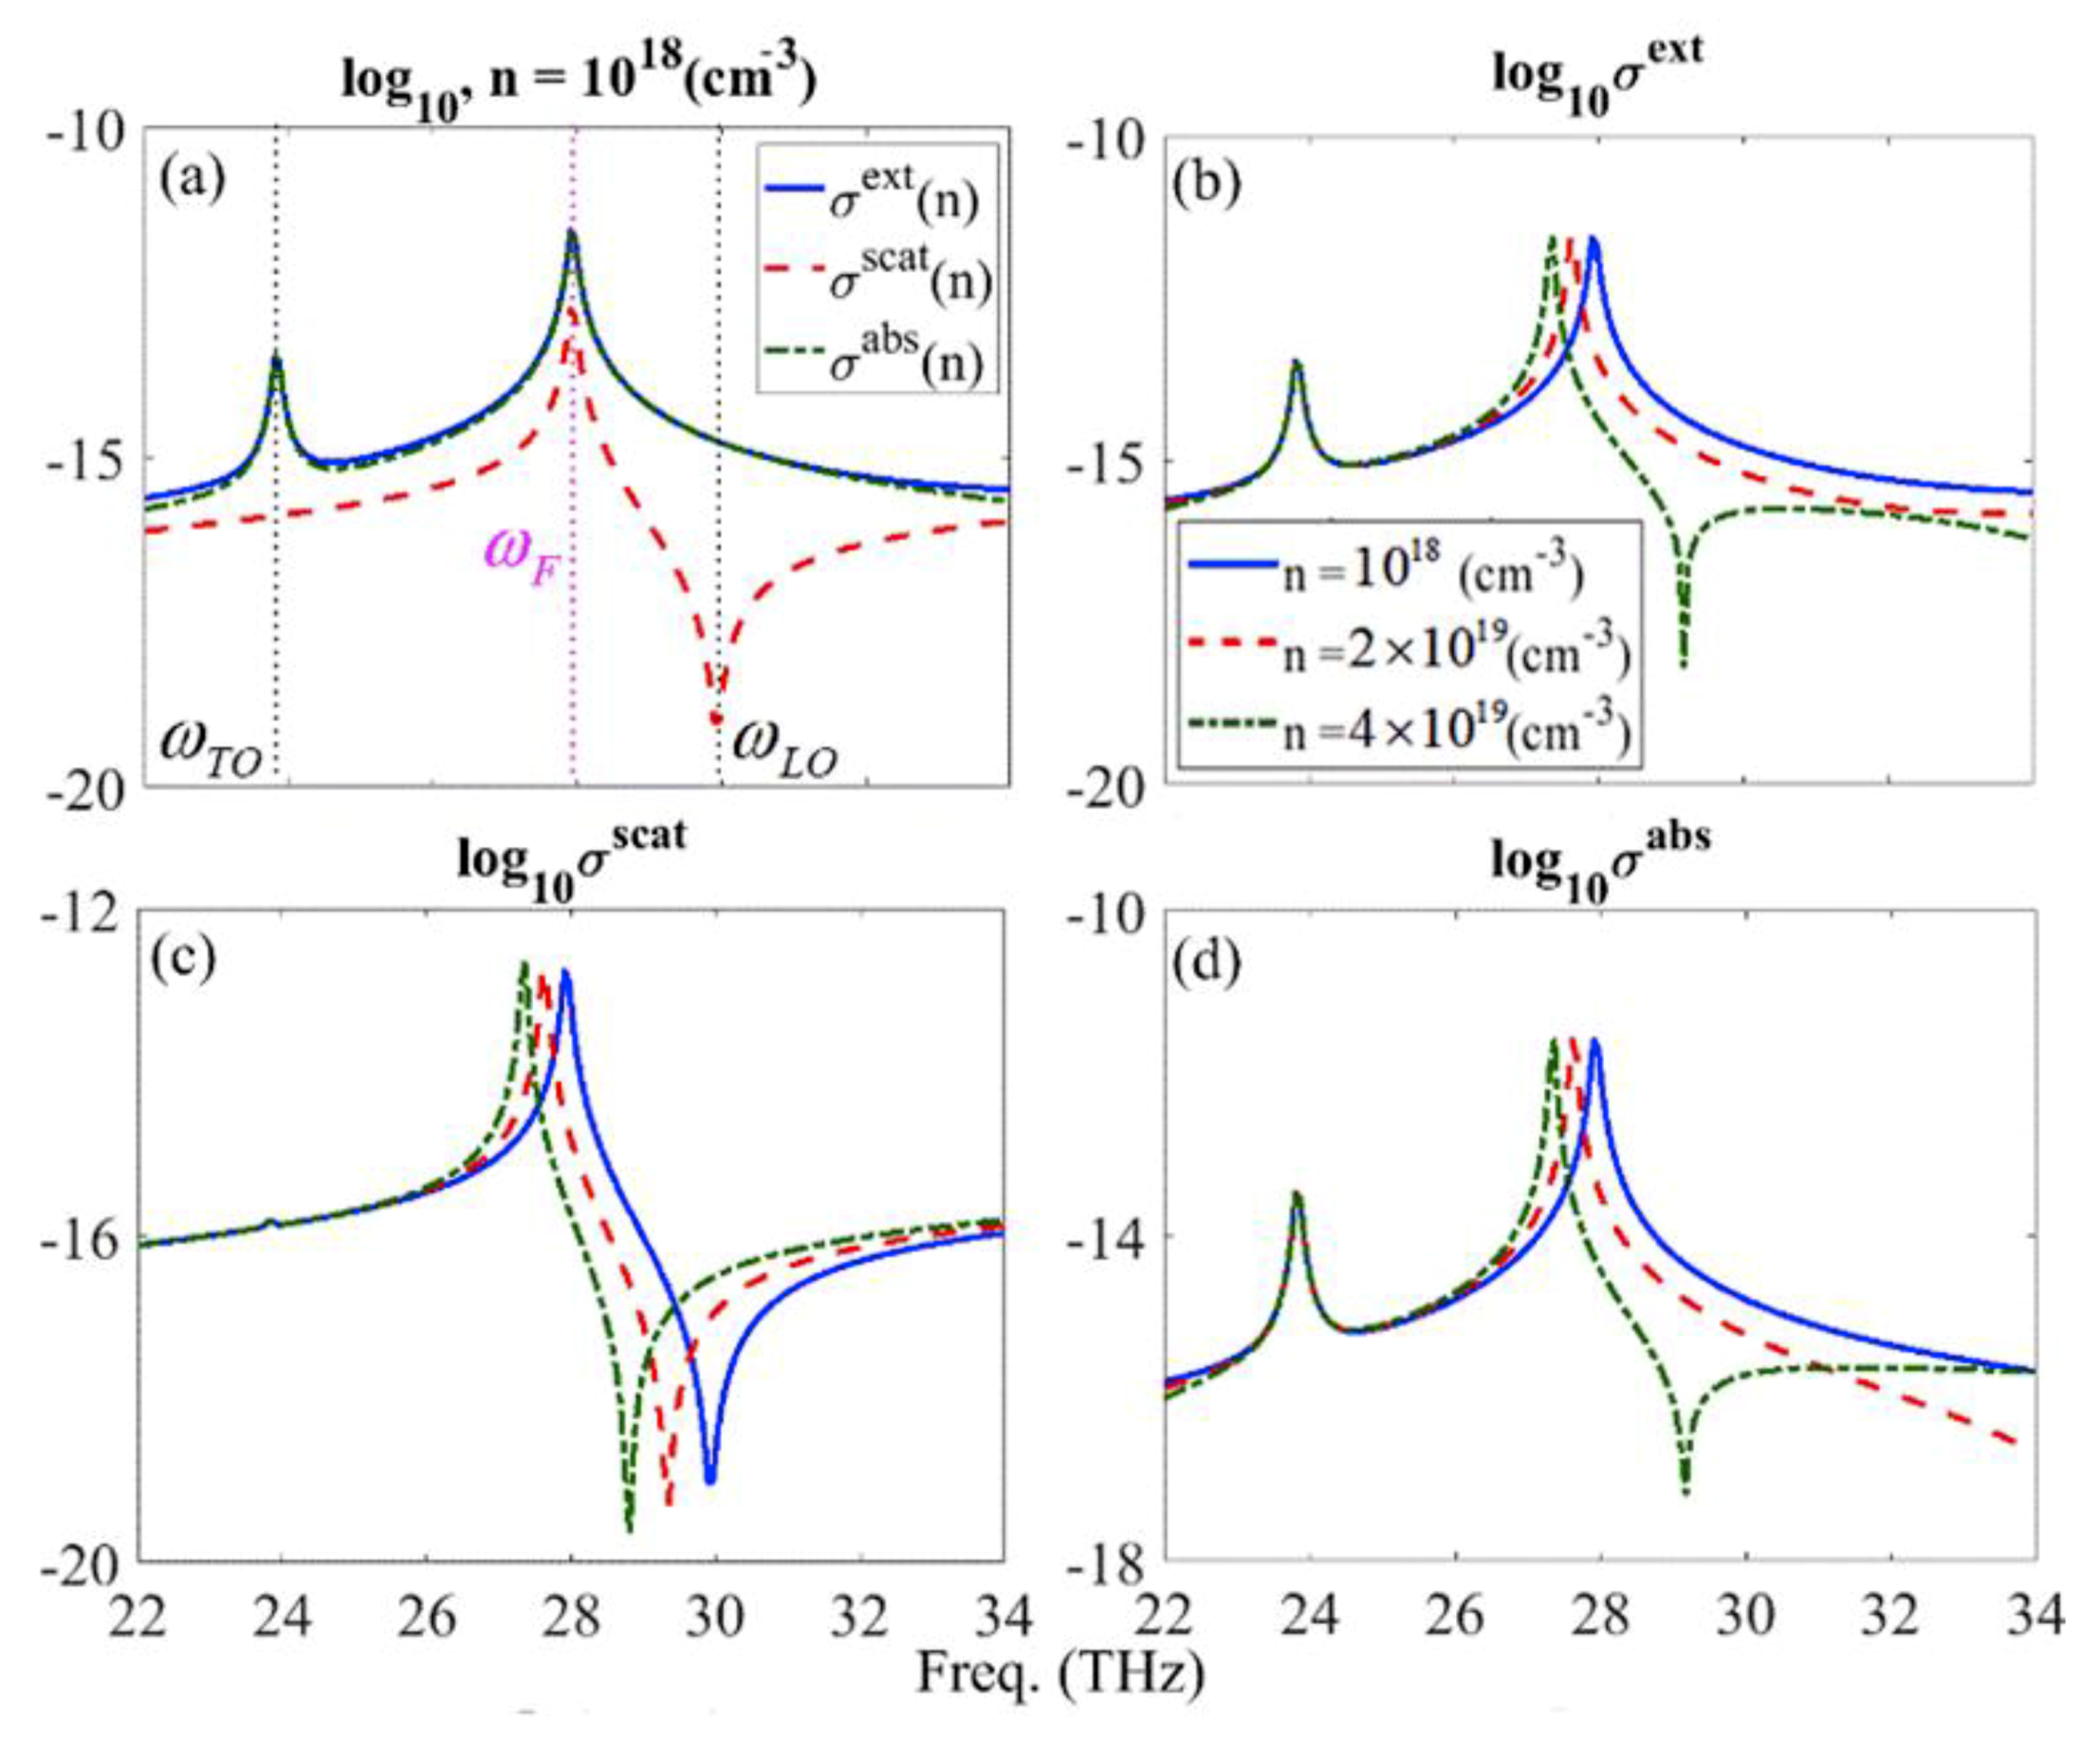
This indicates that the radiation portion of the corresponding electric dipole in the Poynting vector at can be neglected. In contrast, the results in Figure 2b,d reveal that the intensity of the induced magnetic field intensity at is negligible in comparison to , which points to the prevailing role of the magnetic dipolar behavior of the nanoparticle at . These results and observations based on the numerical calculations support the previous discussions based on the theoretical results of the dipolar properties of the considered SiC nanoparticle. To further investigate the doping effects on the optical properties of the SiC nanoparticle in the IR frequencies, we study this impact on the extinction, scattering and absorption cross-sections [i.e., , and ] of the intrinsic and doped SiC particles [30]. Figure 3a demonstrates the logarithmic scale of the extinction (solid-curve), scattering (dashed curve) and absorption (dashed-dotted curve) cross-sections of the SiC nano-sphere with a constant radius of 250 nm and carrier amount of n = , respectively. In Figure 3a, it can be seen that for the SiC nanoparticle, the scattering cross-section is smaller than the extinction and absorption cross-sections and therefore, most of the incident optical energy is absorbed in the nanoparticle. This effect is due to the high imaginary part of the dielectric function of the SiC medium which results in a smaller portion of scattering in the optical extinction cross-section. Although the dominant effect of the electric dipole resonance (i.e.,) is clear in all of the cross sections, the negligible magnetic dipole influence can be tailored in the and ; and minimum scattering can be achieved at . In addition, Figure 3b–d shows the carrier dependency of the extinction, scattering and absorption cross-sections spectrums for the doped SiC nanoparticle in the logarithmic scale for n = (solid curve), n = (dashed curve), n = (dashed-dotted curve), respectively.
In Figure 3b–d, it can be seen that the resonant peak of the electric dipole and the relevant dip of the LO phonon resonances are red-shifted by increasing the carrier concentration. This red shift is due to the plasmon-phonon interaction mechanism which can be stronger by increasing the amount of the carrier concentration. In other words, the higher amount of the carrier concentration, can make this interaction strong enough so that it leads to the red shift of the phonon resonance.
3. Patterned Surface of the Doped SiC Nanoparticles
The real part of the dielectric function of SiC demonstrates a small-positive value for frequencies greater than , which in turn results in a small reflection spectrum of the bulk SiC. In addition to the bulk medium, the same mechanism governs the SiC nano-particles. This can be seen from Figure 3a,c where the minimum scattering cross-section occurs at . In this section, using substrate-induced (SI) metasurfaces composed of the doped SiC nanoparticles, we use a periodic configuration which can compensate for the reflection spectrum for frequencies equal to and/or greater than the LO phonon resonances.
Using the idea of different signs of permittivities for the resonant nanoparticle and substrate, Albooyeh et al. [46] have theoretically and numerically demonstrated that supposing a substrate with a high dielectric permittivity constant (i.e., 12) can satisfy the necessary boundary conditions to achieve an artificial perfect electric conductor (APEC). Since in the Reststrahlen band, SiC represents the negative dielectric properties and as mentioned in the previous section, the individual free-standing nanoparticles can be treated as resonant dipoles (Figure 1b,c).
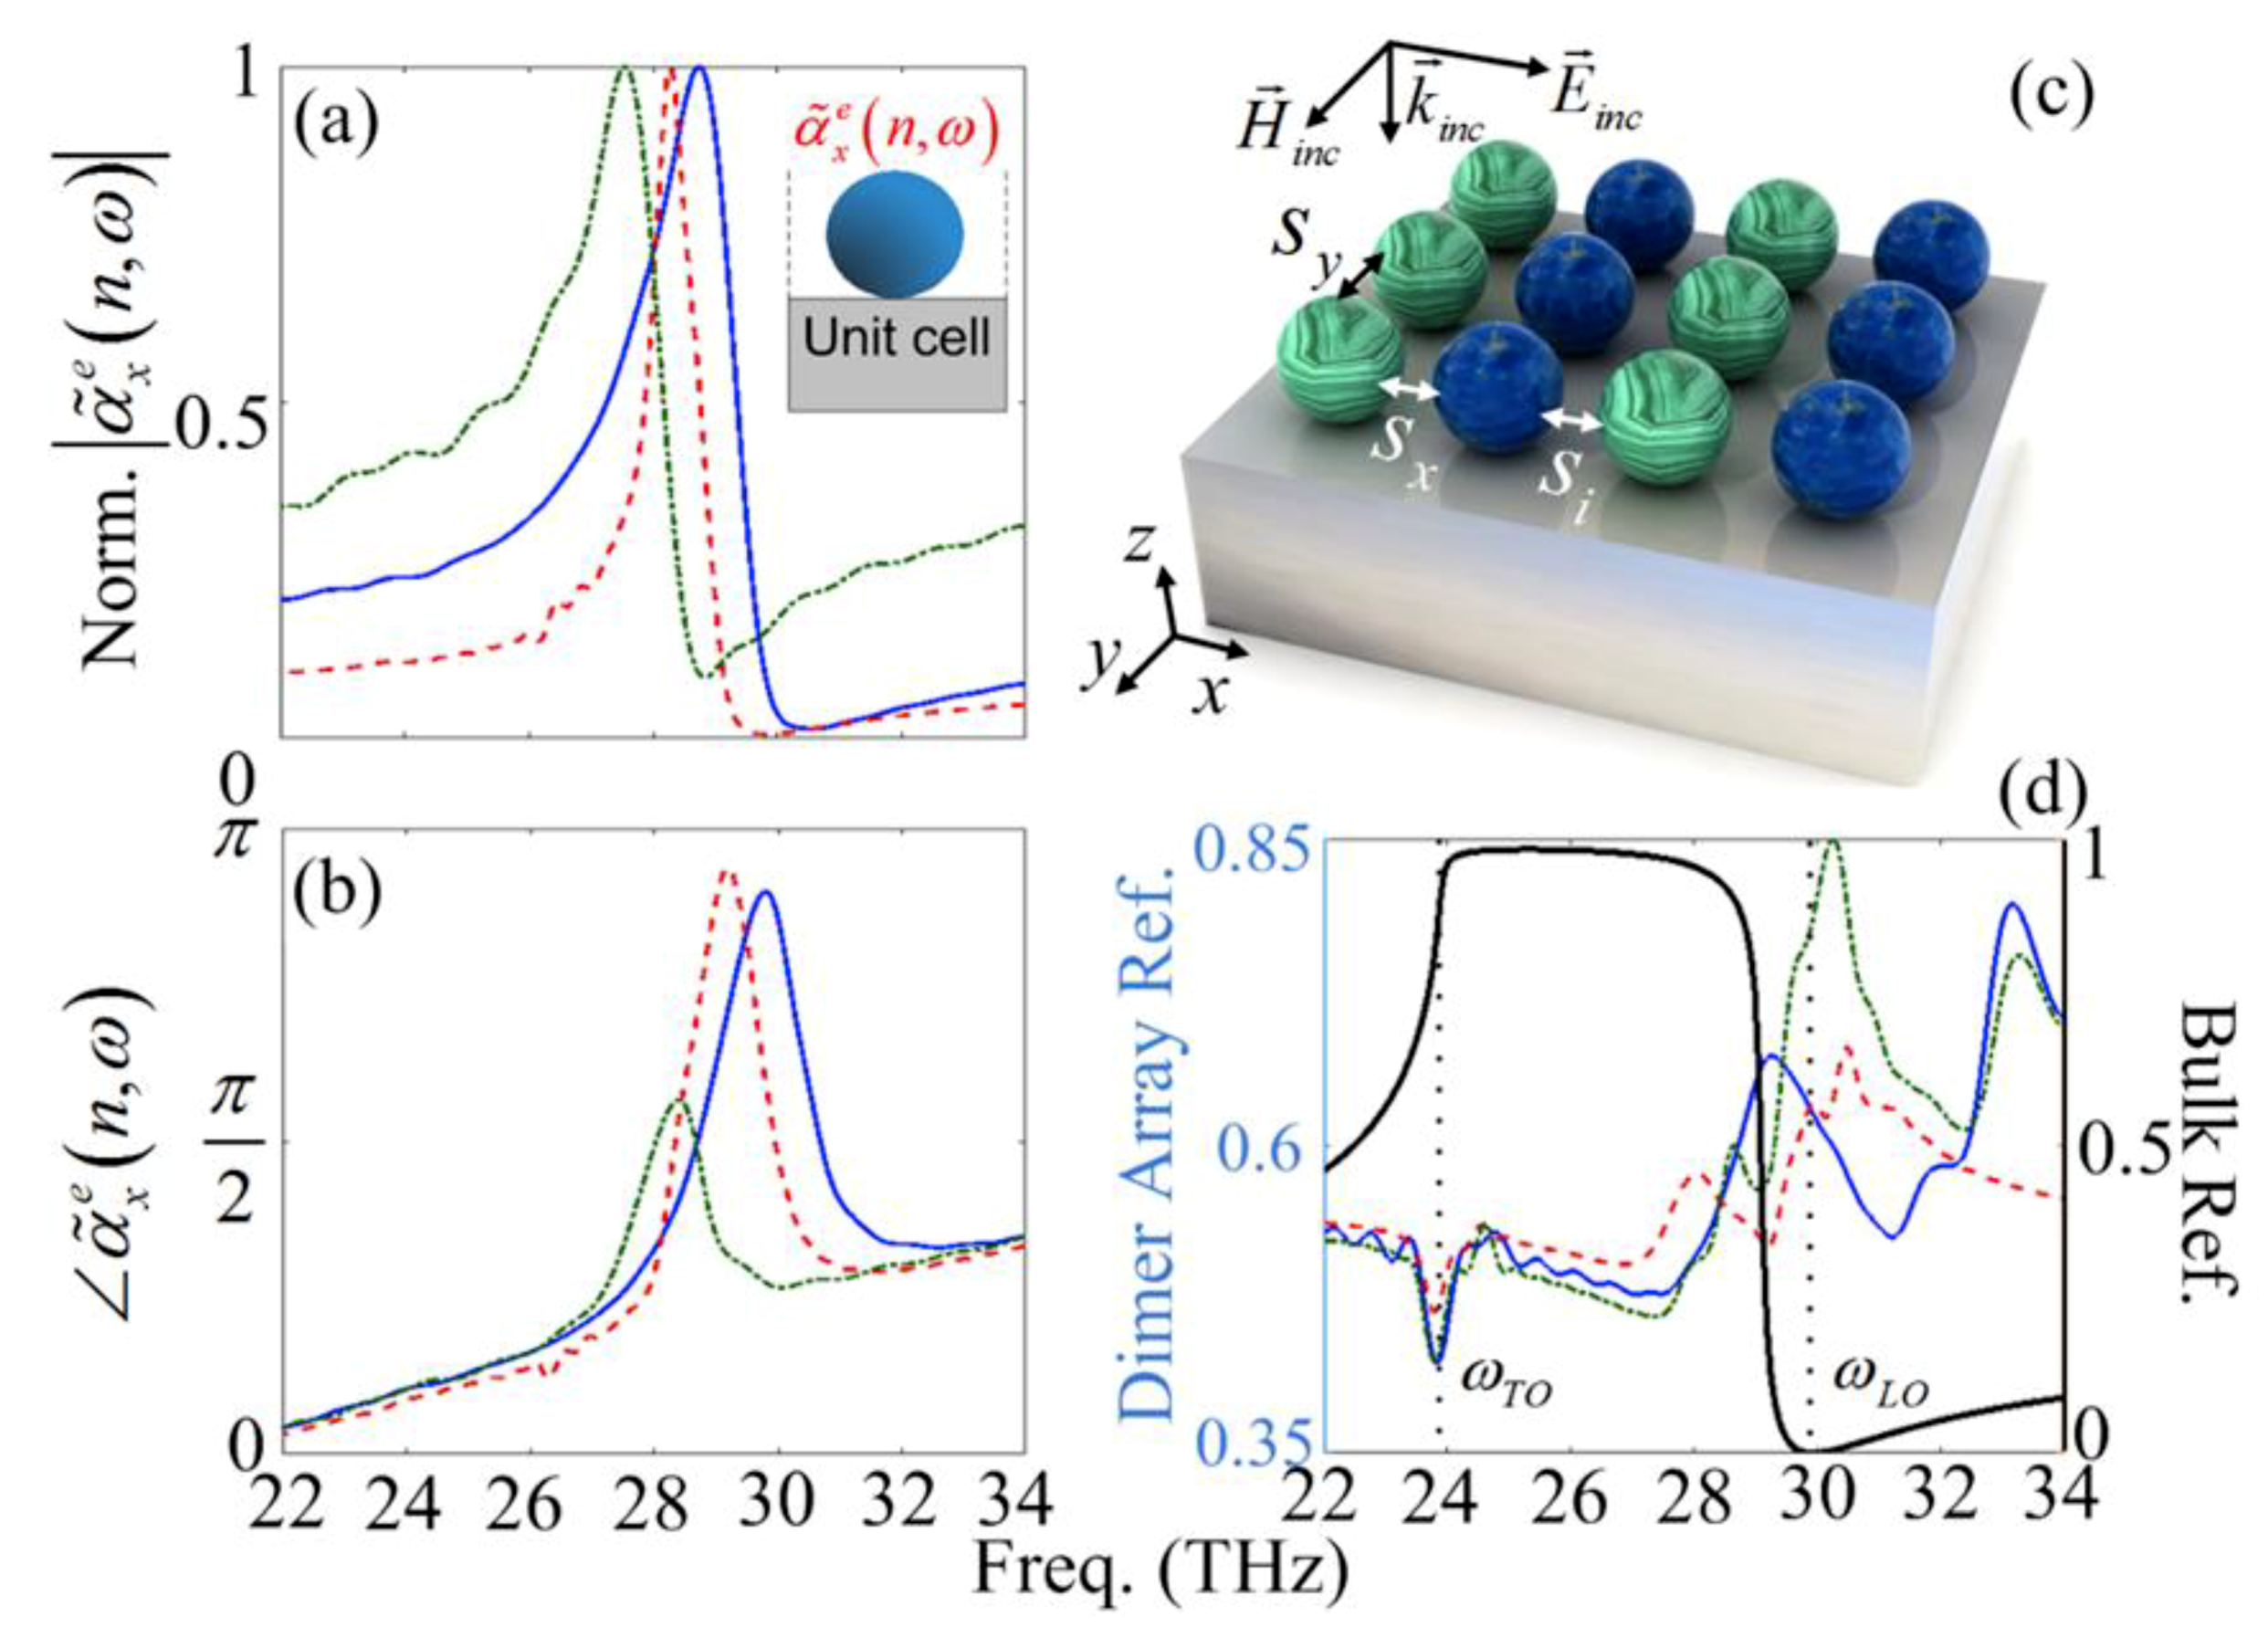
However, satisfying the APEC condition using a high-index substrate can affect the electric polarizability behavior through the induced current density to the substrate; so that the substrate can be replaced by the dipolar image of the nanoparticle. Each single unit-cell consisting of the electric and its induced image can be assumed as an effective dipole . We note that a substrate with 14 can provide an APEC in the IR frequencies. Figure 3a,b shows the normalized amplitude and phase of the effective dipole for (solid curve), (dashed curve) and (dashed-dotted curve), respectively.
Similar to the free-standing SiC nanoparticles with the same size (Figure 1b,c); resonance frequency is red-shifted by increasing the carrier concentration and despite the substrate impacts (especially on phase), the unit-cell shows dipolar behavior. Figure 4c is a schematic of the array of SiC nanoparticle SI dimers with different doping values in a square lattice arrangement with a constant relative permittivity of 14 for the substrate. The separation distance between the dimer unit-cells and their neighbors in the x- and y-directions; and the dimer internal distance of the nanoparticles are considered equal, i.e., = 200 nm. Figure 4d shows the relevant reflection spectrum of the SI array with and (solid curve), and (dashed curve), and (dashed-dotted curve), respectively. It should be noted that with i = 1, 2; symbolizes the doping concentration at each nanoparticle of the dimer. In Figure 4d, the black-solid-curve [the right axis] shows the reflection spectrum of the bulk SiC and the vertical dotted-lines elucidate the spectral position of and frequencies, respectively. According to Figure 4d, it can be seen that a valley of reflection happens for all doping concentrations at frequency. In comparison with the reflection spectrum of bulk SiC in which at frequency the reflection is around zero, for the arrays of SiC nanoparticles it can be seen that a maximum reflection with amplitude of around 40–60 percent can be achieved. To investigate this structure, we used a full wave analysis of the structure based on three dimensional FDTD method with uniform unit cells of = 10 nm by means of the commercial software Lumerical [47]. An incident x-polarized plane-wave illuminates the structure along the z-axis (top-side). The Bloch periodic boundary condition along the x-axis, the symmetric boundary condition along the y-axis (in order to provide the square-lattice), and the stretched coordinate perfectly matched layers (PMLs) with 32 layers along the z-direction were applied to the computation region. The simulation time was set to 80,000 (fs) to ensure convergence of the results. To achieve better insight into the reflection spectrum properties, we studied the near-field dipolar interaction of the nanoparticles.
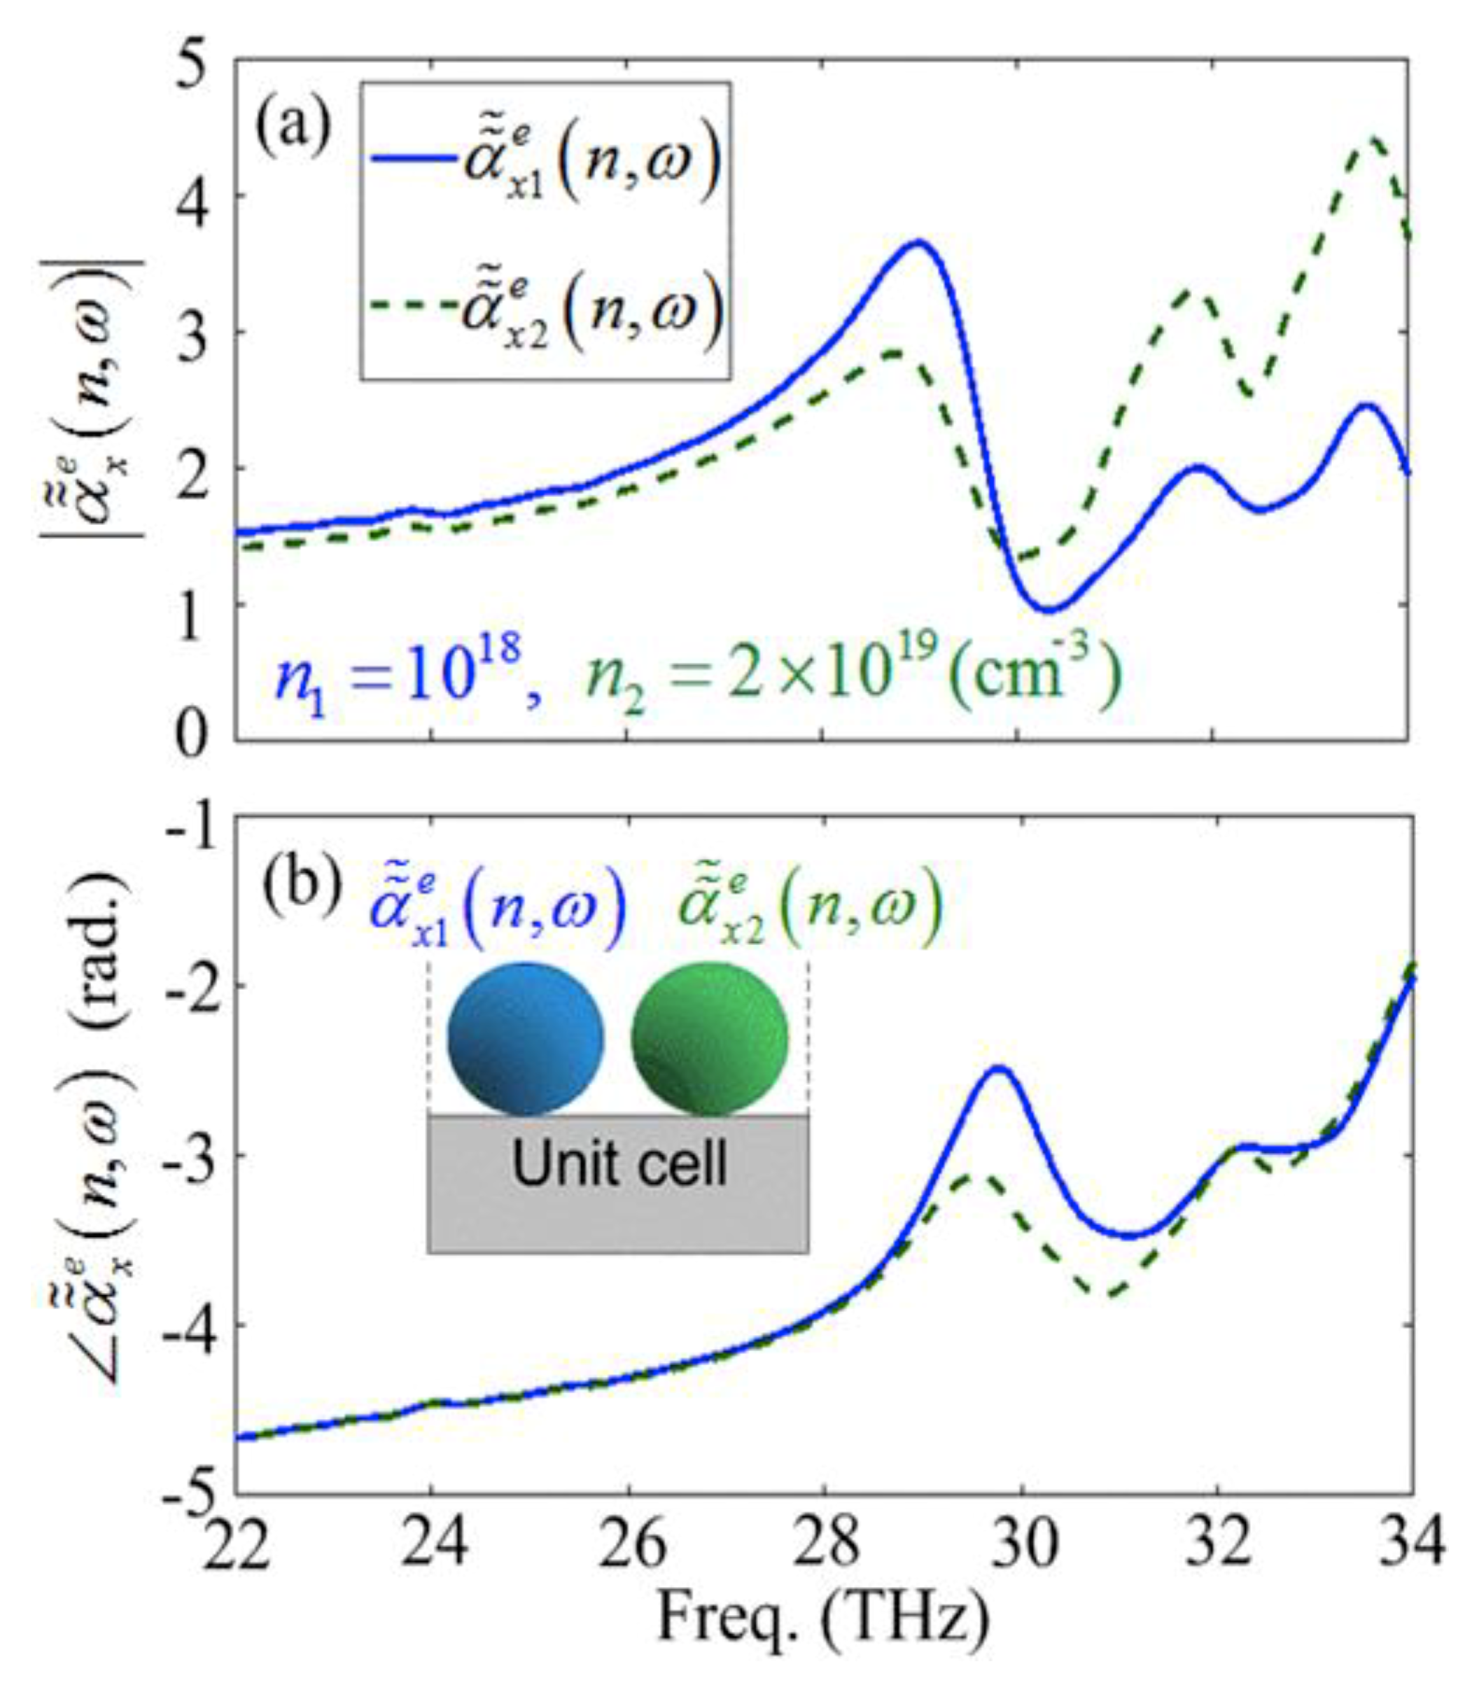
Figure 5a,b shows the amplitude and phase of the effective electric susceptibilities of the doped SiC dimer square array for the (solid curve) and (dashed curve), respectively. The inset of the Figure 5b shows the unit-cell arrangement of the considered structure. It can be seen that the first (low-frequency) and the second (high-frequency) modes of the individual reflection spectrum (see Figure 4d) occur at the phase differences of 0.7(rad.) and 0 (rad.), respectively, while the relevant valley occurs at 0.35 (rad.). Furthermore, it can be interpreted that the first mode happens near the resonant frequency of the single nanoparticles which are slightly red-shifted due to the phononic interactions between the nanoparticles.
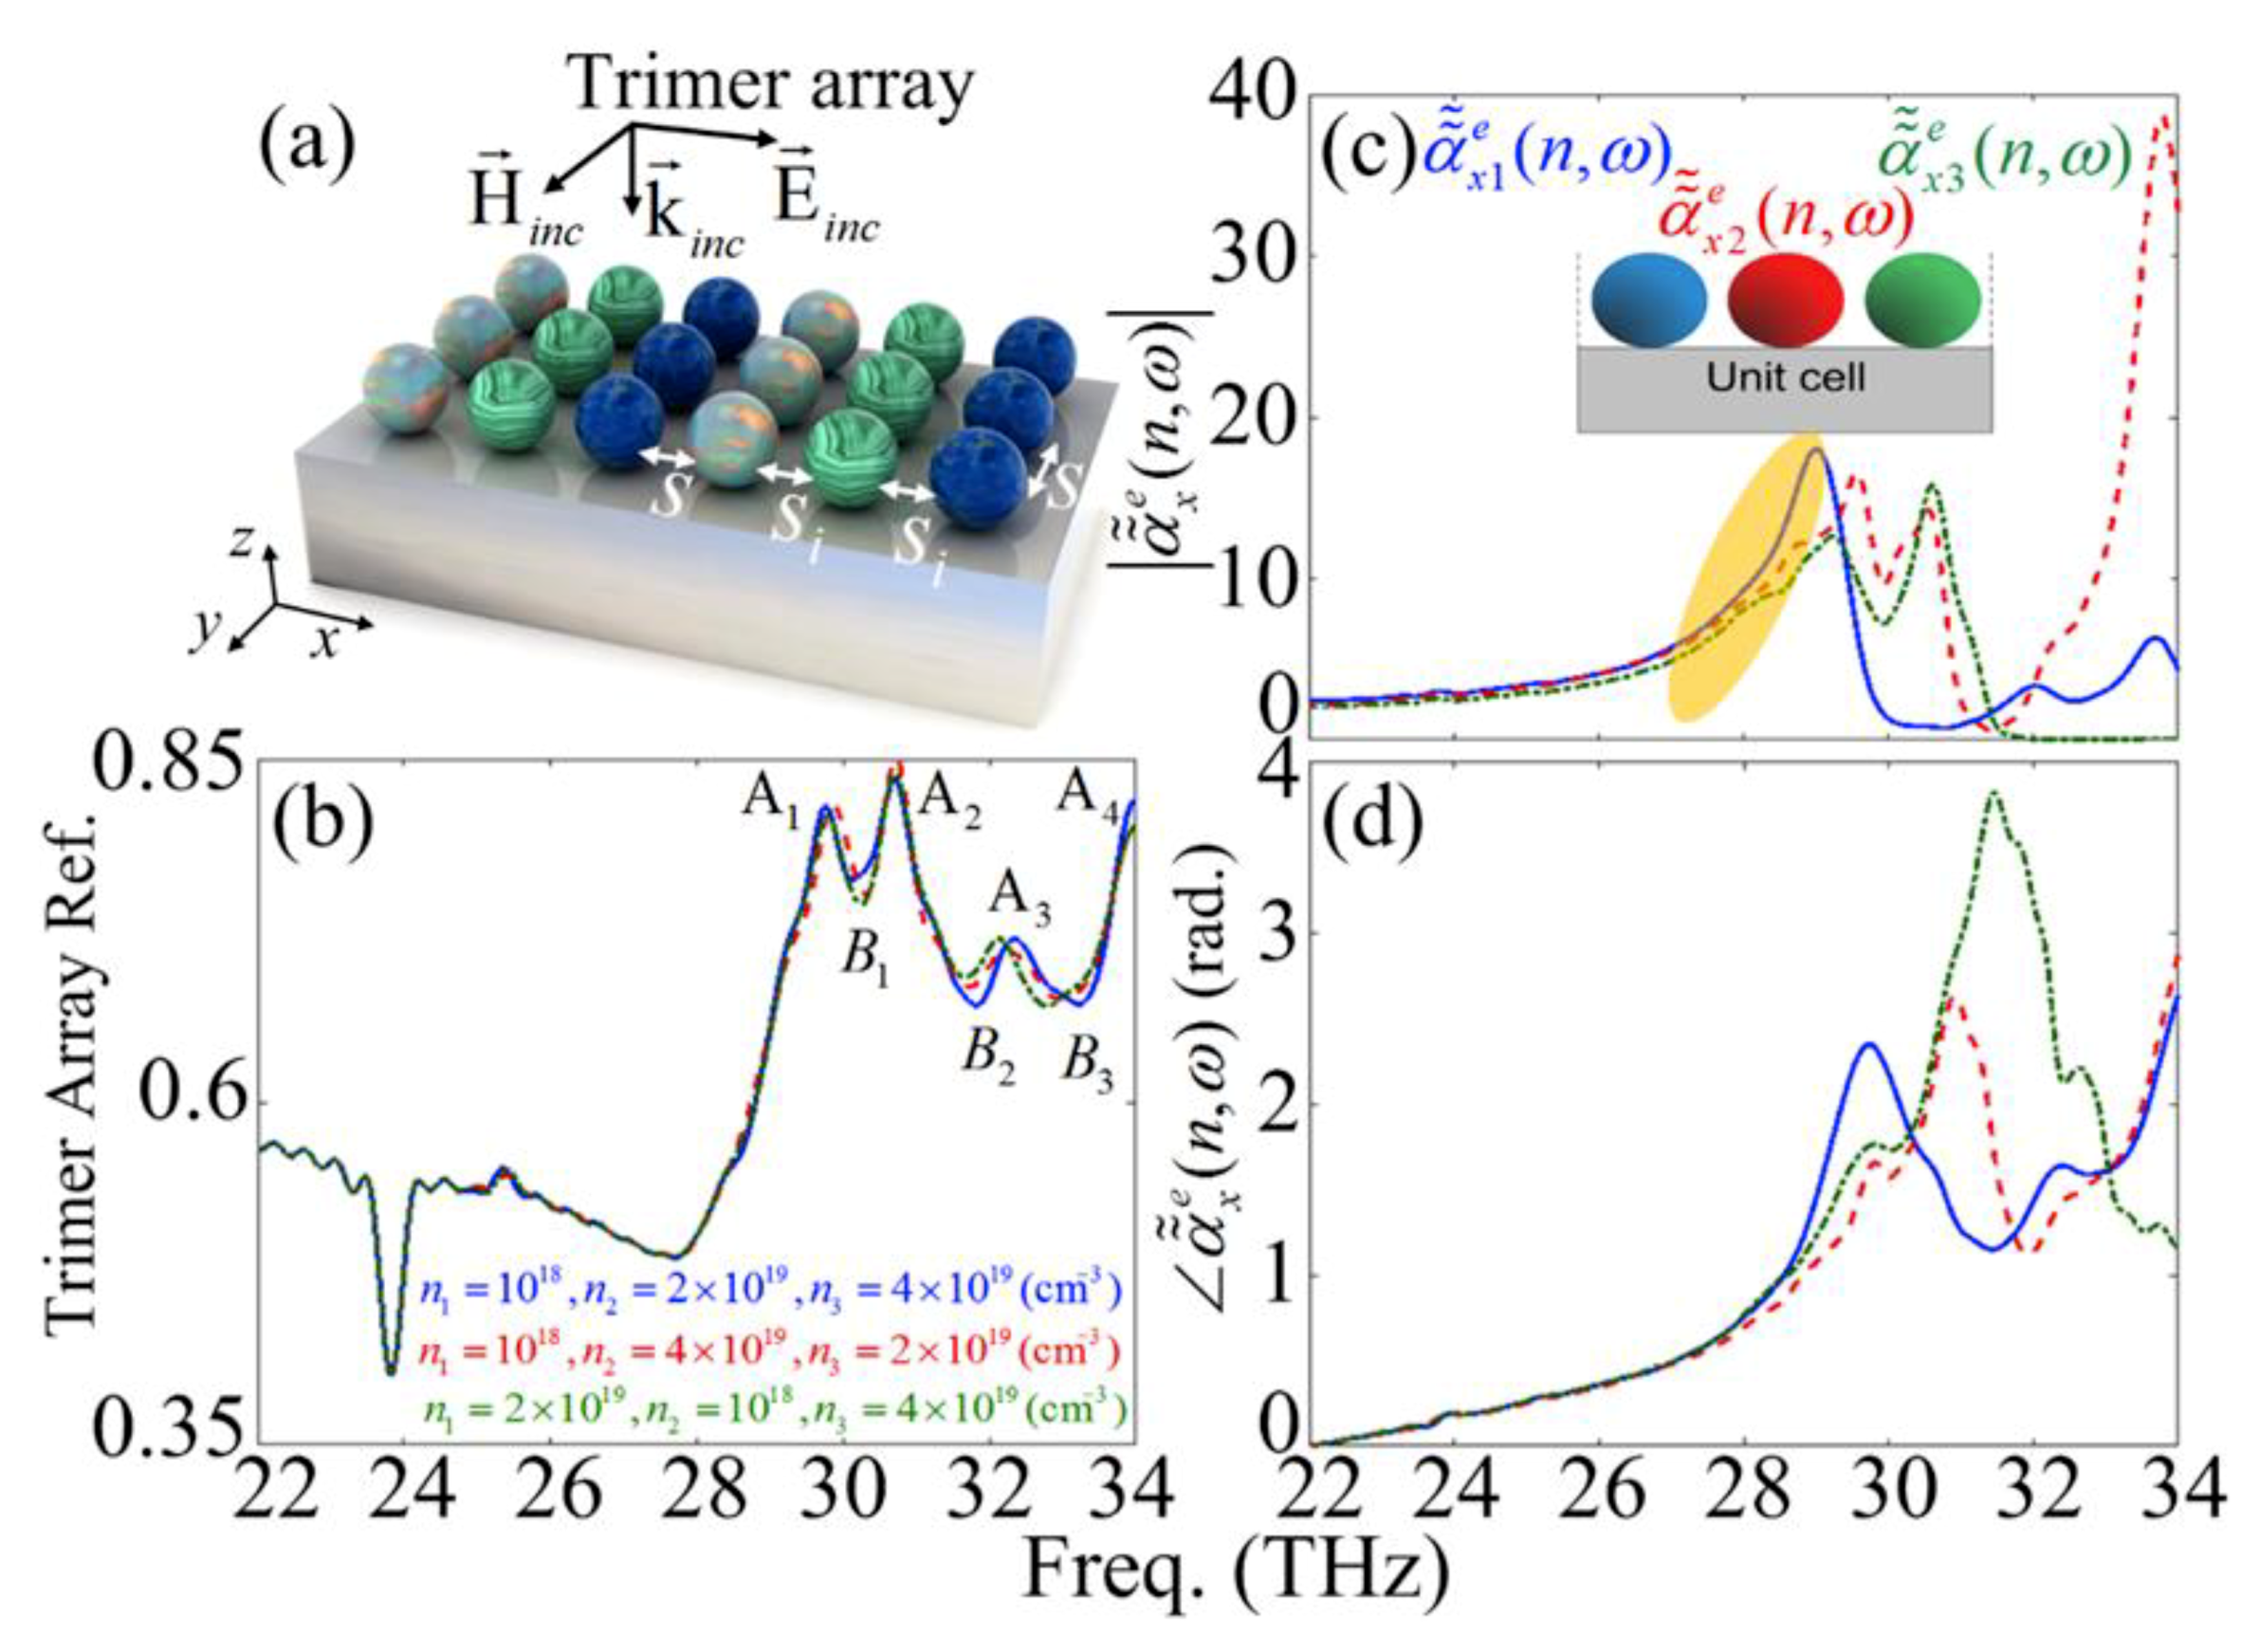
The reflection spectrum bandwidth can be enhanced by increasing the number of interacting dipoles with a different carrier concentration. To further improve and broaden the reflection spectrum of the considered structure, we use trimer cells in the square periodic configuration. Figure 6a demonstrates the schematic representation of the SiC nanoparticle periodic array configuration composed of the linear trimers. The internal separation distance between the nanoparticles and the cell-separation distance between an individual trimer cell with its adjacent cells in the x- and y-directions are defined as and of , respectively. It should be noted that, we have assumed equal separation distances of 200 nm for the trimer structure. Moreover, Figure 6b depicts the reflection spectrum of the trimer arrays for , and (solid curve), , , and (dashed curve) and , , and (dashed-dotted curve), respectively.
Accordingly, four separate reflection peaks and three dips known as – modes; and – modes, can be distinguished, respectively. It can be seen that the maximum reflection occurs at , and modes. To investigate the origin of the peaks and dips we studied the near-field interaction between the nanoparticles of each trimer unit-cell. Figure 6c,d presents the amplitude and phase of the effective electric susceptibilities of the doped SiC trimer square array for , , and (solid curve), , , and (dashed curve) and , , and (dashed-dotted curve), respectively. It can be seen that at each mode, a pair of in-phase interacting dipoles are interacting with another out-of-phase dipole. Throughout this manuscript the dipolar interactions with very small phase differences [around zero radian] are assumed as in-phase interactions and the interactions with phase difference of around or more than 0.5 (rad.) are assumed as out-phase interactions. For instance, at the and modes, and pair interact in-phase together and out-of-phase with [with phase differences of 0.4 and 0.7 (rad), respectively]. In contrast, at the and modes the pair of and are in-phase together and out-of-phase with . The same interacting rule governs the – modes. The interaction mechanism of the effective polarizabilities at each mode is summarized in Table 1. Furthermore, according to Figure 6c, it can be seen that in addition to the resonant peaks due to the near-field interactions, the individual resonant peak of the each single nanoparticle is similar to the periodic dimer structure (see the yellow-colored region).
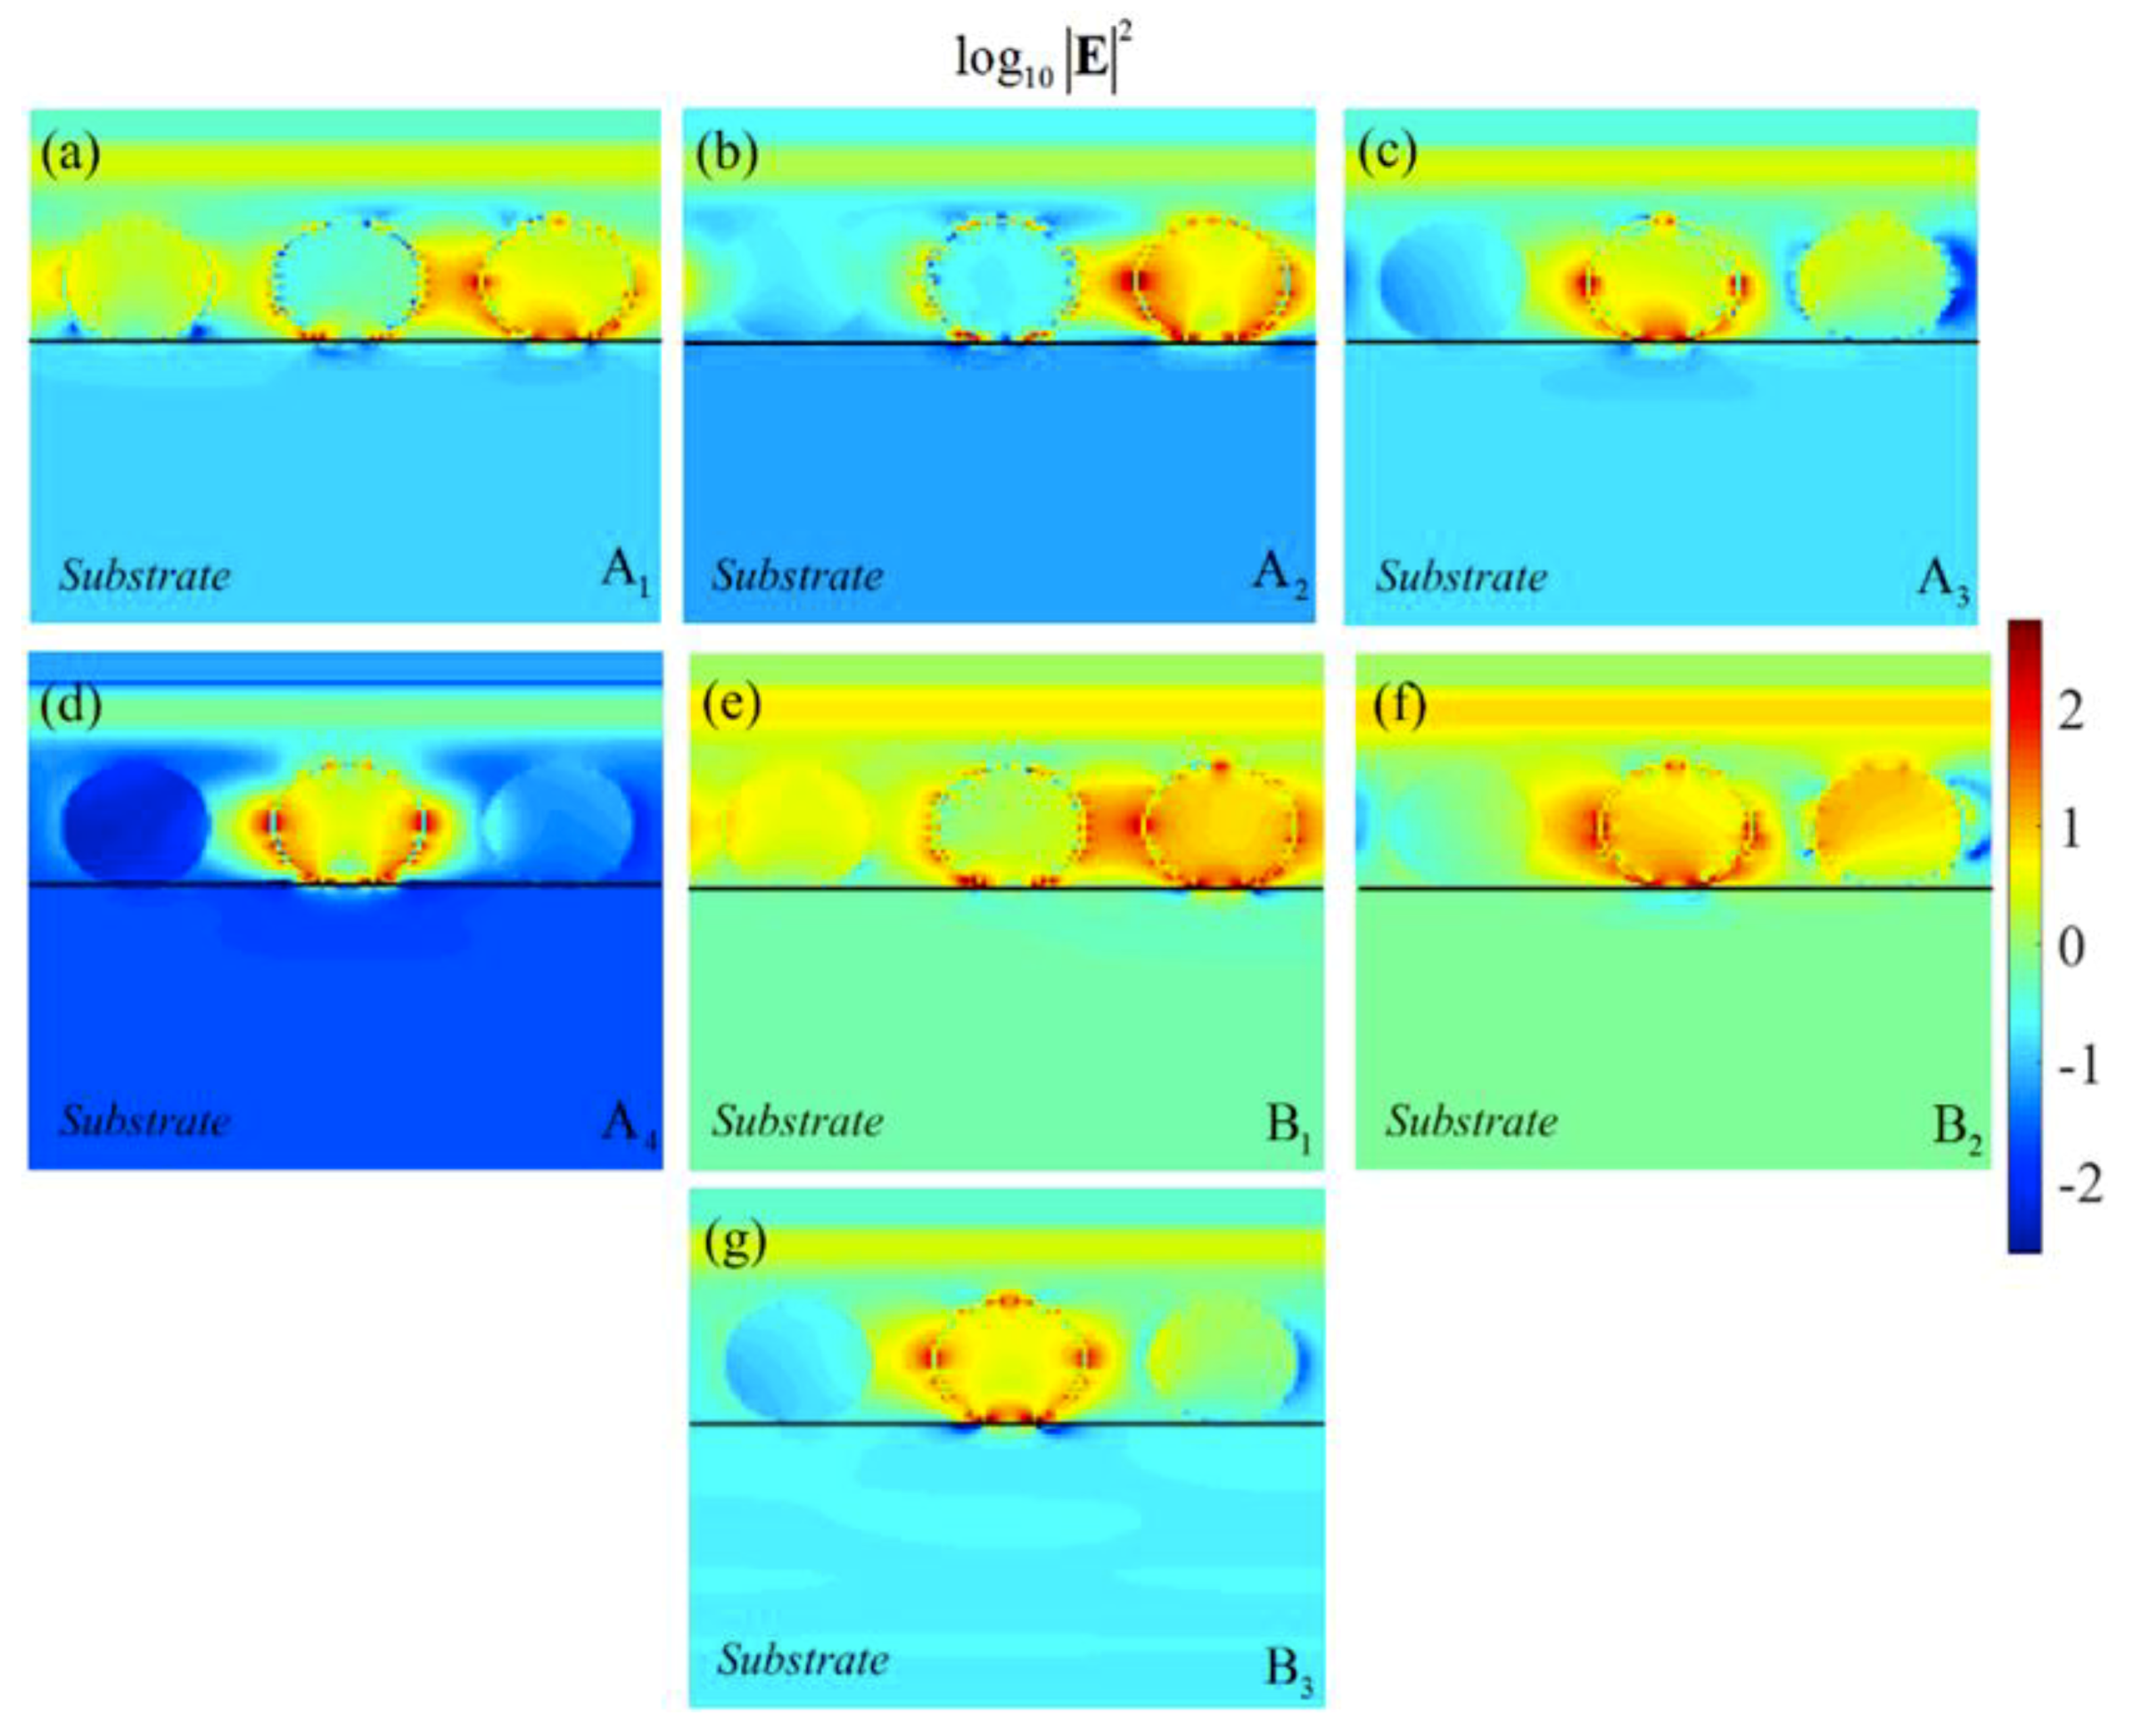
Particularly for (dashed curve) and (dashed-dotted curve), these resonant peaks appear in the form of semi-shoulder resonances. Figure 7a–g elucidate the electric field distribution in the xz-plane and in a logarithmic scale of the unit-cell of the trimer array metasurface composed of the SiC nanoparticles at – (Figure 7a–d); and – (Figure 7e–g), respectively.
In Figure 7a–g, the carrier concentration for the individual nanoparticles are considered as an , , and arrangement. It can be seen that at the – modes the reflection of the incident field is maximized while at the – modes the reflection is smaller, respectively. If the spheres are replaced by other geometrical shapes, such as rods, it enables the excitation of the higher orders of polar resonances using rod size and aspect ratio in a more controlled manner. As the higher order of polar near-field interaction between the neighboring rods may not be as strong as the dipolar interaction, the reflection spectrum from a metasurface composed of rods may be more limited as it is mostly dominated by dipolar interactions.
4. Conclusions
In this study, spectral characteristics of SiC metasurfaces are demonstrated using Mie theory. Our results in the first part show how the extra carriers affect the LSPhR and the dipolar behavior of an individual SiC nanoparticle. In the second part, using the FDTD method we numerically demonstrate the spectral broadening of the reflectivity using patterned SiC-doped structures. We have shown that each SiC nanoparticle can be modeled by a resonant electric dipole in the Reststrahlen band (i.e., the negative permittivity region) and a magnetic dipole at the TO phonon frequency. Furthermore, we have demonstrated that enhancing the carrier concentration amounts in a subwavelength nanoparticle leads to a red-shift of the resonant peak in the electric dipole, while the negligible magnetic dipole may not be influenced by the doping. Based on these results we have presented an APEC array configuration of the n-doped SiC nano-spheres with a constant radius which can compensate for the reflection amplitude for the frequencies greater than ωLO.
Author Contributions
Both authors contributed equally to the methodology, writing, and revising of the article. Coding the theoretical formulas and performing the numerical simulations, M.J. Funding acquisition and project administration, K.Ş. All authors have read and agreed to the published version of the manuscript.
Funding
This research was funded by the Air Force Office of Scientific Research (Aerospace Materials for Extreme Environments Program, PM: Ali Sayir) under award number FA9550-17-1-0092.
Acknowledgments
This material is based upon work supported by the Air Force Office of Scientific Research (Aerospace Materials for Extreme Environments Program, PM: Ali Sayir) under award number FA9550-17-1-0092.
Conflicts of Interest
The authors declare no conflict of interest.
References
- Liang, Y.; Zhang, S.; Cao, X.; Lu, Y.; Xu, T. Free-standing plasmonic metal-dielectric-metal bandpass filter with high transmission efficiency. Sci. Rep. 2017, 7, 4357. [Google Scholar] [CrossRef] [PubMed] [Green Version]
- Soni, A.; Purohit, S.; Hegde, R.S. Multilayered Aluminum Plasmonic Metasurfaces for Ultraviolet Bandpass Filtering. IEEE Photonics Technol. Lett. 2017, 29, 110–113. [Google Scholar] [CrossRef]
- Liu, Y.; Zhong, R.; Lian, Z.; Bu, C.; Liu, S. Dynamically tunable band stop filter enabled by the metal-graphene metamaterials. Sci. Rep. 2018, 8, 2828. [Google Scholar] [CrossRef] [PubMed]
- Hu, X.L.; Sun, L.B.; Wu, Q.J.; Wang, L.S.; Bai, S.A.; Li, Q.; Yang, S.M.; Tai, R.Z.; Mohr, M.; Fecht, H.J.; et al. Broad band optical band-reject filters in near-infrared regime utilizing bilayer Ag metasurface. J. Appl. Phys. 2017, 121, 153105. [Google Scholar] [CrossRef]
- Chou Chau, Y.-F.; Syu, J.-Y.; Chao, C.-T.C.; Chiang, H.-P.; Lim, C.M. Design of crossing metallic metasurface arrays based on high sensitivity of gap enhancement and transmittance shift for plasmonic sensing applications. J. Phys. D 2017, 50, 045105. [Google Scholar] [CrossRef]
- Gwo, S.; Wang, C.-Y.; Chen, H.-Y.; Lin, M.-H.; Sun, L.; Li, X.; Chen, W.-L.; Chang, Y.-M.; Ahn, H. Plasmonic Metasurfaces for Nonlinear Optics and Quantitative SERS. ACS Photonics 2016, 3, 1371–1384. [Google Scholar] [CrossRef]
- Wei, Z.; Li, X.; Yin, J.; Huang, R.; Liu, Y.; Wang, W.; Liu, H.; Meng, H.; Liang, R. Active plasmonic band-stop filters based on graphene metamaterial at THz wavelengths. Opt. Express 2016, 24, 14344. [Google Scholar] [CrossRef]
- Karimi, E.; Schulz, S.A.; De Leon, I.; Qassim, H.; Upham, J.; Boyd, R.W. Generating optical orbital angular momentum at visible wavelengths using a plasmonic metasurface. Light Sci. Appl. 2014, 3, e167. [Google Scholar] [CrossRef] [Green Version]
- Zhao, Y.; Belkin, M.A.; Alù, A. Twisted optical metamaterials for planarized ultrathin broadband circular polarizers. Nat. Commun. 2012, 3, 870. [Google Scholar] [CrossRef] [Green Version]
- Wen, D.; Yue, F.; Kumar, S.; Ma, Y.; Chen, M.; Ren, X.; Kremer, P.E.; Gerardot, B.D.; Taghizadeh, M.R.; Buller, G.S.; et al. Metasurface for characterization of the polarization state of light. Opt. Express 2015, 23, 10272. [Google Scholar] [CrossRef]
- Fasold, S.; Linß, S.; Kawde, T.; Falkner, M.; Decker, M.; Pertsch, T.; Staude, I. Disorder-Enabled Pure Chirality in Bilayer Plasmonic Metasurfaces. ACS Photonics 2018, 5, 1773–1778. [Google Scholar]
- Wei, Q.; Huang, L.; Li, X.; Liu, J.; Wang, Y. Broadband Multiplane Holography Based on Plasmonic Metasurface. Adv. Opt. Mater. 2017, 5, 1700434. [Google Scholar] [CrossRef]
- Cao, W.; Yang, X.; Gao, J. Broadband polarization conversion with anisotropic plasmonic metasurfaces. Sci. Rep. 2017, 7, 8841. [Google Scholar] [CrossRef] [PubMed]
- Jia, Y.; Liu, Y.; Zhang, W.; Wang, J.; Wang, Y.; Gong, S.; Liao, G. Ultra-wideband metasurface with linear-to-circular polarization conversion of an electromagnetic wave. Opt. Mater. Express 2018, 8, 597. [Google Scholar] [CrossRef]
- Li, T.; Hu, X.; Chen, H.; Zhao, C.; Xu, Y.; Wei, X.; Song, G. Metallic metasurfaces for high efficient polarization conversion control in transmission mode. Opt. Express 2017, 25, 23597. [Google Scholar] [CrossRef]
- Li, Z.; Liu, W.; Cheng, H.; Chen, S.; Tian, J. Realizing Broadband and Invertible Linear-to-circular Polarization Converter with Ultrathin Single-layer Metasurface. Sci. Rep. 2016, 5, 18106. [Google Scholar] [CrossRef] [Green Version]
- Zhang, Y.; Yang, X.; Gao, J. Twisting phase and intensity of light with plasmonic metasurfaces. Sci. Rep. 2018, 8, 4884. [Google Scholar] [CrossRef] [Green Version]
- Liu, Y.; Ke, Y.; Zhou, J.; Liu, Y.; Luo, H.; Wen, S.; Fan, D. Generation of perfect vortex and vector beams based on Pancharatnam-Berry phase elements. Sci. Rep. 2017, 7, 44096. [Google Scholar] [CrossRef] [Green Version]
- Scheuer, J. Metasurfaces-based holography and beam shaping: Engineering the phase profile of light. Nanophotonics 2017, 6, 137–152. [Google Scholar] [CrossRef]
- Nanfang, Y.; Genevet, P.; Aieta, F.; Kats, M.A.; Blanchard, R.; Aoust, G.; Tetienne, J.-P.; Gaburro, Z.; Capasso, F. Flat Optics: Controlling Wavefronts With Optical Antenna Metasurfaces. IEEE J. Sel. Top. Quantum Electron. 2013, 19, 4700423. [Google Scholar] [CrossRef]
- Fan, J.A.; Wu, C.; Bao, K.; Bao, J.; Bardhan, R.; Halas, N.J.; Manoharan, V.N.; Nordlander, P.; Shvets, G.; Capasso, F. Self-assembled plasmonic nanoparticle clusters. Science 2010, 328, 1135–1138. [Google Scholar] [CrossRef] [PubMed]
- Fattal, D.; Li, J.; Peng, Z.; Fiorentino, M.; Beausoleil, R.G. Flat dielectric grating reflectors with focusing abilities. Nat. Photonics 2010, 4, 466–470. [Google Scholar] [CrossRef] [Green Version]
- Aieta, F.; Genevet, P.; Yu, N.; Kats, M.A.; Gaburro, Z.; Capasso, F. Out-of-Plane Reflection and Refraction of Light by Anisotropic Optical Antenna Metasurfaces with Phase Discontinuities. Nano Lett. 2012, 12, 1702–1706. [Google Scholar] [CrossRef] [PubMed]
- Chen, K.C.; Yang, J.W.; Yang, Y.-C.; Khin, C.F.; Kehn MN, M. Plasmonic Luneburg lens antenna synthesized by metasurfaces with hexagonal lattices. Opt. Express 2017, 25, 27405. [Google Scholar] [CrossRef]
- Yang, Q.; Gu, J.; Wang, D.; Zhang, X.; Tian, Z.; Ouyang, C.; Singh, R.; Han, J.; Zhang, W. Efficient flat metasurface lens for terahertz imaging. Opt. Express 2014, 2, 25931. [Google Scholar] [CrossRef]
- Zeng, C.; Liu, X.; Wang, G. Electrically tunable graphene plasmonic quasicrystal metasurfaces for transformation optics. Sci. Rep. 2015, 4, 5763. [Google Scholar] [CrossRef] [Green Version]
- Ma, Z.; Hanham, S.M.; Albella, P.; Ng, B.; Lu, H.T.; Gong, Y.; Maier, S.A.; Hong, M. Terahertz All-Dielectric Magnetic Mirror Metasurfaces. ACS Photonics 2016, 3, 1010–1018. [Google Scholar]
- Yu, N.; Genevet, P.; Kats, M.A.; Aieta, F.; Tetienne, J.-P.; Capasso, F.; Gaburro, Z. Light Propagation with Phase Discontinuities: Generalized Laws of Reflection and Refraction. Science 2011, 334, 333–337. [Google Scholar] [CrossRef] [Green Version]
- Ni, X.; Emani, N.K.; Kildishev, A.V.; Boltasseva, A.; Shalaev, V.M. Broadband Light Bending with Plasmonic Nanoantennas. Science 2012, 335, 427. [Google Scholar] [CrossRef] [Green Version]
- Bohren, C.F.; Huffman, D.R. Absorption and Scattering of Light by Small Particles; Wiley: New York, NY, USA, 1983. [Google Scholar]
- Zetterling, C.-M.; Hallén, A.; Hedayati, R.; Kargarrazi, S.; Lanni, L.; Malm, B.G.; Mardani, S.; Norström, H.; Rusu, A.; Suvanam, S.S.; et al. Bipolar integrated circuits in SiC for extreme environment operation. Semicond. Sci. Technol. 2017, 32, 034002. [Google Scholar] [CrossRef]
- Law, S.; Yu, L.; Rosenberg, A.; Wasserman, D. All-Semiconductor Plasmonic Nanoantennas for Infrared Sensing. Nano Lett. 2013, 13, 4569–4574. [Google Scholar] [CrossRef] [PubMed]
- Kasic, A.; Schubert, M.; Einfeldt, S.; Hommel, D.; Tiwald, T.E. Free-carrier and phonon properties of n - and p -type hexagonal GaN films measured by infrared ellipsometry. Phys. Rev. B 2000, 62, 7365–7377. [Google Scholar] [CrossRef]
- Yu, P.Y.; Cardona, M. Fundamentals of Semiconductors, Physics and Materials Properties; Springer: New York, NY, USA, 2005. [Google Scholar]
- Caldwell, J.D.; Kretinin, A.V.; Chen, Y.; Giannini, V.; Fogler, M.M.; Francescato, Y.; Ellis, C.T.; Tischler, J.G.; Woods, C.R.; Giles, A.J.; et al. Sub-diffractional volume-confined polaritons in the natural hyperbolic material hexagonal boron nitride. Nat. Commun. 2014, 5, 1–9. [Google Scholar] [CrossRef] [PubMed]
- Adachi, S. The Reststrahlen Region. In Optical Properties of Crystalline and Amorphous Semiconductors; Springer: Boston, MA, USA, 1999; pp. 33–62. [Google Scholar]
- Caldwell, J.D.; Lindsay, L.; Giannini, V.; Vurgaftman, I.; Reinecke, T.L.; Maier, S.A.; Glembocki, O.J. Low-loss, infrared and terahertz nanophotonics using surface phonon polaritons. Nanophotonics 2015, 4, 44–68. [Google Scholar] [CrossRef] [Green Version]
- Janipour, M.; Sendur, K. Broadband infrared reflective surfaces using doped and stacked polar dielectric layers. AIP Adv. 2018, 8, 025213. [Google Scholar] [CrossRef]
- Streyer, W.; Feng, K.; Zhong, Y.; Hoffman, A.J.; Wasserman, D. Engineering the Reststrahlen band with hybrid plasmon/phonon excitations. MRS Commun. 2016, 6, 1–8. [Google Scholar] [CrossRef]
- Demangeot, F.; Frandon, J.; Renucci, M.A.; Meny, C.; Briot, O.; Aulombard, R.L. Interplay of electrons and phonons in heavily doped GaN epilayers. J. Appl. Phys. 1997, 82, 1305–1309. [Google Scholar] [CrossRef]
- Tiwald, T.E.; Woollam, J.A.; Zollner, S.; Christiansen, J.; Gregory, R.B.; Wetteroth, T.; Wilson, S.R.; Powell, A.R. Carrier concentration and lattice absorption in bulk and epitaxial silicon carbide determined using infrared ellipsometry. Phys. Rev. B 1999, 60, 11464–11474. [Google Scholar] [CrossRef] [Green Version]
- Kuzmany, H. Solid State Spectroscopy, An Introduction; Springer: Heidelberg, Germany, 2009. [Google Scholar]
- Maier, S.A. Plasmonics: Fundamentals and Applications; Springer: New York, NY, USA, 2007. [Google Scholar]
- Janipour, M.; Misirlioglu, I.B.; Sendur, K. Tunable Surface Plasmon and Phonon Polariton Interactions for Moderately Doped Semiconductor Surfaces. Sci. Rep. 2016, 6, 34071. [Google Scholar] [CrossRef] [Green Version]
- Sasaki, Y.; Nishina, Y.; Sato, M.; Okamura, K. Optical-phonon states of SiC small particles studied by Raman scattering and infrared absorption. Phys. Rev. B 1989, 40, 1762–1772. [Google Scholar] [CrossRef]
- Albooyeh, M.; Morits, D.; Simovski, C.R. Electromagnetic characterization of substrated metasurfaces. Metamaterials 2011, 5, 178–205. [Google Scholar] [CrossRef]
- Anon. Available online: http://www.lumerical.com/ (accessed on 31 July 2018).
Figure 1.
(a) The real and imaginary parts of the dielectric function of SiC, (b) The Frölich frequencies (dashed curve) and (solid-curve) for a 4H-SiC nanoparticle using Equation (1) and Equation (2) versus doping concentration, respectively. (c–f) The normalized electric and magnetic polarizability amplitudes and phase for n = (solid curve), n = (dashed curve), n = (dashed-dotted curve), respectively.

Figure 2.
(a,c) The electric and (b,d) magnetic field intensities at = 24 and = 28 THz for a 4H-SiC nanoparticle, respectively, for n = .
Figure 2.
(a,c) The electric and (b,d) magnetic field intensities at = 24 and = 28 THz for a 4H-SiC nanoparticle, respectively, for n = .

Figure 3.
(a) The logarithmic carrier concentration dependency of the extinction (solid-curve), scattering (dashed curve) and absorption (dashed-dotted curve) spectrum, respectively, of a 4H-SiC nano-sphere and for n = . (b–d) The logarithmic scale of the extinction, scattering and absorption spectrums for n = (solid curve), n = (dashed curve), n = (dashed-dotted curve), respectively.

Figure 4.
(a,b) The normalized amplitude and phase of the effective susceptibility of a substrate induced doped SiC nanoparticles for (solid curve), (dashed curve) and (dashed-dotted curve), respectively. (c) Schematic representation of the square patterned metasurface composed of SiC nano-spheres dimers with different doping values. (d) The reflection spectrum of the dimer arrays for and (solid curve), and [dashed-curve], and [dashed-dotted-curve], respectively, with 200 nm.

Figure 5.
The amplitude and phase of the effective electric susceptibilities of the square patterned array of the SiC dimers [(a,b)] for and with [solid-curve], and [dashed-curve], respectively.
Figure 5.
The amplitude and phase of the effective electric susceptibilities of the square patterned array of the SiC dimers [(a,b)] for and with [solid-curve], and [dashed-curve], respectively.

Figure 6.
Schematic representation of the square patterned array composed of the SiC dimers (a) and trimers (c) with different doping values, respectively. (b); (d) , , and (solid curve), , , and (dashed curve) and , , and (dashed-dotted curve), respectively.
Figure 6.
Schematic representation of the square patterned array composed of the SiC dimers (a) and trimers (c) with different doping values, respectively. (b); (d) , , and (solid curve), , , and (dashed curve) and , , and (dashed-dotted curve), respectively.

Figure 7.
Electric field intensity in logarithmic scale for the periodic trimer array metasurface composed of doped SiC nano-spheres with the doping concentration of , , and at (a–d) the higher reflective modes of , , , ; and (e–g) the lower reflective modes of , , and , respectively.
Figure 7.
Electric field intensity in logarithmic scale for the periodic trimer array metasurface composed of doped SiC nano-spheres with the doping concentration of , , and at (a–d) the higher reflective modes of , , , ; and (e–g) the lower reflective modes of , , and , respectively.


© 2020 by the authors. Licensee MDPI, Basel, Switzerland. This article is an open access article distributed under the terms and conditions of the Creative Commons Attribution (CC BY) license (http://creativecommons.org/licenses/by/4.0/).
Share and Cite
MDPI and ACS Style
Janipour, M.; Şendur, K. Enhancing Spectral Reflection through Controlled Phase Distribution Using Doped Polar-Dielectric Metasurfaces. Materials 2020, 13, 2007. https://0-doi-org.brum.beds.ac.uk/10.3390/ma13092007
AMA Style
Janipour M, Şendur K. Enhancing Spectral Reflection through Controlled Phase Distribution Using Doped Polar-Dielectric Metasurfaces. Materials. 2020; 13(9):2007. https://0-doi-org.brum.beds.ac.uk/10.3390/ma13092007
Chicago/Turabian StyleJanipour, Mohsen, and Kürşat Şendur. 2020. "Enhancing Spectral Reflection through Controlled Phase Distribution Using Doped Polar-Dielectric Metasurfaces" Materials 13, no. 9: 2007. https://0-doi-org.brum.beds.ac.uk/10.3390/ma13092007
Note that from the first issue of 2016, this journal uses article numbers instead of page numbers. See further details here.