
A Novel Multiaxial Strain-Based Criterion Considering Additional Cyclic Hardening


Department of Engineering & Architecture, University of Parma, Parco Area delle Scienze 181/A, 43124 Parma, Italy
Materials 2021, 14(10), 2542; https://0-doi-org.brum.beds.ac.uk/10.3390/ma14102542
Submission received: 30 March 2021
/
Revised: 28 April 2021
/
Accepted: 11 May 2021
/
Published: 13 May 2021
(This article belongs to the Special Issue Fatigue Life under Multiaxial Load Conditions)
Abstract
:The present paper is dedicated to the theoretical evaluation of a loading feature, that may have a significant influence on fatigue phenomenon: non-proportionality. As a matter of fact, considerable interactions between dislocations, leading to the formation of dislocation cells, cause additional cyclic hardening of material. Such a phenomenon is experimentally observed for materials sensitive to non-proportionality. In such a context, the present paper is aimed to propose a novel multiaxial strain-based criterion, the refined equivalent deformation (RED) criterion, which allows to take into account, in fatigue life estimation, both strain amplitude and additional cyclic hardening. The accuracy of the novel criterion is evaluated by considering experimental tests, performed on Ti-6Al-4V specimens, subjected to multiaxial LCF loading.
1. Introduction
It is well known that one feature of loading that may have a significant influence on fatigue phenomenon is the non-proportionality of a load [1], where a rotation of principal stress or strain axes occurs during the observation time interval. As a matter of fact, under the influence of non-proportional loading, shear stresses, acting in multiple directions and planes, activate additional slip systems in uniaxial or multiaxial proportional loading. Therefore, new sources of dislocation appear. Considerable interactions between dislocations (that do not appear under proportional loading) result in a high density, leading to the formation of dislocation cells, causing additional cyclic hardening of materials, which usually has a significant negative effect on the lifetime.
As a result, a load characterized by a high degree of non-proportionality, acting on a material with a high susceptibility to non-proportionality, can lead to as much as a 10-fold decrease in fatigue strength with respect to proportional loading [1].
Therefore, the theoretical evaluation of the effect of the strain path non-proportionality on the ultimate state of a material under fatigue loading represents an interesting research field for engineering practice, and, consequently, at a stage of dynamic development.
It is worth noticing that a fatigue criterion cannot accurately estimate fatigue life by only considering the stress/strain state inside a material in terms of the computation of a suitable damage parameter. Among the criteria available in the literature for such an evaluation, both strain- and energy-based criteria are widely used [2,3,4,5,6,7,8,9,10,11,12,13,14,15,16,17].
In such a context, the present paper is aimed to propose a novel multiaxial strain-based criterion, named Refined Equivalent Deformation (RED) criterion, that allows to take into account in fatigue life estimation both the strain amplitude and additional cyclic hardening when the load is non-proportional and the material is sensitive to non-proportionality. More precisely, an enhancement factor is implemented in the damage parameter relationship, proposed in [18]. Such a factor is a function of material constants, strain path orientation, and the degree of non-proportionality [3,4,5].
The accuracy of the proposed criterion is verified by considering an experimental campaign, available in the literature [6], performed on a material that is sensitive to loading non-proportionality and is widely used in industry: titanium alloy. As a matter of fact, titanium alloys are widely used in aerospace, automotive, and biomedical and chemical industries due to their superior properties, such as their corrosion resistance and high strength-to-weight ratio [19,20,21,22,23]. In such a context, Ti-6Al-4V here examined has excellent tensile (tensile strength ≥ 895 MPa) and fatigue strength (equal to about 460MPa at a number of loading cycles of 109 under rotating bending), as well as high resistance to a wide spectrum of corrosive environments, with respect to other titanium based alloys, due to its inclination to form protective surface oxides [24,25,26,27,28,29,30,31,32,33,34,35]. As such, it is used in life-limit components of civil aviation engines and as fractured critical components of military engines [36,37,38,39]. Therefore, fatigue behavior, especially under low-cycle fatigue (LCF) regimes, should be critically evaluated for the design of the above-mentioned components under service loads. More precisely, such components are subjected to cyclic loading due to thermal and mechanical stresses, which cause multiaxial LCF that may be proportional and/or non-proportional [40,41,42].
A comparison between the experimental data and the theoretical results, in terms of fatigue lifetime, is performed, and the influence of the phase shift on fatigue strength is investigated. A comparison with the results obtained by applying other criteria available in the literature is also carried out.
2. Examined Experimental Campaign
The examined experimental campaign [6] is presented. More precisely, uniaxial and multiaxial fatigue tests under LCF regime were performed on TC4 titanium alloy specimens.
2.1. Material and Specimens
The material was TC4 titanium alloy, and was produced in China [6]. A similar material produced in the USA is Ti-6Al-4V.
The chemical composition is reported in Table 1, and its mechanical properties are: elastic modulus , Poisson’s ratio , and yield stress [6].
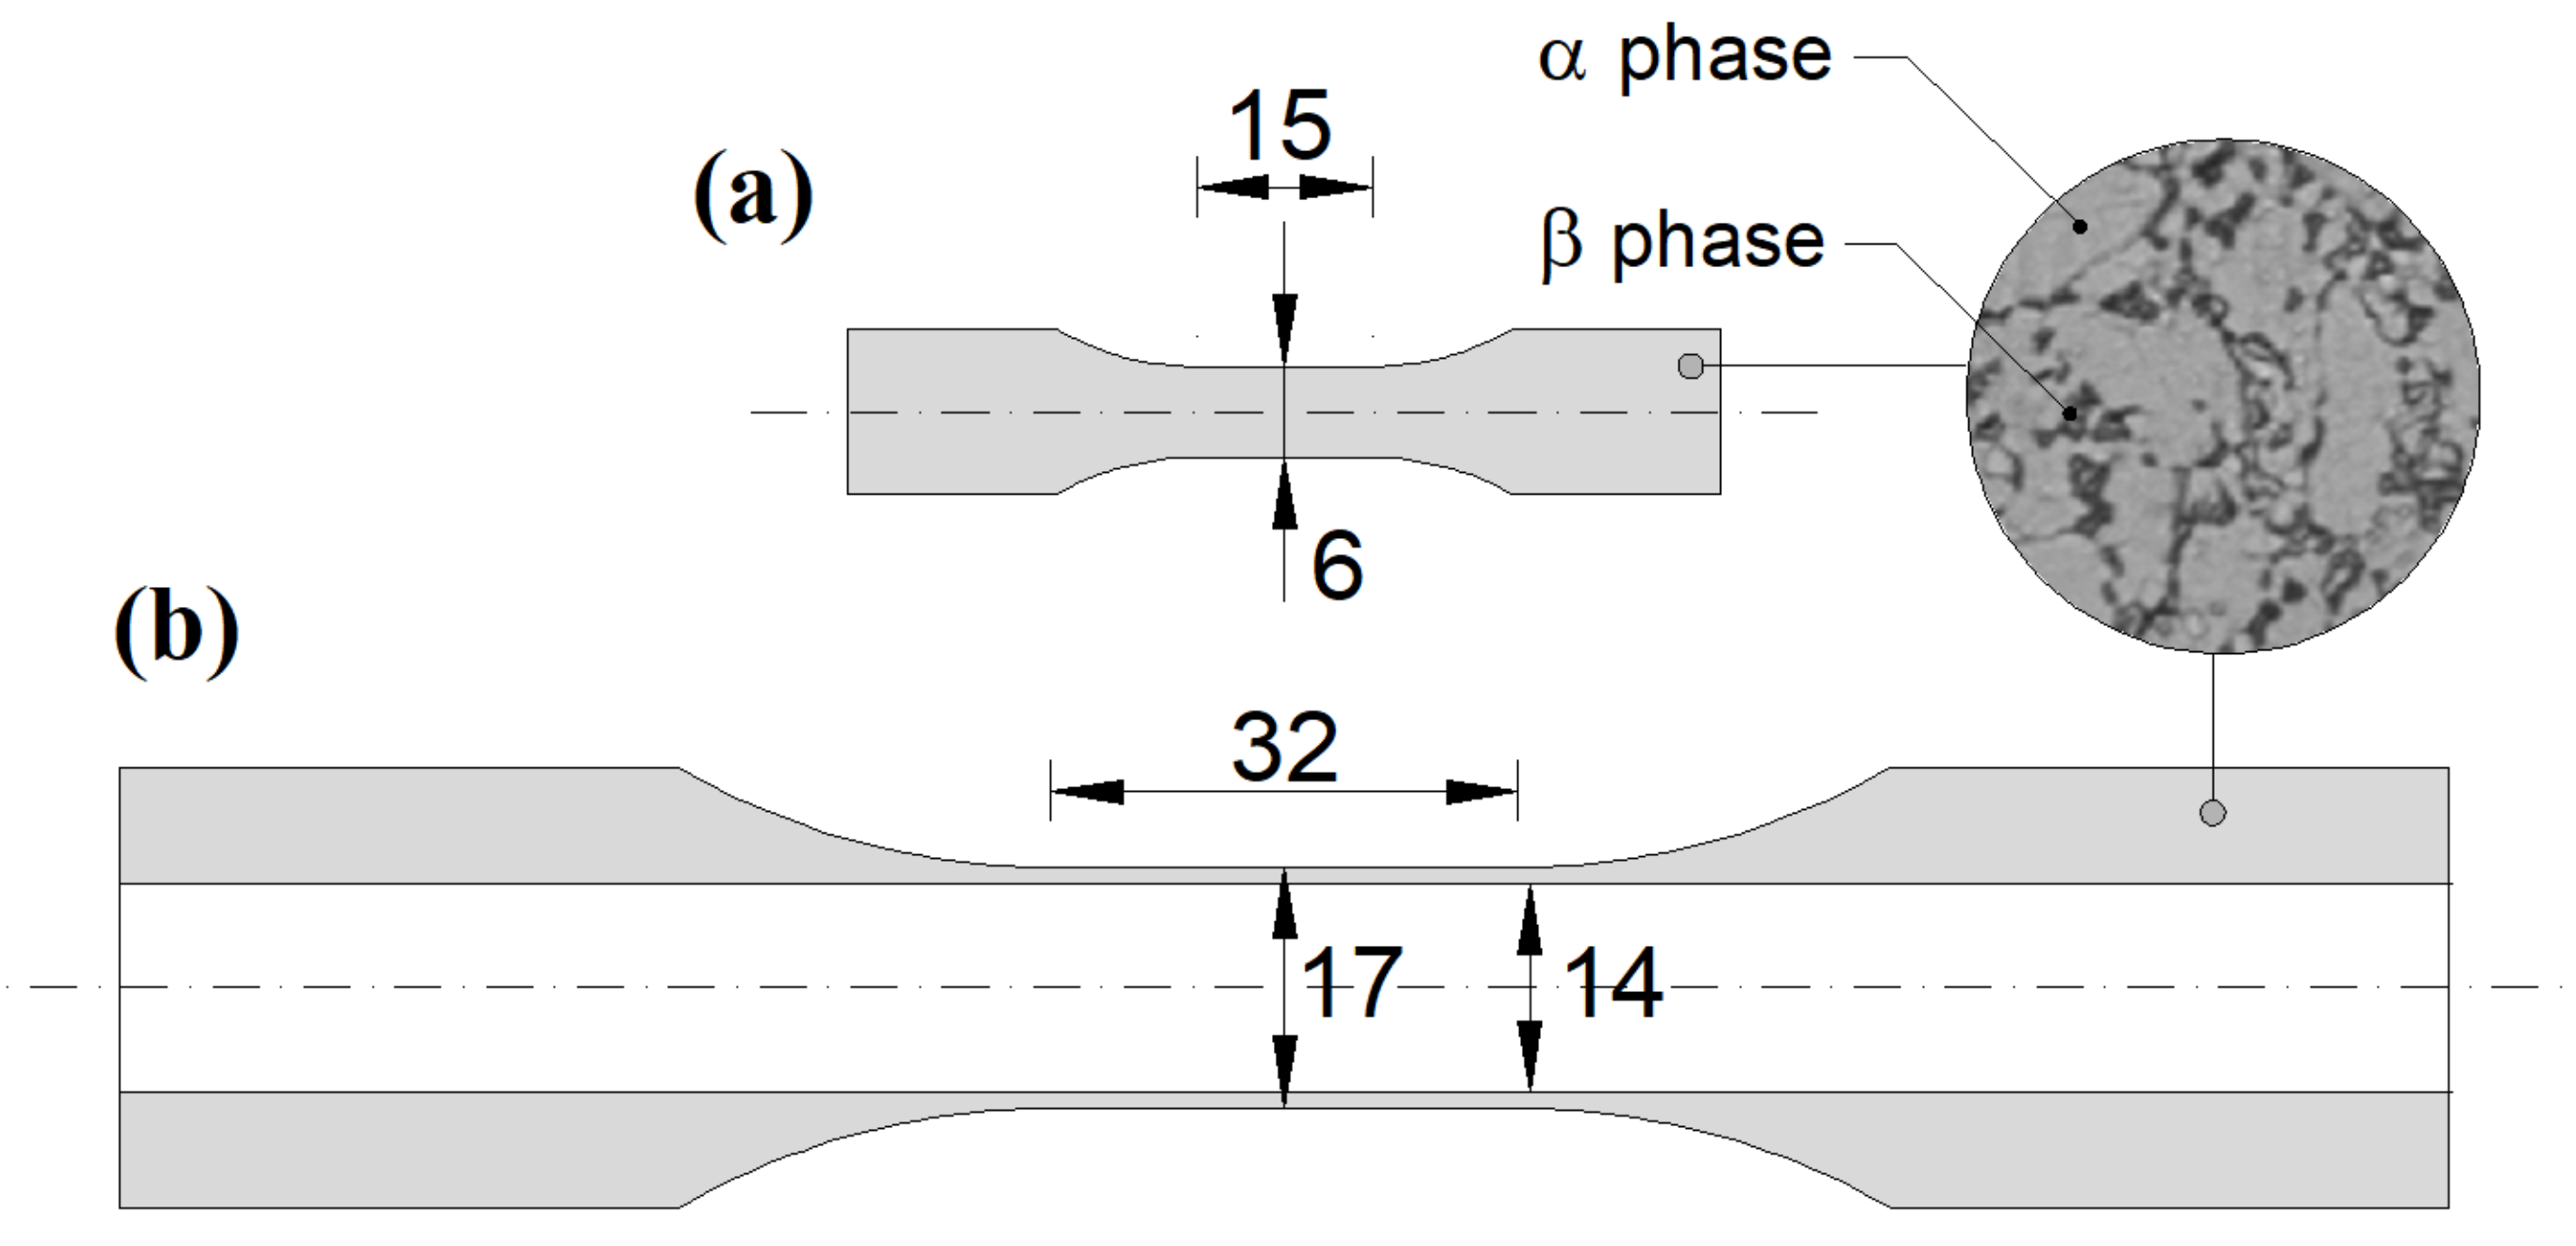
Heat treatment, which was performed on the material before machining, consisted in heating to 730 °C and then air cooling [6]. After such a treatment, the material microstructure (Figure 1) was homogeneous and consisted of fully equiaxed and columnar alpha grains (light) with intergranular beta phase (dark).
The specimens were machined from full bars with a diameter of 35 mm [6]. Two types of specimen were produced: solid specimens with a diameter equal to 6 mm along a gauge length of 15 mm (Figure 1a), employed for axial fatigue tests (according to ASTM standard ASTM E606/E606M), and hollow specimens with an outer diameter equal to 17 mm and an inner diameter equal to 14 mm, both along a gauge length of 32 mm (Figure 1b), employed for torsional and combined axial/torsional tests (according to ASTM standard E2207).
2.2. Testing Conditions
LCF tests were performed using a servo-hydraulic MTS Model 809 testing system [6]. The tests were carried out under the strain-controlled mode of loading, where an axial-torsional extensometer was used to measure the axial and shear strains. Axial load and torque were also registered during testing.
Axial, torsional, and combined axial–torsional fatigue tests were characterized by a loading ratio equal to −1, and sinusoidal waveforms with a frequency between 0.5 and 1.0 Hz. Under multiaxial loading conditions, both proportional and non-proportional signals were investigated, the latter was characterized by a phase shift, , equal to 45° or 90°.
The failure criterion was considered when a 10–15% drop in axial load or torque was observed (whichever occurred first) with respect to the corresponding values registered at midlife.
2.3. Experimental Results
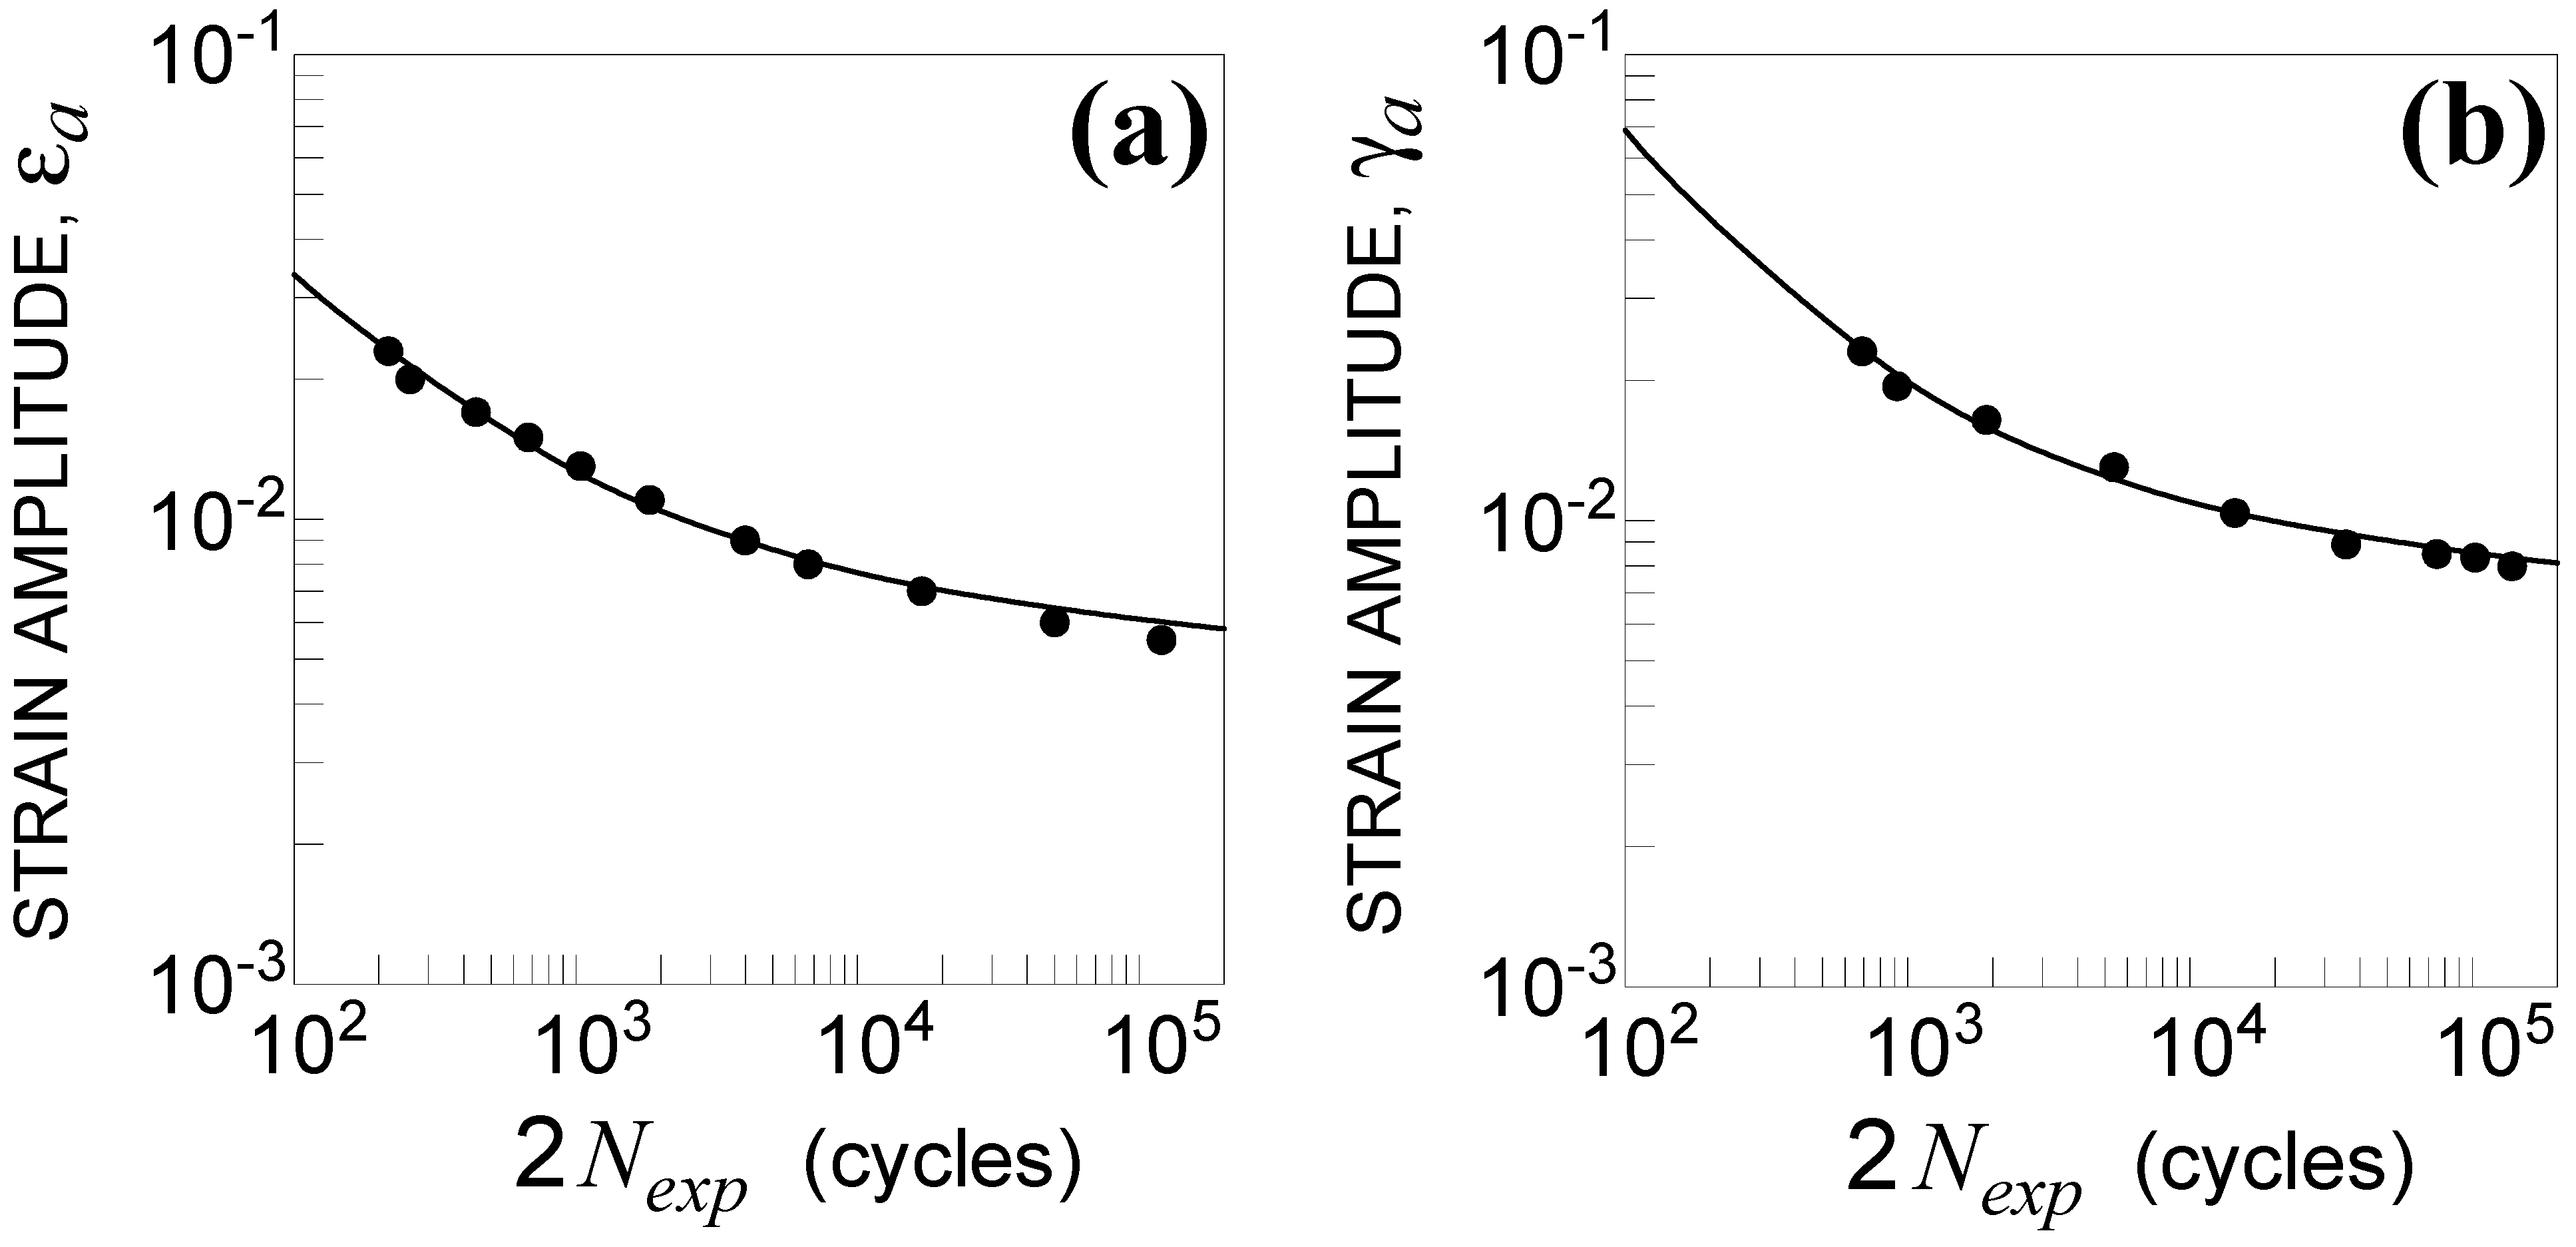
The experimental results under uniaxial loading are shown in Figure 2, whereas those under multiaxial loading are listed in Table 2, where is the measured axial strain amplitude, is the measured shear strain amplitude, is the phase shift, and is the fatigue life.
It was observed that the fatigue life under both axial and torsional loading was well correlated by the Manson–Coffin equations [6], in which the parameters were , , , and , , , and , respectively.
3. Simulation of the Experimental Tests
It is well known that changing of principal axes under non-proportional loading can lead to additional cyclic hardening, which is considered to be closely related to decreases in the fatigue life. Such a phenomenon is more pronounced when a material is sensitive to loading non-proportionality.
A fatigue criterion cannot estimate fatigue life by only considering the stress/strain state in computations of damage parameters because, under non-proportional loading, the rotation of principal stress or strain axes occurs and new sources of dislocation appear. Considerable interactions between dislocations lead to the formation of dislocation cells, causing additional cyclic hardening of material, which usually has a significant negative effect on the lifetime.
In such a context, an enhancement factor, implemented in the damage parameter relationship, can be used to reflect the effect of additional cyclic hardening on the estimated fatigue life.
The reduced strain range method proposed by Borodii et al. [3,4,5] is a strain-based criterion that, uses an enhancement factor (named strain factor in the following), which is the function of the material constants, strain path orientation, and degree of non-proportionality. In Section 3.1, such a method is presented and applied to the experimental campaign examined here [6], highlighting two drawbacks of the method.
The novelty of the present paper is to propose a strain-based criterion, the RED criterion, which is feasible for estimation of the multiaxial life of metallic engineering components, especially under non-proportional loading. More precisely, as presented in Section 3.2, a strain factor, along the lines of that proposed by Borodii et al., but which overcomes the above-mentioned drawbacks [3,4,5], is implemented in the damage parameter relationship proposed by Vantadori et al. [18].
3.1. The Reduced Strain Range Method
According to the method proposed by Borodii et al. [3,4,5], experimental fatigue data under non-proportional loading can be represented using the reduced strain range, , which for the i-th test is given by:
where is the strain factor and is the standard definition of the strain range [43], computed as:
where and are the total axial and shear strains related to the i-th test, at time instants and .
The strain factor, , is given by:
where is the material constant characterizing the difference in the cyclic properties with respect to the proportional strain path, is the angle of the i-th non-proportional strain path with respect to the material principal axis, is the material constant related to additional cyclic hardening, and is the coefficient of non-proportionality of the i-th non-proportional strain path. Note that the material principal axis corresponds to the direction of the proportional strain path where the maximum value of is realized and the longest lifetime is attained. Further details are given in References [3,4,5].
More precisely, the first term in the brackets of Equation (3) takes into account the experimental evidence that when the fatigue life under an uniaxial strain path is greater than that under proportional strain path, a similar trend holds true for non-proportional strain path with respect to the proportional one rotated by the same angle. The material constant, , is computed by considering experimental data related to tests under proportional loading, uniaxial and/or multiaxial, depending on the material principal axis.
The second term in the brackets of Equation (3) takes into account the experimental evidence that under non-proportional loading the decreasing in fatigue lifetime depends on both the strain range and the cyclic path shape, by means of the coefficient . Details on the calculation of such parameters are given in References [3,4,5].
Under proportional loading (uniaxial or multiaxial), . As a matter of fact, in such a case, is assumed to be equal to zero, according to the corresponding definition given above, whereas is equal to zero, being a proportional strain path non-convex.
The constant is computed through the following expression:
where M is the tests number under proportional loading, excluding those characterized by a strain path along the material principal direction, whereas the constant is given by:
where N is the number of tests under non-proportional loading.
The fatigue lifetime, , is computed as:
where and are the linear approximation coefficients of the experimental data relative to the material principal axis.
3.1.1. Theoretical Results
For the experimental campaign examined here, the values of , , and are listed in Table 2. The computed values of the linear approximation coefficients and were −0.226 and −0.877, respectively. Therefore, by exploiting the , , and values, and the and coefficients, the material constants and were calculated, that is: and . Note that, to compute and , was calculated according to Equation (6) by assuming .
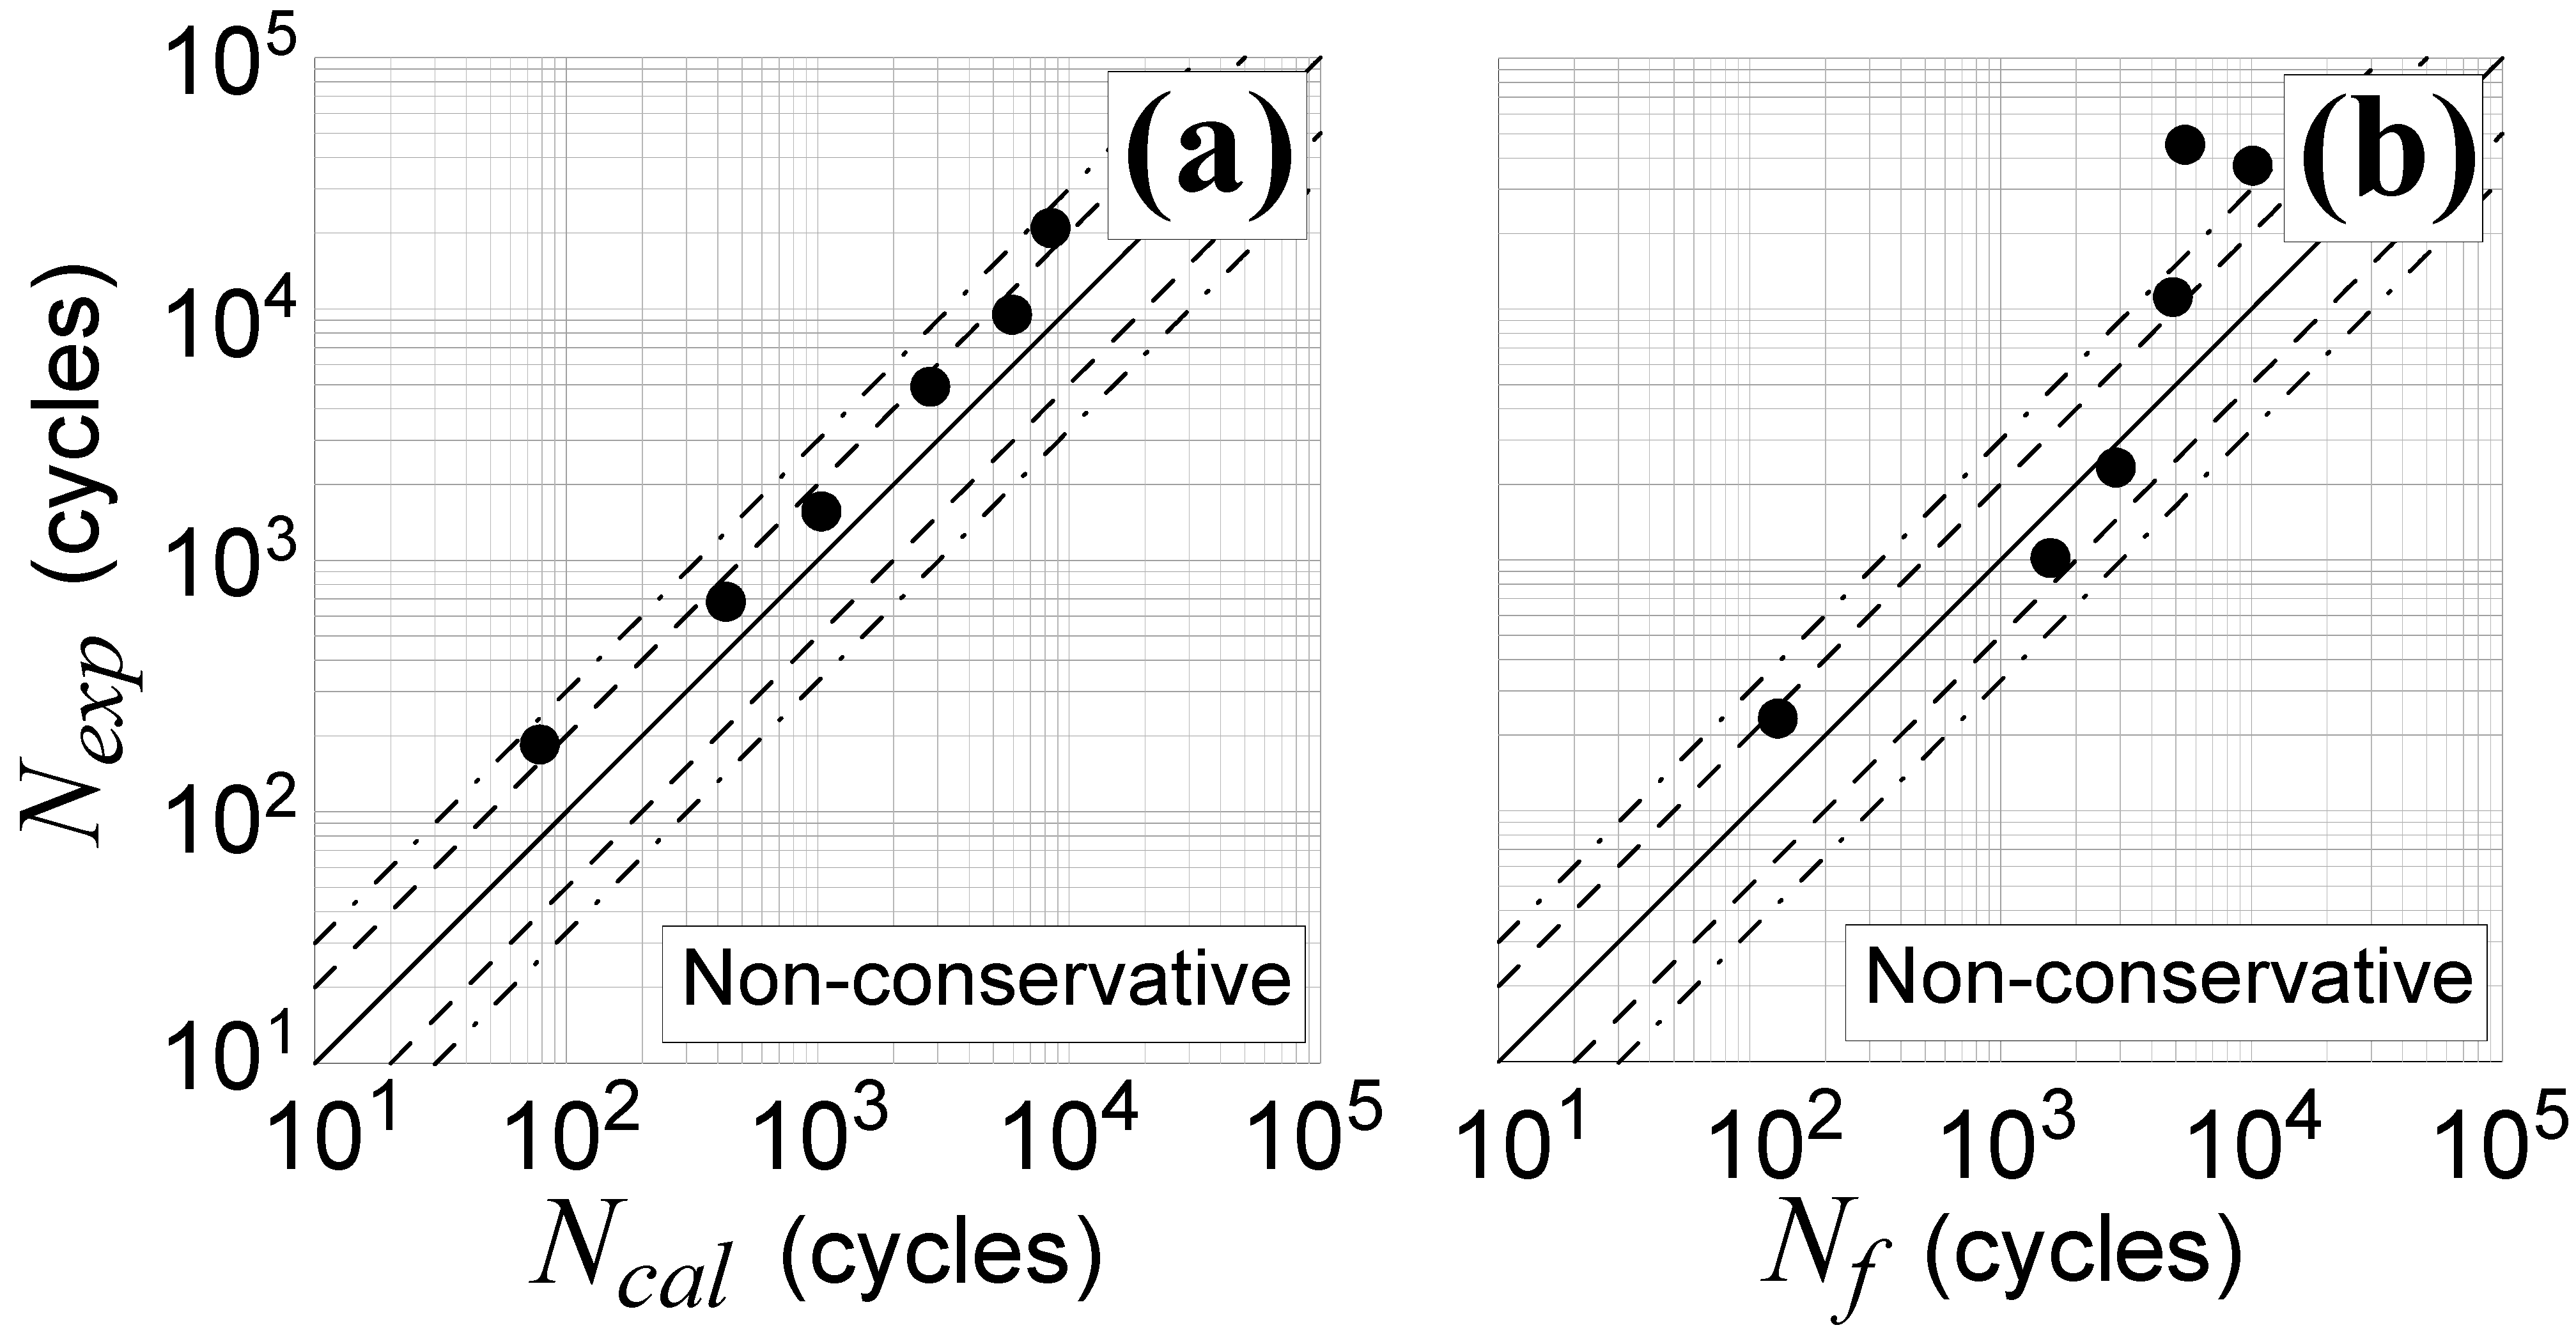
In Figure 3, the estimated fatigue life, , which was computed by employing the reduced strain range method, is compared with the experimental one, , for non-proportional loading characterized by a phase shift, , equal to 45° (Figure 3a) or 90° (Figure 3b). Although the results can be considered as quite satisfactory, falling most of the data in scatter band 3, some drawbacks of the method need to be highlighted, as presented in Section 3.1.2.
3.1.2. Criterion Drawbacks
As can be observed in Table 2, a significant additional cyclic hardening is experimentally observed under non-proportional loading: for example, by considering test No. T1 characterized by = 1.018 under proportional loading, a decreasing in fatigue life of about 55% was registered under a phase shift of (see test No. T7 with = 0.996), whereas a decrease of about 76% was registered under a phase shift of (see test No. T15 with = 0.998). The same trend was observed by comparing tests No. T3 and T10 and tests No. T9 and T17.
Such experimental evidence was captured by the method proposed by Borodii et al. As a matter of fact, considering test simulation No. T1, with an estimated fatigue life of 84,402 loading cycles (see Table 2), a decrease in fatigue life of about 90% was registered under a phase shift of (see test simulation No. T7), whereas a decrease of about 94% was registered under a phase shift of (see test simulation No. T15). The same trend was observed for test simulation No. T10 with respect to No. T3, and for test simulation No. T9 with respect to No. T17.
The drawbacks of the method are related to the results obtained when the loading was the same, but the phase shift was varied from 0° to 90°. Over 90°, the trend is mirrored, and thus theoretical investigations can be avoided.
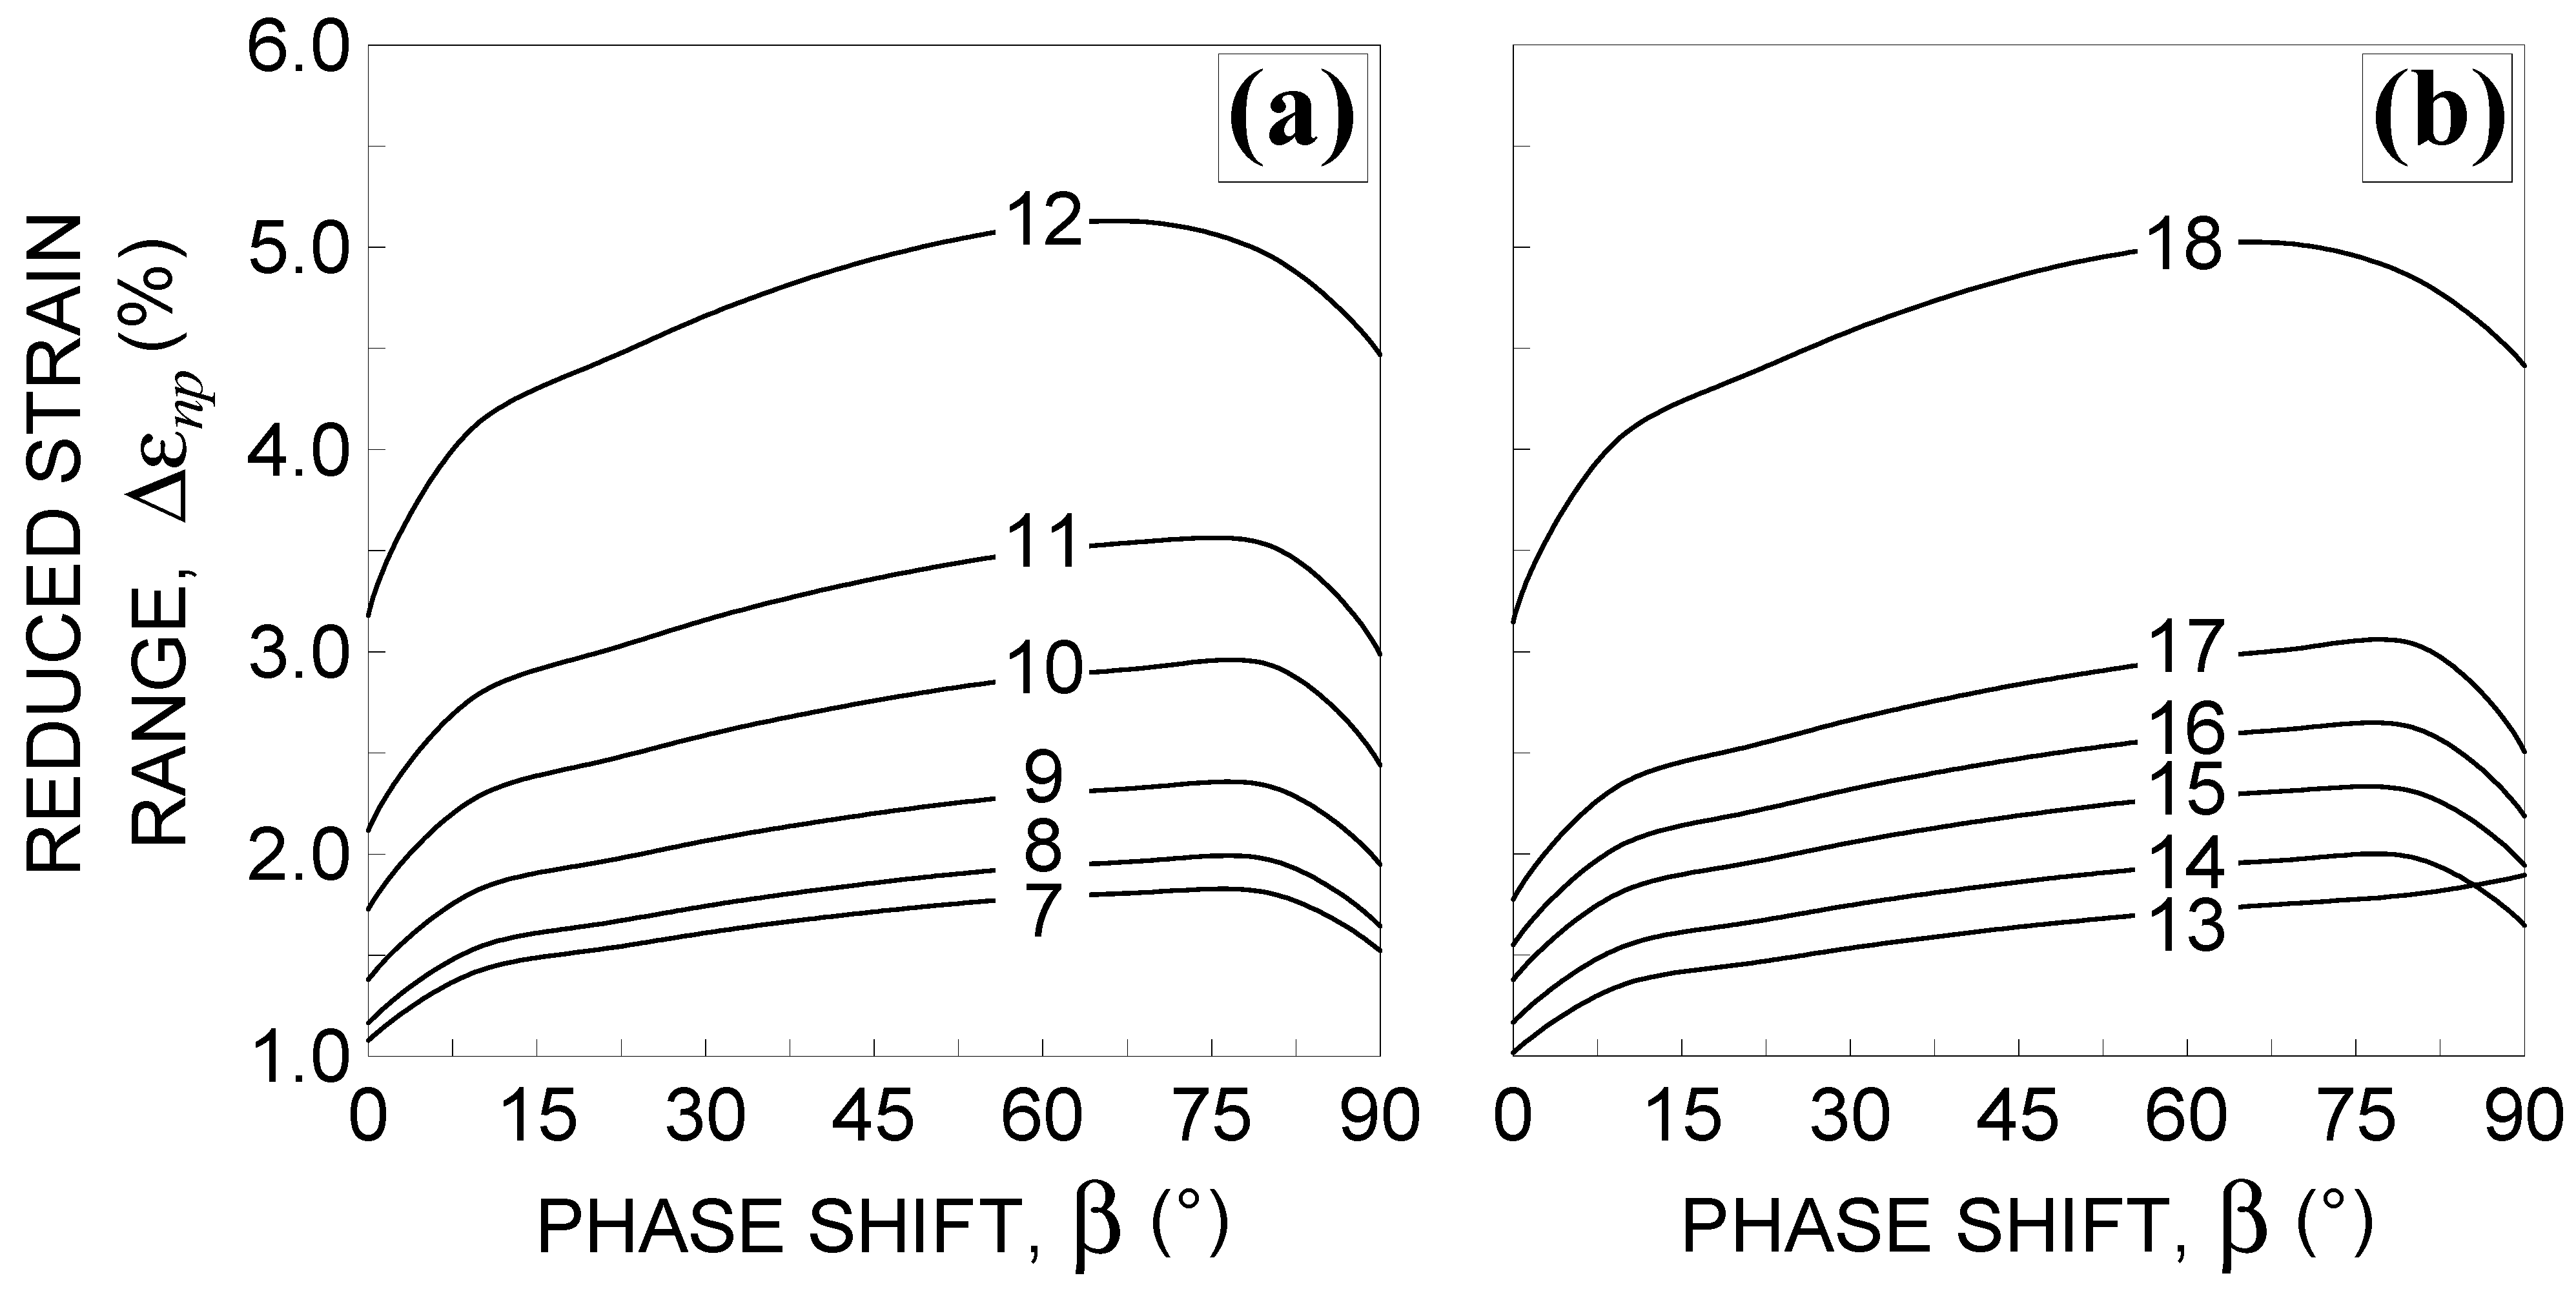
In Figure 4, the reduced strain range is plotted against the phase shift for the loading conditions from No. 7–No.18, listed in Table 2. It can be observed that increases by increasing to a value of about 80°, and then decreases with the exception of loading condition No. 13.
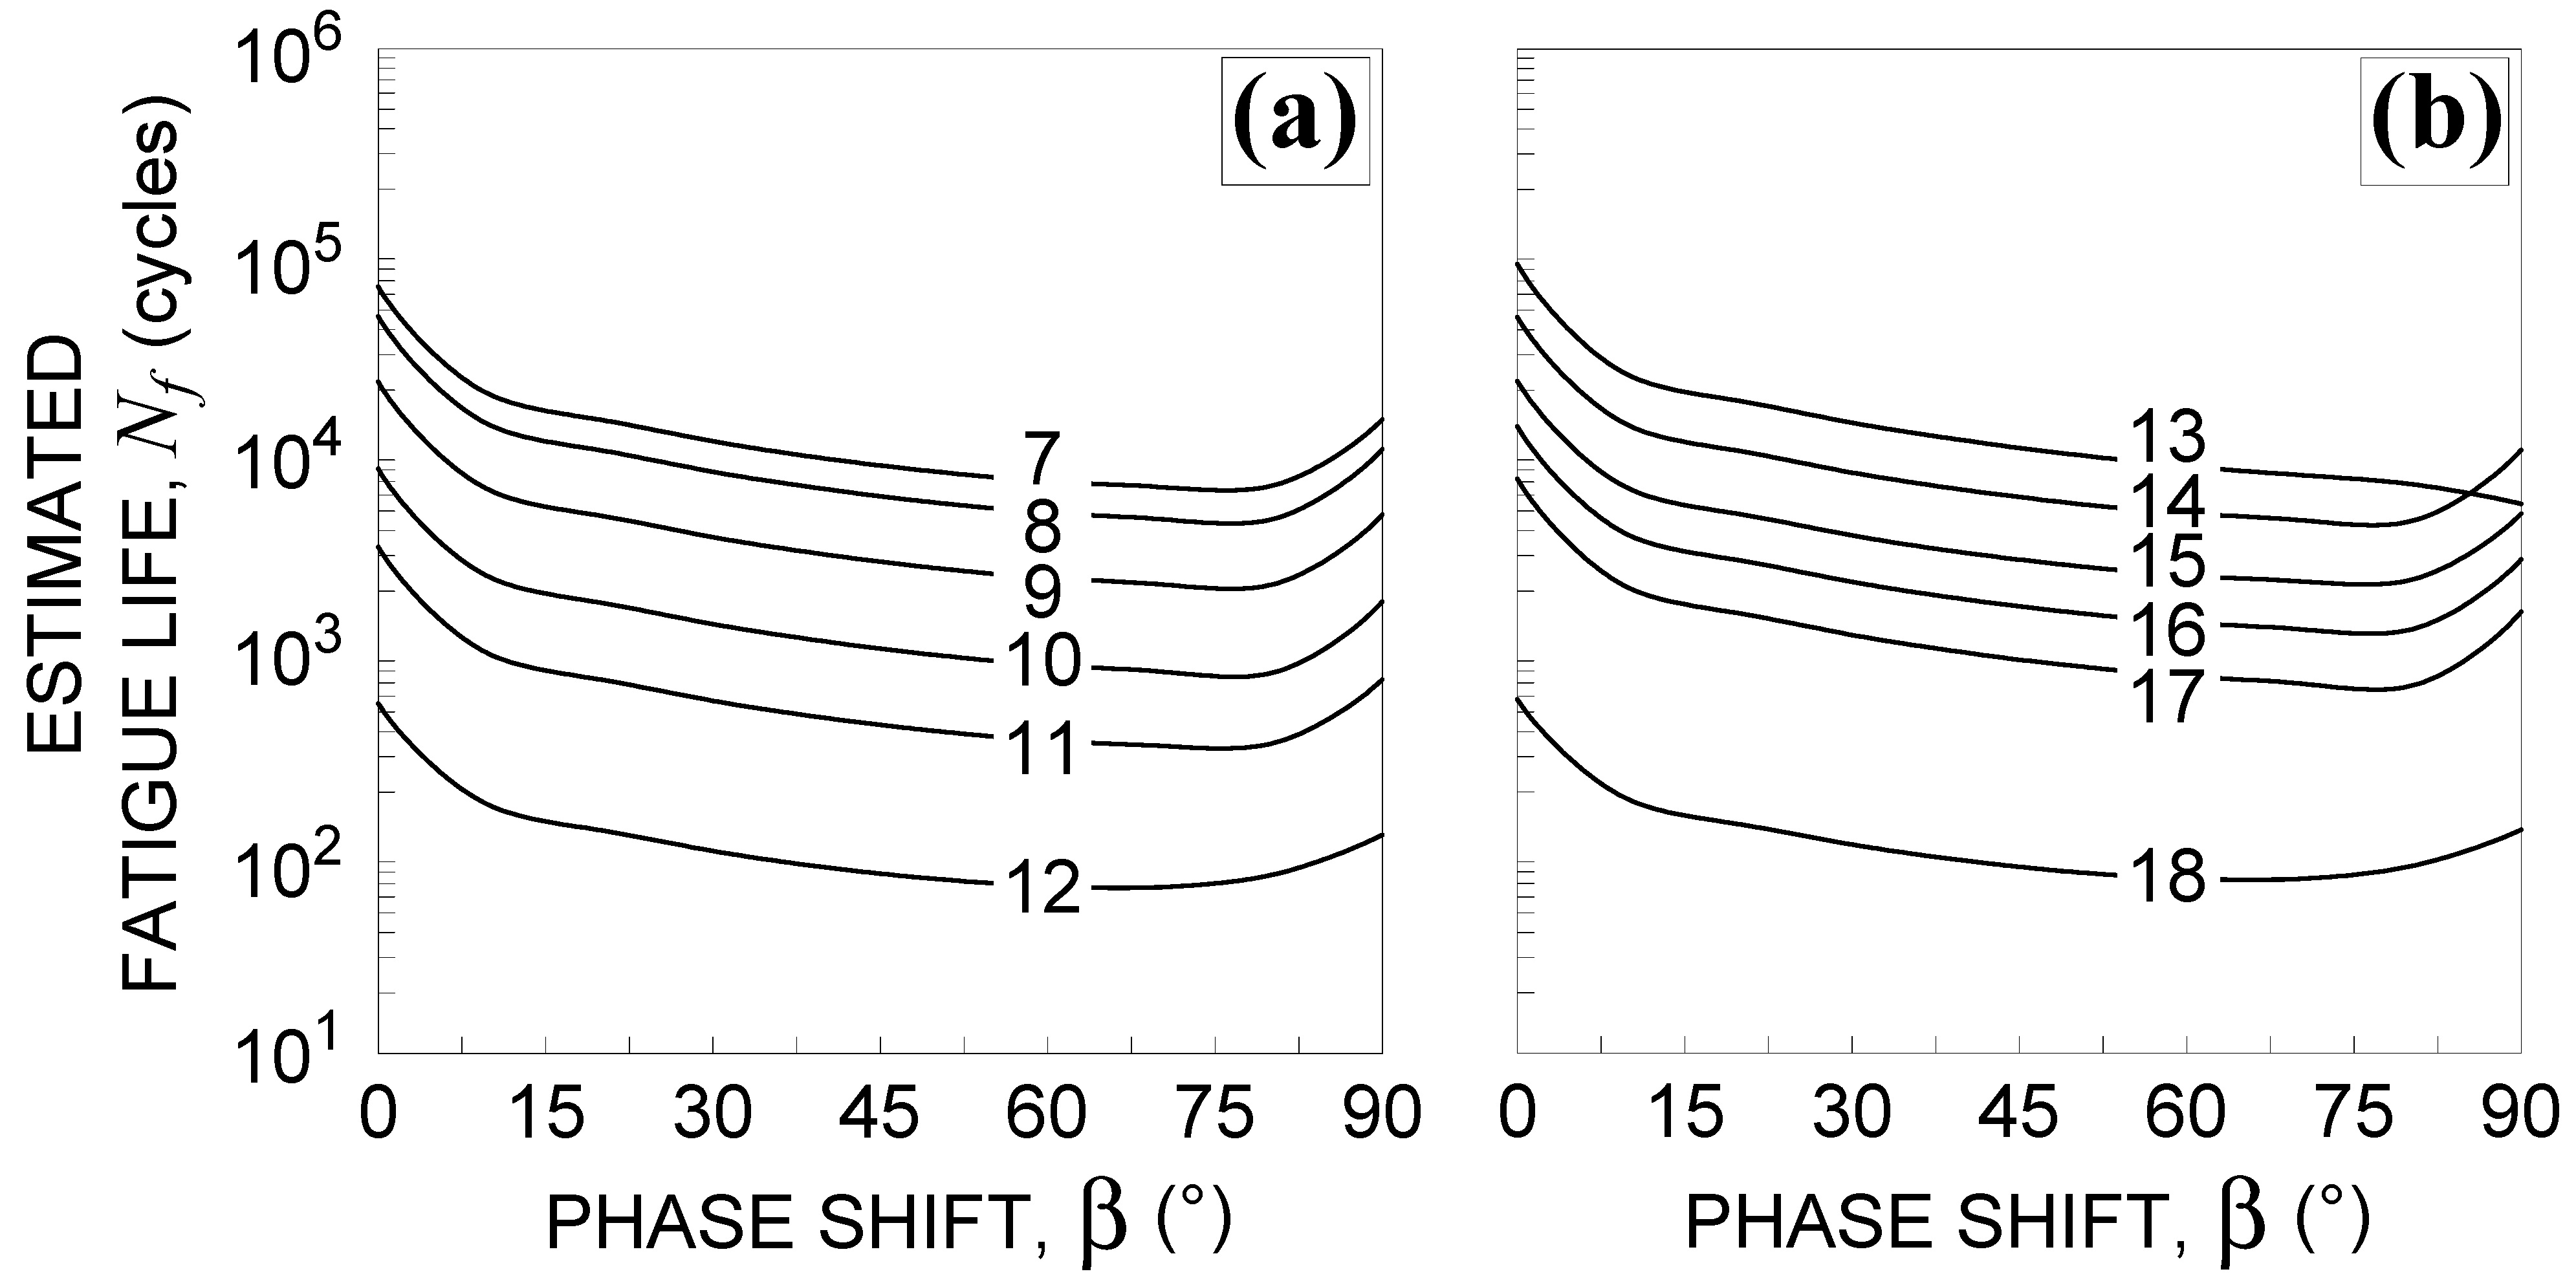
Consequently, by computing the estimated fatigue life, , it decreases to the above-mentioned value of , and then increases with the exception of loading condition No. 13, as shown in Figure 5.
Such a trend does not capture the experimental evidence that recognizes 90° out-of-phase loading as the most damaging loading path.
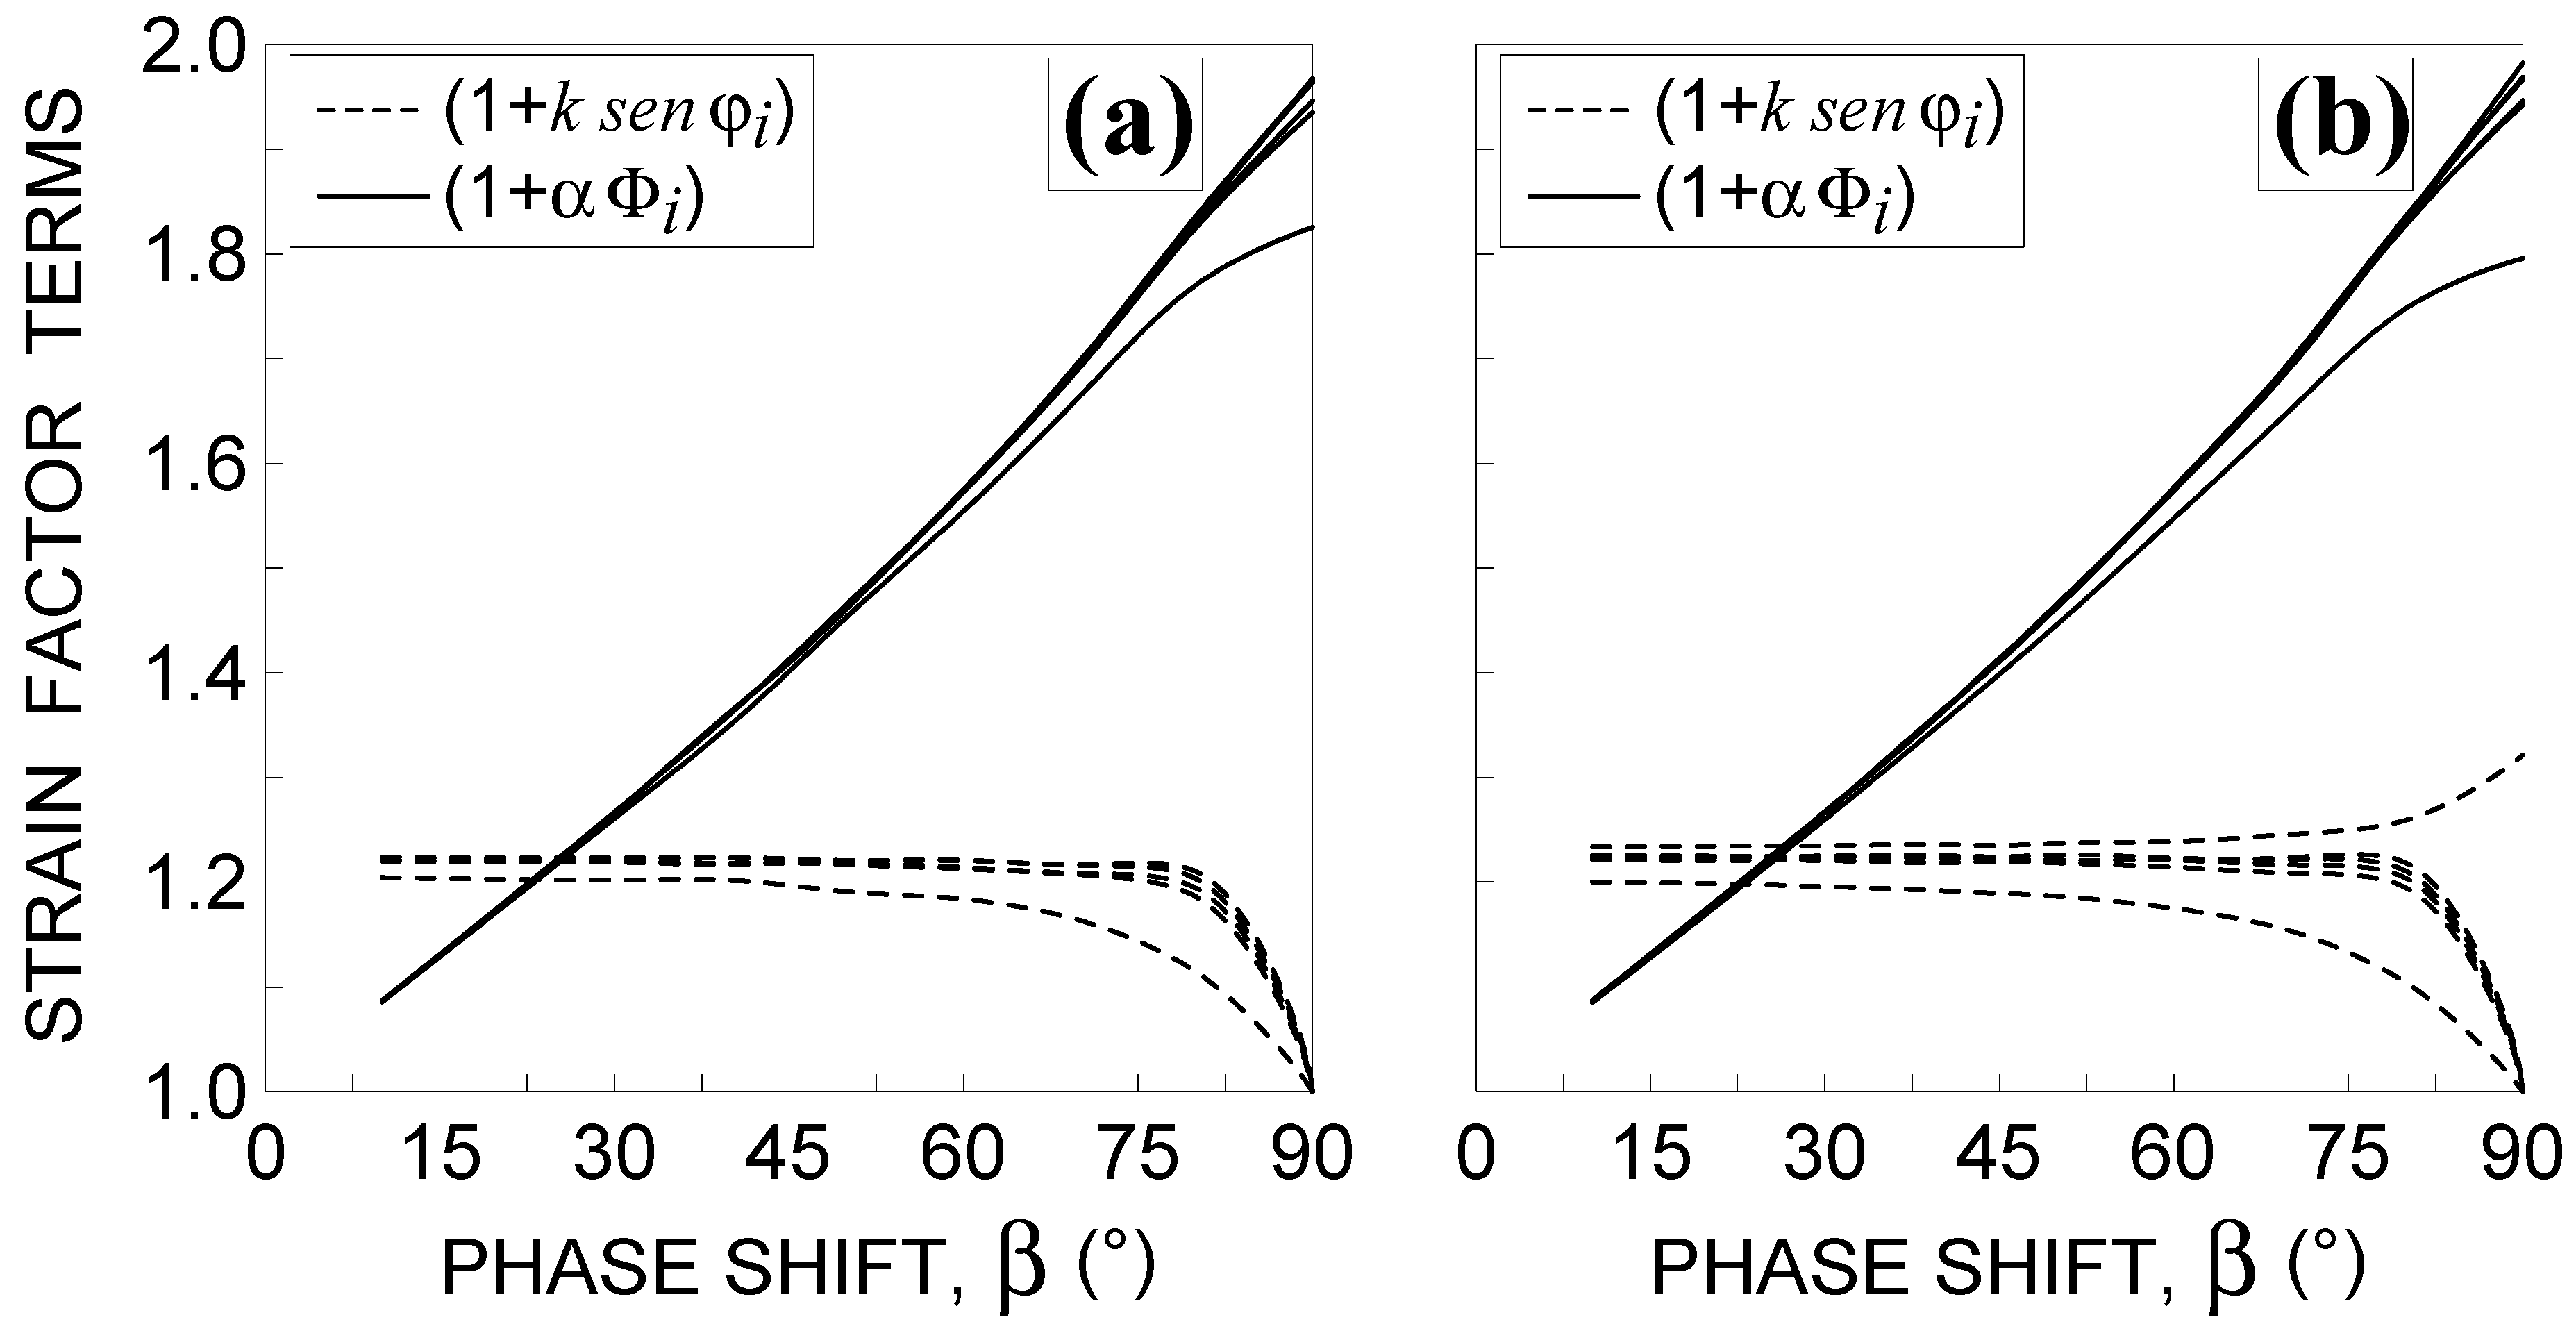
The second drawback of the criterion is related to the first term in the brackets of Equation (3). By plotting such a term against for all the examined non-proportional loading conditions (see Figure 6), it can be observed that the curves decrease by increasing the phase shift (with the exception of that corresponding to loading condition No. 13), whereas the opposite occurs for the second terms in the brackets of Equation (3) (also reported in Figure 6).
In order to capture the experimental evidence that the estimated fatigue life has to decrease by increasing the phase shift, the strain factor has to monotonically increase by increasing the phase shift, and such a trend may always be assured (independent of the loading conditions) when both terms in Equation (3) increase by increasing the loading non-proportionality.
Such drawbacks are overcome by using the RED criterion here proposed and presented in Section 3.2.
3.2. The Refined Equivalent Deformation (RED) Criterion
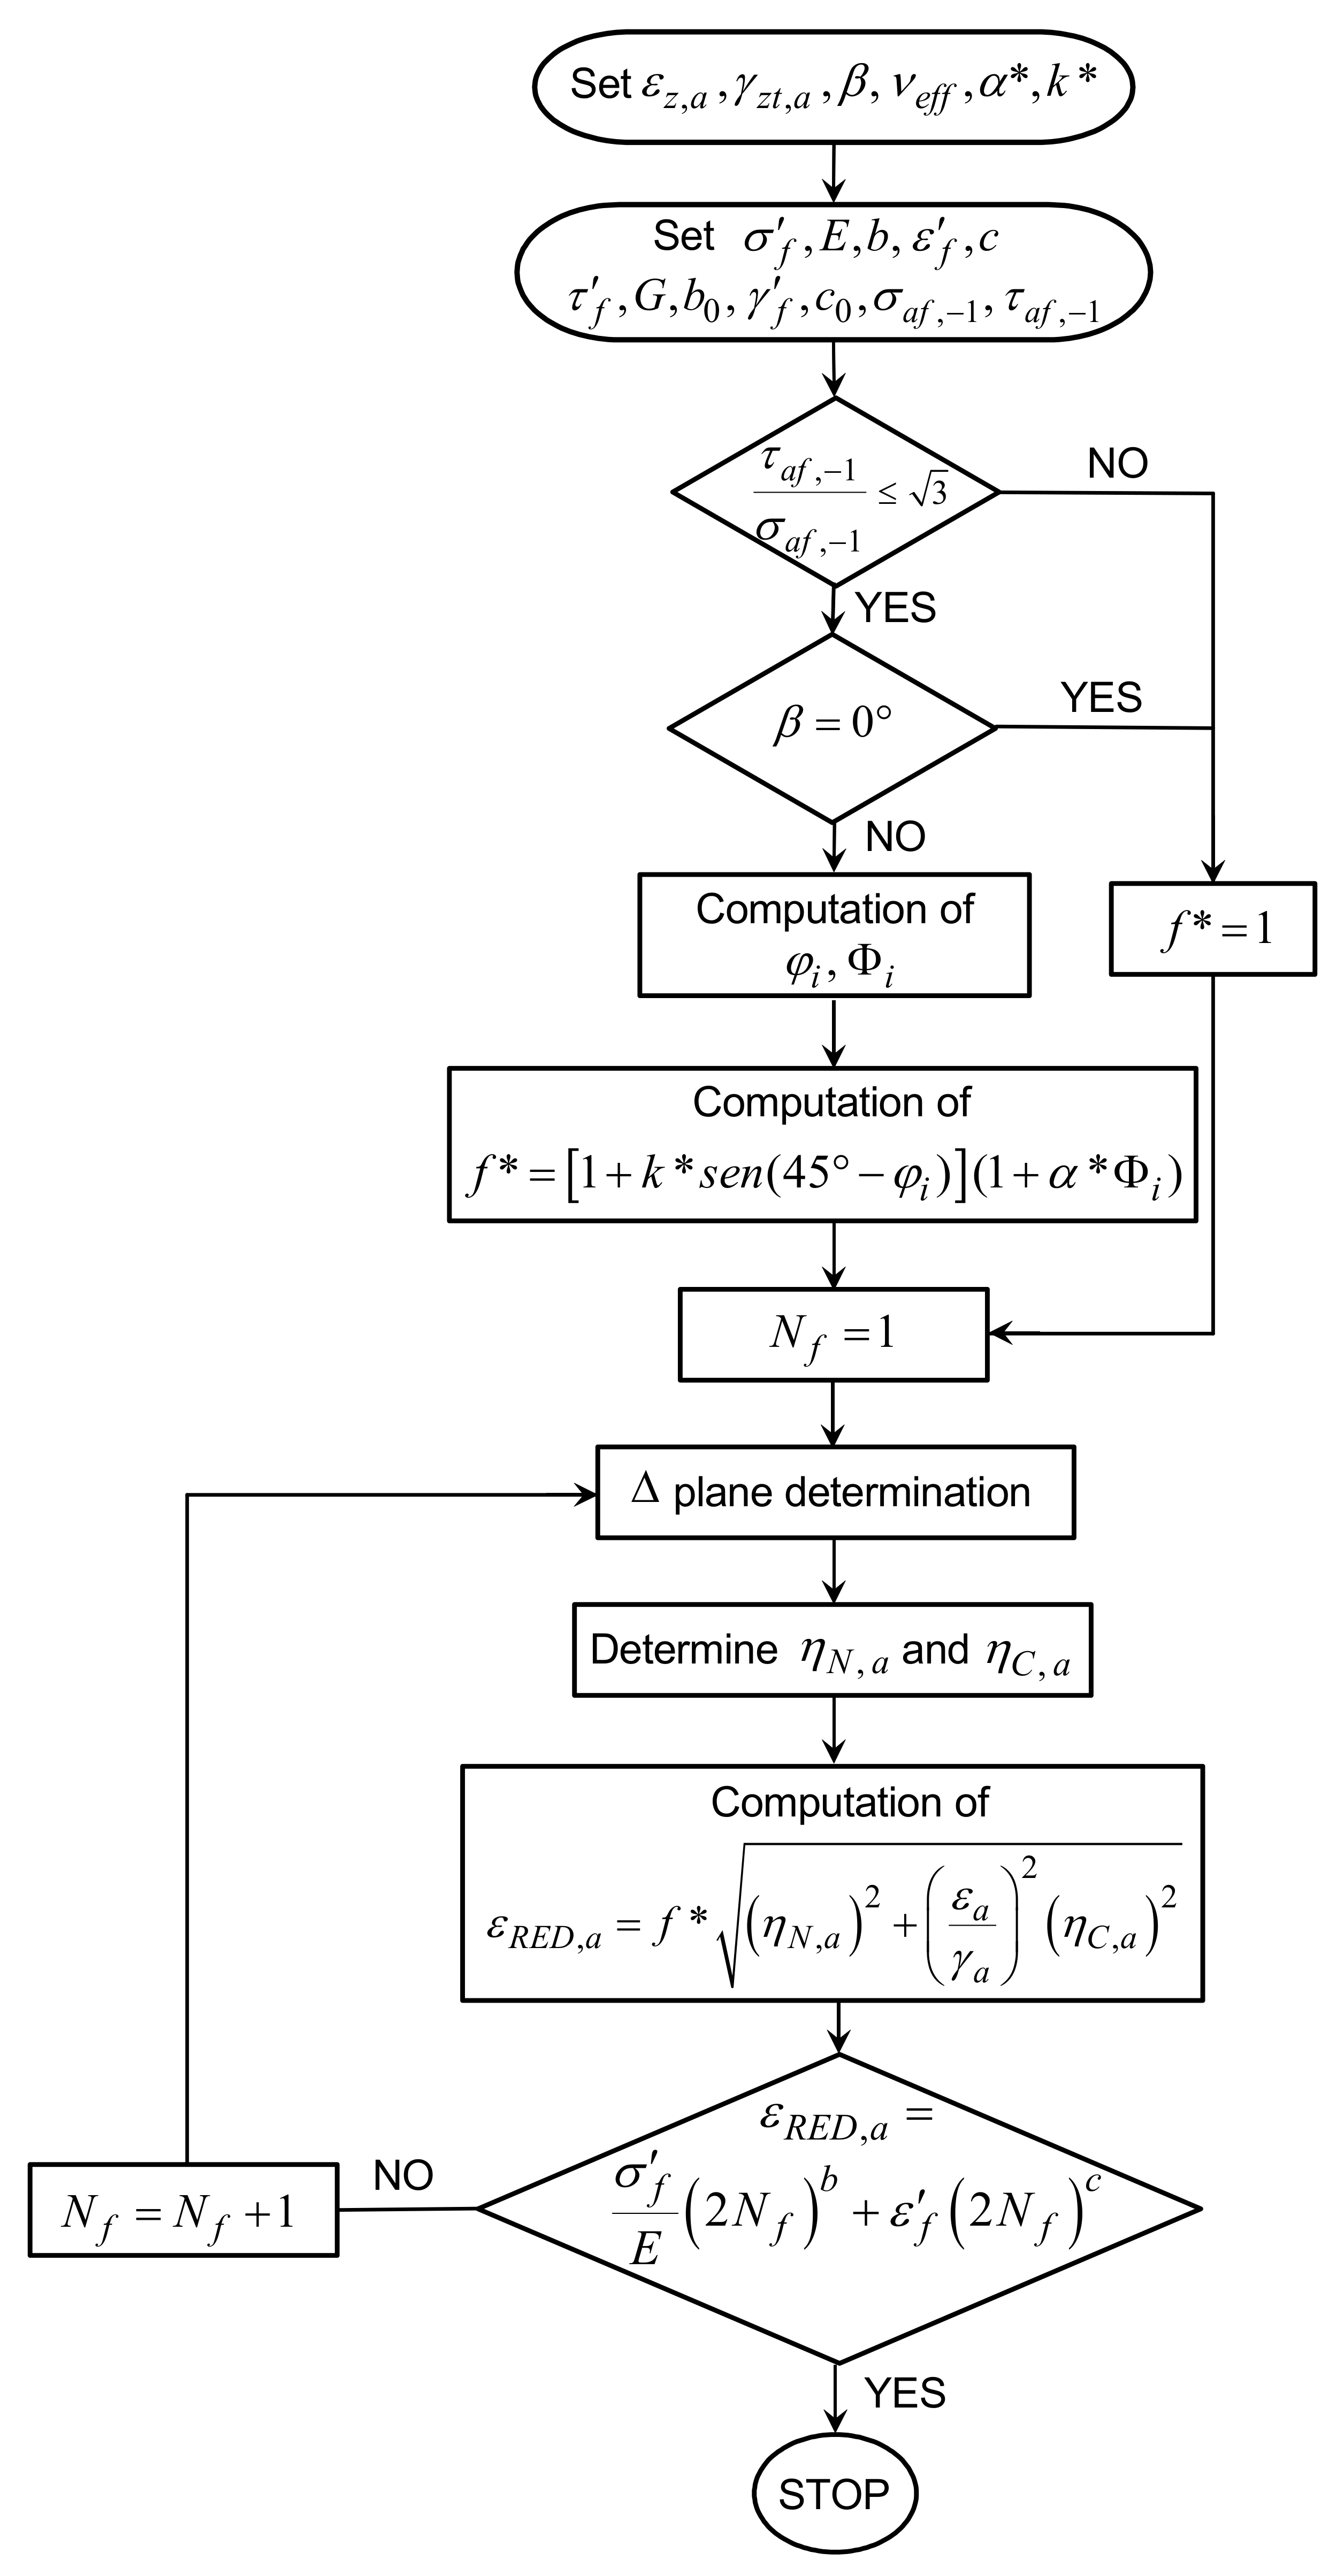
The flowchart of the RED criterion for biaxial fatigue test simulations is shown in Figure 7.
The RED criterion is a strain-based criterion, which is based on the critical plane concept and employs a novel enhancement factor in order to take into account the additional cyclic hardening under non-proportional fatigue loading. The main steps are detailed in the following.
Note that, in Figure 7, the loading non-proportionality is assumed to be produced by the phase shift (for simplicity of schematization), but the criterion is more general and it can be used in the presence of any cause of loading non-proportionality.
3.2.1. Material Sensitivity to Loading Non-Proportionality
As previously mentioned, materials react in different ways to non-proportional loading under the same degree of non-proportionality. This can be described as the sensitivity of a given material to non-proportional loading.
Therefore, first of all, the criterion checks material sensitivity to non-proportional loading and the quotient of fatigue limits between fully reversed shear stress and fully reversed normal stress, , is used to achieve such an aim. As a matter of fact, according to Papadopoulos’ statement [1], when the material shows a decreasing in fatigue limit under non-proportional loading.
Only in the case of sensitive materials, the criterion takes into consideration both the strain state and the additional cyclic hardening, by using a suitable strain factor, . Otherwise, such a factor is assumed to be equal to 1.0.
3.2.2. Determination of the Critical Plane
The critical plane concept is based on the physical observation that cracks initiate and grow on specific material planes. There are different ways to define the critical plane itself. The orientation of the critical plane presented here is linked to both the directions of the principal strain axes and the mechanical/fatigue properties of the material, as detailed hereafter.
Let us consider a material point of a smooth structural component under a fully reversed biaxial constant amplitude fatigue loading. The strain tensor at such a point is a function of:
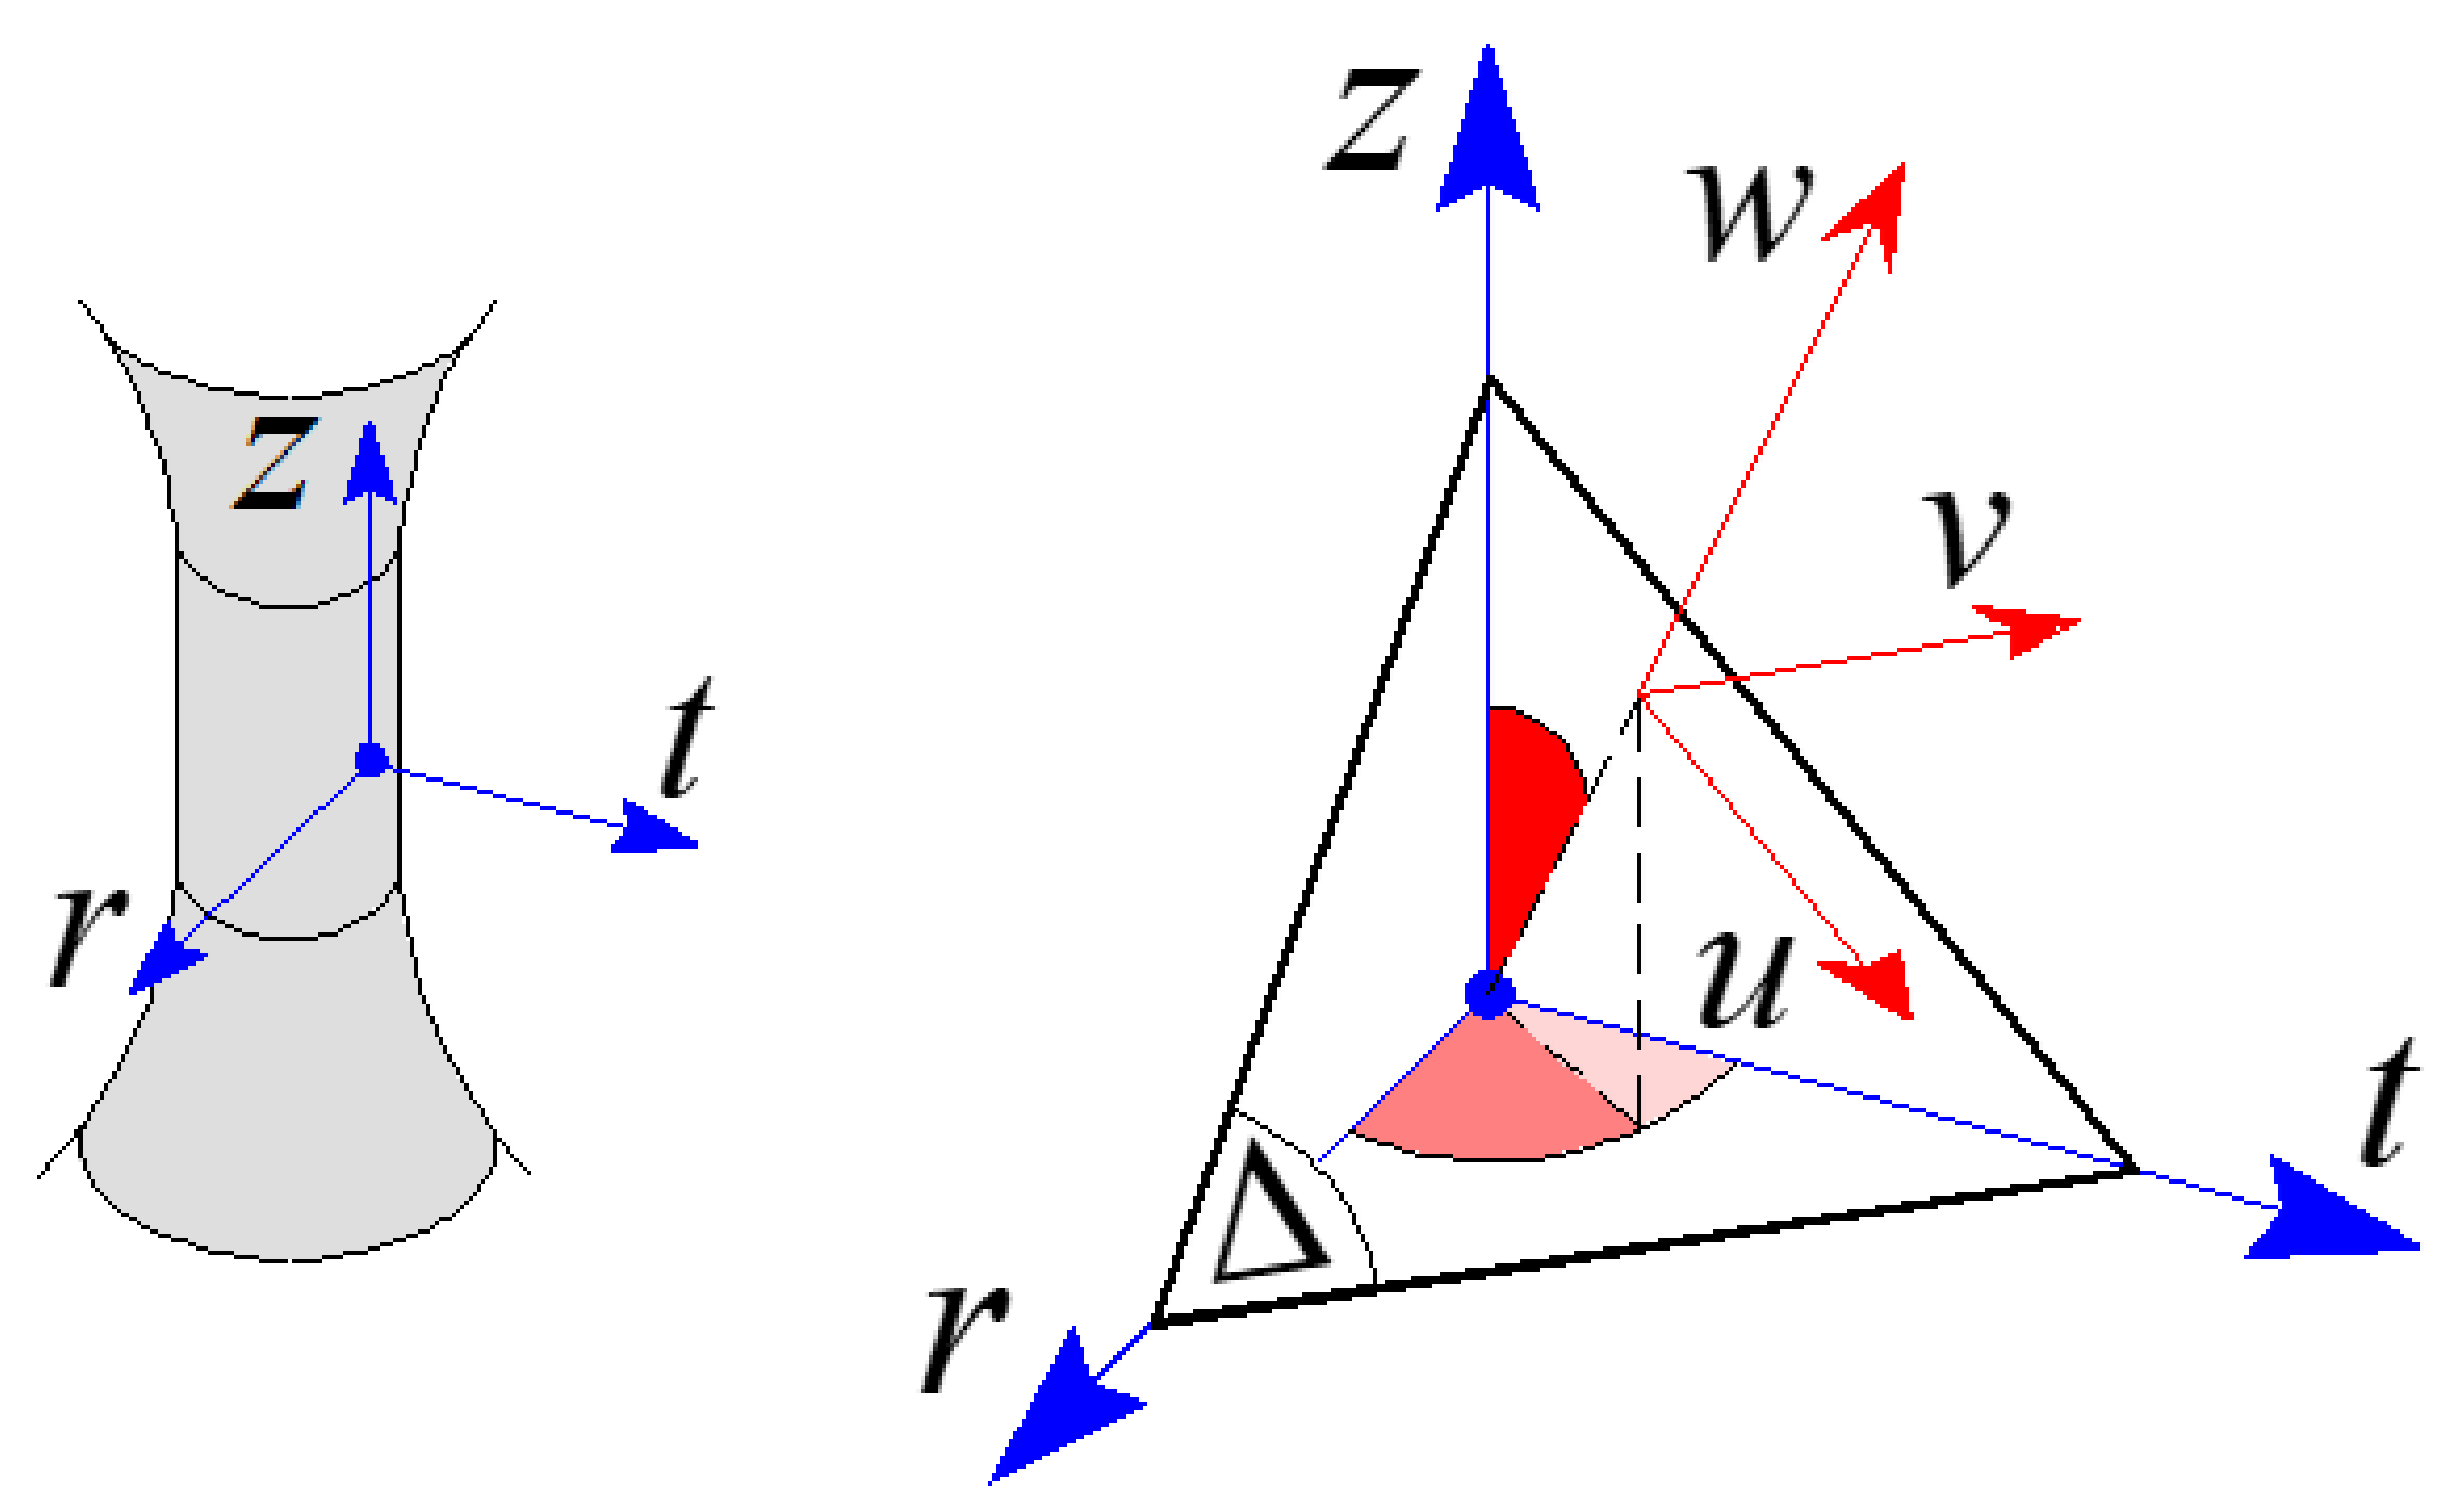
with being a fixed frame with its origin in the verification point, the r- and t-axes are perpendicular and tangential to the specimen surface, respectively, and the z-axis forms, with r and t, an orthogonal frame (Figure 8). The effective Poisson’s ratio needed to compute the whole strain tensor is here assumed to be equal to 0.5 [18].
According to [18], the critical plane, , has to be determined first. Principal strains and are related to the and principal strain directions, respectively, and are computed during a loading cycle (with a period equal to ). The direction of the 1-axis in correspondence with the time instant, , when attains its maximum value is assumed as the normal to the fracture plane, . The normal to the critical plane is assumed to form angle with respect to , and the rotation performed around the direction is clockwise towards . Details on such an assumption are given in Reference [18].
The expression of the angle is as follows:
where and (function of the number of loading cycles to failure, ) are computed by means of the tensile and torsional Manson–Coffin equations, that is:
It can be observed that the definition of the orientation of the critical plane, given by Equation (9), is able to precisely capture the experimental fracture nature because it is a function of . As a matter of fact:
- (i)
- when the fracture is extremely ductile, that is , the angle tends to be 45°;
- (ii)
- when the fracture is extremely brittle, that is , the angle tends to be 0°;
- (iii)
- between the above fracture types, .
The critical plane is the plane where the fatigue assessment is performed, that is, where the damage parameter is computed.
3.2.3. Damage Parameter under Proportional Loading
Let us consider a local frame on the plane (Figure 8), with its origin in the verification point. The u-axis is represented by the intersection of and the plane, and the v-axis forms an orthogonal frame with u and w.
The displacement vector related to the verification point, , may be decomposed in: a normal vector, , function of the strain tensor component, , and a tangential vector, , function of the strain tensor components, and . For such vectors, their amplitudes are calculated, and more precisely: for , its direction is fixed with respect to time and the amplitude is given by:
whereas the amplitude of , , is computed according to the maximum rectangular hull method proposed by Araujo et al. [44].
Note that in Reference [18] an analytical procedure to determine both and is presented, as an alternative to that employed here.
Under multiaxial proportional loading, the equivalent strain amplitude (damage parameter), , is computed as follows:
By implementing the tensile Manson-Coffin equation (see Equation (10)) in the fatigue limit condition represented by Equation (13), that is:
the fatigue life, , is determined.
3.2.4. Damage Parameter under Non-Proportional Loading
The lifetime estimation performed by means of Equation (14) is relatively poor under non-proportional loading, due to the fact that the above equation is not able to take into account the additional cyclic hardening experimentally observed in materials sensitive to non-proportionality.
Therefore, a refined equivalent deformation amplitude, , is here proposed by implementing in Equation (14) a novel strain factor, , and the fatigue limit condition is given by:
where the factor, , is:
being and computed according to definitions given in Section 3.1. is given by:
being M the test number under proportional loading by excluding those characterised by a strain path along 45°- direction, is computed by applying Equation (10), and is calculated by means of Equation (2). Moreover, is given by:
where N is the tests number under non-proportional loading.
It can be observed that such equations are analogous to those proposed by Borodii et al. [3,4,5] (see Equations (4) and (5)); however, according to the author’s proposal, is computed by considering the angles formed between the uniaxial strain paths and the multiaxial proportional one (i.e., that with an orientation equal to 45°). As a matter of fact, such a parameter, according to the definition given in Section 3.1, should be representative of the difference in cyclic properties with respect to the proportional strain path; therefore, the reference orientation proposed here to compute is the multiaxial proportional one, contrary to that assumed by Borodii, and corresponding to the material principal direction [3,4,5].
This proposal allows to overcome one of the drawbacks presented in Section 3.1.2. Since both terms of Equation (16) increase by increasing the phase shift, the strain factor increases even by increasing .
3.2.5. Theoretical Results
First, for the material being examined, the sensitivity to non-proportional loading is checked, according to the theoretical statement by Papadopoulos [1]. The fatigue limits are derived from the elastic parameters of the both tensile and torsional Mason-Coffin curves [45]. More precisely, is equal to 261.45 MPa, whereas is equal to 490.08 MPa, the above limits being referred to loading cycles (according to Reference [46]). Consequently, , that is the material being examined can be considered sensitive to non-proportional loading.
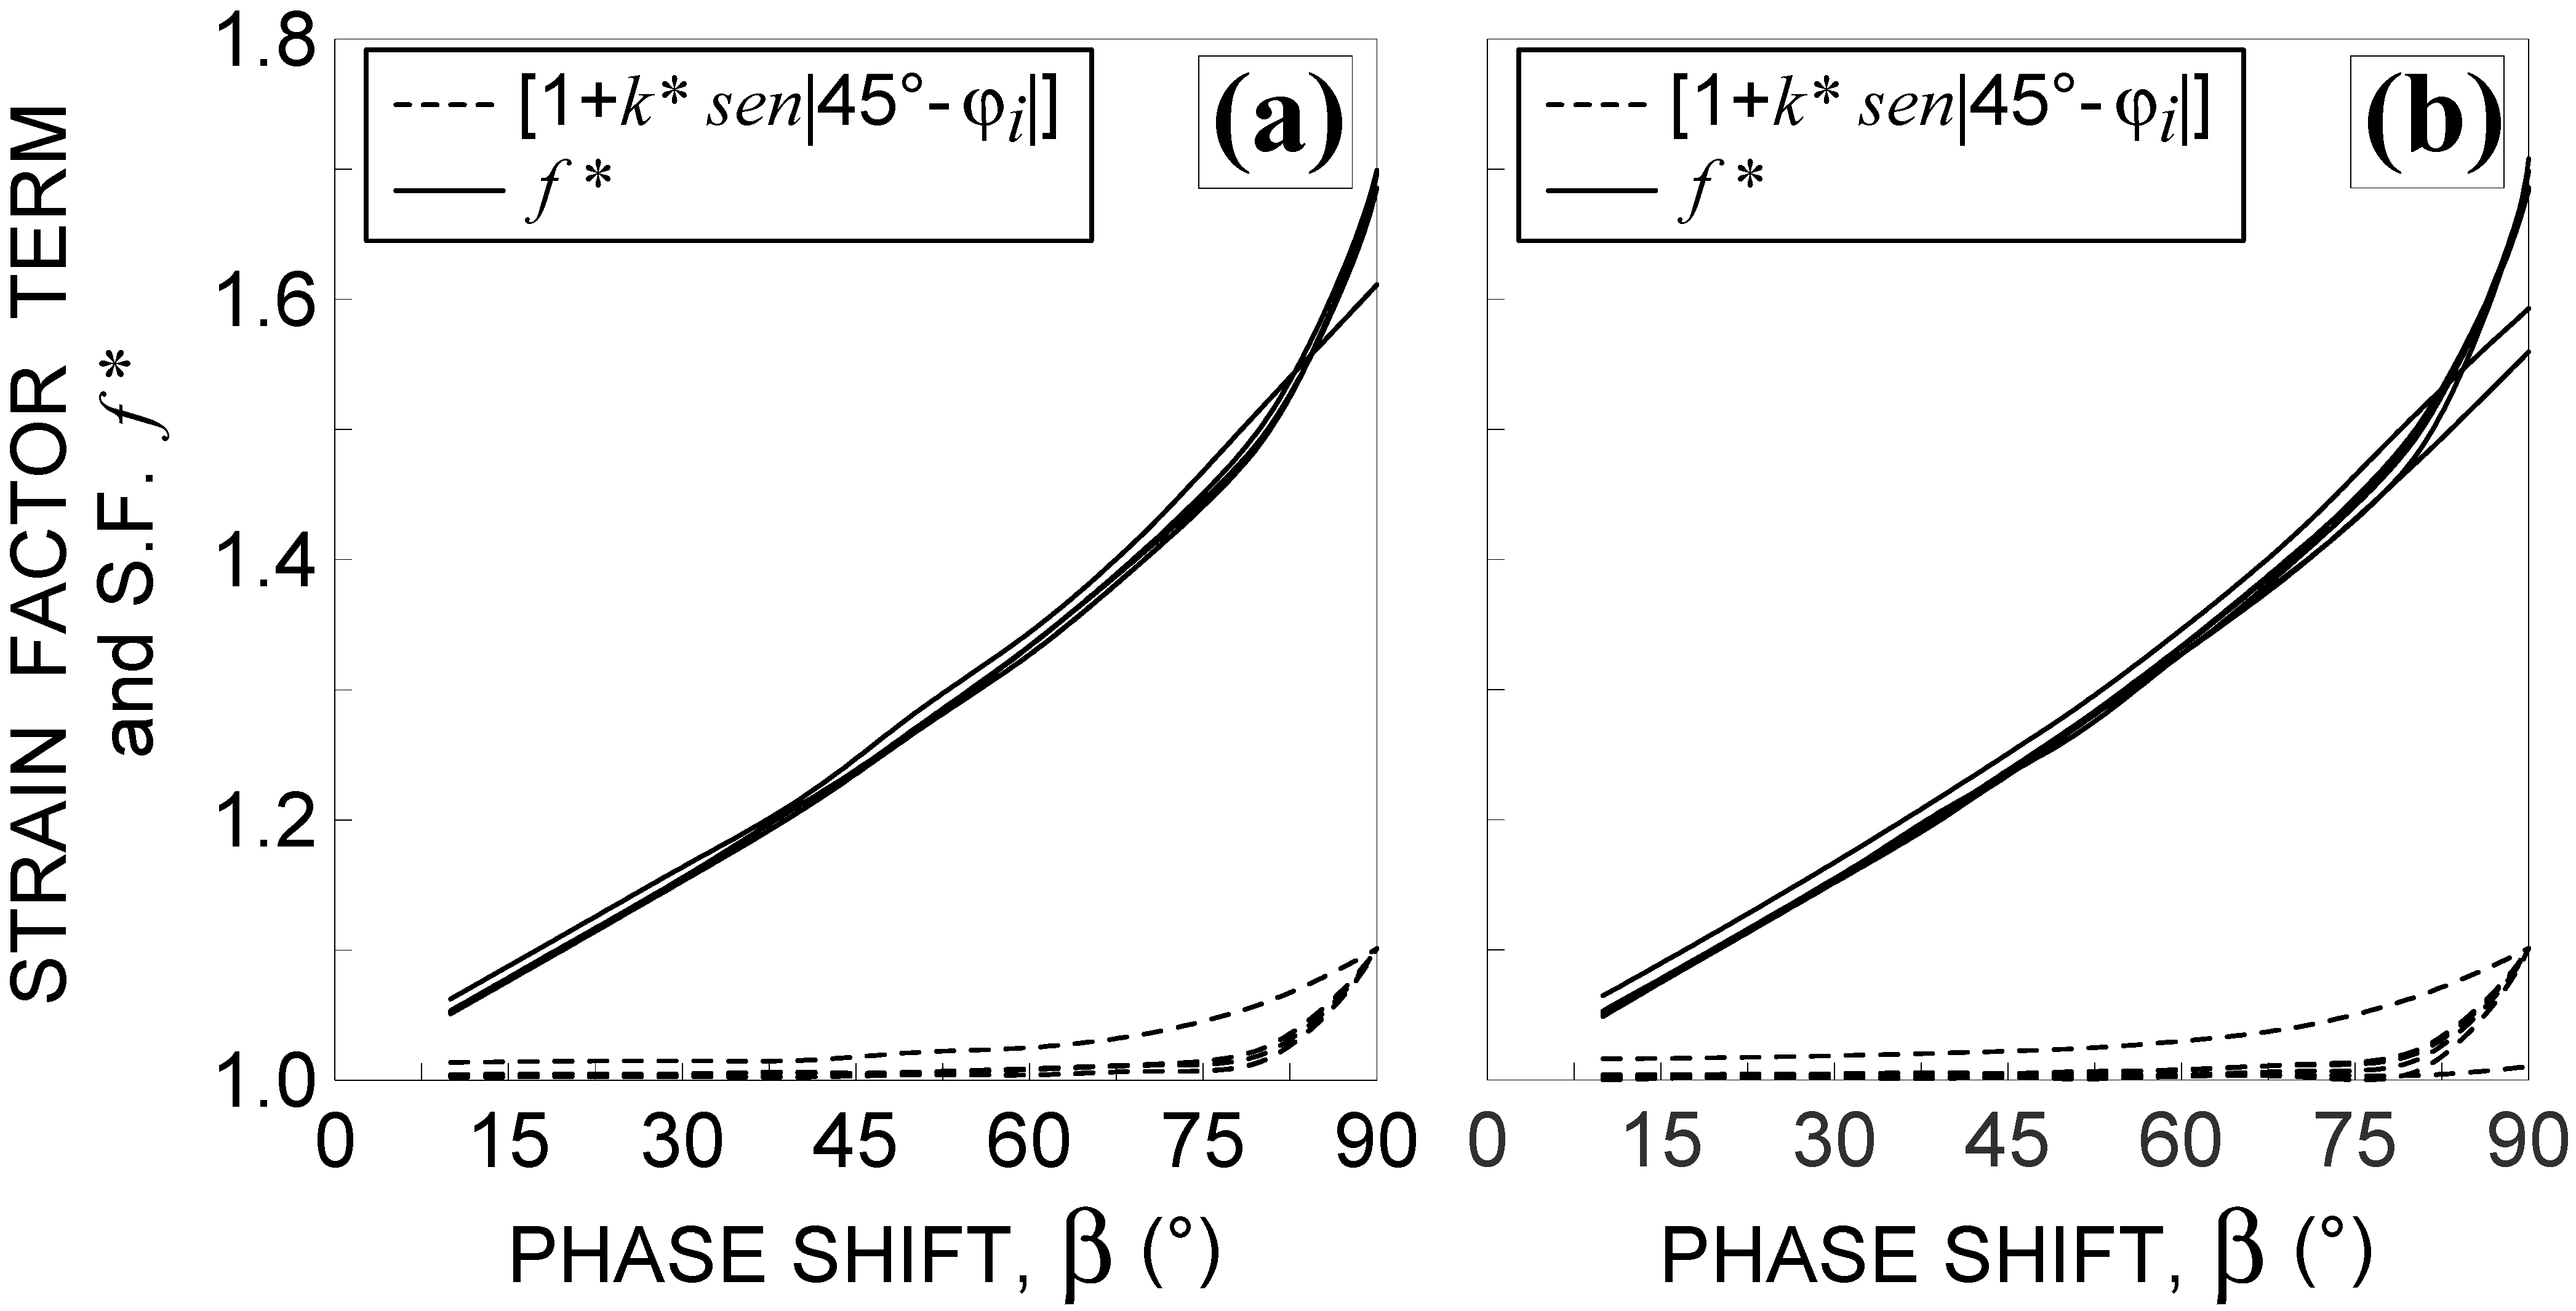
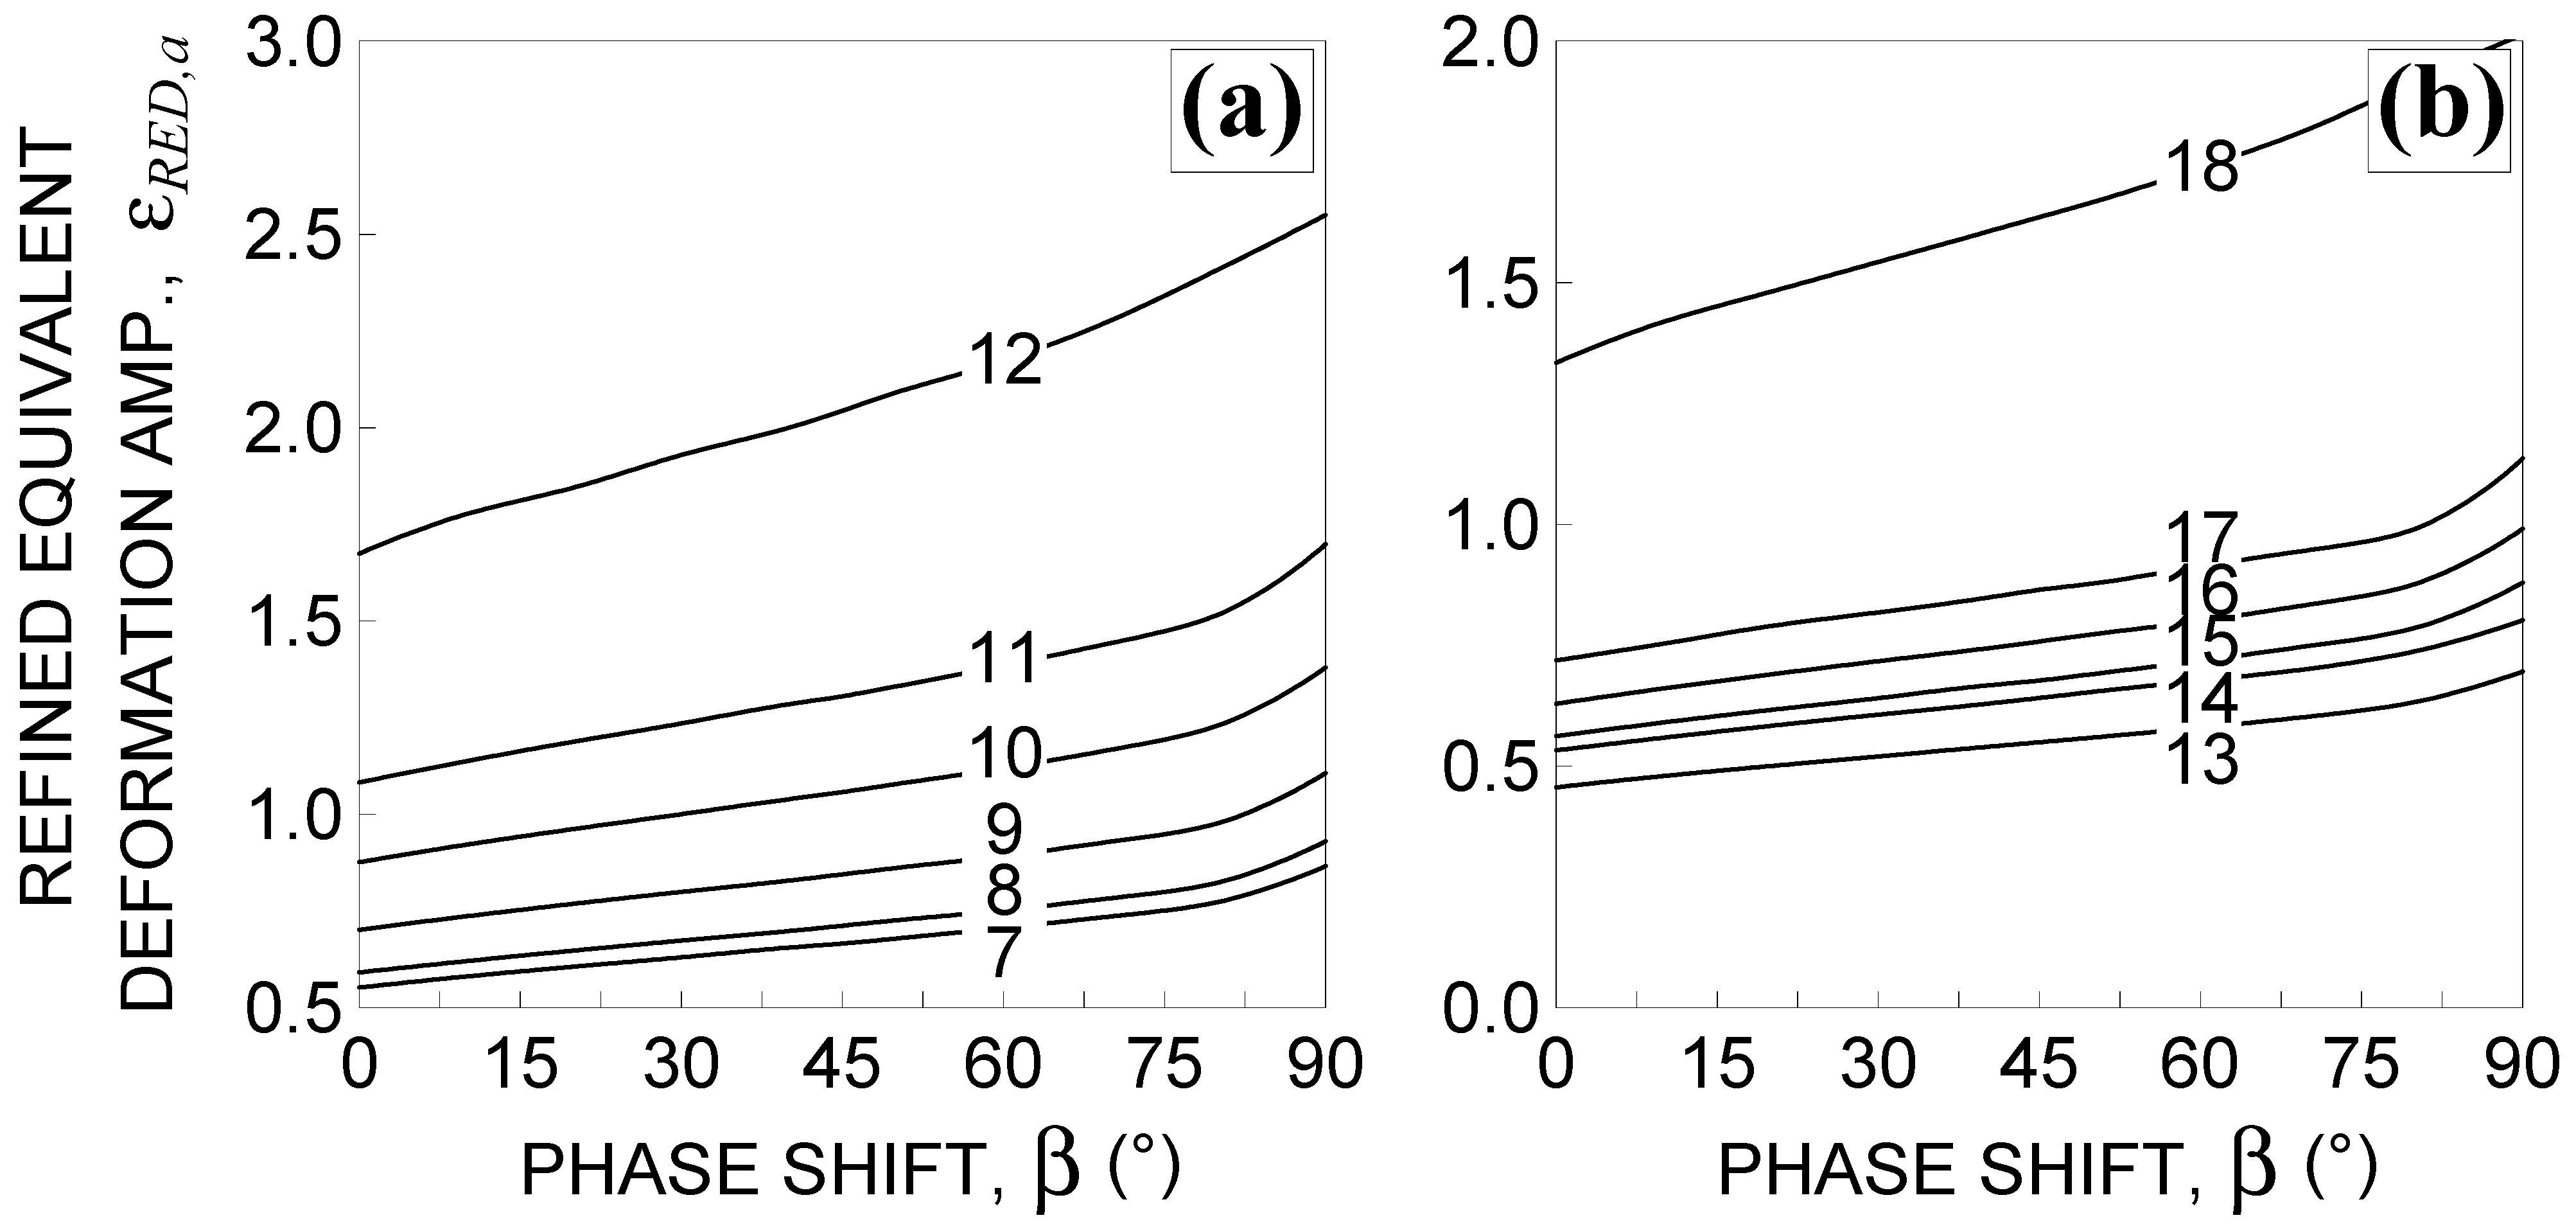
In Figure 9, the first term in the brackets of Equation (16) and strain factor are plotted against for all examined non-proportional loading conditions. Figure 10 shows the corresponding trends of the refined equivalent deformation amplitude, , including the proportional loading condition (that is ).
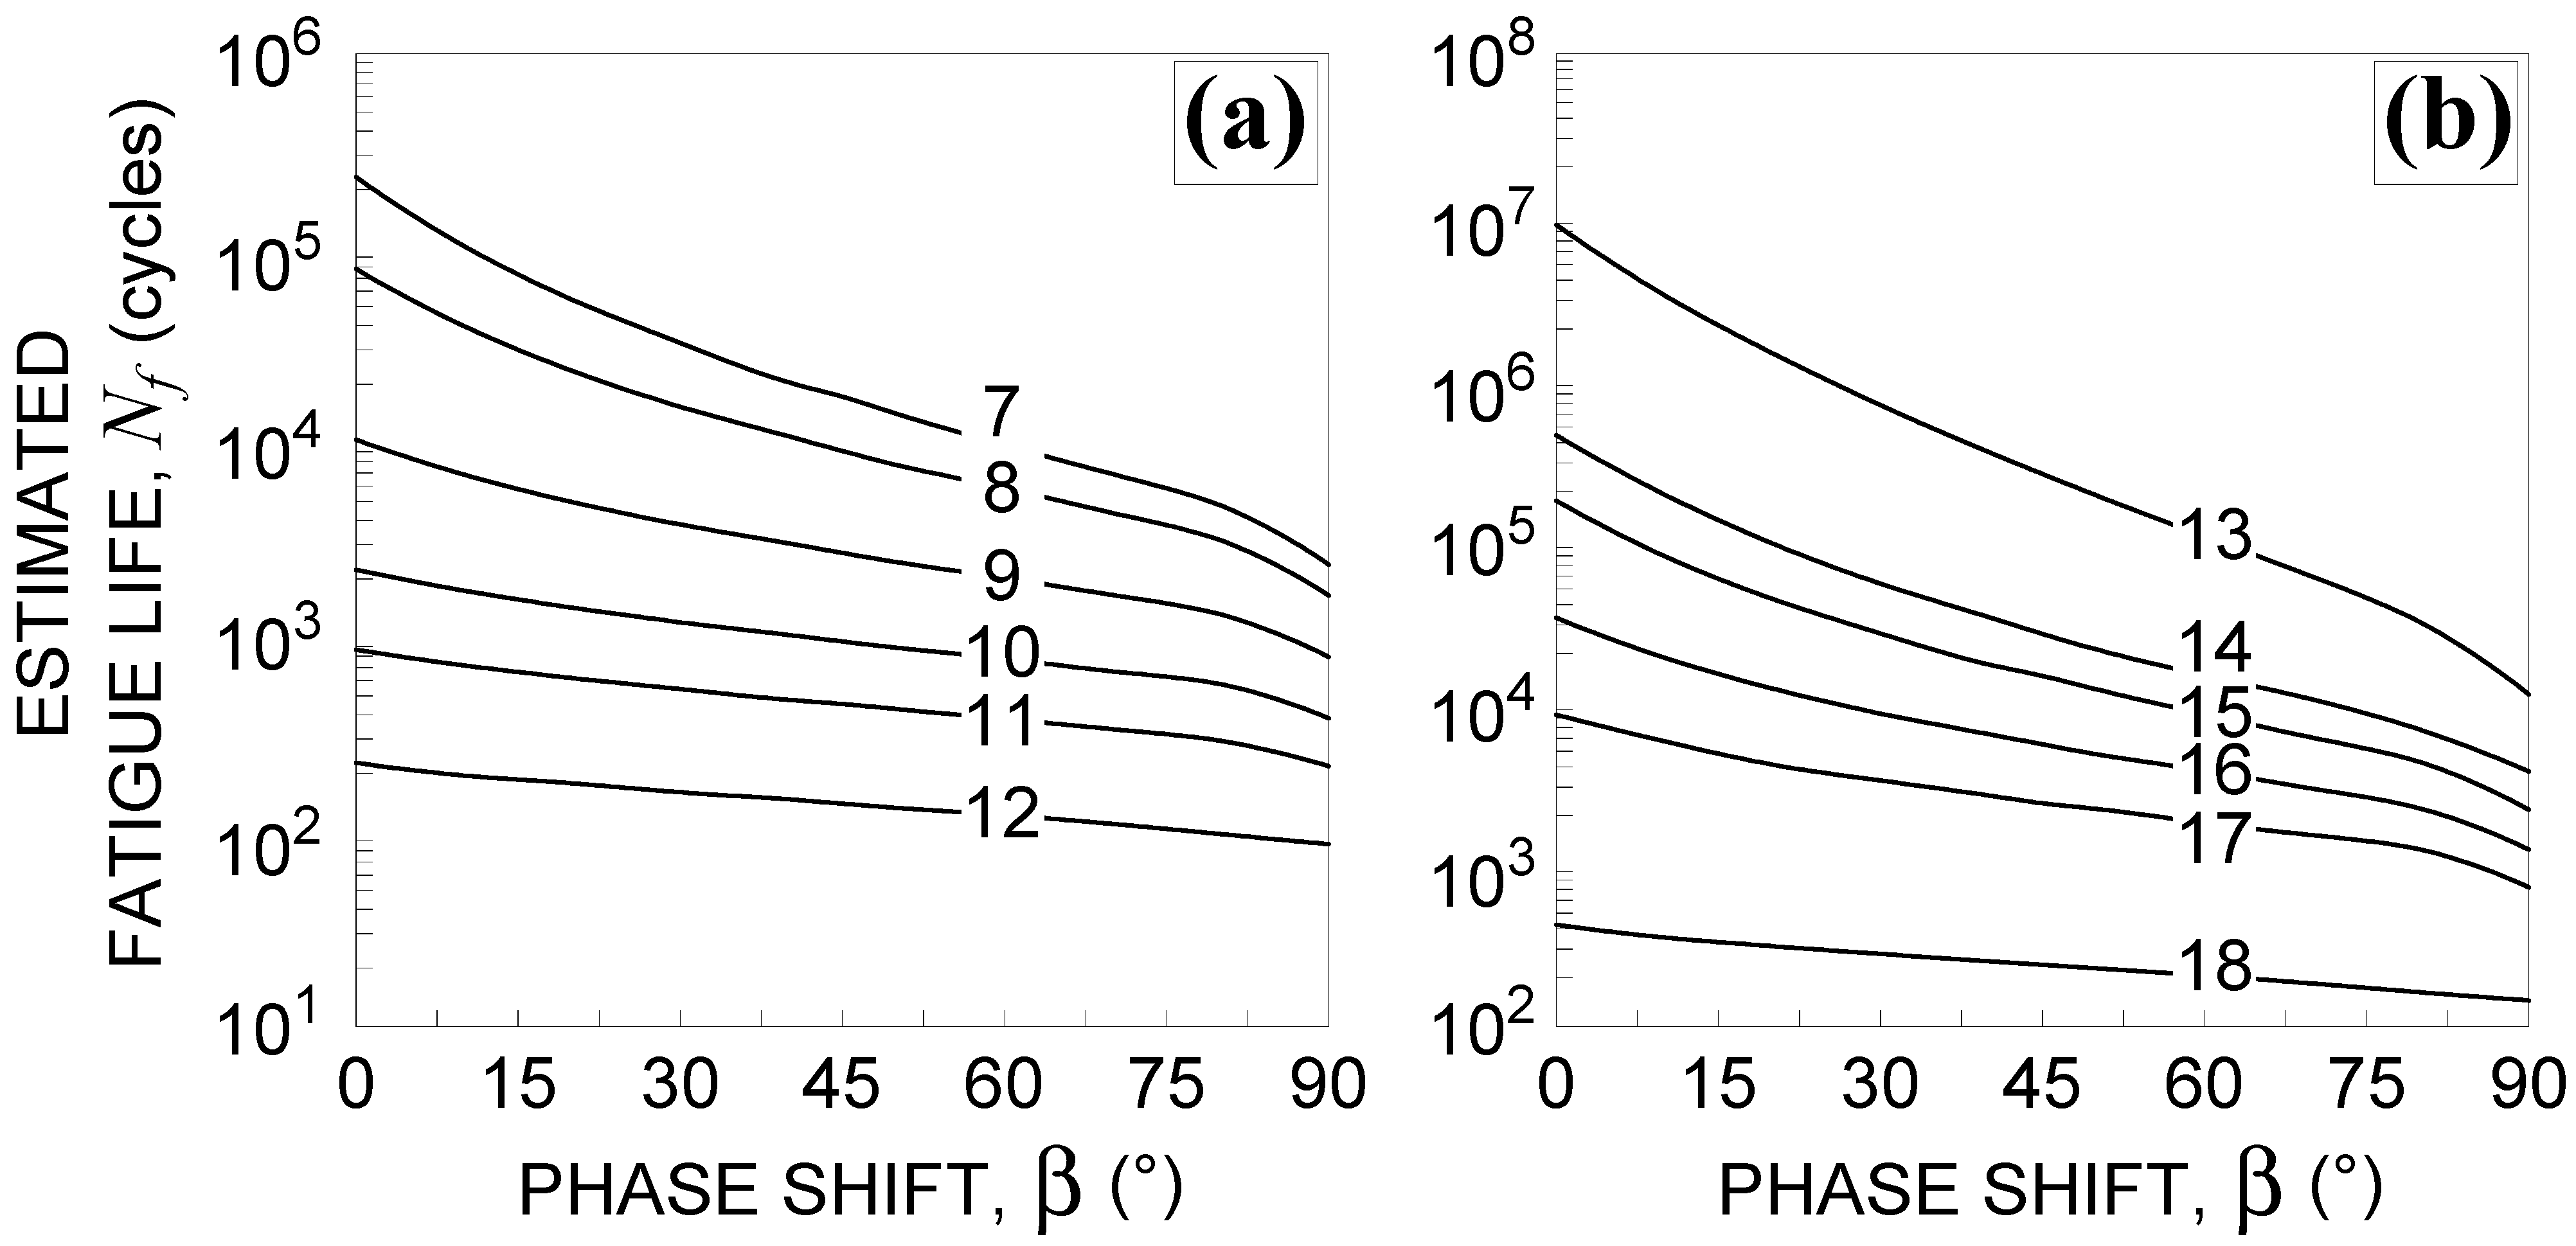
From Figure 9, it can be observed that one of the drawbacks of the reduced strain range method is overcome, since increases along with an increasing (Figure 10). The lifetime, , decreases up to a minimum in correspondence of 90°, as shown Figure 11, in accordance with the experimental evidence. Therefore, the second drawback is also overcome.
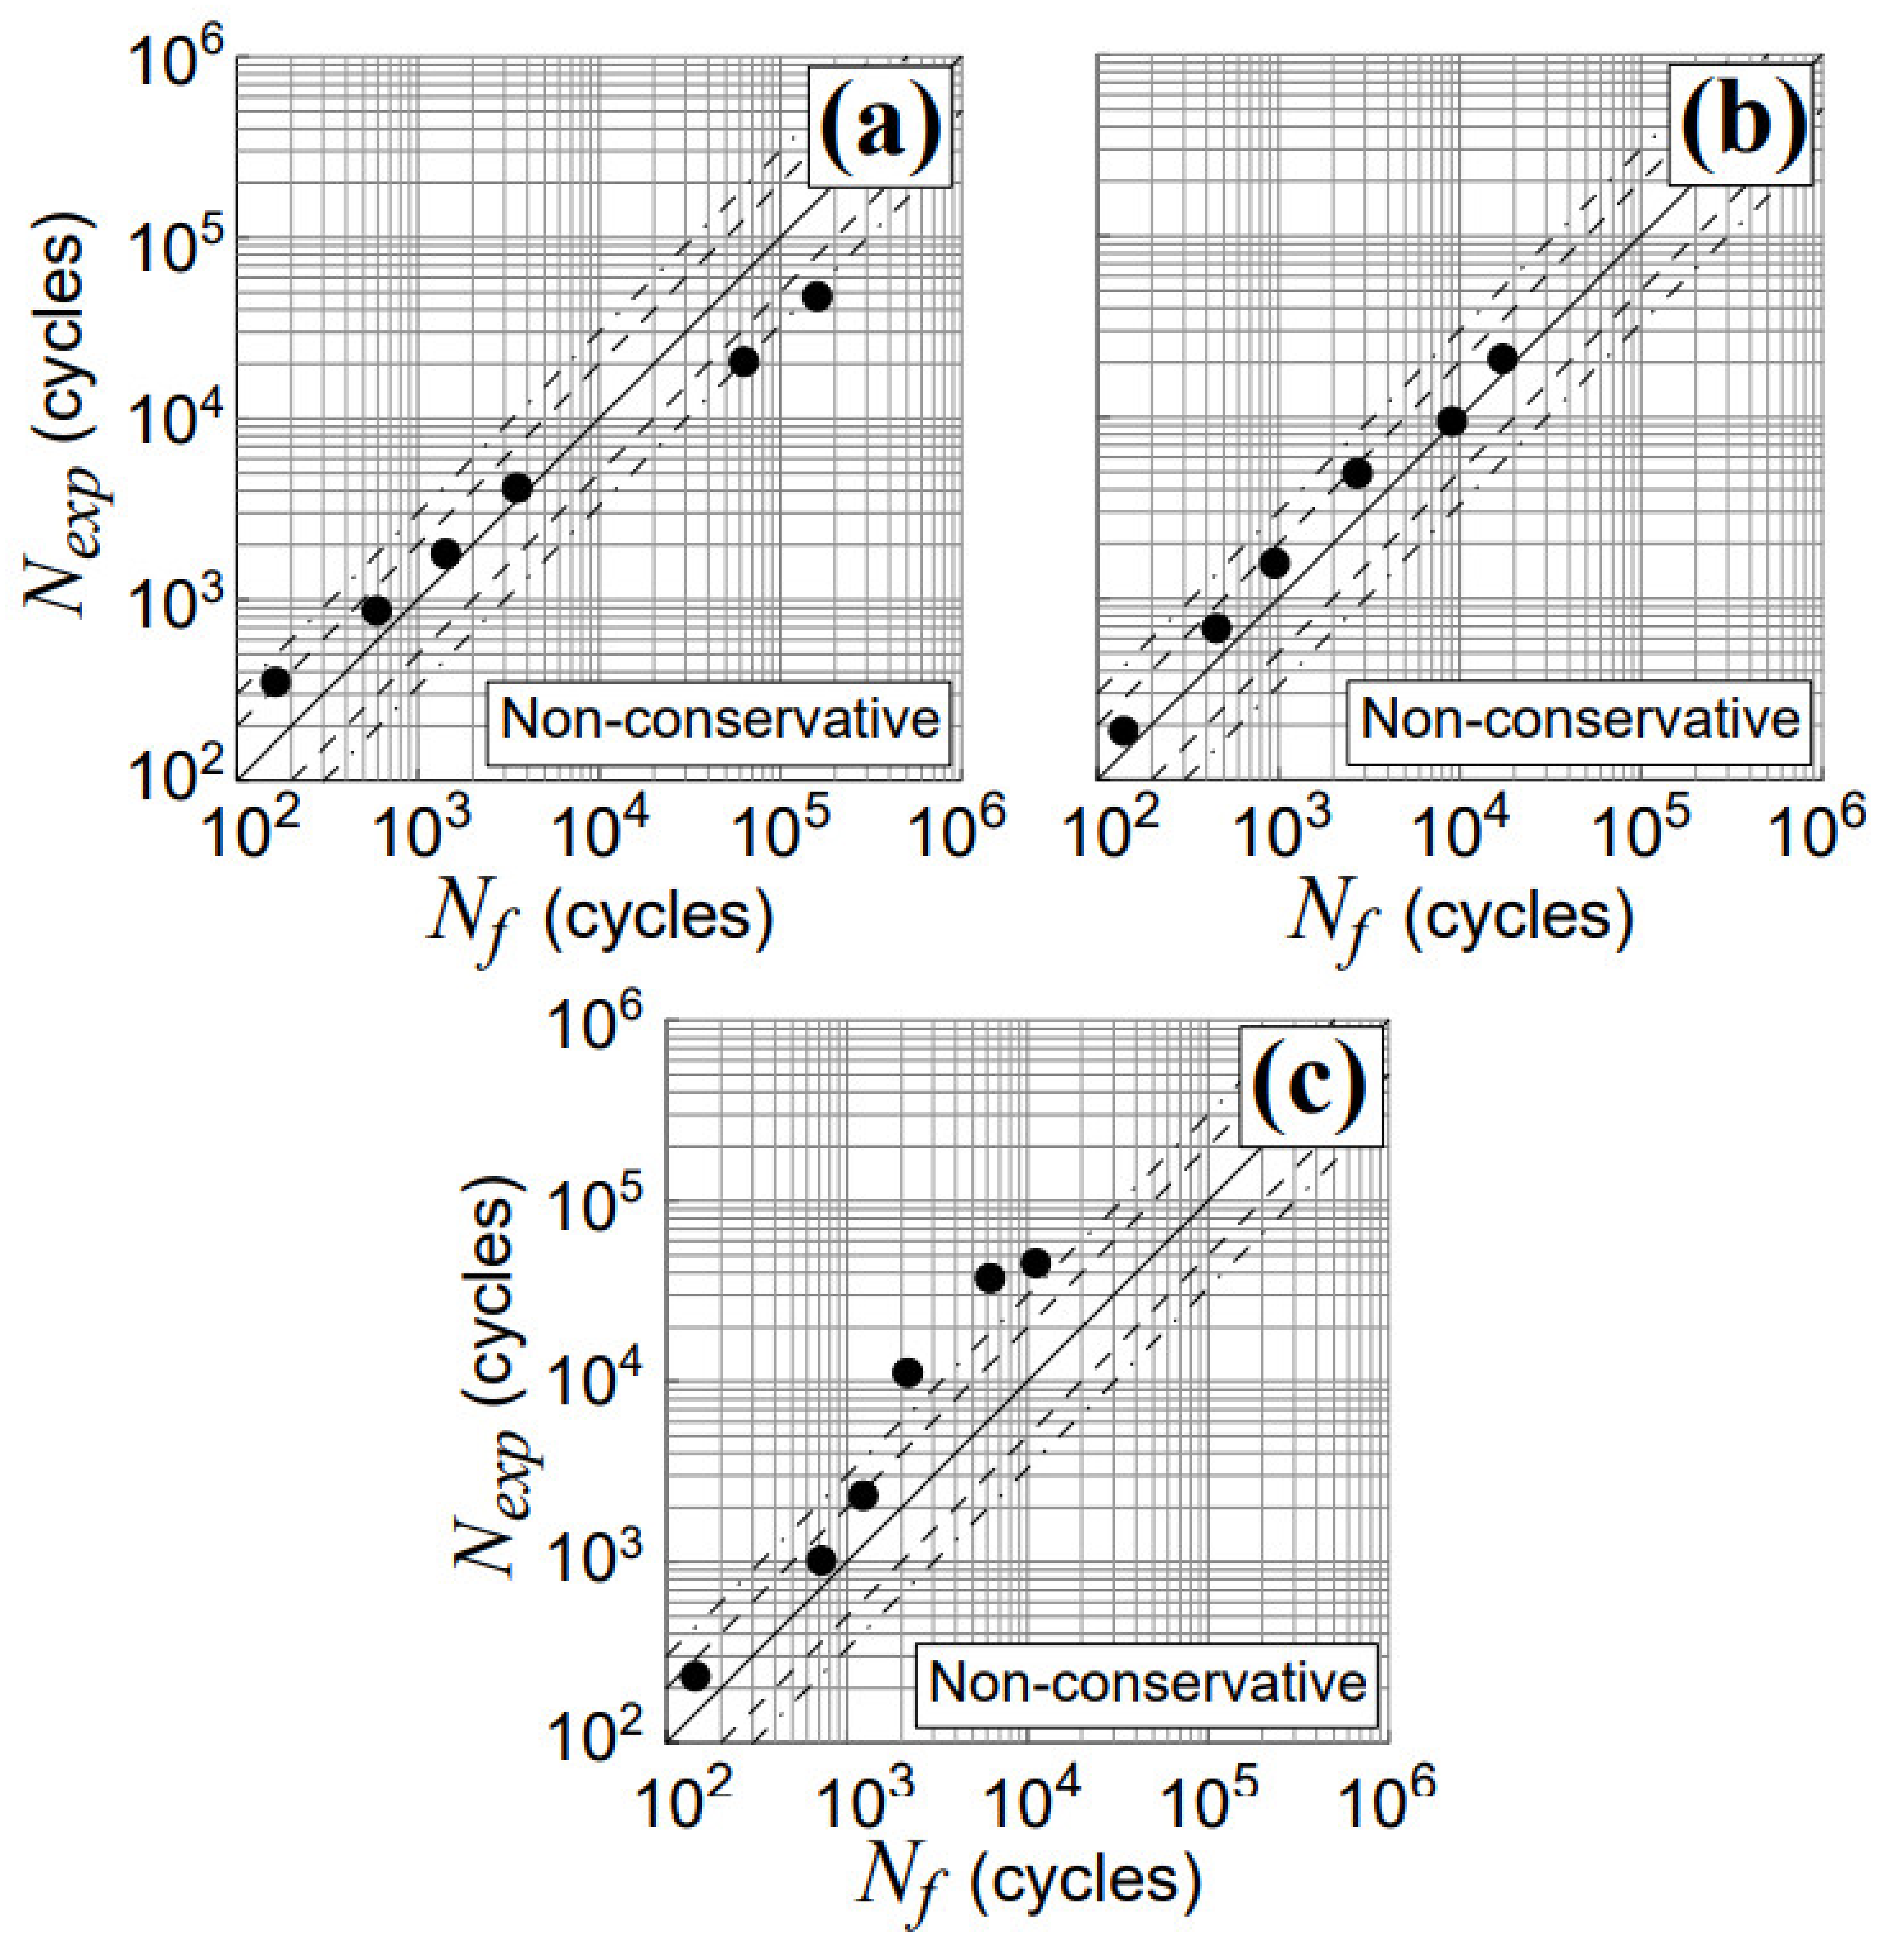
For each multiaxial test listed in Table 2, the fatigue life is computed and compared with the experimental one in Figure 12. It can be observed that, under proportional loading (Figure 12a), 67% of the results fall within scatter band 2, whereas 83% of the results fall within scatter band 3. Under non-proportional loading and (Figure 12b), 100% of the results fall within scatter band 2, whereas for (Figure 12c), 50% of the results fall within scatter band 2 and the other 50% fall out of scatter band 3. Moreover, under non-proportional loading, conservative results are obtained.
The accuracy of the proposed criterion can also be evaluated by means of the mean square error [18], . By considering all tests (that is, No. T1 to No. T18, in Table 2) the value is equal to 2.34. The accuracy is slightly greater than that characterizing the Borodii et al. method, being equal to 2.42.
It is worth mentioning that, according to the root mean square error method, the value of is equal to 1 when a perfect correspondence exists between experimental and estimated fatigue lifetimes. On the other hand, if all the computed results fall within scatter band 2, the value would be lower than 2, while if all the computed results fall within scatter band 3, the value would be lower than 3.
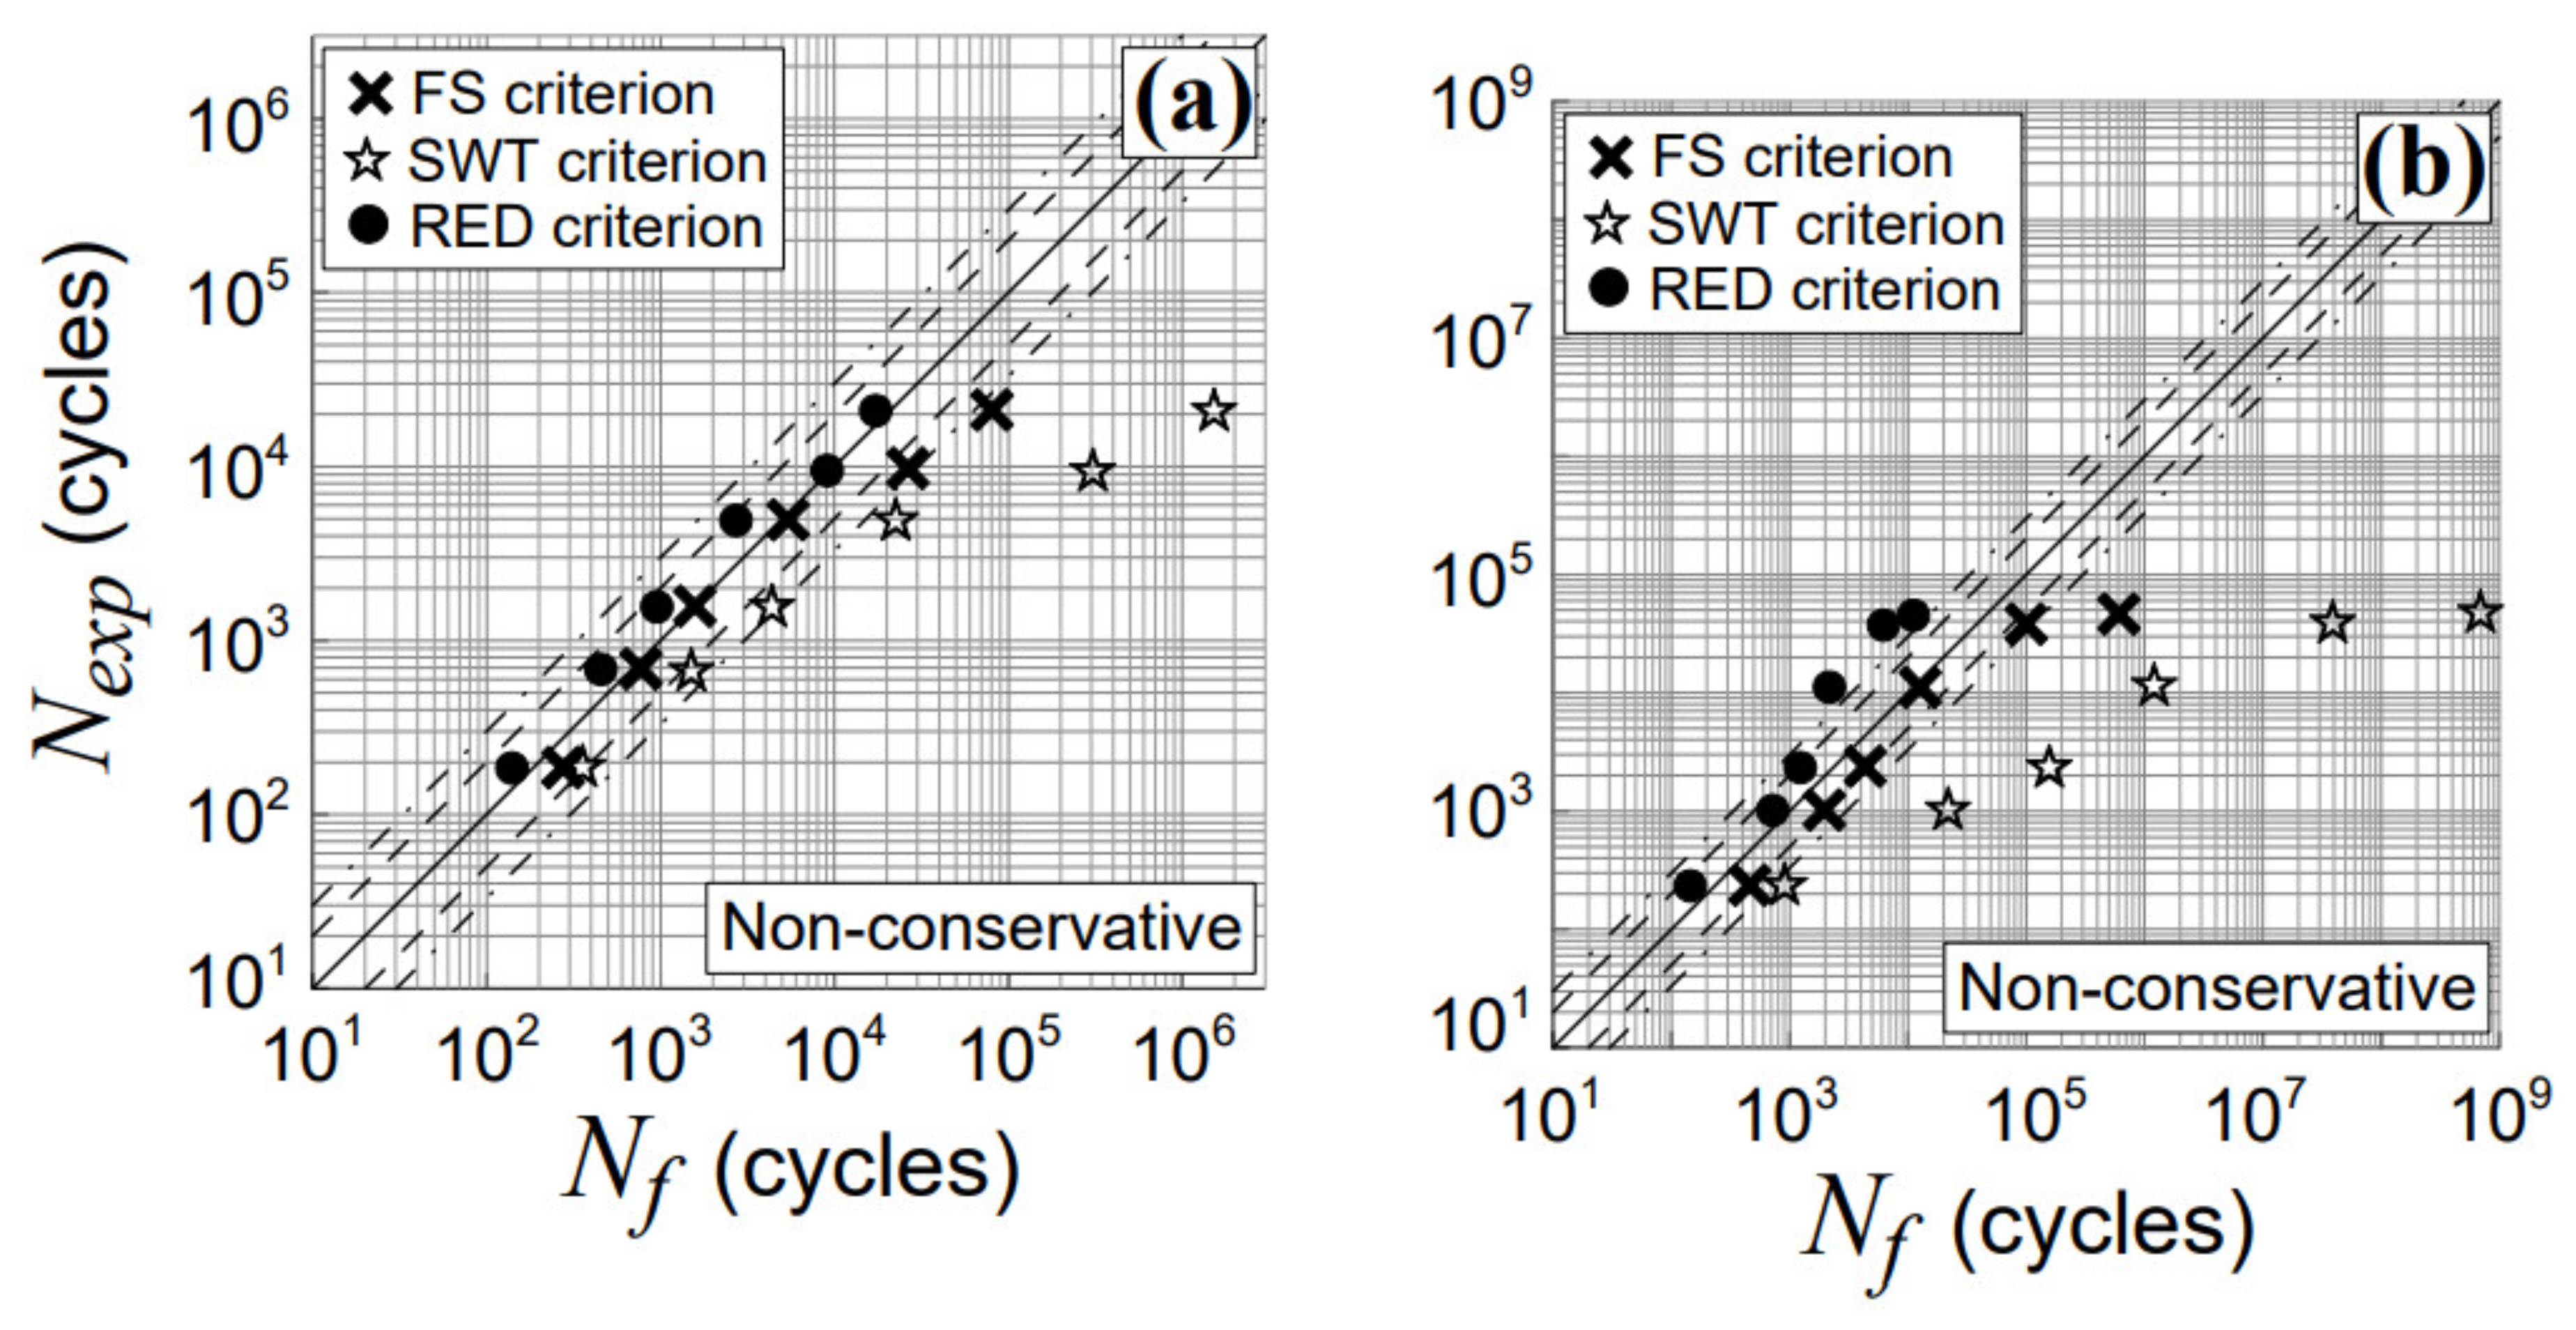
Finally, the above results are compared with those obtained by using two other criteria, available in the literature, the Fatemi and Socie (FS) criterion [47], and the SmithWatson and Topper (SWT) criterion [48], as shown in Figure 13. The RED criterion accuracy is greater with respect to that related to each of the above examined criteria.
4. Conclusions
In the present paper, a novel criterion, the RED criterion, has been proposed in order to estimate the fatigue lifetime of materials that are sensitive to non-proportionality.
Due to the fact that, in such conditions, a fatigue criterion cannot accurately estimate fatigue life by considering only the stress/strain state inside a material, an enhancement factor, implemented into the damage parameter relationship, has been employed. More precisely, along the line of the strain factor definition implemented in the reduced strain range method by Borodii et al.; the strain factor proposed here is a function of material constants, strain path orientation, and the degree of non-proportionality.
The use of such a strain factor allows to overcome the drawbacks of the Borodii method, and to define a refined equivalent deformation amplitude that represents the experimental data with a quite satisfactory accuracy, especially under non-proportional loading.
More precisely, the proposed criterion has been applied to experimental data obtained by testing TC4 titanium alloy specimens under multiaxial LCF. In such a context, the accuracy of the criterion has been computed by means of the mean square error, obtaining satisfactory results, being the value of equal to 2.34. The comparison with other criteria available in the literature has shown that the novel criterion holds a greater accuracy.
Further investigations on other metallic materials, sensitive to additional cyclic hardening, are in progress.
Funding
This research was funded by the Italian Ministry of University and Research, PRIN National Grant 2017, project code 2017HFPKZY, University of Parma Research Unit.
Institutional Review Board Statement
Not applicable.
Informed Consent Statement
Not applicable.
Data Availability Statement
Data sharing not applicable.
Conflicts of Interest
The author declares no conflict of interest.
References
- Skibicki, D. Phenomena and Computational Models of Non-Proportional Fatigue of Materials; Springer Science and Business Media LLC: Berlin/Heidelberg, Germany, 2014. [Google Scholar]
- Brown, M.W.; Miller, K.J. A theory for fatigue failure under multiaxial stress–strain conditions. Proc. Inst. Mech. Eng. 1973, 187, 745–755. [Google Scholar] [CrossRef]
- Borodii, M.V. Analysis of experimental data on low-cycle fatigue in nonproportional deformation. Strength Mater. 2000, 32, 7–12. [Google Scholar] [CrossRef]
- Borodii, M.V.; Strizhalo, V.A. Analysis of the experimental data on a low cycle fatigue under nonproportional straining. Int. J. Fatigue 2000, 22, 275–282. [Google Scholar] [CrossRef]
- Borodii, M. Obtaining a Low-Cycle Fatigue Strain Criterion. Strength Mater. 2001, 33, 217–223. [Google Scholar] [CrossRef]
- Wu, Z.-R.; Hu, X.-T.; Song, Y.-D. Multiaxial fatigue life prediction for titanium alloy TC4 under proportional and nonproportional loading. Int. J. Fatigue 2014, 59, 170–175. [Google Scholar] [CrossRef]
- Paul, S.K. Prediction of non-proportional cyclic hardening and multiaxial fatigue life for FCC and BCC metals under constant amplitude of strain cycling. Mater. Sci. Eng. A 2016, 656, 111–119. [Google Scholar] [CrossRef]
- Zhao, E.-N.; Qu, W.-L.; Zhou, Q. Multiaxial Fatigue Life Prediction of Metallic Materials Based on Critical Plane Damage Parameter. Huanan Ligong Daxue Xuebao J. South China Univ. Technol. Nat. Sci. 2017, 45, 130–136, 152. [Google Scholar]
- Qu, W.L.; Zhao, E.N.; Zhou, Q.; Pi, Y.-L. Multiaxial low-cycle fatigue life evaluation under different non-proportional loading paths. Fatigue Fract. Eng. Mater. Struct. 2018, 41, 1064–1076. [Google Scholar] [CrossRef]
- Zhao, B.F.; Xie, L.Y.; Bai, X.; Ren, J.G.; Li, H.Y.; Zhang, S.J. A multi-axial low-cycle fatigue life prediction model considering effects of additional hardening. Fatigue Fract. Eng. Mater. Struct. 2018, 41, 1488–1503. [Google Scholar] [CrossRef]
- Liu, J.; Zhang, Z.; Li, B.; Lang, S. Multiaxial Fatigue Life Prediction of GH4169 Alloy Based on the Critical Plane Method. Metals 2019, 9, 255. [Google Scholar] [CrossRef] [Green Version]
- Zhao, B.; Xie, L.; Song, J.; Zhao, Z.; Fan, F.; Xu, G. Prediction of multiaxial fatigue life for complex three-dimensional stress state considering effect of additional hardening. Fatigue Fract. Eng. Mater. Struct. 2019, 42, 2558–2578. [Google Scholar] [CrossRef]
- Bin, L.; Jianhui, L.; Xiuli, W. A new multiaxial fatigue life prediction model considering additional hardening effect. Adv. Mech. Eng. 2020, 12, 1–8. [Google Scholar] [CrossRef]
- Gan, L.; Wu, H.; Zhong, Z. Low-cycle fatigue life prediction for 316 l stainless steel using strain-based model. Jixie Qiangdu J. Mech. Strength 2020, 42, 313–318. [Google Scholar]
- Liu, J.; Lyu, X.; Wei, Y.; Cheng, J. Multiaxial Fatigue Life Prediction Considering Additional Hardening Effects and Mean Stains. Zhongguo Jixie Gongcheng China Mech. Eng. 2020, 31, 314–320. [Google Scholar]
- Liu, J.; Lv, X.; Wei, Y.; Pan, X.; Jin, Y.; Wang, Y. A novel model for low-cycle multiaxial fatigue life prediction based on the critical plane-damage parameter. Sci. Prog. 2020, 103, 1–8. [Google Scholar] [CrossRef] [PubMed]
- Zhao, B.; Xie, L.; Wang, L.; Hu, Z.; Zhou, S.; Bai, X. A new multiaxial fatigue life prediction model for aircraft aluminum alloy. Int. J. Fatigue 2021, 143, 105993. [Google Scholar] [CrossRef]
- Vantadori, S.; Carpinteri, A.; Fortese, G.; Ronchei, C.; Scorza, D.; Zanichelli, A. Fatigue lifetime evaluation of notched components: Implementation of the control volume concept in a strain-based LCF criterion. Theor. Appl. Fract. Mech. 2018, 97, 400–408. [Google Scholar] [CrossRef]
- Gallo, P.; Berto, F.; Lazzarin, P. High temperature fatigue tests of notched specimens made of titanium Grade. Theor. Appl. Fract. Mech. 2015, 76, 27–34. [Google Scholar] [CrossRef]
- Shunmugavel, M.; Polishetty, A.; Littlefair, G. Microstructure and Mechanical Properties of Wrought and Additive Manufactured Ti-6Al-4V Cylindrical Bars. Procedia Technol. 2015, 20, 231–236. [Google Scholar] [CrossRef] [Green Version]
- Gatto, M.; Groppo, R.; Bloise, N.; Fassina, L.; Visai, L.; Galati, M.; Iuliano, L.; Mengucci, P. Topological, Mechanical and Biological Properties of Ti6Al4V Scaffolds for Bone Tissue Regeneration Fabricated with Reused Powders via Electron Beam Melting. Materials 2021, 14, 224. [Google Scholar] [CrossRef]
- Hoppe, V.; Szymczyk-Ziółkowska, P.; Rusińska, M.; Dybała, B.; Poradowski, D.; Janeczek, M. Assessment of mechanical, chemical, and biological properties of Ti-Nb-Zr alloy for medical applications. Materials 2021, 14, 126. [Google Scholar]
- Piechowiak, D.; Miklaszewski, A.; Jurczyk, M. Low-Temperature Hydrothermal Treatment Surface Functionalization of the Ultrafine-Grained TiMo Alloys for Medical Applications. Materials 2020, 13, 5763. [Google Scholar] [CrossRef]
- Qi, H.-Y.; Zheng, X.-L.; Yang, X.-G. Low-cycle fatigue lifetime estimation of Ti–6Al–4V welded joints by a continuum damage mechanics model. Rare Met. 2015, 35, 299–302. [Google Scholar] [CrossRef]
- Eliaz, N.; Foucks, N.; Geva, D.; Oren, S.; Shriki, N.; Vaknin, D.; Fishman, D.; Levi, O. Comparative Quality Control of Titanium Alloy Ti–6Al–4V, 17–4 PH Stainless Steel, and Aluminum Alloy 4047 Either Manufactured or Repaired by Laser Engineered Net Shaping (LENS). Materials 2020, 13, 4171. [Google Scholar] [CrossRef] [PubMed]
- Shang, L.; Wu, Y.; Fang, Y.; Li, Y. High Temperature Mechanical Properties of a Vented Ti-6Al-4V Honeycomb Sandwich Panel. Materials 2020, 13, 3008. [Google Scholar] [CrossRef]
- Neikter, M.; Colliander, M.; Schwerz, C.D.A.; Hansson, T.; Åkerfeldt, P.; Pederson, R.; Antti, M.-L. Fatigue Crack Growth of Electron Beam Melted Ti-6Al-4V in High-Pressure Hydrogen. Materials 2020, 13, 1287. [Google Scholar] [CrossRef] [Green Version]
- Bong, H.J.; Kim, D.; Kwon, Y.-N.; Lee, J. Predicting hot deformation behaviors under multiaxial loading using the Gurson-Tvergaard-Needleman damage model for Ti–6Al–4V alloy sheets. Eur. J. Mech. A Solids 2021, 87, 104227. [Google Scholar] [CrossRef]
- Funch, C.V.; Palmas, A.; Somlo, K.; Valente, E.H.; Cheng, X.; Poulios, K.; Villa, M.; Somers, M.A.; Christiansen, T.L. Targeted heat treatment of additively manufactured Ti-6Al-4V for controlled formation of Bi-lamellar microstructures. J. Mater. Sci. Technol. 2021, 81, 67–76. [Google Scholar] [CrossRef]
- Geyer, M.; Vidal, V.; Pottier, T.; Boher, C.; Rézaï-Aria, F. Investigations on the material flow and the role of the resulting hooks on the mechanical behaviour of dissimilar friction stir welded Al2024-T3 to Ti-6Al-4V overlap joints. J. Mater. Process. Technol. 2021, 292, 117057. [Google Scholar] [CrossRef]
- Lucon, E.; Benzing, J.; Hrabe, N. Effect of Precrack Configuration and Lack-of-Fusion on the Elastic-Plastic Fracture Toughness of Additively Manufactured Ti-6Al-4V parts. Mater. Perform. Charact. 2020, 9, 701–713. [Google Scholar] [CrossRef]
- Ren, Y.; Lin, X.; Yang, H.; Tan, H.; Chen, J.; Jian, Z.; Li, J.; Huang, W. Microstructural features of Ti-6Al-4V manufactured via high power laser directed energy deposition under low-cycle fatigue. J. Mater. Sci. Technol. 2021, 83, 18–33. [Google Scholar] [CrossRef]
- Singh, A.K.; Kumar, A.; Narasimhan, K.; Singh, R. Understanding the deformation and fracture mechanisms in backward flow-forming process of Ti-6Al-4V alloy via a shear modified continuous damage model. J. Mater. Process. Technol. 2021, 292, 117060. [Google Scholar] [CrossRef]
- Sun, C.; Li, Y.; Xu, K.; Xu, B. Effects of intermittent loading time and stress ratio on dwell fatigue behavior of titanium alloy Ti-6Al-4V ELI used in deep-sea submersibles. J. Mater. Sci. Technol. 2021, 77, 223–236. [Google Scholar] [CrossRef]
- Yuan, B.; Liu, X.; Du, J.; Chen, Q.; Wan, Y.; Xiang, Y.; Tang, Y.; Zhang, X.; Huang, Z. Effects of hydrogenation temperature on room-temperature compressive properties of CMHT-treated Ti6Al4V alloy. J. Mater. Sci. Technol. 2021, 72, 132–143. [Google Scholar] [CrossRef]
- Baragetti, S. Notch corrosion fatigue behavior of Ti-6Al-4V. Materials 2014, 7, 4349–4366. [Google Scholar] [CrossRef] [PubMed] [Green Version]
- Yang, X.; Li, S.; Qi, H. Ti–6Al–4V welded joints via electron beam welding: Microstructure, fatigue properties, and fracture behavior. Mater. Sci. Eng. A 2014, 597, 225–231. [Google Scholar] [CrossRef]
- Liu, D.; Zhang, Y.; Luo, M.; Zhang, D. Investigation of Tool Wear and Chip Morphology in Dry Trochoidal Milling of Titanium Alloy Ti–6Al–4V. Materials 2019, 12, 1937. [Google Scholar] [CrossRef] [Green Version]
- Rajan, S.; Wanjara, P.; Gholipour, J.; Kabir, A.S. Joining of Dissimilar Alloys Ti-6Al-4V and Ti-6Al-2Sn-4Zr-2Mo-0.1Si Using Linear Friction Welding. Materials 2020, 13, 3664. [Google Scholar] [CrossRef] [PubMed]
- Wu, M.; Itoh, T.; Shimizu, Y.; Nakamura, H.; Takanashi, M. Low cycle fatigue life of Ti–6Al–4V alloy under non-proportional loading. Int. J. Fatigue 2012, 44, 14–20. [Google Scholar] [CrossRef]
- Oskouei, R.H.; Fallahnezhad, K.; Kuppusami, S. An Investigation on the Wear Resistance and Fatigue Behaviour of Ti-6Al-4V Notched Members Coated with Hydroxyapatite Coatings. Materials 2016, 9, 111. [Google Scholar] [CrossRef] [Green Version]
- De Castro, M.C.B.; Couto, A.A.; Almeida, G.F.C.; Massi, M.; De Lima, N.B.; Sobrinho, A.D.S.; Castagnet, M.; Xavier, G.L.; Oliveira, R.R. The Effect of Plasma Nitriding on the Fatigue Behavior of the Ti-6Al-4V Alloy. Materials 2019, 12, 520. [Google Scholar] [CrossRef] [PubMed] [Green Version]
- ASME Code Case N-47. Case of ASME Boiler and Pressure Vessel Code, Case N-47, Class 1, Section 3, Division 1; ASME: Washington, DC, USA, 1978.
- Araújo, J.; Dantas, A.; Castro, F.; Mamiya, E.; Ferreira, J. On the characterization of the critical plane with a simple and fast alternative measure of the shear stress amplitude in multiaxial fatigue. Int. J. Fatigue 2011, 33, 1092–1100. [Google Scholar] [CrossRef]
- Dowling, N.E. Mechanical Behavior of Materials: Engineering Methods for Deformation, Fracture, and Fatigue; Prentice Hall: Englewood Cliffs, NJ, USA, 1993. [Google Scholar]
- Lin, J.; Li, W.; Yang, S.; Zhang, J. Vibration Fatigue Damage Accumulation of Ti–6Al–4V under Constant and Sequenced Variable Loading Conditions. Metals 2018, 8, 296. [Google Scholar] [CrossRef] [Green Version]
- Fatemi, A.; Socie, D.F. A critical plane approach to multiaxial fatigue damage including out-of-phase loading. Fatigue Fract. Eng. Mater. Struct. 1988, 11, 149–165. [Google Scholar] [CrossRef]
- Smith, R.N.; Watson, P.; Topper, T.H. A stress–strain parameter for the fatigue of metals. J. Mater. 1970, 5, 767–778. [Google Scholar]
Figure 1.
Specimens employed for (a) axial fatigue tests and (b) torsional and combined axial/torsional tests. The material microstructure is also reported: alpha grains (light) with intergranular beta phase (dark).
Figure 1.
Specimens employed for (a) axial fatigue tests and (b) torsional and combined axial/torsional tests. The material microstructure is also reported: alpha grains (light) with intergranular beta phase (dark).

Figure 2.
Uniaxial experimental results and Manson–Coffin curves under (a) tension and (b) torsion.

Figure 3.
TC4 titanium alloy experimental and estimated lifetime obtained by the reduced strain range method for non-proportional tests with a phase shift, , equal to: (a) 45° (Nos. T7–T12, in Table 2) and (b) 90° (Nos. T13–T18, in Table 2).

Figure 4.
Influence of the phase shift on the reduced strain range [3,4,5] for the loading conditions: (a) Nos. 7–12 and (b) Nos. 13–18, in Table 2.

Figure 5.
Influence of the phase shift on fatigue life estimation using the Borodii et al. method [3,4,5] for the loading conditions: (a) Nos. 7–12 and (b) Nos. 13–18, in Table 2.

Figure 6.
Influence of the phase shift on both terms of the strain factor proposed by Borodii et al. [3,4,5] for the non-proportional loading conditions: (a) Nos. 7–12 and (b) Nos. 13–18, in Table 2.

Figure 7.
Flowchart of the RED criterion.

Figure 8.
Global, , and local, frames.

Figure 9.
Influence of the phase shift on both the 1st term of the strain factor (see Equation (16)) and for the non-proportional loading conditions: (a) Nos. 7–12 and (b) Nos. 13–18, in Table 2.
Figure 9.
Influence of the phase shift on both the 1st term of the strain factor (see Equation (16)) and for the non-proportional loading conditions: (a) Nos. 7–12 and (b) Nos. 13–18, in Table 2.

Figure 10.
Influence of the phase shift on the refined equivalent deformation amplitude for the loading conditions: (a) Nos. 7–12 and (b) Nos. 13–18, in Table 2.
Figure 10.
Influence of the phase shift on the refined equivalent deformation amplitude for the loading conditions: (a) Nos. 7–12 and (b) Nos. 13–18, in Table 2.

Figure 11.
Influence of the phase shift on fatigue life estimation using the refined equivalent deformation criterion for the loading conditions: (a) Nos. 7–12 and (b) Nos. 13–18, in Table 2.
Figure 11.
Influence of the phase shift on fatigue life estimation using the refined equivalent deformation criterion for the loading conditions: (a) Nos. 7–12 and (b) Nos. 13–18, in Table 2.

Figure 12.
Experimental and estimated lifetime of TC4 titanium alloy obtained using the refined equivalent deformation criterion for tests: (a) Nos. T1–T6, (b) Nos. T7–T12, and (c) Nos. T13–T18, in Table 2.
Figure 12.
Experimental and estimated lifetime of TC4 titanium alloy obtained using the refined equivalent deformation criterion for tests: (a) Nos. T1–T6, (b) Nos. T7–T12, and (c) Nos. T13–T18, in Table 2.

Figure 13.
Experimental and estimated lifetimes obtained for TC4 titanium alloy using the FS criterion [47] and the SWT criterion [48] for non-proportional tests with a phase shift, , equal to (a) 45° (Nos.T7–T12, in Table 2) and (b) 90° (Nos.T13–T18, in Table 2).


Table 1.
Chemical composition of TC4 titanium alloy (in wt %) [6].
Table 1.
Chemical composition of TC4 titanium alloy (in wt %) [6].
| Material | Al | V | Fe | C | N | H | O | Ti |
|---|---|---|---|---|---|---|---|---|
| TC4 | 6.4 | 4.1 | 0.2 | 0.01 | 0.01 | 0.002 | 0.16 | Balance |
Table 2.
Experimental results under multiaxial loading [6]. The values of , , , () for each strain path are reported.
Table 2.
Experimental results under multiaxial loading [6]. The values of , , , () for each strain path are reported.
| TEST No. | (%) | (%) | (°) | (Cycles) | (°) | (-) | (%) | (Cycles) |
|---|---|---|---|---|---|---|---|---|
| T1 | 0.345 | 0.648 | 0 | 47,195 | 45 | 0 | 1.018 | 84,402 |
| T2 | 0.427 | 0.710 | 0 | 20,611 | 45 | 0 | 1.184 | 43,305 |
| T3 | 0.576 | 0.938 | 0 | 4141 | 45 | 0 | 1.581 | 12,059 |
| T4 | 0.687 | 1.111 | 0 | 1795 | 45 | 0 | 1.880 | 5617 |
| T5 | 0.863 | 1.371 | 0 | 868 | 45 | 0 | 2.342 | 2127 |
| T6 | 1.391 | 2.038 | 0 | 351 | 45 | 0 | 3.644 | 302 |
| T7 | 0.391 | 0.643 | 45 | 20,953 | 43.143 | 0.412 | 0.996 | 8434 |
| T8 | 0.418 | 0.702 | 45 | 9478 | 43.744 | 0.414 | 1.076 | 5922 |
| T9 | 0.496 | 0.831 | 45 | 4898 | 43.675 | 0.414 | 1.275 | 2800 |
| T10 | 0.620 | 1.043 | 45 | 1563 | 43.792 | 0.414 | 1.597 | 1033 |
| T11 | 0.772 | 1.255 | 45 | 683 | 42.813 | 0.411 | 1.957 | 431 |
| T12 | 1.224 | 1.756 | 45 | 185 | 37.811 | 0.403 | 2.947 | 79 |
| T13 | 0.349 | 0.639 | 90 | 45,138 | 90.000 | 0.946 | 0.738 | 5434 |
| T14 | 0.418 | 0.704 | 90 | 37,273 | 0.000 | 0.972 | 0.836 | 10,102 |
| T15 | 0.499 | 0.821 | 90 | 11,152 | 0.000 | 0.950 | 0.998 | 4859 |
| T16 | 0.556 | 0.934 | 90 | 2332 | 0.000 | 0.970 | 1.112 | 2881 |
| T17 | 0.632 | 1.079 | 90 | 1017 | 0.000 | 0.986 | 1.264 | 1579 |
| T18 | 1.229 | 1.700 | 90 | 233 | 0.000 | 0.799 | 2.458 | 129 |
Publisher’s Note: MDPI stays neutral with regard to jurisdictional claims in published maps and institutional affiliations. |
© 2021 by the author. Licensee MDPI, Basel, Switzerland. This article is an open access article distributed under the terms and conditions of the Creative Commons Attribution (CC BY) license (https://creativecommons.org/licenses/by/4.0/).
Share and Cite
MDPI and ACS Style
Vantadori, S. A Novel Multiaxial Strain-Based Criterion Considering Additional Cyclic Hardening. Materials 2021, 14, 2542. https://0-doi-org.brum.beds.ac.uk/10.3390/ma14102542
AMA Style
Vantadori S. A Novel Multiaxial Strain-Based Criterion Considering Additional Cyclic Hardening. Materials. 2021; 14(10):2542. https://0-doi-org.brum.beds.ac.uk/10.3390/ma14102542
Chicago/Turabian StyleVantadori, Sabrina. 2021. "A Novel Multiaxial Strain-Based Criterion Considering Additional Cyclic Hardening" Materials 14, no. 10: 2542. https://0-doi-org.brum.beds.ac.uk/10.3390/ma14102542
Note that from the first issue of 2016, this journal uses article numbers instead of page numbers. See further details here.