
Multi-Scale Modeling of Microstructure Evolution during Multi-Pass Hot-Rolling and Cooling Process

1
Jiangsu Key Laboratory for Advanced Metallic Materials, School of Materials Science and Engineering, Southeast University, Nanjing 211189, China
2
A. O. Smith Corporation, Milwaukee, WI 53224, USA
*
Author to whom correspondence should be addressed.
Materials 2021, 14(11), 2947; https://0-doi-org.brum.beds.ac.uk/10.3390/ma14112947
Submission received: 7 April 2021
/
Revised: 17 May 2021
/
Accepted: 26 May 2021
/
Published: 29 May 2021
(This article belongs to the Special Issue Hot Deformation and Microstructure Evolution of Metallic Materials)
Abstract
:In this work, a 6-pass hot-rolling process followed by air cooling is studied by means of a coupled multi-scale simulation approach. The finite element method (FEM) is utilized to obtain macroscale thermomechanical parameters including temperature and strain rate. The microstructure evolution during the recrystallization and austenite (γ) to ferrite (α) transformation is simulated by a mesoscale cellular automaton (CA) model. The solute drag effect is included in the CA model to take into account the influence of manganese on the γ/α interface migration. The driving force for α-phase nucleation and growth also involves the contribution of the deformation stored energy inherited from hot-rolling. The simulation renders a clear visualization of the evolving grain structure during a multi-pass hot-rolling process. The variations of the nonuniform, deformation-stored energy field and carbon concentration field are also reproduced. A detailed analysis demonstrates how the parameters, including strain rate, grain size, temperature, and inter-pass time, influence the different mechanisms of recrystallization. Grain refinement induced by recrystallization and the γ→α phase transformation is also quantified. The simulated final α-fraction and the average α-grain size agree reasonably well with the experimental microstructure.
1. Introduction
Grain refinement is a critical objective of the thermomechanical processing of Advanced High Strength Steels (AHSS). During hot-rolling, grain refinement is achieved primarily by microstructure evolution during austenite (γ) recrystallization and following the austenite to ferrite (γ→α) transformation [1]. Therefore, the understanding of microstructure evolution during recrystallization and the γ→α phase transformation is crucial for optimizing the rolling processes and enhancing the properties of products. Based on the time period that recrystallization takes place, there are three recrystallization mechanisms: (1) dynamic recrystallization (DRX)—nucleation and growth of recrystallized grains under deformation; (2) metadynamic recrystallization (MDRX)—growth of DRX grains during the inter-pass period; (3) static recrystallization (SRX)—nucleation and growth of recrystallized grain during the inter-pass period.
Extensive experiments have been carried out to study the microstructures and properties of AHSS under various rolling parameters, such as strain rate [2,3,4] and deformation temperature [5,6,7]. Those experimental studies provided important information concerning the relationship between process variables and grain structures after rolling. As a result of inherent experimental difficulties, these studies cannot fully elucidate the physical mechanisms contributing to grain refinement, because one needs to consider the temporal evolution of the multi-pass processes of recrystallization and the γ→α transformation, in order to analyze the contributions of recrystallization quantitatively, including DRX, MDRX, SRX, and the γ→α phase transformation.
With the development of technologies in computer science, numerical simulation methods have popularized and become an important tool for understanding the mechanisms of microstructure formation during material processes due to their capabilities to present the visual, temporal evolution of microstructures. Among different numerical models, the cellular automata (CA) approach, combining both computational efficiency and simplicity [8], has been commonly applied to investigate various phenomena such as recrystallization [9,10,11,12,13,14,15,16,17,18,19,20,21,22], phase transformation [23,24,25,26,27,28,29,30,31], and grain coarsening [32,33].
Simulation studies on microstructure evolution during recrystallization for a single-pass process have been performed by utilizing a CA model [9,10,11] and combining the CA method with the finite element method (FEM) [12,13] or the crystal plasticity finite element method (CPFEM) [14,15,16]. Those studies investigated the mesoscale grain structural evolution as well as the macro- or meso-scale mechanical response. However, there are few simulation studies that focused on multi-pass hot deformation processes using a coupled FEM and CA approach. Barkóczy et al. [17] first simulated the 4-pass rolling process using a CA method, considering SRX and grain coarsening. Yet, the simulation was based on unrealistic material parameters and an unspecific deformation process. The mechanism of dislocation density evolution was also not reproduced. Zheng et al. [18] and Chen et al. [19] input actual material and technology parameters to simulate a 7-pass hot-rolling process and 4-stage hot compression process. The effect of hot deformation was coupled through the determination of deformation-stored energy variation and a topology deformation technique for reproducing the plastically deformed grain structure. Good agreement of average grain size was obtained among the results from the CA simulation, the in-house software of ROLLAN, and a Gleeble simulator. Nevertheless, the simplified assumptions of temperature variation and mechanical response in those studies were insufficient due to the multi-scale nature of hot deformation. Svyetlichnyy et al. [20,21] simulated multi-pass shape rolling processes using a coupled FEM and frontal cellular automata (FCA) method. The results can be used to predict the grain structure and kinetics of recrystallization. However, the above-mentioned studies only focused on recrystallization during multi-pass hot deformation. Svyetlichnyy et al. [22] used a combined FEM and FCA model to simulate recrystallization during 3-pass shape rolling and a subsequent phase transformation during cooling. Nevertheless, an arbitrary α/γ grain boundary migration rate was used for phase transformation. The simulated microstructure was not validated by an experiment.
For the γ→α phase transformation in Fe-C-Mn alloys, the growth kinetics have been usually described by carbon diffusion and interface reaction based on the paraequilibrium condition, where only the interstitials are allowed to partition and reach the equality of chemical potentials between the α- and γ-phases, while the substitutional elements are not [34]. Several numerical simulation studies focused on the α-γ phase transformation during isothermal annealing [23,24], continuous cooling [25,26], continuous heating [27,28], and an entire anneal cycle [29,30,31] under the assumption of paraequilibrium. To account for the interaction of substitutional elements at the moving α/γ interface, Purdy et al. [35] proposed a solute drag model, where the Gibbs energy dissipation due to the trans-interface diffusion of the substitutional solute was introduced. An et al. [29] first coupled a solute drag model with a CA model to simulate the α-γ transformation in a dual-phase steel during different heat treatment processes. The simulation results agree well with those from phase field predictions, atom-probe tomography analyses, and SEM micrographs. However, a CA model incorporated with the solute drag effect for the simulation of the γ-α phase transformation has not been applied to the hot-rolling process.
As described above, at present, quantitative multi-scale simulation studies on both recrystallization and the γ→α phase transformation during a multi-pass hot-rolling process are still limited. In this article, a coupled macroscopic FEM and mesoscopic CA model is proposed to investigate the recrystallization and γ→α phase transformation during a 6-pass hot-rolling and continuous cooling process for an Fe-C-Mn steel. FEM is used to obtain the macroscopic thermomechanical data for CA simulations. The solute drag model is embedded in the CA approach to take into account the effect arising from the redistribution of manganese atoms at the α/γ interface. The evolution of the microstructure, dislocation density, and carbon concentration field during a specific multi-pass hot-rolling process is displayed. The effects of thermomechanical parameters on the recrystallization are discussed in detail.
2. Experiments and FEM Simulation
The steel with the composition Fe-0.07C-1.2Mn-0.5Si-0.052P-0.01S (wt.%) was hot-rolled using a large-scale laboratory hot-rolling mill with 1500 mm diameter work rolls. Before hot-rolling, the slabs were reheated to 1150 °C for 2 h. Then, the slab was deformed by a 6-pass hot-rolling process following by air cooling at a cooling rate of ~4 °C s−1 to room temperature. The rolling temperature at the start of each deformation pass, i.e., the initial rolling temperature, and the temperature at the end of the sixth pass are measured using a high-temperature handheld infrared thermometer (Table 1). The accuracy of the thermometer is about 1% of reading, and the max resolution is about 1 °C. The finishing rolling temperature after the sixth pass measured in the experiment is ~880 °C. The rolling process parameters are also presented in Table 1. The true strain in Table 1 is the plastic strain along the loading direction.
The FEM simulation of the continuous rolling process is conducted using the commercial software DEFORM-3D (v11.0.2, Scientific Forming Technologies Corporation, Columbus, United States). Process parameters and geometric models used for FEM simulation are the same as those in experiments (Table 1). The material file selected for the slab is modified based on tensile tests and thermomechanical analysis experiments. The outset of each deformation, also the end of each previous inter-pass, is determined as the time when the simulated temperature at the center of the slab’s upper surface is identical to the experimentally measured initial rolling temperature. The FEM simulation is finished when the simulated temperature at the center of slab upper surface equals the finishing rolling temperature of the sixth pass. Other thermophysical parameters are taken as follows. The convective heat transfer coefficient between the slab and air is 0.045 kW/m2⋅°C. The heat transfer coefficient between the slab and rolls is 9.5 kW/m2⋅°C. The coefficient of shear friction is 0.7.
3. Governing Equations and Numerical Methods of the CA Model
3.1. Model Description
A 2D mesoscopic CA model is proposed to simulate γ-recrystallization and the γ→α transformation during a 6-pass hot-rolling and subsequent air-cooling process. Recrystallization occurs during the 6-pass hot-rolling and continues until the temperature cools down to the transformation start temperature. The γ→α phase transformation takes place during the air-cooling process after 6-pass rolling.
The CA model of recrystallization simulation is divided into two parts. One part is for calculating the variation of dislocation density due to work hardening, recovery, and recrystallization. The other is for simulating the evolution of the plastically deformed microstructure under three recrystallization mechanisms, namely DRX, MDRX, and SRX, using the approach previously applied by Zheng et al. [18]. During the deformation period, the nucleation and growth of DRX grains occur. During the inter-pass interval, the growth of DRX grain, i.e., MDRX, as well as the nucleation and growth of SRX grains, takes place. A uniform topology mapping technique [36] is utilized to simulate the grain deformation structure. The strain rate and temperature fields are taken as homogeneous in the CA calculation domain, since the whole CA domain is within one element of FEM. The distribution of deformation energy within a grain is considered to be nonuniform with respect to the distance of a cell from a grain boundary.
The CA simulation for the γ→α phase transformation includes α-phase nucleation, α-grain growth and coarsening, and carbon diffusion, which is performed based on a quantitative CA model proposed by An et al. [29]. The multi-component steel used in the experiment is reduced to a ternary Fe-0.323C-1.231Mn (mol.%) alloy for simplicity. The assumption of paraequilibrium is adopted, where the partition of the substitutional element manganese at the γ/α interface is neglected. The solute drag effect of the element manganese is incorporated, which reproduces the decrease in grain boundary mobility due to manganese diffusion inside the α/γ interface. Moreover, the driving force for α-phase nucleation and growth also involves the contribution of the deformation-stored energy inherited from hot-rolling. Both the initial microstructure and deformation-stored energy field for phase transformation simulation are taken from those by the CA simulation at the end of the 6-pass hot-rolling. All thermodynamic data are obtained from Thermo-calc (TCFE9 database). The cooling rate is set as 4 °C/s as the rate measured in the experiment. The transformation temperature range is set from 832 °C to 650 °C based on thermal dilatometer measurements and kinetic factors.
In the CA model, space is discretized into a finite number of cells. Each cell is characterized by several state variables: (1) grain index, I; (2) dislocation density, ρi,j; (3) average carbon concentration, xC; (4) α-phase volume fraction, φ (φ = 1 or 0 denotes the α- or γ-phase, respectively); (5) interface labels denote the recrystallized γ/unrecrystallized γ, γ/γ and α/α grain boundaries, and α/γ interfaces.
3.2. Austenite Recrystallization
3.2.1. Dislocation Density Evolution
During hot deformation, most of the energy (~99%) is released immediately as heat. The residual energy remains stored in the form of dislocations. This deformation-stored energy (per volume), Edef, can be calculated from the dislocation density, ρ, as follows [37]:
where β is a constant of the order of 0.5; μ is the shear modulus of the γ-phase, 50 × 109 Pa [23]; b is the magnitude of the Burgers vector, 2.48 × 10⁻¹⁰ m [23]. The relationship between the flow stress, σ, and the average dislocation density of the material, ρave, can be described as follows:
where α1 is a constant depending on the dislocation/dislocation interaction, and can be taken as 0.5. The Kocks–Mecking (KM) model [38] is applied to evaluate the variation in the dislocation density in each grain with respect to deformation strain using the following equation:
where k1 = 2θ0/(α1μb) is a constant representing work hardening; k2 = 2θ0/σs is the softening parameter representing dynamic recovery; θ0 is the initial work hardening rate; σs is the saturated stress, and it can be determined by Hatta’s model [39]:
where is the strain rate; A0, n’, a, and QA are the material constants and can be obtained from flow stress-strain curve; R is the gas constant, 8.314 J mol−1 K−1; T is the absolute temperature. During the inter-pass intervals, static recovery occurs mainly via dislocation climbing. The decrease in the dislocation density due to static recovery can be expressed by [40]:
where ρ0 is the initial dislocation density and is set as the common dislocation density for annealed metals, 1010 m−2 [41]; d is a temperature-dependent coefficient representing the static recovery rate. It can be calculated by [40]
where is the average γ-grain diameter; d0, md, and QSRV are constants. In addition to recovery, recrystallization also accounts for dynamic and static softening. The dislocation density decreases in cell (i, j) caused by a recrystallized grain growing into a deformed grain can be expressed as
where is the average dislocation density of the deformed grain; is the average dislocation density of the recrystallized grain; Δf is the recrystallization fraction in cell (i, j).
A simplified analytical model [42] is adopted to reproduce the heterogeneous distribution of deformation energy within grains. The stored energy in cell (i, j) belongs to grain S and can be expressed as
where HS,Max is the maximum value of the stored energy in grain S; L is the distance of the cell (i, j) from the grain boundary; f(L) is a factor decreasing from 1.0 to 0.2 in a length of 4.8 μm as L increases; n is the number of cells that belongs to grain S; is the average deformation stored energy of grain S, which can be calculated from Equations (1) and (2).
3.2.2. Nucleation of Austenite Recrystallization
The nucleation of recrystallization is assumed only to occur at austenite grain boundaries once the accumulation of dislocations reaches the critical dislocation density. Moreover, it is assumed to be a continuous nucleation event. During deformation, the nucleation rate per potential nucleation area for DRX as a function of both temperature T and strain rate is calculated by [43]
where C is the nucleation parameter, which can be estimated either by experiment or the inverse analysis method [44]. The value of C could be on the order of 1012–1022 [10,11,45]. In the present study, it is set to 7.2 × 10¹⁵ by comparing the simulation results with experimental data; QN is the activation energy for nucleation, 170 KJ mol−1 [23]; the exponent η is set to be 1 in the present simulation. The critical dislocation density ρc for DRX nucleation on grain boundaries is evaluated by [46]
where γb is high-angle grain boundary energy with a typical value of 0.56 J·m−2; l = 10.5 μb/σ is the dislocation mean free path [47]; τ = μb2/2 is the dislocation line energy; Mb is the high-angle grain boundary mobility, which can be expressed as [48]
where D0 is the boundary self-diffusion coefficient, 1.13 × 10⁻⁶ m2 s−1 [49]; Qb is the activation energy for grain-boundary motion, 140 KJ mol−1 [18]; k is Boltzmann constant. During the inter-pass intervals, the nucleation rate of SRX per unit area in the deformed matrix is considered to be related to the distribution of deformation-stored energy Edef and temperature T. It is given by using a phenomenological model as follows [42]:
where Z is a nucleation parameter 1.389 × 10¹⁰; Ec the critical stored energy for initiating SRX, which can be determined from the critical deformation strain as follows [50]:
where the critical strain ɛc generally ranges from 0.05 to 0.1 for different materials, and it can be taken as 0.1 for C-Mn steel [51].
3.2.3. Grain Growth and Coarsening
The velocity of grain boundary movement, V, can be generally expressed as
where P is the driving pressure for the specific process. For the recrystallization front moving into the deformed matrix, P is determined by the stored energy difference between the recrystallized grains and deformed matrix. For grain coarsening occurring at all grain boundaries, the driving force P is derived from curvature and is expressed as
where κ is the grain boundary curvature and calculated by [52]
where ∆x is the CA cell size; A = 1.28 is a coefficient; N = 24 is the number of the first- and second-nearest neighbors; NS is the number of cells within the neighborhood belonging to the grain S; Kink = 15 is the number of cells within the neighborhood belonging to grain S for a flat interface [52].
3.2.4. Uniform Topology Deformation
For the present 2D model, the 2 × 2 uniform deformation matrix M is utilized to represent deformation. The transformation matrix M alters the original vector u to a new vector v. It can be written as v = Mu, or
where ui (i = x, y) and vi (i = x, y) are the components of the original vector u, and the new vector v; li (i = x, y) is equal to the ratios of the final to initial lengths of vectors along two principal axes. The volume is assumed to be consistent during deformation, which means that lxly = 1. Therefore, the true strain along the two principal axes of deformation can be written as
3.3. Austenite to Ferrite Transformation
3.3.1. Ferrite Nucleation
During the cooling process after 6-pass hot-rolling, ferrite nucleates preferentially on the deformed γ-phase and γ-grain boundaries. The stored energy provides the additional driving force for ferrite nucleation. The classical nucleation theory is adopted to describe the nucleation rate of ferrite per unit in the potential nucleation area [53]:
where K1 is a constant related to the density of nucleation sites, and is taken as 2.48 × 10¹⁰ J1/2 m−4 in the present work; K2 is a constant related to all the interfaces involved in nucleation, 2.5 × 10⁻¹⁸ J3 mol−2 [54], which relates to the shape of the nucleus and interfacial energy; is the carbon diffusion coefficient in austenite; ΔGV is the driving force for ferrite nucleation. It consists of both the chemical driving force, ΔGV,che, and the deformation stored energy, Edef:
where Vm is molar volume of austenite, 7.18 × 10⁻⁶ m3 mol−1 [18]. ΔGV,che is determined by the Gibbs chemical-free energy difference between the α- and γ-phases.
3.3.2. Ferrite Growth and Coarsening
A mixed-mode growth model is adopted to describe the γ→α transformation, where the kinetics of ferrite growth are controlled by both carbon diffusion and α/γ interface mobility. The migration velocity of the α/γ interface Vα/γ is calculated by
where Pα/γ is the effective driving pressure; Mα/γ is the interfacial mobility of the moving α/γ interface, which can be described as [55]
where is the pre-exponential factor dependent on composition and processing history. It is adjustable and ranges from 1 × 10⁻⁴ to 0.5 mol m J−1 s−1 [29]. In the present study, is readjusted as 0.085 mol m J−1 s−1 based on the value estimated by Fazeli et al. [56] and by fitting the simulation results with the experimental micrograph; Qα/γ is the activation energy for atom motion at the interface, 140 KJ mol−1; The effective driving pressure, Pα/γ, involving the chemical driving pressure of the γ→α transformation, ΔGche, the solute drag pressure ΔGdis, and the deformation stored energy Edef. Pα/γ is given by
where ΔGdis is the dissipated Gibbs energy due to the solute drag effect, Section 3.3.3. ΔGche can be calculated from
where χ is a proportionality factor; is the equilibrium carbon concentration of the γ-phase, which can be obtained from thermodynamic calculation; is the actual carbon concentration of the γ-phase at the α/γ interface, which is obtained from the solute transport calculation, Section 3.3.4. To eliminate the artificial anisotropy that originated from the square CA cell, a geometrical factor gnew is introduced. It is related to the states of the neighboring cells and is defined by [29]
where SI and SII indicate the states of the nearest neighbor cells and the second-nearest neighbor cells, respectively; φ is the α-phase volume fraction of the neighboring cells. Thus, the increment of the α-phase fraction during γ→α transformation is expressed as
where Δt is the time step. To reflect the higher kinetics of phase transformation along grain boundaries, the interfacial velocity along the γ/γ grain boundaries is assumed to be 2.5 times faster than that in other directions during cooling.
The α-grain coarsening is driven by curvature and can be found in Section 3.2.3.
3.3.3. Solute Drag Model
The segregation of manganese at the α/γ interface would exert a solute drag pressure on the interface. A dissipated Gibbs energy, ΔGdis, is introduced to consider the velocity reduction of the grain boundary resulting from the solute drag effect. ΔGdis can be calculated from the redistribution of manganese in the interfacial region, which is evaluated by [35]
where 2Λ is the physical interface thickness taken as 1 nm [57]; is the manganese concentration in the bulk matrix; xMn(y) is the manganese concentration profile across the interface; E(y) is the interaction potential of manganese with the interface; y is the distance from the interface. E(y) can be expressed as [35]
where 2ΔE is the potential difference in manganese between ferrite and austenite, which can be obtained from the thermodynamic calculation; E0 is the binding energy, i.e., the minimum in potential profile. It can be taken as J mol−1 [31]. xMn(y) is given by [35]
where = 1.42 × 10⁻¹⁰exp(−132000/RT) m2 s−1 is the diffusivity of solute manganese across the α/γ interface [56].
3.3.4. Carbon Diffusion
Carbon partition and diffusion are governed by
where ; is the equilibrium partitioning coefficient; is the carbon diffusion coefficient associated with the α-phase volume fraction, where , are the temperature-dependent carbon diffusivities in the α- and γ-phases, respectively. They can be estimated by m2 s−1 and m2 s−1 [58]. Equation (30) is solved using the explicit finite difference scheme. The time step is determined by . The zero-flux boundary condition is applied at the four walls of the calculation domain.
3.4. Coupling Scheme between CA and FEM Simulations
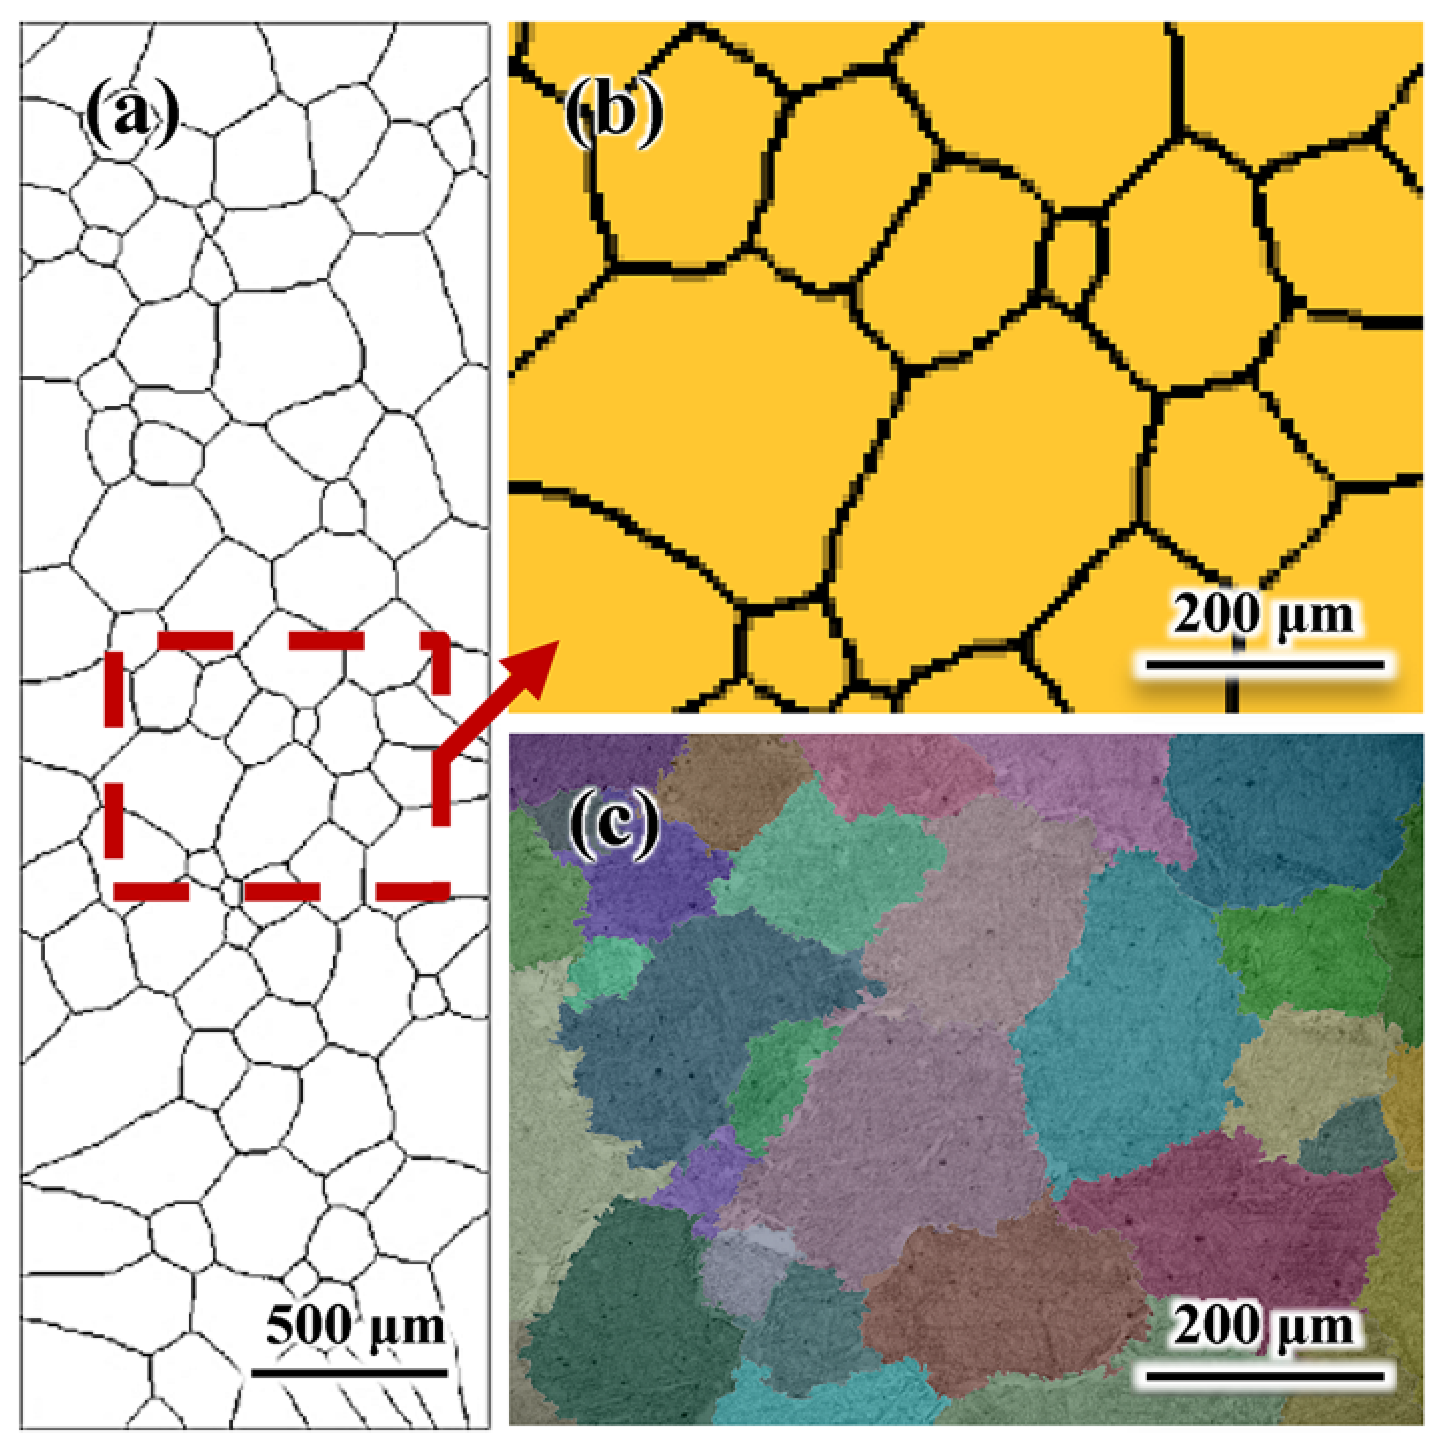
The initial grain structure for the CA simulation is generated through Voronoi tessellation according to the number and size of γ-grains measured from an experimental micrograph. The micrograph is obtained from a quenched sample after annealing at 1150 °C for 2 h. The initial microstructure for CA simulation, with an average grain size of ~174 μm, is generated based on the experimental microstructure (~179 μm), Figure 1. Similar grain sizes of the generated initial microstructure (~174 μm) and the experimental microstructure (~179 μm) are achieved, Figure 1. Macro-process parameters used in the CA simulation are obtained from the experiment and FEM simulations. The true strain for each pass in the CA simulation is identical to those in the hot-rolling experiment (Table 1). The temperature curve and the strain rate are obtained from the FEM simulation. The center element of the slab in the FEM calculation corresponds to the CA simulation domain. Moreover, the average effective strain rate of the center under deformation in FEM is taken for the CA simulation. Since the total reduction of the slab is extremely large (~94%), the calculation domain size reduces in each pass to improve the computational efficiency. Varying CA cell spacing is also required to accommodate the significantly changing average grain size in each pass. The domain size at the start of each deformation period and the CA cell spacing for each pass are listed in Table 2.
4. Results and Discussion
4.1. FEM Simulation of Hot-Rolling
First, FEM simulation using DEFORM-3D software is performed to obtain the average strain rate and the variations of the temperature field in the slab during the whole 6-pass hot-rolling process. Table 3 lists the simulated average effective strain rate, , under each deformation period, which is in accordance with the variation of the true strain given in Table 1.
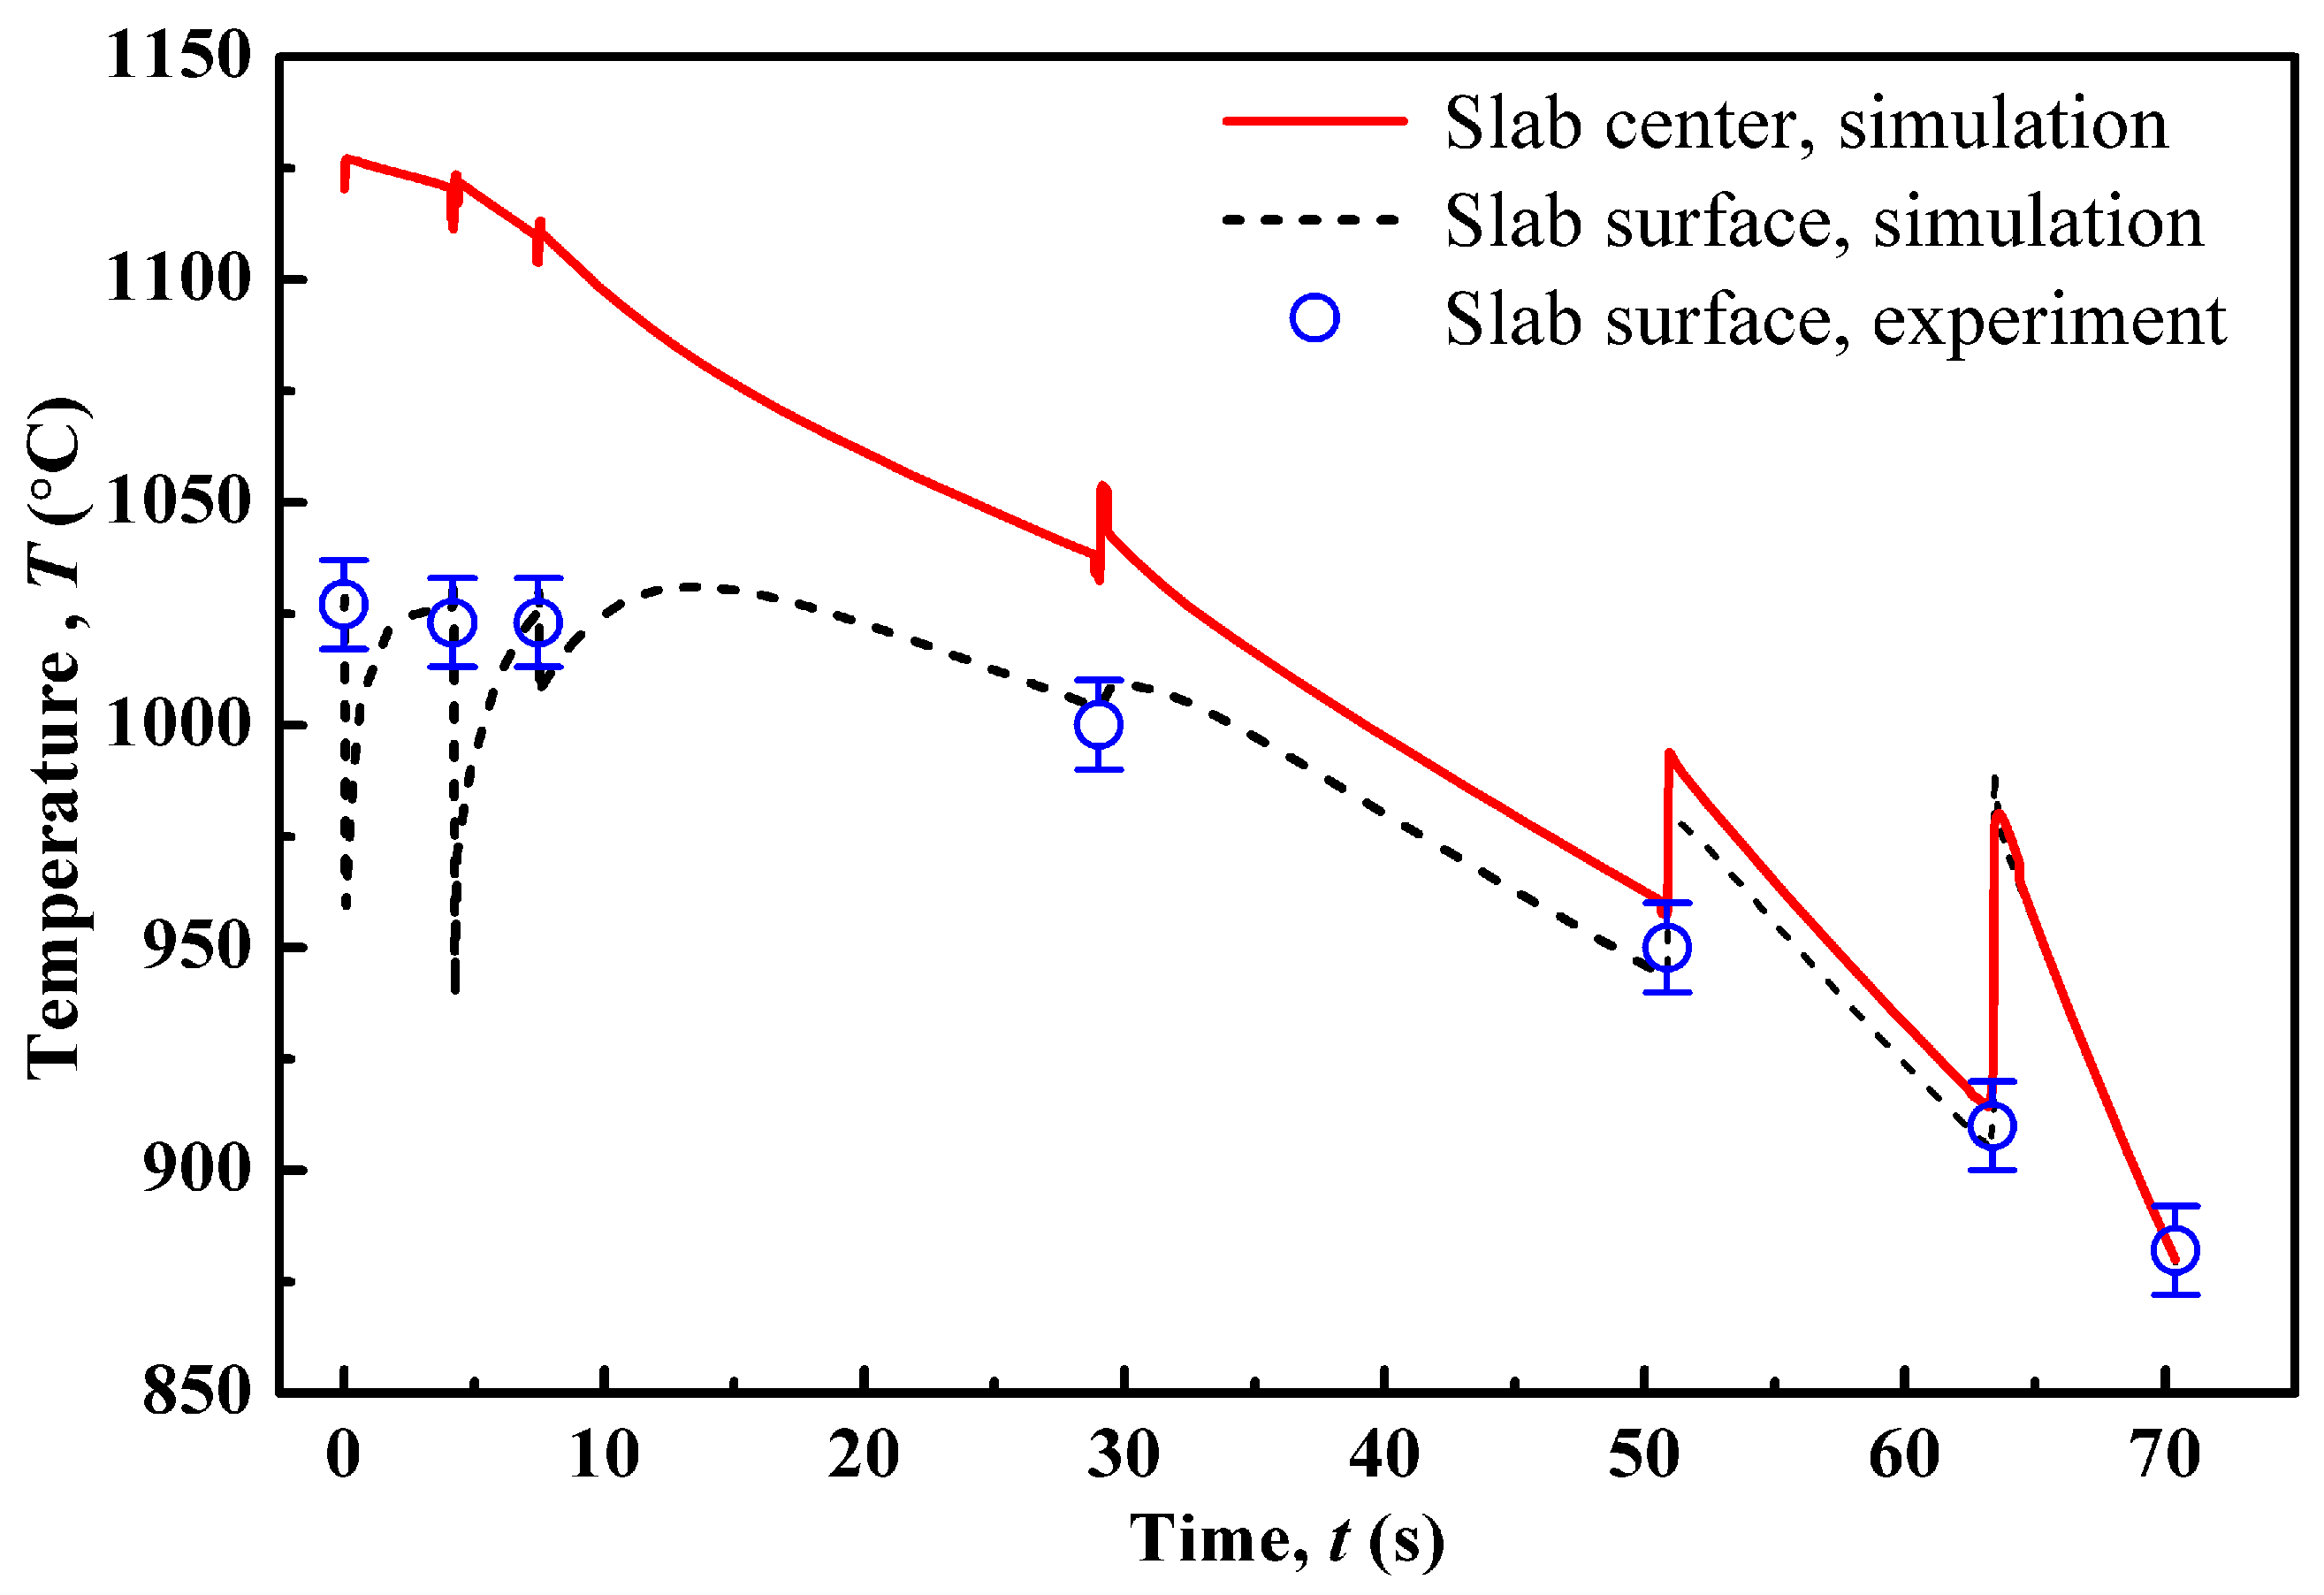
Figure 2 displays the simulated temperature curves at the slab center and surface. In the curves, the sudden temperature changes imply the start of each pass. As shown, the simulated temperature at the surface is lower than that in the slab center by ~20–200 °C during the first to fourth pass, while the two temperature curves become nearly superposed in the last two passes, due to the fact that the rolled steel sheet becomes thin. During the hot-rolling process, the slab/sheet temperature is elevated by the heat generated under deformation. Simultaneously, at the slab surface, the temperature falls mostly by heat convection owing to the contact of slab/air and slab/rollers, while at the slab center, the temperature drops as a result of heat transfer from the center to surface. The surface temperatures measured in the experiment are also plotted with the simulated curve for comparison. However, the handheld pyrometer used in the experiments cannot determine the complete information on the slab temperature field. Therefore, it is necessary to perform FEM simulations to obtain the temperature field inside the slab.
4.2. CA Simulation of the Hot-Rolling Process
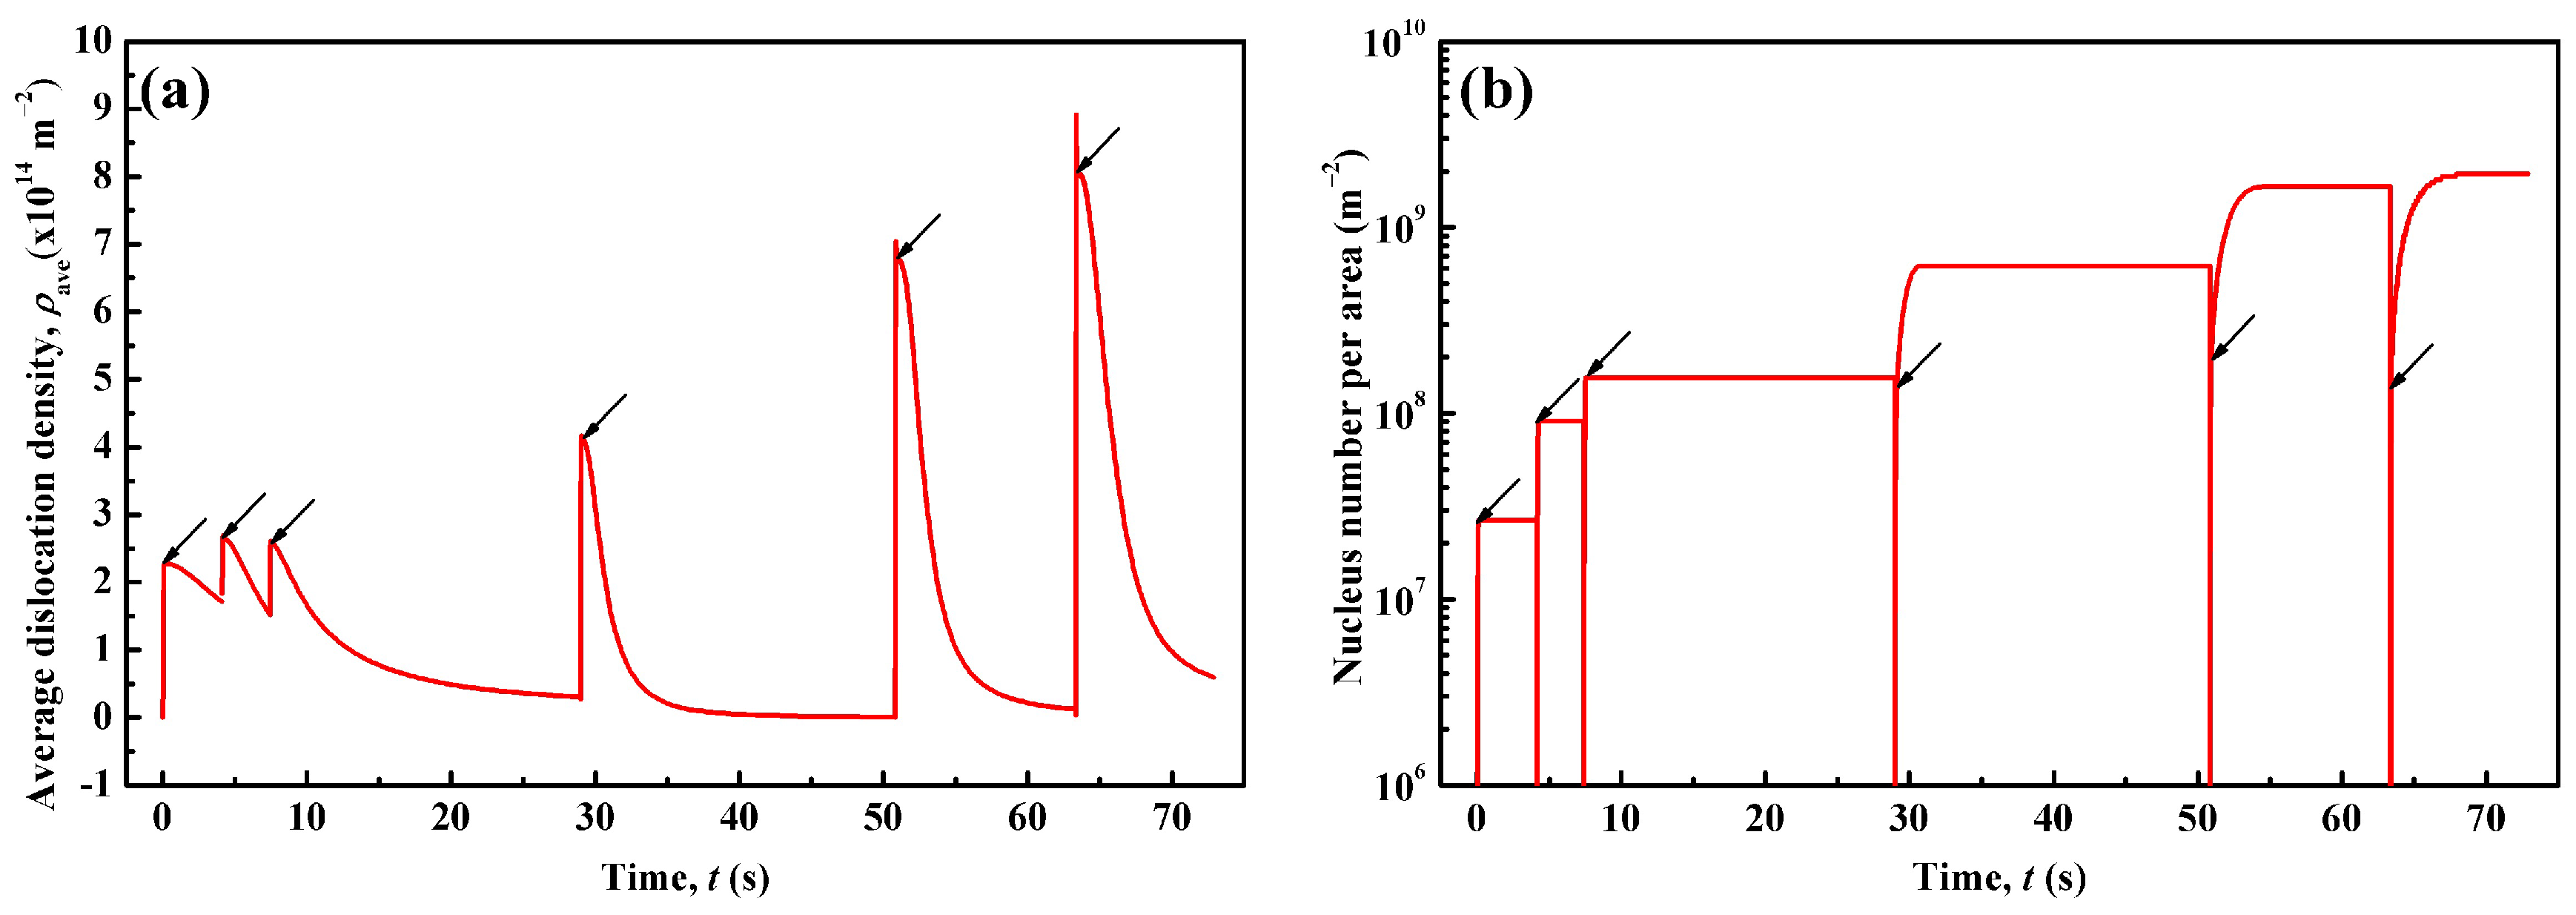
The CA model described in Section 3.2 and Section 3.3 is applied to simulate the evolution of dislocation density and grain structure during the 6-pass hot-rolling process. The FEM-simulated temperature and strain rate are incorporated in the CA simulations. Figure 3 plots the simulated average dislocation density, ρave, and the recrystallized nucleus density varying with time. Arrows in the curves indicate the end of each pass. As shown in Figure 3a, the dislocation density increases rapidly under deformation and reaches a peak value in each pass. Then, it declines in the following inter-pass interval. For the whole process, the ρave peak value shows an increasing trend with time except for the third pass. This corresponds to the strain rate with the pass number (Table 3), due to the fact that a higher strain rate enhances the dislocation density in the matrix. On the other hand, the ρave valley value, representing the value of the remaining dislocation density in each pass, declines until the fourth interval. Especially at the end of the first and the second intervals, ρave remains high (~1.5 × 10¹⁴ m−2) in the matrix and is inherited by the next pass. ρave is almost reduced to zero at the end of the fourth interval, and then rises slightly afterwards. In the end of sixth pass before cooling, ρave is in the order of 1013 m−2, which is in the range of typical values for hot-rolled C-Mn steels [59].
In Figure 3b, the recrystallized nucleus density refers to the newly recrystallized nuclei in each pass, and thus it is zero at the start of each pass. As seen in each pass, the nucleus density increases rapidly. The steady value of the recrystallized nucleus density increases with the pass number. It is noted that there are almost no new nuclei appearing during the first to third inter-pass intervals, implying that the recrystallized nuclei are nearly produced by DRX during the former three passes. However, during the fourth to sixth inter-pass intervals, the nuclei number is increased, which is apparently generated by the SRX mechanism. The proportion of SRX to DRX nuclei also increases with the pass number. As shown in Figure 3a, the peak value of average dislocation density, ρave, gradually increases during the fourth to sixth pass. Obviously, higher ρave in the fourth to sixth pass exceeds the critical value for SRX nucleation and leads to a larger recrystallization nucleation rate, Equations (12) and (13). Thus, it is understandable that SRX could happen and produce more nuclei in the latter three intervals. On the other hand, it is interesting to note that there is an increase in the DRX nucleus density from the first to third pass, although the variation of ρave is nearly the same in those passes. It is considered that the initial grain size could account for this phenomenon [60,61,62]. Finer primary grains could provide more grain boundary area as potential nucleation sites, leading to a higher nucleus density in the matrix.
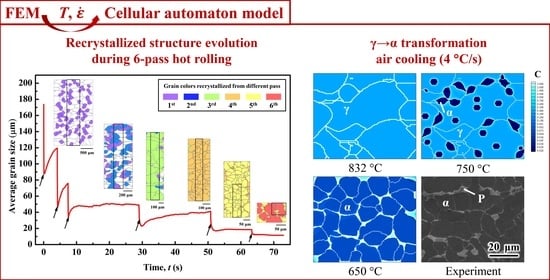
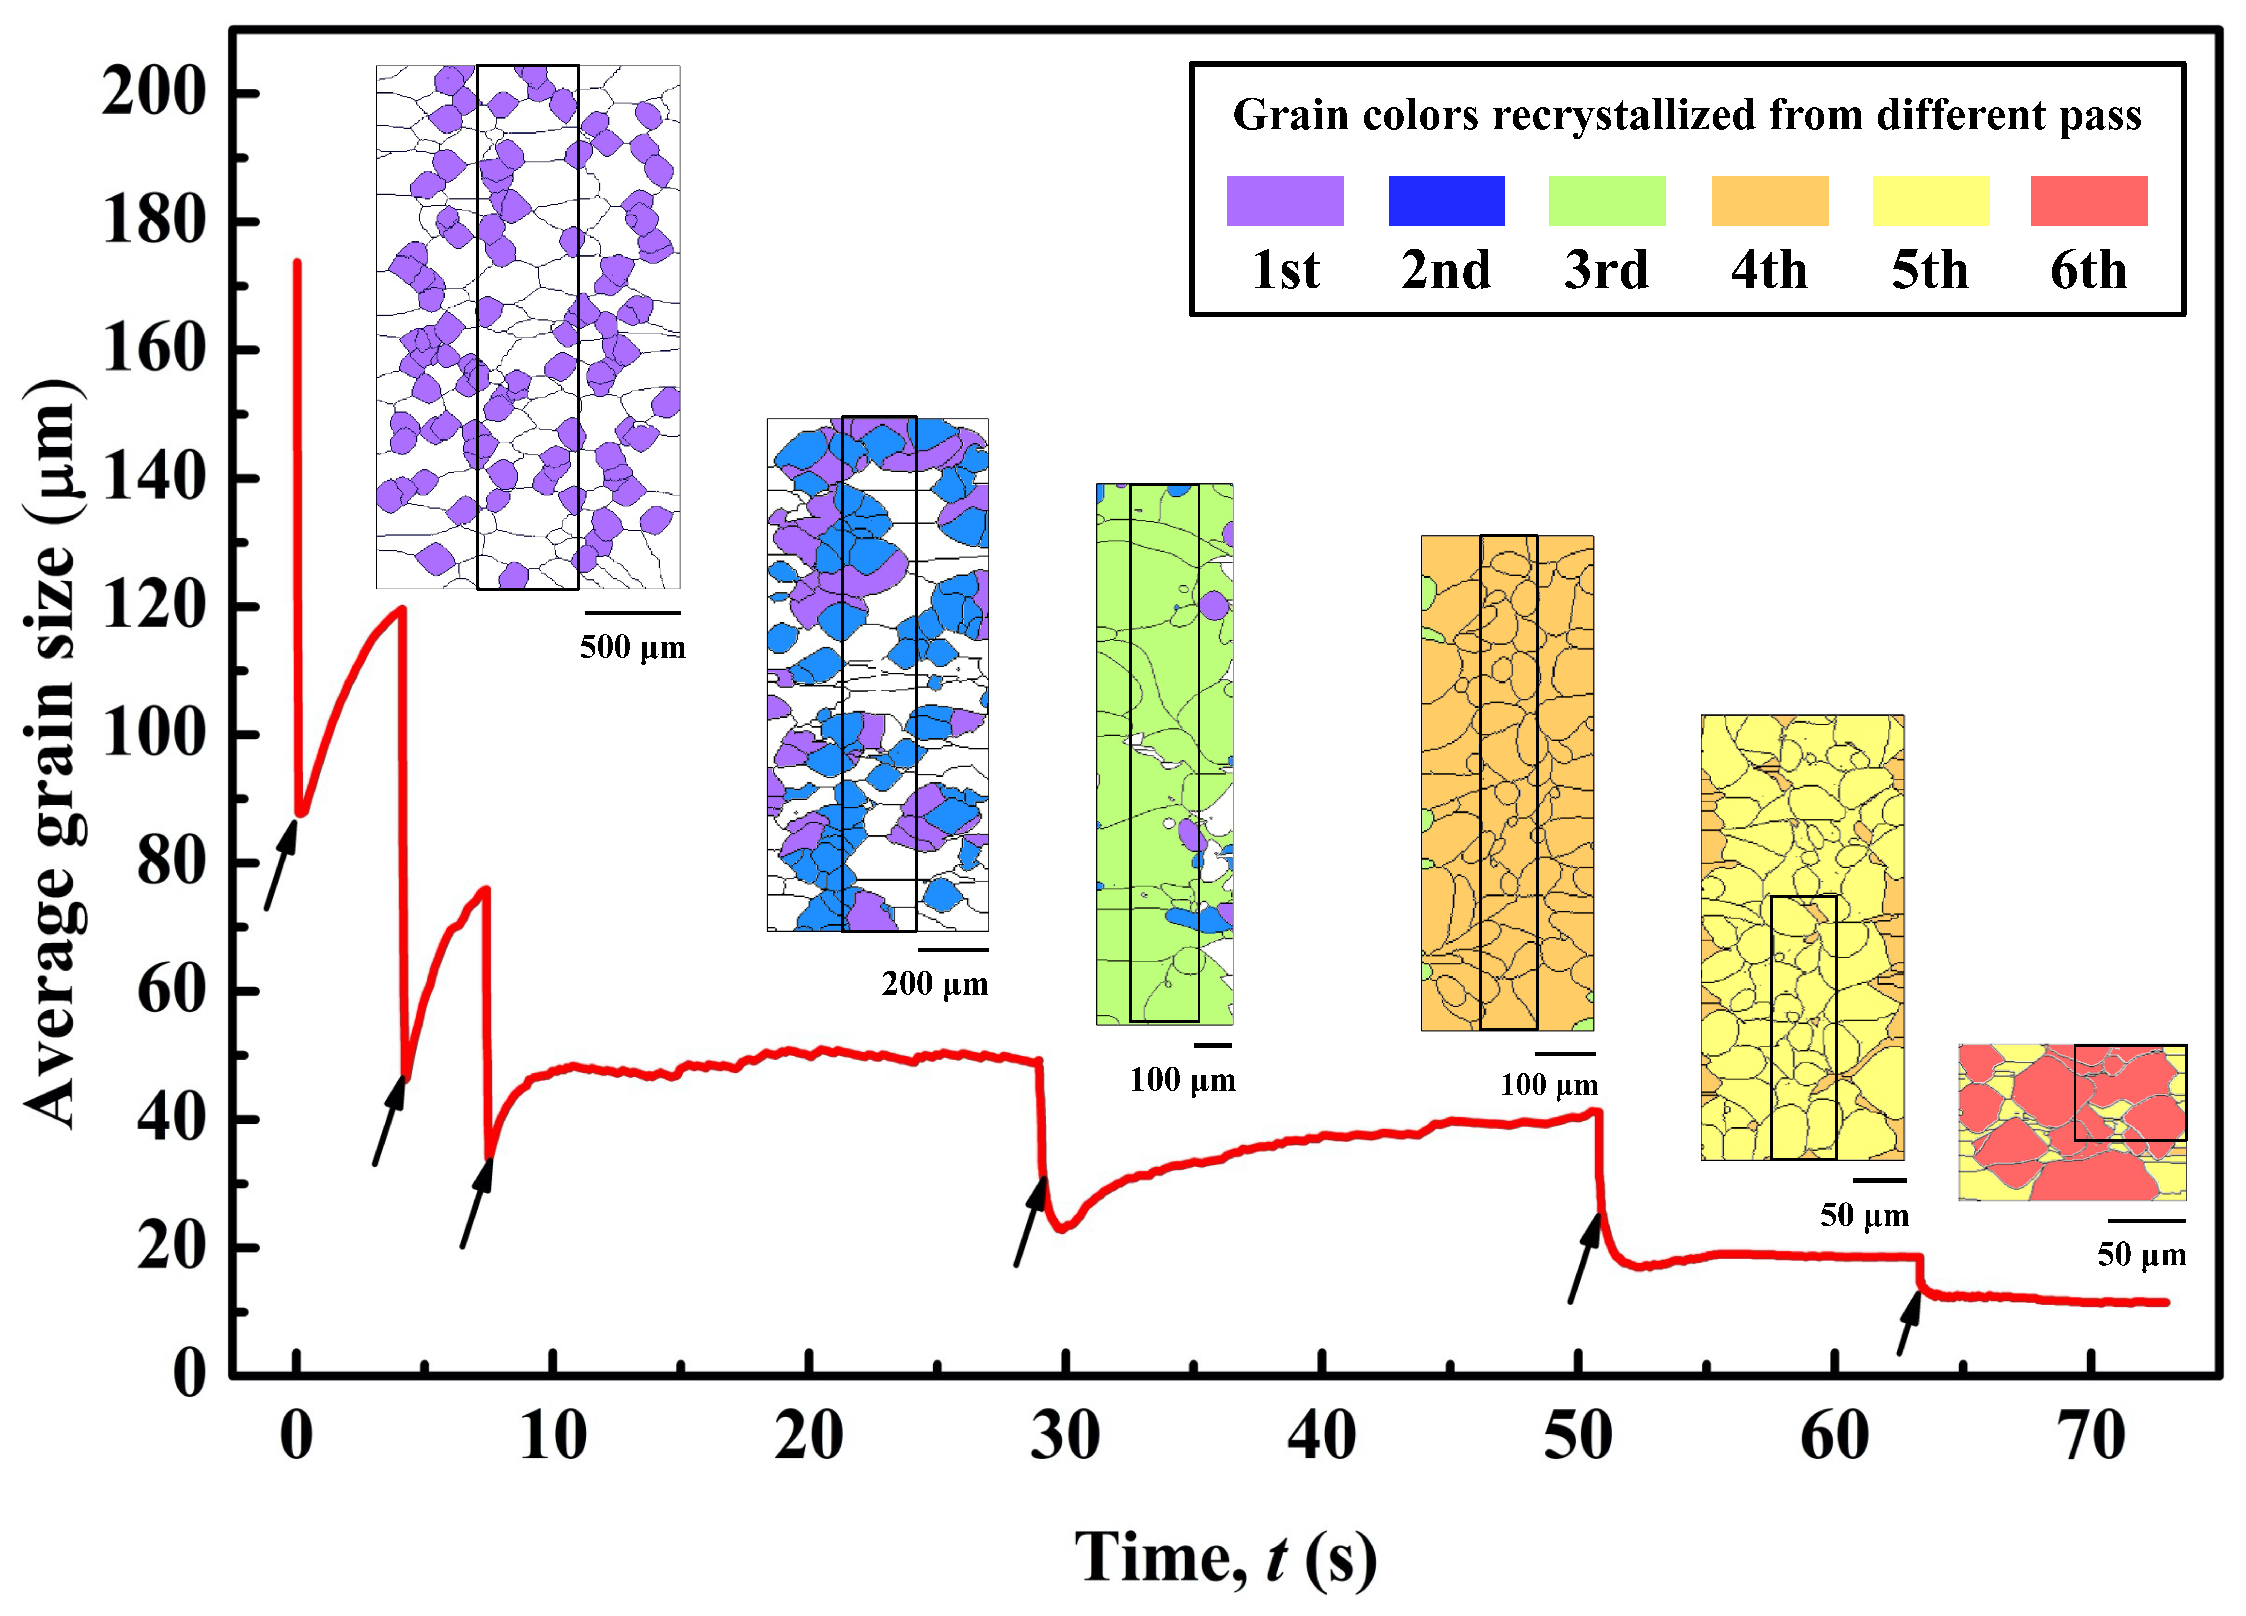
Figure 4 presents the CA-simulated variation of average grain size and the grain structures at the end of each interval during the 6-pass hot-rolling process. The equivalent grain diameter is calculated using
where Ng is the number of grains in the calculation domain; ASi is the area of grain Si. It is seen in Figure 4 that for the first to third pass and interval, the average γ-grain size first reduces rapidly under deformation and then, as indicated by the arrows, rises immediately after finishing deformation. However, during the latter three intervals, the grain size is still reduced after deformation. As analyzed above, during the former three passes, the recrystallized nucleus is generated primarily by the DRX mechanism, while in the latter three passes and intervals, both DRX and SRX occur. Thus, in each pass, the dramatic reduction in average grain size results from the rapid nucleation of DRX. During the fourth to sixth intervals, the continuous decrease in average grain size after deformation results from SRX nucleation. The increase in grain size during the inter-pass period is due to the growth and coarsening of recrystallized grains.
Table 4 lists the average grain size of each type of grain at the end of each interval. The matrix grain refers to the grain structure inherited from the previous pass; DRX grain, formed by DRX and MDRX mechanisms, and SRX grain refer to the newly recrystallized grains in each pass. As shown, γ-grains are gradually refined from the initial ~174 μm to ~12 μm at the end of the sixth interval. At the end of each interval, the average matrix grain size (), average DRX grain size (), and average SRX grain size () are smaller than the average γ-grain size () of the previous pass, which results in the refinement of the overall γ-grains. Each type of grain is also refined step by step except that increases at the end of the third interval. At the end of the first and second intervals, the limited inter-pass time and relatively low strain rate constrain the growth of DRX grains, i.e., MDRX mechanism, which leads to a smaller than . In the case of the third pass and interval, however, there is adequate inter-pass time for sufficient DRX grain structure development. Accordingly, the deformed matrix is greatly consumed. At the end of the third interval, is much larger than and , leading to a weakening of grain refinement and grain size uniformity. In the fourth to sixth pass, the strain rate is high enough (Table 3), and high stored energy accumulates in the matrix, which drives SRX grain growth. SRX grain growth would consume both DRX and matrix grains. At the end of the fourth to the sixth intervals, the average SRX grain size is largest. It is noted that, at the end of the sixth interval, no DRX grains remain, which means that DRX grain structure is totally replaced by SRX grains. The high strain rate in the sixth pass induces high stored energy remaining in the deformed matrix and DRX grains, and thus introduces a high difference in stored energy between SRX grains and other grain structures. The difference in stored energy provides a high driving force for SRX growing into matrix and DRX grains. Therefore, the SRX mechanism could take advantage of the high strain rate when competing with the MDRX mechanism.
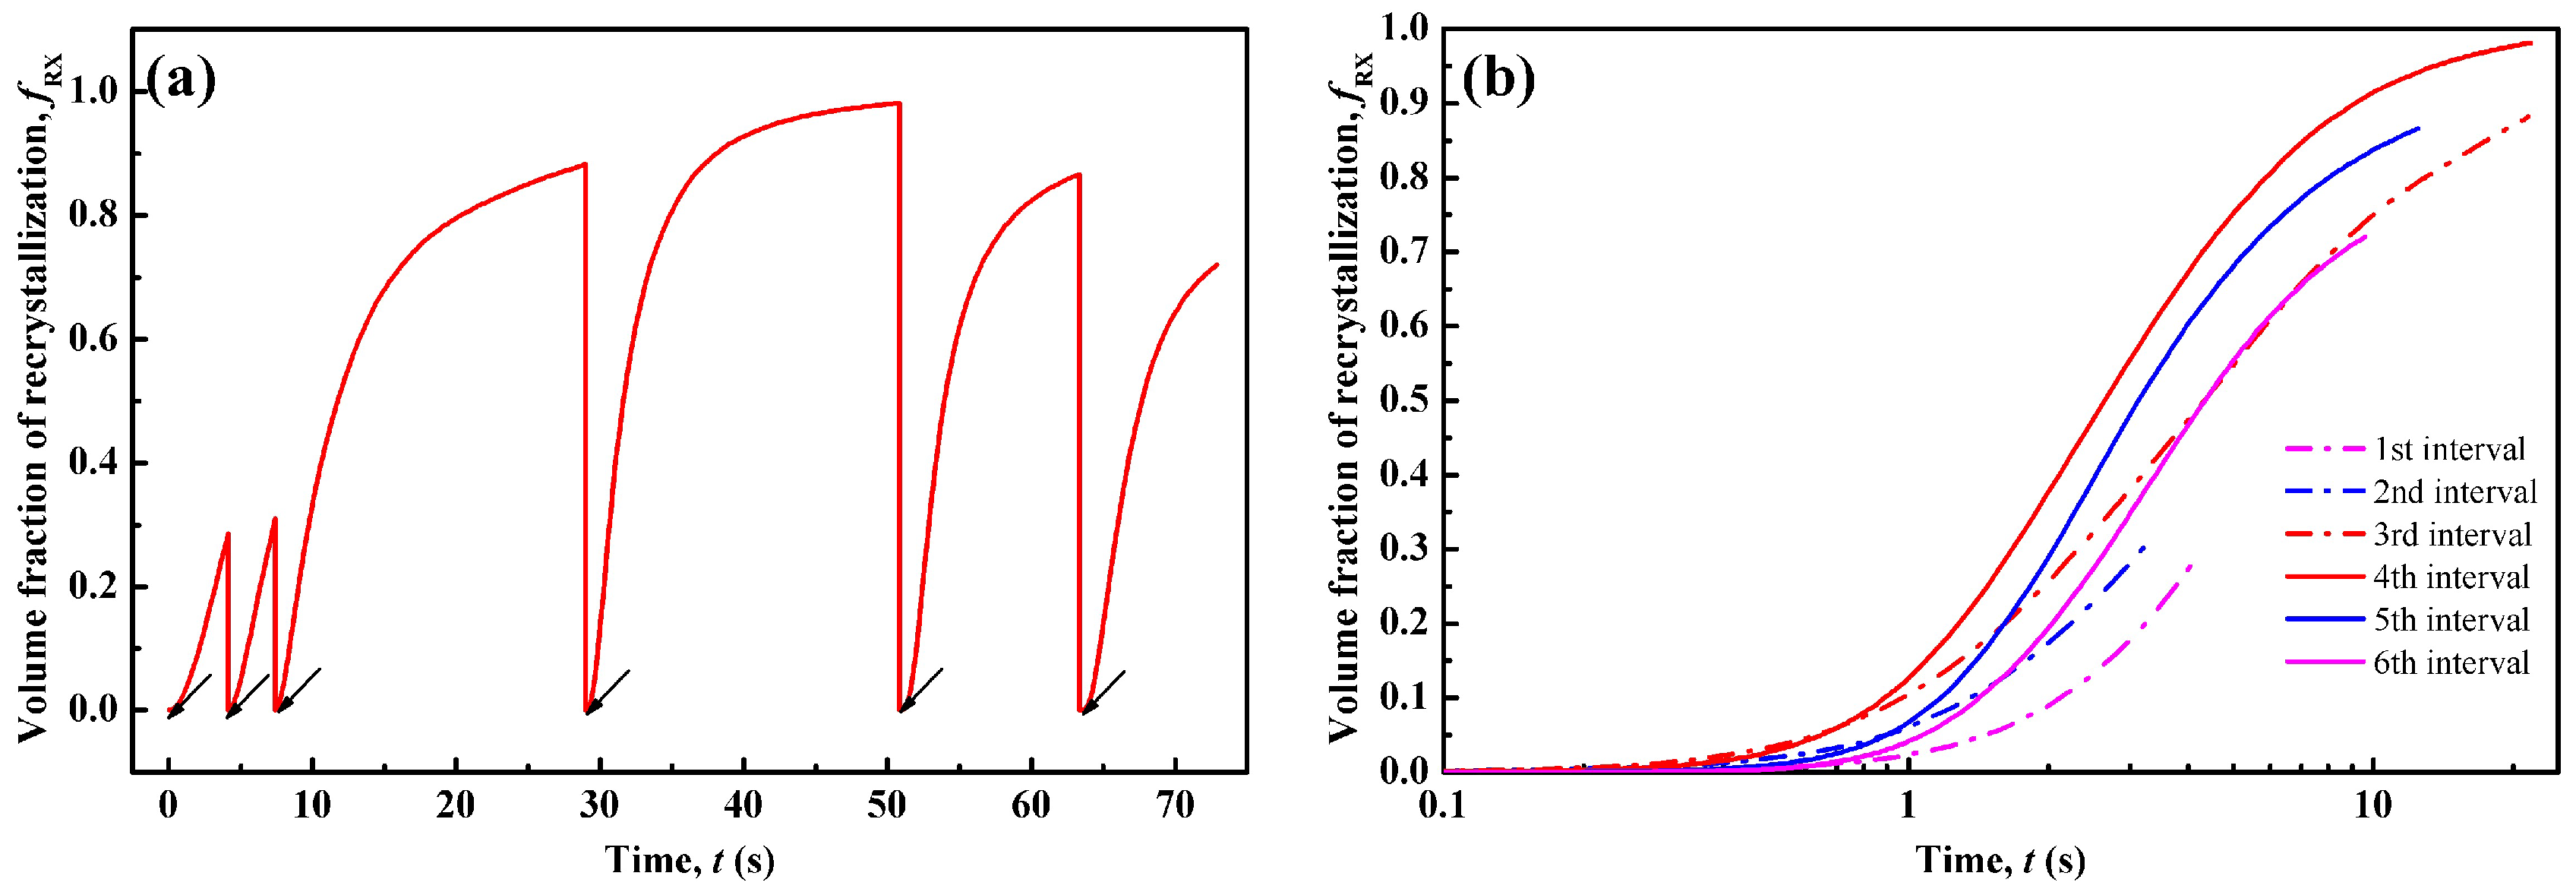
Figure 5 shows the recrystallization volume fraction, fRX, varying with time. In Figure 5a, fRX refers to the volume percentage of the newly recrystallized grains during each pass, and thus it is zero at the start of each pass. During the first to fourth intervals, fRX increases gradually and approaches a nearly saturated value of ~1.0 at the end of fourth interval. Then, fRX decreases in the fifth and sixth intervals. As indicated by the arrows, the fRX increment is not evident during the deformation period. The obvious fRX increase appears during the inter-pass period. This is because the deformation time is extremely short (~0.1 s), and thus the growth of DRX nuclei is quite limited during deformation. Rapid development of the recrystallized structure takes place during the inter-pass intervals. Therefore, MDRX and SRX are the controlling mechanisms for the recrystallized grain structure formation. As discussed, regarding Figure 3b and Figure 4, there is no SRX occurring during the first to third interval. Therefore, MDRX provides the main contribution for recrystallization during the former three intervals. For the latter three intervals, MDRX and SRX dominate concurrently.
Figure 5b compares the recrystallization kinetics of each inter-pass interval. It is seen that the kinetics of recrystallization accelerate gradually from the first to fourth pass. The kinetics curve of the fourth interval becomes the highest. However, from the fifth to the sixth interval, the kinetics are reduced. Numerous experiments found that recrystallization kinetics are influenced by various factors, including strain rate [3,4], temperature [7], initial grain size [60,61,62], as well as inter-pass time. It is obvious that a higher strain rate enhances recrystallization by introducing more dislocations and thus provides a higher nucleation rate and driving force for the growth of recrystallized grains. The increasing temperature also accelerates the kinetics by providing higher boundary mobility. The influence of initial grain size relates to the nucleation of both DRX and SRX. As shown in Figure 3b, the nuclei density increases gradually from the first to third pass, which is considered to result from gradually finer initial grain size. This leads to the acceleration in kinetics of MDRX in the former three passes. For the fourth interval, in addition to the effects of finer grains and increased strain rate, the SRX mechanism also contributes to the higher kinetics than in the third interval by generating more nuclei. Owing to the decreased temperature, the recrystallization kinetics of the last two intervals slow down, even though the strain rate is increased, and the grains are refined. Therefore, the recrystallization fraction in the fourth interval is the highest under the comprehensive effect of initial grain size, strain rate, temperature, as well as inter-pass time.
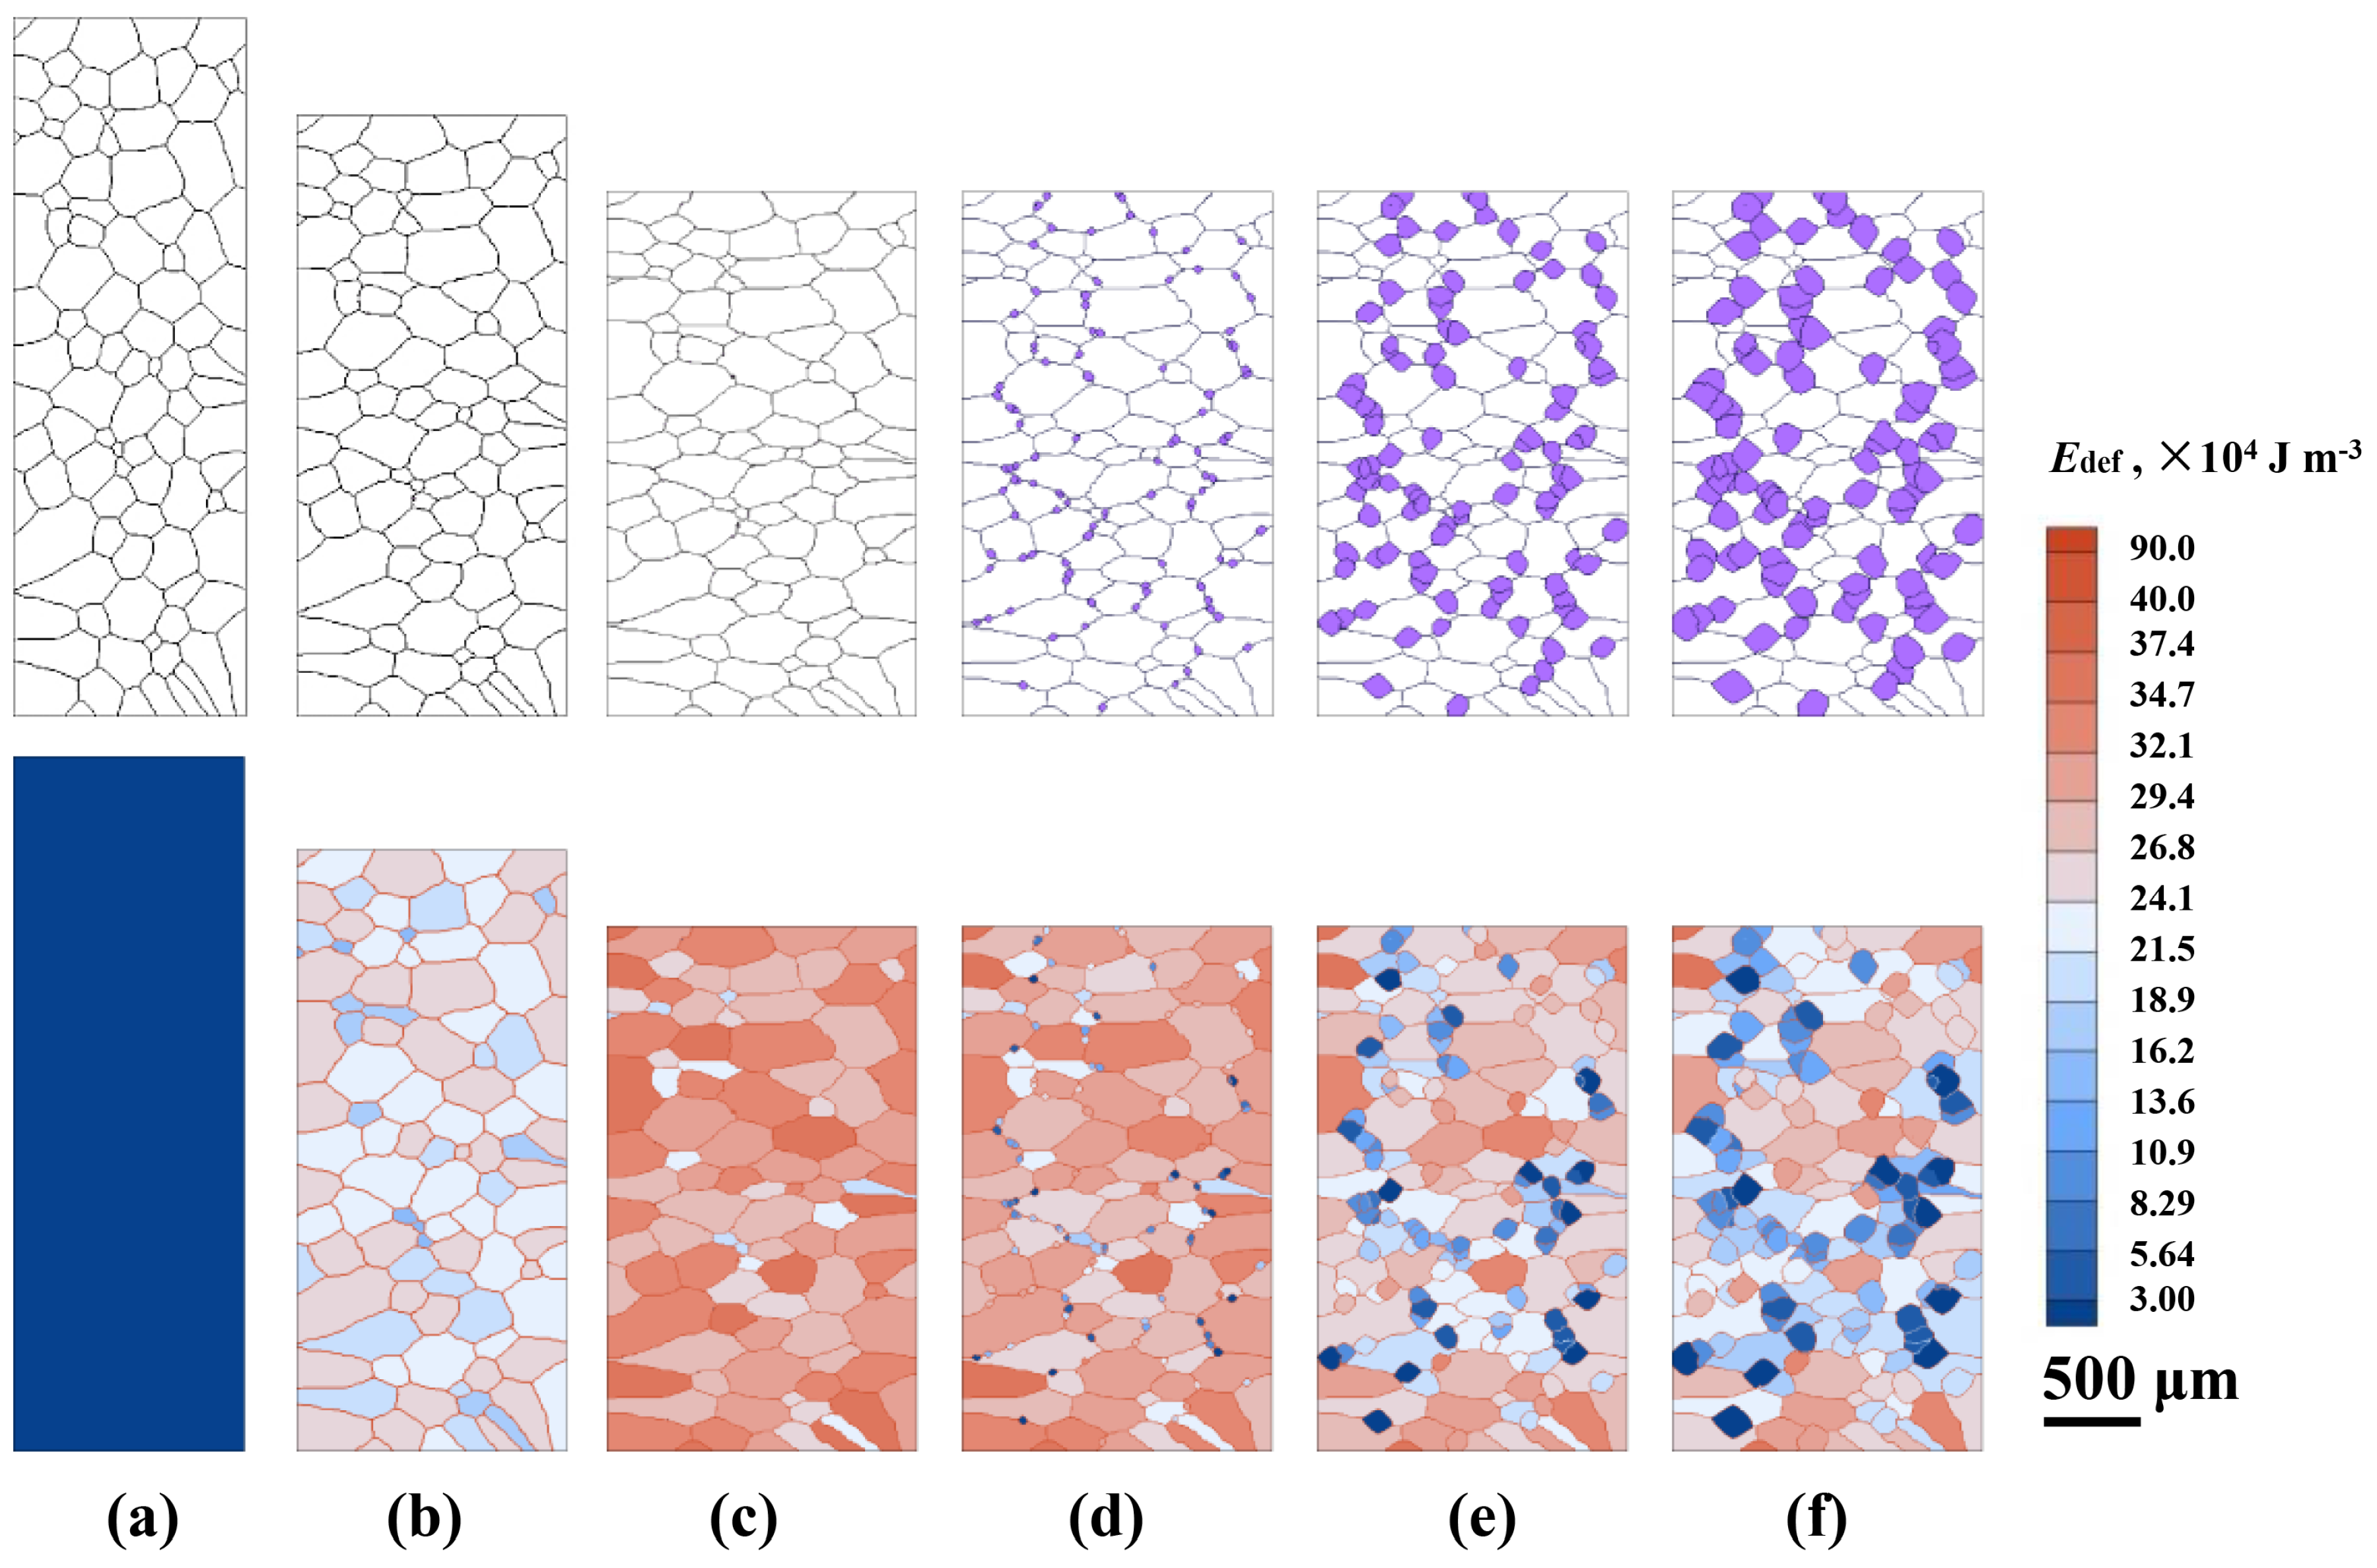
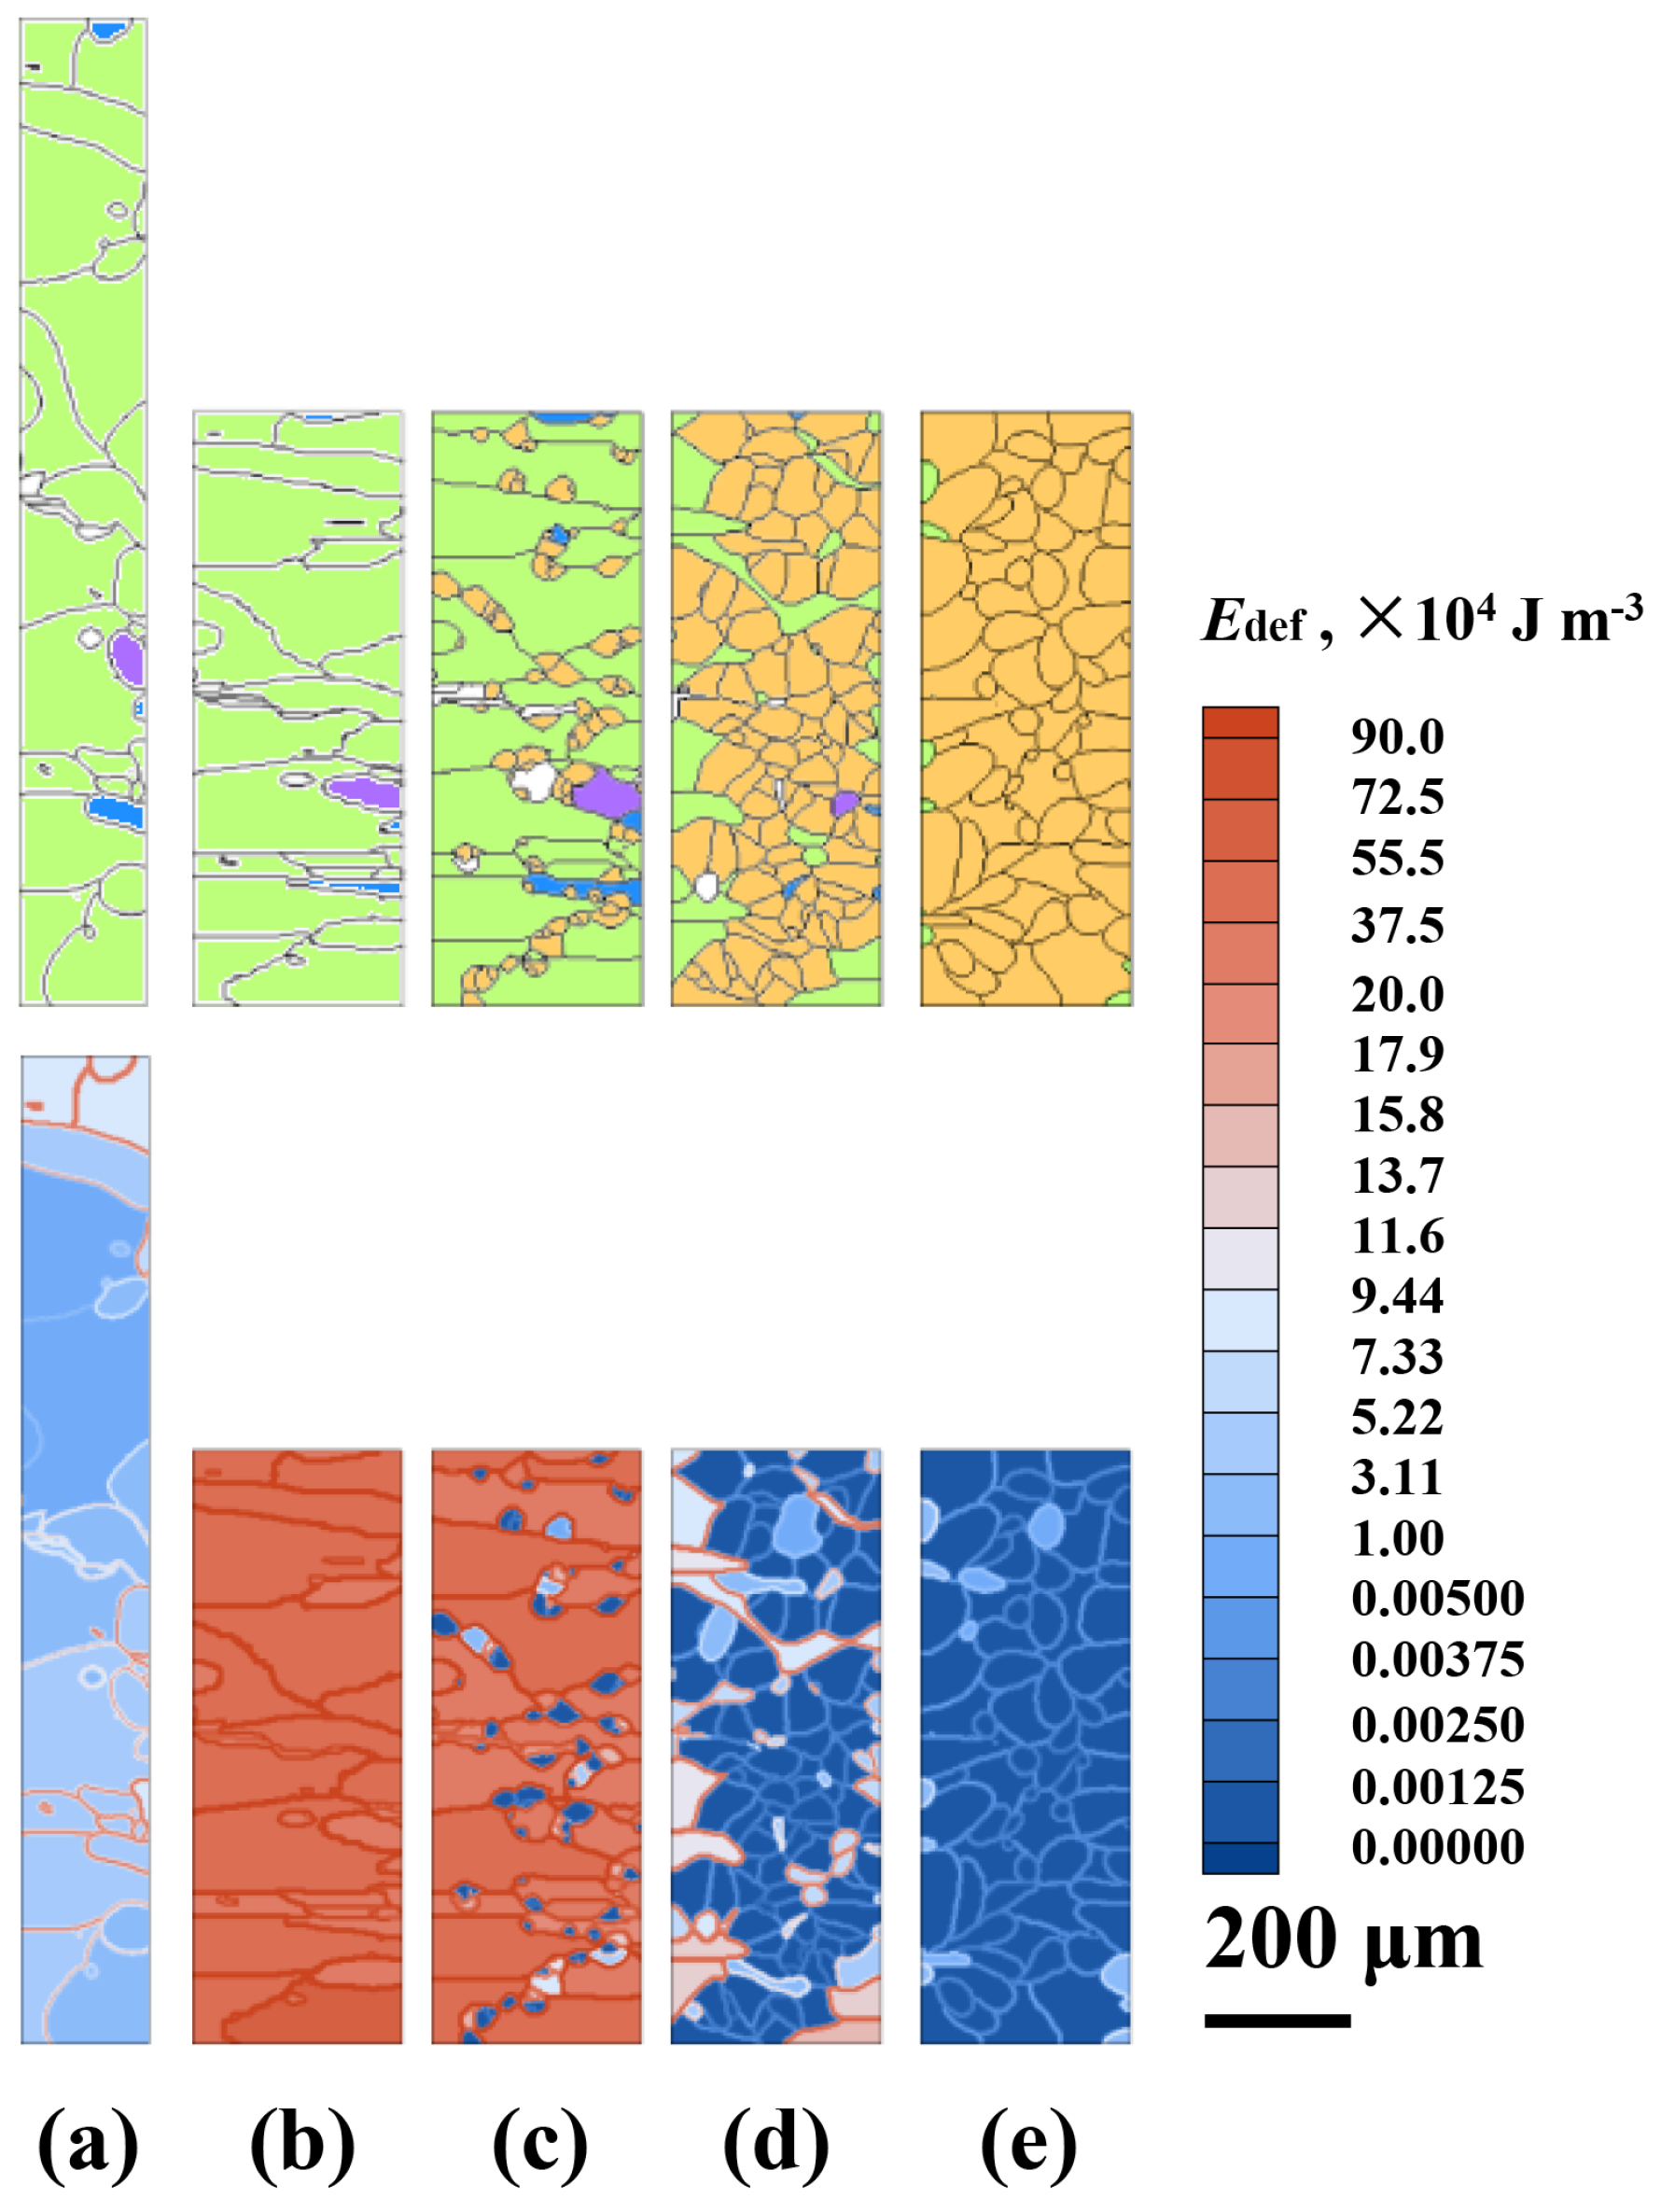
The first and the fourth passes are taken as examples to explain the variations in grain structure and the deformation-stored energy (Edef) field. Figure 6 presents the CA-simulated evolution of grain structure and the Edef field during the first pass and subsequent inter-pass period. As presented in Figure 6a, before hot-rolling, the initial grain structure is produced according to the experimental observation (see Figure 1). The initial Edef at grain boundaries is set to be somewhat higher than that within the grains, Equation (8). The deformed grain structures and nonuniform distribution of the Edef are achieved during deformation, Figure 6b,c. Figure 6c shows the grain structure and the Edef field at the end of deformation. It is seen that recrystallization does not occur evidently during the deformation period, reflecting the minor variation of fRX in Figure 5a due to the limited deformation time. The Edef accumulates continuously under deformation, which corresponds to the increase in ρave in the first pass (Figure 3a). During the inter-pass period, recrystallized grains appear at the γ/γ grain boundaries. As analyzed above, these recrystallized grains nucleate by the DRX mechanism. Then, as described by Equation (14), they grow into unrecrystallized grains by consuming the Edef during the inter-pass interval, Figure 6c–f. The Edef in some recrystallized grains is higher because they are generated prior to other recrystallized grains and thus accumulate more deformation-stored energy. It is also noted that the unrecrystallized grains surrounded by DRX grains have a relatively lower Edef than that far away from DRX grains, as the Edef in those grains is consumed by massive recrystallization, Equation (7).
Figure 7 presents the CA-simulated evolution of grain structure and the deformation-stored energy (Edef) field during the fourth pass and interval. As shown, the nucleation from DRX can hardly be observed in Figure 7a,b, which is the same as that in the first pass. The Edef of the matrix at the end of the fourth pass deformation is much higher compared to that of the first pass. The remaining Edef after the fourth pass still exceeds the critical value for SRX nucleation, leading to the occurrence of SRX, Equation (12). Thus, during the inter-pass period, some new grains nucleate at both the unrecrystallized and recrystallized grain boundaries, Figure 7c–e. When the recrystallized grains contact each other, grain coarsening driven by curvature takes place, Equations (14)–(16). It is seen from Figure 7e that at the end of the fourth pass, the matrix has been almost thoroughly occupied by the new recrystallized grains, and the Edef in the domain has been exhausted to relatively low values. As discussed for Figure 5b, the nearly completely recrystallized grain structure after the fourth pass interval is due to an integrating effect of high strain rate (5.632 s−1), refined initial grain size (~40 μm), relatively long inter-pass time (~21 s), and moderate temperature (950–1050 °C).
4.3. CA Simulation of Cooling Process.
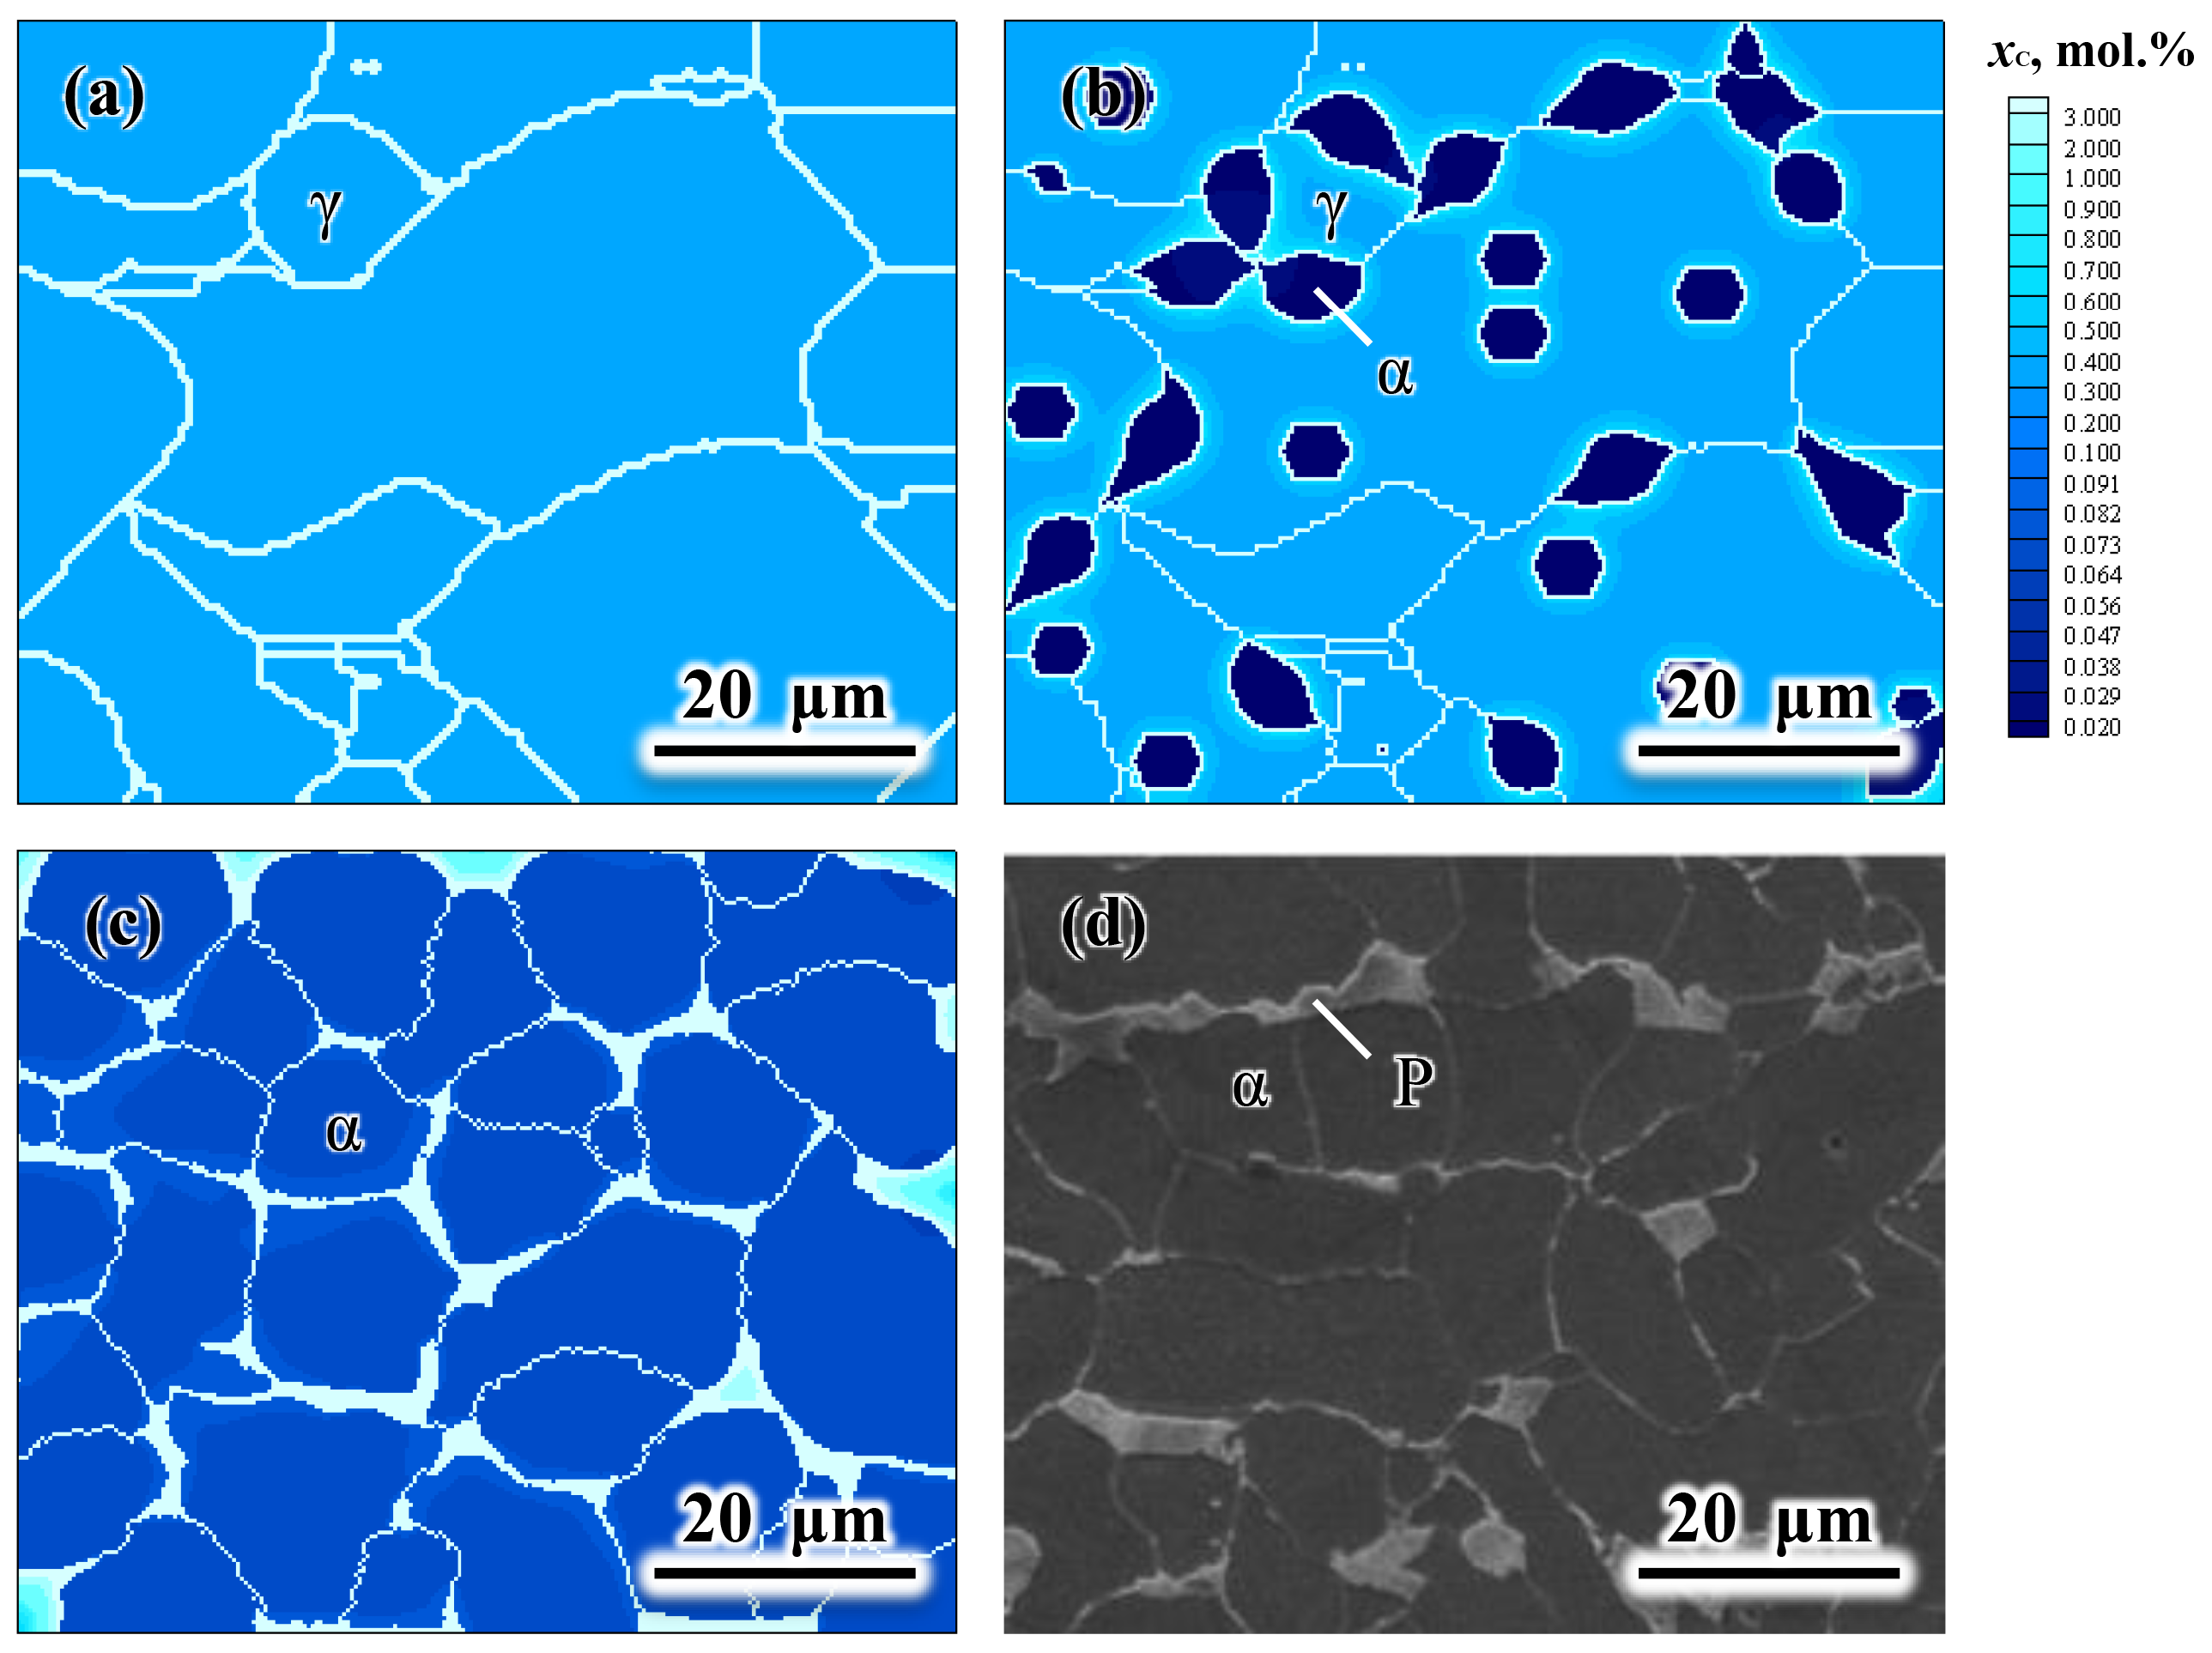
Finally, the CA model coupled with the solute drag effect as described in Section 3.3 is adopted to simulate the microstructure evolution during cooling after the sixth pass. The grain structure at the end of sixth pass (inside the box of the last grain structure picture in Figure 4) is taken as the initial microstructure (Figure 8a) for this simulation. According to the Calphad calculation and experimental measurement, the γ→α transformation temperature range is set from 832 °C to 650 °C. Figure 8 displays the simulation results during cooling from 832 °C to 650 °C at a cooling rate of 4 °C s−1. The SEM micrograph from the as-rolled sample is given in Figure 8d for comparison. As shown in Figure 8b, new α-grains nucleate primarily at γ/γ grain boundaries; some α-grains also appear inside the γ-grains. During cooling, the α-grains grow with the increasing carbon concentrations in both α- and γ-phases. The regions adjacent to the α/γ interfaces are more enriched in carbon due to the rejection of carbon atoms from the newly formed α-grains. When the simulation of phase transformation finishes, carbon enriches in the remaining γ-phase (light blue) in Figure 8c, which corresponds to the pearlite phase in Figure 8d. The final α volume fraction of the simulated microstructure presented in Figure 8c is ~0.92, which is nearly identical to the experimentally measured value, ~0.93. The simulated average α-grain size, ~9.4 μm, also agrees well with the experimental data, ~9.7 μm.
5. Conclusions
A coupled macroscale finite element method (FEM) and mesoscale cellular automaton (CA) model is proposed for the simulation of microstructural evolution during a 6-pass hot-rolling process. The FEM is adopted to calculate the deformation and temperature field. The CA approach is used to simulate the dislocation density and microstructure quantitatively, including recrystallization during hot-rolling, and the γ→α phase transformation during cooling.
The calculation of the dislocation density field takes into account the effects of work hardening, dynamic recovery, static recovery, and recrystallization. For the simulation of the γ→α phase transformation, the interaction between manganese atoms and α/γ interfaces is considered by incorporating a solute drag effect with the CA model; the contribution of deformation-stored energy to the driving forces is also involved.
The simulation results quantitively display the comprehensive effect of strain rate, grain size, temperature, and inter-pass time on the different mechanisms of recrystallization, including dynamic recrystallization (DRX), metadynamic recrystallization (MDRX), and static recrystallization (SRX). DRX is found to be mainly constrained to the nucleation of recrystallized grains due to the limited deformation time (~0.1 s) in the present rolling process. Under the relatively low strain rate of the first to third passes, MDRX dominates the grain structure evolution. For the high strain rates of the fourth to sixth passes, MDRX and SRX occur concurrently. High strain rate is found to be more beneficial to SRX than MDRX. A high temperature and fine initial grain size will enhance the kinetics of recrystallization. A sufficient inter-pass time is also necessary for MDRX and SRX to refine grain structure. However, too long of an inter-pass duration may lead to recrystallized grains coarsening.
The simulated average γ-grain size is reduced from ~174 μm to ~12 μm during the 6-pass hot rolling process. After the γ→α phase transformation during subsequent cooling, the simulated final α volume fraction (0.92) and average α-grain size (~9.4 μm) agree reasonably with the experimental data (~0.93, ~9.7 μm). The simulation in the present work allows for quantification of the contributions of DRX, MDRX, SRX, and phase transformation on grain refinement, and thus provides insight into the mechanisms of microstructural evolution during a multi-pass hot-rolling process.
Author Contributions
Conceptualization, M.Z.; methodology, D.A. and M.Z.; software, D.A. and X.L.; validation, D.A. and X.Z.; formal analysis, X.L. and M.Z.; investigation, X.L. and M.Z.; resources, X.Z.; data curation, X.L. and X.Z.; writing—original draft preparation, X.L.; writing—review and editing, M.Z. and B.W.K.; visualization, X.L.; supervision, M.Z.; project administration, M.Z.; funding acquisition, M.Z. All authors have read and agreed to the published version of the manuscript.
Funding
This work was financially supported by A. O. Smith Corporation, USA, NSFC (Grant No. 51501091), and the Jiangsu Key Laboratory for Advanced Metallic Materials (BM2007204).
Institutional Review Board Statement
Not applicable.
Informed Consent Statement
Not applicable.
Data Availability Statement
The data presented in this study are available in this article.
Conflicts of Interest
The authors declare no conflict of interest.
Nomenclature
| γb | high-angle grain boundary energy: J m−2 |
| ε | strain |
| ɛc | critical strain for SRX nucleation |
| strain rate, s−1 | |
| θ0 | initial work hardening rate, MPa |
| κ | the grain boundary curvature, m−1 |
| Λ | half physical interface thickness, nm |
| μ | shear modulus of the γ-phase, Pa |
| ρ | dislocation density, m−2 |
| ρ0 | initial dislocation density, m−2 |
| ρc | critical dislocation density for DRX, m−2 |
| ρave | average dislocation density of the material, m−2 |
| average dislocation density of the deformed grain, m−2 | |
| average dislocation density of the recrystallized grain, m−2 | |
| σ | flow stress, Pa |
| σs | saturated stress, Pa |
| τ | dislocation line energy, J·m−1 |
| φ | α-phase volume fraction |
| χ | proportionality factor, J mol−1 mol.%−1 |
| α1,β, η, a, n’, A0, QA | constants for calculating dislocation density evolution |
| A | coefficient for calculating curvature |
| ASi | area of grain Si |
| b | the magnitude of the Burgers vector, m |
| C | DRX nucleation parameter |
| d | coefficient representing static recovery rate |
| d0, md QSRV | constants for calculating static recovery rate |
| average diameters for γ-, matrix, DRX, SRX, α-grains, μm | |
| carbon diffusion coefficients in the α- and γ-phases, m2 s−1 | |
| D0 | boundary self-diffusion coefficient, m2 s−1 |
| manganese diffusion coefficient across the α/γ interface, m2 s−1 | |
| Edef | deformation stored energy, J m−3 |
| Ec | critical deformation stored energy for SRX nucleation, J m−3 |
| average deformation stored energy of grain S, J m−3 | |
| E0 | binding energy of manganese, J mol−1 |
| ΔE | half potential difference of manganese between α- and γ-phases, J mol−1 |
| fRX, fα | volume fractions of recrystallized grains and α grains |
| ΔGV | driving force of the ferrite nucleation, J mol−1 |
| ΔGV,che | Gibbs chemical free energy difference between the α- and γ-phases, J mol−1 |
| ΔGche | chemical driving force of the γ→α transformation, J mol−1 |
| ΔGdis | solute drag pressure, J mol−1 |
| gnew | geometrical factor |
| HS,Max | maximum value of the stored energy in grain S, J m−3 |
| I | grain index |
| J | nucleation rate of ferrite, m−2 s−1 |
| k | Boltzmann constant, J K−1 |
| ke | equilibrium partitioning coefficient |
| k1,k2 | constants representing work hardening and dynamic recovery |
| K1K2 | constants for calculating the nucleation rate of ferrite |
| Kink | number of cells within the neighborhood belonging to grain S for a flat interface |
| l | dislocation mean free path, m |
| li | ratio of the final to initial length of vector along corresponding axis |
| L | distance of the cell (i, j) from the grain boundary, μm |
| f(L) | factor for deformation stored energy distribution |
| M | deformation matrix for topology mapping |
| Mb | high-angle grain boundary mobility, m4 J−1 s−1 |
| Mα/γ | interfacial mobility of the moving α/γ interface, mol m J−1 s−1 |
| pre-exponential factor, mol m J−1 s−1 | |
| nucleation rates for DRX and SRX, m−2 s−1 | |
| n | number of cells that belongs to grain S |
| N | number of the first and second nearest neighbors |
| NS | number of cells within the neighborhood belonging to grain S |
| Ng | number of grains in the calculation domain |
| P | driving pressure, J m−3 |
| Pα/γ | effective driving pressure for ferrite growth, J mol−1 |
| QN | activation energy for nucleation, KJ mol−1 |
| Qb | activation energy for grain-boundary motion, KJ mol−1 |
| Qα/γ | activation energy for atom motion at the interface, KJ mol−1 |
| R | universal gas constant, J mol−1 K−1 |
| SI, SII | states of the nearest and the second-nearest neighbor cells |
| T | absolute temperature, K |
| u,v | original and the new vectors of the CA cell space |
| V | velocity of grain boundary movement, m s−1 |
| Vα/γ | migration velocity of the α/γ interface, m s−1 |
| Vm | molar volume of austenite, m3 mol−1 |
| equilibrium carbon concentration of the α-phase, mol.% | |
| equilibrium carbon concentration of the γ-phase, mol.% | |
| actual carbon concentration of the γ-phase at the α/γ interface, mol.% | |
| manganese concentration in the bulk matrix, mol.% | |
| y | distance from the interface, μm |
| xMn(y) | the manganese concentration profile |
| E(y) | the interaction potential of manganese |
| Z | nucleation parameter for SRX, J−1 s−1 |
References
- Huang, K.; Logé, R.E. A Review of Dynamic Recrystallization Phenomena in Metallic Materials. Mater. Des. 2016, 111, 548–574. [Google Scholar] [CrossRef]
- Zhao, L.; Park, N.; Tian, Y.; Shibata, A.; Tsuji, N. Mechanism of Dynamic Formation of Ultrafine Ferrite Grains during High Temperature Processing in Steel. Adv. Eng. Mater. 2017, 19, 1600778. [Google Scholar] [CrossRef]
- Fang, Y.; Chen, X.; Madigan, B.; Cao, H.; Konovalov, S. Effects of Strain Rate on the Hot Deformation Behavior and Dynamic Recrystallization in China Low Activation Martensitic Steel. Fusion Eng. Des. 2016, 103, 21–30. [Google Scholar] [CrossRef]
- Nicolaÿ, A.; Fiorucci, G.; Franchet, J.M.; Cormier, J.; Bozzolo, N. Influence of Strain Rate on Subsolvus Dynamic and Post-Dynamic Recrystallization Kinetics of Inconel 718. Acta Mater. 2019, 174, 406–417. [Google Scholar] [CrossRef]
- Yu, S.; Du, L.X.; Hu, J.; Misra, R.D.K. Effect of Hot Rolling Temperature on the Microstructure and Mechanical Properties of Ultra-Low Carbon Medium Manganese Steel. Mater. Sci. Eng. A 2018, 731, 149–155. [Google Scholar] [CrossRef]
- Ghosh, S.; Komi, J.; Mula, S. Flow Stress Characteristics and Design of Innovative 3-Steps Multiphase Control Thermomechanical Processing to Produce Ultrafine Grained Bulk Steels. Mater. Des. 2020, 186, 108297. [Google Scholar] [CrossRef]
- Zhang, W.; Zhang, J.; Han, Y.; Liu, R.; Zou, D.; Qiao, G. Metadynamic Recrystallization Behavior of As-Cast 904L Superaustenitic Stainless Steel. J. Iron Steel Res. Int. 2016, 23, 151–159. [Google Scholar] [CrossRef]
- Raabe, D. Cellular Automata in Materials Science with Particular Reference to Recrystallization Simulation. Annu. Rev. Mater. Res. 2002, 32, 53–76. [Google Scholar] [CrossRef]
- Chen, F.; Zhu, H.; Zhang, H.; Cui, Z. Mesoscale Modeling of Dynamic Recrystallization: Multilevel Cellular Automaton Simulation Framework. Metall. Mater. Trans. A 2020, 51, 1286–1303. [Google Scholar] [CrossRef]
- Zhang, F.; Liu, D.; Yang, Y.; Wang, J.; Liu, C.; Zhang, Z.; Wang, H. Modeling and Simulation of Dynamic Recrystallization for Inconel 718 in the Presence of Delta Phase Particles Using a Developed Cellular Automaton Model. Model. Simul. Mater. Sci. Eng. 2019, 27, 035002. [Google Scholar] [CrossRef]
- Bararpour, S.M.; Jamshidi Aval, H.; Jamaati, R. Cellular Automaton Modeling of Dynamic Recrystallization in Al-Mg Alloy Coating Fabricated Using the Friction Surfacing Process. Surf. Coat. Technol. 2021, 407, 126784. [Google Scholar] [CrossRef]
- Liu, H.; Zhang, J.; Xu, B.; Xu, X.; Zhao, W. Prediction of Microstructure Gradient Distribution in Machined Surface Induced by High Speed Machining through a Coupled FE and CA Approach. Mater. Des. 2020, 196, 109133. [Google Scholar] [CrossRef]
- Madej, Ł.; Sitko, M.; Legwand, A.; Perzynski, K.; Michalik, K. Development and Evaluation of Data Transfer Protocols in the Fully Coupled Random Cellular Automata Finite Element Model of Dynamic Recrystallization. J. Comput. Sci. 2018, 26, 66–77. [Google Scholar] [CrossRef]
- Kim, D.-K.; Woo, W.; Park, W.-W.; Im, Y.-T.; Rollett, A. Mesoscopic Coupled Modeling of Texture Formation during Recrystallization Considering Stored Energy Decomposition. Comput. Mater. Sci. 2017, 129, 55–65. [Google Scholar] [CrossRef] [Green Version]
- Shen, G.; Hu, B.; Zheng, C.; Gu, J.; Li, D. Coupled Simulation of Ferrite Recrystallization in a Dual-Phase Steel Considering Deformation Heterogeneity at Mesoscale. Comput. Mater. Sci. 2018, 149, 191–201. [Google Scholar] [CrossRef]
- Li, H.; Sun, X.; Yang, H. A Three-Dimensional Cellular Automata-Crystal Plasticity Finite Element Model for Predicting the Multiscale Interaction among Heterogeneous Deformation, DRX Microstructural Evolution and Mechanical Responses in Titanium Alloys. Int. J. Plast. 2016, 87, 154–180. [Google Scholar] [CrossRef]
- Barkóczy, P.; Roósz, A.; Geiger, J. Simulation of Recrystallization by Cellular Automaton Method. Mater. Sci. Forum 2003, 414–415, 359–364. [Google Scholar] [CrossRef]
- Zheng, C.; Xiao, N.; Li, D.; Li, Y. Microstructure Prediction of the Austenite Recrystallization during Multi-Pass Steel Strip Hot Rolling: A Cellular Automaton Modeling. Comput. Mater. Sci. 2008, 44, 507–514. [Google Scholar] [CrossRef]
- Chen, F.; Cui, Z. Mesoscale Simulation of Microstructure Evolution during Multi-Stage Hot Forging Processes. Model. Simul. Mater. Sci. Eng. 2012, 20, 045008. [Google Scholar] [CrossRef]
- Łach, Ł.; Svyetlichnyy, D. Multiscale Model of Shape Rolling Taking into Account the Microstructure Evolution—Frontal Cellular Automata. Adv. Mater. Res. 2014, 998–999, 545–548. [Google Scholar] [CrossRef]
- Łach, Ł.; Svyetlichnyy, D. Frontal Cellular Automata Simulations of Microstructure Evolution during Shape Rolling. Mater. Res. Innov. 2014, 18, S6-295. [Google Scholar] [CrossRef]
- Svyetlichnyy, D. Simulation of Microstructure Evolution during Shape Rolling with the Use of Frontal Cellular Automata. ISIJ Int. 2012, 52, 559–568. [Google Scholar] [CrossRef] [Green Version]
- Zheng, C.; Xiao, N.; Hao, L.; Li, D.; Li, Y. Numerical Simulation of Dynamic Strain-Induced Austenite-Ferrite Transformation in a Low Carbon Steel. Acta Mater. 2009, 57, 2956–2968. [Google Scholar] [CrossRef]
- Zheng, C.; Raabe, D. Interaction between Recrystallization and Phase Transformation during Intercritical Annealing in a Cold-Rolled Dual-Phase Steel: A Cellular Automaton Model. Acta Mater. 2013, 61, 5504–5517. [Google Scholar] [CrossRef]
- Lan, Y.J.; Xiao, N.M.; Li, D.Z.; Li, Y.Y. Mesoscale Simulation of Deformed Austenite Decomposition into Ferrite by Coupling a Cellular Automaton Method with a Crystal Plasticity Finite Element Model. Acta Mater. 2005, 53, 991–1003. [Google Scholar] [CrossRef]
- Su, B.; Ma, Q.; Han, Z. Modeling of Austenite Decomposition during Continuous Cooling Process in Heat Treatment of Hypoeutectoid Steel with Cellular Automaton Method. Steel Res. Int. 2017, 88, 1600490. [Google Scholar] [CrossRef]
- Zhu, B.; Zhang, Y.; Wang, C.; Liu, P.X.; Liang, W.K.; Li, J. Modeling of the Austenitization of Ultra-High Strength Steel with Cellular Automation Method. Metall. Mater. Trans. A 2014, 45, 3161–3171. [Google Scholar] [CrossRef]
- Su, B.; Han, Z.; Liu, B. Cellular Automaton Modeling of Austenite Nucleation and Growth in Hypoeutectoid Steel during Heating Process. ISIJ Int. 2013, 53, 527–534. [Google Scholar] [CrossRef] [Green Version]
- An, D.; Baik, S.; Pan, S.; Zhu, M.; Isheim, D.; Krakauer, B.W.; Seidman, D.N. Evolution of Microstructure and Carbon Distribution During Heat Treatments of a Dual-Phase Steel: Modeling and Atom-Probe Tomography Experiments. Metall. Mater. Trans. A 2018, 50, 436–450. [Google Scholar] [CrossRef]
- An, D.; Chen, S.; Sun, D.; Pan, S.; Krakauer, B.W.; Zhu, M. A Cellular Automaton Model Integrated with CALPHAD-Based Thermodynamic Calculations for Ferrite-Austenite Phase Transformations in Multicomponent Alloys. Comput. Mater. Sci. 2019, 166, 210–220. [Google Scholar] [CrossRef]
- Bos, C.; Mecozzi, M.G.; Sietsma, J. A Microstructure Model for Recrystallisation and Phase Transformation during the Dual-Phase Steel Annealing Cycle. Comput. Mater. Sci. 2010, 48, 692–699. [Google Scholar] [CrossRef]
- Vertyagina, Y.; Mahfouf, M.; Xu, X. 3D Modelling of Ferrite and Austenite Grain Coarsening Using Real-Valued Cellular Automata Based on Transition Function. J. Mater. Sci. 2013, 48, 5517–5527. [Google Scholar] [CrossRef]
- Li, D.Z.; Xiao, N.M.; Lan, Y.J.; Zheng, C.W.; Li, Y.Y. Growth Modes of Individual Ferrite Grains in the Austenite to Ferrite Transformation of Low Carbon Steels. Acta Mater. 2007, 55, 6234–6249. [Google Scholar] [CrossRef]
- Chen, H.; van der Zwaag, S. A General Mixed-Mode Model for the Austenite-to-Ferrite Transformation Kinetics in Fe–C–M Alloys. Acta Mater. 2014, 72, 1–12. [Google Scholar] [CrossRef]
- Purdy, G.R.; Brechet, Y.J.M. A Solute Drag Treatment of the Effects of Alloying Elements on the Rate of the Proeutectoid Ferrite Transformation in Steels. Acta Metall. Mater. 1995, 43, 3763–3774. [Google Scholar] [CrossRef]
- Chen, F.; Cui, Z.; Liu, J.; Chen, W.; Chen, S. Mesoscale Simulation of the High-Temperature Austenitizing and Dynamic Recrystallization by Coupling a Cellular Automaton with a Topology Deformation Technique. Mater. Sci. Eng. A 2010, 527, 5539–5549. [Google Scholar] [CrossRef]
- Humphreys, J.; Rohrer, G.S.; Rollett, A. Chapter 7—Recrystallization of Single-Phase Alloys. In Recrystallization and Related Annealing Phenomena, 3rd ed.; Humphreys, J., Rohrer, G.S., Rollett, A., Eds.; Elsevier: Oxford, UK, 2017; pp. 245–304. ISBN 978-0-08-098235-9. [Google Scholar]
- Mecking, H.; Kocks, U.F. Kinetics of Flow and Strain-Hardening. Acta Metall. 1981, 29, 1865–1875. [Google Scholar] [CrossRef]
- Hatta, N.; Kokado, J.; Kikuchi, S.; Takuda, H. Modelling on Flow Stress of Plain Carbon Steel at Elevated Temperatures. Steel Res. 1985, 56, 575–582. [Google Scholar] [CrossRef]
- Yoshie, A.; Fujita, T.; Fujioka, M.; Okamoto, K.; Morikawa, H. Formulation of the Decrease in Dislocation Density of Deformed Austenite Due to Static Recovery and Recrystallization. ISIJ Int. 1996, 36, 474–480. [Google Scholar] [CrossRef]
- Barnoush, A.; Asgari, M.; Johnsen, R. Resolving the Hydrogen Effect on Dislocation Nucleation and Mobility by Electrochemical Nanoindentation. Scr. Mater. 2012, 66, 414–417. [Google Scholar] [CrossRef]
- Ivasishin, O.M.; Shevchenko, S.V.; Vasiliev, N.L.; Semiatin, S.L. A 3-D Monte-Carlo (Potts) Model for Recrystallization and Grain Growth in Polycrystalline Materials. Mater. Sci. Eng. A 2006, 433, 216–232. [Google Scholar] [CrossRef]
- Ding, R.; Guo, Z.X. Coupled Quantitative Simulation of Microstructural Evolution and Plastic Flow during Dynamic Recrystallization. Acta Mater. 2001, 49, 3163–3175. [Google Scholar] [CrossRef]
- Chen, F.; Qi, K.; Cui, Z.; Lai, X. Modeling the Dynamic Recrystallization in Austenitic Stainless Steel Using Cellular Automaton Method. Comput. Mater. Sci. 2014, 83, 331–340. [Google Scholar] [CrossRef]
- Fan, X.G.; Yang, H.; Sun, Z.C.; Zhang, D.W. Quantitative Analysis of Dynamic Recrystallization Behavior Using a Grain Boundary Evolution Based Kinetic Model. Mater. Sci. Eng. A 2010, 527, 5368–5377. [Google Scholar] [CrossRef]
- Roberts, W.; Ahlblom, B. A Nucleation Criterion for Dynamic Recrystallization during Hot Working. Acta Metall. 1978, 26, 801–813. [Google Scholar] [CrossRef]
- Takeuchi, S.; Argon, A.S. Steady-State Creep of Single-Phase Crystalline Matter at High Temperature. J. Mater. Sci. 1976, 11, 1542–1566. [Google Scholar] [CrossRef]
- Davies, C.H.J. Growth of Nuclei in a Cellular Automaton Simulation of Recrystallisation. Scr. Mater. 1997, 36, 35–40. [Google Scholar] [CrossRef]
- Kugler, G.; Turk, R. Modeling the Dynamic Recrystallization under Multi-Stage Hot Deformation. Acta Mater. 2004, 52, 4659–4668. [Google Scholar] [CrossRef]
- Song, X.; Rettenmayr, M. Modelling Study on Recrystallization, Recovery and Their Temperature Dependence in Inhomogeneously Deformed Materials. Mater. Sci. Eng. A 2002, 332, 153–160. [Google Scholar] [CrossRef]
- Zhang, J.; Zheng, C.-W.; Li, D.-Z. A Multi-Phase Field Model for Static Recrystallization of Hot Deformed Austenite in a C-Mn Steel. Acta Metall. Sin. Engl. Lett. 2018, 31, 208–215. [Google Scholar] [CrossRef]
- Kremeyer, K. Cellular Automata Investigations of Binary Solidification. J. Comput. Phys. 1998, 142, 243–263. [Google Scholar] [CrossRef]
- Umemoto, M.; Guo, Z.H.; Tamra, I. Effect of Cooling Rate on Grain Size of Ferrite in Carbon Steel. Mater. Sci. Technol. 1987, 3, 249–255. [Google Scholar] [CrossRef]
- Offerman, S.E.; van Dijk, N.H.; Sietsma, J.; Grigull, S.; Lauridsen, E.M.; Margulies, L.; Poulsen, H.F.; Rekveldt, M.T.; van der Zwaag, S. Grain Nucleation and Growth During Phase Transformations. Science 2002, 298, 1003–1005. [Google Scholar] [CrossRef] [PubMed] [Green Version]
- Krielaart, G.P.; Van Der Zwaag, S. Kinetics of γ → α Phase Transformation in Fe-Mn Alloys Containing Low Manganese. Mater. Sci. Technol. 1998, 14, 10–18. [Google Scholar] [CrossRef]
- Fazeli, F.; Militzer, M. Application of Solute Drag Theory to Model Ferrite Formation in Multiphase Steels. Metall. Mater. Trans. A 2005, 36, 1395–1405. [Google Scholar] [CrossRef]
- Zhu, B.; Militzer, M. Phase-Field Modeling for Intercritical Annealing of a Dual-Phase Steel. Metall. Mater. Trans. A 2015, 46, 1073–1084. [Google Scholar] [CrossRef]
- Militzer, M.; Mecozzi, M.; Sietsma, J.; Van Der Zwaag, S. Three-Dimensional Phase Field Modelling of the Austenite-to-Ferrite Transformation. Acta Mater. 2006, 54, 3961–3972. [Google Scholar] [CrossRef]
- Li, Z.; Xu, Y.; Wu, D.; Zhao, X.; Wang, G. Investigation on recrystallization and dislocation densityin high temperature deformed of C-Mn steel. Res. Iron Steel 2004, 32, 35–38. [Google Scholar] [CrossRef]
- Sun, W.P.; Hawbolt, E.B. Comparison between Static and Metadynamic Recrystallization—An Application to the Hot Rolling of Steels. ISIJ Int. 1997, 37, 1000–1009. [Google Scholar] [CrossRef]
- Wang, Z.; Sun, S.; Wang, B.; Shi, Z.; Zhang, R.; Fu, W. Effect of Grain Size on Dynamic Recrystallization and Hot-Ductility Behaviors in High-Nitrogen CrMn Austenitic Stainless Steel. Metall. Mater. Trans. A 2014, 45, 3631–3639. [Google Scholar] [CrossRef]
- Dehghan-Manshadi, A.; Hodgson, P.D. Dependency of Recrystallization Mechanism to the Initial Grain Size. Metall. Mater. Trans. A 2008, 39, 2830. [Google Scholar] [CrossRef] [Green Version]
Figure 1.
Initial grain structure before hot-rolling: (a) initial microstructure generated for the CA simulations; (b) enlarged microstructure in the region of the box in (a); (c) micrograph of the water-quenched sample cut from a slab after annealing at 1150 °C for 2 h before hot-rolling.
Figure 1.
Initial grain structure before hot-rolling: (a) initial microstructure generated for the CA simulations; (b) enlarged microstructure in the region of the box in (a); (c) micrograph of the water-quenched sample cut from a slab after annealing at 1150 °C for 2 h before hot-rolling.

Figure 2.
FEM-simulated temperatures of slab center (red line) and surface (black dash line) varying with time compared with the experimentally measured slab surface temperatures (blue circle).
Figure 2.
FEM-simulated temperatures of slab center (red line) and surface (black dash line) varying with time compared with the experimentally measured slab surface temperatures (blue circle).

Figure 3.
CA-simulated (a) average dislocation density and (b) recrystallized nucleus density varying with time. Arrows in the curves indicate the end of each pass.
Figure 3.
CA-simulated (a) average dislocation density and (b) recrystallized nucleus density varying with time. Arrows in the curves indicate the end of each pass.

Figure 4.
CA-simulated average grain size varying with time. Arrows indicate the end of each pass. Pictures from the left to right are the simulated grain structures at the end of each interval. The selected areas inside boxes shown in each picture are the input microstructures for the next pass. The sizes of each squared area are listed in Table 2. Recrystallized grains formed in different passes and intervals are shown in different colors; the initial matrix before the 1st pass is shown in white color.

Figure 5.
CA-simulated volume fraction of recrystallization varying with time: (a) an overview of the 6-pass hot-rolling process and (b) in each pass. Arrows in (a) indicate the end of each pass.
Figure 5.
CA-simulated volume fraction of recrystallization varying with time: (a) an overview of the 6-pass hot-rolling process and (b) in each pass. Arrows in (a) indicate the end of each pass.

Figure 6.
CA simulated evolution of the grain structure (upper row) and deformation-stored energy (lower row) during the 1st pass and interval: (a) t = 0.0 s; (b) t = 0.05 s; (c) t = 0.09 s, the end of deformation; (d) t = 1.0 s; (e) t = 3.0 s; (f) t = 4.1 s. In the upper row, the white and purple grains represent the initial and recrystallized grains generated in the 1st pass and interval, respectively. The horizontal and vertical directions are the rolling and compression directions, respectively.

Figure 7.
CA-simulated evolution of the grain structure (upper row) and deformation-stored energy (lower row) during the 4th pass and interval: (a) t = 0.0 s; (b) t = 0.1 s, the end of deformation; (c) t = 1.0 s; (d) t = 5.0 s; (e) t = 21.8 s. In the upper row, the purple, blue, green, yellow grains represent recrystallized grain generated in the 1st, 2nd, 3rd, 4th pass and interval, respectively. The horizontal and vertical directions are the rolling and compression directions, respectively.

Figure 8.
CA-simulated microstructures and carbon concentration fields during cooling from 832 °C to 650 °C at a cooling rate of 4 °C s−1: (a) T = 832 °C; (b) T = 750 °C; (c) T = 650 °C (t = 45.5 s, fα = ~0.92, Dα = ~9.4 μm); (d) SEM micrograph (fα = ~0.93, Dα = ~9.7 μm) of the cooled sample at room temperature. fα is the α volume fraction, and Dα is the average diameter of α-grains.


Table 1.
Strain and initial rolling temperature used for laboratory hot-rolling.
| Pass 1 | Pass 2 | Pass 3 | Pass 4 | Pass 5 | Pass 6 | |
|---|---|---|---|---|---|---|
| Strain, ε | 0.288 | 0.405 | 0.288 | 0.511 | 0.693 | 0.889 |
| Initial rolling Temperature (°C) | 1027 ± 10 | 1023 ± 10 | 1023 ± 10 | 1000 ± 10 | 950 ± 10 | 910 ± 10 |
Table 2.
CA simulation settings.
| Pass 1 | Pass 2 | Pass 3 | Pass 4 | Pass 5 | Pass 6 | Cooling | |
|---|---|---|---|---|---|---|---|
| Initial simulation domain size (CA cells) | 250 × 750 | 111 × 563 | 110 × 752 | 73 × 565 | 80 × 680 | 100 × 400 | 240 × 200 |
| CA space step, Δx (μm) | 4.8 | 4.8 | 2.4 | 2.4 | 1.2 | 0.6 | 0.3 |
Table 3.
Average effective strain rate obtained from the FEM simulation.
| Pass 1 | Pass 2 | Pass 3 | Pass 4 | Pass 5 | Pass 6 | |
|---|---|---|---|---|---|---|
| Strain rate, (s−1) | 3.724 | 4.770 | 3.964 | 5.632 | 10.000 | 12.024 |
Table 4.
Average grain size at the end of each interval.
| Pass Number | Initial | 1 | 2 | 3 | 4 | 5 | 6 |
|---|---|---|---|---|---|---|---|
| Average grain size, (μm) | 174 | 120 | 76 | 49 | 41 | 19 | 12 |
| Average matrix grain size, (μm) | 174 | 147 | 87 | 27 | 20 | 12 | 8 |
| Average DRX grain size, (μm) | -- | 93 | 63 | 72 | 33 | 15 | -- |
| Average SRX grain size, (μm) | -- | -- | -- | -- | 45 | 23 | 19 |
Publisher’s Note: MDPI stays neutral with regard to jurisdictional claims in published maps and institutional affiliations. |
© 2021 by the authors. Licensee MDPI, Basel, Switzerland. This article is an open access article distributed under the terms and conditions of the Creative Commons Attribution (CC BY) license (https://creativecommons.org/licenses/by/4.0/).
Share and Cite
MDPI and ACS Style
Lin, X.; Zou, X.; An, D.; Krakauer, B.W.; Zhu, M. Multi-Scale Modeling of Microstructure Evolution during Multi-Pass Hot-Rolling and Cooling Process. Materials 2021, 14, 2947. https://0-doi-org.brum.beds.ac.uk/10.3390/ma14112947
AMA Style
Lin X, Zou X, An D, Krakauer BW, Zhu M. Multi-Scale Modeling of Microstructure Evolution during Multi-Pass Hot-Rolling and Cooling Process. Materials. 2021; 14(11):2947. https://0-doi-org.brum.beds.ac.uk/10.3390/ma14112947
Chicago/Turabian StyleLin, Xian, Xinyi Zou, Dong An, Bruce W. Krakauer, and Mingfang Zhu. 2021. "Multi-Scale Modeling of Microstructure Evolution during Multi-Pass Hot-Rolling and Cooling Process" Materials 14, no. 11: 2947. https://0-doi-org.brum.beds.ac.uk/10.3390/ma14112947
Note that from the first issue of 2016, this journal uses article numbers instead of page numbers. See further details here.