
Comparison of Physicochemical Properties of Fly Ash Precursor, Na-P1(C) Zeolite–Carbon Composite and Na-P1 Zeolite—Adsorption Affinity to Divalent Pb and Zn Cations

 , and
, and
Abstract
:1. Introduction
2. Materials and Methods
2.1. Materials
2.2. Methods
3. Results and Discussion
3.1. Characteristics of Adsorbents
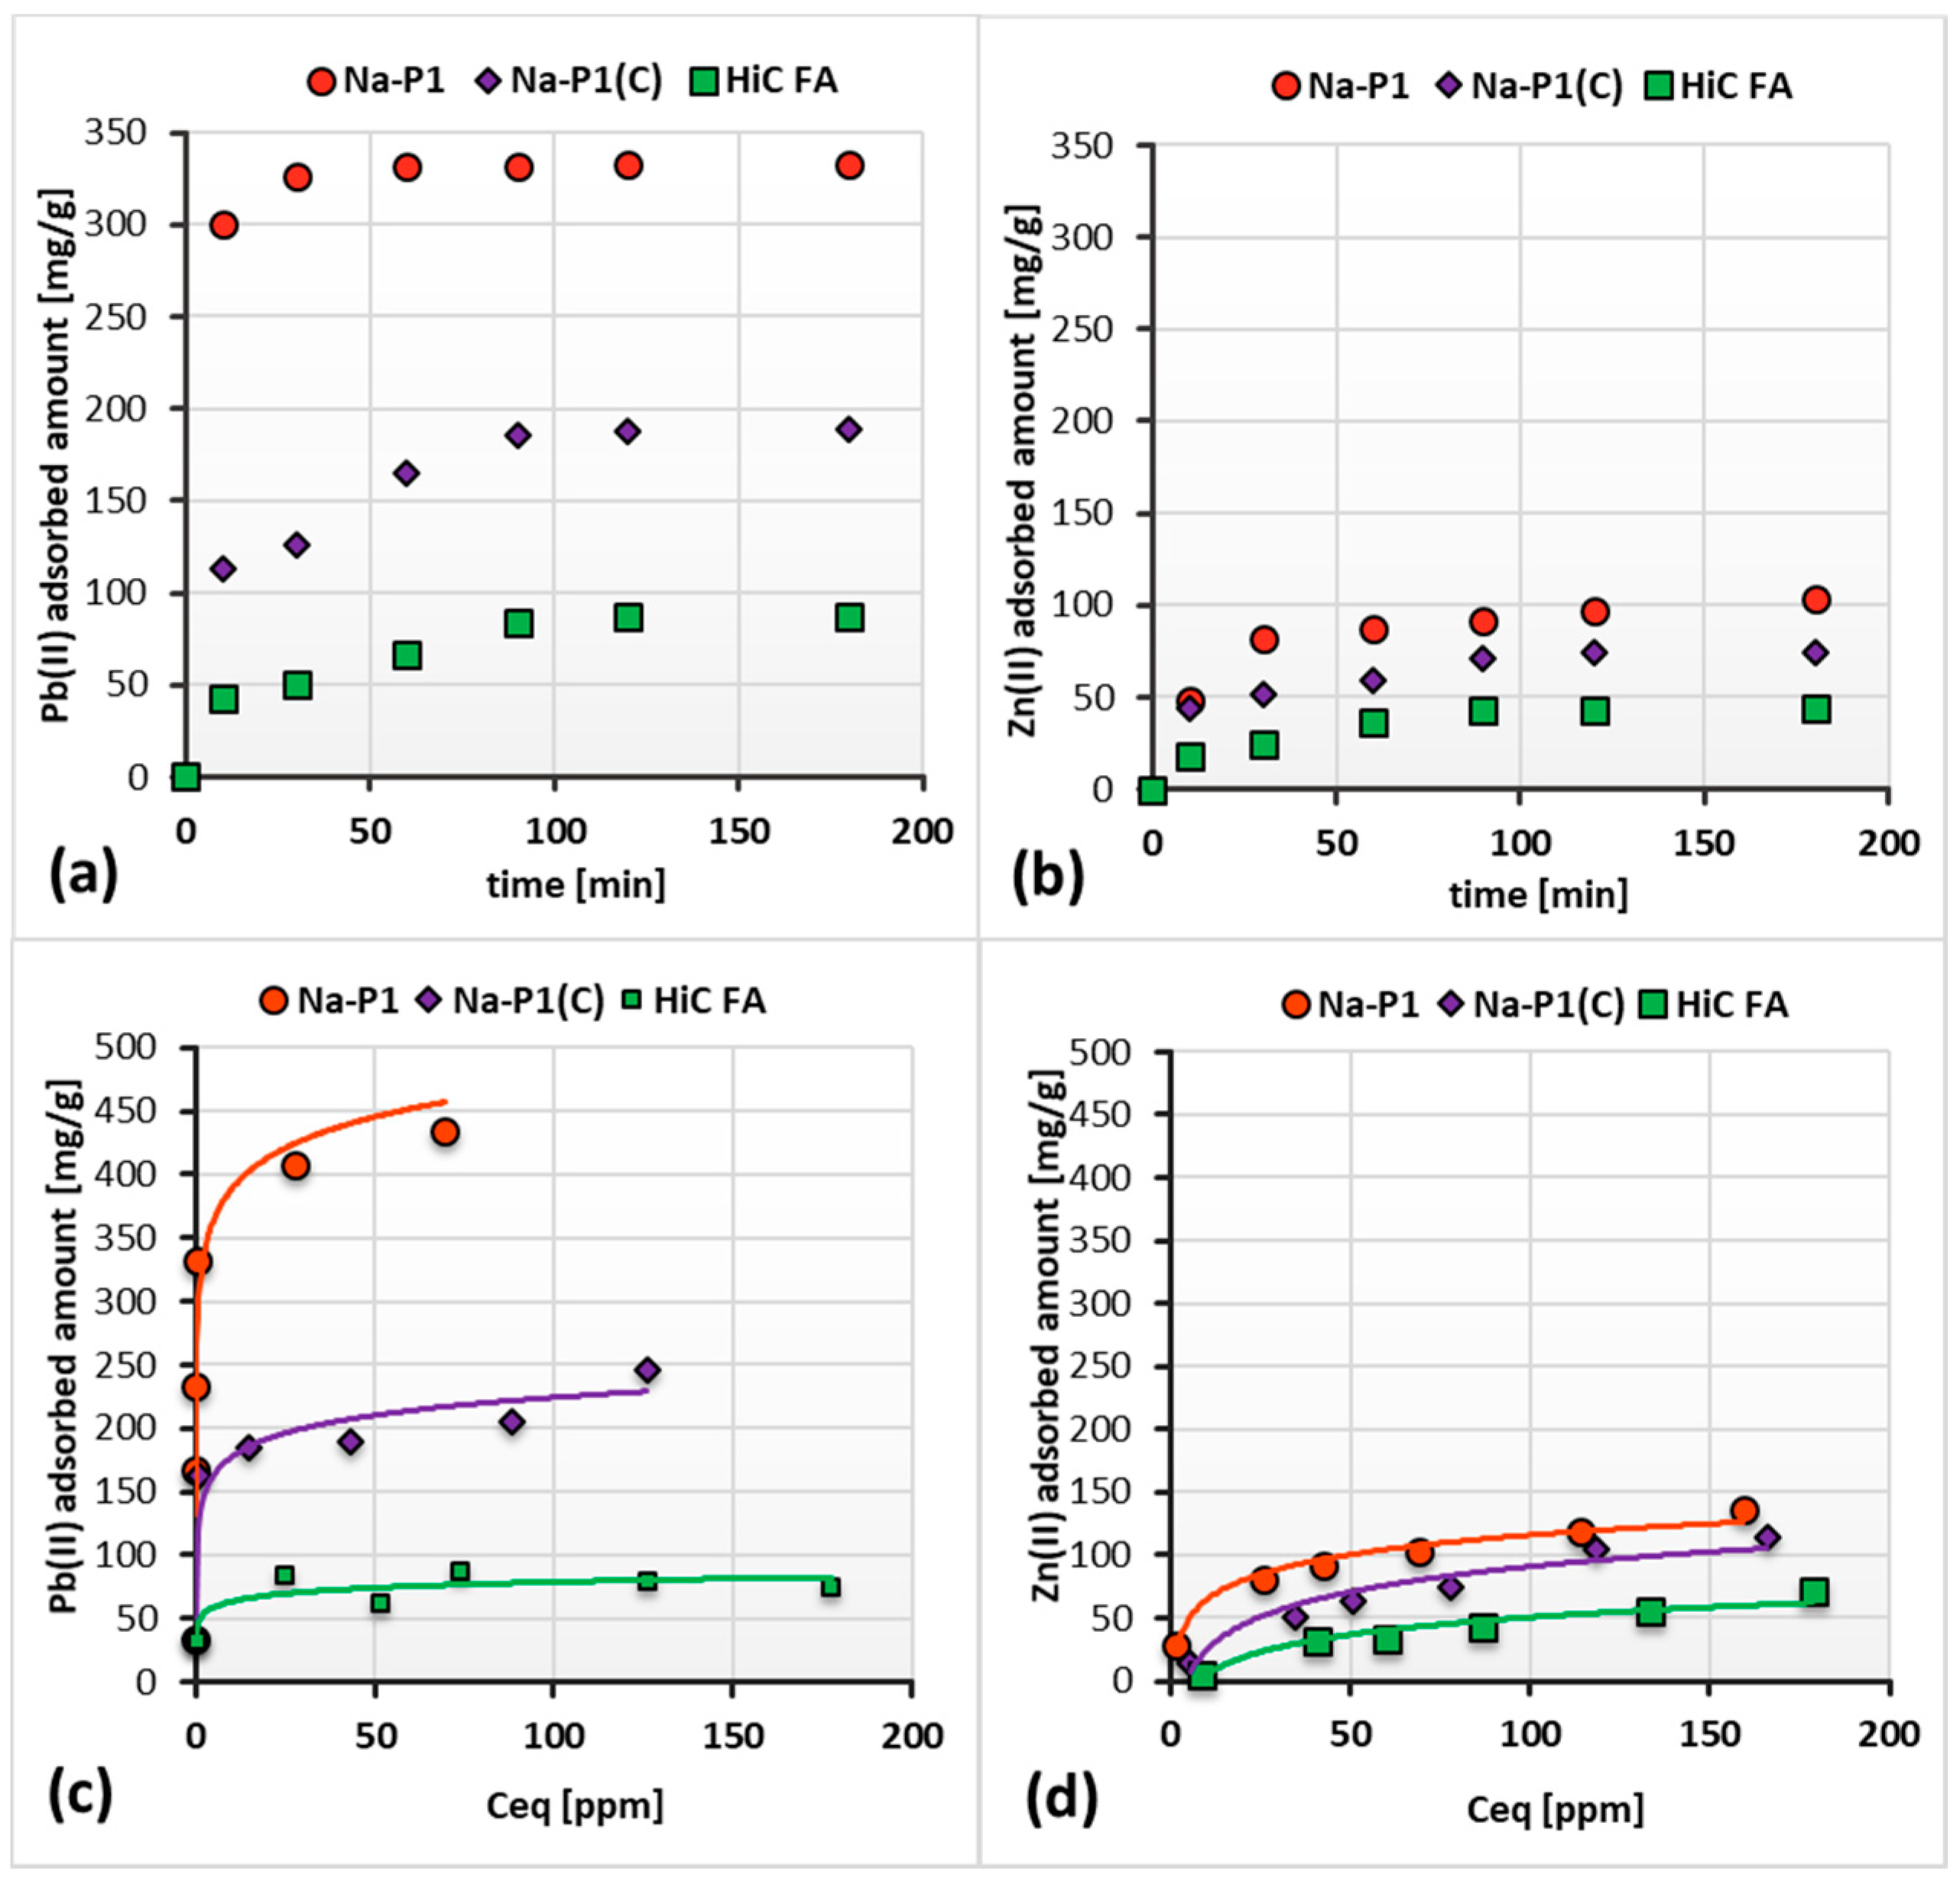
3.2. Adsorption Capacity of HiC FA, Zeolite–Carbon Composite and Pure Zeolite Relative to Zn(II)/Pb(II) Ions in the Single Adsorbate Systems
3.3. Adsorption Capacity of HiC FA, Zeolite and Its Carbon Composite Relative to Zn(II) and Pb(II) Ions in the Mixed Adsorbate Solutions
3.4. Changes in Surface Charge Density of HiC FA, Na-P1 and Na-P1(C) Particles as a Result of Zn(II) and/or Pb(II) Adsorption
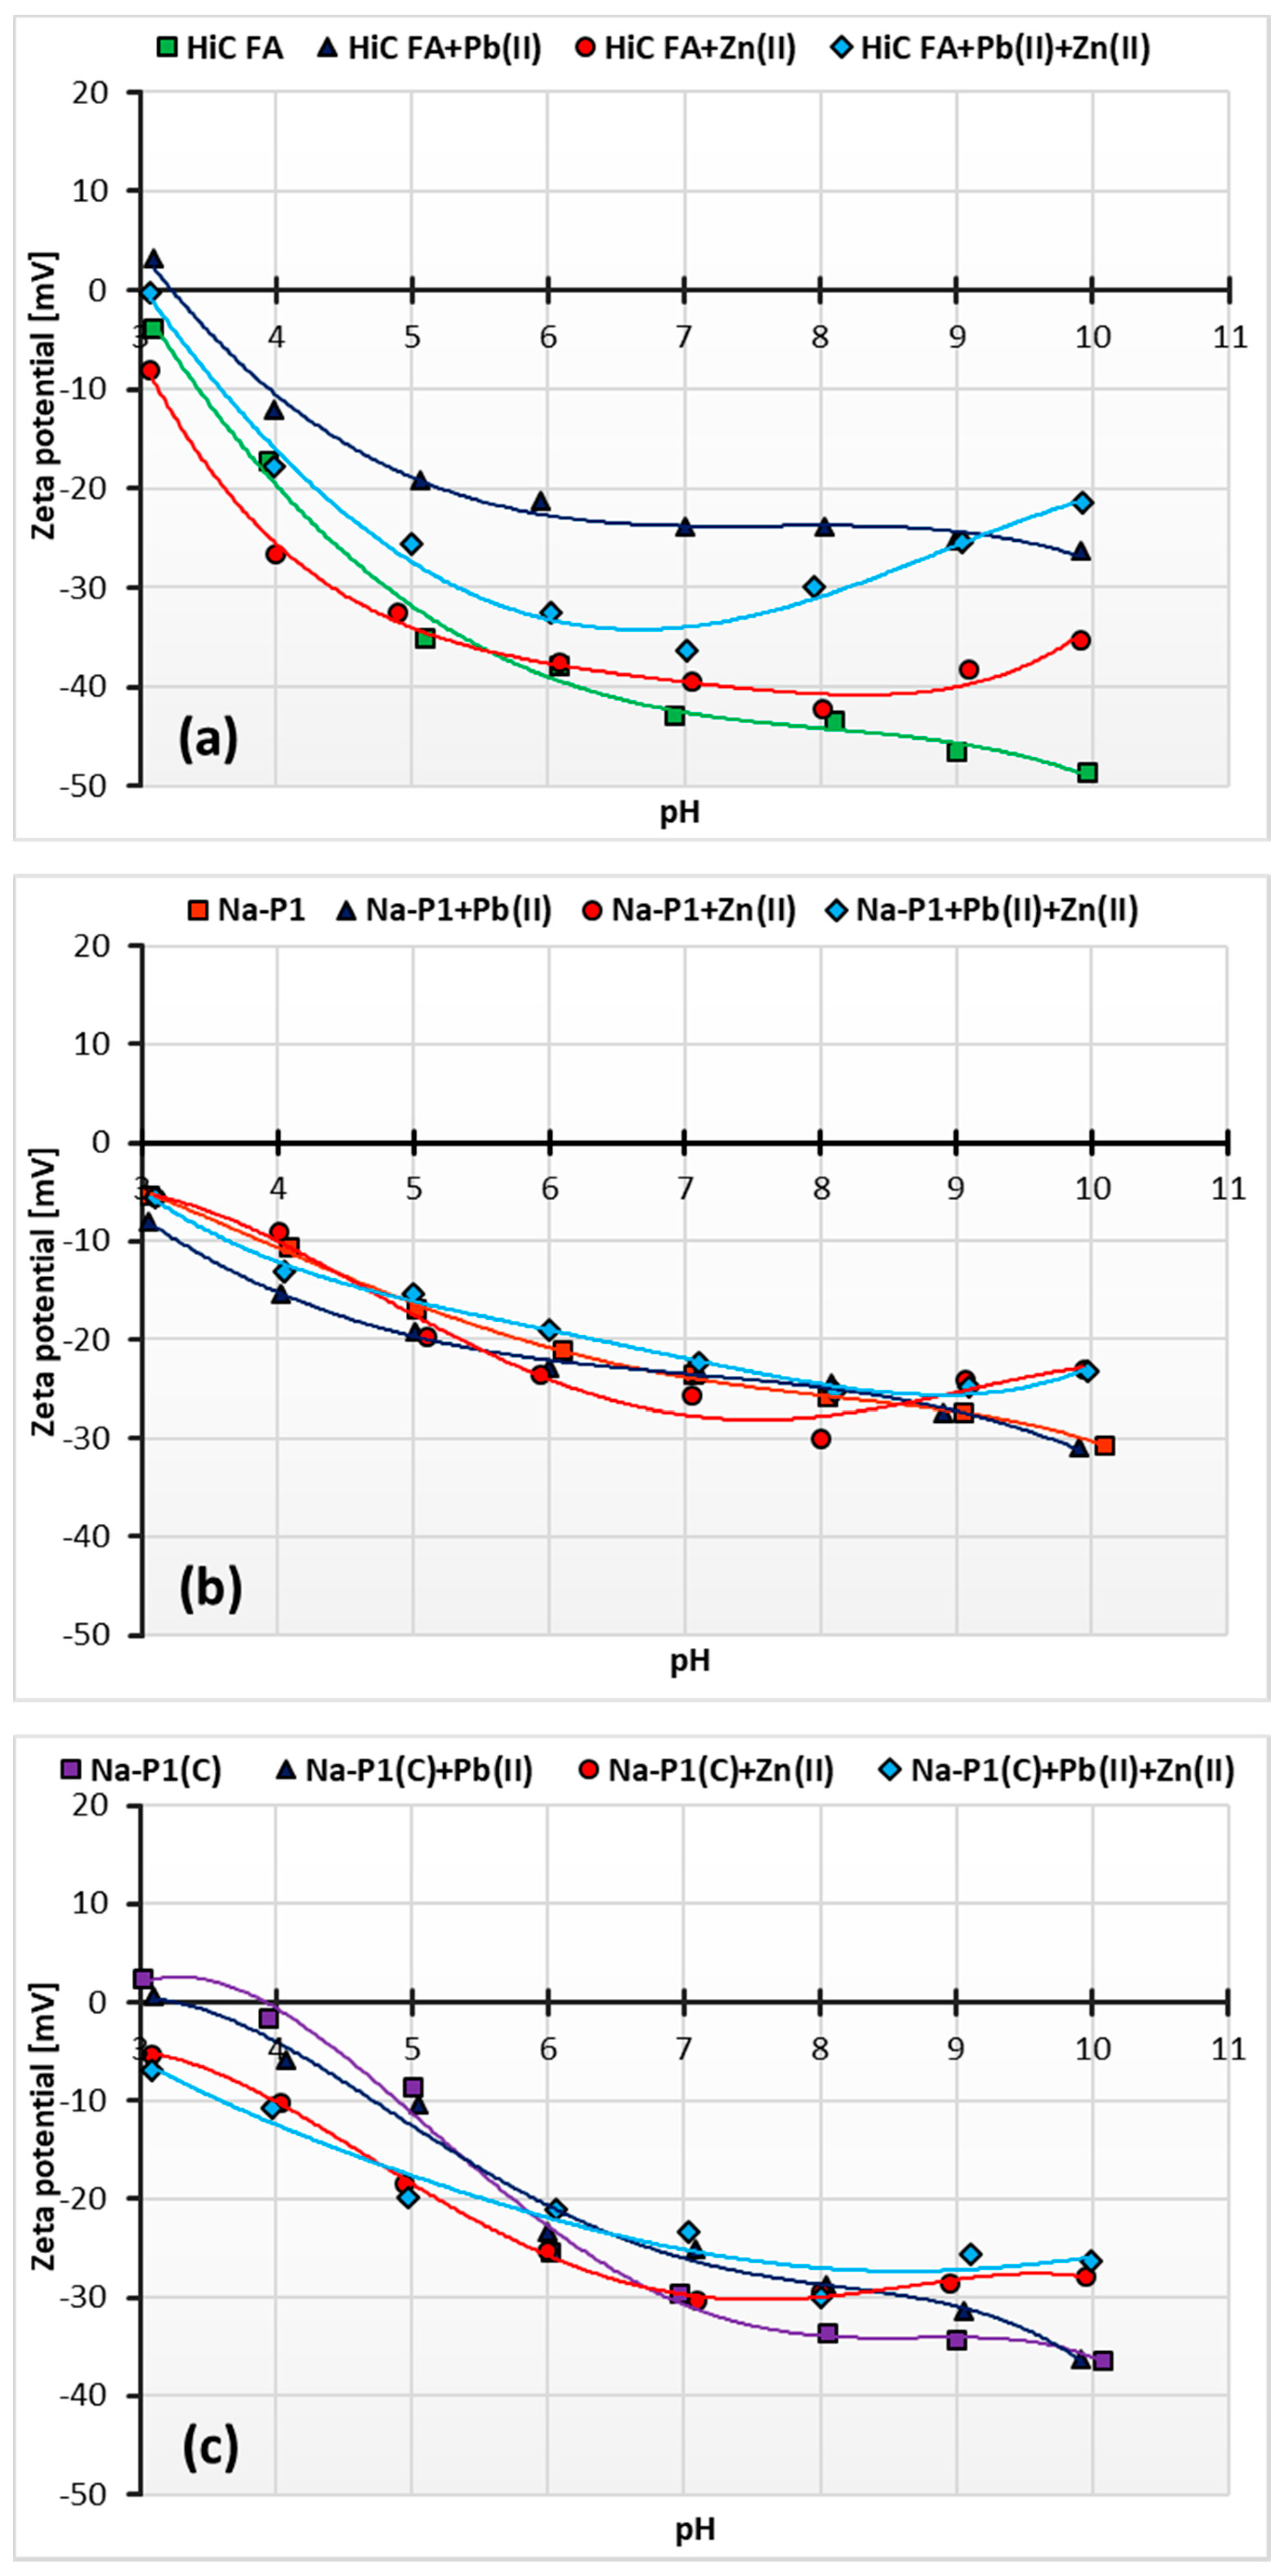
3.5. Changes in Zeta Potential of HiC FA, Na-P1 and Na-P1(C) Particles as a Result of Zn(II) and/or Pb(II) Adsorption
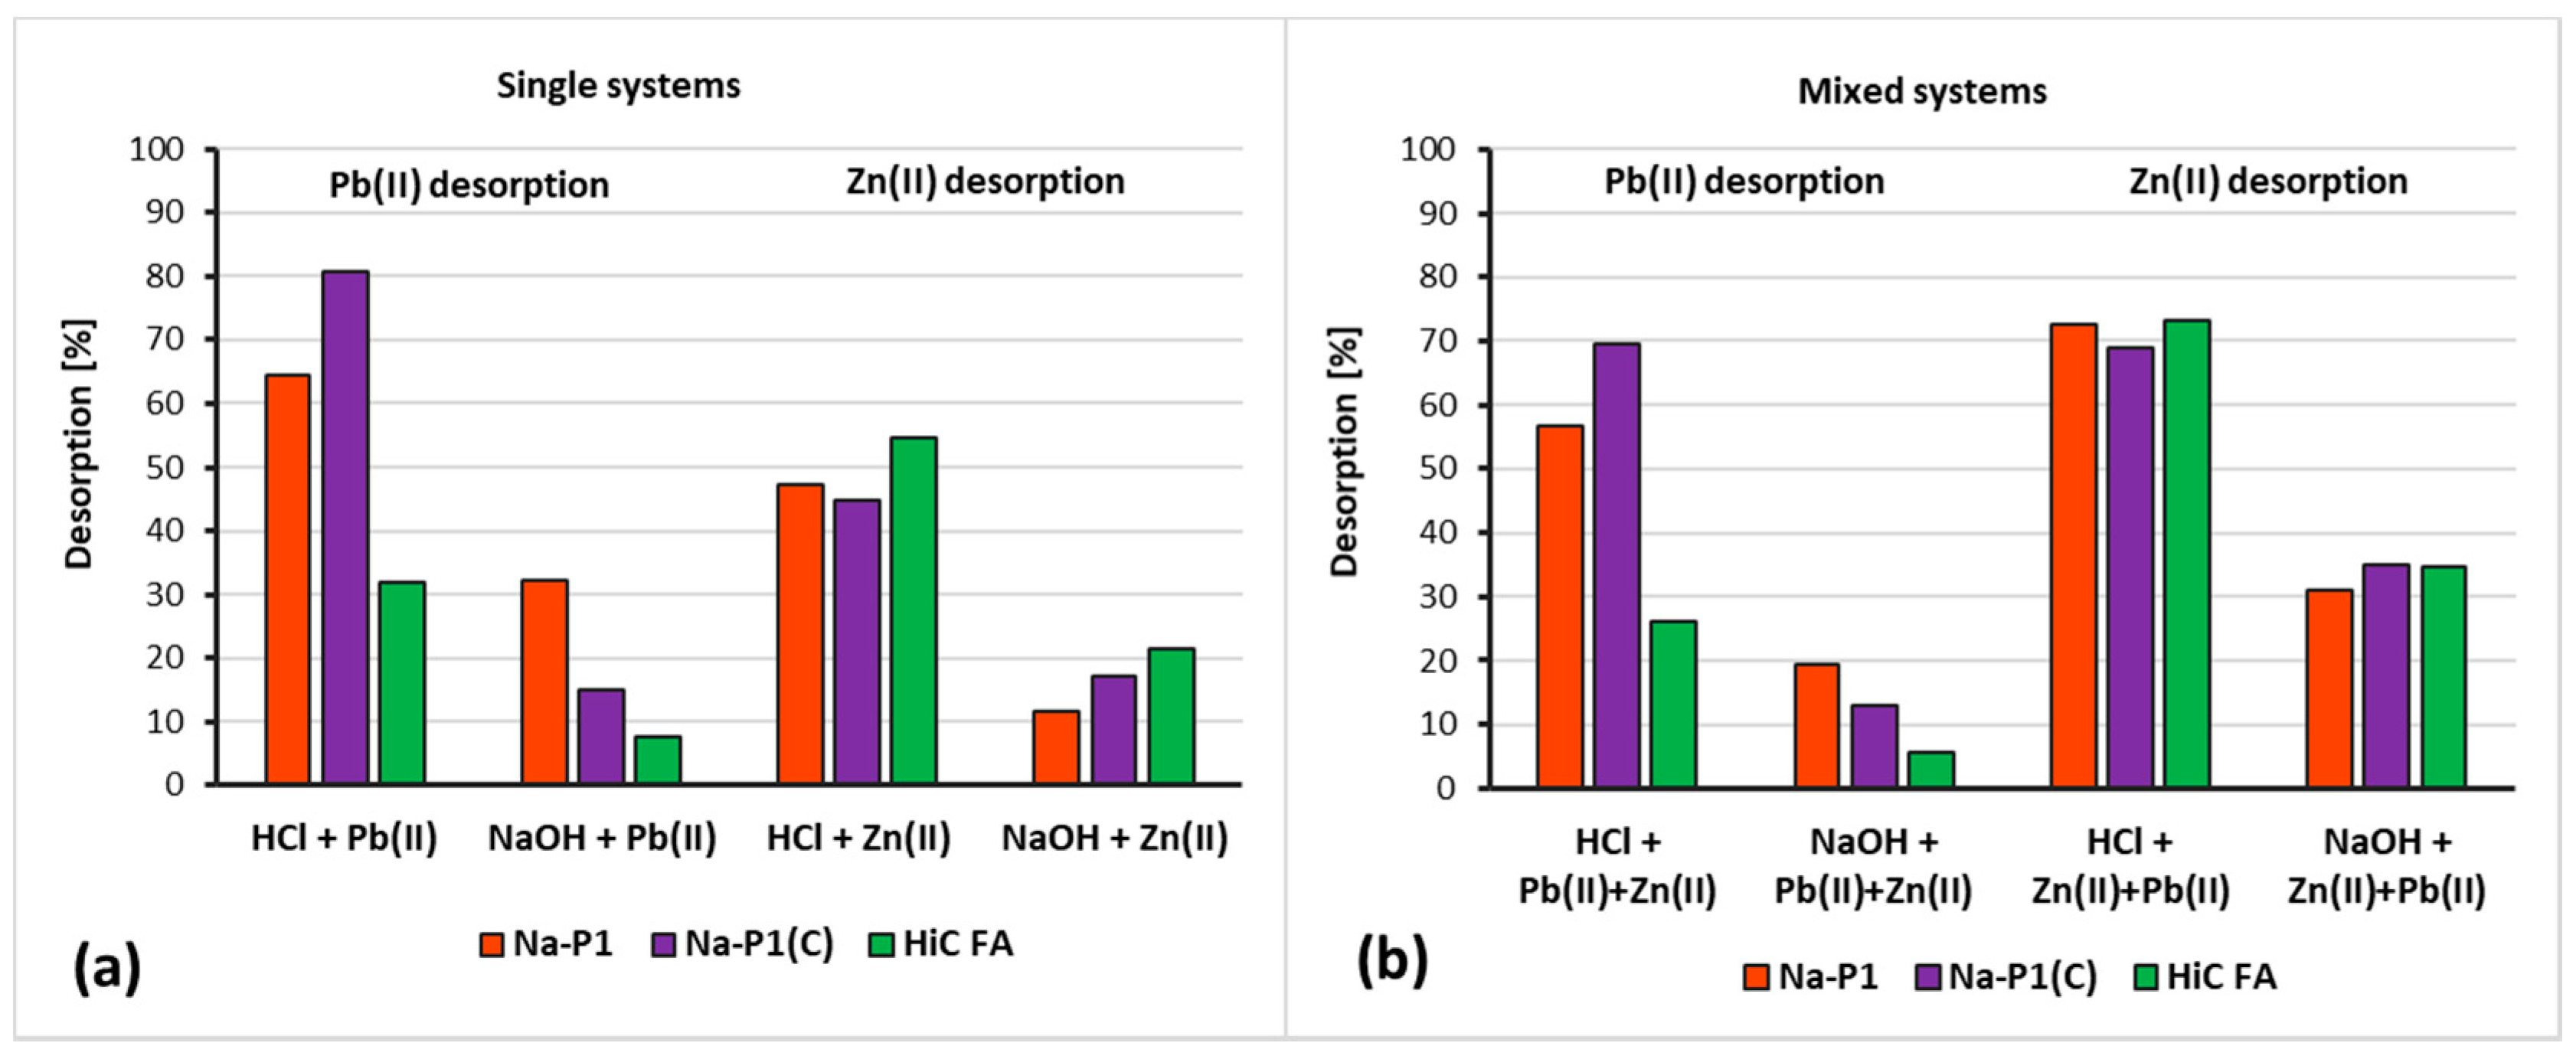
3.6. Desorption Degree of Zn(II) and Pb(II) from HiC FA, Na-P1 and Na-P1(C) Surfaces
4. Conclusions
Author Contributions
Funding
Institutional Review Board Statement
Informed Consent Statement
Data Availability Statement
Acknowledgments
Conflicts of Interest
References
- Liu, X.B.; Zhang, X.Y.; Wang, Y.X.; Sui, Y.Y.; Zhang, S.L.; Herbert, S.J.; Ding, G. Soil degradation: A problem threatening the sustainable development of agriculture in Northeast China. Plant Soil Environ. 2010, 56, 87–97. [Google Scholar] [CrossRef] [Green Version]
- Domagała-Świątkiewicz, I. The impact of agricultural activity on the natural environment. Environmental protection in the 21st century. In New Challenges and Threats; red. K. Wiecha i inni, Fundacja Na Rzecz Wspierania Badań Naukowych: Kraków, Poland, 2005; pp. 57–71. (In Polish) [Google Scholar]
- Louwagie, G.; Gay, S.H.; Sammeth, F.; Ratinger, T. The potential of European Union policies to address soil degradation in agriculture. Land Degrad. Dev. 2010, 22, 5–17. [Google Scholar] [CrossRef]
- Larney, F.J.; Angers, D.A. The role of organic amendments in soil reclamation: A review. Can. J. Soil Sci. 2012, 92, 19–38. [Google Scholar] [CrossRef]
- Szewczuk-Karpisz, K.; Tomczyk, A.; Komaniecka, I.; Choma, A.; Adamczuk, A.; Sofińska-Chmiel, W. Impact of Sinorhizobium meliloti Exopolysaccharide on Adsorption and Aggregation in the Copper(II) Ions/Supporting Electrolyte/Kaolinite System. Materials 2021, 14, 1950. [Google Scholar] [CrossRef] [PubMed]
- Karami, N.; Clemente, R.; Moreno-Jiménez, E.; Lepp, N.W.; Beesley, L. Efficiency of green waste compost and biochar soil amendments for reducing lead and copper mobility and uptake to ryegrass. J. Hazard. Mater. 2011, 191, 41–48. [Google Scholar] [CrossRef]
- Wang, R.; Shafi, M.; Ma, J.; Zhong, B.; Guo, J.; Hu, X.; Xu, W.; Yang, Y.; Ruan, Z.; Wang, Y.; et al. Effect of amendments on contaminated soil of multiple heavy metals and accumulation of heavy metals in plants. Environ. Sci. Pollut. Res. 2018, 25, 28695–28704. [Google Scholar] [CrossRef]
- Soudejani, H.T.; Kazemian, H.; Inglezakis, V.J.; Zorpas, A.A. Application of zeolites in organic waste composting: A review. Biocatal. Agric. Biotechnol. 2019, 22, 101396. [Google Scholar] [CrossRef]
- Gottardi, G.; Galli, E. Natural Zeolites; Springer: Berlin/Heidelberg, Germany, 1985; pp. 1–34. [Google Scholar]
- Inglezakis, V.J.; Zorpas, A.A. Handbook of Natural Zeolites; Bentham Science: Sharjah, United Arab Emirates, 2012; pp. 3–133. [Google Scholar]
- Ming, D.W.; Boettinger, J.L. Zeolites in Soil Environments. Rev. Miner. Geochem. 2001, 45, 323–345. [Google Scholar] [CrossRef]
- Hay, R.L.; Sheppard, R.A. Occurrence of Zeolites in Sedimentary Rocks: An Overview. Rev. Miner. Geochem. 2001, 45, 217–234. [Google Scholar] [CrossRef]
- Król, M. Natural vs. Synthetic Zeolites. Crystals 2020, 10, 622. [Google Scholar] [CrossRef]
- Bansiwal, A.K.; Rayalu, S.S.; Labhasetwar, N.K.; Juwarkar, A.A.; Devotta, S. Surfactant-Modified Zeolite as a Slow Release Fertilizer for Phosphorus. J. Agric. Food Chem. 2006, 54, 4773–4779. [Google Scholar] [CrossRef]
- Manikandan, A.; Subramanian, K.S. Fabrication and characterization of nanoporous zeolite based N fertilizer. Afr. J. Agric. Res. 2014, 9, 276–284. [Google Scholar]
- Flores, C.G.; Schneider, H.; Marcilio, N.R.; Ferret, L.; Oliveira, J.C.P. Potassic zeolites from Brazilian coal ash for use as a fertilizer in agriculture. Waste Manage. 2017, 70, 263–271. [Google Scholar] [CrossRef] [PubMed]
- Shi, W.; Shao, H.; Li, H.; Shao, M.; Du, S. Progress in the remediation of hazardous heavy metal-polluted soils by natural zeolite. J. Hazard. Mater. 2009, 170, 1–6. [Google Scholar] [CrossRef] [PubMed]
- Hudcová, B.; Osacký, M.; Vítková, M.; Mitzia, A.; Komáreka, M. Investigation of zinc binding properties onto natural and synthetic zeolites: Implications for soil remediation. Micropor. Mesopor. Mat. 2021, 317, 111022. [Google Scholar] [CrossRef]
- Moynier, F.; Pichat, S.; Pons, M.-L.; Fike, D.; Balter, V.; Albarède, F. Isotopic fractionation and transport mechanisms of Zn in plants. Chem. Geol. 2009, 267, 125–130. [Google Scholar] [CrossRef]
- Liu, J.; Dong, Y.; Xu, H.; Wang, D.; Xu, J. Accumulation of Cd, Pb and Zn by 19 wetland plant species in constructed wetland. Hazard. Mater. 2007, 147, 947–953. [Google Scholar] [CrossRef]
- Hui, L.; Feng, Z.; Jing, W.; Jianmin, Z.; Xiaohui, H.; Lai, C.; Pengfei, H.; Jian-ming, G.; Qiang, Z.; Sajid, B.; et al. Facile preparation of zeolite-activated carbon composite from coal gangue with enhanced adsorption performance. Chem. Eng. J. 2020, 390, 124513. [Google Scholar]
- Wanyonyi, F.S.; Fidelis, T.T.; Mutua, G.K.; Orata, F.; Pembere, A.M.S. Role of pore chemistry and topology in the heavy metal sorption by zeolites: From molecular simulation to machine learning, Comput. Mater. Sci. 2021, 195, 110519. [Google Scholar]
- Kragović, M.; Pašalić, S.; Marković, M.; Petrović, M.; Nedeljković, B.; Momčilović, M.; Stojmenović, M. Natural and Modified Zeolite—Alginate Composites. Application for Removal of Heavy Metal Cations from Contaminated Water Solutions. Minerals 2018, 8, 11. [Google Scholar] [CrossRef] [Green Version]
- Abdelrahman, E.A.; Abou El-Reash, Y.G.; Youssef, H.M.; Kotp, Y.H.; Hegazey, R.M. Utilization of rice husk and waste aluminum cans for the synthesis of some nanosized zeolite, zeolite/zeolite, and geopolymer/zeolite products for the efficient removal of Co(II), Cu(II), and Zn(II) ions from aqueous media. J. Hazard. Mater. 2020, 401, 123813. [Google Scholar] [CrossRef]
- Olegario, E.; Pelicano, C.M.; Felizco, J.C.; Mendoza, H. Thermal stability and heavy metal (As5+, Cu2+, Ni2+, Pb2+ and Zn2+) ions uptake of the natural zeolites from the Philippines. Mater. Res. Express 2019, 6, 085204. [Google Scholar] [CrossRef]
- Wiśniewska, M.; Szewczuk-Karpisz, K.; Ostolska, I.; Terpiłowski, K.; Sternik, D.; Zarko, V.; Gun’ko, V. Comparison of the Poly(vinyl alcohol) Adsorption Behaviour on the Mixed Oxides with Different Surface Structure. Mater. Sci. 2016, 22, 268–272. [Google Scholar] [CrossRef] [Green Version]
- Wiśniewska, M.; Chibowski, S.; Urban, T.; Fijałkowska, G.; Medykowska, M.; Bogatyrov, V.; Nosal-Wiercińska, A.; Klepka, T.; Szewczuk-Karpisz, K. Modification of Surface Properties of Colloidal Suspensions of NixOy-SiO2 Mixed Oxides with Different Ni Contents by the Adsorption Layers of Poly(Vinyl Alcohol). J. Clust. Sci. 2020. [Google Scholar] [CrossRef]
- Wiśniewska, M.; Fijałkowska, G.; Ostolska, I.; Franus, W.; Nosal-Wiercińska, A.; Tomaszewska, B.; Goscianska, J.; Wójcik, G. Investigations of the possibility of lithium acquisition from geothermal water using natural and synthetic zeolites applying poly(acrylic acid). J. Clean. Prod. 2018, 195, 821–830. [Google Scholar] [CrossRef]
- Panek, R.; Wdowin, M.; Bandura, L.; Wisła-Walsh, E.; Gara, P.; Franus, W. Changes in the textural parameters of fly ash-derived Na-P1 zeolite during compaction processes. Mineralogia 2017, 48, 3–22. [Google Scholar] [CrossRef] [Green Version]
- Wdowin, M.; Franus, M.; Panek, R.; Bandura, L.; Franus, W. The conversion technology of fly ash into zeolites. Clean Tech. Environ. Policy 2014, 16, 1217–1223. [Google Scholar] [CrossRef] [Green Version]
- Franus, W.; Wdowin, M.; Franus, M. Synthesis and characterization of zeolites prepared from industrial fly ash. Environ. Monit. Assess. 2014, 186, 5721–5729. [Google Scholar] [CrossRef] [Green Version]
- Bandura, L.; Panek, R.; Madej, J.; Franus, W. Synthesis of zeolite-carbon composites using high-carbon fly ash and their adsorption abilities towards petroleum substances. Fuel 2021, 283, 119173. [Google Scholar] [CrossRef]
- Sing, K.S.W.; Everett, D.H.; Haul, R.A.W.; Moscou, L.; Pierotti, R.A.; Rouquerol, J.; Siemieniewska, T. Reporting Physisorption Data For Gas/Solid Systems with Special Reference to the Determination of Surface Area and Porosity. Pure Appl. Chem. 1985, 57, 603–619. [Google Scholar] [CrossRef]
- Thommes, M.; Kaneko, K.; Neimark, A.V.; Olivier, J.P.; Rodriguez-Reinoso, F.; Jean Rouquerol, J.; Sing, K.S.W. Physisorption of gases, with special reference to the evaluation of surface area and pore size distribution (IUPAC Technical Report). Pure App. Chem. 2015, 87, 9–10. [Google Scholar] [CrossRef] [Green Version]
- Ościk, J. Adsorption; UMCS: Lublin, Poland, 1969; pp. 91–124. (In Polish) [Google Scholar]
- Foo, K.Y.; Hameed, B.H. Insights into the modeling of adsorption isotherm systems. Chem. Eng. J. 2010, 156, 2–10. [Google Scholar] [CrossRef]
- Ho, Y.S.; McKay, G. Sorption of dye from aqueous solution by peat. Chem. Eng. J. 1998, 70, 115–124. [Google Scholar] [CrossRef]
- Ho, Y.S.; McKay, G. Application of kinetics models to the sorption of copper(II) onto peat. Ads. Sci. Technol. 2002, 20, 797–815. [Google Scholar] [CrossRef]
- Homaeigohar, S.; Zillohu, A.U.; Abdelaziz, R.; Hedayati, M.K.; Elbahri, M. A novel nanohybrid nanofibrous adsorbent for water purification from dye pollutants. Materials 2016, 9, 848. [Google Scholar] [CrossRef] [PubMed] [Green Version]
- Homaeigohar, S.; Botcha, N.K.; Zarie, E.S.; Elbahri, M. Ups and downs of water photodecolorization by nanocomposite polymer nanofibers. Nanomaterials 2019, 9, 250. [Google Scholar] [CrossRef] [PubMed] [Green Version]
- Ho, Y. The kinetics of sorption of divalent metal ions onto sphagnum moss peat. Water Res. 2000, 34, 735–742. [Google Scholar] [CrossRef]
- Janusz, W. Electrical double layer at the metal oxide–electrolyte interface. In Interfacial Forces and Fields: Theory and Applications; Dekker, M., Ed.; CRC Press: New York, NY, USA, 1999; Volume 85, Chapter 4. [Google Scholar]
- Oshima, H. A simple expansion for Henry’s function for the retardation effect in electrophoresis of spherical colloidal particles. J. Colloid Interface Sci. 1994, 168, 269–271. [Google Scholar] [CrossRef]
- Lee, M.-G.; Yi, G.; Ahn, B.-J.; Roddick, F. Conversion of coal fly ash into zeolite and heavy metal removal characteristics of the products. Korean J. Chem. Eng. 2000, 17, 325–331. [Google Scholar] [CrossRef]
- Sahoo, T.R.; Prelot, B. Adsorption processes for the removal of contaminants from wastewater. Nanomater. Detect. Remov. Wastewater Pollut. 2020, 161–222. [Google Scholar] [CrossRef]
- Sahu, O.; Singh, N. Significance of bioadsorption process on textile industry wastewater. Impact Prospect. Green Chem. Text. Technol. 2019, 367–416. [Google Scholar] [CrossRef]
- Mu, T.-H.; Sun, H.-N. Sweet Potato Leaf Polyphenols: Preparation, Individual Phenolic Compound Composition and Antioxidant Activity. Polyphen. Plants 2019, 365–380. [Google Scholar] [CrossRef]
- Trochanowska, J.; Kowalczuk, P.B. Point of Zero Charge on the Surface of Cuprous Shale in An Aqueous Solution; Łupek Miedzionośny WGGG PWr: Wrocław, Poland, 2014; pp. 61–64. (In Polish) [Google Scholar]
- Wiśniewska, M.; Fijałkowska, G.; Szewczuk-Karpisz, K.; Teresa, U.; Nosal-Wiercińska, A.; Wójcik, G. Comparison of adsorption affinity of anionic and cationic polyacrylamides for montmorillonite surface in the presence of chromium(VI) ions. Adsorption 2019, 25, 41–50. [Google Scholar] [CrossRef] [Green Version]
- Belova, T.P. Adsorption of heavy metal ions (Cu2+, Ni2+, Co2+ and Fe2+) from aqueous solutions by natural zeolite. Heliyon 2019, 5, e02320. [Google Scholar] [CrossRef]
- Kats, A.M.; Nikashina, V.A.; Bychkova, Y.V. Sorption of heavy metals Ni, Cd, Cr, Zn, Cu from surface water on natural and modified clinoptilolite. J. Sorpt. Chromatogr. Proc. 2013, 13, 808–815. [Google Scholar]
- Visa, M.; Popa, N. Adsorption of heavy metals cations onto zeolite materials from aqueous solution. J. Membr. Sci. Technol. 2015, 5, 133. [Google Scholar]
- Taamneh, Y.; Sharadqah, S. The removal of heavy metals from aqueous solution using natural Jordanian zeolite. Appl. Water Sci. 2017, 7, 2021–2028. [Google Scholar] [CrossRef] [Green Version]
- Sadek, R.; Chałupka, K.; Dźwigaj, S. Application and synthesis of zeolite materials. Eliksir 2015, 2, 36–39. (In Polish) [Google Scholar]
- Gulicovski, J.J.; Čerović, L.S.; Milonjić, S.K. Point of Zero Charge and Isoelectric Point of Alumina. Mater. Manuf. Process. 2008, 23, 615–619. [Google Scholar] [CrossRef]
- Bajpai, P. Colloid and Surface Chemistry. In Biermann’s Handbook of Pulp and Paper; Elsevier: Amsterdam, The Netherlands, 2018; pp. 381–400. [Google Scholar]
- Lament, K. Study on the Mechanism of Adsorption of Ca2+ and Fe2+ Cations on Metal Oxides Using An Ion-Selective Electrode and A Combined Platinum Electrode; Maria Curie-Skłodowska University: Lublin, Poland, 2021; pp. 97–102. (In Polish) [Google Scholar]


| Compounds | ||||||||||||
|---|---|---|---|---|---|---|---|---|---|---|---|---|
| Na2O | MgO | Al2O3 | SiO2 | P2O5 | SO3 | K2O | CaO | TiO2 | Fe2O3 | LOI | C | |
| HiC FA | 0.61 | 1.52 | 14.11 | 29.72 | 0.32 | 1.16 | 2.28 | 3.67 | 0.95 | 8.82 | 36.82 | 29.65 |
| Na-P1(C) | 3.77 | 1.19 | 10.07 | 18.05 | 0.04 | 0.53 | 0.42 | 2.17 | 0.91 | 9.12 | 53.73 | 44.49 |
| Na-P1 | 8.11 | nd * | 18.05 | 49.38 | nd * | nd * | 5.57 | 0.31 | 0.06 | 0.51 | 17.37 | nd * |
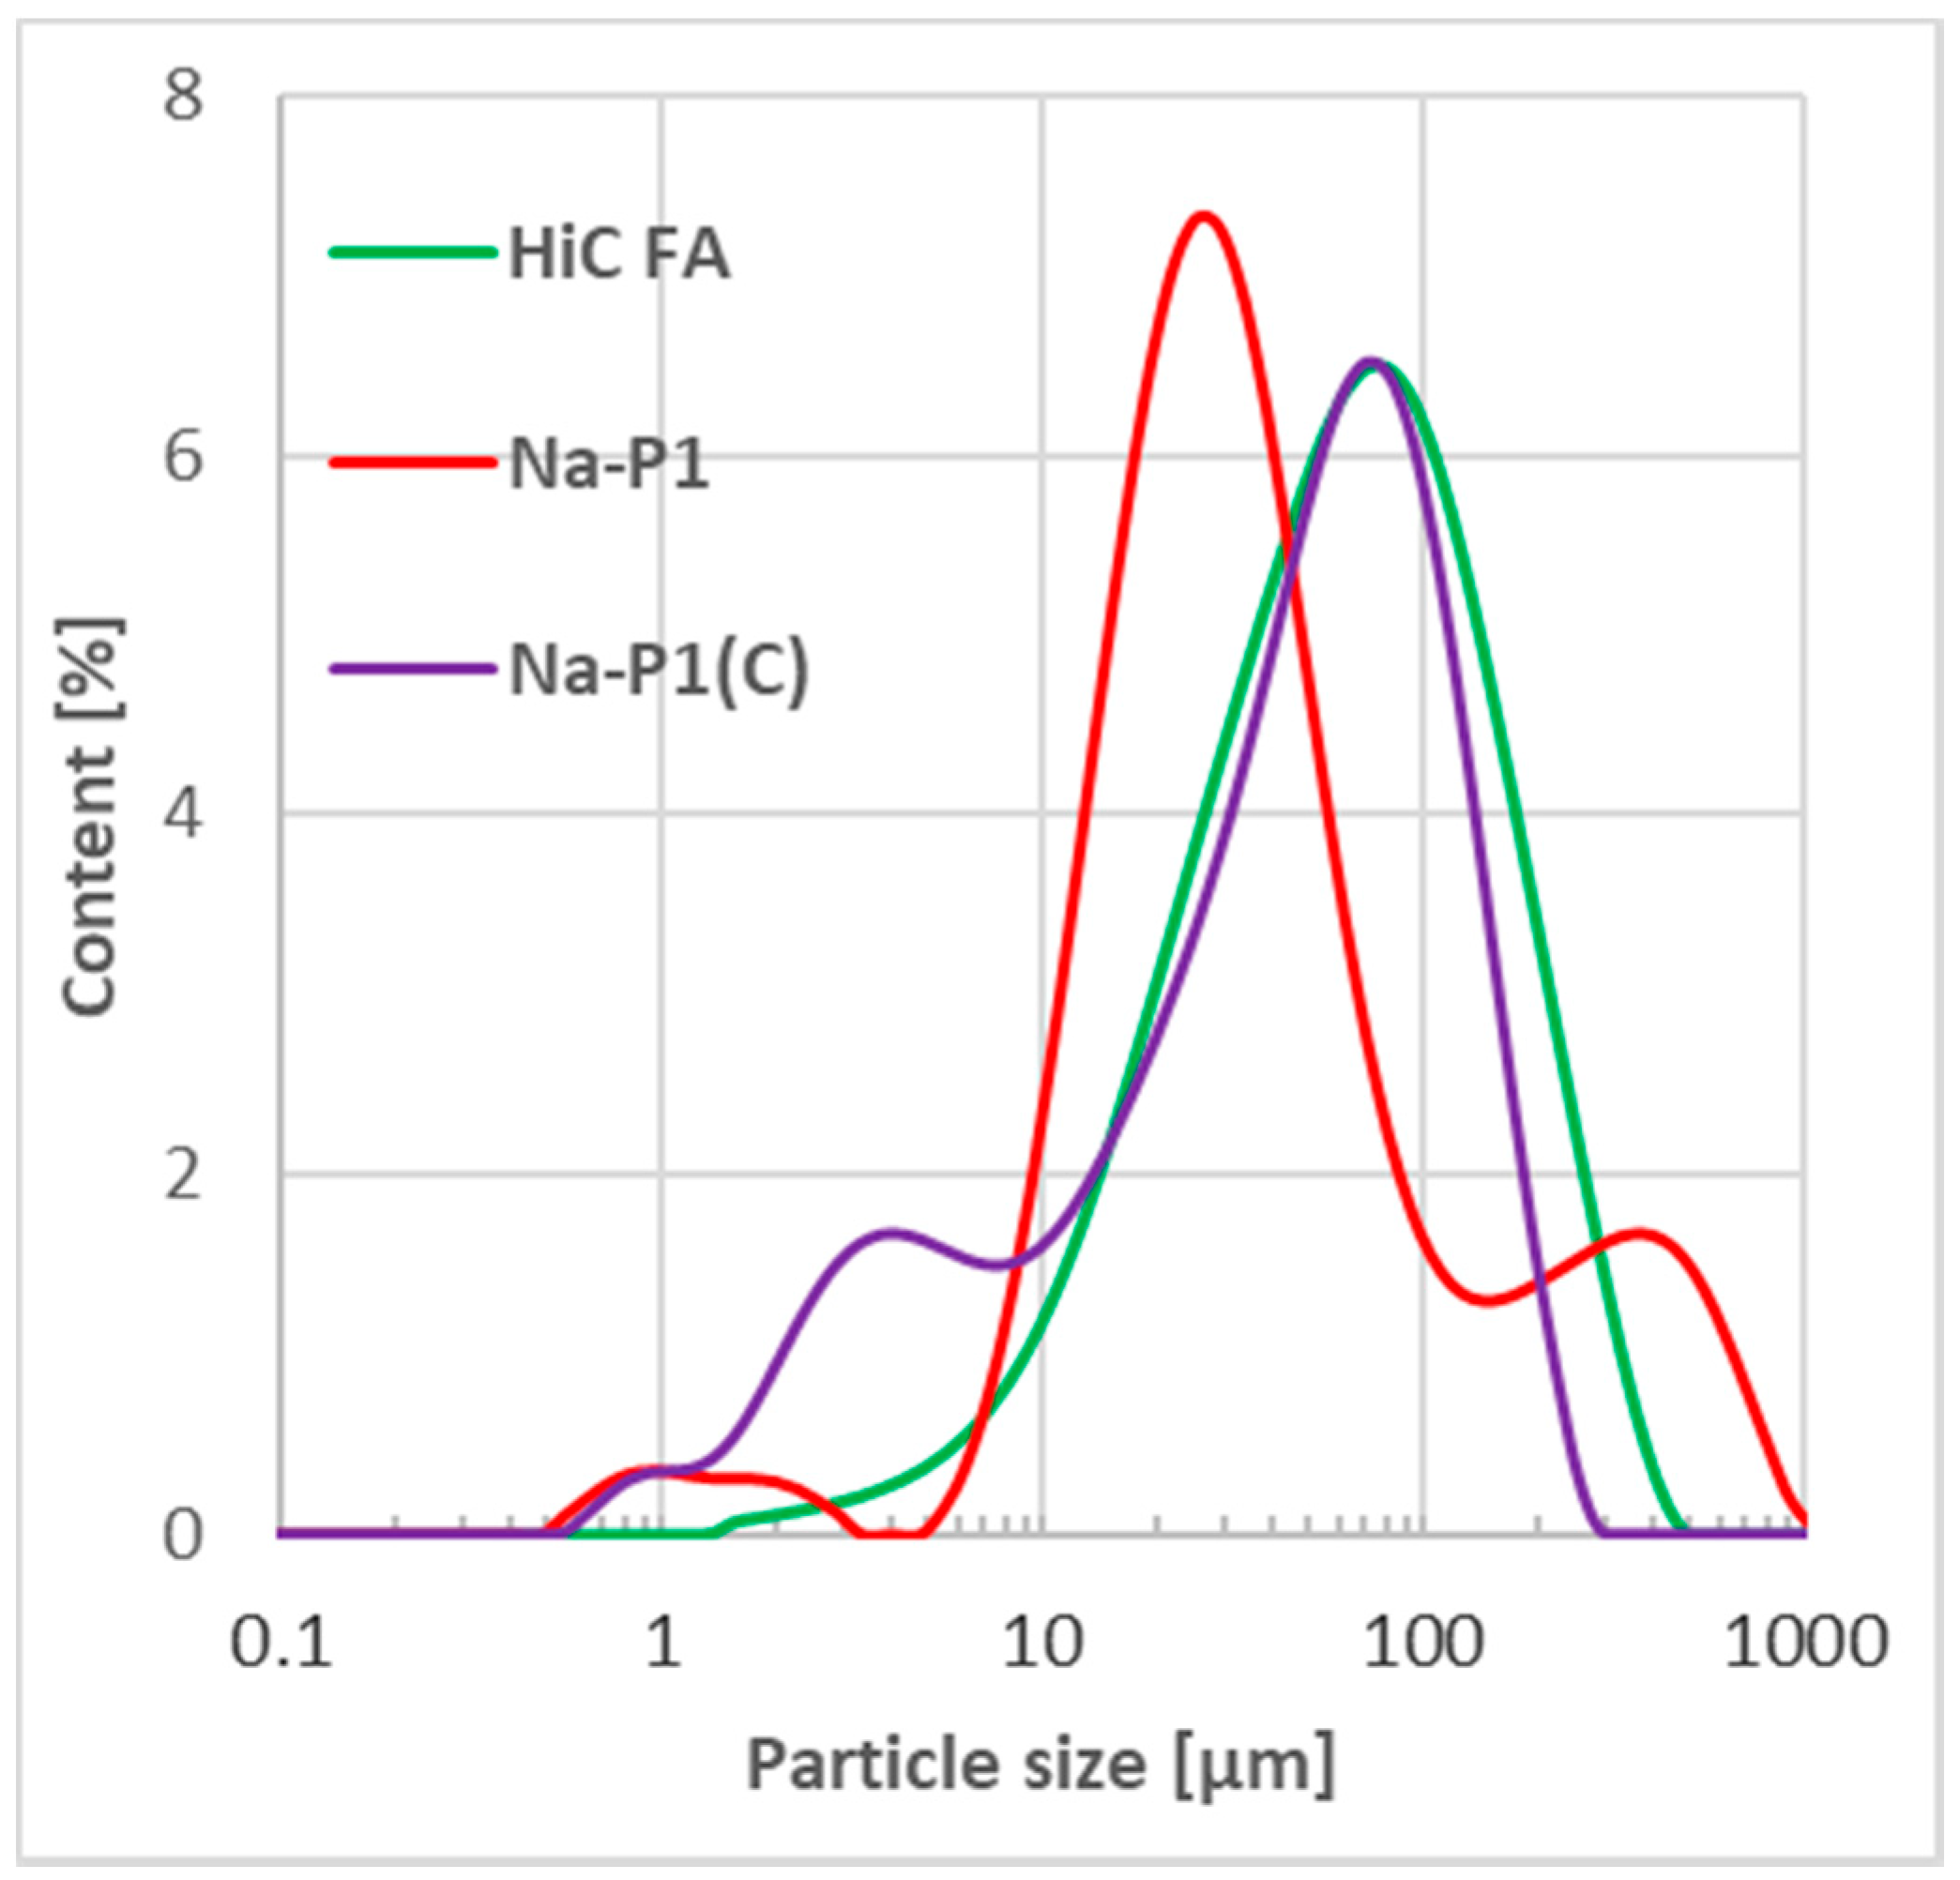
| Fraction [µm] | HiC FA | Na-P1 | Na-P1(C) |
|---|---|---|---|
| [%] | |||
| 0.01–2 | 0.18 | 2.57 | 3.16 |
| 2–20 | 13.69 | 25.23 | 25.28 |
| 20–50 | 27.02 | 39.56 | 24.65 |
| 50–100 | 28.64 | 13.29 | 28.41 |
| 100–250 | 26.41 | 8.34 | 18.34 |
| 250–500 | 4.05 | 7.34 | 0.17 |
| 500–1000 | 0 | 3.64 | 0 |
| 1000–2000 | 0 | 0.04 | 0 |
| Adsorbent | SBET [m2/g] | Smicro [m2/g] | Vt [cm3/g] | Vmicro [cm3/g] | D (4 V/A) [nm] |
|---|---|---|---|---|---|
| HiC FA | 46.19 | 10.72 | 0.064 | 0.0060 | 5.66 |
| Na-P1 | 26.71 | 4.30 | 0.05 | 0.0017 | 6.93 |
| Na-P1(C) | 69.85 | 16.90 | 0.12 | 0.0070 | 6.75 |
| System | Pseudo-Second-Order Model | |||
|---|---|---|---|---|
| qe [mg/g] | k2 [g/(mg·min)] | R2 | ||
| Pb(II) | Na-P1 | 322.581 | 0.0004 | 0.997 |
| Na-P1(C) | 212.766 | 0.0004 | 0.997 | |
| HCFA | 129.870 | 0.0001 | 0.959 | |
| Zn(II) | Na-P1 | 32.362 | 0.0023 | 0.996 |
| Na-P1(C) | 30.030 | 0.0019 | 0.998 | |
| HCFA | 19.083 | 0.0011 | 0.940 | |
| System | Langmuir model | |||
| qm [mg/g] | KL [dm3/mg] | R2 | ||
| Pb(II) | Na-P1 | 432.572 | 3.755 | 0.999 |
| Na-P1(C) | 236.661 | 0.248 | 0.978 | |
| HCFA | 76.548 | 2.911 | 0.988 | |
| Zn(II) | Na-P1 | 144.062 | 0.053 | 0.980 |
| Na-P1(C) | 156.988 | 0.014 | 0.962 | |
| HCFA | 142.192 | 0.007 | 0.860 | |
| Solid | Na-P1 | Na-P1(C) | HiC FA |
|---|---|---|---|
| Without adsorbates | 9.6 | 8.8 | 9.5 |
| With Pb(II) | 9.1 | 8.5 | 9.2 |
| With Zn(II) | 9.0 | 8.4 | 9.0 |
| With Pb(II) + Zn(II) | 8.6 | 8.3 | 8.6 |
| Solid | Na-P1 | Na-P1(C) | HiC FA |
|---|---|---|---|
| Without adsorbates | - | 4.0 | - |
| With Pb(II) | - | 3.2 | 3.2 |
| With Zn(II) | - | - | - |
| With Pb(II) + Zn(II) | - | - | 3.0 |
Publisher’s Note: MDPI stays neutral with regard to jurisdictional claims in published maps and institutional affiliations. |
© 2021 by the authors. Licensee MDPI, Basel, Switzerland. This article is an open access article distributed under the terms and conditions of the Creative Commons Attribution (CC BY) license (https://creativecommons.org/licenses/by/4.0/).
Share and Cite
Panek, R.; Medykowska, M.; Szewczuk-Karpisz, K.; Wiśniewska, M. Comparison of Physicochemical Properties of Fly Ash Precursor, Na-P1(C) Zeolite–Carbon Composite and Na-P1 Zeolite—Adsorption Affinity to Divalent Pb and Zn Cations. Materials 2021, 14, 3018. https://0-doi-org.brum.beds.ac.uk/10.3390/ma14113018
Panek R, Medykowska M, Szewczuk-Karpisz K, Wiśniewska M. Comparison of Physicochemical Properties of Fly Ash Precursor, Na-P1(C) Zeolite–Carbon Composite and Na-P1 Zeolite—Adsorption Affinity to Divalent Pb and Zn Cations. Materials. 2021; 14(11):3018. https://0-doi-org.brum.beds.ac.uk/10.3390/ma14113018
Chicago/Turabian StylePanek, Rafał, Magdalena Medykowska, Katarzyna Szewczuk-Karpisz, and Małgorzata Wiśniewska. 2021. "Comparison of Physicochemical Properties of Fly Ash Precursor, Na-P1(C) Zeolite–Carbon Composite and Na-P1 Zeolite—Adsorption Affinity to Divalent Pb and Zn Cations" Materials 14, no. 11: 3018. https://0-doi-org.brum.beds.ac.uk/10.3390/ma14113018