1. Introduction
Nickel-based alloys are the most used alloys in the aerospace industry and its components as they can offer a higher chemical resistance, mechanical strength, and thermal conductivity compared to steels, for example [
1,
2]. Moreover, a great opportunity has arisen to produce parts for the aerospace sector with advanced performances made of nickel-based superalloys [
3]. However, the manufacturing of parts from nickel-based superalloys currently represents a challenging task for industrial sites [
4].
Due to their excellent properties, these superalloys are very difficult to machine conventionally and the final surface integrity of a machined component can be affected [
2,
5,
6].
In particular, the conventional drilling process of effusion cooling holes in a combustion chamber made of Ni-based alloys has reached its technological and economical limits. Nonconventional machining technology, such as laser beam drilling, could therefore be a cost-effective alternative for these materials and will be more important in the future [
7].
When speaking of conventional machining processes, the research performed by Pusavec et al. [
8,
9] using the Inconel 718 alloys revealed that the application of MQL (Minimum Quantity Lubrication) can reduce the cutting forces, tool wear, and chip breakability and can increase productivity. In fact, this observation is not a sufficient argument for the possibility of comparing the drilling efficiency with a laser.
When taking into consideration the fact that thousands of effusion cooling holes are drilled on to the combustion chamber with a very thin wall, conventional drilling by a drilling tool would be inefficient, uneconomical, very time-consuming, and maybe even impossible.
The Electrical Discharge Machining (EDM) process has also been used for the machining of features onto aerospace components [
10,
11,
12,
13,
14]. The new strategy in EDM milling allows the machining of complex geometries by using a standard cylindrical shape rotary electrode, which is used for the machining of complex shaped diffusors in Inconel 718 turbine blades. This manufacturing strategy was researched by Kliuev et al. [
15]. The proposed strategy offers a 15% higher productivity in comparison to the layer-by-layer machining strategy. Another manuscript deals with the use of modern EDM drilling machines for drilling cooling holes and diffusers in turbine blades. Kliuev et al. have published studies that have shown where the material removal rate reached 77 mm
3/min, the relative tool wear was reduced to 20%, the average recast layer thickness was reduced to 8 μm, and the roughness Sa of the internal surface was less than 1 µm. The EDM process is available for combination high-speed cutting with relatively low recast layer thickness and with very good surface quality [
16]. In the future, aero engines will typically have an excess of 150,000 cooling holes [
17]. This is very important for the research and development of the optimalization technology process. This manuscript is interesting as it contains a study of high-speed hole drilling with a diameter of 0.8 mm [
17]. It is important that EDM technology has very good precision. Zou has presented research about the precision of EDM of a micron-scale diameter hole array using in-process wire electro-discharge grinding high-aspect-ratio microelectrodes. To improve machining accuracy, an in-process touch-measurement compensation strategy was applied to reduce the cumulative compensation error of the micro-EDM process [
18]. However, due to reasons that also apply to the conventional drilling method, the EDM method is not comparable with laser beam machining due to the cycle time of the drilling process itself.
Laser beam drilling is currently widely used for various aerospace applications where high dimensional accuracy and hole quality are required [
19,
20,
21,
22,
23]. This process is especially suitable for processing difficult-to-machine alloys by conventional machining processes [
24]. In addition, a large number of holes can be produced by laser drilling in a non-contact manner (as opposed to conventional drilling methods). However, the process also has certain defects associated with the resulting drilled hole geometry [
25,
26] and material microstructure [
17,
27,
28,
29,
30,
31,
32]. These are mainly heat affected areas, recast layers and microcracks in the base material, which are considered to be undesirable effects. In the real production process, it is recommended to minimize them. The residual stress and finite element method and an experimental analysis of residual stress and elevated temperature are also important [
33].
Previous studies have already shown that for the laser drilling process, parameters such as pulse energy, pulse width, and pulse frequency are the most influential—all of these increase the recast layer thickness and lead to the formation of microcracks, as investigated by Morar et al [
34].
In terms of the future, there are many opportunities that could focus on the field of Additive Manufacturing (AM) adoption as an advanced manufacturing technology for this kind of aerospace product. However, first there are many challenges in the field of AM which need to be investigated, such as the distortion, fatigue, defects, and residual stress of the manufactured parts [
35].
For the Inconel 718 material, the influences of input laser energy density on densification behavior, phases composition, microstructures, microhardness, and wear performance of the AM as-built samples were explored by Liu et al [
36].
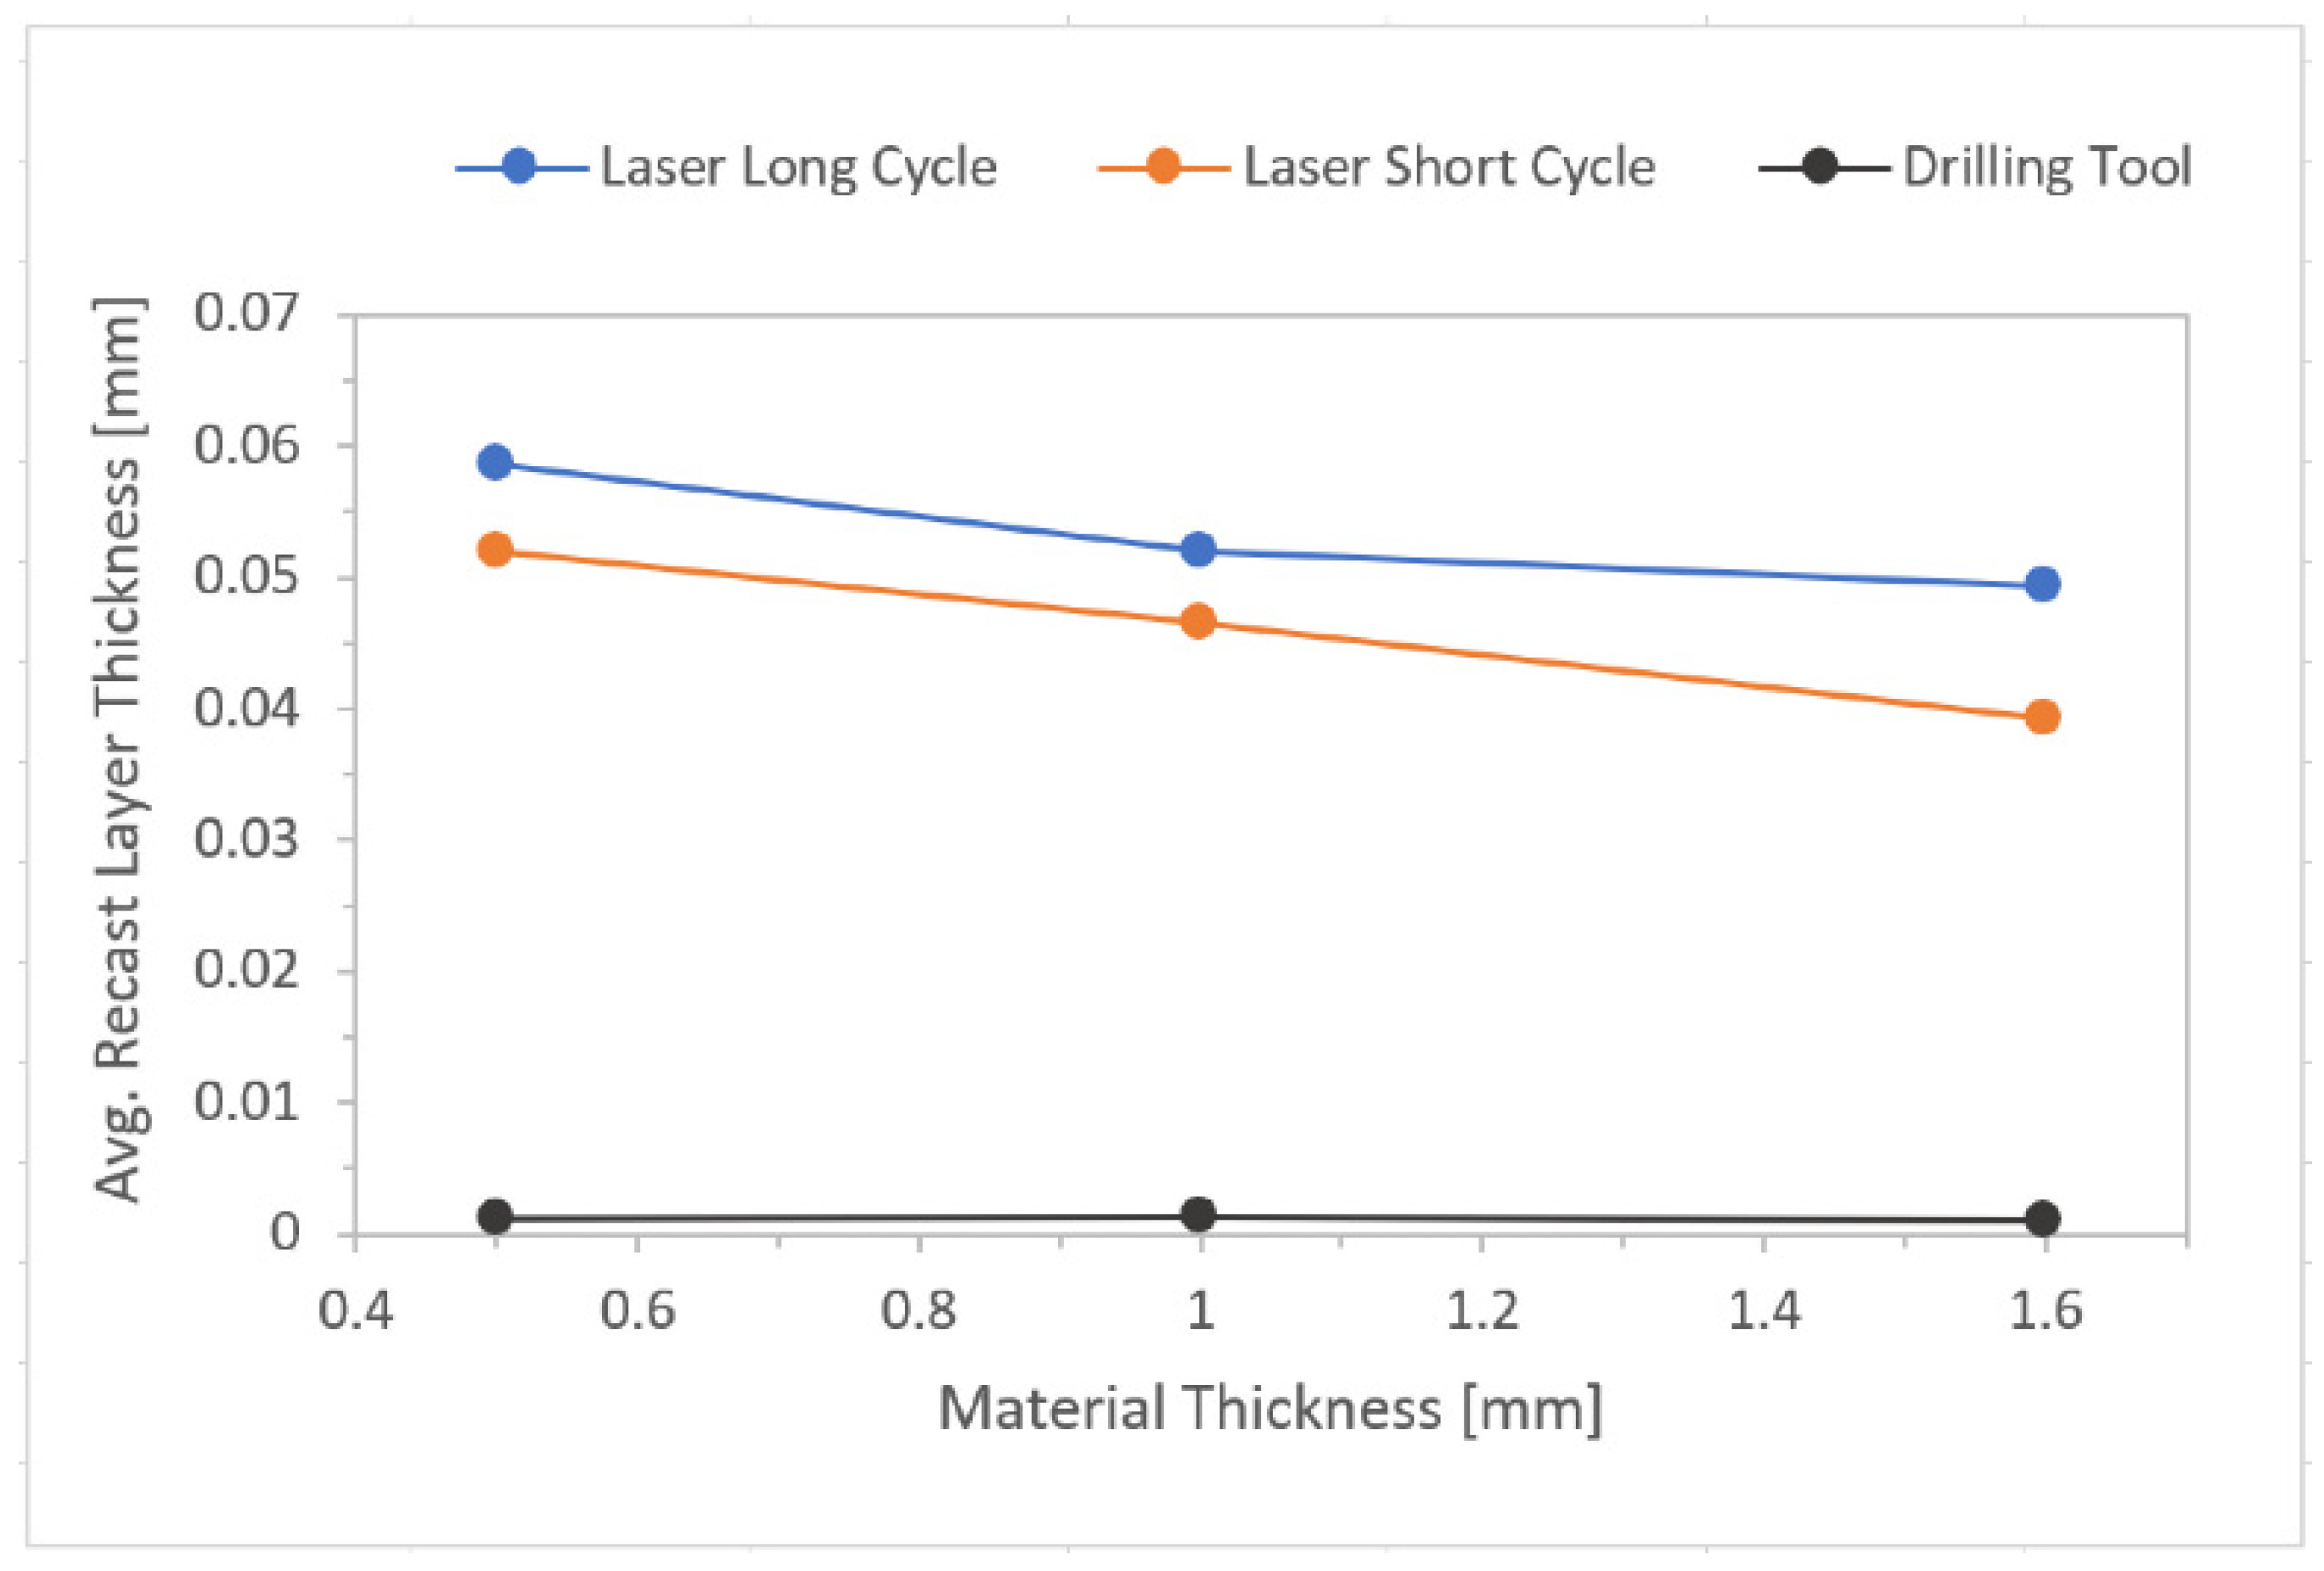
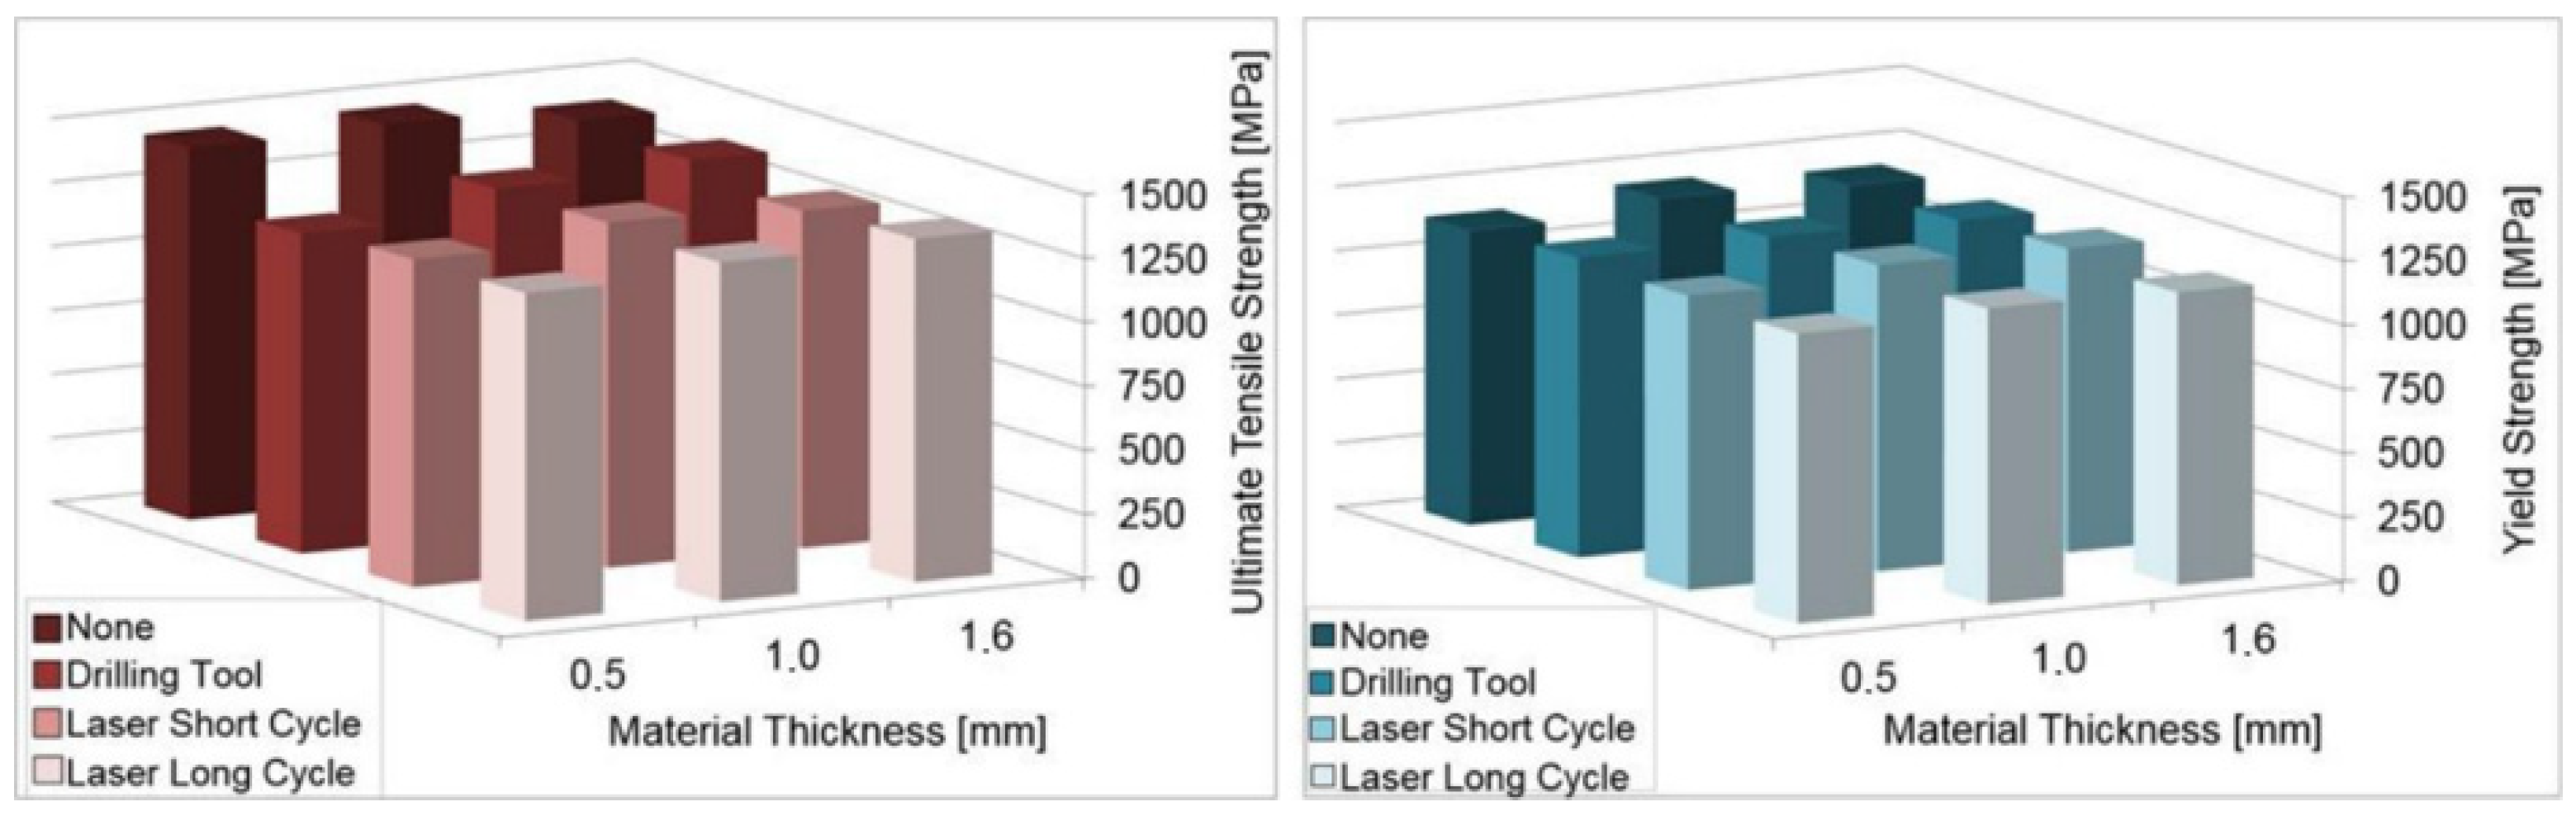
This investigation has been performed with the purpose to describe the harmful effects, if there are any, of the laser beam drilling method when used in the processing of aerospace applications. It is known that during the process, the recast layer of the material is created and it adheres to the machined surface. In addition, the recast layer is known as a crack-into-the-base-metal initiator and so it was expected that the mechanical properties would be adversely affected as a result of this phenomenon. This was confirmed. This result is compared to conventional drilling by a drilling tool, where the recast layer is not expected to be observed and the mechanical properties of the base material should not be affected so significantly.
In the first section of this article, the specifics of laser drilled holes and the effects on the base materials are mentioned. The second section describes all the properties of the experimental samples, their processing, and the laser machine used in the experiment. The evaluation methodology, the achieved results, the equipment and the software used are given in section three of this article. The final discussion and all the conclusions obtained can be found at the end of the article.
1.1. Hole Shape Deformations
A typical shape deformation of a drilled hole by a laser is a taper [
37]. The taper of the hole can be eliminated by optimal values of laser drilling parameters, but this will always depend on the material and the thickness to be drilled [
38,
39].
The taper of the drilled holes is caused by the removal of molten and vaporized material away from the hole. The percussion drilling strategy, used in this experiment, (several consecutive pulses, in a short time, that gradually create a drilled hole) is a complex process with a large number of variables. However, in general, a shorter pulse width means a more significant taper. On the other hand, the degree of the taper decreases with the increasing thickness of the drilled material.
Manufacturing processes, including laser drilling, used to drill effusion cooling holes on gas turbine engines currently, can result in some geometric deviations (e.g., conical angles, filleted edges, diameter deviations, etc.). This can reduce the cooling effectiveness, heat transfer performance, and aerodynamic characteristics of the final products [
40].
The potential geometric deviations by laser drilling techniques were gathered by Bunker [
41] and the report [
42] was from PRIMA North America, Inc. It was pointed out that the statistical data of effusion cooling holes are subjected to a Gaussian distribution, even if the most advanced laser drilling techniques are used.
Outside the area in which the hole shape deformations are located, the efficiency of the engine is also dependent on other factors.
1.2. Recast Layer Formation
The formation of the recast layer (thickness in the order of μm) is one of the accompanying undesirable effects, which is influenced by the resulting state of the machined material. Due to the high surface energy density of the laser beam absorbed by the material and the fact that its energy is converted into heat, the surface melts and solidifies very quickly when the laser radiation ceases to act on the area of the material being machined [
43]. A recast layer then forms on the surface when heat dissipates [
44]. The newly formed microstructure of the recast layer has an amorphous (glassy) character. It is characterized by high hardness and brittleness and is therefore prone to cracking. The cracks spread along the least resistant path—along the grain boundaries. Cracks can then have a significant negative impact on the fatigue strength of aircraft engine components while reducing their durability and safety [
45].
After the interaction with the laser beam, the material is affected in three layers. There is an oxide layer on the surface, which can be partially eliminated by the process gas (inert gases) used. This is followed by a recast layer of the base material which has solidified again on the surface to be treated and contains oxidic inclusions. Between the recast layer and the unaffected base material, there is a heat affected zone (HAZ) of the base material. Previously, Sezer et al. [
46,
47] experimentally observed a larger HAZ on the leading edge side and a larger recast layer on the trailing edge side of the hole.
The thickness of the recast layer can be reduced by the appropriate selection of process parameters. However, it is considered that a tiny layer will almost always occur on the machined material and its formation cannot be completely prevented due to the inevitable influence of the material with a huge amount of surface energy density. Nevertheless, these small volumes are unimportant to the technical practice because they do not initiate microcracks into the base material.
In practice, it is highly recommended, if possible, to remove the recast layer from the surface of the machined material by one of the machining methods that does not generate a recast layer, or any other process such as heat treatment (applicable in some specific cases only).
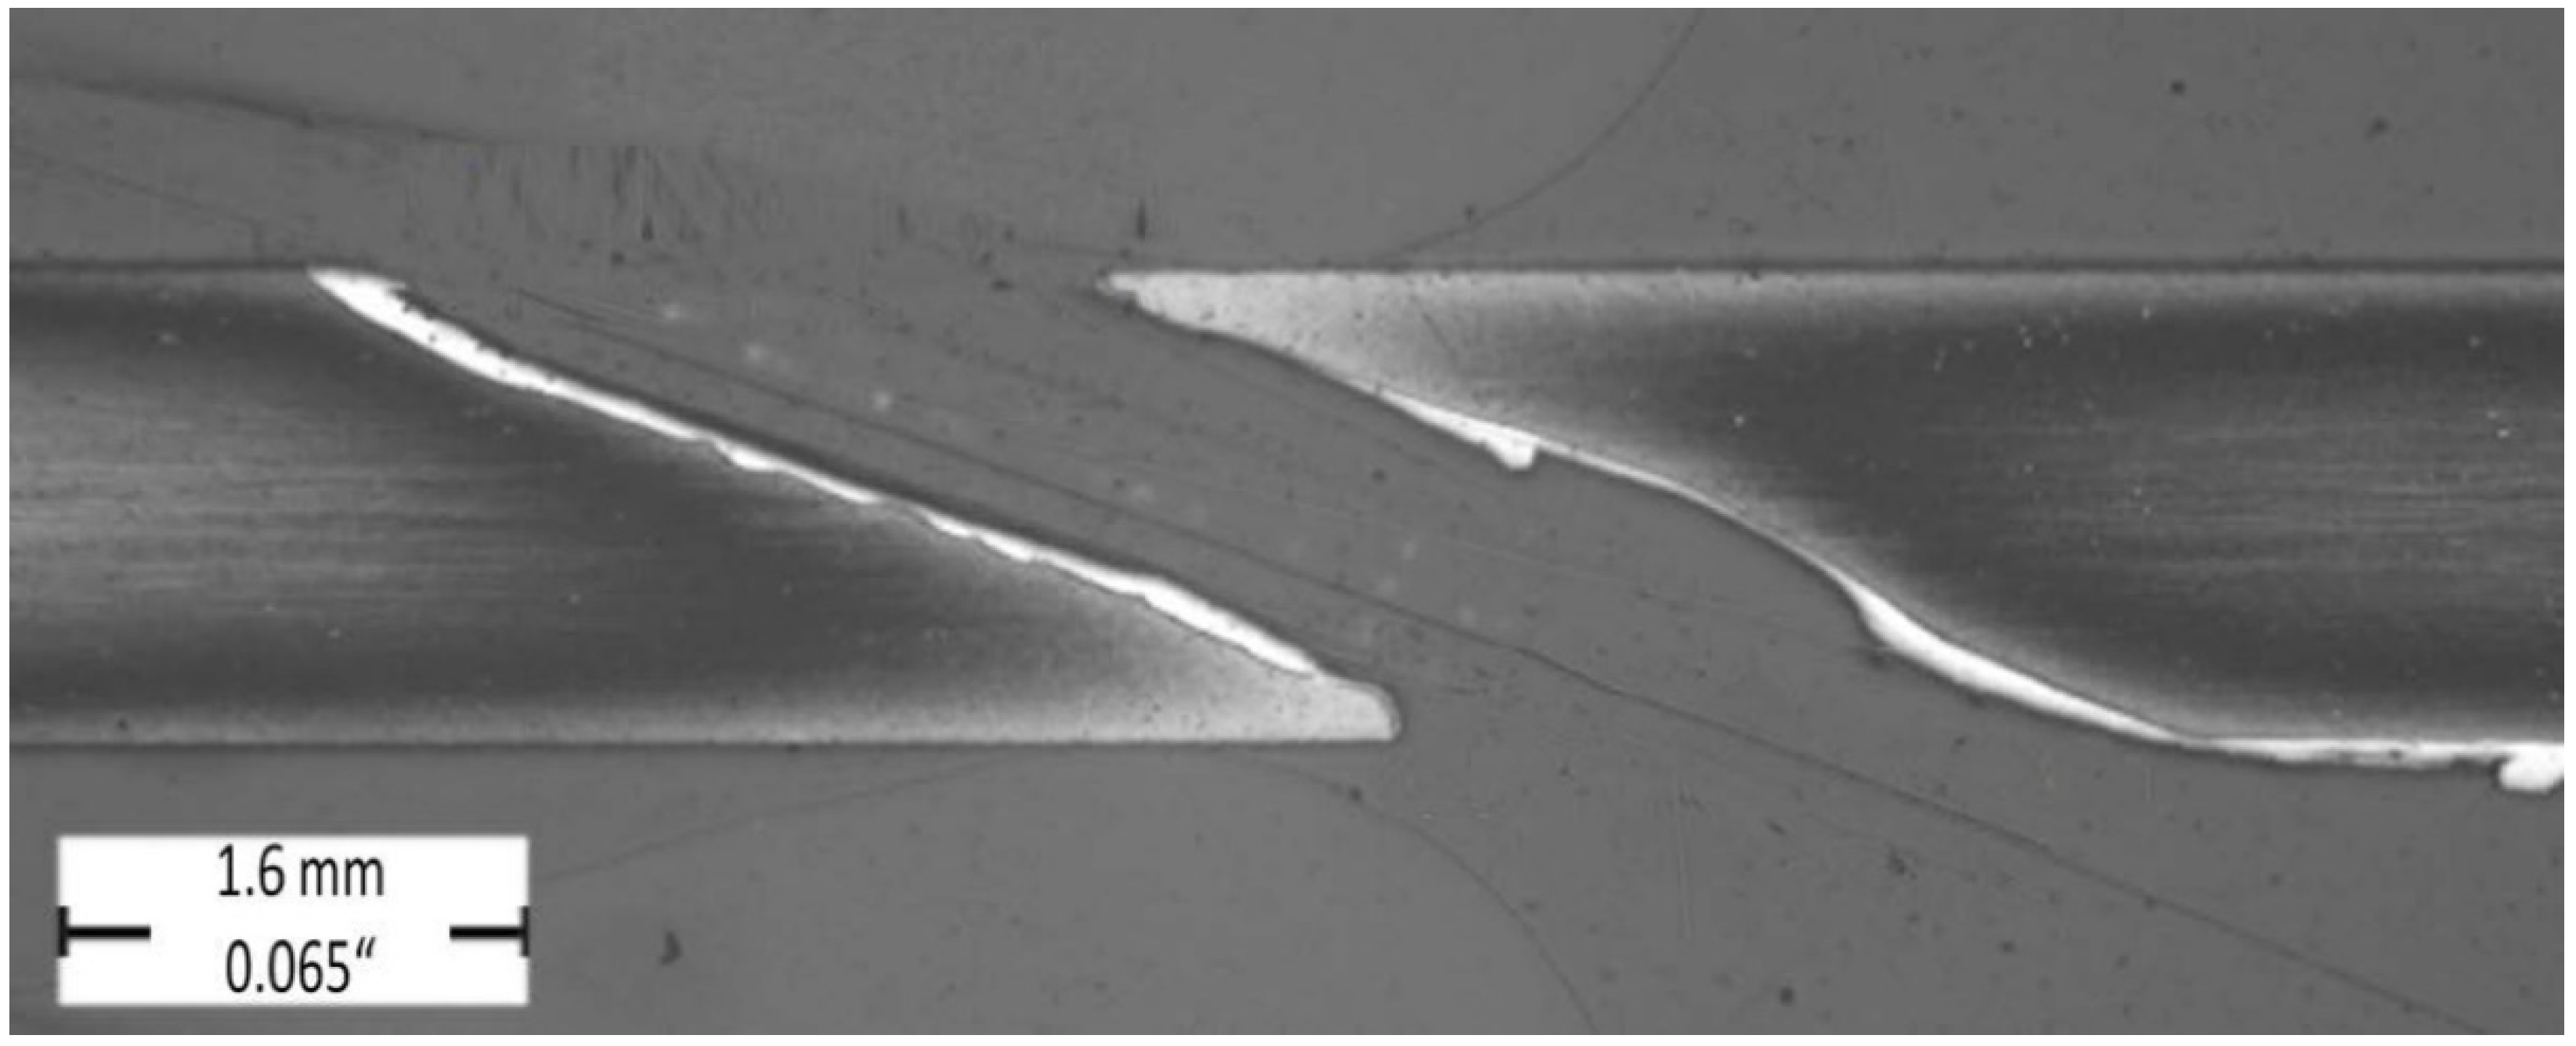
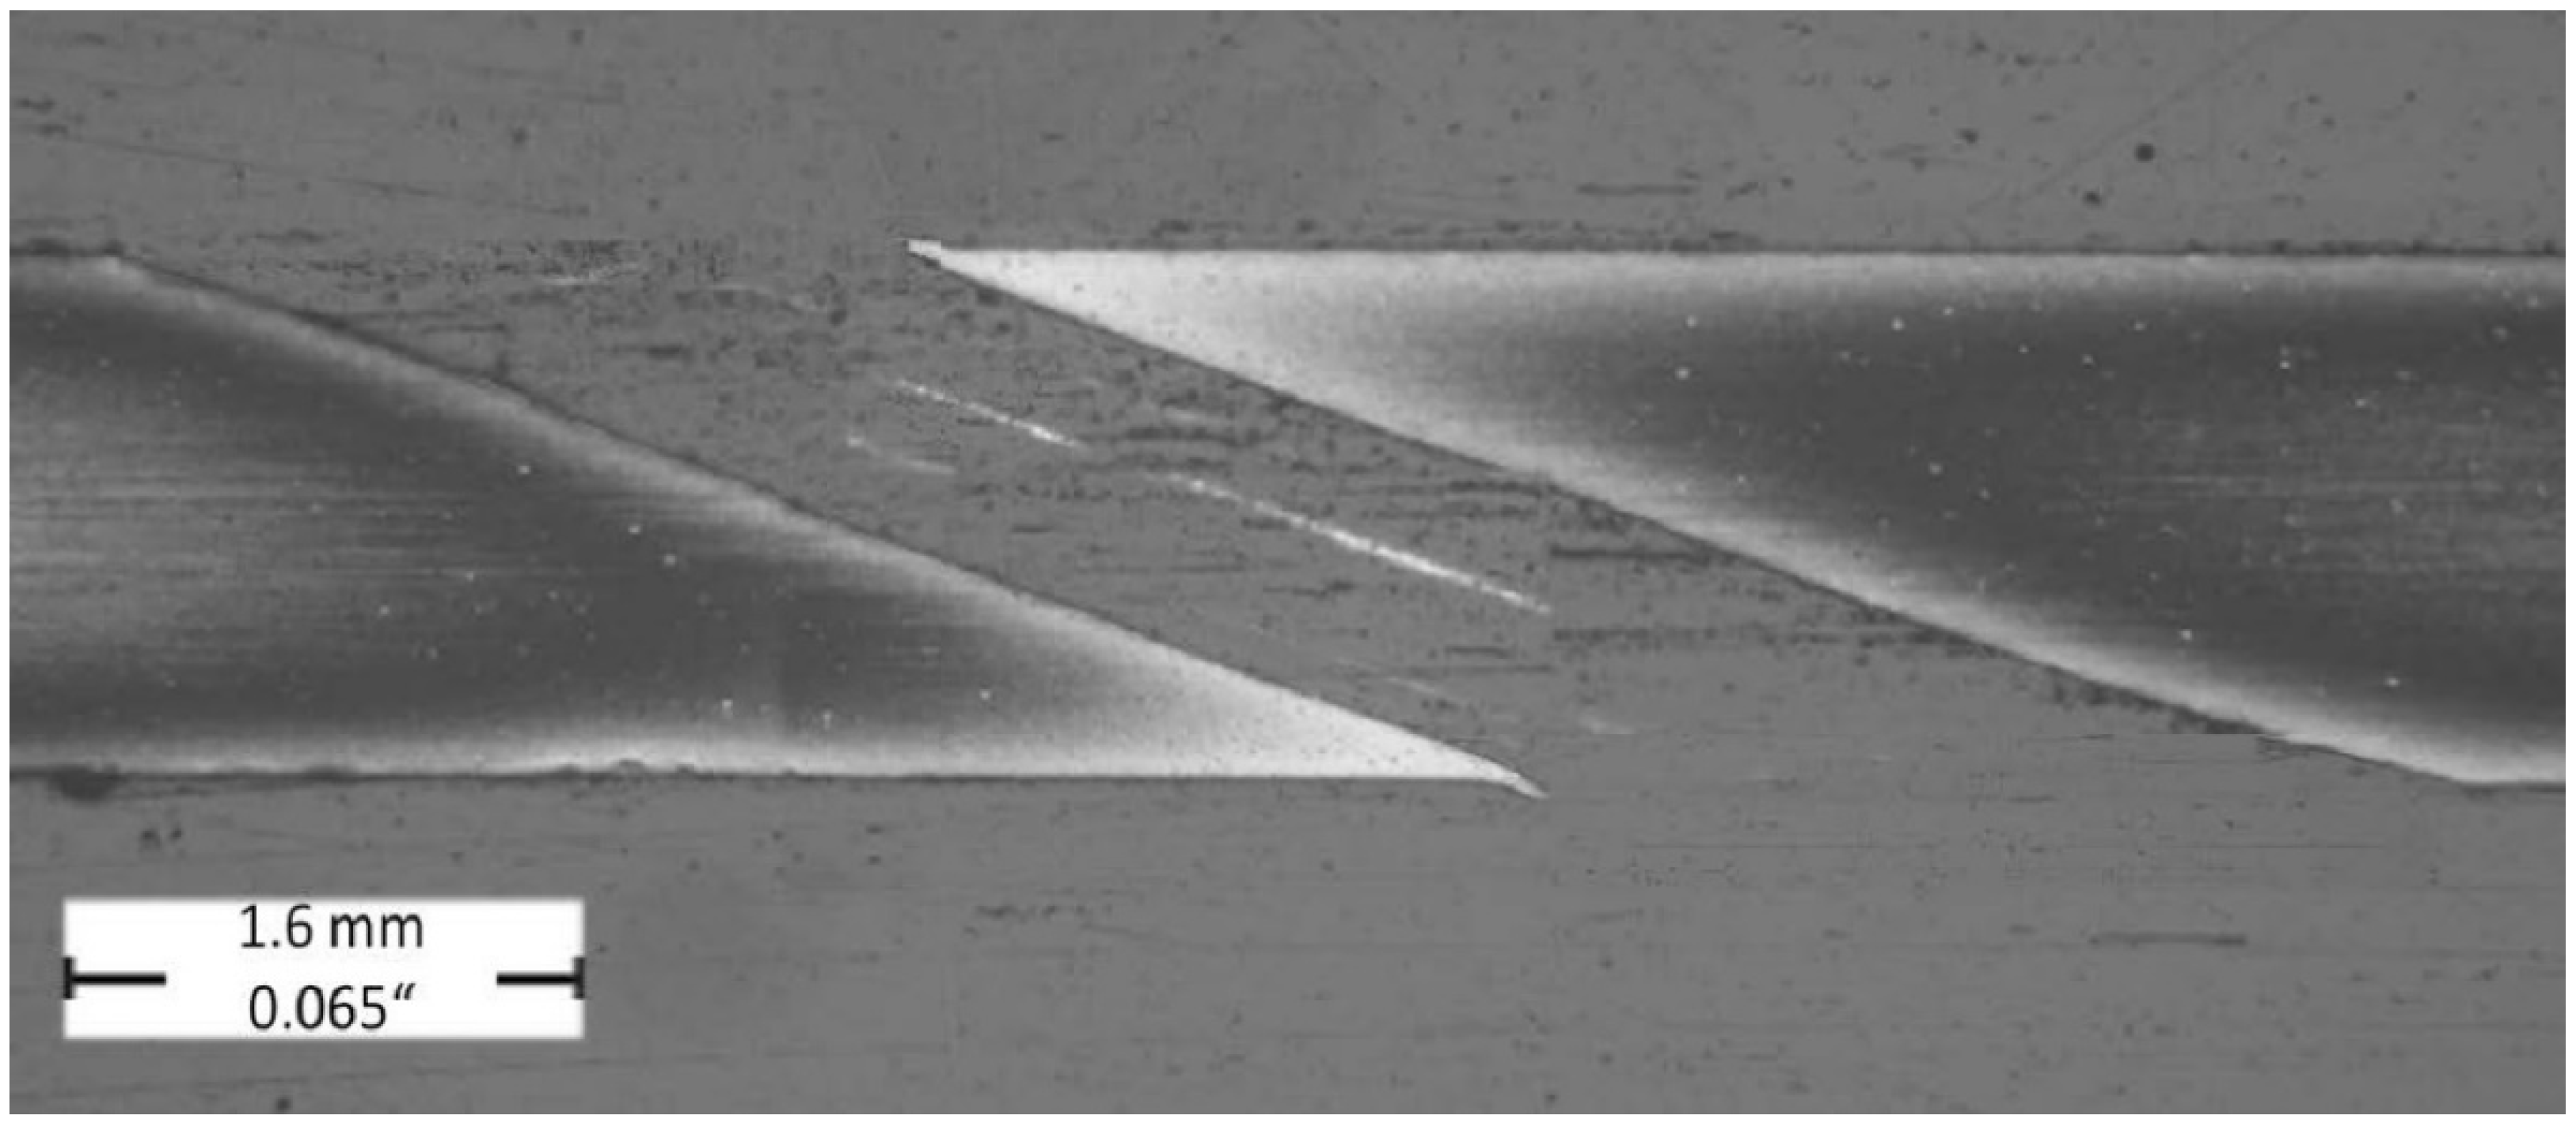
1.3. Microcracks in the Base Material
The formation of these cracks is initiated by the recast layer; therefore, it is important to analyze their length. These cracks can have a significant negative effect on the fatigue strength of the aircraft engine components, while reducing their life and safety [
22].
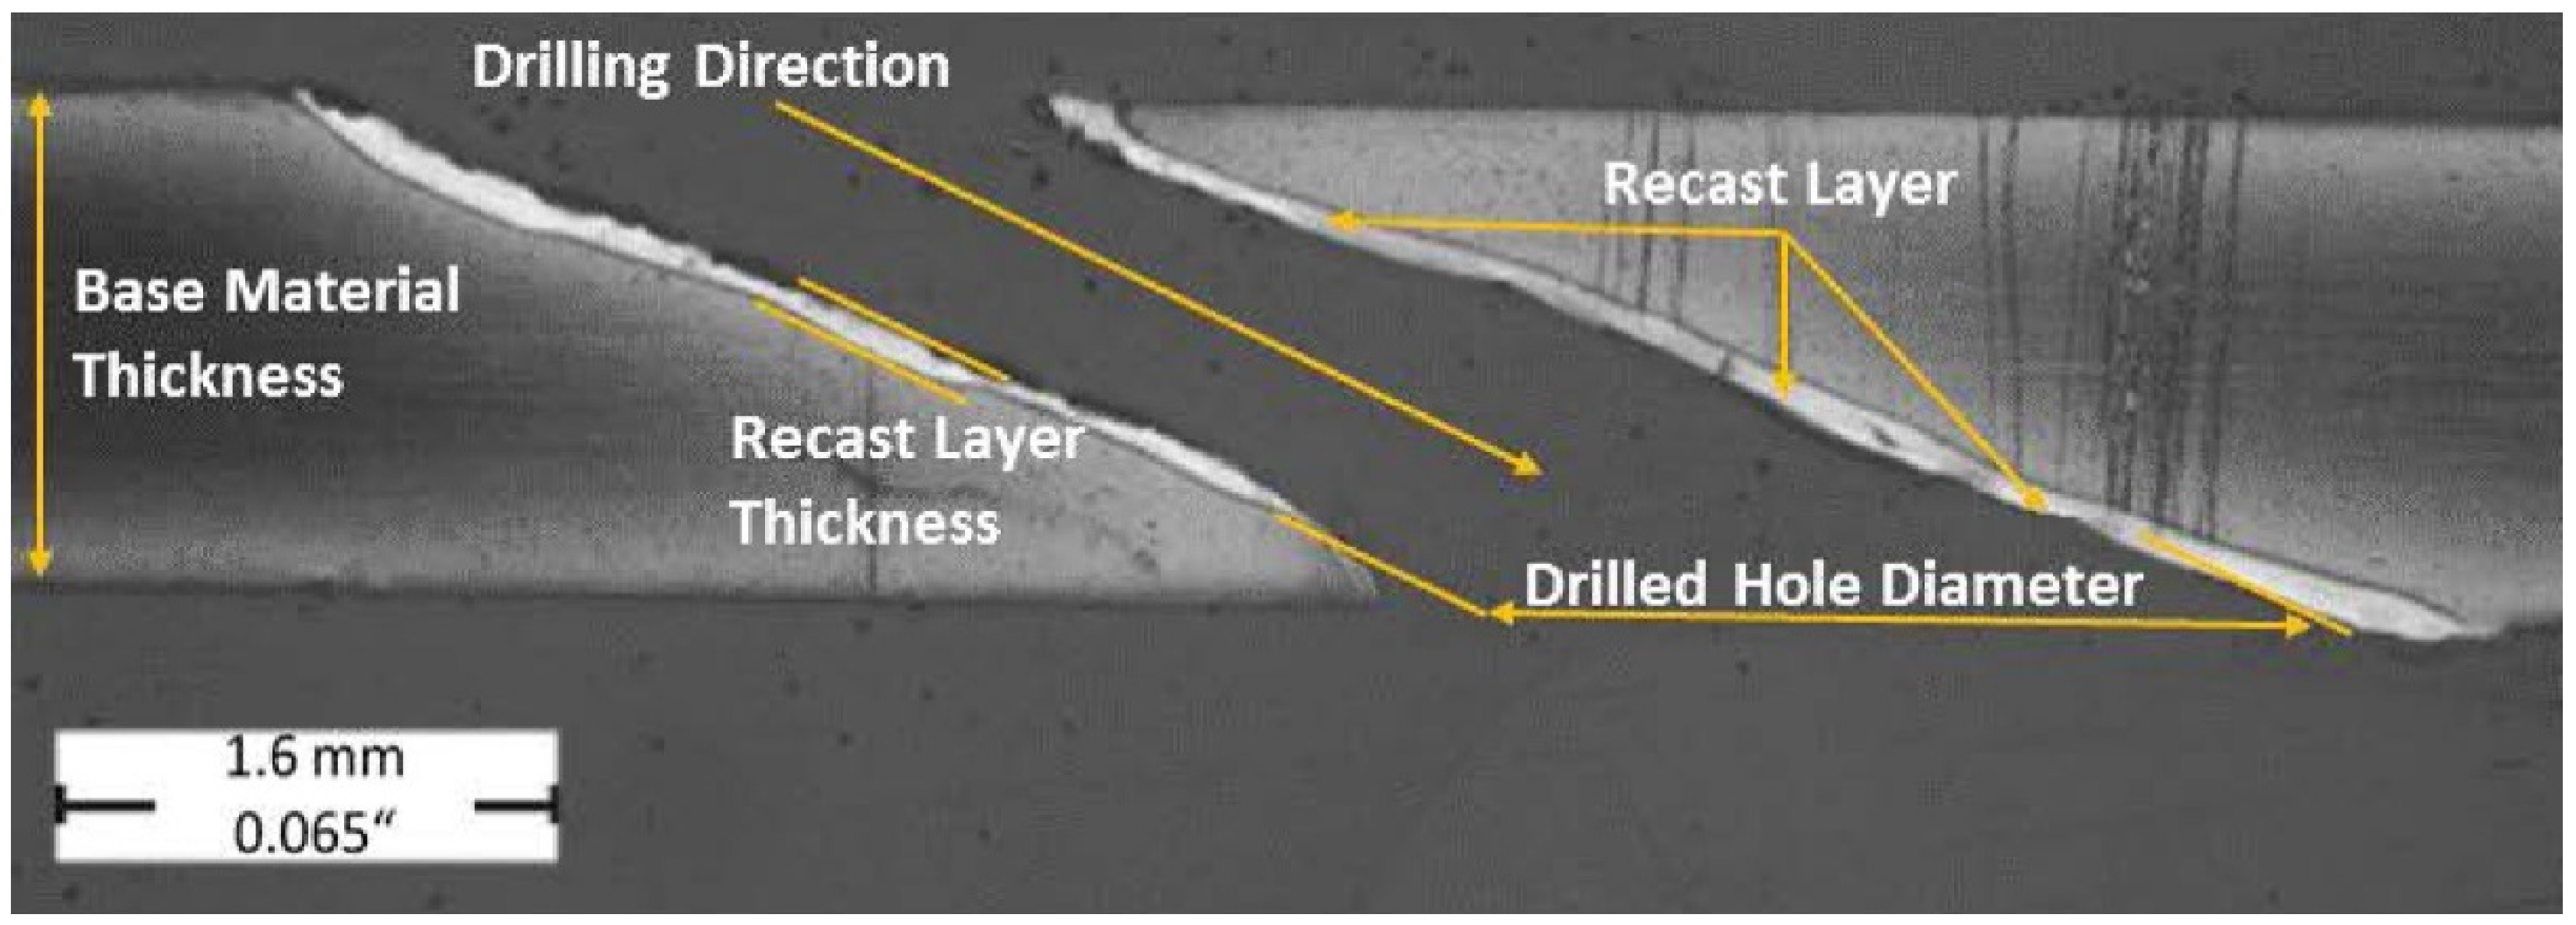
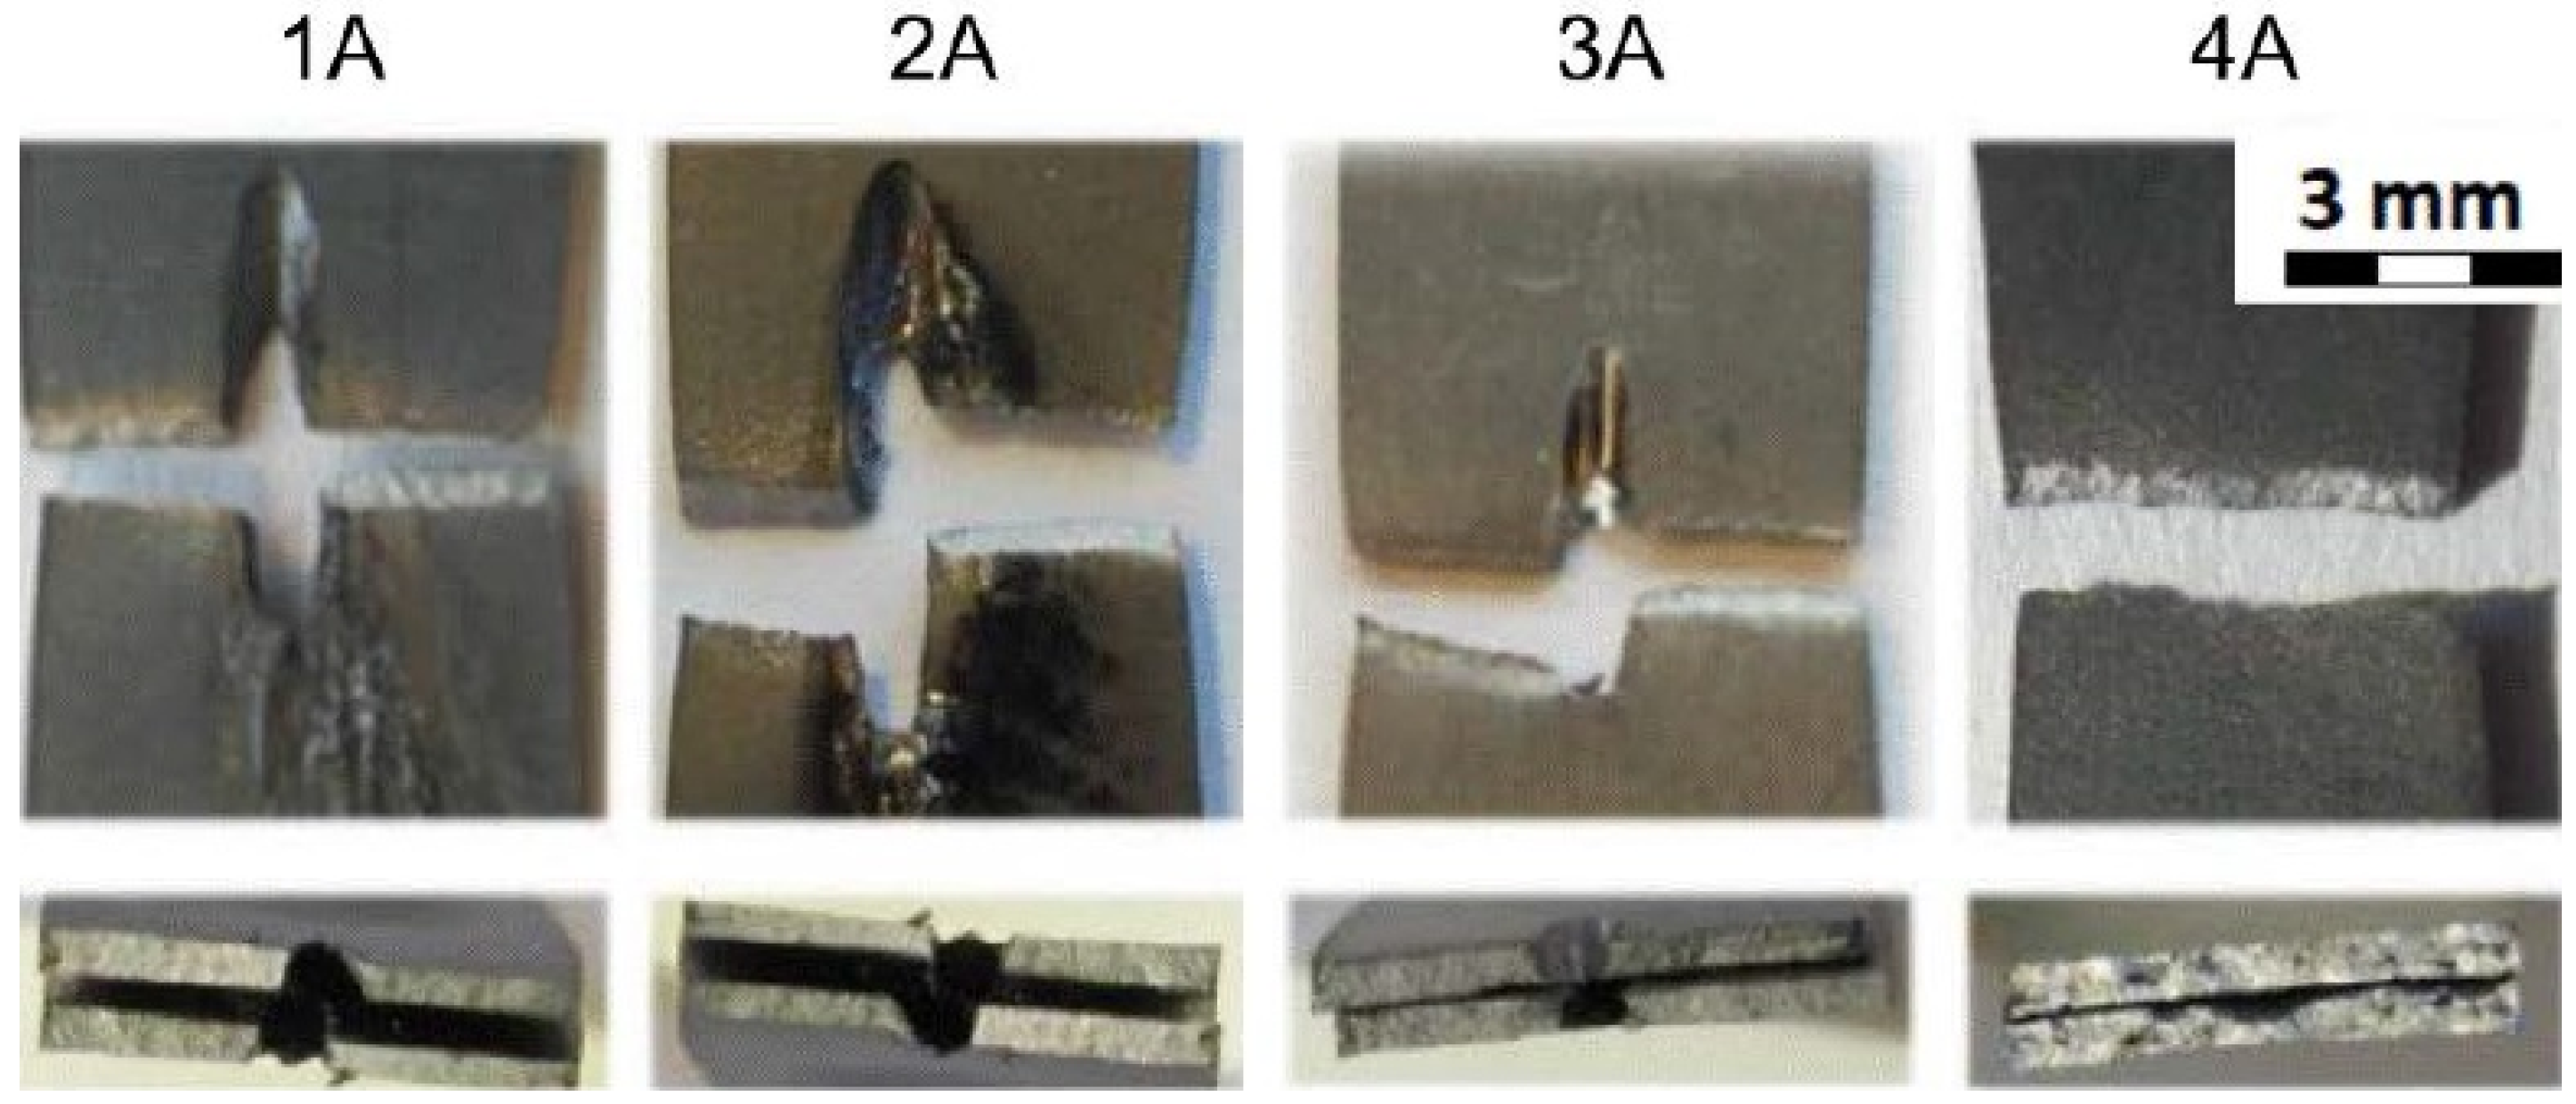
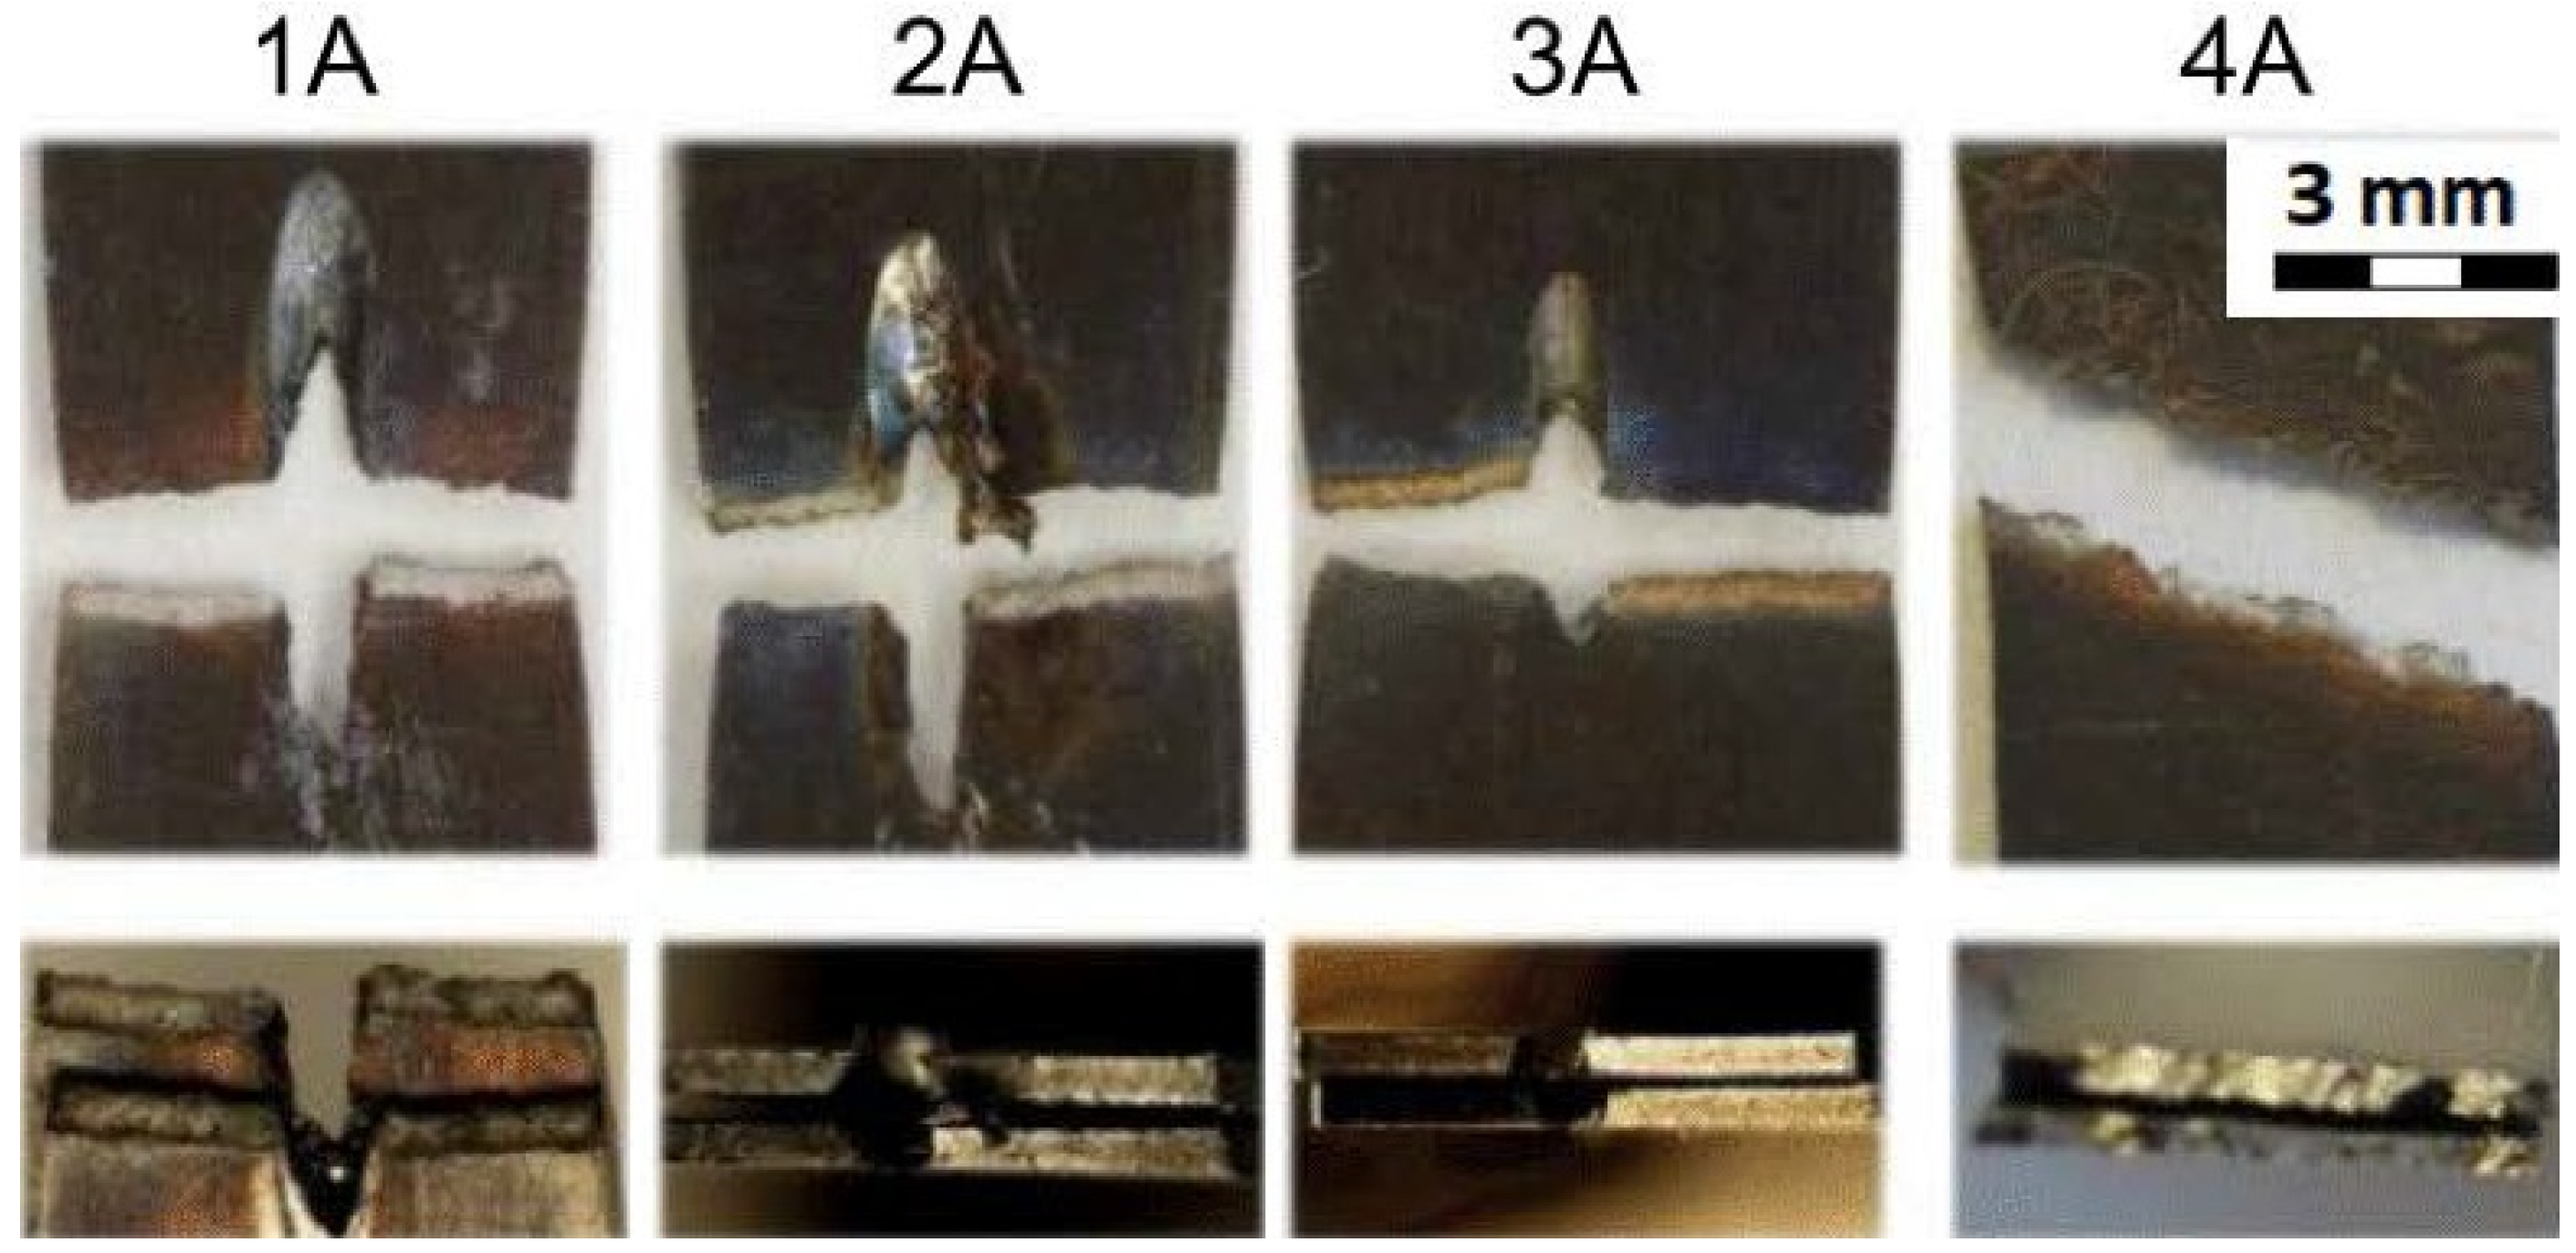
In
Figure 1, the formation of a crack in the recast layer of the material and its subsequent spread in the base material can be observed.
2. Experimental Samples
2.1. Material and Thickness
High burning temperatures inside jet engines have made material selection complicated. That is why such materials require high strength and temperature resistance [
16]. The test samples were made of high strength Inconel 718 alloy, which belongs to the group of nickel-base superalloys (
Table 1). As high temperature resistant materials, these are suitable for operation under extremely demanding conditions. Nickel-based superalloys are generally used in industries such as aerospace, nuclear, etc. [
48,
49], and in applications such as land gas turbines and aircraft engine turbines. The Inconel 718 alloy is characterized by an excellent temperature resistance in the range of −253 °C to +705 °C, as well as an excellent oxidation resistance up to 980 °C.
Three different material thicknesses were chosen to cover the common range of thicknesses from which the real aerospace applications are manufactured: 0.5 mm; 1.0 mm; 1.6 mm.
Table 1.
Nominal chemical composition of Inconel 718 [
50].
Table 1.
Nominal chemical composition of Inconel 718 [
50].
| Element | Fe | Cr | C | Ti | Mn | Si | Ni | S | P | Mo | Nb | Al |
|---|
| Weight % | 17.62 | 18.84 | 0.024 | 0.95 | 0.02 | 0.06 | 53.64 | 0.002 | 0.03 | 3.08 | 5.23 | 0.53 |
2.2. Design, Amount, and Preparation
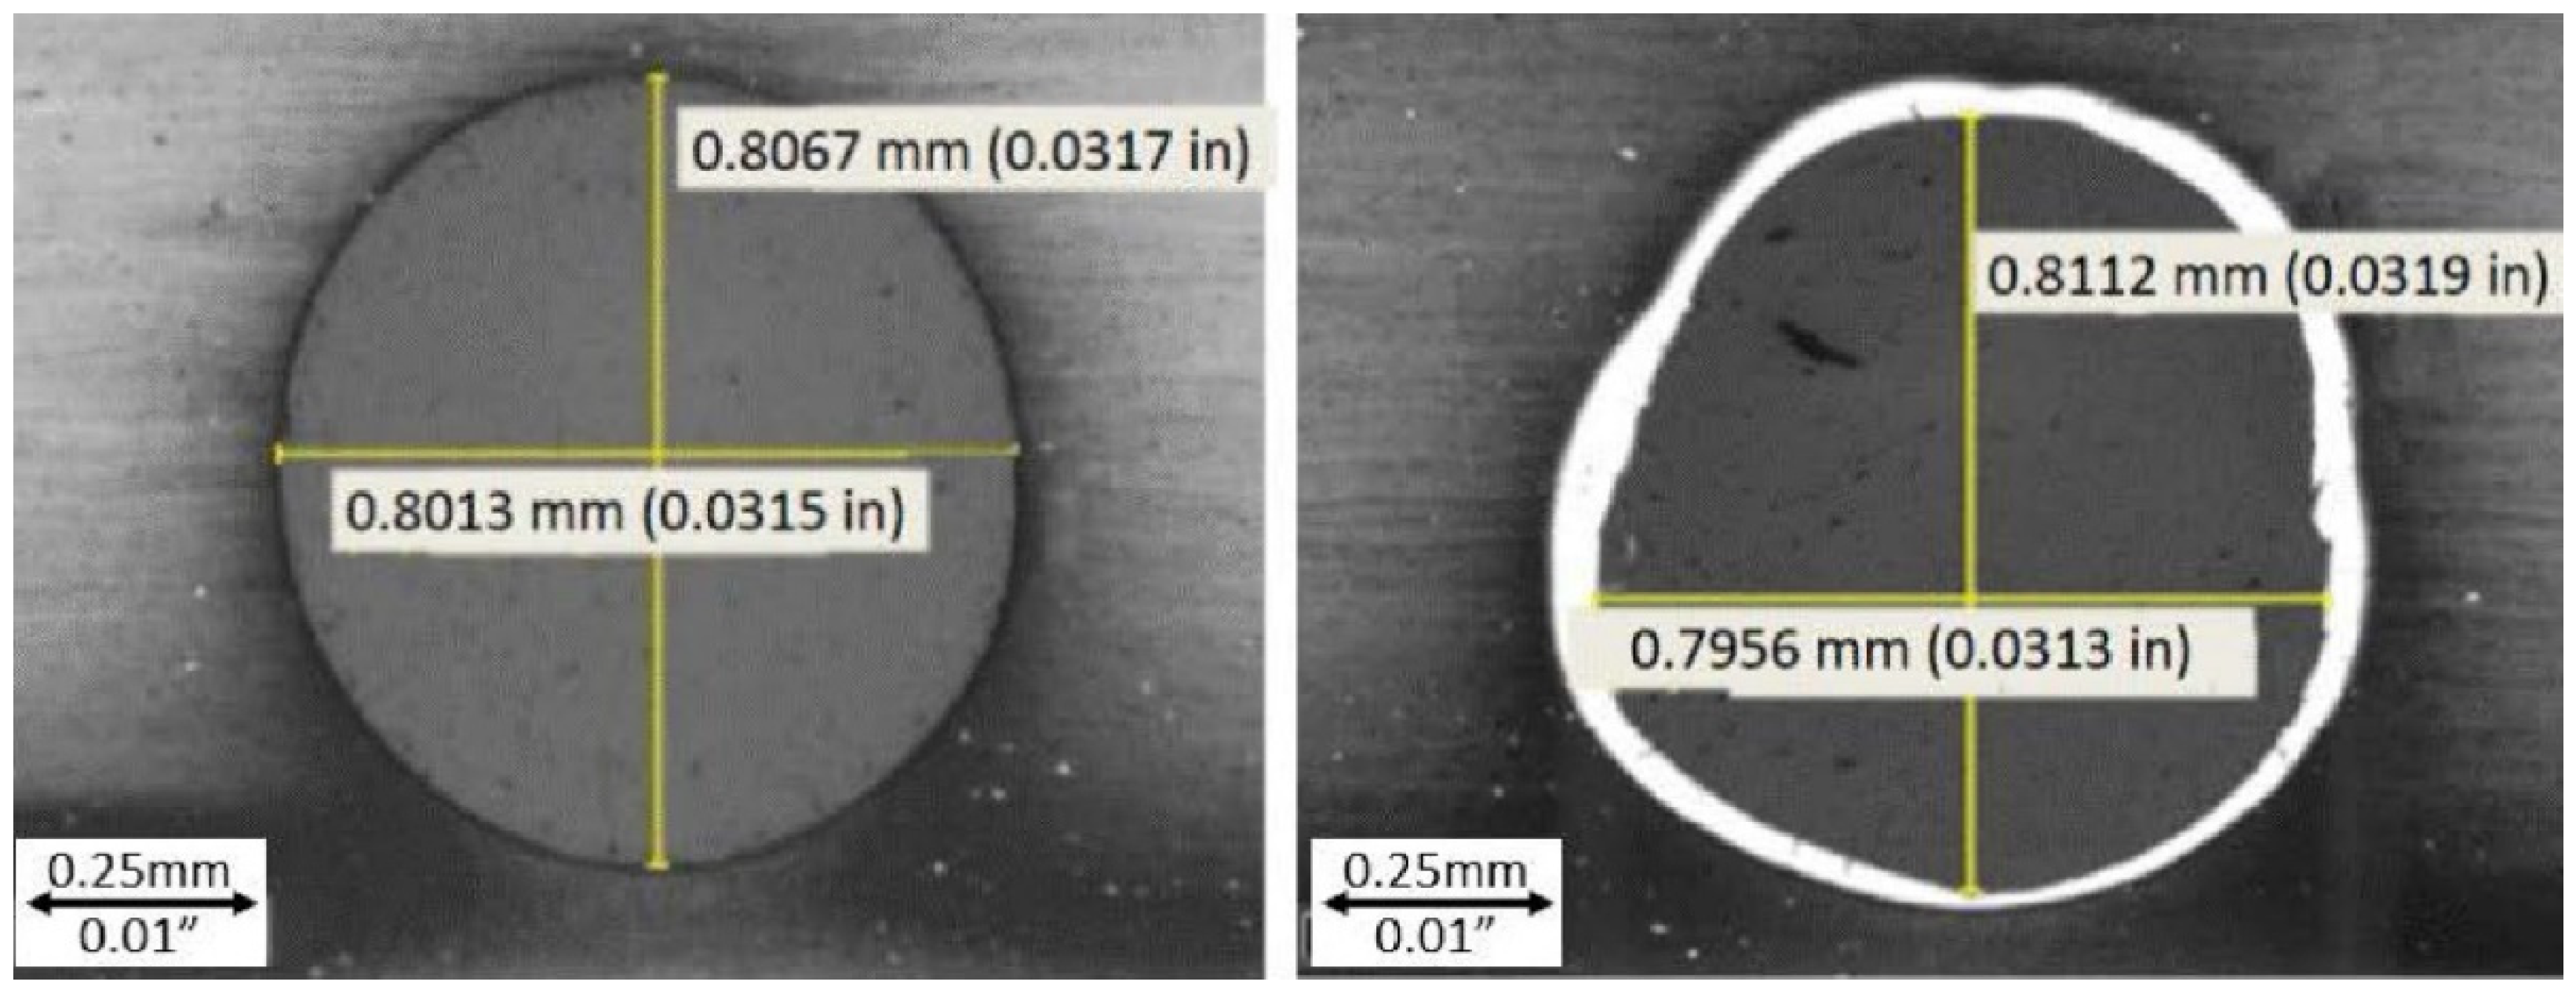
Flat shape samples were determined as the more suitable design to be used for the experiment. Except for their thickness, all the samples were manufactured with the same dimensions and under the same manufacturing conditions (
Figure 2).
In total, 192 experimental samples were manufactured and evaluated (
Table 2). There were four Sample Groups (1 through 4) including all three material thicknesses (A through C).
From a statistical evaluation point of view, and with regard to costs and time needed for manufacturing and the subsequent evaluation of all the experimental samples, 8 samples were established as the number of samples for each subgroup. They were expected to have the same condition.
At the end, there were two main groups of samples subjected to tensile testing. Each one of them contained all the material thicknesses and all the drilling methods previously applied, as well as undrilled samples (group 4) to reveal the basic mechanical properties of the material. The first half of the samples were subjected to tensile testing at room temperature (23 °C). The second half were subjected to tensile testing at an elevated temperature (550 °C).
Prior to the drilling of the samples, all were cleaned by immersion degreasing, and heat treated by solution annealing and precipitation hardening. Heat treating cycles are not specified as they are considered as intellectual property information. The reason was to have the material of the samples in the same condition as the material of real jet engine applications.
2.3. Drilling of Experimental Samples
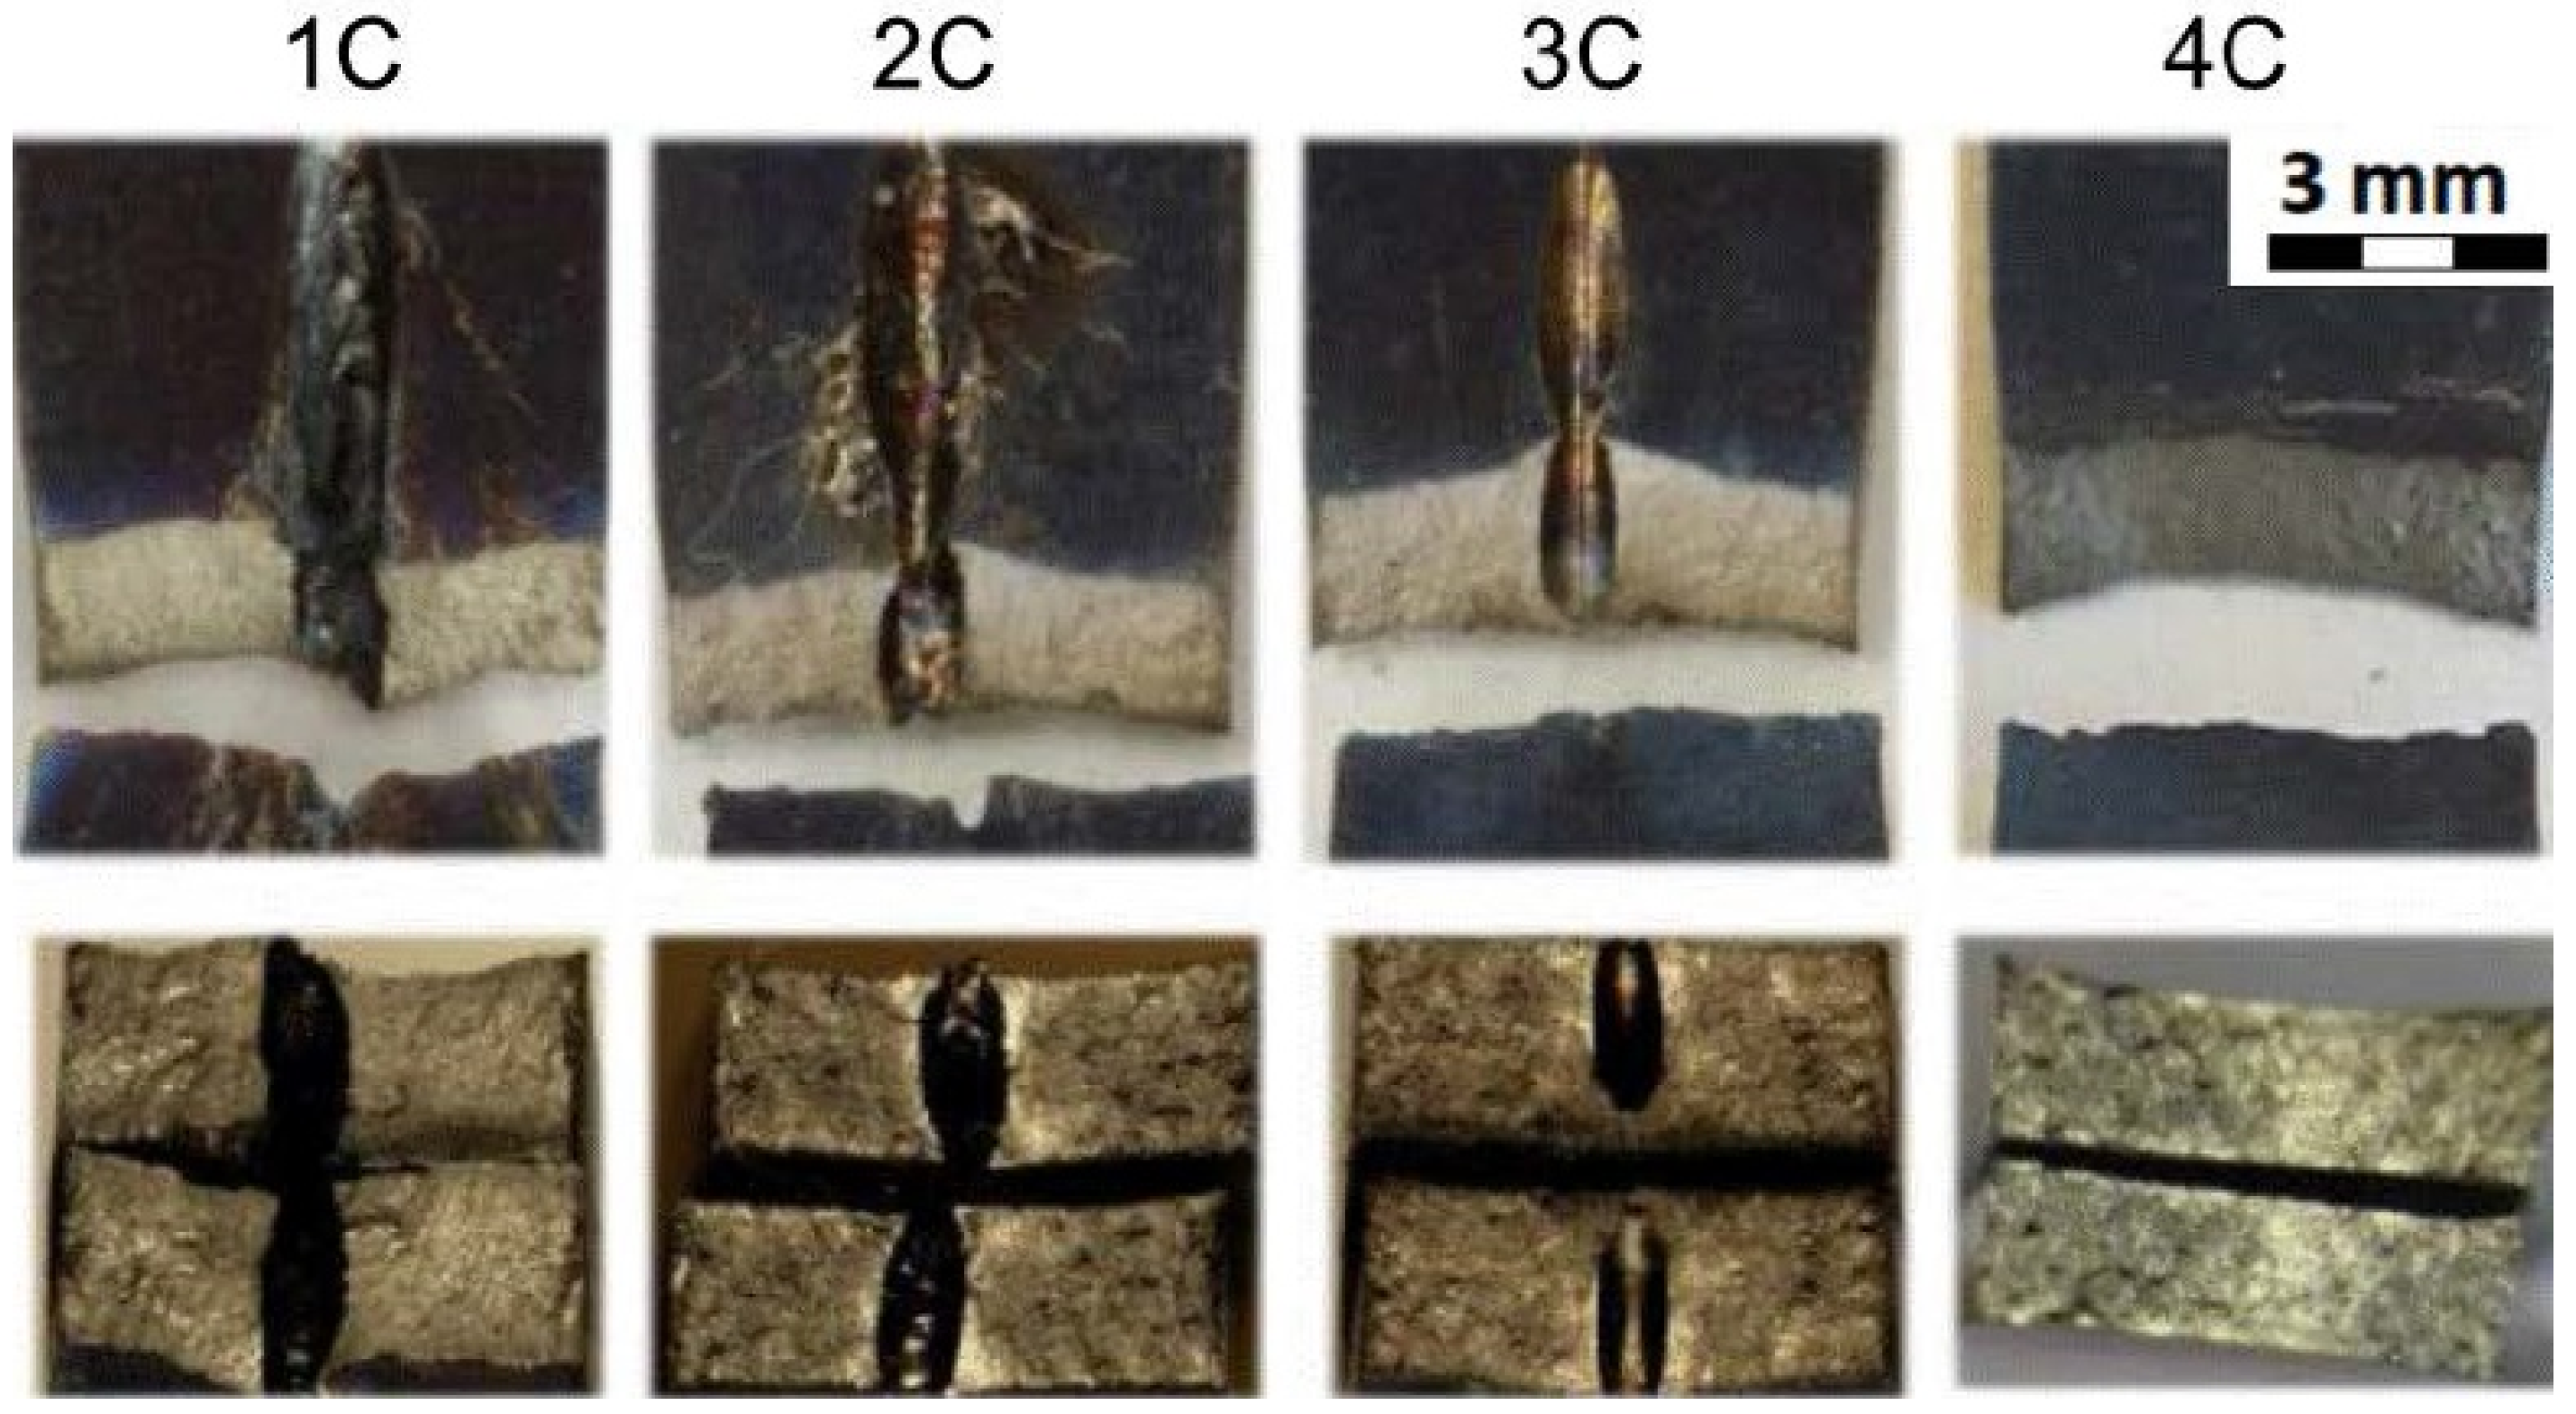
The sample groups 1, 2, and 3 were drilled. The same rule was applied—one hole under a 70° incidence angle (a common angle of effusion holes) with a diameter of 0.8 mm was drilled into the middle of the sample length, either by a laser beam (groups 1 and 2), or by a drilling tool (group 3).
Effusion cooling holes (<1 mm) drilled by laser beam are highly valued for improving the performance of aviation engines [
48]. It is envisaged that future generations of aero engines will typically have an excess of 150,000 cooling holes, which will result in enormous pressure on the technology used to meet targets in relation to productivity and hole quality [
51]. Previously, Marimuthu et al. [
52] investigated the effects of pulse duration, energy, frequency, and laser assisted gas composition on the characteristics of laser drilled holes. Kononenko et al. [
53] also investigated the influence of laser pulses on the percussion drilling process, during which a dramatic rise of the recast layer thickness inside the drilled hole was observed.
The laser cycle is mainly determined by pulse width. The longer the pulse width, the longer the cycle.
To support the exothermic reaction, which helped to intentionally create more of the recast layer on the base material, oxygen was used as an assist gas to drill all the sample groups by a laser long cycle (1A, 1B, 1C).
As today’s fiber optic lasers offer the possibility to drill fast even at high qualities [
54,
55], the laser machine used for drilling was equipped with a fiber optic laser source with a maximum peak pulse power of 20 kW.
Figure 3 shows the clamped experimental sample, as well as the nozzle position adjusted prior to the sample being drilled.
The samples were clamped by hand—however, repeatability of the drilling procedure was ensured by laser machine adjustment. Strictly speaking, the zero position of the laser nozzle was adjusted after each sample was clamped and so the position of the drilled hole and the drilling angle was always adjusted the same on each sample prior to its drilling. This is also the methodology used in the machining of the real application.
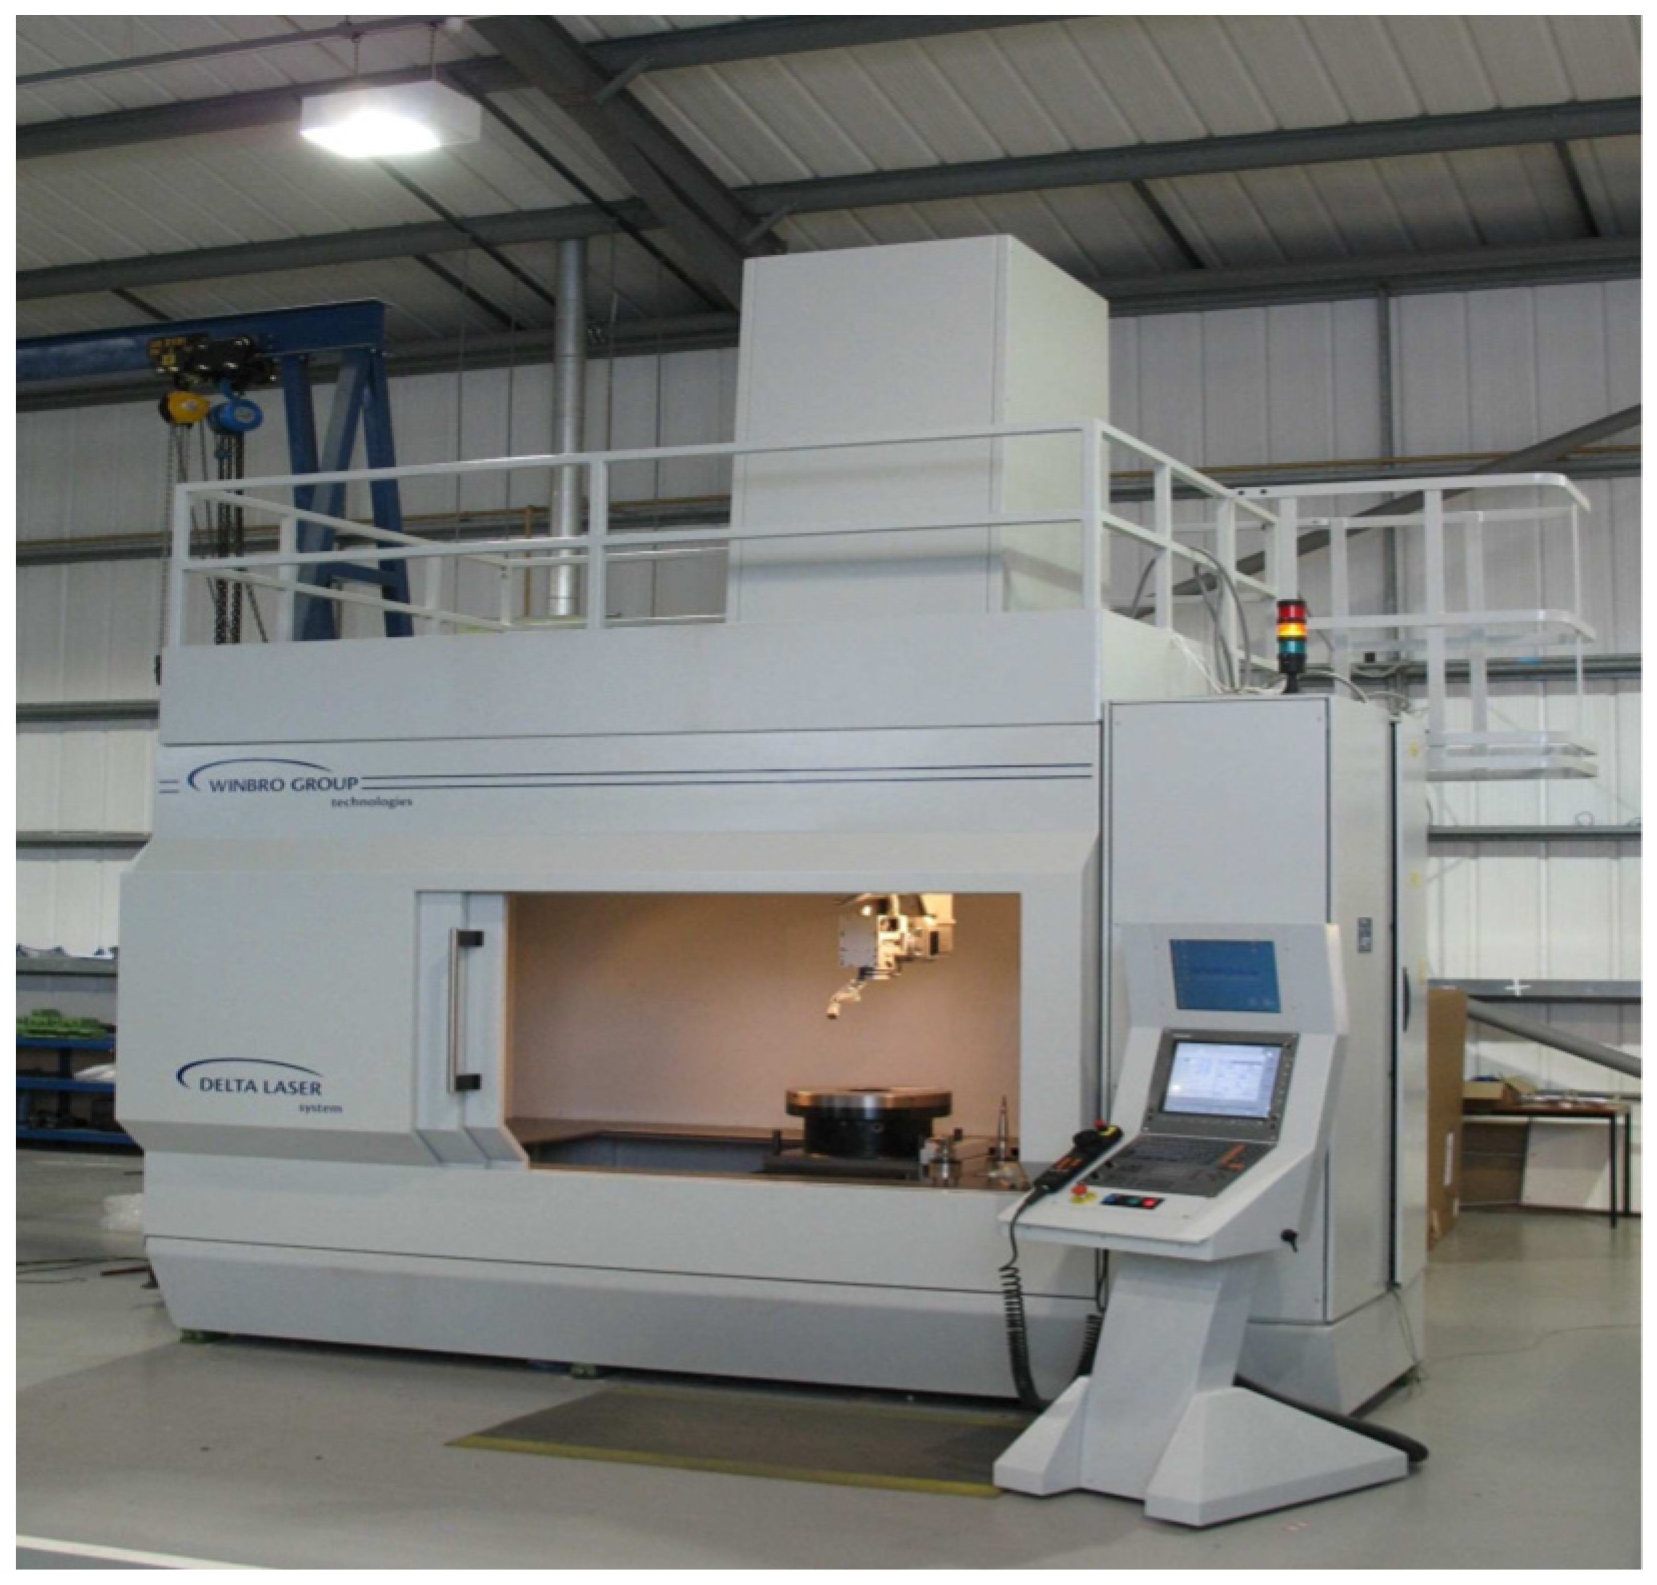
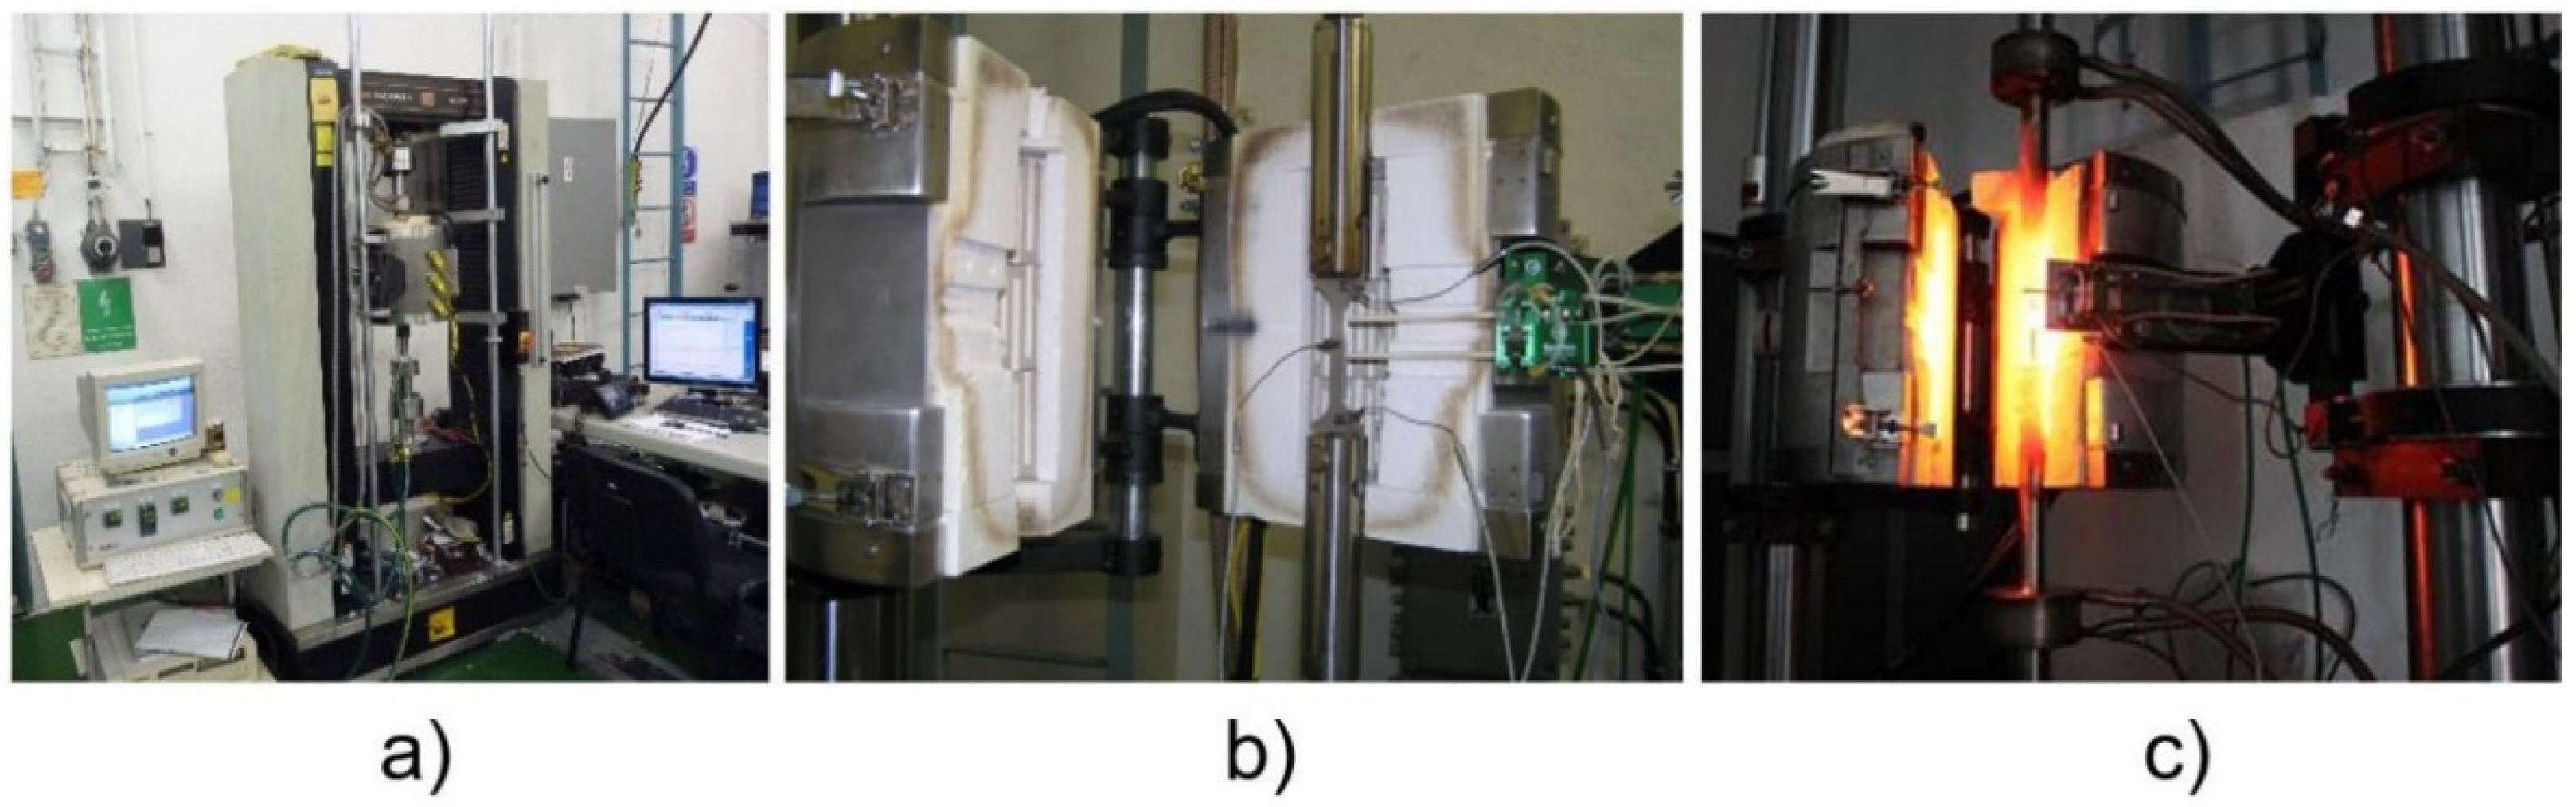
The laser machine used for the drilling of the experimental samples can be seen in
Figure 4. This machine is one of the most frequently used for the machining of aerospace applications by the contracting authority of this work, Honeywell Aerospace company.
The laser source, by which the laser machine was fitted, is shown in
Figure 5. It is a solid-source type widely used for such processing. Currently, the solid-source lasers are being replaced by fiber optic laser sources, as these are more stable at the peak power and are easier to maintain.
In
Table 3, all the process parameters (Assist Gas; Frequency; Pulse Width; Energy; Power; Number of Pulses) of a laser beam drilling process used on all applicable material thicknesses (0.5 mm; 1.0 mm; 1.6 mm) are described. Samples 1A, 1B, and 1C stand for the laser beam drilling with a long cycle, where more of the recast layer was expected to be formed. Oxygen assist gas was chosen to promote an exothermic reaction and the recast layer formation during the laser drilling. Samples 2A, 2B, and 2C stand for the laser beam drilling with a short cycle, where less of the recast layer was expected to be formed. Nitrogen assist gas was chosen to protect the melting area of the material during the laser drilling and to reduce the recast layer formation. The pulse width was also always higher for drilling with oxygen for the same reason. The number of pulses required to drill the hole increased with the increasing thickness of the sample material.


