
Polyurethane Composite Foams Synthesized Using Bio-Polyols and Cellulose Filler

 ,
,
Abstract
:1. Introduction
2. Materials and Methods
2.1. Materials
2.2. Preparation of Cellulose Dispersion in Petrochemical Polyol
2.3. Characterization of Cellulose
2.4. Preparation of Rigid Polyurethane Foams Modified by Microcellulose
2.5. Characteristics of Rigid Polyurethane Foams
3. Results and Discussion
3.1. ARBOCEL® P 4000 X Characterization
3.2. Polyurethane Foams Characterization
4. Conclusions
Author Contributions
Funding
Institutional Review Board Statement
Informed Consent Statement
Data Availability Statement
Acknowledgments
Conflicts of Interest
References
- Polyurethane Market—Growth, Trends, Covid-19 Impact, and Forecasts (2021–2026). Available online: https://www.mordorintelligence.com/industry-reports/polyurethane-market (accessed on 15 May 2021).
- De Avila Delucis, R.; Magalhães, W.L.E.; Petzhold, C.L.; Amico, S.C. Forest-based resources as fillers in biobased polyurethane foams. J. Appl. Polym. Sci. 2018, 135, 1–7. [Google Scholar] [CrossRef]
- Gharib, J.; Pang, S.; Holland, D. Synthesis and characterisation of polyurethane made from pyrolysis bio-oil of pine wood. Eur. Polym. J. 2020, 133, 109725. [Google Scholar] [CrossRef]
- Huang, X.; De Hoop, C.F.; Xie, J.; Wu, Q.; Boldor, D.; Qi, J. High bio-content polyurethane (PU) foam made from bio-polyol and cellulose nanocrystals (CNCs) via microwave liquefaction. Mater. Des. 2018, 138, 11–20. [Google Scholar] [CrossRef]
- Septevani, A.A.; Evans, D.A.C.; Martin, D.J.; Annamalai, P.K. Hybrid polyether-palm oil polyester polyol based rigid polyurethane foam reinforced with cellulose nanocrystal. Ind. Crops Prod. 2018, 112, 378–388. [Google Scholar] [CrossRef]
- Ribeiro Da Silva, V.; Mosiewicki, M.A.; Yoshida, M.I.; Coelho Da Silva, M.; Stefani, P.M.; Marcovich, N.E. Polyurethane foams based on modified tung oil and reinforced with rice husk ash I: Synthesis and physical chemical characterization. Polym. Test. 2013, 32, 438–445. [Google Scholar] [CrossRef]
- Zhang, C.; Kessler, M.R. Bio-based polyurethane foam made from compatible blends of vegetable-oil-based polyol and petroleum-based polyol. ACS Sustain. Chem. Eng. 2015, 3, 743–749. [Google Scholar] [CrossRef]
- Dhaliwal, G.S.; Anandan, S.; Chandrashekhara, K.; Lees, J.; Nam, P. Development and characterization of polyurethane foams with substitution of polyether polyol with soy-based polyol. Eur. Polym. J. 2018, 107, 105–117. [Google Scholar] [CrossRef]
- Zieleniewska, M.; Leszczyński, M.K.; Kurańska, M.; Prociak, A.; Szczepkowski, L.; Krzyzowska, M.; Ryszkowska, J. Preparation and characterisation of rigid polyurethane foams using a rapeseed oil-based polyol. Ind. Crops Prod. 2015, 74, 887–897. [Google Scholar] [CrossRef]
- Członka, S.; Bertino, M.F.; Kośny, J.; Strąkowska, A.; Masłowski, M.; Strzelec, K. Linseed oil as a natural modifier of rigid polyurethane foams. Ind. Crops Prod. 2018, 115, 40–51. [Google Scholar] [CrossRef]
- Paciorek-Sadowska, J.; Borowicz, M.; Czupryński, B.; Tomaszewska, E.; Liszkowska, J. Oenothera biennis seed oil as an alternative raw material for production of bio-polyol for rigid polyurethane-polyisocyanurate foams. Ind. Crops Prod. 2018, 126, 208–217. [Google Scholar] [CrossRef]
- Zareanshahraki, F.; Lu, J.; Yu, S.; Kiamanesh, A.; Shabani, B.; Mannari, V. Development of sustainable polyols with high bio-renewable content and their applications in thermoset coatings. Prog. Org. Coat. 2020, 147, 105725. [Google Scholar] [CrossRef]
- Lligadas, G.; Ronda, J.C.; Galiá, M.; Cádiz, V. Plant oils as platform chemicals for polyurethane synthesis: Current state-of-the-art. Biomacromolecules 2010, 11, 2825–2835. [Google Scholar] [CrossRef]
- Prociak, A.; Kurańska, M.; Malewska, E. Porous polyurethane plastics synthetized using bio-polyols from renewable raw materials. Polim. Polym. 2017, 62, 353–363. [Google Scholar] [CrossRef]
- Allauddin, S.; Somisetti, V.; Ravinder, T.; Rao, B.V.S.K.; Narayan, R.; Raju, K.V.S.N. One-pot synthesis and physicochemical properties of high functionality soy polyols and their polyurethane-Urea coatings. Ind. Crops Prod. 2016, 85, 361–371. [Google Scholar] [CrossRef]
- Ghasemlou, M.; Daver, F.; Ivanova, E.P.; Adhikari, B. Polyurethanes from seed oil-based polyols: A review of synthesis, mechanical and thermal properties. Ind. Crops Prod. 2019, 142, 111841. [Google Scholar] [CrossRef]
- Kurańska, M.; Prociak, A. The influence of rapeseed oil-based polyols on the foaming process of rigid polyurethane foams. Ind. Crops Prod. 2016, 89, 182–187. [Google Scholar] [CrossRef]
- Kirpluks, M.; Kalnbunde, D.; Benes, H.; Cabulis, U. Natural oil based highly functional polyols as feedstock for rigid polyurethane foam thermal insulation. Ind. Crops Prod. 2018, 122, 627–636. [Google Scholar] [CrossRef]
- Zhang, J.; Hori, N.; Takemura, A. Optimization of preparation process to produce polyurethane foam made by oilseed rape straw based polyol. Polym. Degrad. Stab. 2019, 166, 31–39. [Google Scholar] [CrossRef]
- Członka, S.; Strąkowska, A.; Kairytė, A.; Kremensas, A. Nutmeg filler as a natural compound for the production of polyurethane composite foams with antibacterial and anti-aging properties. Polym. Test. 2020, 86. [Google Scholar] [CrossRef]
- Leszczyńska, M.; Ryszkowska, J.; Szczepkowski, L.; Kurańska, M.; Prociak, A.; Leszczyński, M.K.; Gloc, M.; Antos-Bielska, M.; Mizera, K. Cooperative effect of rapeseed oil-based polyol and egg shells on the structure and properties of rigid polyurethane foams. Polym. Test. 2020, 90. [Google Scholar] [CrossRef]
- Członka, S.; Strąkowska, A.; Kairytė, A. Effect of walnut shells and silanized walnut shells on the mechanical and thermal properties of rigid polyurethane foams. Polym. Test. 2020, 87. [Google Scholar] [CrossRef]
- Kurańska, M.; Barczewski, M.; Uram, K.; Lewandowski, K.; Prociak, A.; Michałowski, S. Basalt waste management in the production of highly effective porous polyurethane composites for thermal insulating applications. Polym. Test. 2019, 76, 90–100. [Google Scholar] [CrossRef]
- Kuźnia, M.; Magiera, A.; Pielichowska, K.; Ziąbka, M.; Benko, A.; Szatkowski, P.; Jerzak, W. Fluidized bed combustion fly ash as filler in composite polyurethane materials. Waste Manag. 2019, 92, 115–123. [Google Scholar] [CrossRef]
- Rueda, L.; Saralegui, A.; Fernández D’Arlas, B.; Zhou, Q.; Berglund, L.A.; Corcuera, M.A.; Mondragon, I.; Eceiza, A. Cellulose nanocrystals/polyurethane nanocomposites. Study from the viewpoint of microphase separated structure. Carbohydr. Polym. 2013, 92, 751–757. [Google Scholar] [CrossRef] [PubMed]
- Stanzione, M.; Oliviero, M.; Cocca, M.; Errico, M.E.; Gentile, G.; Avella, M.; Lavorgna, M.; Buonocore, G.G.; Verdolotti, L. Tuning of polyurethane foam mechanical and thermal properties using ball-milled cellulose. Carbohydr. Polym. 2020, 231, 115772. [Google Scholar] [CrossRef]
- Luo, X.; Mohanty, A.; Misra, M. Lignin as a reactive reinforcing filler for water-blown rigid biofoam composites from soy oil-based polyurethane. Ind. Crops Prod. 2013, 47, 13–19. [Google Scholar] [CrossRef]
- Septevani, A.A.; Evans, D.A.C.; Annamalai, P.K.; Martin, D.J. The use of cellulose nanocrystals to enhance the thermal insulation properties and sustainability of rigid polyurethane foam. Ind. Crops Prod. 2017, 107, 114–121. [Google Scholar] [CrossRef]
- Członka, S.; Strąkowska, A.; Strzelec, K.; Kairytė, A.; Kremensas, A. Melamine, silica, and ionic liquid as a novel flame retardant for rigid polyurethane foams with enhanced flame retardancy and mechanical properties. Polym. Test. 2020, 87. [Google Scholar] [CrossRef]
- Uram, K.; Prociak, A.; Kurańska, M. Influence of the chemical structure of rapeseed oil-based polyols on selected properties of polyurethane foams. Polymers 2020, 65, 698–707. [Google Scholar]
- Auguścik-Królikowska, M.; Ryszkowska, J.; Kurańska, M.; Wantulok, M.; Gloc, M.; Szczepkowski, L.; Dąbkowska-Susfał, K.; Prociak, A. Composites of open-cell viscoelastic foams with blackcurrant pomace. Materials 2021, 14, 934. [Google Scholar] [CrossRef]
- ISO 845:2006 Cellular Plastics and Rubbers—Determination of Apparent Density; International Organization for Standardization: Geneva, Switzerland, 2006.
- ISO 4590:2016 Rigid Cellular Plastics—Determination of the Volume Percentage of Open Cells and of Closed Cells; International Organization for Standardization: Geneva, Switzerland, 2016.
- ISO 8301:1991 Thermal Insulation—Determination of Steady-State Thermal Resistance and Related Properties HeatFlow Meter Apparatus; International Organization for Standardization: Geneva, Switzerland, 1991.
- PN-EN 826:2013-07 Thermal Insulating Products for Building Applications—Determination of Compression Behavior; Polish Committee for Standardization: Warszawa, Poland, 2013.
- ISO 2796:1986 Cellular Plastics, Rigid - Test for Dimensional Stability; International Organization for Standardization: Geneva, Switzerland, 1986.
- Melikoğlu, A.Y.; Bilek, S.E.; Cesur, S. Optimum alkaline treatment parameters for the extraction of cellulose and production of cellulose nanocrystals from apple pomace. Carbohydr. Polym. 2019, 215, 330–337. [Google Scholar] [CrossRef]
- Wei, L.; Agarwal, U.P.; Hirth, K.C.; Matuana, L.M.; Sabo, R.C.; Stark, N.M. Chemical modification of nanocellulose with canola oil fatty acid methyl ester. Carbohydr. Polym. 2017, 169, 108–116. [Google Scholar] [CrossRef] [Green Version]
- Oh, S.Y.; Yoo, D., II; Shin, Y.; Seo, G. FTIR analysis of cellulose treated with sodium hydroxide and carbon dioxide. Carbohydr. Res. 2005, 340, 417–428. [Google Scholar] [CrossRef] [PubMed]
- Park, S.; Baker, J.O.; Himmel, M.E.; Parilla, P.A.; Johnson, D.K. Cellulose crystallinity index: Measurement techniques and their impact on interpreting cellulase performance. Biotechnol. Biofuels 2010, 3, 1–10. [Google Scholar] [CrossRef] [PubMed] [Green Version]
- Väisänen, T.; Haapala, A.; Lappalainen, R.; Tomppo, L. Utilization of agricultural and forest industry waste and residues in natural fiber-polymer composites: A review. Waste Manag. 2016, 54, 62–73. [Google Scholar] [CrossRef]
- Silva, M.C.; Takahashi, J.A.; Chaussy, D.; Belgacem, M.N.; Silva, G.G. Composites of Rigid Polyurethane Foam and Cellulose Fiber Residue. J. Appl. Polym. Sci. 2010, 117, 3665–3672. [Google Scholar] [CrossRef]
- Zhou, X.; Sain, M.M.; Oksman, K. Semi-rigid biopolyurethane foams based on palm-oil polyol and reinforced with cellulose nanocrystals. Compos. Part A Appl. Sci. Manuf. 2016, 83, 56–62. [Google Scholar] [CrossRef] [Green Version]
- Członka, S.; Bertino, M.F.; Strzelec, K. Rigid polyurethane foams reinforced with industrial potato protein. Polym. Test. 2018, 68, 135–145. [Google Scholar] [CrossRef]
- Heath, D.E.; Cooper, S.L. Biomaterials Science an Introduction to Materials in Medicine, 3rd ed.; Elsevier Inc.: Amsterdam, The Netherlands, 2013; ISBN 978-0-12-374626-9. [Google Scholar]
- Członka, S.; Sienkiewicz, N.; Kairytė, A.; Vaitkus, S. Colored polyurethane foams with enhanced mechanical and thermal properties. Polym. Test. 2019, 78, 105986. [Google Scholar] [CrossRef]
- Polaczek, K.; Kurańska, M.; Auguścik-Królikowska, M.; Prociak, A.; Ryszkowska, J. Open-cell polyurethane foams of very low density modified with various palm oil-based bio-polyols in accordance with cleaner production. J. Clean. Prod. 2021, 290. [Google Scholar] [CrossRef]
- Prociak, A.; Kurańska, M.; Cabulis, U.; Ryszkowska, J.; Leszczyńska, M.; Uram, K.; Kirpluks, M. Effect of bio-polyols with different chemical structures on foaming of polyurethane systems and foam properties. Ind. Crops Prod. 2018, 120, 262–270. [Google Scholar] [CrossRef]
- Członka, S.; Sienkiewicz, N.; Strąkowska, A.; Strzelec, K. Keratin feathers as a filler for rigid polyurethane foams on the basis of soybean oil polyol. Polym. Test. 2018, 72, 32–45. [Google Scholar] [CrossRef]
- Członka, S.; Kairytė, A.; Miedzińska, K.; Strąkowska, A. Polyurethane hybrid composites reinforced with lavender residue functionalized with kaolinite and hydroxyapatite. Materials 2021, 14, 415. [Google Scholar] [CrossRef] [PubMed]


| Properties | Rokopol RF 551 | Bio-Polyol BP-1.6HEX | Bio-Polyol BP-1HEX |
|---|---|---|---|
| Hydroxyl value (mgKOH/g) | 420 | 217 | 101 |
| Viscosity (mPa·s) | 4000 | 2050 | 561 |
| Water content (%) | 0.1 | 0.25 | 0.04 |
| Functionality | 4.8 | 4.4 | 2.5 |
| Component (g) | PU | PU/C1 | PU/C2 | PU/C3 |
|---|---|---|---|---|
| Rokopol RF 551 | 60.00 | 43.33 | 26.67 | 10.00 |
| Bio-polyol BP-1.6HEX | 20.00 | |||
| Bio-poliol BP-1HEX | 20.00 | |||
| Niax L6915 | 1.50 | |||
| Polycat 218 | 1.50 | |||
| Water | 3.37 | 2.87 | 2.37 | 1.87 |
| cellulose dispersion in Rokopol RF 551 polyol,6 php | - | 17.67 | 35.33 | 53.00 |
| PMDI | 141.93 | |||
| Functional Groups | Wavenumber (cm−1) |
|---|---|
| OH stretching hydrogen bond | 3330, 3285 |
| C–H stretching | 2896 |
| C=C stretching | 1601 |
| C–H and H–C–H in-plane bending vibration | 1426 |
| C–H deformation vibration | 1366 |
| C–H or –OH | 1333, 1316 |
| C–O stretching vibrations | 1199 |
| C–O–C glycoside ether band | 1160 |
| C–O stretching vibrations | 1105 |
| C–O stretching vibrations | 1055 |
| C–O–C pyranose ring stretching vibration | 1028 |
| C–O–C, C–C–O, and C–C–H deformation modes and stretching vibrations in which the motions of the C-5 and C-6 atoms | 895 |
| C–O–H | 660 |
| Foam System | Direction of Growth | Anisotropy Index | Number of Cell/mm2 | Average Cell Cross-Sectional Area (mm2·103) | NF1 (Number of Cells∙103/cm3) |
|---|---|---|---|---|---|
| PU | Parallel | 1.31 ± 0.04 | 45 ± 3 | 9.3 ± 0.7 | 301.3 ± 29.2 |
| Perpendicular | 0.94 ± 0.04 | 70 ± 6 | 5.7 ± 0.4 | 592.4 ± 77.3 | |
| PU/C1 | Parallel | 1.31 ± 0.04 | 58 ± 2 | 7.3 ± 0.3 | 445.7 ± 27.3 |
| Perpendicular | 0.95 ± 0.03 | 90 ± 6 | 4.6 ± 0.4 | 857.8 ± 77.8 | |
| PU/C2 | Parallel | 1.29 ± 0.07 | 60 ± 5 | 7.1 ± 1.0 | 460.5 ± 58.4 |
| Perpendicular | 0.95 ± 0.04 | 91 ± 7 | 4.5 ± 0.6 | 863.4 ± 102.0 | |
| PU/C3 | Parallel | 1.31 ± 0.05 | 60 ± 4 | 7.4 ± 0.7 | 461.9 ± 42.4 |
| Perpendicular | 0.94 ± 0.04 | 102 ± 5 | 3.9 ± 0.3 | 1027.0 ± 71.5 |
| Foam System | Total Porosity (%) | Apparent Density (kg/m3) | Closed Cell Content (%) | Thermal Conductivity (mW/m·K) | |
|---|---|---|---|---|---|
| (24 h) | (7 days) | ||||
| PU | 82.3 | 37.8 ± 0.27 | 91.0 ± 1.0 | 24.7 ± 0.08 | 31.2 ± 0.28 |
| PU/C1 | 70.7 | 35.4 ± 0.19 | 92.2 ± 1.1 | 24.6 ± 0.03 | 31.6 ± 0.28 |
| PU/C2 | 65.3 | 34.8 ± 0.47 | 92.2 ± 1.4 | 24.8 ± 0.19 | 32.5 ± 0.41 |
| PU/C3 | 75.8 | 36.6 ± 0.01 | 90.7 ± 4.3 | 24.8 ± 0.16 | 32.5 ± 0.31 |
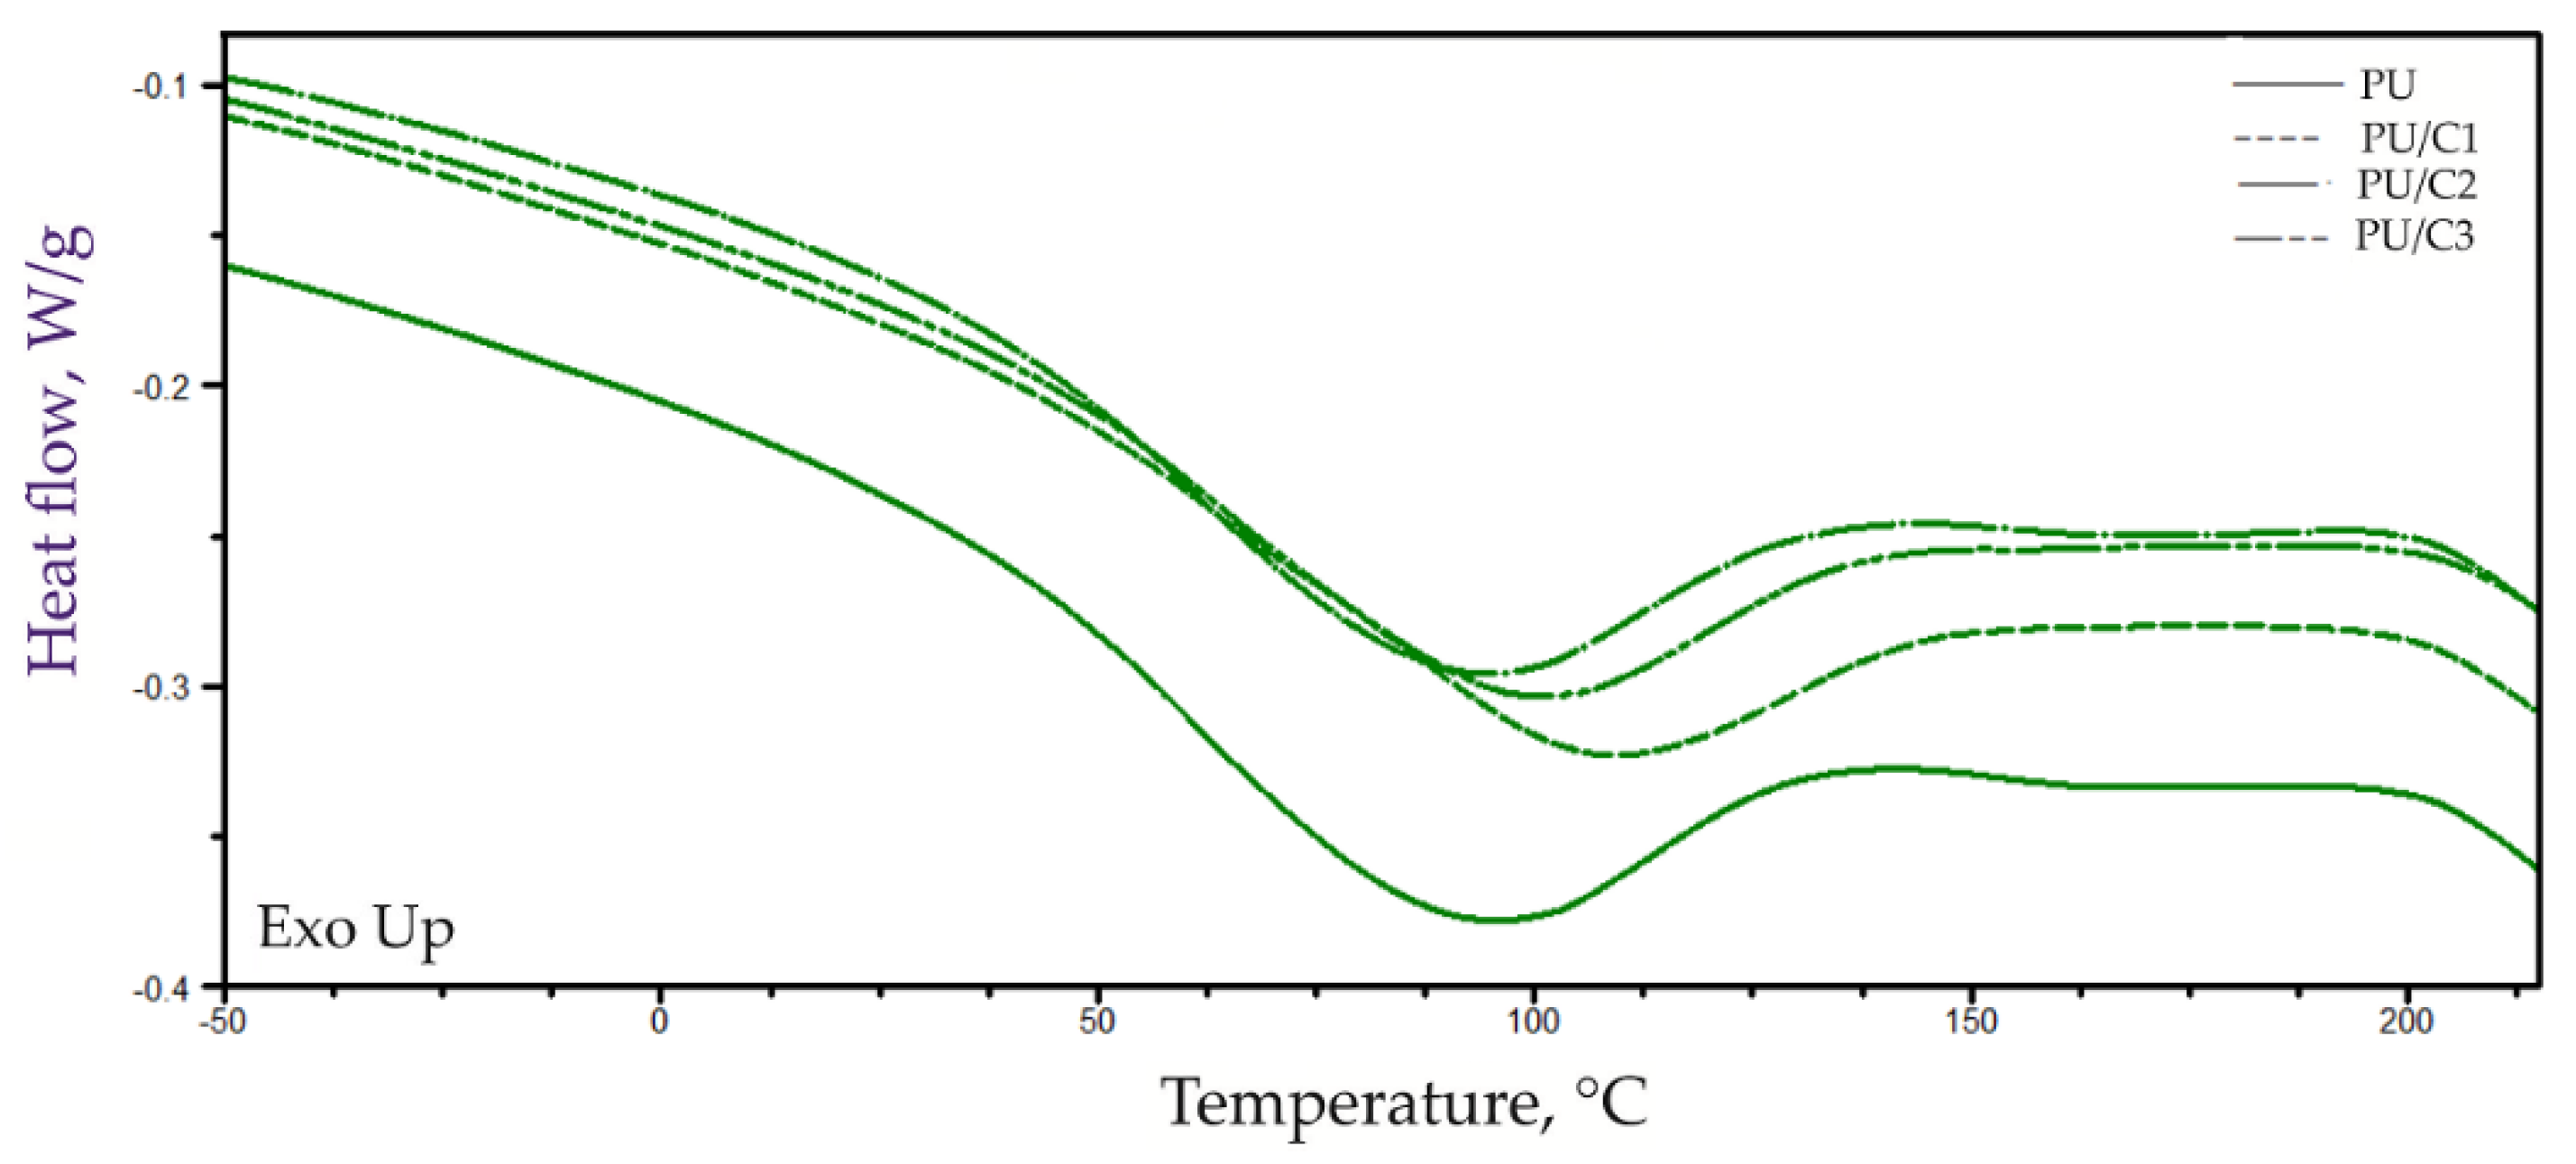
| Sample/ Parameter | PU | PU/C1 | PU/C2 | PU/C3 |
|---|---|---|---|---|
| Tt (°C) | 91.0 ± 4.0 | 85.5 ± 10.0 | 90.7 ± 0.9 | 97.5 ± 0.8 |
| ΔHt (J/g) | 38.8 ± 1.0 | 33.2 ± 2.0 | 35.5 ± 0.9 | 37.4 ± 1.5 |
| Td (°C) | 202.7 ± 0.3 | 202.6 ± 0.2 | 203.2 ± 0.3 | 204.2 ± 0.4 |
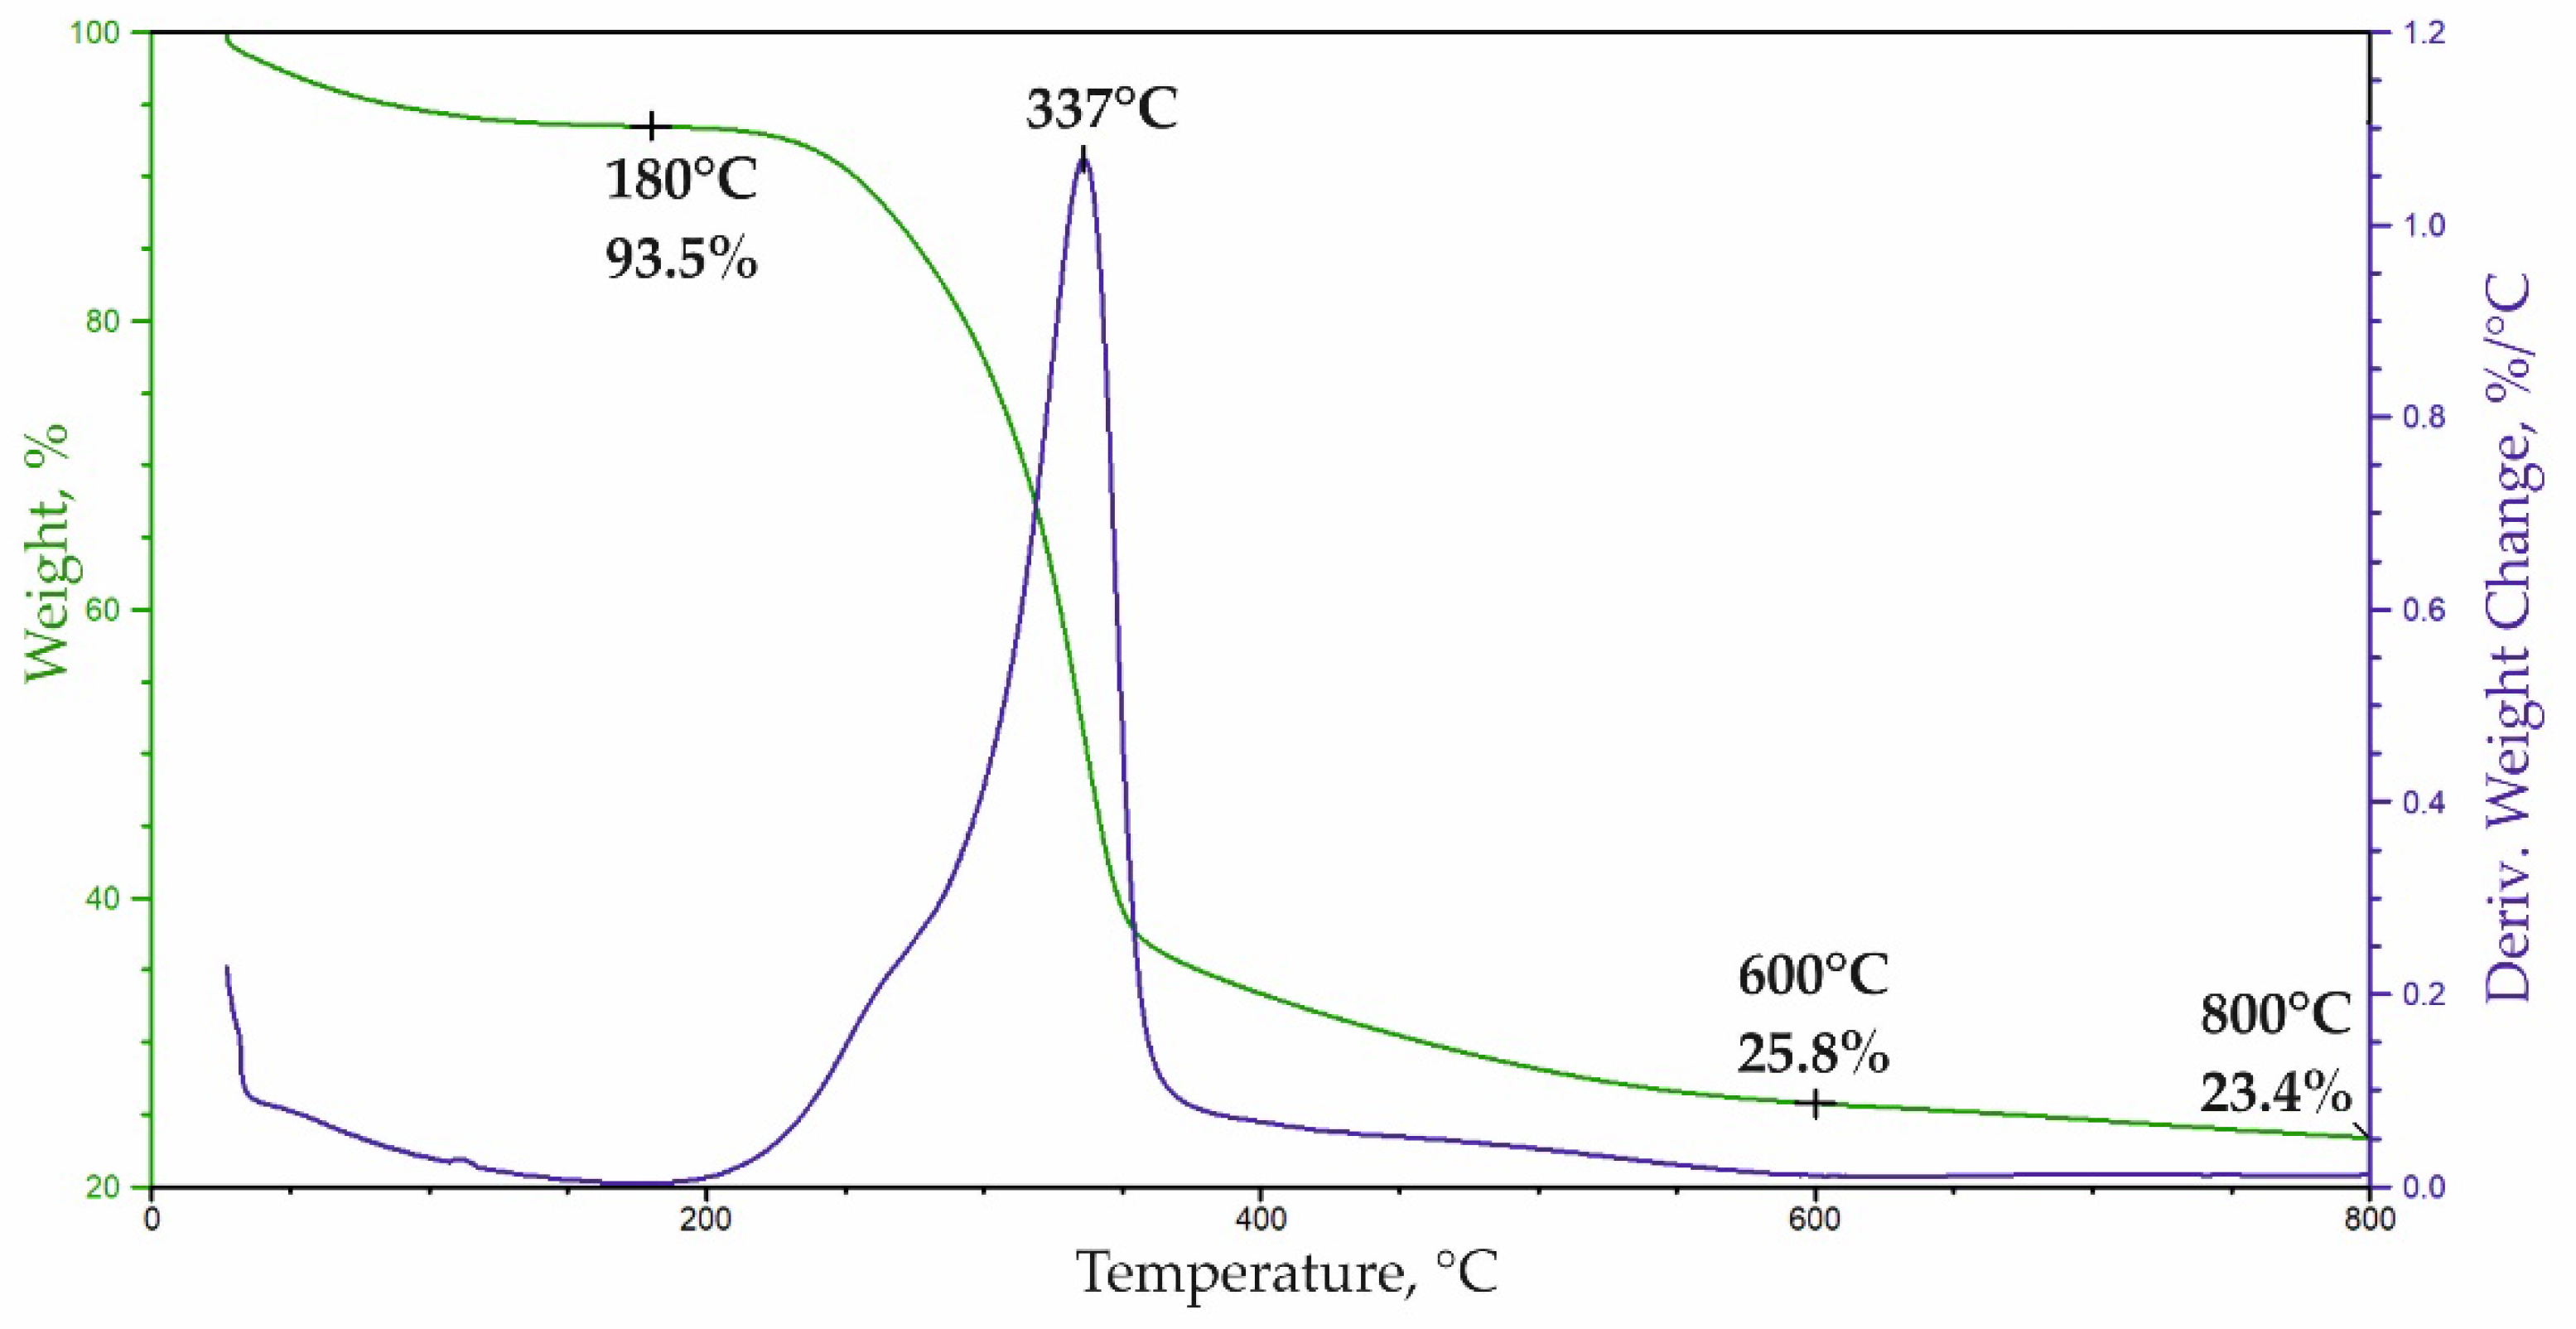
| Sample/ Parameter | Tonset (°C) | T5% (°C) | Ts1 (°C) | T1 (°C)/ V1 (%/°C) | Te1 (°C) | T2 (°C)/ V2 (%/°C) | Δm1 (%) | Te2 (°C) | Δm2 (%) | R800 (%) |
|---|---|---|---|---|---|---|---|---|---|---|
| PU | 201 | 269 | 249 | 337/0.70 | 405 | 483/0.23 | 64.0 | 532 | 21.5 | 10.1 |
| PU/C1 | 200 | 268 | 243 | 337/0.71 | 404 | 479/0.23 | 64.0 | 532 | 21.5 | 10.3 |
| PU/C2 | 201 | 267 | 243 | 337/0.71 | 405 | 479/0.24 | 64.9 | 532 | 21.6 | 10.0 |
| PU/C3 | 202 | 269 | 247 | 336/0.70 | 403 | 483/0.23 | 63.5 | 531 | 21.8 | 10.3 |
| Foam System | Temperature: −25 °C | Temperature: 70 °C Humidity: 90% | ||||
|---|---|---|---|---|---|---|
| Height | Width | Thickness | Height | Width | Thickness | |
| PU | 0.02 ± 0.08 | 0.02 ± 0.03 | −0.12 ± 0.19 | 0.67 ± 0.07 | 0.70 ± 0.07 | 0.34 ± 0.25 |
| PU/C1 | 0.06 ± 0.07 | 0.04 ± 0.07 | 0.44 ± 0.82 | 0.75 ± 0.09 | 0.77 ± 0.06 | 0.14 ± 0.16 |
| PU/C2 | −0.07 ± 0.06 | −0.01 ± 0.05 | 0.05 ± 0.11 | 0.74 ± 0.15 | 0.77 ± 0.08 | 0.08 ± 0.25 |
| PU/C3 | 0.02 ± 0.04 | −0.05 ± 0.07 | −0.05 ± 0.25 | 0.67 ± 0.09 | 0.68 ± 0.09 | 0.22 ± 0.12 |
Publisher’s Note: MDPI stays neutral with regard to jurisdictional claims in published maps and institutional affiliations. |
© 2021 by the authors. Licensee MDPI, Basel, Switzerland. This article is an open access article distributed under the terms and conditions of the Creative Commons Attribution (CC BY) license (https://creativecommons.org/licenses/by/4.0/).
Share and Cite
Uram, K.; Leszczyńska, M.; Prociak, A.; Czajka, A.; Gloc, M.; Leszczyński, M.K.; Michałowski, S.; Ryszkowska, J. Polyurethane Composite Foams Synthesized Using Bio-Polyols and Cellulose Filler. Materials 2021, 14, 3474. https://0-doi-org.brum.beds.ac.uk/10.3390/ma14133474
Uram K, Leszczyńska M, Prociak A, Czajka A, Gloc M, Leszczyński MK, Michałowski S, Ryszkowska J. Polyurethane Composite Foams Synthesized Using Bio-Polyols and Cellulose Filler. Materials. 2021; 14(13):3474. https://0-doi-org.brum.beds.ac.uk/10.3390/ma14133474
Chicago/Turabian StyleUram, Katarzyna, Milena Leszczyńska, Aleksander Prociak, Anna Czajka, Michał Gloc, Michał K. Leszczyński, Sławomir Michałowski, and Joanna Ryszkowska. 2021. "Polyurethane Composite Foams Synthesized Using Bio-Polyols and Cellulose Filler" Materials 14, no. 13: 3474. https://0-doi-org.brum.beds.ac.uk/10.3390/ma14133474