1. Introduction
As one of promising thermal energy storage modes, latent heat storage system (LHSS) mainly absorbing/releasing a large amount of thermal energy through phase change process has received a growing interest in research community for various engineering applications, due to its significantly high energy storage per unit mass or volume [
1,
2]. Moreover, during phase change process, phase change material (PCM) keeps almost constant temperature, which is crucial to achieve controllable thermal performances [
3]. Considering the relative high material cost and spatial occupation of directly using pure PCM as separate heat storage element, PCM is preferable to be incorporated into matrix material (e.g., cement, mortar, and concrete) to form composite LHSS in practice [
4,
5,
6,
7,
8]. However, the direct incorporation of bulk PCM in matrix material may lead to poor shape-stabilizing problem, which can bring molten PCM to leak and affect the composite’s thermal performance. To overcome this obstacle, encapsulating PCM to form shape-stabilizing micro or macro particles would be a good choice in engineering applications [
9,
10,
11].
On the other hand, it is not feasible to directly simulate the melting process of PCM, especially large amounts of PCM particles embedded in composite, because the melting process of PCM inevitably involves natural convection (NC) of liquid phase driven by temperature gradient in timely-changed liquid region, which generally requires very refined calculating mesh, tremendous simulating time, large memory capacity and complex coupled theory of heat conduction, fluid flow and moving solid–liquid interface [
12]. It has been demonstrated that NC has positive effect on the total melting rate of PCM [
13,
14,
15], but its strength is affected by heating mode, PCM shape, size, and position [
16,
17,
18,
19,
20]. Hence, the contribution of NC generally cannot be ignored in the practical application of PCM and its accelerating mechanism should be discussed comprehensively.
To simplify the simulating complexity of NC-driven melting process of PCM, various strategies have been practiced by community researchers. One of these methods is introducing an equivalent pure conduction (EC) model, in which enlarged thermal conductivity of PCM is exploited to represent the contribution of NC [
14,
21,
22,
23,
24], so that simpler heat conduction behavior is taken into consideration only in the equivalent model, as indicated in
Figure 1a. In this context, there are a limited number of published researches available to quantitatively depict the contribution of NC in a spherical container. For example, an improved equivalent thermal conductivity (ETC) expression accounting for the NC effect for unconstrained and constrained meltings of n-octadecane enclosed in a single spherical capsule has been derived to numerically investigate the thermal performance of a whole tank consisting of 9 × 9 × 20 spherical capsules [
23,
24]. Similar melting fraction-based scheme with modified ETC for PCM melting was proposed by Gao et al. [
25]. Different to the previous ETC approximations (see discussions in [
22,
25,
26]) with constant characteristic length, the improved expression in a form:
is a function of the surface temperature difference
and the varied characteristic length
. In Equation (1),
is the sought ETC,
is the thermal conductivity of liquid phase,
is the surface temperature of spherical capsule,
is the melting temperature of PCM,
is the radius of solid PCM, which is related to the time-dependent liquid fraction, and
is the inner radius of spherical capsule. Besides,
and
are constant coefficients.
It should be noted that the developed ETC correlation emphasizes on capturing the melting process of PCM and are derived from the concentric sphere assumption (See
Figure 1a), which is given based on the constrained melting (See
Figure 1b). This means that the solid PCM will remain spherical and hold its position during the melting process. However, this is different to the real melting physics [
27,
28,
29,
30], in which the solid–liquid interface becomes non-spherical due to the nature convection of liquid PCM. Especially for the unconstrained melting (See
Figure 1c), the solid PCM may drop down to contact the bottom of sphere, so the melting process is greatly different to the constrained melting. Moreover, it will cause errors to describe the shape of the non-spherical liquid region in the melting process [
25]. In addition, in approximating correlation (1), the ETC is a function of time and space, thus it needs to be modified for each time step according to the molten liquid fraction to be determined in advance. This means that an iterative scheme is required and the iterative error may accumulate in depicting the melting process of PCM. Thus, correlation (1) is not easy to be used in practice.
The purpose of this study is to provide a practically simple and acceptable way to quantitatively depict the contribution of complex natural convection (NC) to the melting process. To this end, the overall energy storage efficiency for the PCM melting is addressed to reduce the difficulty in determining time-dependent characteristic length. Consequently, a new simplified empirical correlation of ETC is proposed by considering the consistency of total melting time (TMT) calculated by the NC and EC models. In practice, the TMT determines the amount of stored or released energy for PCM of given mass. Therefore, focusing on TMT and abandoning to track the complex evolution of solid–liquid interface may bring great convenience to engineers. To do this, the melting experiments of constrained and unconstrained PCMs in a spherical enclosure are firstly conducted to exhibit the difference of melting processes, and then the experiments are simulated to further explore the accelerating mechanism of NC by COMSOL Multiphysics. Next, the unconstrained melting is particularly addressed because it is closer to the real-life environment, and the effects of the PCM sphere size and the heating temperature applied on the spherical surface are numerically investigated to reveal the relation of the TMT with respect to the two critical controlling parameters, from which the accelerating effect of NC is approximately represented by enlarging thermal conductivity of PCM in an EC model. Finally, the effectiveness of the proposed empirical correlation is demonstrated by comparing the TMT calculated by the NC and EC models. This will bring great convenience in coping with a large-scale composite LHSS filled with spherical PCM capsules.
2. Experiment Setup
The white solid paraffin wax with a melting temperature of
and latent heat of fusion of
was purchased from Shanghai Joule wax company and was used as the phase change material in the work. The thermos-physical properties of paraffin wax are tabulated in
Table 1 [
14].
The thin-wall glass sphere with inner diameter of 62.04 mm is selected as an enclosure of PCM. The wall thickness is about 2 mm. The glass spherical enclosure has a short opening tube to facilitate the filling of the liquid PCM into the enclosure as well as the removing of air bubbles by shaking the liquid PCM during the filling process. Then, the sample is sealed with a rubber gasket and mounted on a steel supporter. The filled enclosure is placed into a refrigerator with environmental temperature 12 °C at least 24 h. The environmental temperature in the refrigerator is set to be significantly lower than the melting temperature
of the paraffin wax to ensure the fast solidification of the liquid paraffin. Besides, to monitor the temperature variation at the central point of the sphere, a constrained sample is prepared as well, in which a thermocouple attached to a slender wood rod is embedded at the specific position (see
Figure 2).
As shown in
Figure 3, the experimental system consists of a thermostatic water tank with a plastic top, a digital camera, and a temperature acquisition device (Applent AT4524 32-Channel Thermocouple Temperature Meter from Applent Instruments, Changzhou, China) connected to a desktop and the PCM container to be tested. The temperature acquisition device AT4524 has a resolution of 0.1 °C, and the k-type thermocouple connected to it has a measurement accuracy ±0.8 °C in the temperature range 0~1350 °C. First, chilly water was poured into the water tank and then was heated by an electric heating system. The setting water temperature was 318.15 K, while the actual water temperature in the tank usually had about 1 °C less than it. Next, the capsule sample to be tested was quickly taken out from the refrigerator and was then placed into the hot water to heat it. During the test, the short tube of the spherical container was mounted on the top through an opening hole. Also, the camera was used to record the transient position and shapes of the phase change interface at regular intervals during the melting process.
3. Computational Model
Due to the limitations of experiment, it is difficult to observe the more detailed information on fluid flow and temperature profile. Therefore, establishing a proper numerical model is necessary to extend the experimental research. Here, due to the uniform heating condition applied on the outer wall of PCM sphere and the geometric symmetry feature of the PCM sphere, a two-dimensional axisymmetric finite element model is developed using COMSOL Multiphysics software (see
Figure 2) to simulate the heat transfer and melting of the PCM sphere. Three physics, including the heat conduction in the solid, the heat conduction in the liquid, and the flow driven by natural convection in the liquid, should be accounted for.
It is assumed that the flow of liquid paraffin is laminar, incompressible, and Newtonian. Also, the liquid and solid phases are assumed to be isotropic and homogeneous, and their properties keep constant in the melting process. Moreover, a mushy zone is assumed to exist along the solid–liquid interface to ensure the solving stability. In this zone, the phase change is assumed to occur in a small temperature range , where and are and , respectively, and is a small temperature interval, i.e., 1 K.
Based on these assumptions, the following partial differential equation system is implemented to analyze the melting process of paraffin [
14,
15,
31,
32,
33]:
Energy Equation:
where
is the effective density,
is the latent heat of fusion,
is the effective thermal conductivity,
is the effective specific heat capacity,
is the dynamic viscosity,
is the liquid volume fraction,
is the time variable,
is the velocity vector,
is the temperature field, and
is the pressure field. Besides,
is the volume force vector related to the effect of natural convection, and
is the additional volume force vector which is introduced to speed up the calculational efficiency by forcing a trivial solution of
in the solid phase.
Practically, when the density fluctuation caused by temperature variation is small, the flow of liquid phase can be assumed to be driven by a buoyancy force, which can be given by the following Boussinesq approximation for the NC-driven flow:
where
is the reference temperature, which is usually assumed to be the melting temperature
.
is the thermal expansion coefficient and
is the acceleration of gravity.
While, the additional term
is usually given by:
with Darcy assumption:
where
is a big constant reflecting the morphology of the melting front and
is a small constant used to avoid division by zero.
Obviously, in the melting process, the liquid volume fraction
is related to the temperature field
in the PCM and can be defined by:
Based on the definition of the liquid volume fraction, the effective thermal conductivity
, the effective density
and the effective specific heat capacity
can respectively be given by the following mixture relations:
where the subscript
represents the solid phase and the subscript
represents the liquid phase.
is the standard Gaussian function which is zero everywhere except the temperature interval
. More importantly, its integral is equal to 1.
Moreover, the solid phase can be regarded as a liquid with very high viscosity, so the dynamic viscosity
in Equation (3) can be describe by the parameter
in the simulation:
In addition, the temperature boundary condition is applied on the outer surface of the container. The heat conduction only takes place along the thickness of the glass wall of the container. The thermal conductivity of glass is set as 0.81 W/m/K, which is chosen from COMSOL Material Library.
In the finite element simulation coupling the fluid flow and the heat conduction in solid, an extremely refined mesh with triangular axisymmetric element is used to obtain the grid-independent convergence solution. Besides, the boundary layer technology is used near the common interface between the PCM and the glass inner wall, and the number of boundary layers are set as 7, as shown in
Figure 4. The total number of elements are 14,036. In addition, the computing time step is set as 0.1 s in the simulation. The direct solver PARDISO in COMSOL is used.
4. Results and Discussion
In this section, the melting experiments are simulated to further explain the difference of melting process of constrained and unconstrained PCM and explore the melting mechanism driven by the natural convection. In the simulation, the initial temperature is , and the heating temperature applied on the surface of the spherical container is . Then, a detailed computational analysis is performed for the unconstrained melting, which is closer to the real-life physics, and a correlation of equivalent thermal conductivity is proposed to simplify the analysis.
4.1. Validation of the Numerical Model
4.1.1. Constrained Melting
Figure 5 shows the transient shapes of the solid paraffin within a spherical container with inner diameter of 64.04 mm during the constrained melting process. The heating temperature is set as
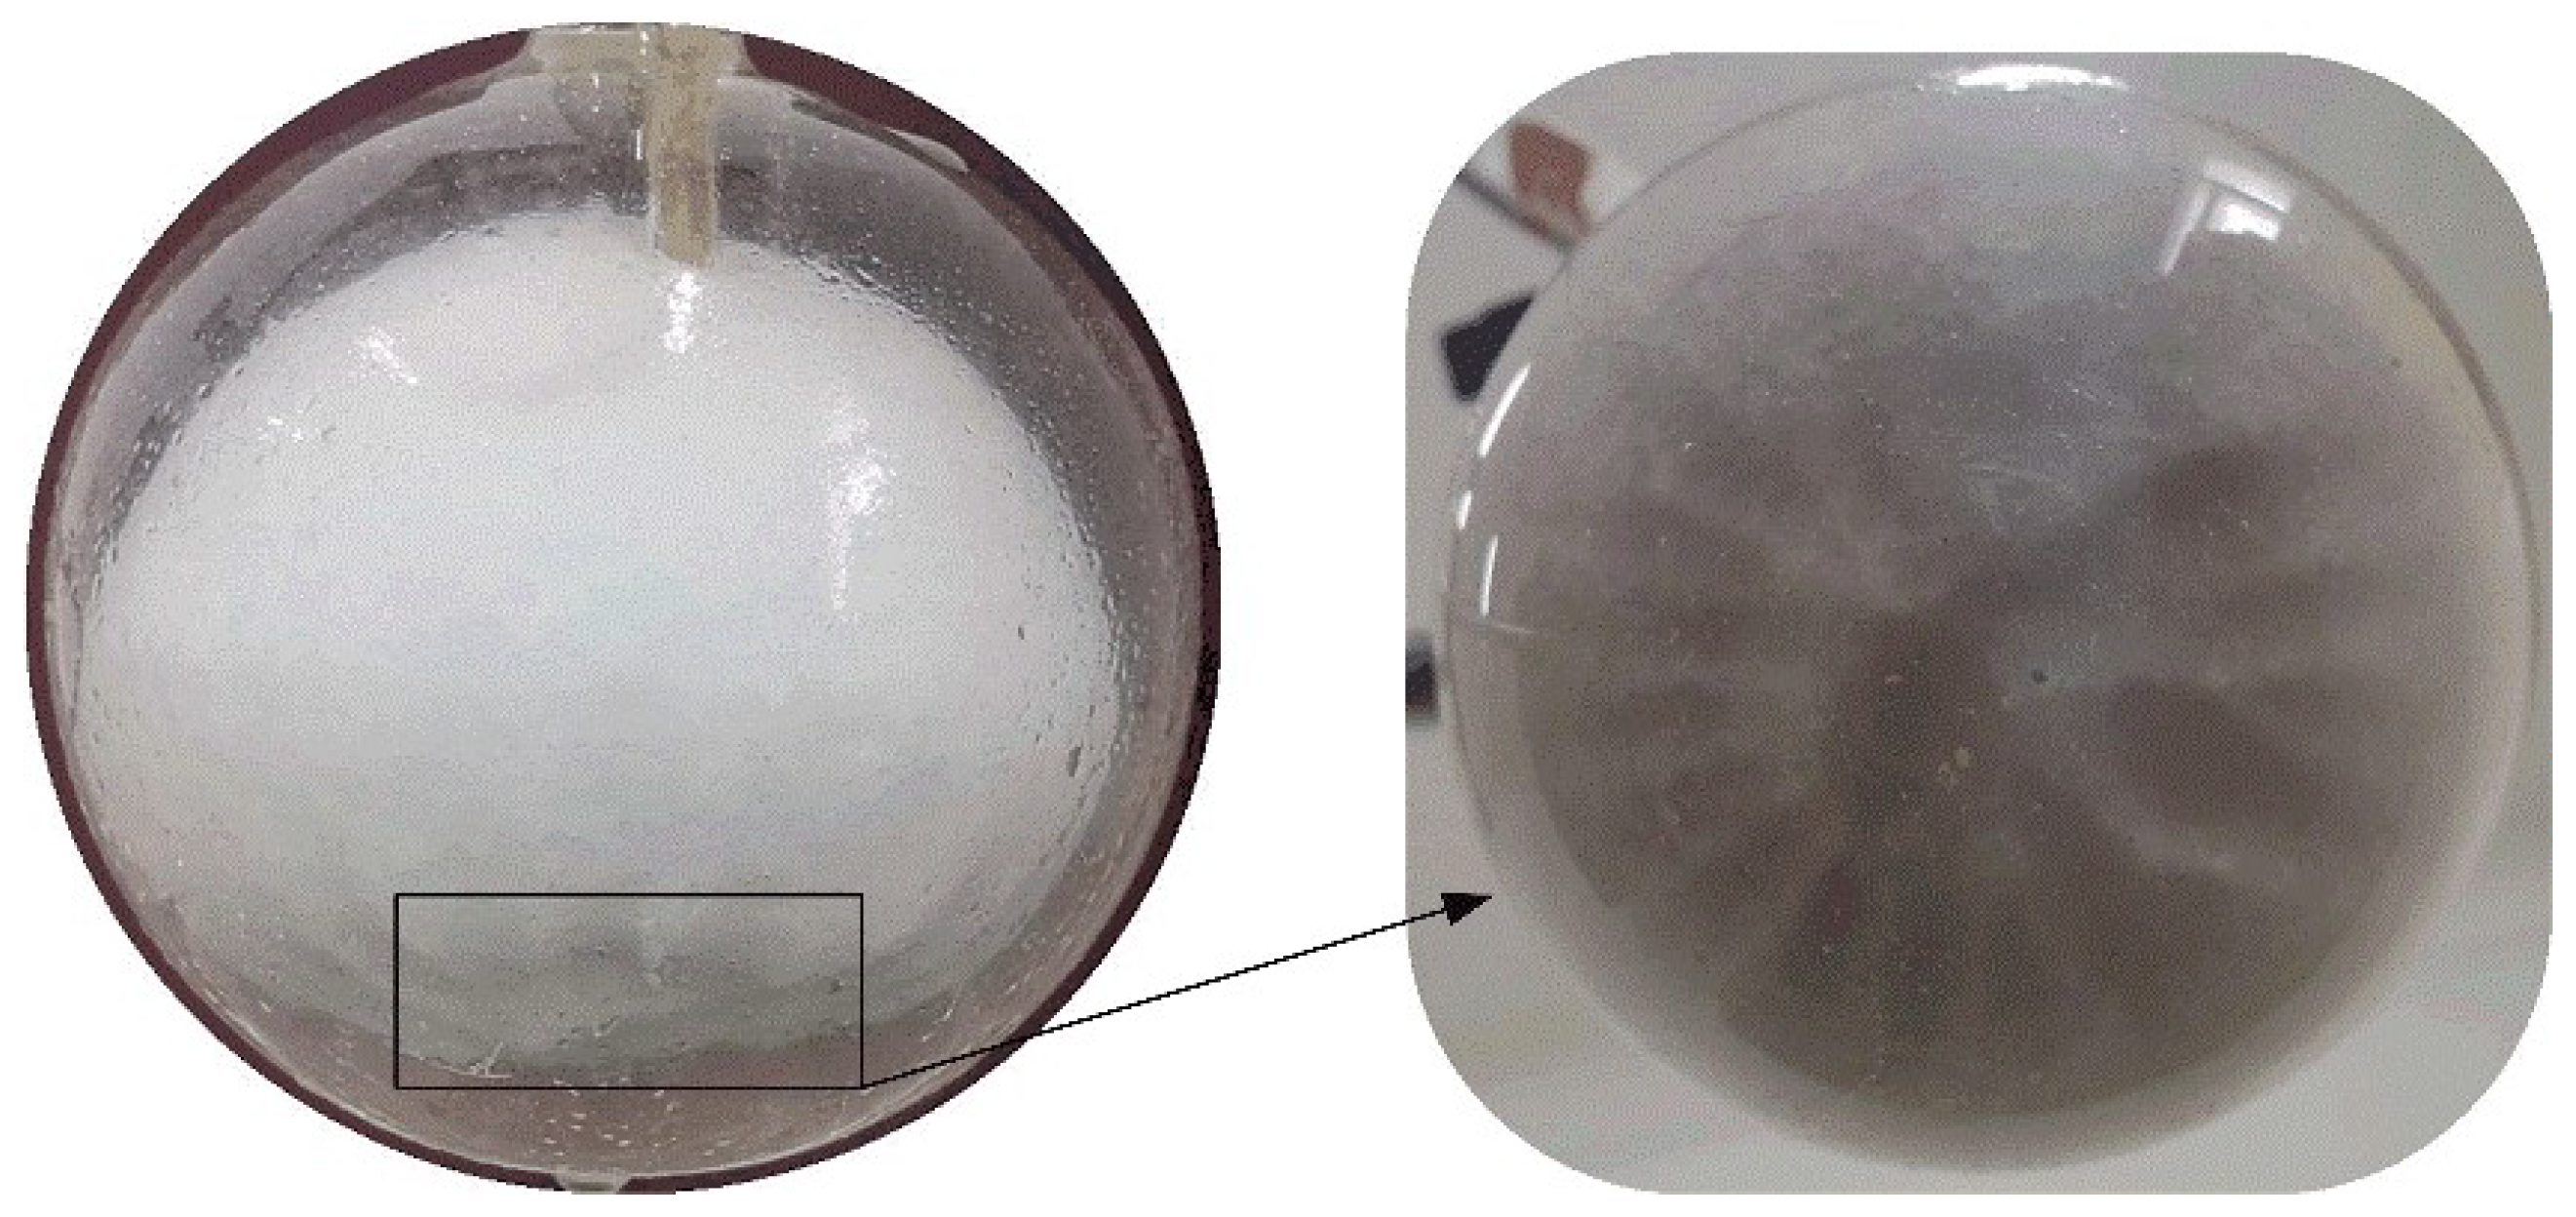
. It is seen that the solid paraffin holds its position under the constraint of the thermocouple and the slender wood rod, but its volume gradually shrinks with the evolution of melting. Initially, the solid PCM is wrapped in a very thin liquid film, indicating that the melting of paraffin is dominated by heat conduction between the inner surface of the container and the solid paraffin at this stage. As the melting of the solid PCM continues, the paraffin in the upper part melts faster than that in the lower part, and as a result, the solid–liquid interface becomes non-spherical and the solid PCM becomes smaller and smaller. Simultaneously, the portion of liquid PCM occupying the top region is always higher than that at the bottom region. This may be attributed to the lateral whirl flow caused by NC of liquid paraffin. At the final stage, the remaining solid PCM drops from the constrained position and contacts the bottom of the container until it fully melts. Besides, during the melting process, the bottom surface of the solid PCM is observed to become bumpy (see
Figure 6). This may because of the scouring action of bottom whirlpool flow caused by the rising up of the warmer liquid from the bottom and the sink of the cooler liquid. As a whole, the lateral NC leads to higher rate of melting than the bottom NC. As a comparison,
Figure 5 also displayed the simulated melting fronts in the paraffin at different time instances. The blue and red colors represent the solid and liquid phases, respectively, and the black arrow represents the velocity direction. It is found from
Figure 5 that the evolution of the simulated melting front is basically consistent with the experimental results, although the melting time in the experiment is slightly longer than that in the simulation. This can be attributed to the fact that the actual heating temperature in the experiment is slightly lower than the desired one, and the thermal resistance between the glass wall and the PCM, the glass wall and the surrounding water is ignored in the computation.
Further,
Figure 7 shows the variation of computational temperature at the center point A of the spherical container for the constrained melting case (see
Figure 2). From
Figure 7, it is observed that the melting process around the center point A is roughly divided into three stages: solid heating (stage 1), phase transition (stage 2), and liquid heating (stage 3). At stage 1, the PCM around point A keeps the solid state, so heat is transferred to it in the form of heat conduction. Gradually, as the temperature exceeds the melting point, the solid PCM melts and becomes liquid phase. At this stage, the temperature almost keeps constant. Finally, at stage 3, the heat conduction and flow in the liquid PCM dominates the temperature at point A to rise fast and reach the heating temperature at the end. Besides, it should be observed from
Figure 7 that the time needed for the melting of PCM at point A in the numerical simulation is slightly shorter than that in the experiment. The reason may be the relatively lower actual heating temperature and the presence of interfacial thermal resistance in the experiment. In spite of this, the experimental result shows a similar trend to the simulated result.
To further explain the NC effect on the melting of solid PCM in the spherical container, the distributions of velocity and temperature at 70 min are plotted in
Figure 8, from which the thermally stable and unstable regions of the liquid PCM are clearly observed, and the separating line between them is close to the top of the mushy zone. In the stable region, the thermal energy transfer mainly happens by heat conduction. However, it is dominated by NC in the three unstable regions. In the two big unstable regions, the hot liquid moves upwards along the inner wall of the glass sphere and the cold liquid moves downwards along the melting front. Therefore, anticlockwise whirlpool flows respectively form in the two regions, in which the melting of solid PCM accelerates. Moreover, the bottom whirlpool flow makes the bottom of solid PCM become bumpy, while the lateral whirlpool flow makes the solid–liquid interface of PCM become inclined. Additionally, there is a small unstable region between the two big unstable regions, in which a clockwise whirlpool flow takes place. As a result, the melting front becomes more and more irregular as the melting goes on.
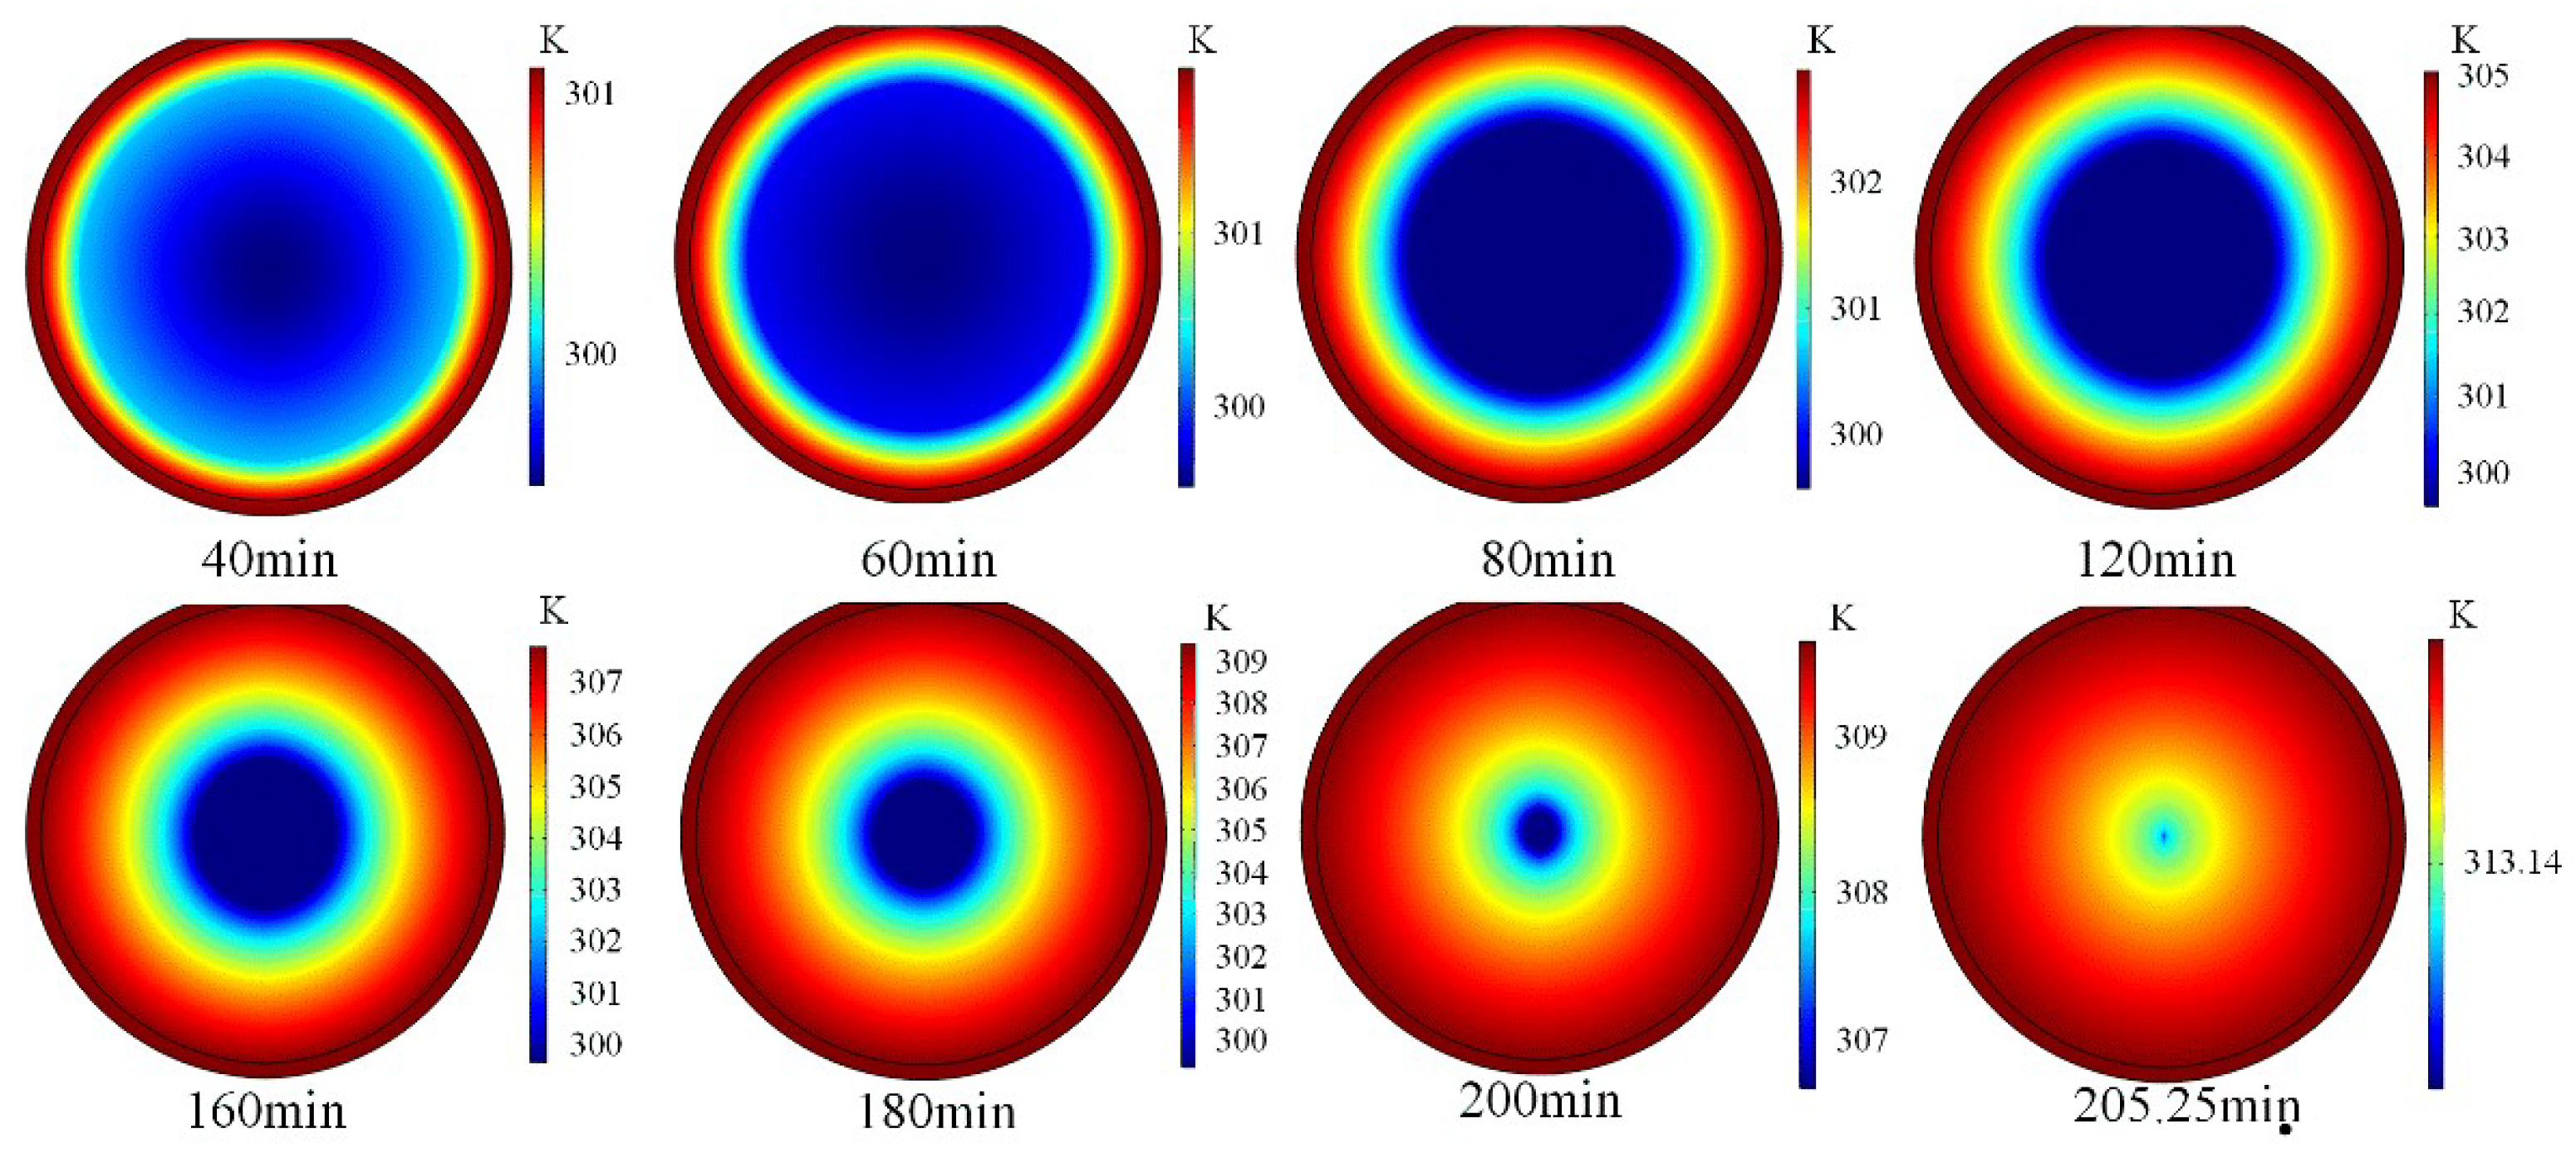
Besides, to compare the accelerating effect of NC on the melting of paraffin, the model without NC, that is the pure heat conduction (PC) only, is simulated and the melting front is displayed in
Figure 9, which indicates that the melting front keeps concentric spherical shape in the melting process under the heat conduction behavior transferring from outwards to inwards, and its size gradually decreases as the melting goes on. This is typically different to the NC model. Moreover, the total melting time (TMT) required for completing the paraffin melting is 205 min, which is significantly longer than 113 min when the NC is considered.
4.1.2. Unconstrained Melting
For the case of unconstrained melting, no temperature data can be directly recorded in the experiment, so only the shape and location of the melting front are observed. Contrary to the constrained melting, the unconstrained melting in the spherical container exhibits different experimental phenomenon [
20], as displayed in
Figure 10. At the beginning, the paraffin melts to form a thin liquid layer along the interior surface of the spherical shell. Then, the solid PCM sinks to contact the bottom of the container and the liquid PCM rises up to form lateral whirlpool flow, due to the higher density of the solid paraffin than the liquid paraffin. Besides, because of the contact of the solid PCM with the bottom of container, the heat conduction is dominant near the bottom region of the container and has a higher melting efficiency than the NC. As a result, the unconstrained melting shows a faster melting speed than the constrained melting.
Besides,
Figure 10 shows the variation of the melting front at specific time instances obtained from the computational model. It can be seen that the computational profiles of the melting front are highly similar to the experimental profiles. The thermal transfer in the upper region of the PCM sphere is mainly NC, which causes the melting front inclined. Moreover, due to the density difference between the liquid and solid PCM, the solid PCM gradually moves downwards and contacts the bottom of the container as the melting goes on. Therefore, the heat conduction takes place at the bottom of solid PCM. Moreover, the downward movement of the sold PCM pushes the warm liquid layer between the solid PCM and the inner wall of the sphere to rise along the lateral wall of the sphere. This enhances the strength of lateral whirl flow and accelerates the melting of the upper region of the PCM sphere. Additionally, the total melting time is about 100 min for the experiment and 85 min for the computational model, respectively. The TMT difference of the experiment and the numerical simulation may be attributed to the ignored thermal resistance between the glass wall and the PCM in the simulation and the relatively lower actual heating temperature in the experiment.
4.2. Size Effect of PCM Sphere on Natural Convection
Next, the size effect of PCM sphere on NC is investigated using the verified numerical model for the unconstrained melting case, which is closer to the real-life applications. The wall thickness of the spherical container is 1 mm, and the sphere size is adjusted by the inner radius
changing from 30 to 2 mm. The solid wall material is steel with thermal conductivity 44.5 W/m/K from COMSOL Material Library. Hereafter, the steel wall is used because the macro-encapsulated PCM sphere by a steel shell is particularly used for potential energy building applications. The steel shell can provide both sufficient protection to the PCM core and excellent thermal and mechanical properties of the PCM sphere [
11,
34]. A heating temperature
is uniformly applied on the outer surface of steel sphere.
is the temperature difference of the heating temperature
and the melting temperature
of the PCM.
Figure 11 displays the variation of liquid fraction against the heating time for the case of the temperature difference
. It can be seen from
Figure 11 that the liquid fraction increases as the melting goes on. Moreover, as the size of PCM sphere decreases, the needed TMT decreases as well. As comparison, the variation of liquid fraction for the PC model is plotted in
Figure 11 as well. It is observed that the TMT of the PC model obviously becomes longer than that of the NC model, and the difference of them becomes more significant as the sphere becomes larger. However, it is interesting that the PC and NC models give almost the same TMT when
. This means that the melting of the PCM in a small sphere is mainly dominated by heat conduction, instead of NC, whose strength is suppressed in a small cavity.
To clearly illustrate the variation of TMT, various
and
are considered and the results are listed in
Table 2, from which it is observed that the TMT for the NC model (
) is always less than that for the PC model (
), owing to the accelerating effect of NC on the melting of PCM. Moreover, both
and
change in terms of the spherical inner radius
and the temperate difference
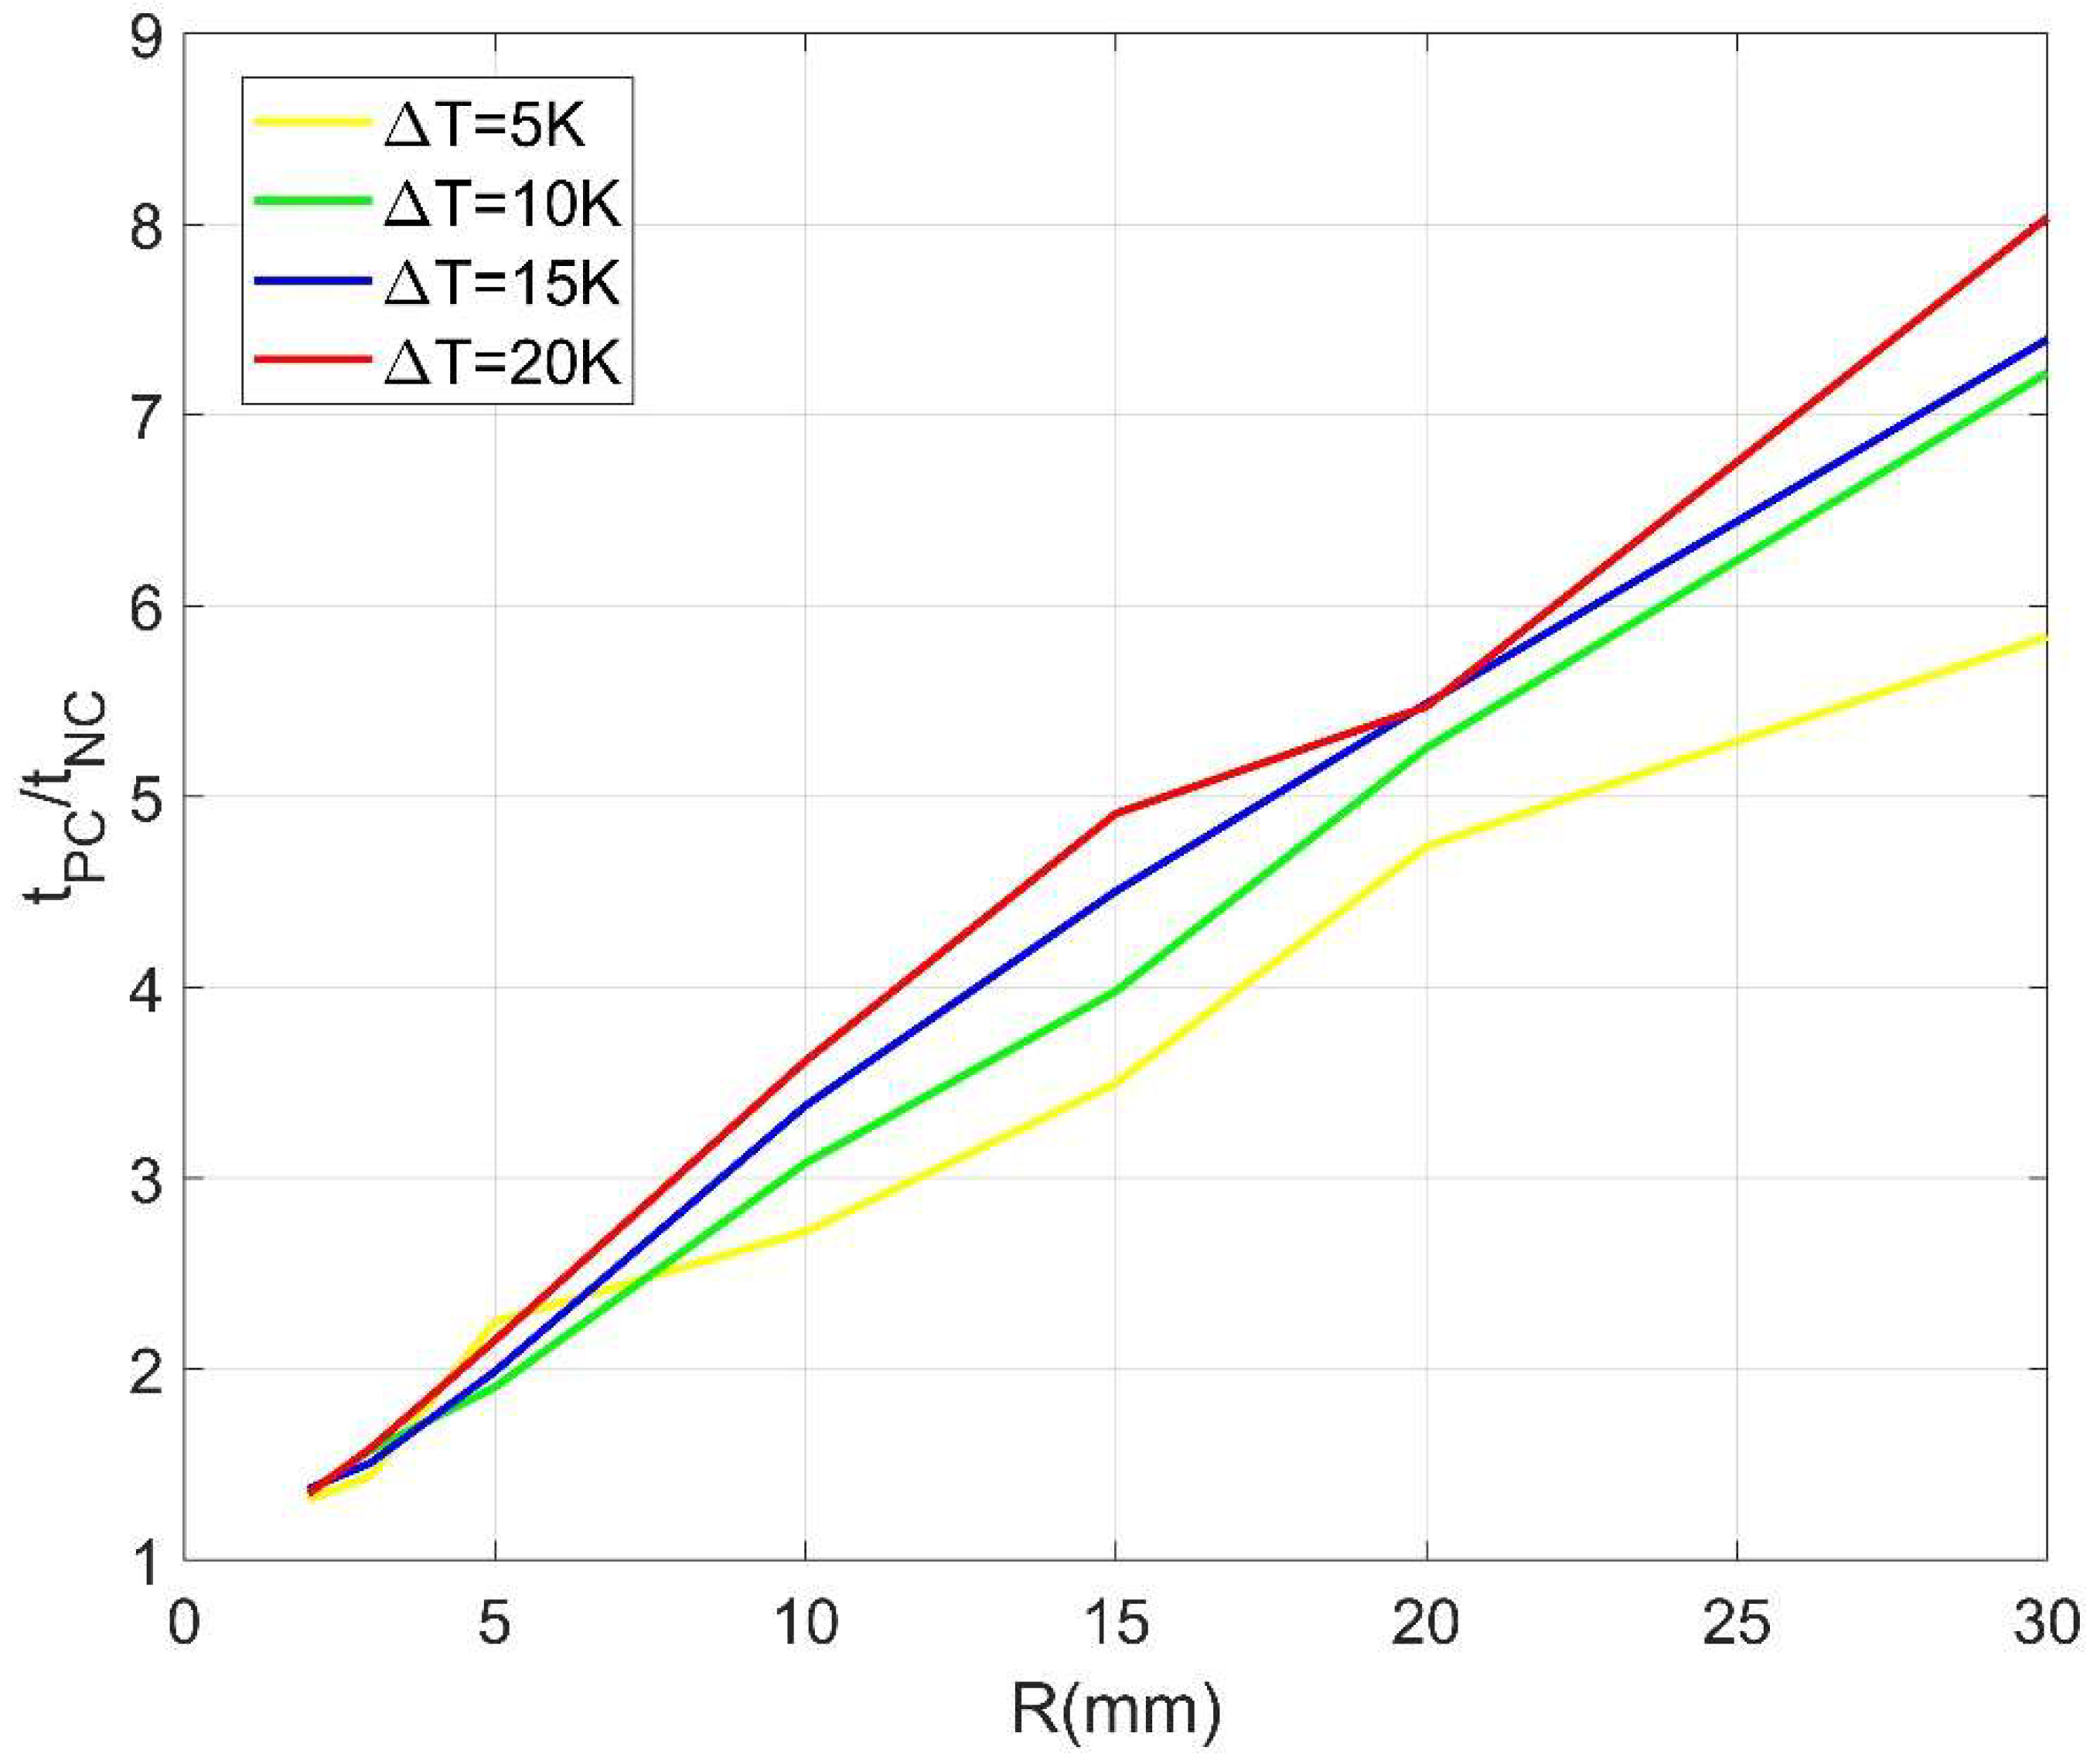
. Generally, the smaller the sphere size, and/or the higher the heating temperature, the shorter the TMT. Interestingly, it is found that the TMT ratio
basically descends with the decrease of sphere size and reaches a relative stable value independent of the heating temperature when
is 2 mm, as displayed in
Figure 12. This indicates that the NC effect is size-dependent. It becomes weaker for the smaller size of sphere and can be ignored in practice when
or less.
4.3. Equivalent Thermal Conductivity Model
From the results above, it is confirmed that the size-dependent NC plays an import role in the melting process of PCM. However, it is not feasible to take the complex NC effect into account in the practical engineering applications, especially for composite LHSS including amounts of encapsulated PCM particles, because the simulation procedure of NC involves complex coupled theory and inevitably leads to tremendous computing cost of time and memory capacity. To simplify this procedure, in this work, an equivalent pure conduction (EC) model is established by counting the contribution of NC by an enlarged thermal conductivity of PCM. In the EC model, only the energy equation involving only heat conduction is considered for the phase change simulation, so a lot of computing cost can be saved.
In order to distinguish the inherent thermal conductivity
of PCM, the enlarged thermal conductivity in the EC model is named as equivalent thermal conductivity (ETC)
. Because of the fact that the higher the thermal conductivity of PCM, the shorter the TMT, it is reasonable to assume that the TMT of PCM and the ETC in the EC model basically meets the following approximating inverse proportional relation
from which
can be evaluated by the results of
listed in
Table 2 for different heating temperatures and sphere sizes. It is noting that the coefficient 1.061 is set to ensure the TMT calculated by the target value of
in the EC model is closest to that in the NC model.
In the practical application, the ETC
can be expressed as a function of
and
. Generally, the approximate expression of
can be written as [
33]:
where:
is Rayleigh number:
stands for Grashof number, and:
denotes Prandtl number.
The data fitting of the target value of
and the corresponding parameters
and
R gives:
To check the accuracy of the proposed approximate correlation (14) with the fitting coefficients (18), the TMT of PCM in the EC model with the new
given in Equation (14) is evaluated for the case of
and is compared to that from the NC model. Results in
Table 3 indicate that the EC model can be used to effectively treat the melting problem of PCM sphere with great convenience.
It is worth pointing out that the correlation (14) is given under the condition of constant heating temperature on the surface of sphere. For composite LHSS including amounts of encapsulated PCM microspheres, the surface temperature of each microsphere can be assumed to be uniform due to the relatively small size of microsphere compared to the composite bulk, and can be evaluated by averaging the surface temperature of each microsphere.


