
Correlations of Geometry and Infill Degree of Extrusion Additively Manufactured 316L Stainless Steel Components

 ,
, 
 ,
, 
Abstract
:1. Introduction
1.1. Extrusion Based Additive Manufacturing of High-End Parts
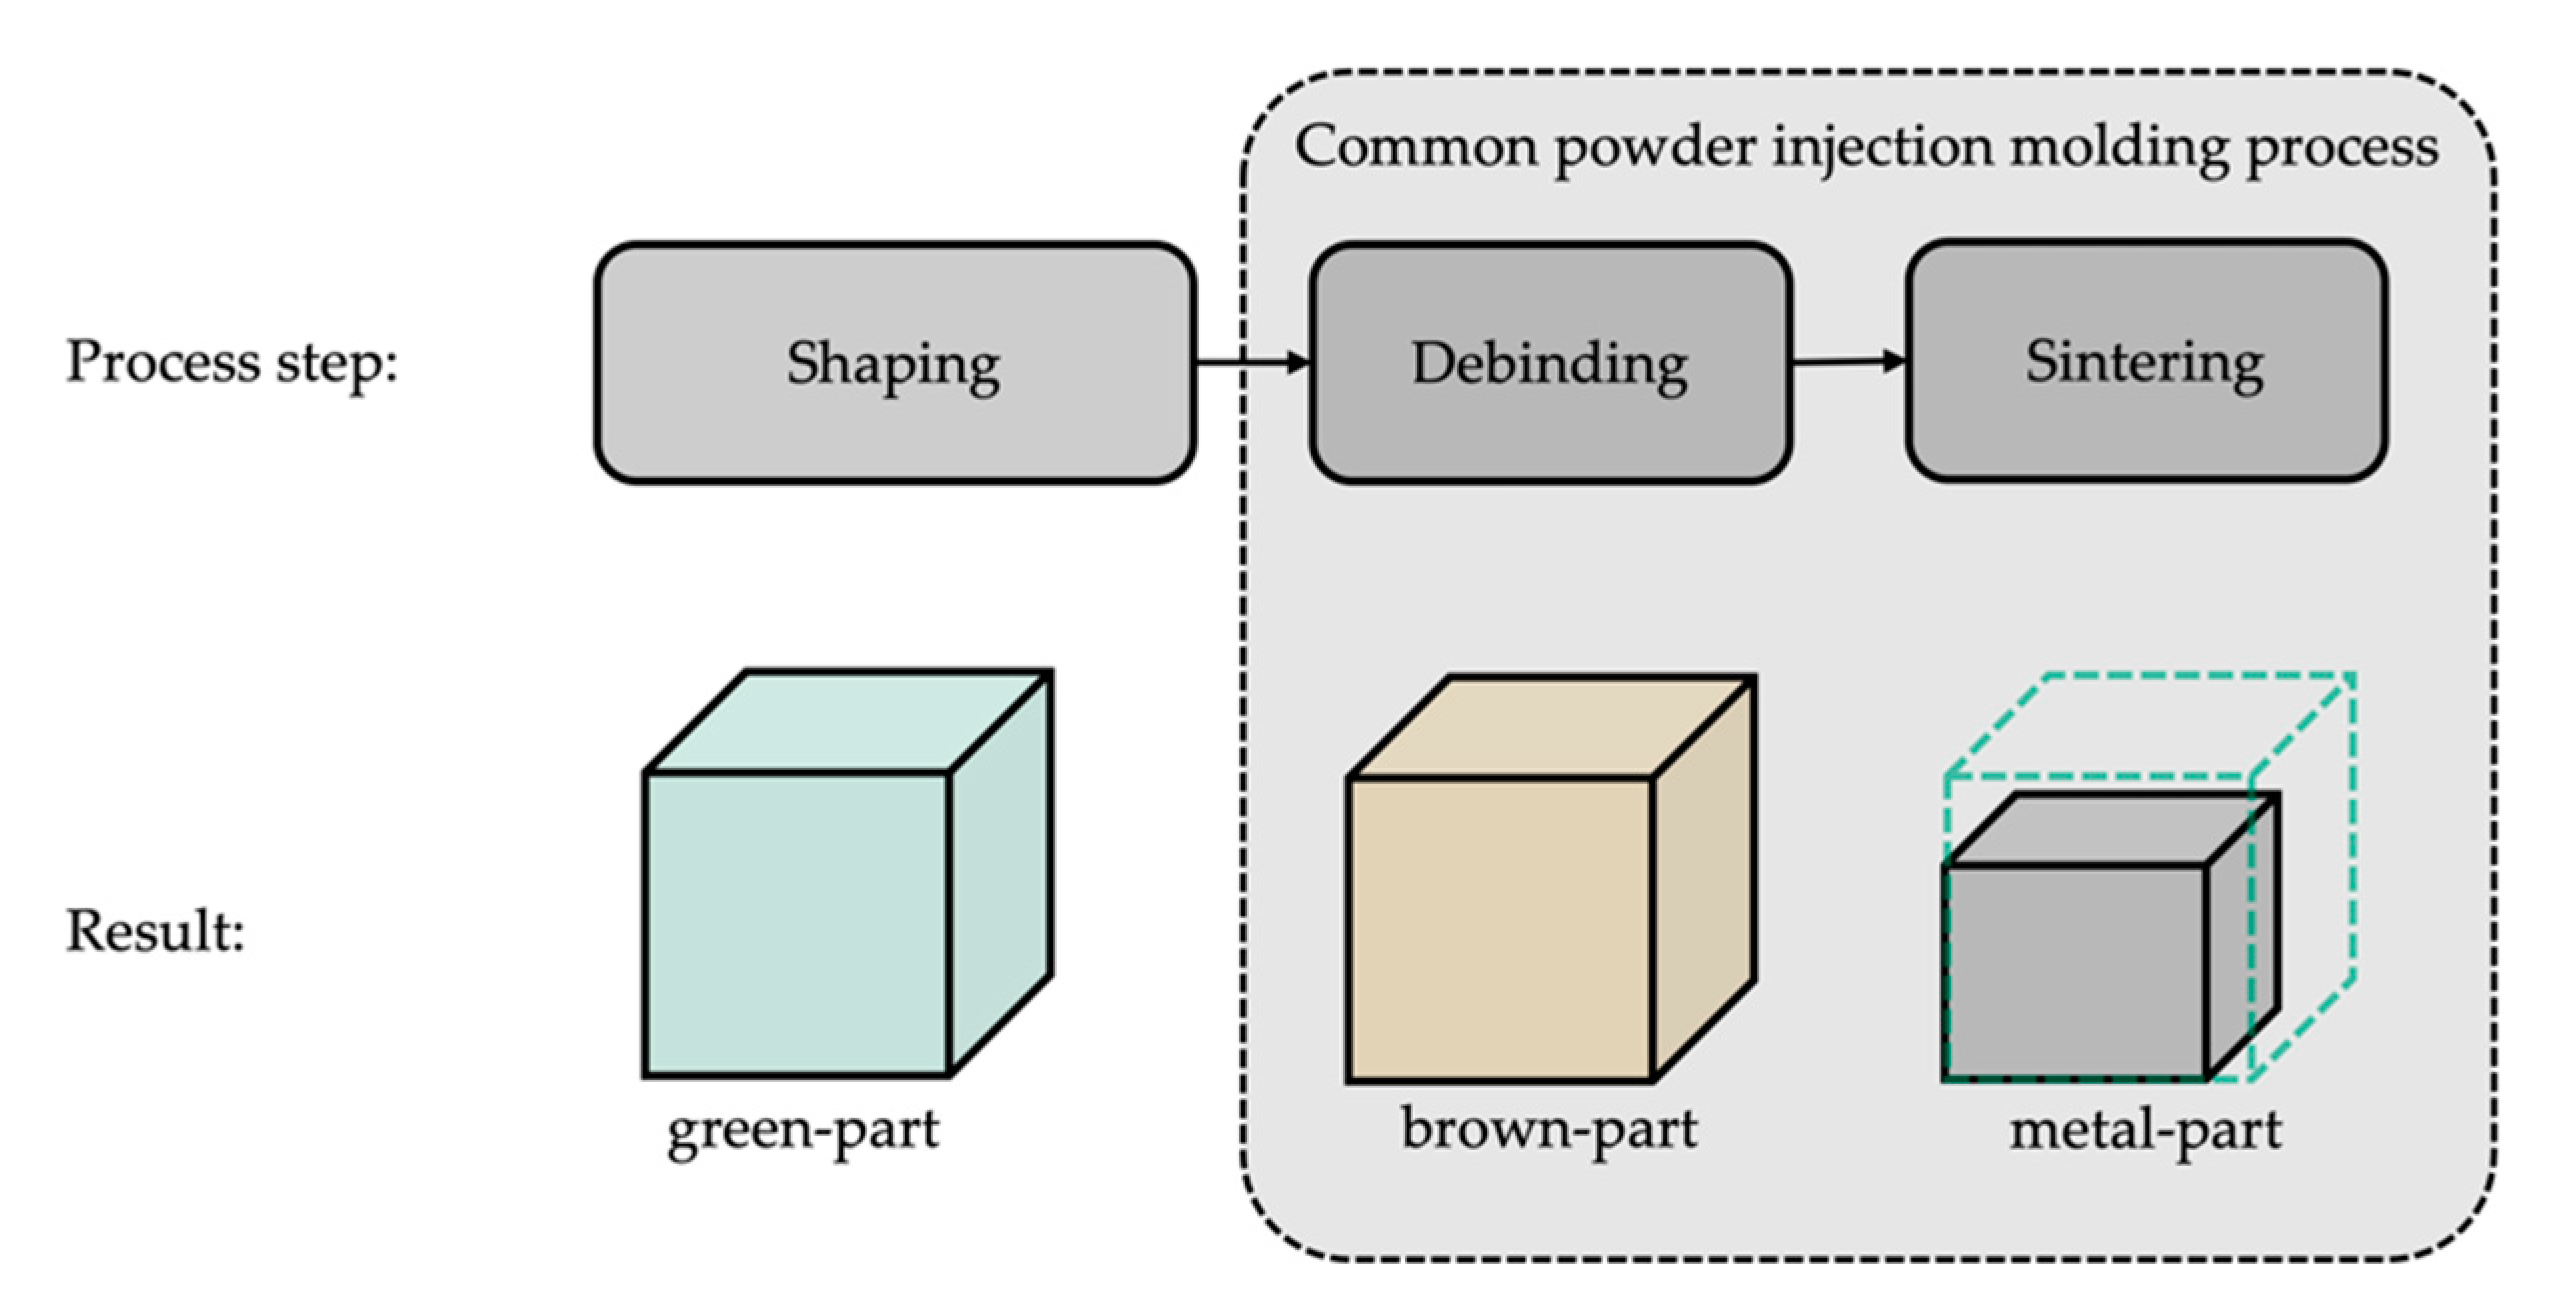
1.2. Debinding and Sintering
1.3. Structure-Property-Relations
2. Materials and Methods
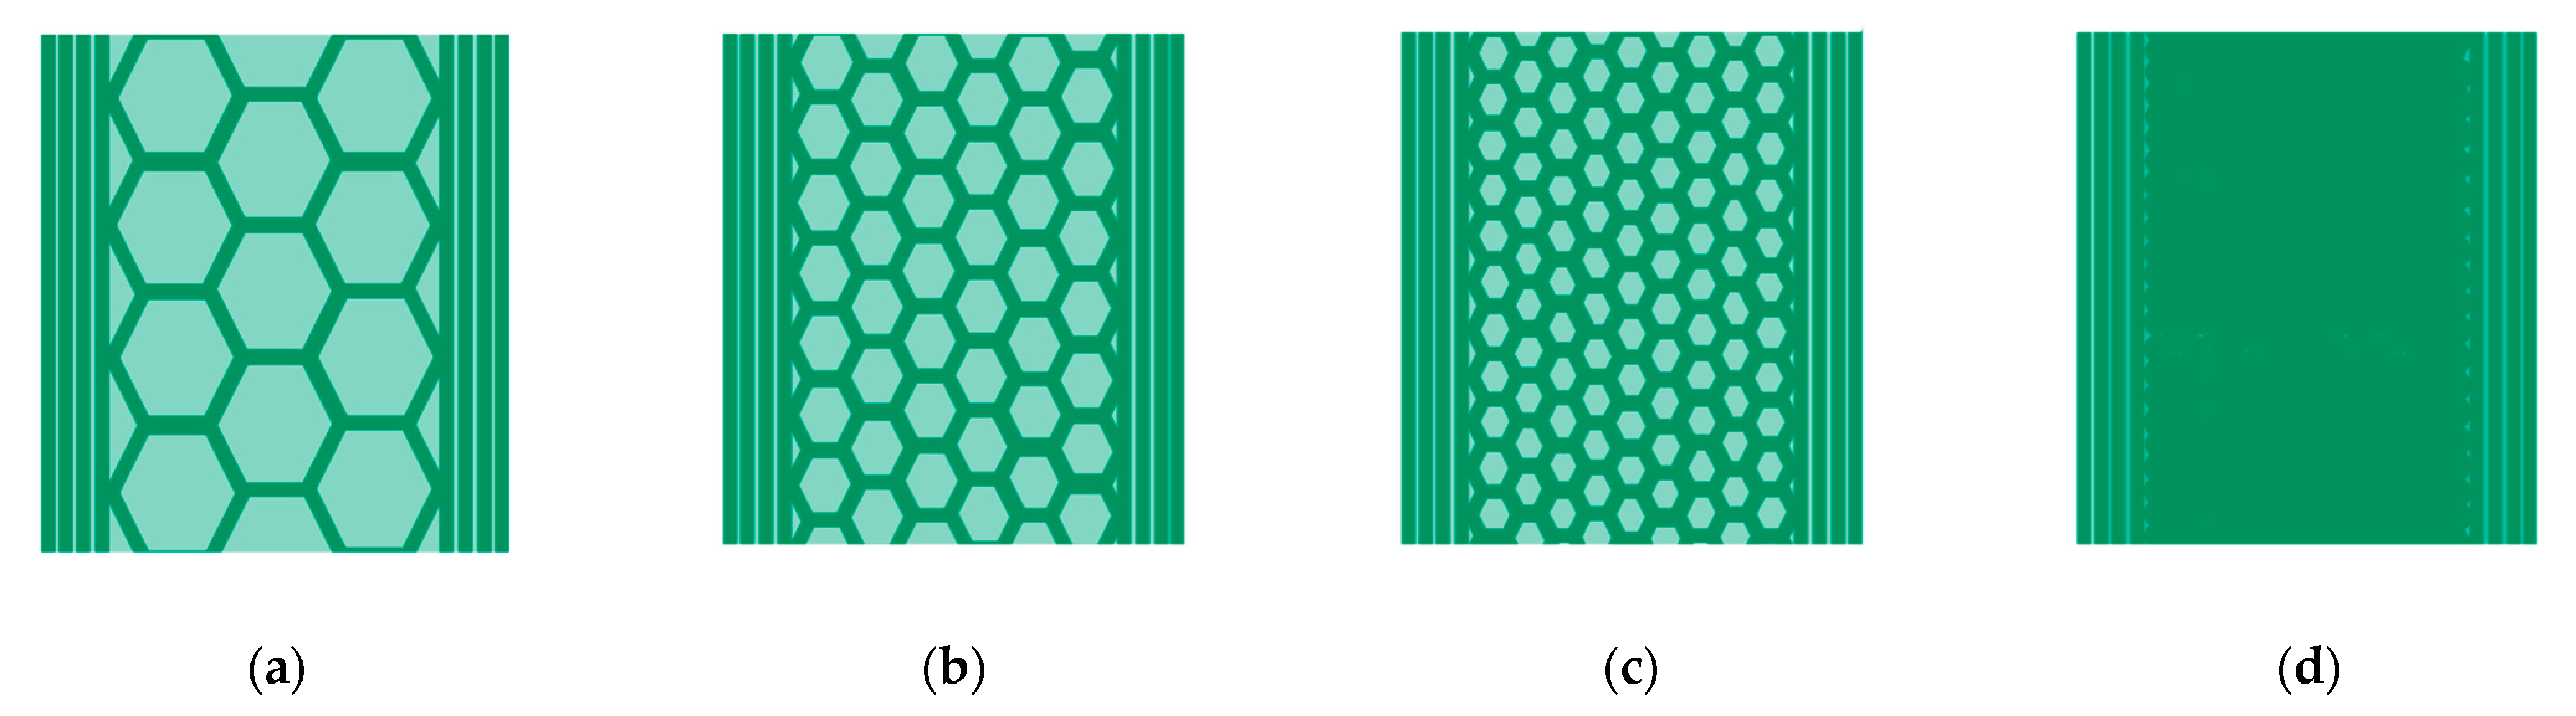
2.1. Designing, Printing, Debinding and Sintering
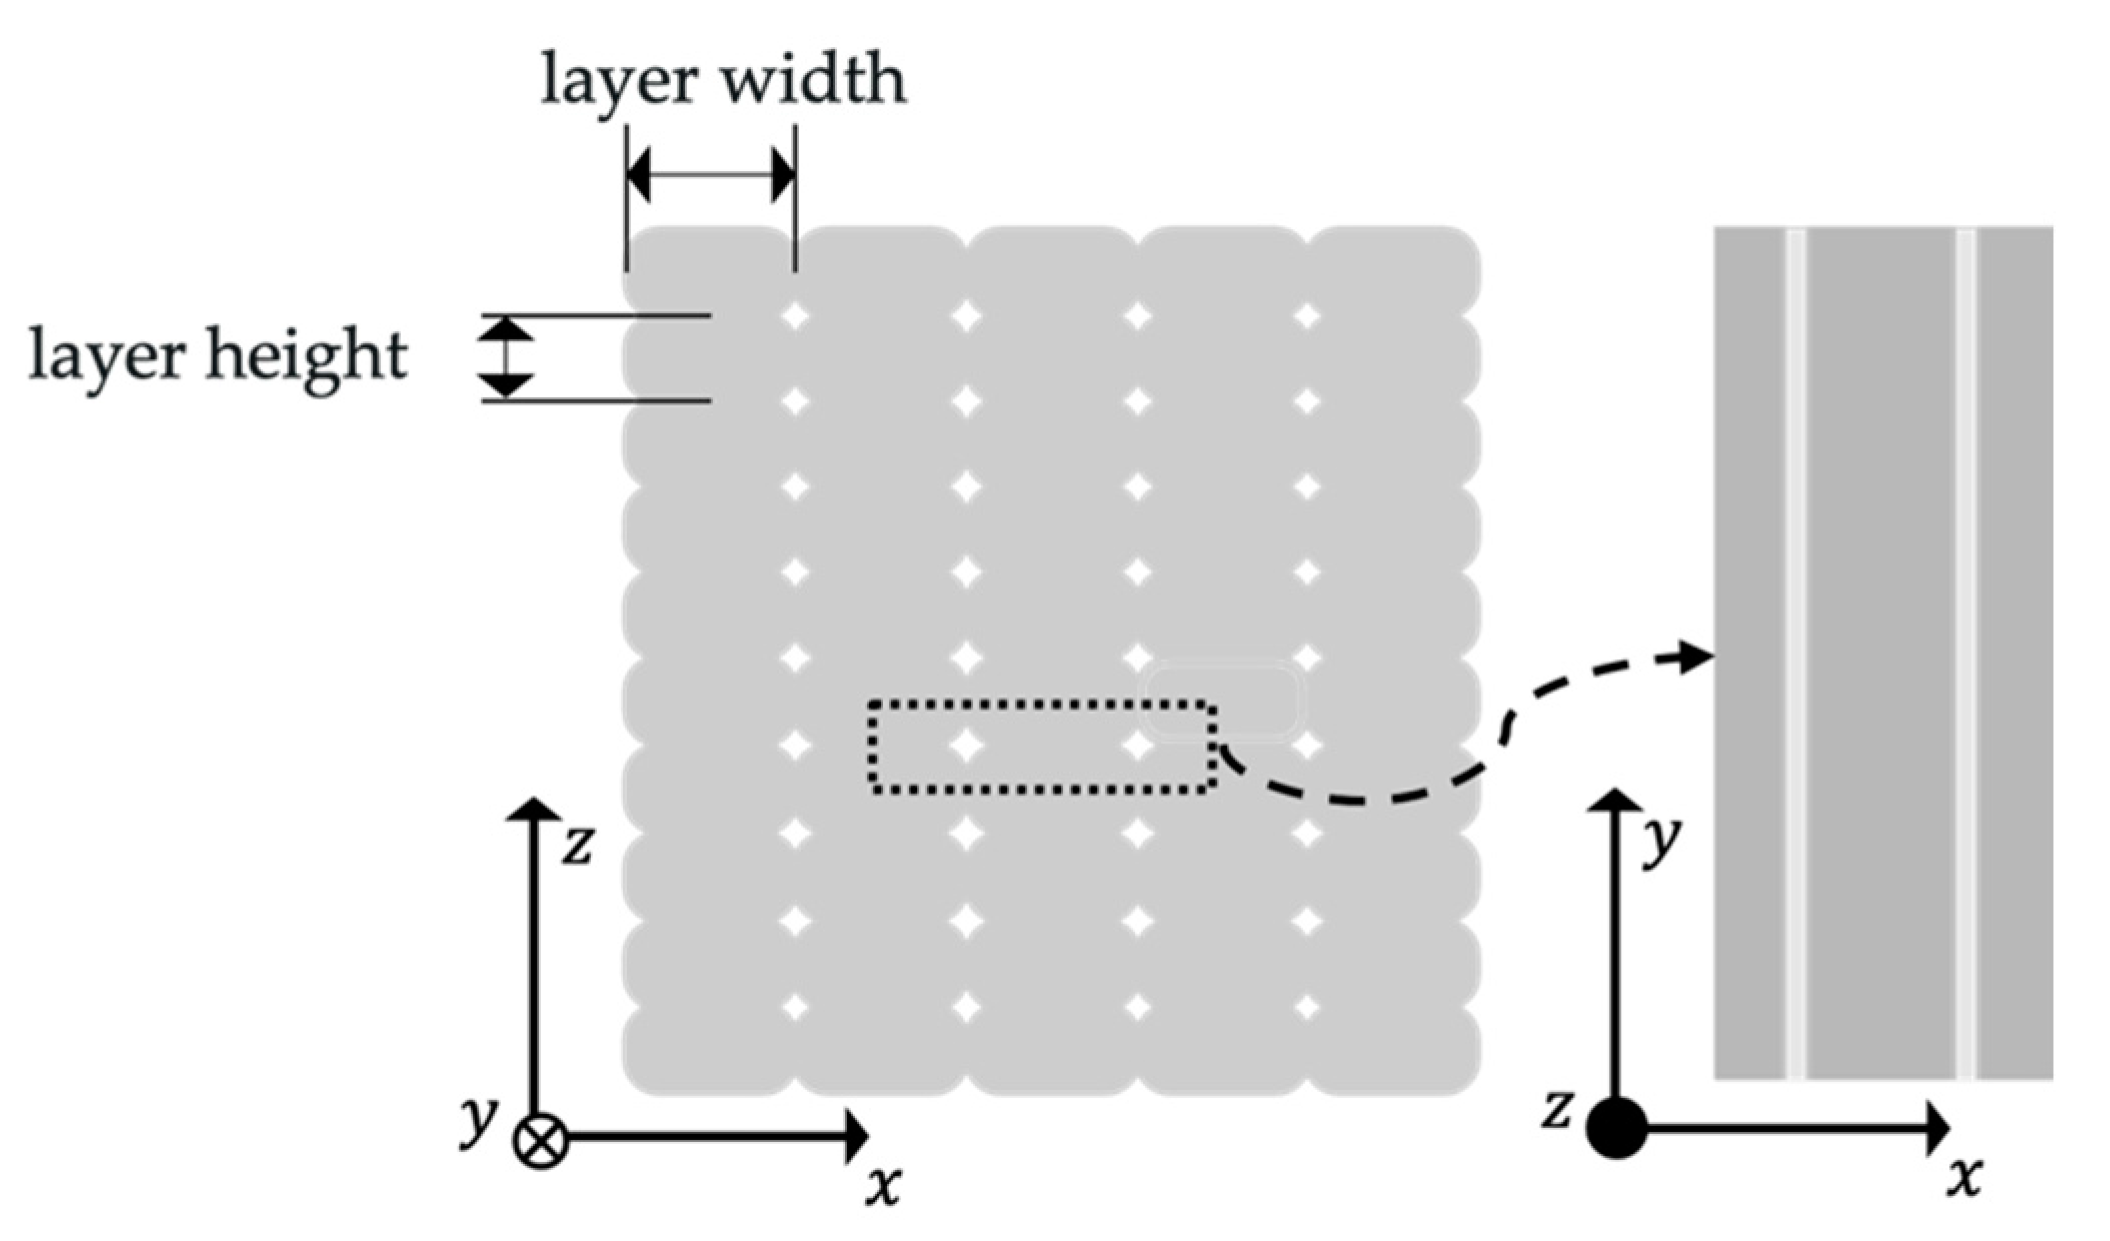
2.1.1. Material and Printing Parameters
2.1.2. Debinding and Sintering
2.2. Experimental Methods
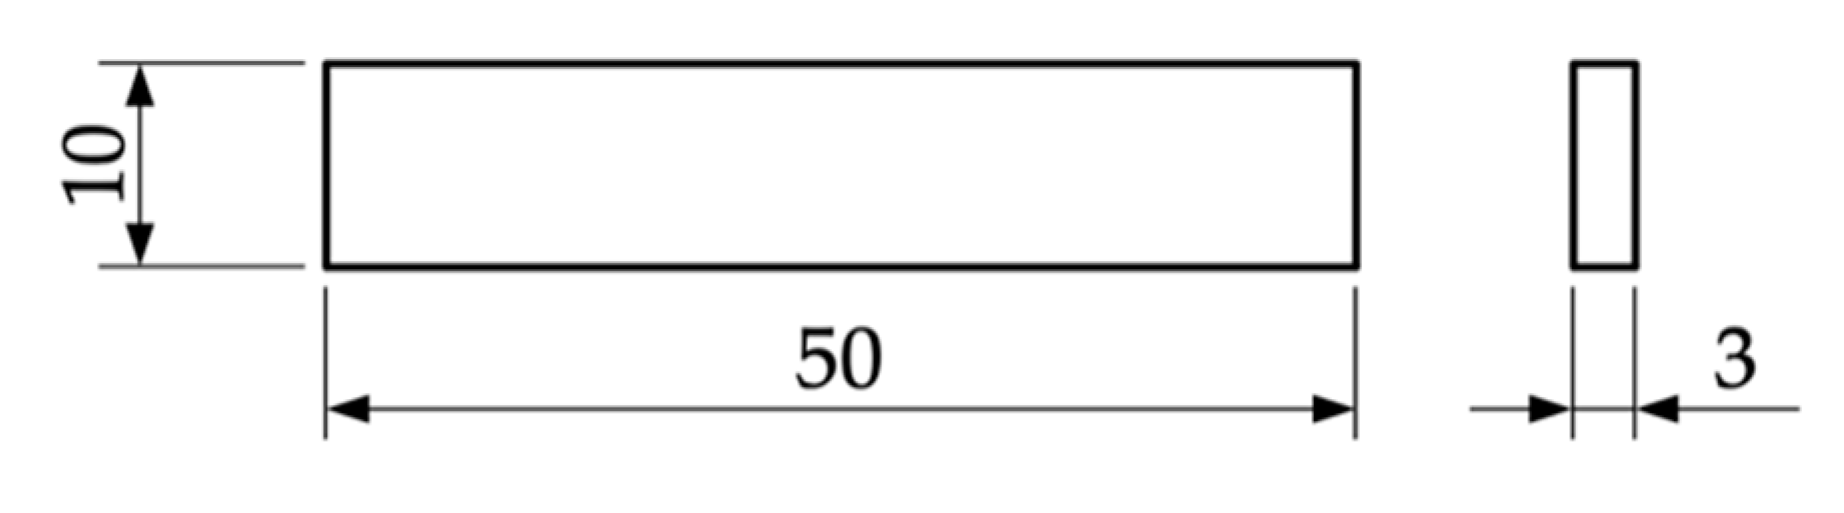
2.2.1. Dimensional Deviations
2.2.2. Tensile Testing
2.2.3. Bending Testing
3. Results and Discussion
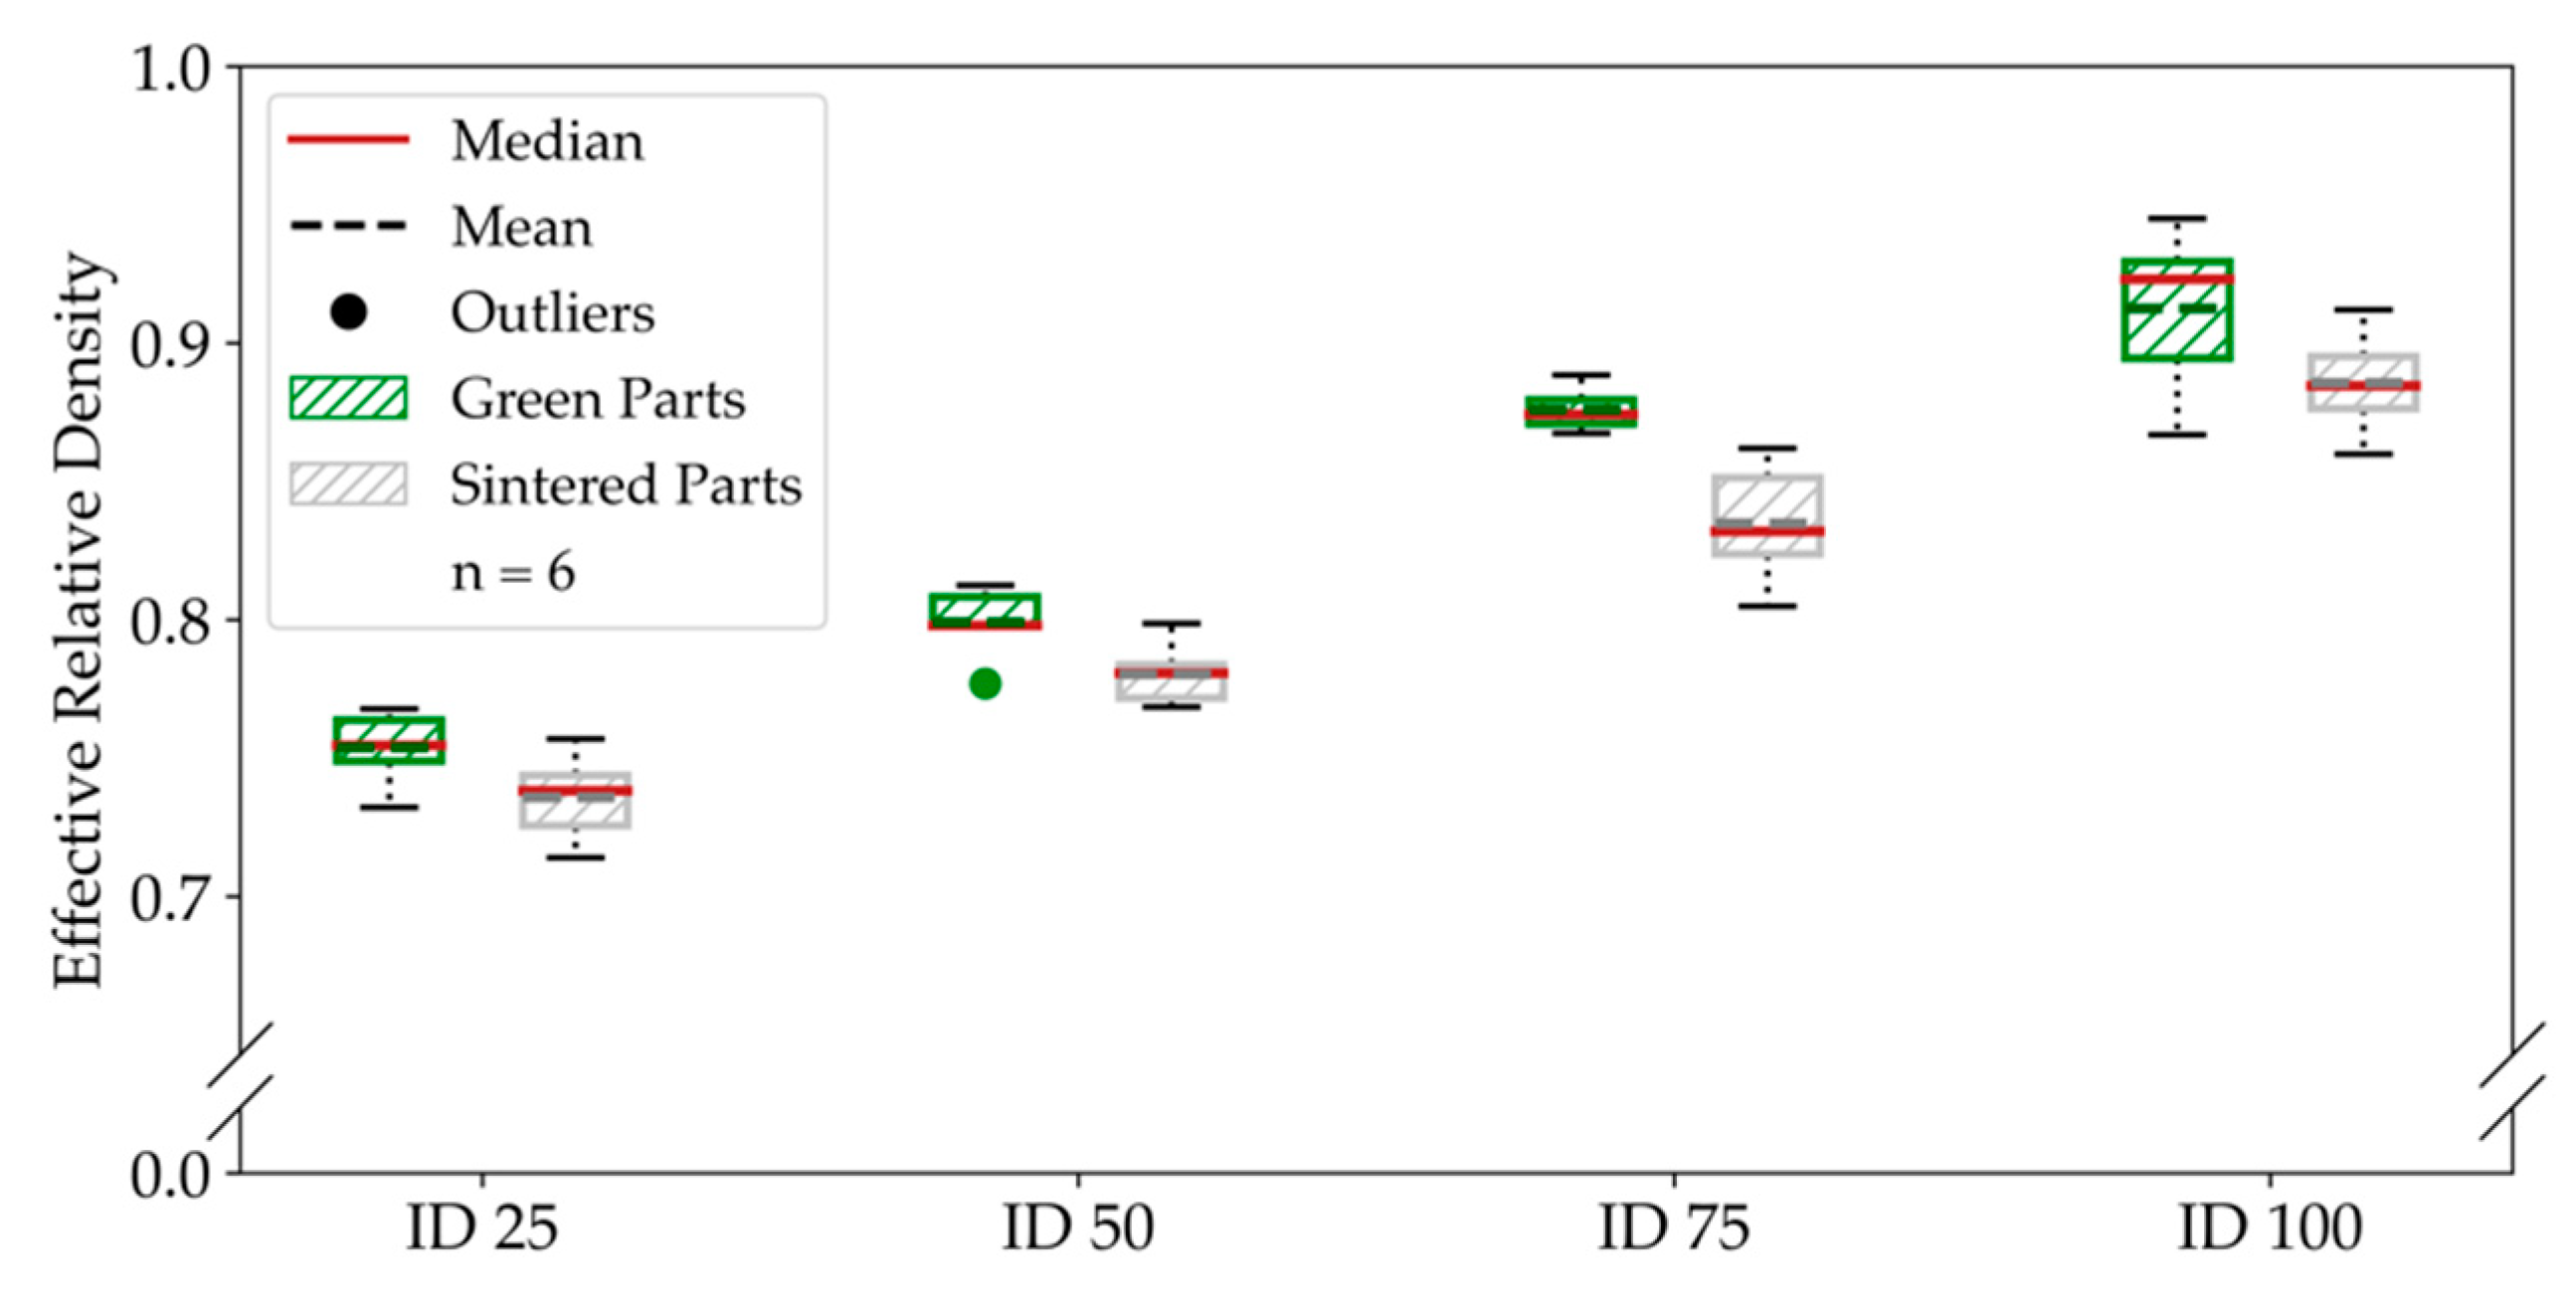
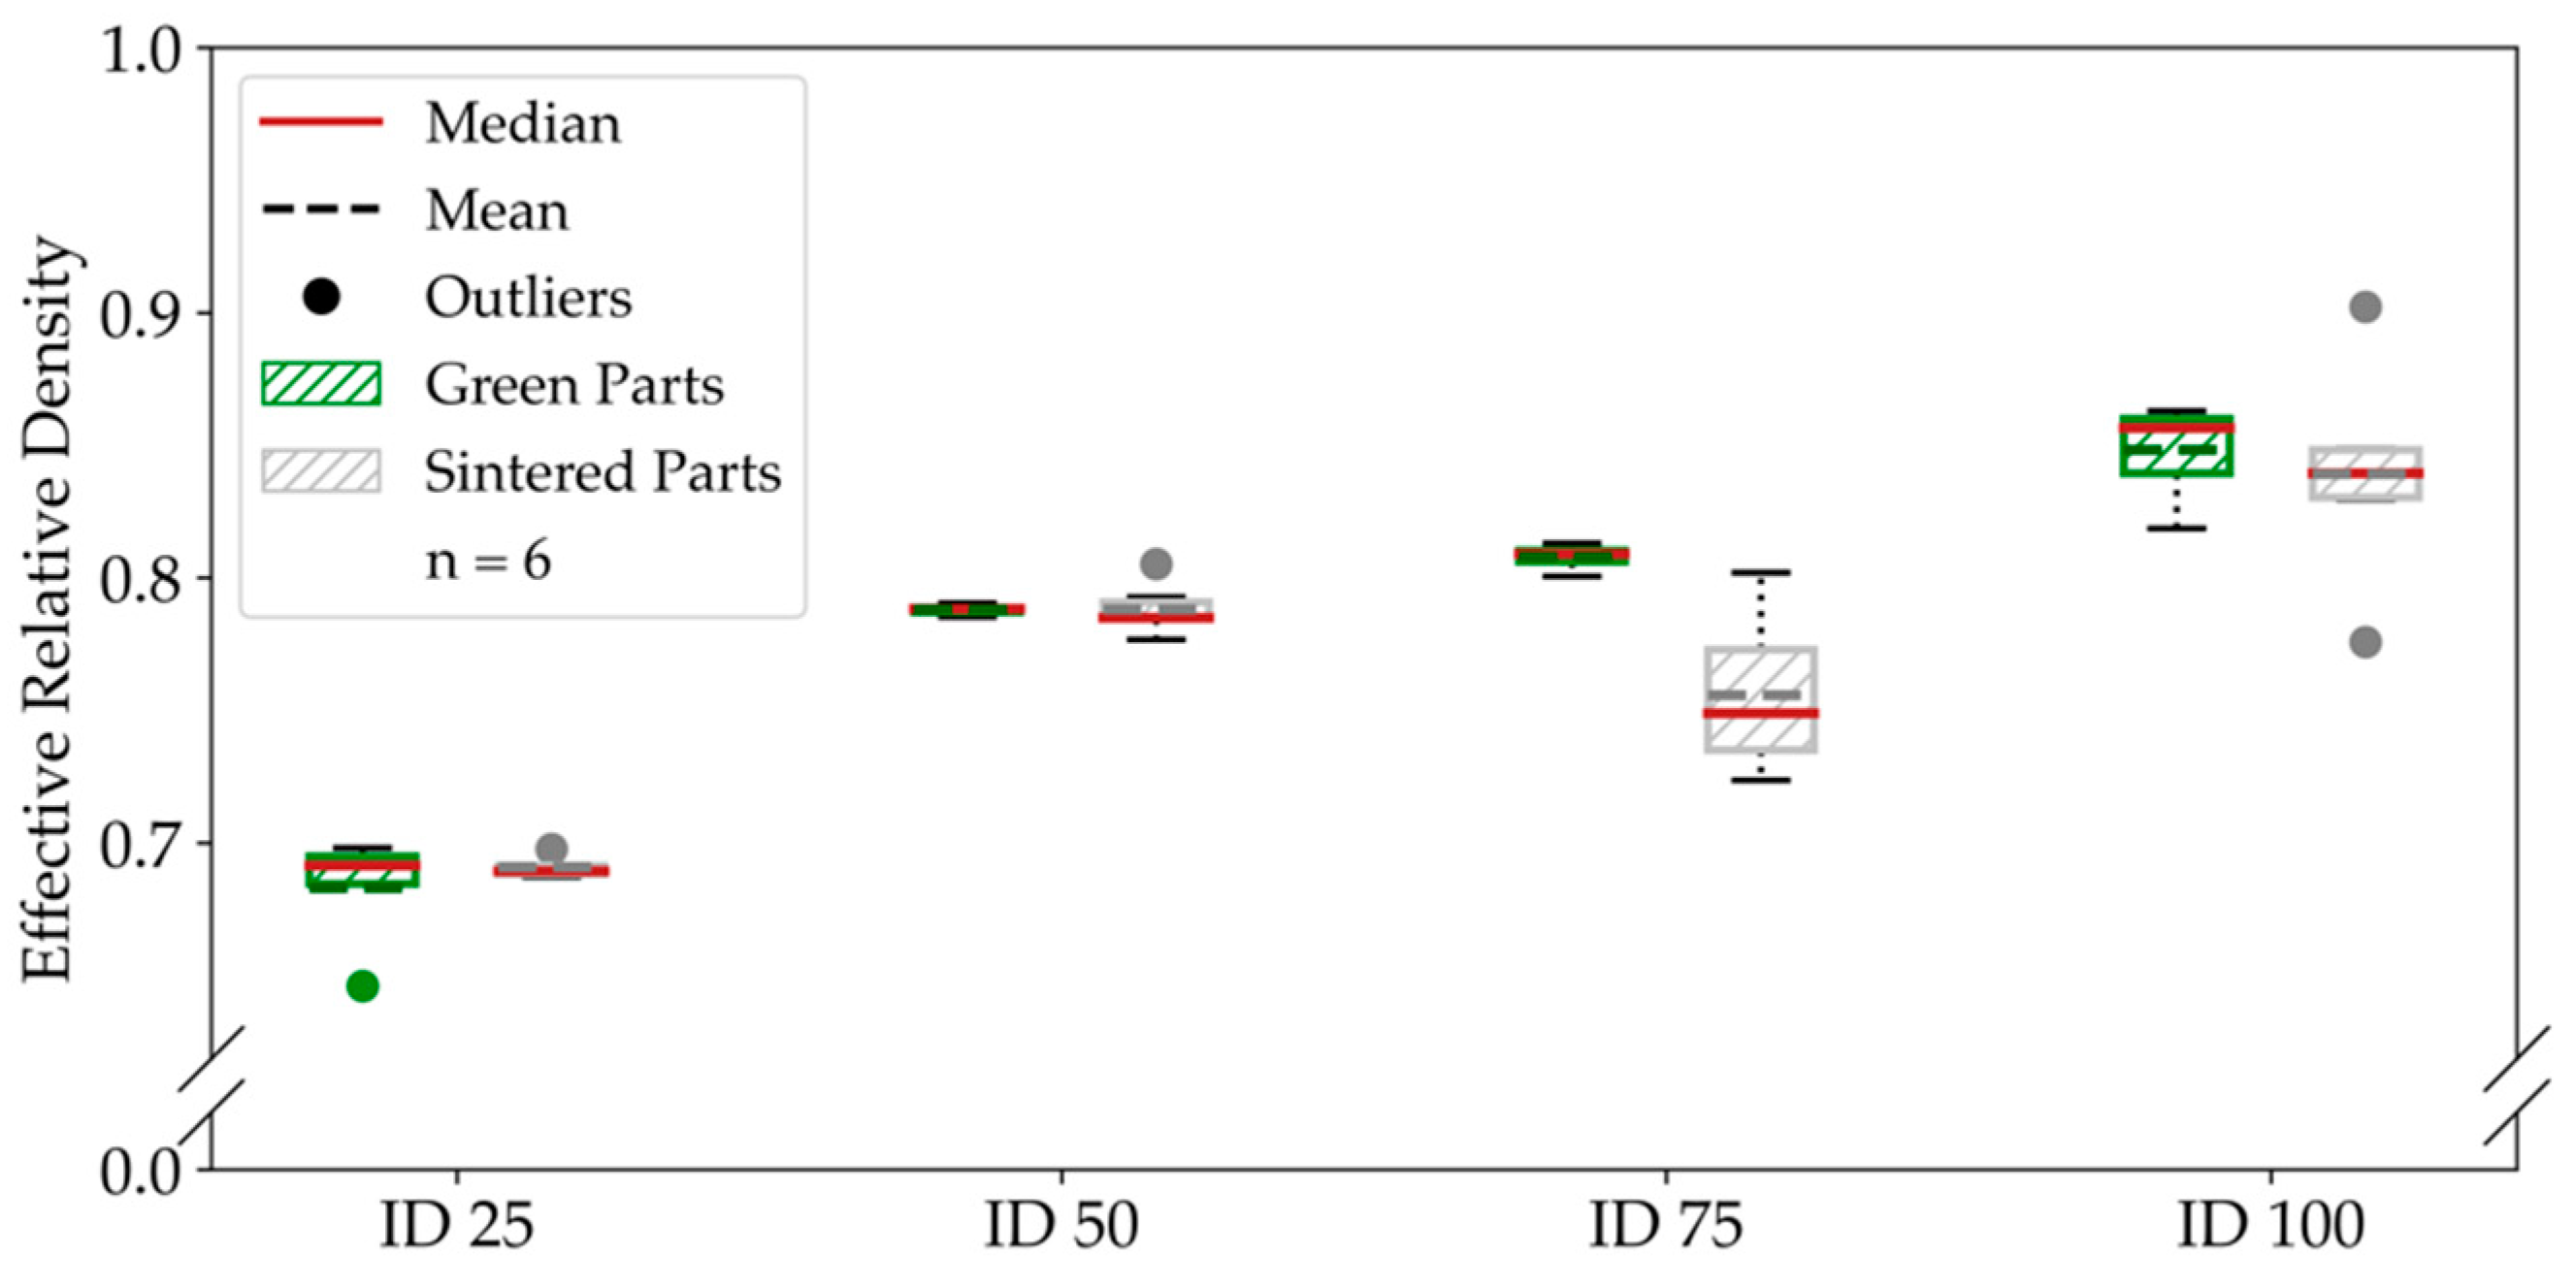
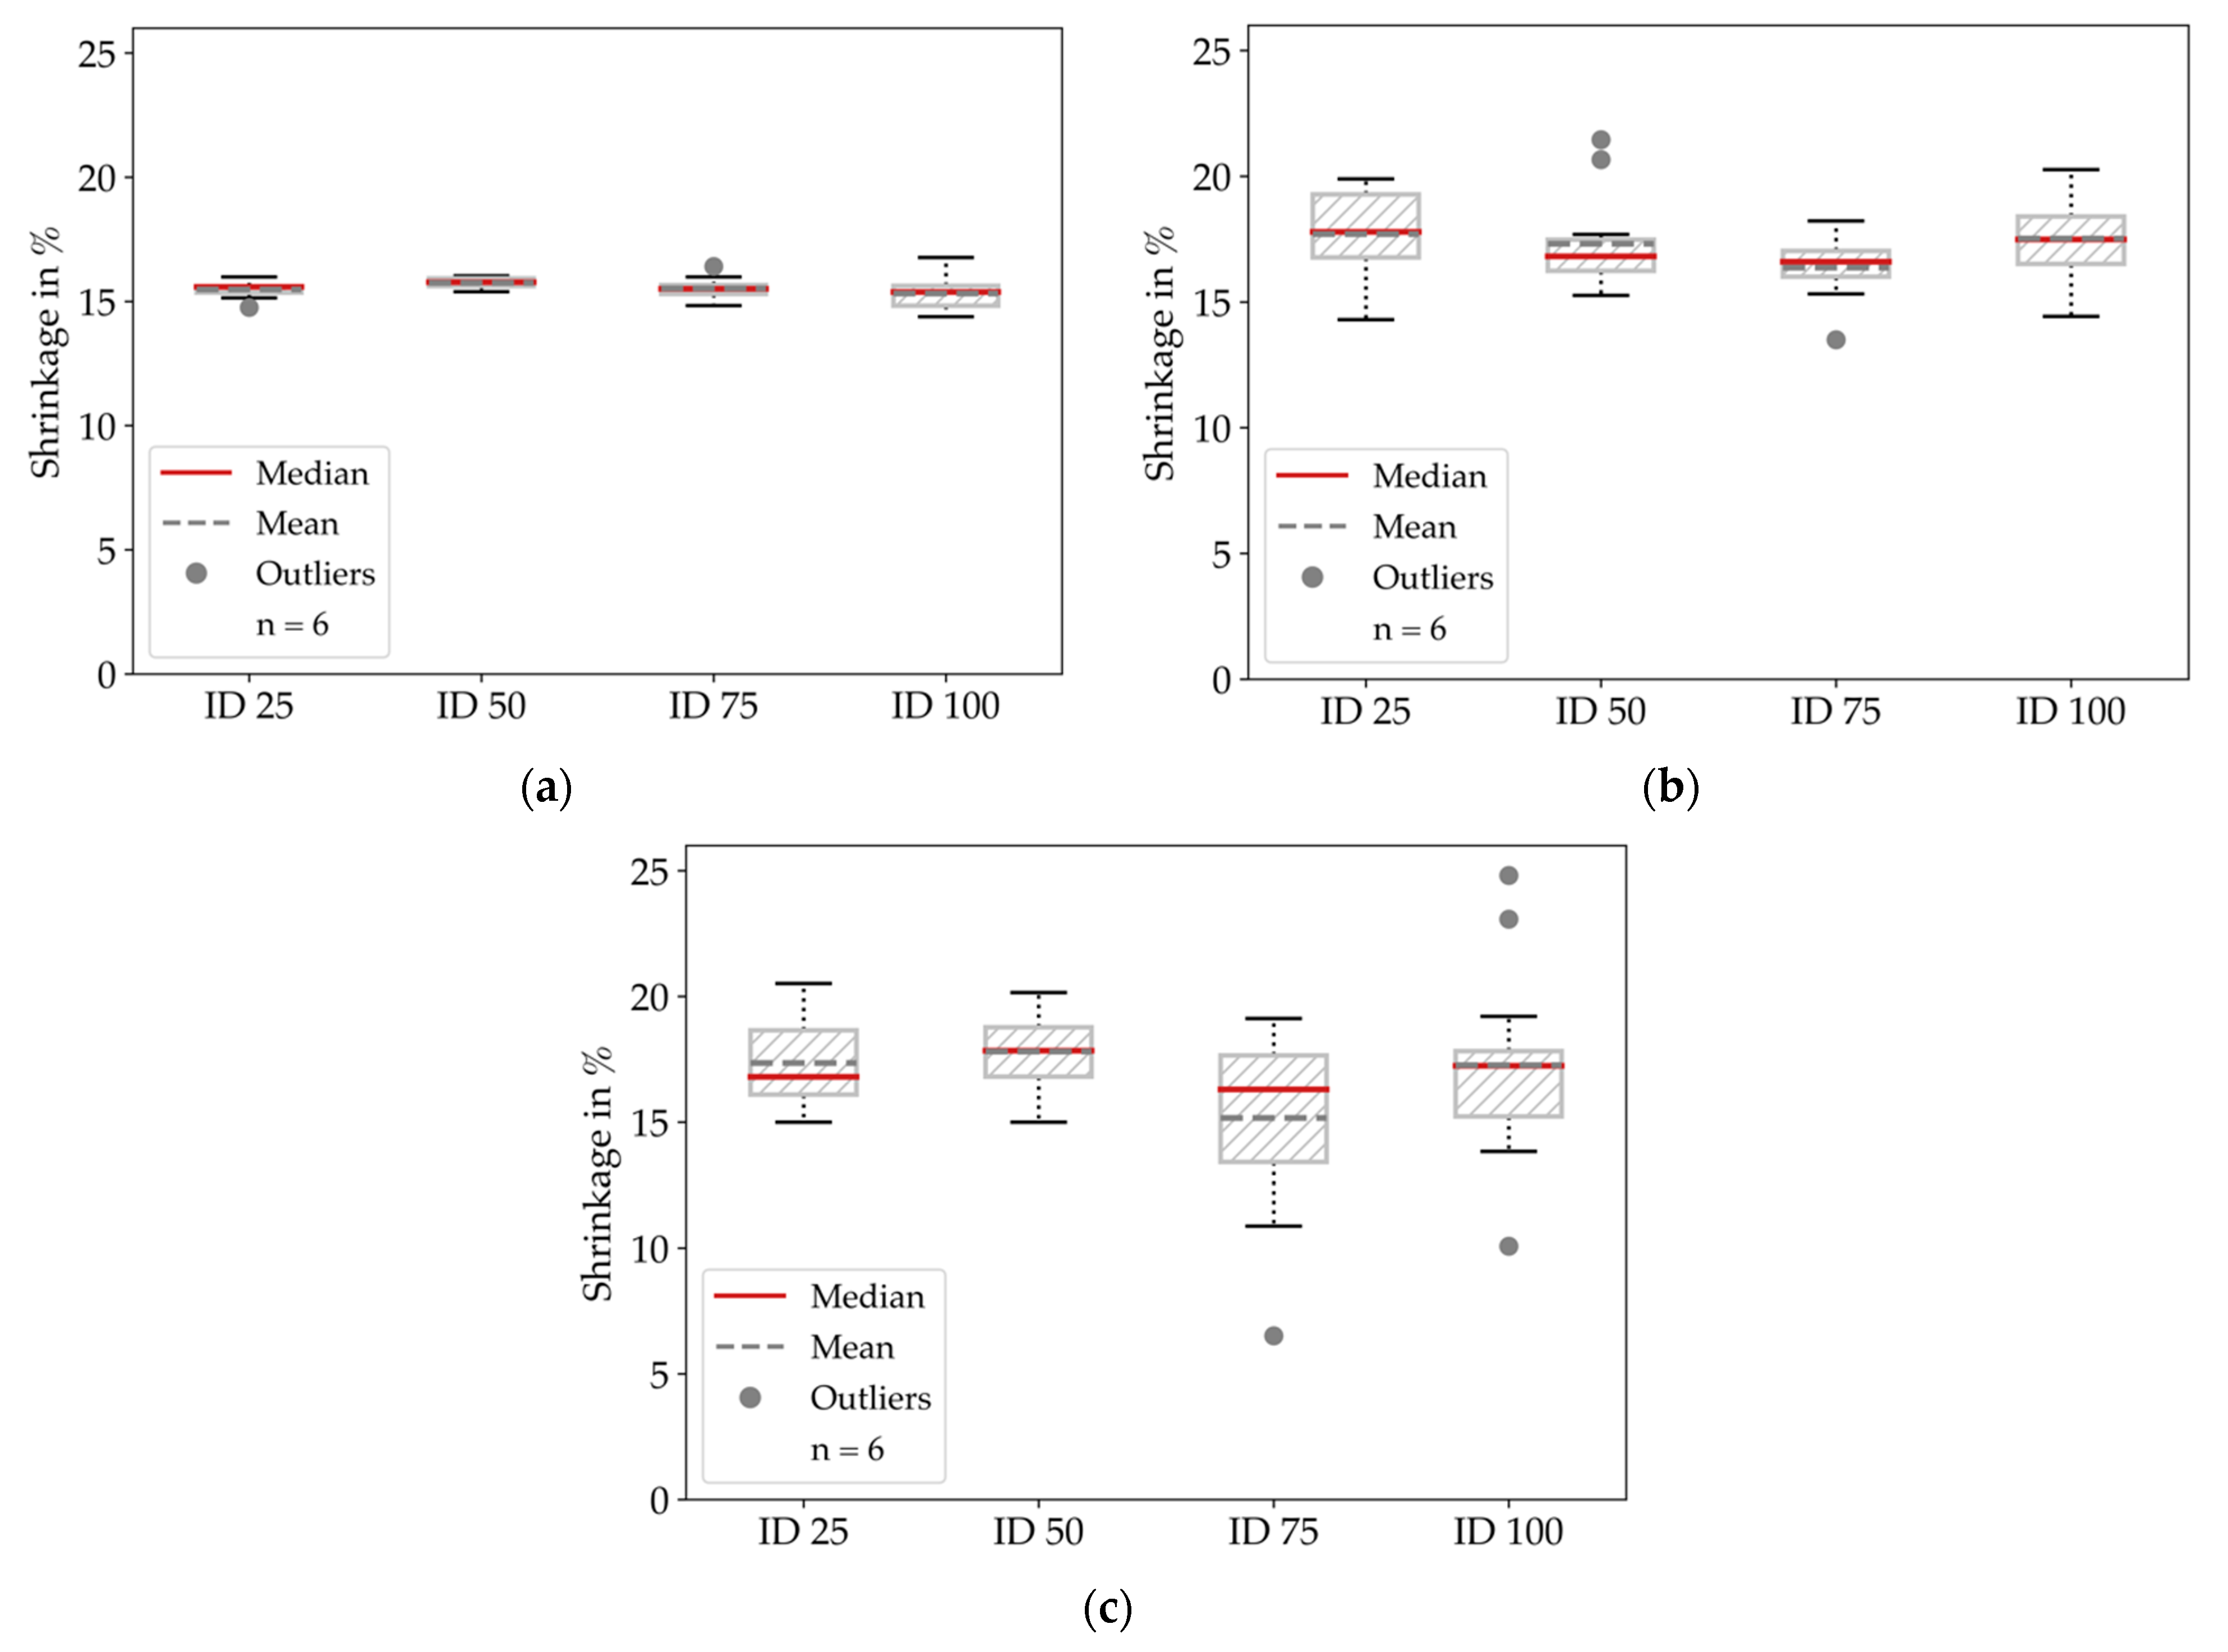
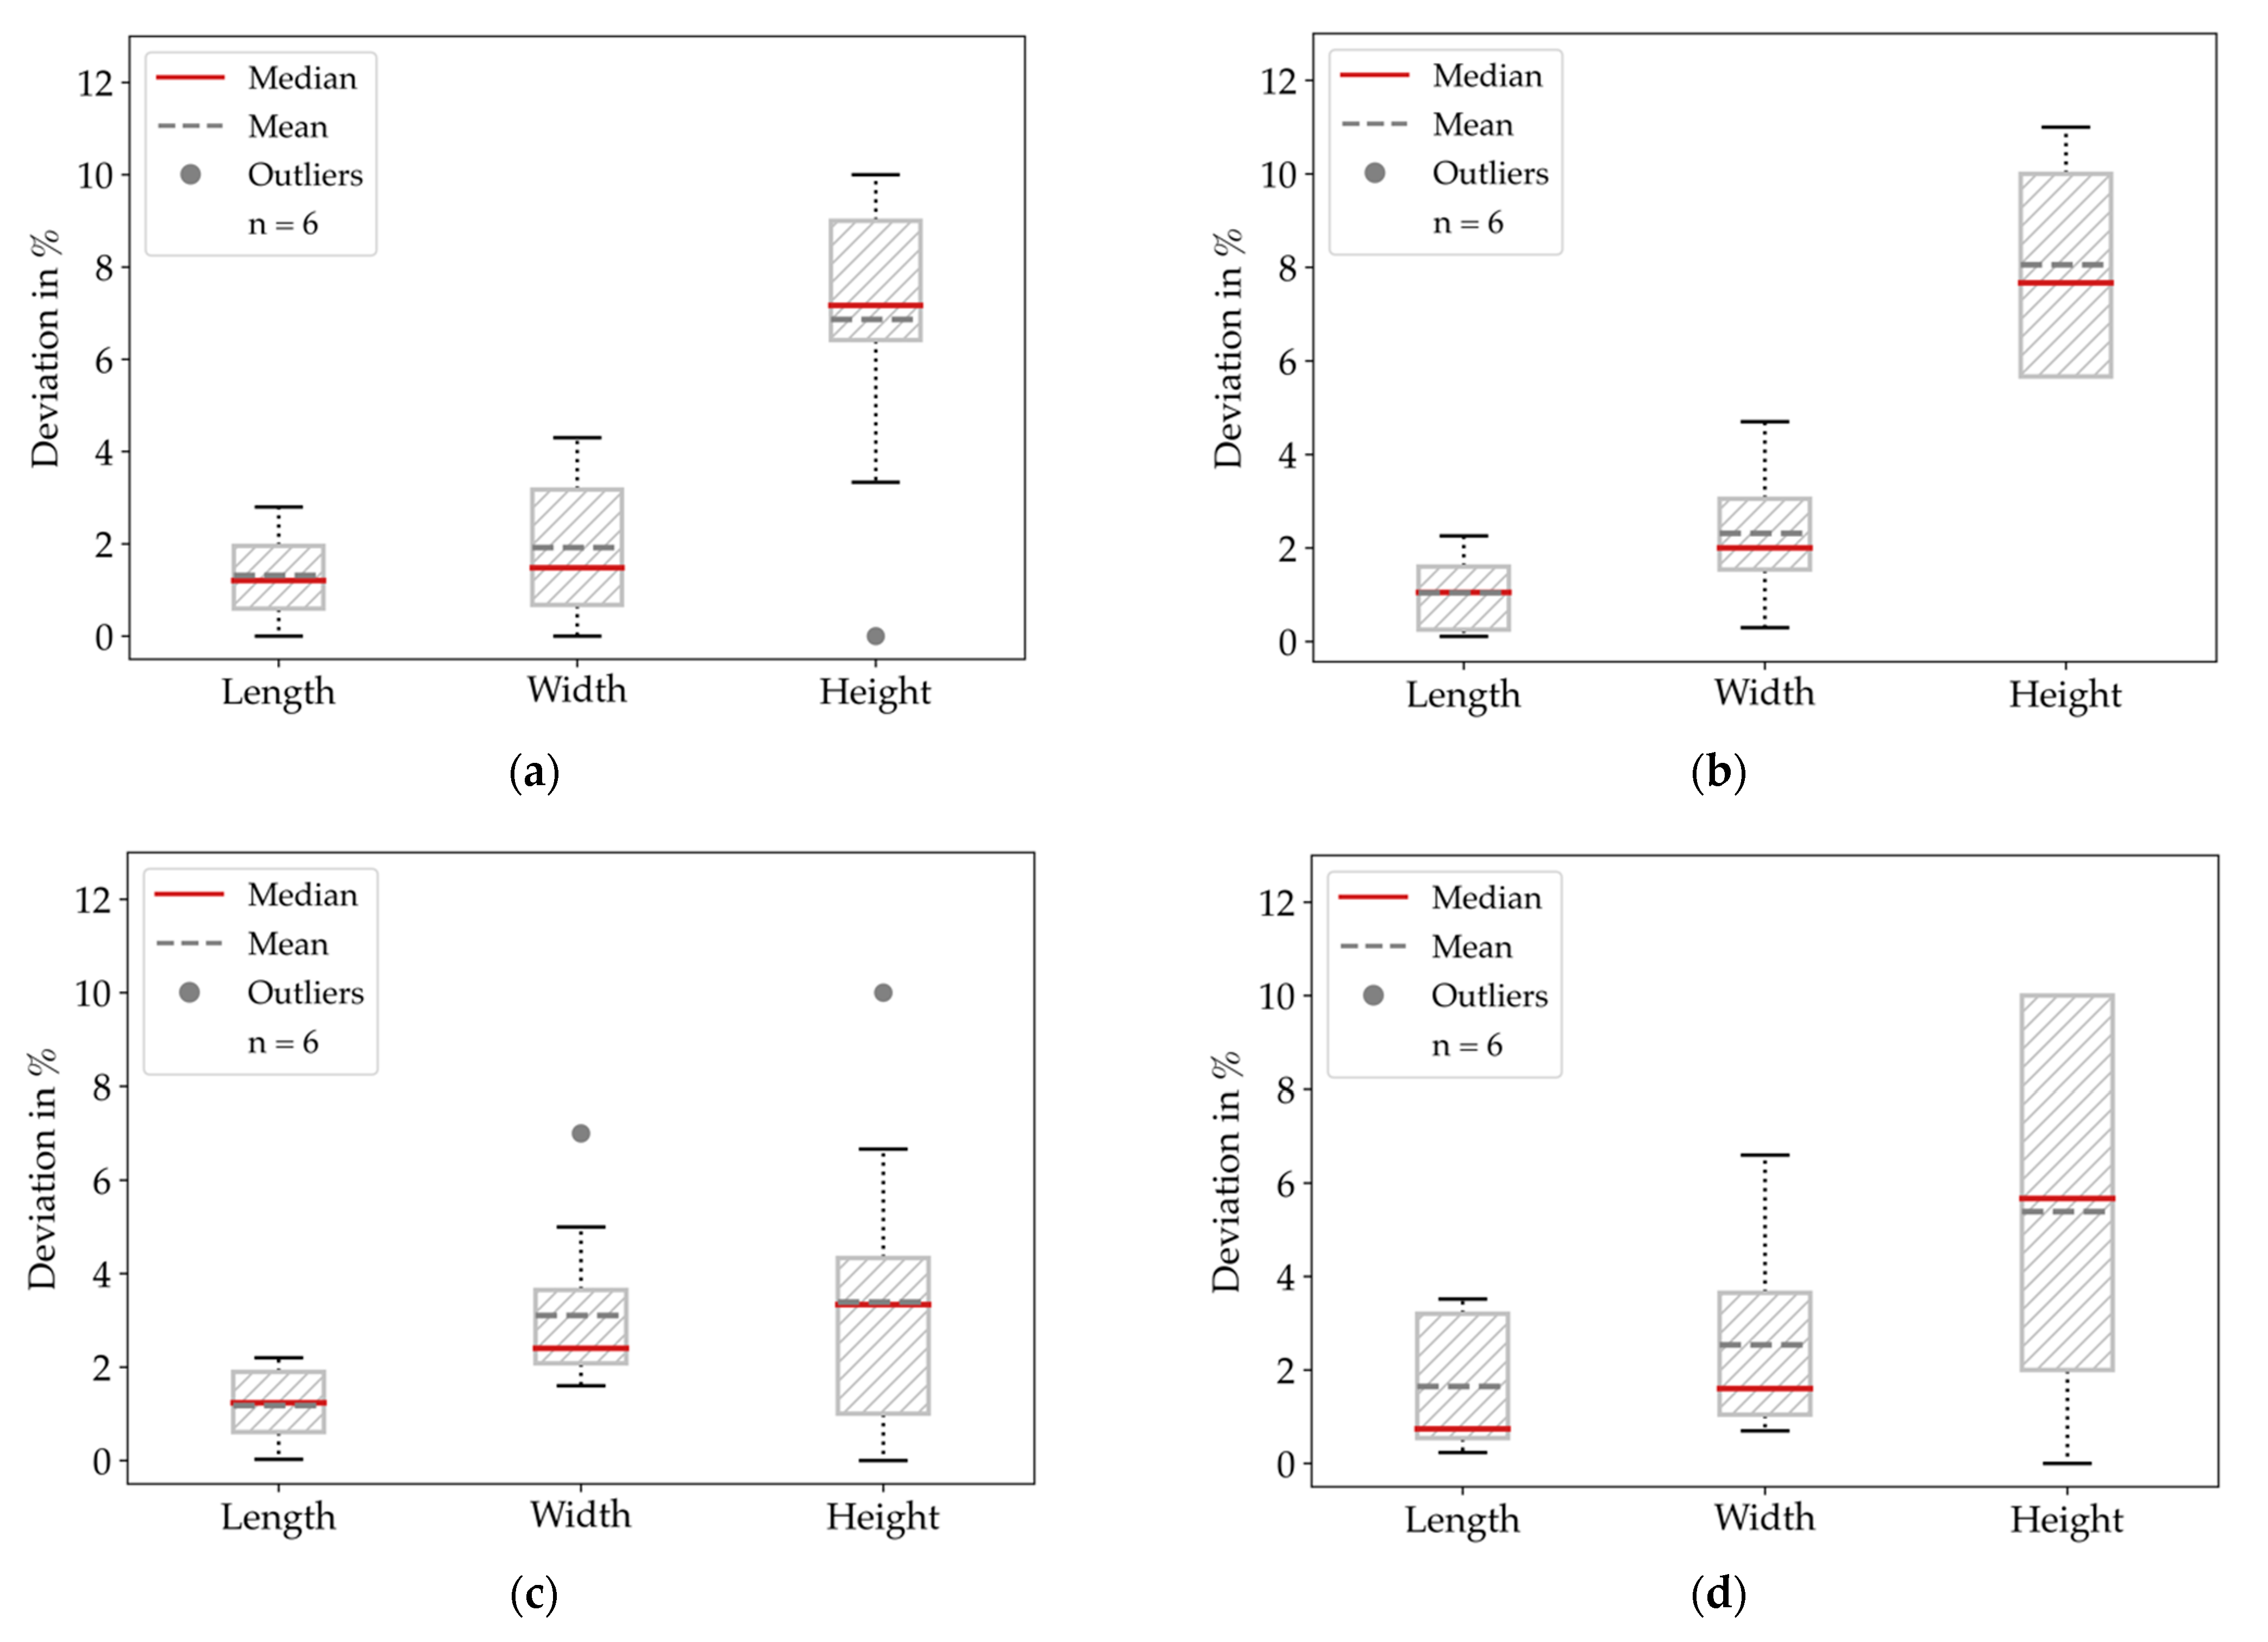
3.1. Dimensional Deviations
3.2. Mechanical Testing
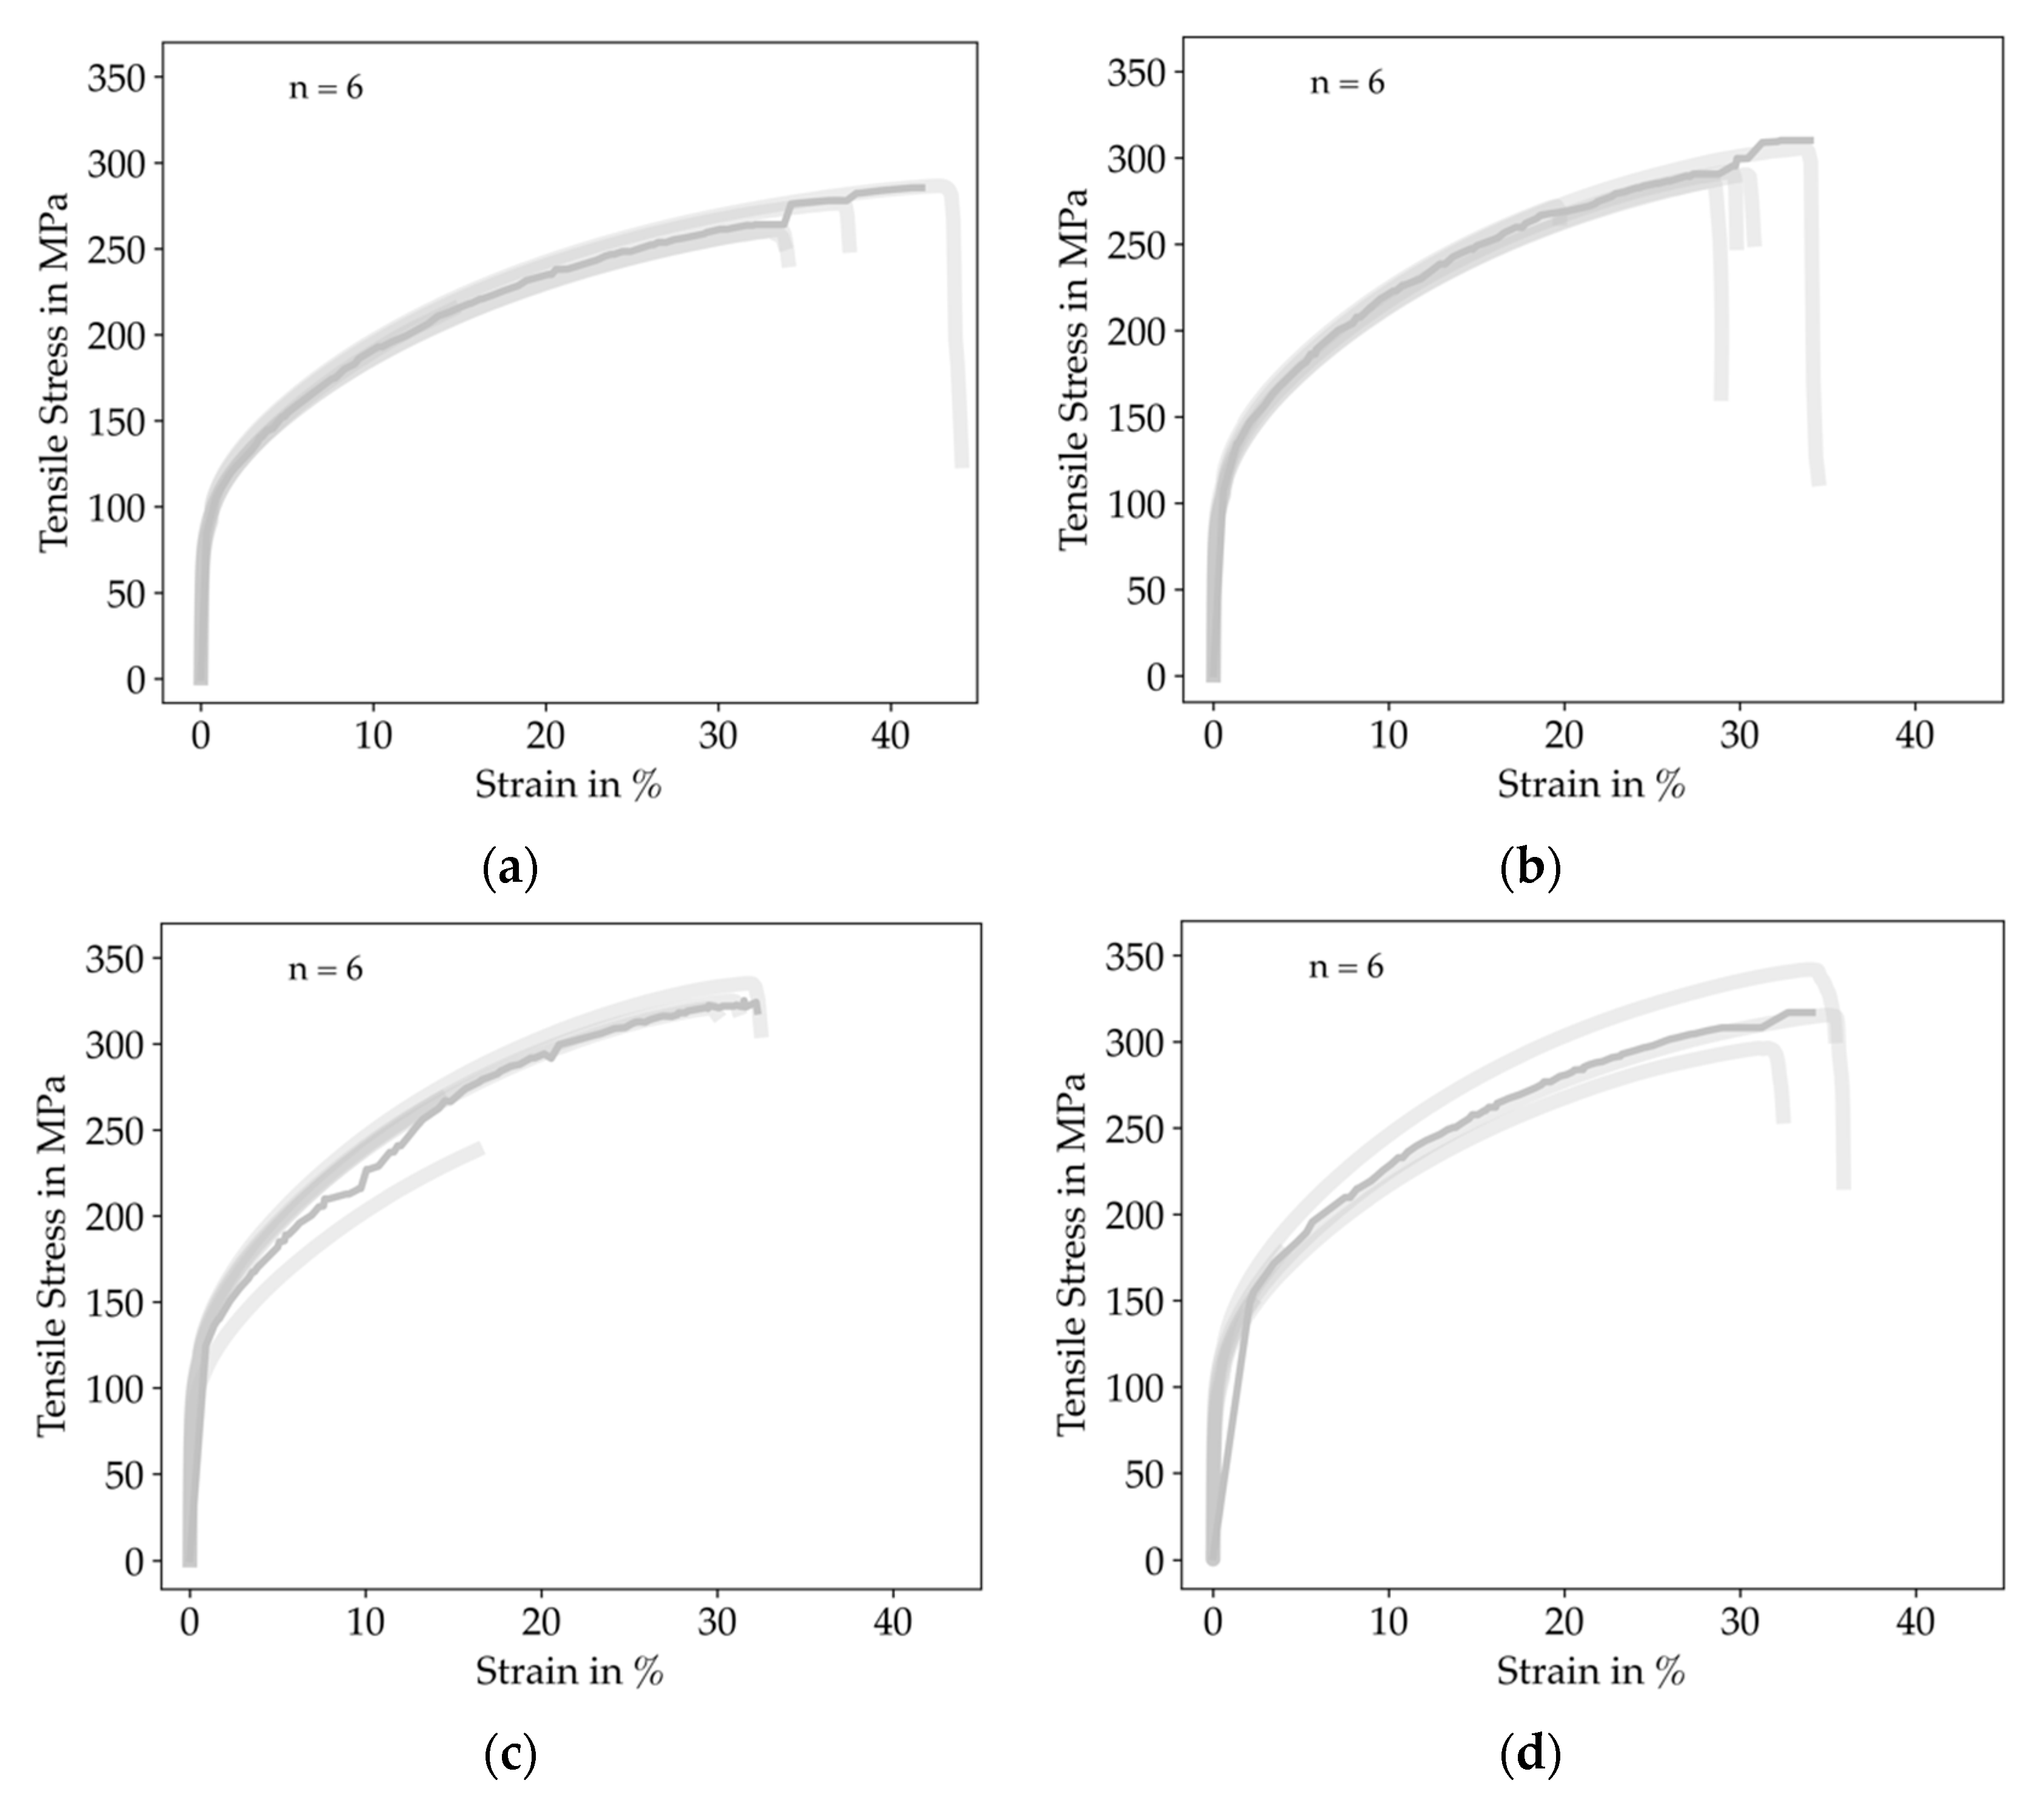
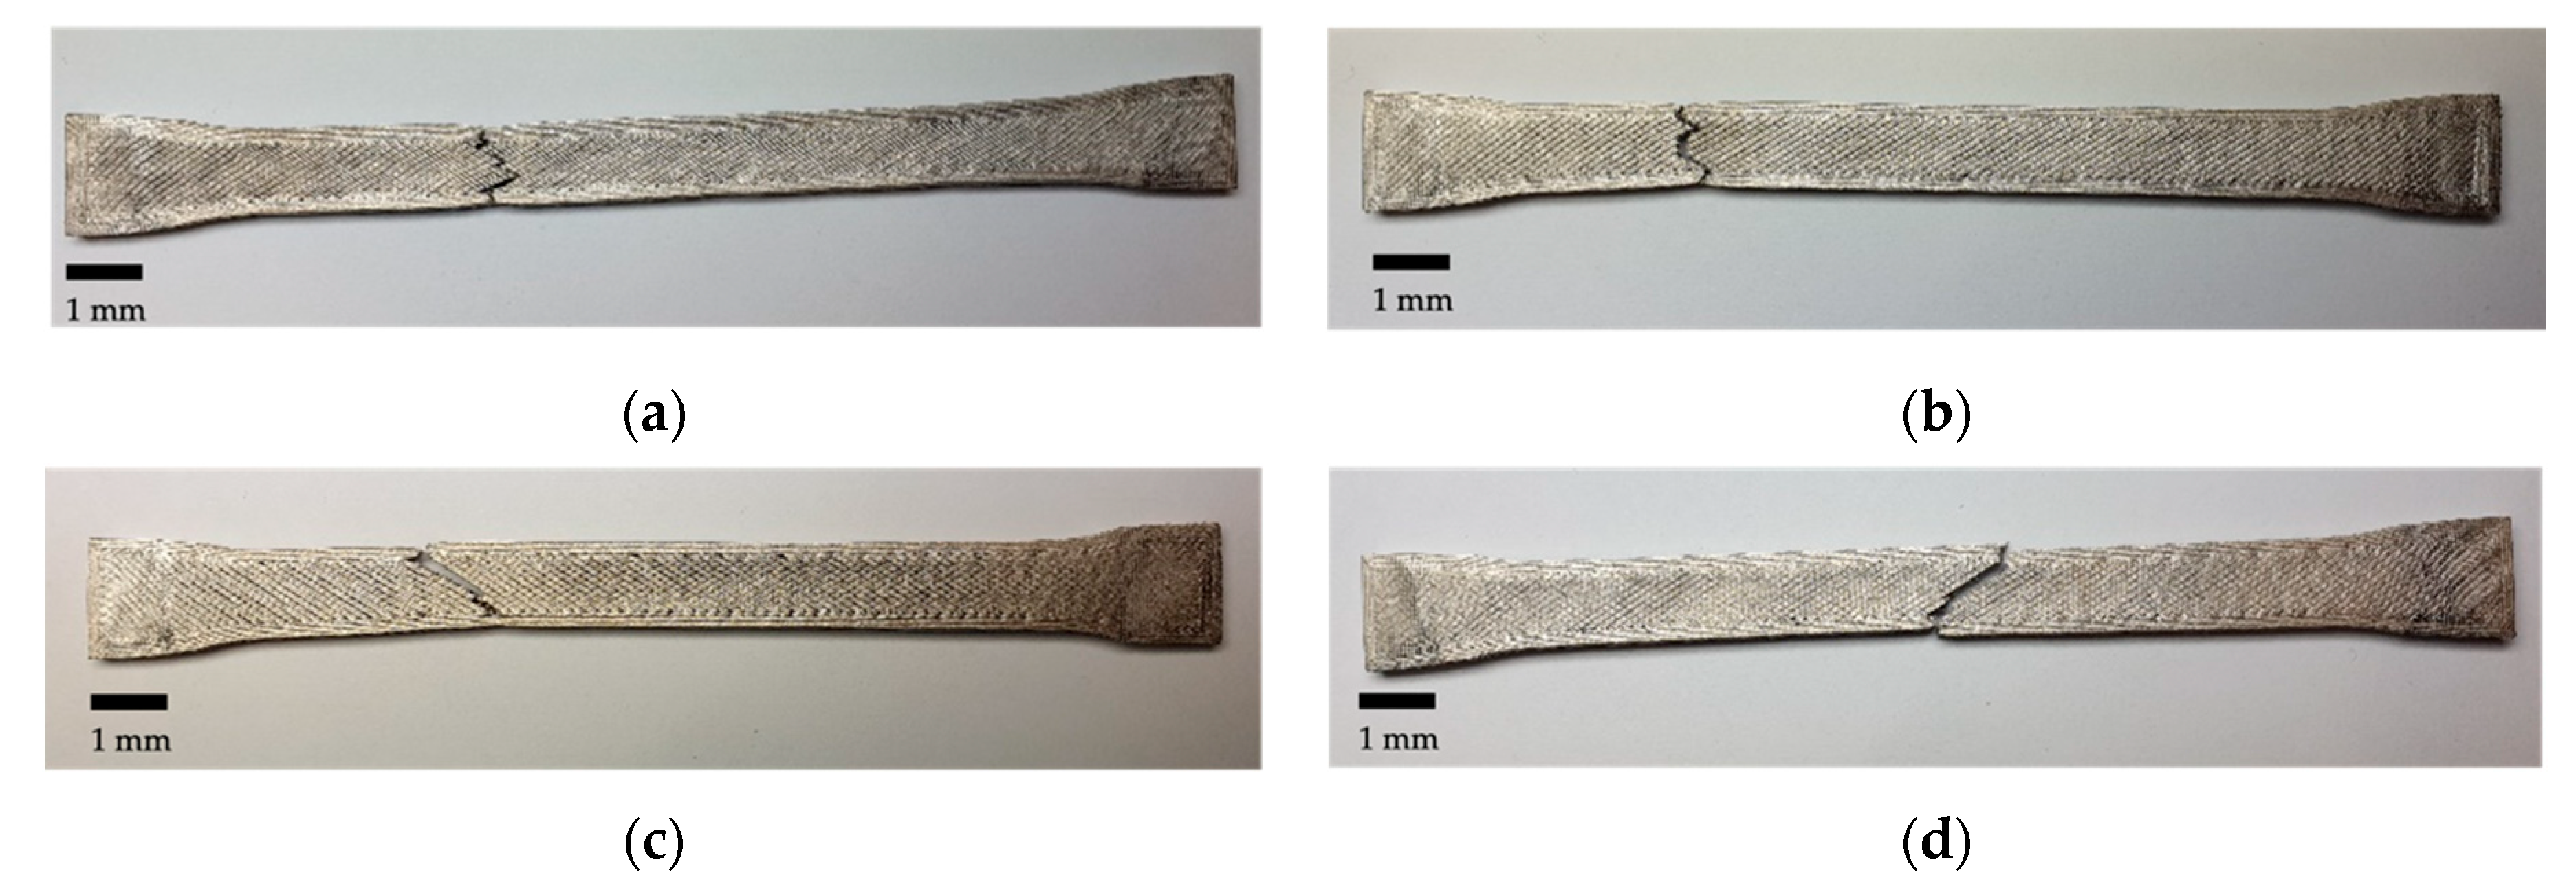
3.2.1. Tensile Testing
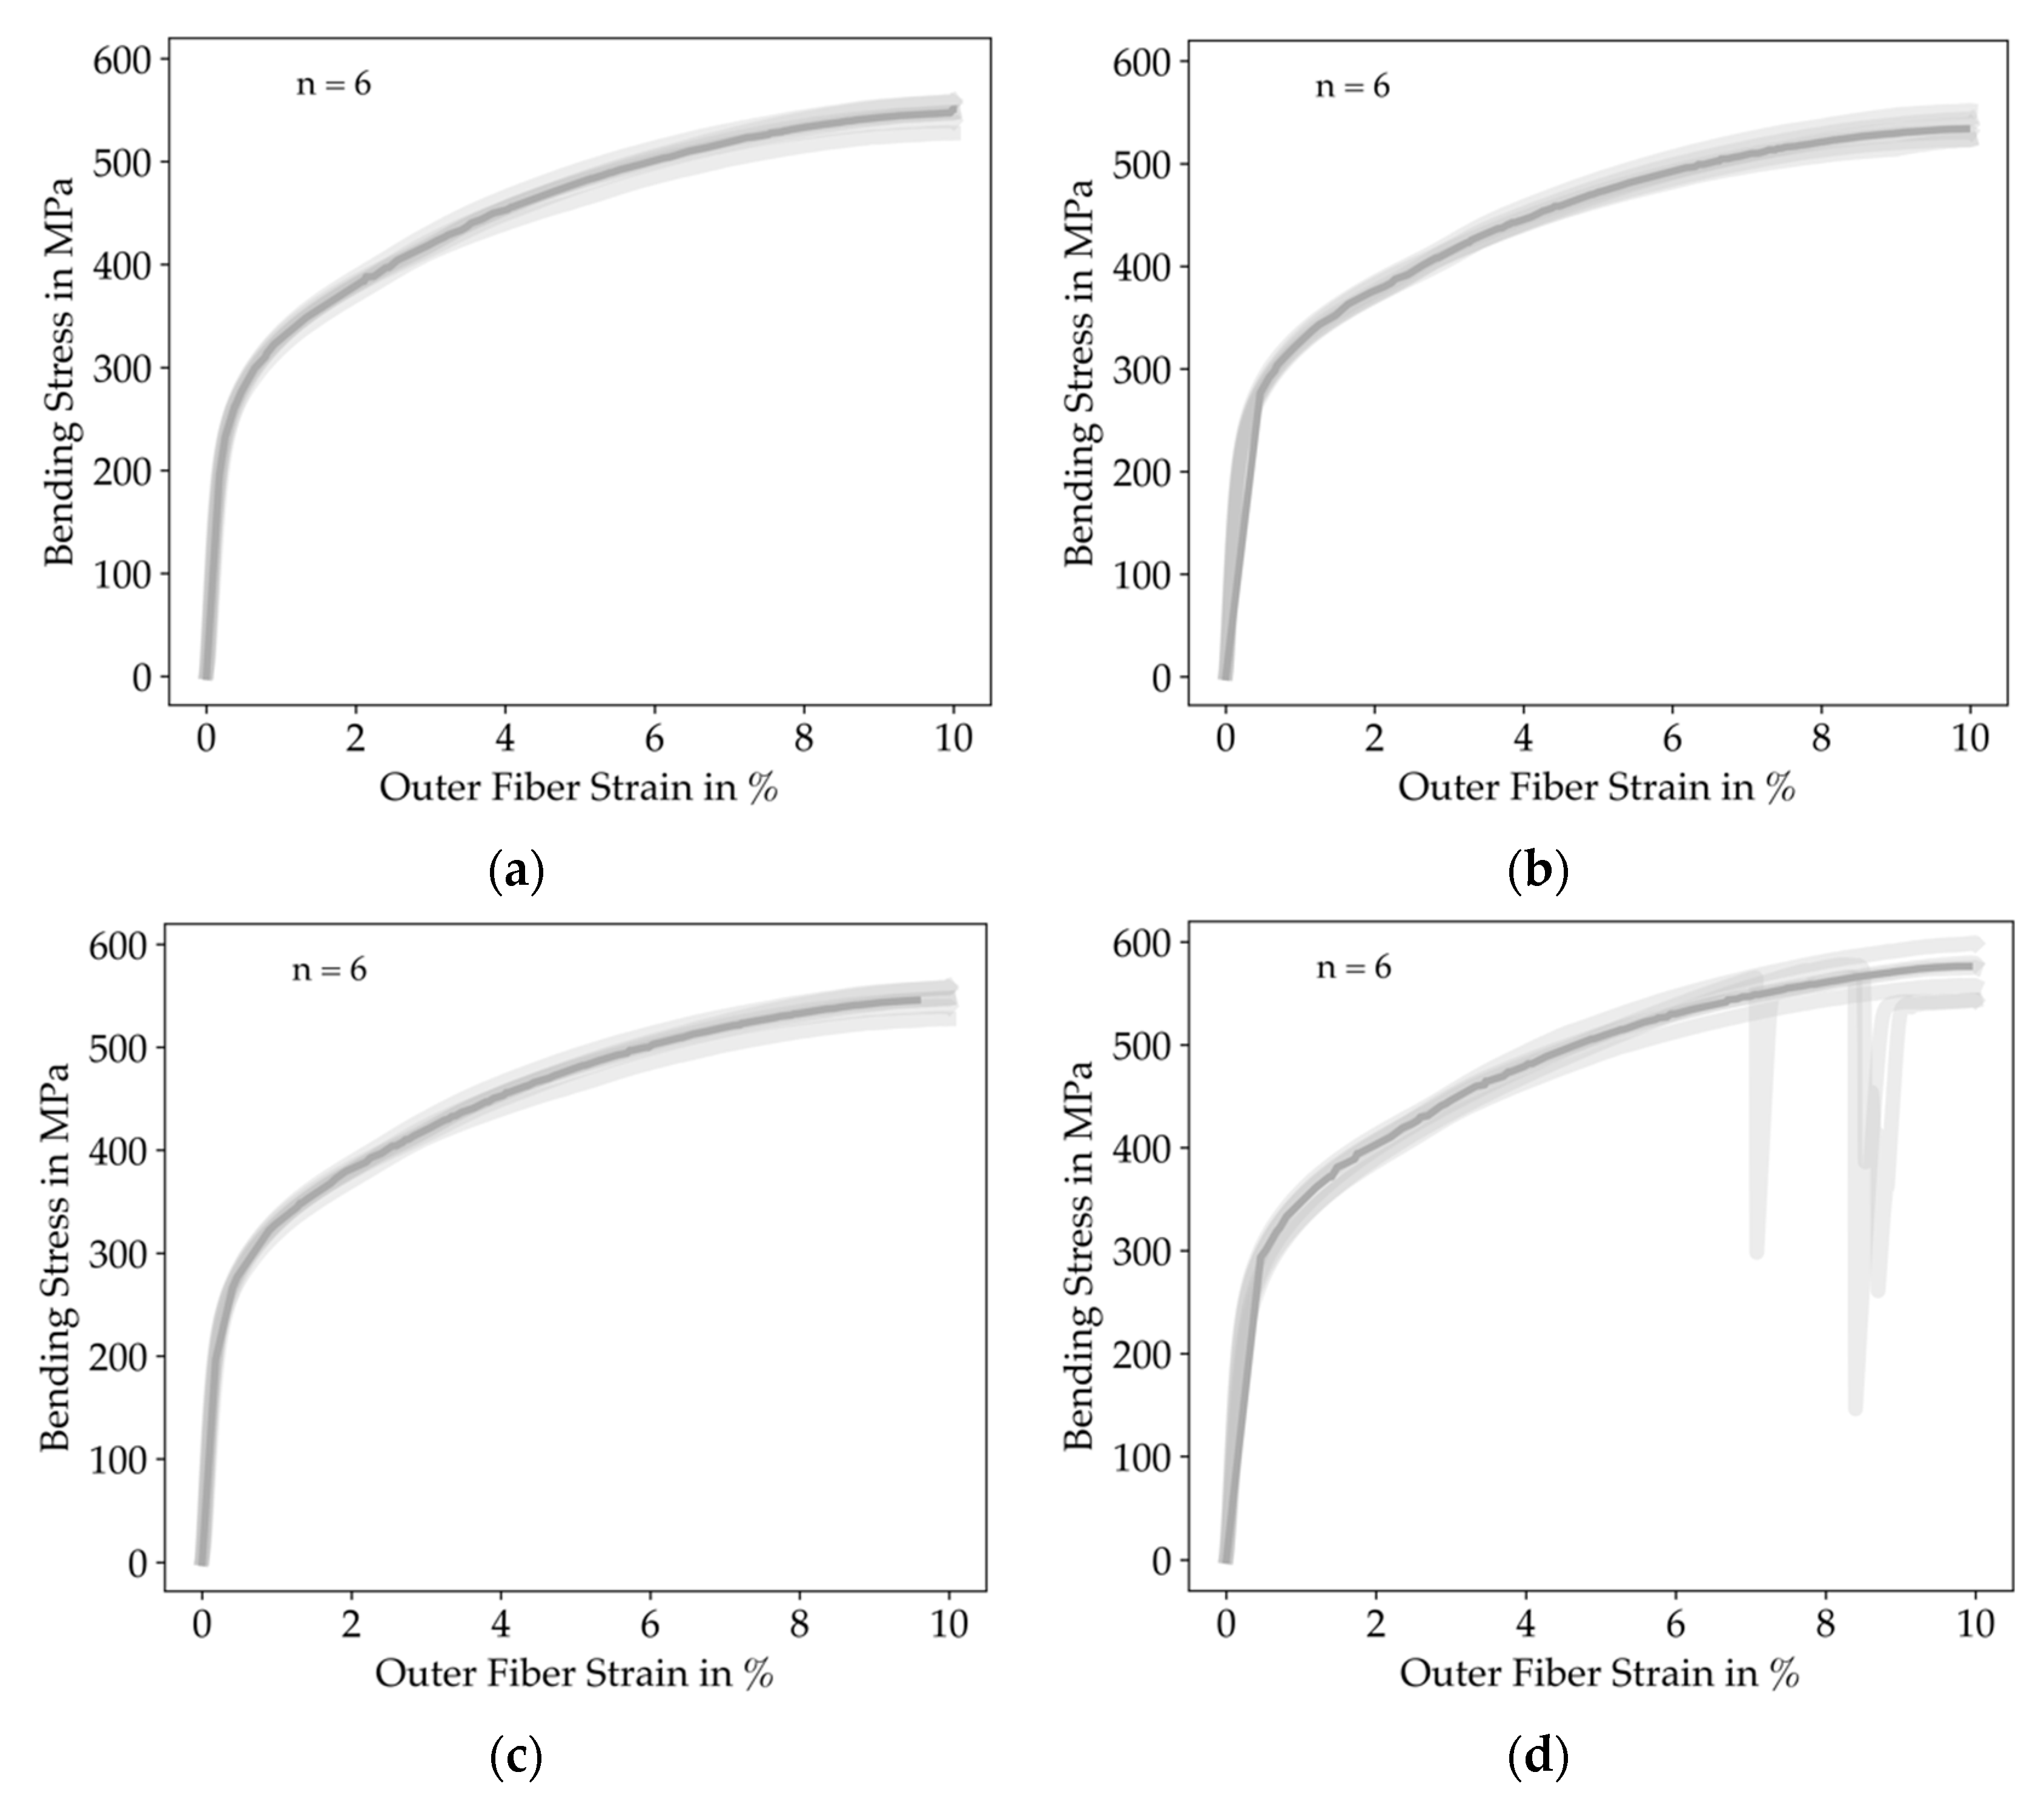
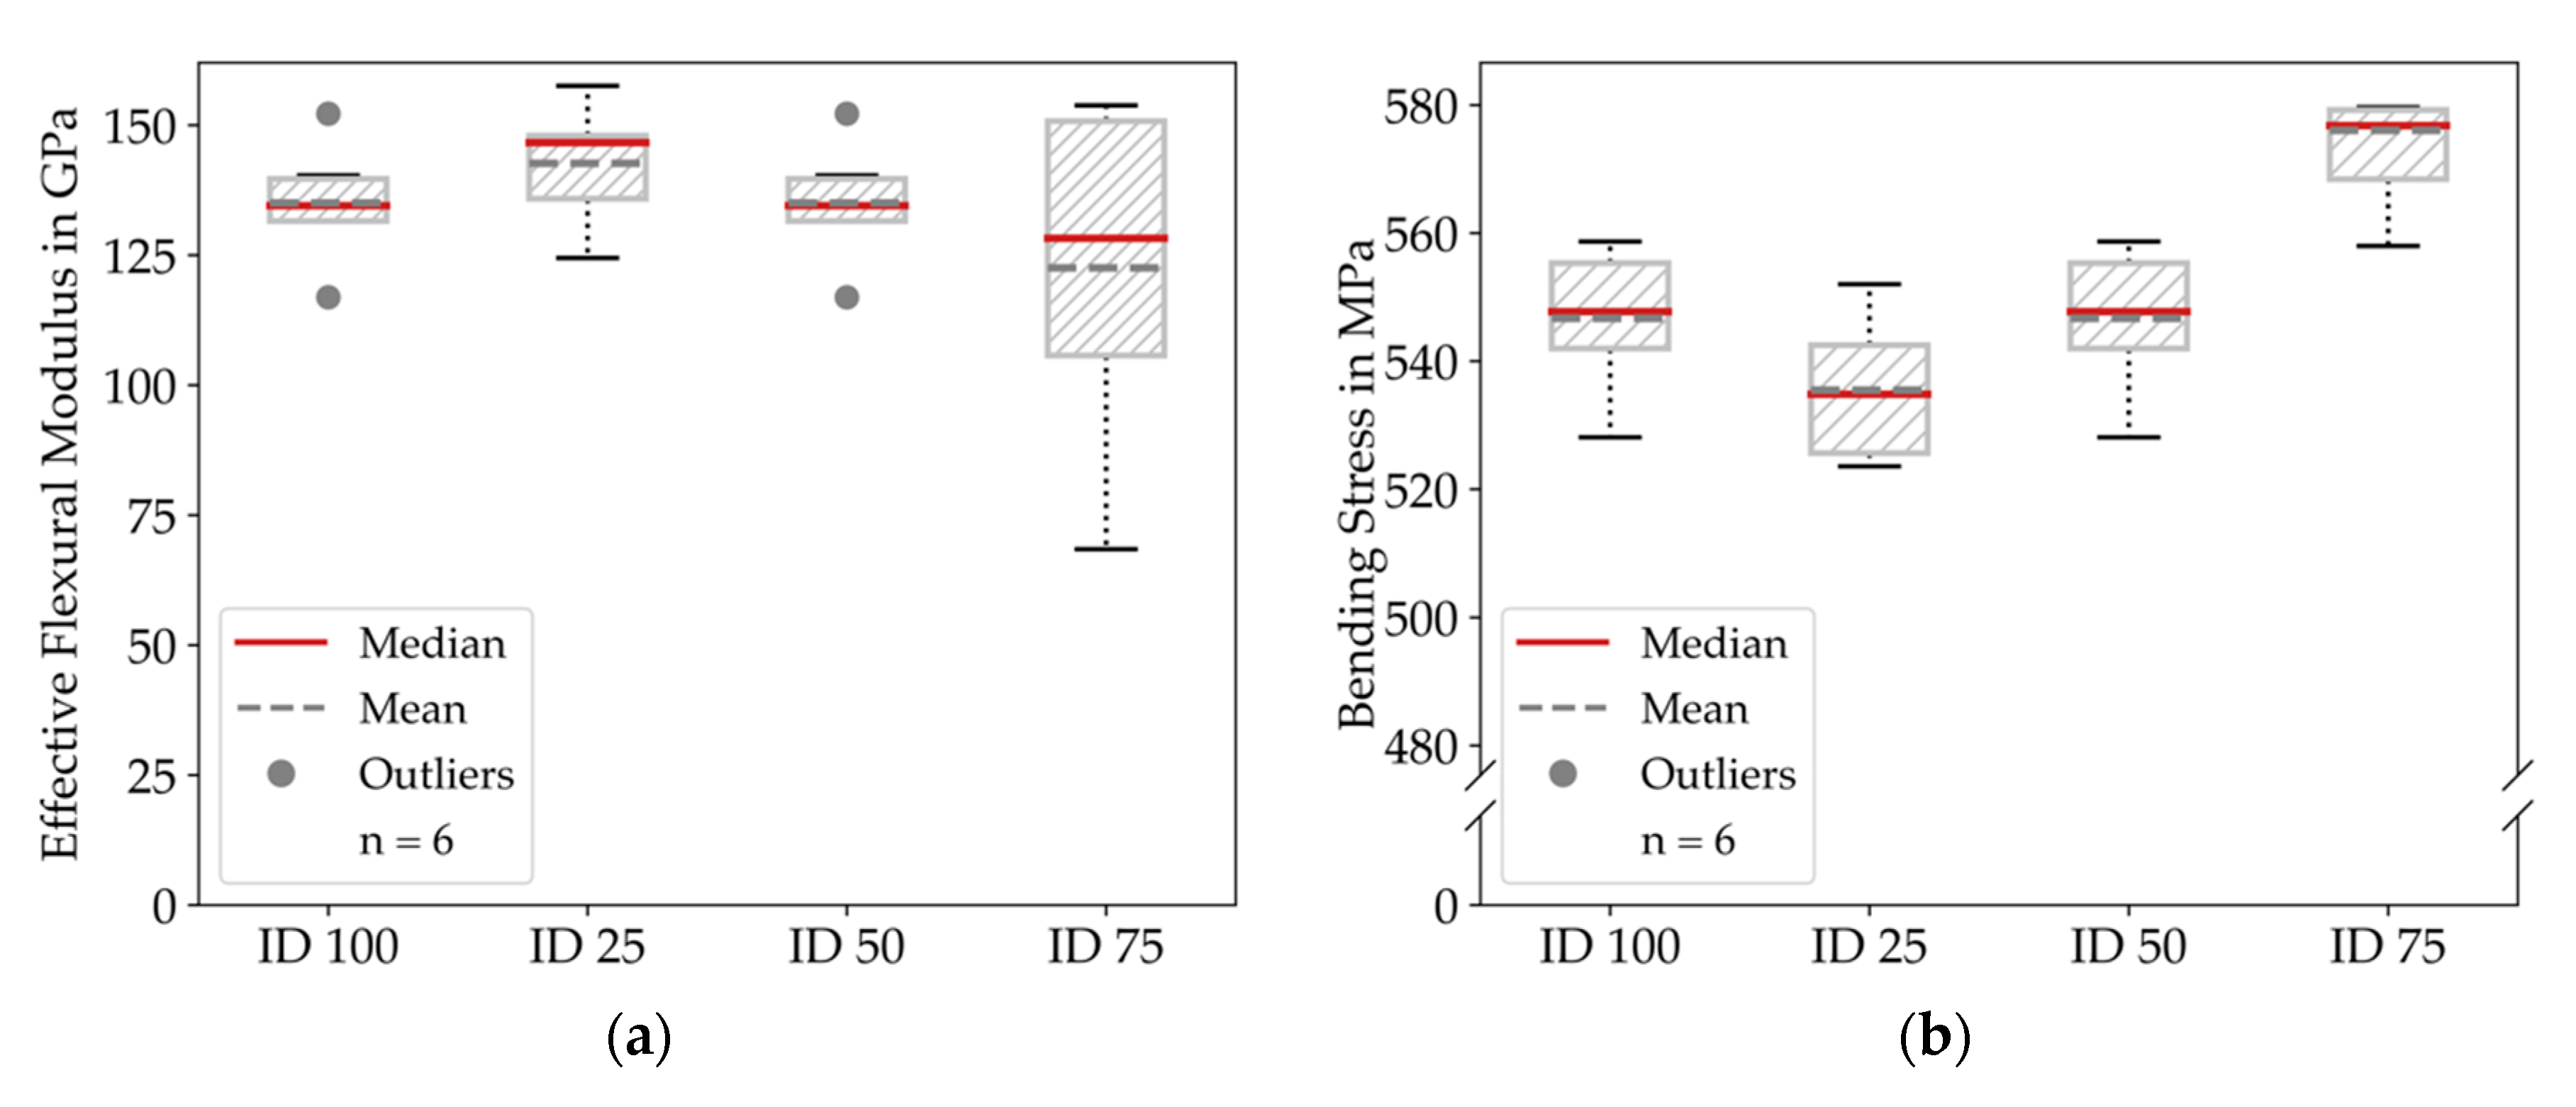
3.2.2. Bending Testing
4. Discussion
4.1. Dimensional Deviations
4.2. Mechanical Properties
5. Conclusions
Author Contributions
Funding
Institutional Review Board Statement
Informed Consent Statement
Data Availability Statement
Conflicts of Interest
References
- Tofail, S.A.M.; Koumoulos, E.P.; Bandyopadhyay, A.; Bose, S.; O’Donoghue, L.; Charitidis, C. Additive Manufacturing: Scientific and Technological Challenges, Market Uptake and Opportunities. Mater. Today 2018, 21, 22–37. [Google Scholar] [CrossRef]
- Clausen, A.; Andreassen, E.; Sigmund, O. Topology Optimization of 3D Shell Structures with Porous Infill. Acta Mech. Sin. 2017, 33, 778–791. [Google Scholar] [CrossRef] [Green Version]
- Bourell, D.L. Perspectives on Additive Manufacturing. Annu. Rev. Mater. Res. 2016, 46, 1–18. [Google Scholar] [CrossRef]
- Scime, L.; Wolf, S.D.; Beuth, J.; Mrdjenovich, S.; Kelley, M. Safety and Workflow Considerations for Modern Metal Additive Manufacturing Facilities. JOM 2018, 70, 1830–1834. [Google Scholar] [CrossRef]
- Agarwala, M.K.; Jamalabad, V.R.; Langrana, N.A.; Safari, A.; Whalen, P.J.; Danforth, S.C. Structural Quality of Parts Processed by Fused Deposition. Rapid Prototyp. J. 1996, 2, 4–19. [Google Scholar] [CrossRef]
- Wu, G.; Langrana, N.A.; Rangarajan, S.; McCuiston, R.; Sadanji, R.; Danforth, S.C.; Safari, A.A. Fabrication of Metal Components Using FDMet: Fused Deposition of Metals. In Proceedings of the Solid Freeform Fabrication Symposium, Austin, TX, USA, 11–13 August 1999. [Google Scholar]
- Wu, G.; Langrana, N.A.; Sadanji, R.; Danforth, S.C. Solid Freeform Fabrication of Metal Components Using Fused Deposition of Metals. Mater. Des. 2002, 23, 97–105. [Google Scholar] [CrossRef]
- Damon, J.; Dietrich, S.; Gorantla, S.; Popp, U.; Okolo, B.; Schulze, V. Process Porosity and Mechanical Performance of Fused Filament Fabricated 316L Stainless Steel. Rapid Prototyp. J. 2019, 25, 1319–1327. [Google Scholar] [CrossRef]
- Godec, D.; Cano, S.; Holzer, C.; Gonzalez-Gutierrez, J. Optimization of the 3D Printing Parameters for Tensile Properties of Specimens Produced by Fused Filament Fabrication of 17-4PH Stainless Steel. Materials 2020, 13, 774. [Google Scholar] [CrossRef] [Green Version]
- Gong, H.; Snelling, D.; Kardel, K.; Carrano, A. Comparison of Stainless Steel 316L Parts Made by FDM-and SLM-Based Additive Manufacturing Processes. JOM 2019, 71, 880–885. [Google Scholar] [CrossRef]
- Gonzalez-Gutierrez, J.; Cano, S.; Schuschnigg, S.; Kukla, C.; Sapkota, J.; Holzer, C. Additive Manufacturing of Metallic and Ceramic Components by the Material Extrusion of Highly-Filled Polymers: A Review and Future Perspectives. Materials 2018, 11, 840. [Google Scholar] [CrossRef] [Green Version]
- Rane, K.; Strano, M. A Comprehensive Review of Extrusion-Based Additive Manufacturing Processes for Rapid Production of Metallic and Ceramic Parts. Adv. Manuf. 2019, 7, 155–173. [Google Scholar] [CrossRef]
- Rane, K.; Cataldo, S.; Parenti, P.; Sbaglia, L.; Mussi, V.; Annoni, M.; Giberti, H.; Strano, M. Rapid Production of Hollow SS316 Profiles by Extrusion Based Additive Manufacturing. In Proceedings of the 21st International ESAFORM Conference On Material Forming: ESAFORM, Palermo, Italy, 23–25 April 2018; AIP Conference Proceedings 1960; Fratini, L., di Lorenzo, R., Buffa, G., Ingarao, G., Eds.; AIP Publishing LLC: Melville, NY, USA, 2018; p. 140014. [Google Scholar]
- Thompson, Y.; Gonzalez-Gutierrez, J.; Kukla, C.; Felfer, P. Fused Filament Fabrication, Debinding and Sintering as a Low Cost Additive Manufacturing Method of 316L Stainless Steel. Addit. Manuf. 2019, 30, 100861. [Google Scholar] [CrossRef]
- Chacón, J.M.; Caminero, M.A.; Núñez, P.J.; García-Plaza, E.; García-Moreno, I.; Reverte, J.M. Additive Manufacturing of Continuous Fibre Reinforced Thermoplastic Composites Using Fused Deposition Modelling: Effect of Process Parameters on Mechanical Properties. Compos. Sci. Technol. 2019, 181, 107688. [Google Scholar] [CrossRef]
- Czasny, M.; Goerke, O.; Kaba, O.; Koerber, S.; Schmidt, F.; Gurlo, A. Influence of Composition on Mechanical Properties of Additively Manufactured Composites Reinforced with Endless Carbon Fibers. KEM 2019, 809, 335–340. [Google Scholar] [CrossRef]
- van de Werken, N.; Tekinalp, H.; Khanbolouki, P.; Ozcan, S.; Williams, A.; Tehrani, M. Additively Manufactured Carbon Fiber-Reinforced Composites: State of the Art and Perspective. Addit. Manuf. 2020, 31, 100962. [Google Scholar] [CrossRef]
- Pezold, D.; Rosnitschek, T.; Kleuderlein, A.; Döpper, F.; Alber-Laukant, B. Evaluation of Technologies for the Fabrication of Continuous Fiber Reinforced Thermoplastic Parts by Fused Layer Modeling. In Technologies for Economic and Functional Lightweight Design; Zukunftstechnologien für den multifunktionalen Leichtbau; Dröder, K., Vietor, T., Eds.; Springer: Berlin/Heidelberg, Germany, 2021; pp. 125–141. ISBN 978-3-662-62923-9. [Google Scholar]
- Desktop Metal Inc. Desktop Metal Metal Filaments. Available online: https://www.desktopmetal.com/materials (accessed on 21 March 2021).
- Markforged Inc. Markforged Metal Filaments. Available online: https://markforged.com/materials/ (accessed on 21 March 2021).
- BASF 3D Printing Solutions GmbH BASF Metal Filaments. Available online: https://forward-am.com/material-portfolio/ultrafuse-filaments-for-fused-filaments-fabrication-fff/metal-filaments/ (accessed on 21 March 2021).
- German, R.M. Metal powder injection molding (MIM): Key trends and markets. In Handbook of Metal Injection Molding; Elsevier: Amsterdam, The Netherlands, 2012; pp. 1–25. ISBN 978-0-85709-066-9. [Google Scholar]
- Rosnitschek, T.; Glamsch, J.; Lange, C.; Alber-Laukant, B.; Rieg, F. An Automated Open-Source Approach for Debinding Simulation in Metal Extrusion Additive Manufacturing. Designs 2021, 5, 2. [Google Scholar] [CrossRef]
- Gonzalez-Gutierrez, J.; Arbeiter, F.; Schlauf, T.; Kukla, C.; Holzer, C. Tensile Properties of Sintered 17-4PH Stainless Steel Fabricated by Material Extrusion Additive Manufacturing. Mater. Lett. 2019, 248, 165–168. [Google Scholar] [CrossRef]
- Jimbo, K.; Tateno, T. Shape Contraction in Sintering of 3D Objects Fabricated via Metal Material Extrusion in Additive Manufacturing. Int. J. Autom. Technol. 2019, 13, 354–360. [Google Scholar] [CrossRef]
- Ait-Mansour, I. Design-Dependent Shrinkage Compensation Modeling and Mechanical Property Targeting of Metal FFF. Prog. Addit. Manuf. 2020, 5, 51–57. [Google Scholar] [CrossRef] [Green Version]
- He, H.; Li, Y.M.; Li, D.P. Effect of Sintering Temperature and Atmosphere on Corrosion Behavior of MIM 316L Stainless Steel. AMR 2011, 239–242, 132–136. [Google Scholar] [CrossRef]
- Turner, B.N.; Gold, S.A. A Review of Melt Extrusion Additive Manufacturing Processes: II. Materials, Dimensional Accuracy, and Surface Roughness. Rapid Prototyp. J. 2015, 21, 250–261. [Google Scholar] [CrossRef]
- Rosnitschek, T.; Hueter, F.; Alber-Laukant, B. FEM-Based Modelling of Elastic Properties and Anisotropic Sinter Shrinkage of Metal EAM. Int. J. Simul. Model. 2020, 19, 197–208. [Google Scholar] [CrossRef]
- DIN EN ISO 6892-1:2019. Metallic Materials—Tensile Testing—Part 1: Method of Test at Room Temperature; Beuth: Berlin, Germany, 2019. [Google Scholar] [CrossRef]
- DIN EN ISO 3325:1999 + A1:2002. Sintered Metal Materials, Excluding Hardmetals—Determination of Transverse Rupture Strength; Beuth: Berlin, Germany, 2002. [Google Scholar] [CrossRef]
- Hausnerova, B.; Novak, M. Environmentally Efficient 316L Stainless Steel Feedstocks for Powder Injection Molding. Polymers 2020, 12, 1296. [Google Scholar] [CrossRef] [PubMed]
- Röttger, A.; Boes, J.; Theisen, W.; Thiele, M.; Esen, C.; Edelmann, A.; Hellmann, R. Microstructure and Mechanical Properties of 316L Austenitic Stainless Steel Processed by Different SLM Devices. Int. J. Adv. Manuf. Technol. 2020, 108, 769–783. [Google Scholar] [CrossRef]
- AISI Type 316L Stainless Steel Material Data. Available online: http://asm.matweb.com/search/SpecificMaterial.asp?bassnum=mq316q (accessed on 29 August 2021).
- Rosnitschek, T.; Hentschel, R.; Siegel, T.; Kleinschrodt, C.; Zimmermann, M.; Alber-Laukant, B.; Rieg, F. Optimized One-Click Development for Topology-Optimized Structures. Appl. Sci. 2021, 11, 2400. [Google Scholar] [CrossRef]


| Printing Parameter | Value |
|---|---|
| Nozzle temperature | 240 °C |
| Chamber temperature | 70 °C |
| Printing bed temperature | 140 °C |
| Printing speed | 25 mm/s |
| Layer height | 0.2 mm |
| Layer width | 0.5 mm |
| Extrusion factor | 1.6 |
| Length (x-Axis) | Width (y-Axis) | Height (z-Axis) | |
|---|---|---|---|
| ID 25 | 15.48% | 17.70% | 17.35% |
| ID 50 | 15.75% | 17.31% | 17.80% |
| ID 75 | 15.52% | 16.37% | 15.16% |
| ID 100 | 15.31% | 17.52% | 17.26% |
| Length Deviation | Width Deviation | Height Deviation | |
|---|---|---|---|
| ID 25 | 1.31% (0.79%) | 1.92% (2.62%) | 6.86% (4.21%) |
| ID 50 | 1.04% (0.79%) | 2.31% (3.62%) | 8.06% (6.86%) |
| ID 75 | 1.18% (0.70%) | 3.31% (3.67%) | 3.39% (−1.45%) |
| ID 100 | 1.65% (0.96%) | 2.54% (4.06%) | 5.39% (2.65%) |
| Mechanical Property | ID 100 | PIM [32] | SLM [33] | AISI 316L [34] | MetEBAM [8] | MetEBAM [10] |
|---|---|---|---|---|---|---|
| Tensile strength in MPa | 296 (78) | 557 | 644 | 515 | 500–520 | 465 |
| Elongation at break in % | 32 (16) | 30 | 51 | 60 | 32–37 | 31 |
| (effective)Young’s modulus in GPa | 132 (65) | no data | 165 | 193 | 185 | 152 |
| (effective sintered) relative density in % | 83.9 (3.7) | 92.1 | 99.9 | 100 | 99.5 | 98.5 |
Publisher’s Note: MDPI stays neutral with regard to jurisdictional claims in published maps and institutional affiliations. |
© 2021 by the authors. Licensee MDPI, Basel, Switzerland. This article is an open access article distributed under the terms and conditions of the Creative Commons Attribution (CC BY) license (https://creativecommons.org/licenses/by/4.0/).
Share and Cite
Rosnitschek, T.; Seefeldt, A.; Alber-Laukant, B.; Neumeyer, T.; Altstädt, V.; Tremmel, S. Correlations of Geometry and Infill Degree of Extrusion Additively Manufactured 316L Stainless Steel Components. Materials 2021, 14, 5173. https://0-doi-org.brum.beds.ac.uk/10.3390/ma14185173
Rosnitschek T, Seefeldt A, Alber-Laukant B, Neumeyer T, Altstädt V, Tremmel S. Correlations of Geometry and Infill Degree of Extrusion Additively Manufactured 316L Stainless Steel Components. Materials. 2021; 14(18):5173. https://0-doi-org.brum.beds.ac.uk/10.3390/ma14185173
Chicago/Turabian StyleRosnitschek, Tobias, Andressa Seefeldt, Bettina Alber-Laukant, Thomas Neumeyer, Volker Altstädt, and Stephan Tremmel. 2021. "Correlations of Geometry and Infill Degree of Extrusion Additively Manufactured 316L Stainless Steel Components" Materials 14, no. 18: 5173. https://0-doi-org.brum.beds.ac.uk/10.3390/ma14185173