1. Introduction
In the South-East Asian countries (SACs), booming economies have significantly increased consumption of energy. During 2005–2030, the consumption of energy was anticipated to increase 2.6 times [
1]. In 2040, the demand of energy will possibly increase by virtually 66.67%, representing 10% of the increase in international demands [
2,
3]. In the meantime, the energy-associated ecological pollution caused mainly by emissions of greenhouse gases from the energy industry will increase regionally as well as internationally. The SACs, particularly Vietnam, Thailand, the Philippines, and Indonesia, should start swiftly investing in renewable electricity supply forms because of the climate change impacts [
4,
5]. To fit this issue, it is preferable to adopt the sustainable biomass energy technologies, but the barrier to adoption of sustainable biomass energy technologies is in justifying the prepositions of value by the providers of the services, as well as the customers, followed by technology standards and regulatory constraints that obstruct the technologies of sustainable biomass energy. The planners and operators of the power system still face various challenges in the integration of sources of renewable energy into grids of the power system. Fossil fuels are vital to the economy of the SACs [
6].
Factors such as a growing understanding of anthropogenic international causes of environmental degradation, eco risks, and volatility in oil prices motivate broad interests in locally generated alternative fuels, such as sustainable biomass energy. The demand for sustainable biomass energy in the SACs was increased by approximately 21% between 2019 and 2020 [
6]. In the current political and economic climate in the SACs, the alternative fuel goals are to produce more energy in the sustainable biomass energy and minimize emissions of greenhouse gases. The phrase “life cycle analysis” is commonly applied in describing the summations of benefits and costs to balance greenhouse gases and energy efficiencies accrued in the generation and consumption of sustainable biomass energy. The sustainable biomass energy life cycle for this analysis purpose starts with the biomass plant and ends with biomass energy production.
The energy demands for SACs are estimated to grow significantly between 2015 and 2050 [
7]. That is a reflection of increased populations with restricted mediations to minimize the general building’s need. The new houses shall have electric appliances, like building-level heat pumps. A huge number of existing gas boilers shall have to be substituted by the heat pumps [
8]. In addition, heating, ventilation, and air conditioning are critical to energy demand [
9].
The growing requirements for electricity around the world is likely to require additional substations and grid upgrades, including biomass energy utilization. At the same time, it is necessary to take into account the dependence on the energy of the main power supply networks. Population growth, combined with an increase in the number of jobs as well as homes, is projected to lead to an increase in global energy demand [
10].
This review reveals a biomass energy plan that is a viable alternative to fuel. Low energy prices assumption [
11], in this case, implies that structures have a high demand for electricity as investments in the retrofits of energy efficiencies that have been incentivized. The case leads to approximated reductions of sixty percent in emissions of carbon dioxide from levels in 1990. Because of the fast economic growth in SACs, the mean carbon emissions have gone up by more than 5% [
11]. It is stated that growing buying energy parities result in a rise in consumption of per capita electricity, thus increasing the emissions of per capita CO
2 [
12].
Figure 1 indicates relationships among carbon dioxide emissions, per capita electricity consumption, and buying power parities [
13,
14,
15,
16,
17,
18,
19]. CO
2 is not a large source of greenhouse gas emission in South-East Asian nations in which agriculture and forestry are the main emission sources, even though CO
2 is the biggest source of emissions of international greenhouse gases that originate significantly from the power industry [
20].
For the appliances, there are approximately ten percent improvements in efficiencies and forty percent improvements. However, this is combined with more frequent use of electrical appliances due to the growing population. Life cycle analysis of individual biomass plants with state-particular biomass generation data notably yields different evaluations of greenhouse gases and energy than comprehensive analysis over significant geographic areas. The most fruitful and accessible ways in which biomass plants might decrease total emissions of greenhouse gases increase the energy efficiency of fuel.
This systematic review is mainly aimed at identifying possible studies of energy production from biomass carried out in the countries of South-East Asia. Based on the literature review, the trend in the use of biomass in the world was identified, including the problems and obstacles. The expected high population growth in South-East Asia is another reason why SACs need to study how to achieve net zero carbon.
2. Place of Biomass in the Energy System
Figure 2 shows that in the first two decades of the 21st century, the consumption of renewable energy sources increased significantly. This can be traced especially clearly in the countries of South-East Asia for hydro resources, as the most developed type of energy in the world. At the same time, the use of renewable energy sources, such as wind and sun, began. Against this background, in Thailand, the use of biomass has increased tenfold, and, in many other countries, it has appeared as an alternative source of energy.
The detailed use of various sources of biomass in the countries of South-East Asia is listed in
Table 1.
Table 1 shows that Malaysia is characterized by the use of oil palm waste; Vietnam—peanut and coconut shell; Cambodia and Laos—cassava stalk; Brunei, Myanmar and Indonesia—rice husk; Philippines—bagasse.
The heating value is one of the most important properties of biomass fuels for design calculations or numerical simulations of thermal conversion systems for biomass. There are a number of formulae proposed in the literature to estimate the higher heating value (HHV) of biomass fuels from the basic analysis data, i.e., proximate, ultimate, and chemical analysis composition [
41,
42]. In the papers [
41,
43], these correlations were evaluated statistically based on a larger database of biomass samples collected from the open literature.
3. Methodological Approach: Review Strategy
During recent years, since the beginning of the 21st century, the nation-particular data associated with bioenergy sources, power potentials, and usage in some nations, including Lao PDR, Myanmar, and Cambodia, have not been adequately accessible because the majority of SACs are emerging economies. However, the information was gathered to a viable level from reviewed papers, peer-reviewed research papers, reports from non-governmental organizations, and policy reports by institutions such as the Global Renewable Energy Agency, Global Energy Agency, UN Food and Agriculture Organization, World Bank and Asian Development Bank. The research then assessed and synthesized the biomass sources and the potential, usage, and management of biomass energy in the region to emphasize the possible usage of the available biomass sources in the SACs. In addition, the biomass usage challenges and barriers in the region were also explained [
44]. Ultimately, the research recommended sustainable biomass energy approaches by comparing conventional biomass usage ways [
40].
Many evidence-based interventions (EBIs) have been designed to improve energy production or reduce emissions of greenhouse gases. When implemented in diverse community settings, many EBIs nevertheless have portrayed restricted adoptions, reach, and sustainability [
45]. These limitations are particularly noticeable in low-resource nations that serve energy disparity populations. Practitioners usually determine challenges with existing EBIs initially designed and tried with populations diverse from their target populations, and launch required adaptation to make the interventions more appropriate [
46]. Most local adaptations to enhance fit for energy disparity populations are not well evaluated or documented, even though some EBIs have been extensively adapted for different populations and assessed [
47]. As a result, empirical information is always lacking concerning the possible success of particular adaptation practitioners to be considered [
48]. The researcher advocates for expansions in the emphases of adaptation study, from investigator-led interventions to studies that inform practitioners-lead adaptation. The researcher aims to inform study that facilitates effective adaptations and equitable implementations and deliveries of EBIs that improve energy security in SACs by presenting a study vision and strategies required to build this scientific area of biomass energy [
40].
The systematic literature review revealed that evidence-oriented, biomass frameworks and innovative educational interventions for the promotion of biomass energy should assist policymakers in ensuring energy security and safety in SACs [
49]. It is indicated that concentrated teaching approaches could have an impact on enhancing biomass production to integrate modern energy production methods. The research used cluster analytical techniques [
50]. The multilevel data gathered are utilized to determine an evidence-based biomass energy framework to promote energy production and security in SACs. The sources are reliable because biasness is minimized by data triangulation. It indicated validity and reliability in the research study [
40].
4. Demand for Electricity in SACs
The demand for electricity in SACs will grow by up to 15% between 2015 and 2050 [
51]. With a growing population and, as a result, an increase in energy demand, it will be necessary to introduce new technologies, such as the utilization of biomass energy [
52]. About a third of the heat demand of SACs shall be achieved by the use of heat networks and renewable energy like biomass production [
53]. The installed systems of heat shall become steadily low carbons, and the sources of fuel shall show this through steadily renewable energy use and sources of domestic secondary heat like data centers and waste plants. This shall minimize the demands placed on the national gas and electricity networks.
Sustainable biomass production will provide quality energy to fulfill the 21st century demands in SACs. It integrates technologies that consider the present energy challenges, such as direct combustion of woody biomass; pyrolysis and gasification of biomass; anaerobic digestion of organic waste to produce biogas; landfill gas production; direct incineration of organic waste [
54,
55]. The vital smart grid goal is to foster active decision making and participation of the customers as well as to develop functioning environments in which both the users of electricity and utilities influence one another. Users can influence the services in the smart grids through the addition of sources of distributed productions, like the solar panels (modules of photovoltaic-PV). Utilities can enhance reliabilities, effectiveness, and efficiency by the programs of demand response, adding distributed energy storage or productions at the substations and offering automated controls to the smart grids. For example, some of the South-East Asian states, like Thailand, Malaysia, Brunei Darussalam, and Singapore, have already gained access to 100% of power, as indicated in
Figure 3 [
51,
53,
56]. By 2030, other nations are meanwhile anticipated to achieve 100% of electricity access [
51,
57].
Representing 77.4% of the international supply of renewable energy and 10.40% of the globe’s total chief energy supplies, biomass power is by far the main source of renewable energy [
5]. A major biomass feedstock supplier to markets like the U.S and Europe is Asia. However, new investments and opportunities in biomass are emerging within the region, especially in SACs [
6]. With their plentiful biomass resources, SACs hold a strategic place in the atlas of international biomass energy [
7]. In addition, the region is one of the biggest producers of wood and agricultural products. The quantities of biomass residues, according to conservative estimates produced from palm oil, sugar, and rice mills, are over 200–230 million tons per annum corresponding to coproduction potentials of 15–20 gigawatts (GW) [
7].
SACs nowadays are quickly becoming striking markets for generating biomass as a source of energy [
5]. Equal to 87% of the supply of renewable energies, biomass energies might offer 26% of supply of aggregate primary energy [
6]. Most South-East Asian states are among the chief manufacturers of agricultural products like rubber, coconut, palm oil, canes, sugar, and rice; the most hopeful residues are wood residues, oil palm residues, sugarcane bagasse, and rice husks [
5].
The renewable energy share to the production of total electricity is indicated in
Figure 4. The production of the aggregate power from non-renewable and renewable production totaled to about 856.0 Terawatt-hours (TWhrs) [
57]. Out of these, 20% originated from renewable energies: accounting for wind (0.6%) [
58], solar photovoltaic (PV) (1.2%) [
59], geothermal (11.5%) [
60], biofuels (12.6%) [
61], and hydropower (74.1%) [
53].
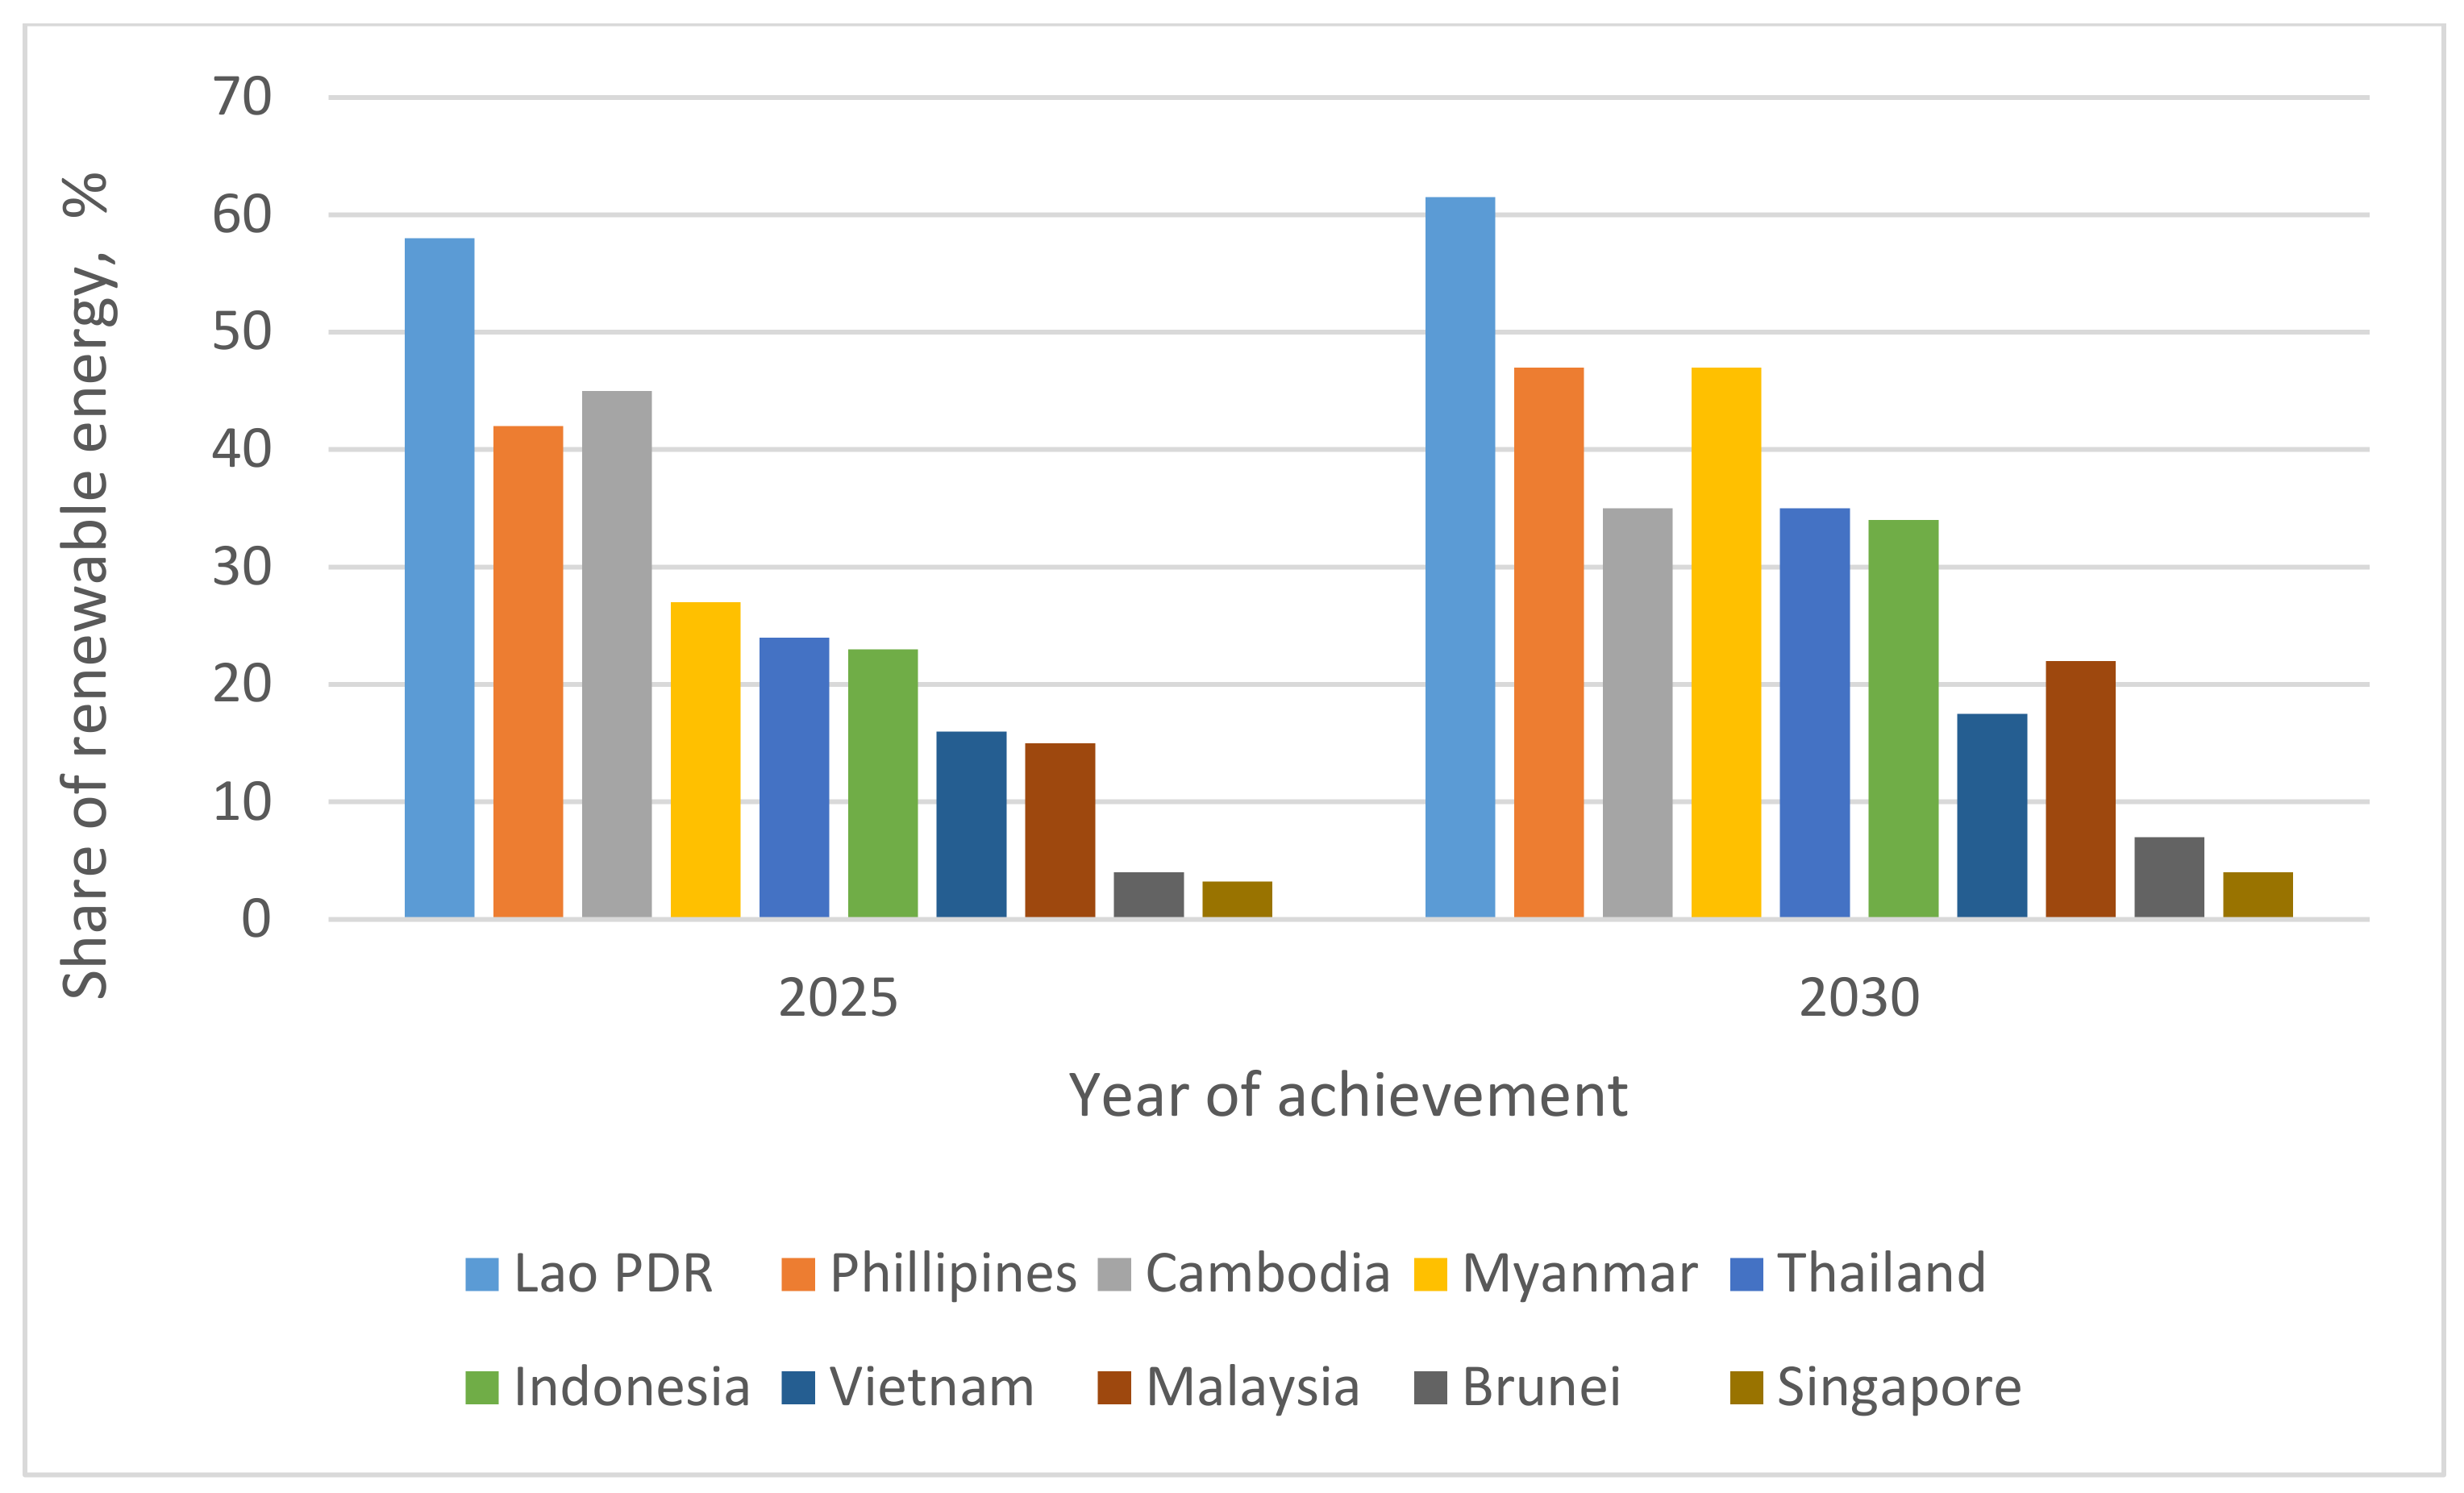
In total primary energy supplies, the possible renewable energies share in the Southern Asian nations is shown in
Figure 5. The share of renewable energies in aggregate supply of primary energy at a country level appears to improve greatly, particularly in the nations that fully-phased out conventional applications of biomass, such as Myanmar, Indonesia, Lao People’s Democratic Republic (Lao PDR), and Cambodia [
62]. The possible biomass energy share in the supply of aggregate chief energy is likely to be more than half of the total supply of primary energy by 2025 in Lao PDR (
Figure 5).
Various studies have concentrated on the emission factors, policy, energy utilization, renewable energy sources, bioenergy, and sources of renewable energies [
2,
8,
9,
15,
16,
17,
18,
19], but mainly in particular nations like Philippines, Brunei Darussalam, Lao PDR, Cambodia, Malaysia, and Indonesia [
19,
20,
21,
22,
23,
24,
25]. Thus, the review underlined the sources of biomass, management, and potentials of bioenergy in SACs in ensuring the sources of biomass and their energy usage are applicable to non-governmental organizations, policymakers, and scholars looking out for biomass energy as a crucial part of the sector of future renewable energy in SACs.
5. Current Status of Biomass in SACs
South-East Asian countries are located in tropical regions and have the capability of producing huge bioenergy amounts throughout the years. For the local people, bioenergy from forests makes up a specifically precious energy source in the domestic fuel form [
16]. In addition, most of the region has plenty of agricultural wastes for sources of bioenergy because of their agricultural-oriented economies. For example, Myanmar has increased the bioenergy resources from the agricultural and forest sectors with an agriculture-oriented economy and 45% of forest covers. A careful assessment should be made of the potential for the use of the entire variety of energies of various biological resources, as illustrated in
Figure 6. Sewage and solid waste is constantly generated in urban environments and can not only be a source of waste and pollution, but also an excellent and efficient raw energy material. The same can be said about agricultural waste, which is generated in huge quantities in tropical and equatorial regions. In SACs, the agriculture and forest resources are highlighted in
Table 2.
In SACs, the bioenergy sources and their energy potentials are presented in
Table 2. The biomass utilization in the SACs is described in
Table 3. Per year, it is established that aggregate amounts of waste from the forest and agriculture sectors are approximated at more than 0.5 billion tons. In addition, the energy potentials of aggregate biomass in the nations have more than 8 billion gigajoules [
63]. In each of the SACs, resources of agriculture and forest for biomass energy were briefly discussed in
Table 2.
5.1. Cambodia
In Cambodia, 57% of the country’s total area (10.094 million hectares) is covered with forests. Thus, wood charcoal and woods are accountable for about 80% of aggregate energy consumptions. In rural areas, 94% of wood and charcoal are utilized for cooking, while 80% of the fuels are used in the urban areas. The other main bioenergy sources originate from agricultural wastes such as coconut fronts and shells, groundnut husks and shells, bagasse, cassava stalks, corns cobs, rice straws and husks [
64]. The aggregate installed capacities are currently approximately 23.0 MW. By 2030, Cambodia has a plan of generating more than 75.0 MW of installed biomass capacities.
5.2. Myanmar
Covering 45% of the country with forests, Myanmar is an agricultural state [
28]. Myanmar generates more than twenty million tons of paddies yearly. Thus, the nation’s main bioenergy sources are acquired mainly from the agriculture and forest sectors. The residents are largely dependent on solid bioenergy fuels because 70% of the people live in rural areas [
63]. About 65.0% of the aggregate energy consumptions of Myanmar originate from bioenergy sources. From biogas and biomass, the aggregate capacity potentials are approximated at 4741 MW and 6899 MW, respectively [
29]. The total installed capacities out of these have reached 115.0 MW [
63].
5.3. Lao PDR
Lao PDR has plenty of biomass sources from the forest sectors, with over 65% of the country covered in forest [
26]. About 80% of families depend on charcoal and firewood because of the people dwelling in rural areas. Charcoal and firewood have 68% of the chief energy supply in the rural areas. The agriculture sector might offer a wealth of bioenergy sources, in addition to the forest sector, because of its agricultural economy [
30], as the installed bioenergy capacities is expected to reach about 40.0 MW by 2025. Also, Lao PDR is planning to accomplish 58 MW of biomass capacity [
63].
5.4. Vietnam
Vietnam has plenty of bioenergy resources, being an agriculture nation with more than 300 GW theoretic capacity potentials [
31]. Bioenergy is mainly used at household levels (76%) [
63]. Only 24% of the biomass energies are utilized in combined heat and power (CHP) plants and small industrial boilers in sugarcane grinders [
32]. The main bioenergy resources are coconut shells, coffee husks, peanut shells, cassava stems, maize residues, cane wastes, bagasse, rice straws and husks, and forest residues. In Vietnam, the major consumption potentials are aimed at industrial and municipal production energy factories. By 2020, Vietnam has achieved 500 MW combined capacity of biomass energy. By 2030, the country targets 2000 MW combined capacities [
33].
5.5. Philippines
The Philippines government has looked at renewable energies for potential alternatives because the power needs of the country dominantly depend on fossil fuel imports [
34]. Bioenergy, among the alternatives, is important to the Philippines as almost 30% of the energy for the one-hundred million citizens dwelling in the country originates from bioenergy and is largely utilized by the rural populations for household cooking [
27,
35]. In addition, with 276.70 MW of aggregate installed capacities around the Philippines, the bioenergy sector is quickly changing [
35]. In the Philippines, applications of bioenergy account for virtually 15% of the chief energy applications [
36].
6. Sustainable Energy Model
The integration of smart grid tools contributes to noteworthy enhancements in dependability. Grid operators can monitor power quality, which helps them in the early detection of unhealthy equipment. An additional advantage of an automated grid is its ability to self-heal, ensuring that it recovers quickly. It can start, stop, or reroute power flow to avoid further problems without manual intervention. The use of a Geographic Information System (GIS) helps in the network’s design, and this has been found to promote optimization of the grid infrastructure. GIS is a tool widely used in scheduling maintenance works and has been observed to save between 10 and 30 percent by reducing operational expenses [
65]. Additional cost savings come from distributed generation by deferring improvement or establishing new transmission and distribution networks connected to the client loads. The system operator can integrate the massive volume of data on a real-time basis so that correct price indications may be produced and billing data can be gathered. The well-timed settlements of the vast number of new dealings can be achieved. The latter part can be facilitated with IoT and blockchain technologies [
65].
A smart grid comes with security improvements that increase its robustness and resiliency for physical and cyber-attacks. This reduces the probabilities and concerns of human-made attacks (such as theft and infrastructure vandalism) and natural disasters. The Advanced Metering Infrastructure (AMI) fitted provides operators with real-time and two-way connection on personal customer statuses. This includes the ability to remotely connect and disconnect their loads while demand response components provide valuable information that is key in sustaining services when the delivery systems are stressed, decreasing the likelihood of outages. Grid operators are capacitated in deterring, detecting, mitigating, responding to, and restoring emergency occurrences. The use of intelligent components in the transmission infrastructure provides control capabilities of detecting attempts to attack the transmission systems and reduce the impact zone. A smart grid can also be fitted with video monitoring of transmission stations that shall prevent vandalism, sabotage, and theft activities [
66].
All biomass should go through various phases to generate biomass energy [
3]. All the phases require resources and infrastructures. The energy ratio produced by the resulting biomass energy combustions to power used in the process is known as the biomass fuel energy balance, or the net power gained. Various site-specific and independent variables determine the greenhouse gas and life cycle energy assessment of biomass energy fuels. When all aspects of biomass energy generation and applications of co-products are tightly integrated, particular agriculture aspects present opportunities for optimizing the energy efficiencies and greenhouse gas biomass fuel neutrality. When compared to gasoline, it is estimated that the current biomass energy production has about 1.6 net energy ratios and minimizes emissions of greenhouse gases by more than forty-five percent [
1]. When all co-products are assumed to be fed to dairy cattle in wet forms within 64km of the distillation plants, the emissions of greenhouse gases decrease by 15%, and net energy ratios increase to 1.9 [
67]. The impacts of substituting natural gases with biogas from the fermentation of corn are remarkable. Life-cycle analyses of biomass energy production are sensitive to inputs of nitrogen and lime [
2]. Minimizing the nitrogen and lime inputs by applying and crediting possible basicity and nutrients into the output of corn-based ethanol further decrease emissions by 10% and increase the net energy ratios to 2.00 [
2]. Biomass energy is renewable fuels generated from corn materials through the biomass process. Over 98% of the biomass energy typically contains E10 (90% gasoline and 10% ethanol) [
67]. This oxygenates the fuel and minimizes pollutions [
3].
Proper biomass energy management to protect its quality is essential to most energy sustainability definitions. While focusing on biomass energy resource sufficiency, in the development of sustainable energy, early definitions concerning the quality of energy define the hazardous energy capacity given the proper practices and plans of energy management. Early scholars explained the entwined energy quality and sustainable human development difficulties in that energy might be utilized to remove pollutions from a site. Yet, energy also delivers such hazards to users of downstream [
67].
Sustainable quality of biomass energy includes the biomass energy and infrastructure sustainability utilized within the systems to make biomass energy quality sustainability a pressing matter for urban areas in SACs. The burdens to ensure high-level human energy quality are put heavily on the utilities of biomass energy. With the latest laws ratified in Asia reducing the energy disparity, the regulations and policy in SACs uphold the even management practices. Utilities of biomass energy should not be responsible for the treatment of excess contaminants caused by the lack of agricultural regulations. Management procedures and policy implementation should be considered in urban, ecosystem, agricultural, and industrial energy as one interlinked power system. Without balanced energy-quality management policies, the players accountable for energy quality degradation will have no incentives to reverse hazardous practices [
68].
The smart grid of electricity and biomass renewable energy production in accommodating greater renewable power percentages would need traditional backup of large energy amounts and storage of ample biomass energy. For natural variation compensation, this would be necessary in the energy quantities generated depending on time of the day, seasons, and other elements, such as biomass amounts, at any given time. The adoption expenses for renewable resource sources are more expensive than they should be, since today’s electricity cannot deal with these variabilities. Renewable biomass energy allows a renewable energy resource for greater penetration accommodations with cost-efficient and effective procedures when improving energy quality and reliability. In recent years, the utilizations of renewable biomass energy resources in the smart grid systems have been increasing. Various significant plans and strategies have been executed in different parts of SACs, both in the developing and developed nations. Certain research studies indicate that these renewable biomass energy technologies can offer relatively low cost and reliable electricity services. The renewable biomass energy offers an alternative, to provide SACs with sustainable and clear energy that does not pollute the environment [
69].
Blockchain in waste management is implemented in order to gain control over waste management. Blockchain technology is being implemented in many areas, like healthcare and entertainment, and has shown the capability on how it is improved and changed. Blockchain in waste management is a new and trending technology, which can be used for an error-free waste management and disposal. When the blockchain technology is implemented, certain areas like product manufacturing and the food industry can cut down the amount of waste produced. To achieve these goals in the best possible way, waste managers and policy makers use the “waste hierarchy”. From top (best option) to bottom (least favorable option) these options are: prevention, minimization, reuse, recycling, energy recovery (incineration), and storage (landfills) [
70].
Energy storage is regarded as the major link in the transformation of the current infrastructure and operation of the electrical grid.
Table 3 shows the comparison between capacity of biomass and biogas energies with the targeted project in several SACs. Academic sources have indicated that the regulatory and policy framework has limited the deployment and up-scaling of energy distributed storage systems into the electrical grid. Currently, regulatory structures are based purely on market systems with no proper pricing signals. This does not contribute to full deployment in the transmission and distribution services. Energy storage has capability in the role of power management, bridging, and stability, thereby acting as a ‘shock absorber’ in the electrical grid. Having energy storage not accorded full asset status recognition, such as generation, signals the economic argument on cost recovery. The key to energy storage is that it can provide revenue and increase economic benefits similar to generation if offered the status of generation, transmission, and distribution services. An example is where energy storage operators can dispatch to the highest-valued use, thus generating a higher return unlike just supplementing energy systems. In this sense, one can agree that a smart grid and net metering network, driven by energy storage, demand side management and interconnection will shape the future outlook of the utility market, creating an Internet of Energy [
71].
Table 3.
Comparison between capacity of biomass and biogas energies with the targeted project in several SACs.
Table 3.
Comparison between capacity of biomass and biogas energies with the targeted project in several SACs.
| Compartments | Capacity of Biogas Energy (MW) | Capacity of Biomass Energy (MW) | Refs |
|---|
| Country | Potential (MW) | Potential | Targeted | Installed |
|---|
| Lao PDR | 51 MW by 2025 | >200 | 58 by 2025 | ≈40 | [6,7,8] |
| Philippines | - | - | - | ≈277 | [24] |
| Myanmar | 4741 | 6899 | - | - | [27] |
| Vietnam | - | 318,630 | 500 by 2020 2000 by 2030 | 270 | [29,31] |
| Cambodia | - | ≈19 GWh/year | 73 by 2030 | 23 | [33,36] |
| Singapore | - | - | - | 220 | [39] |
| Thailand | 46 | 7000 | 3.630 GW by 2021 | 1610 | [46,47] |
| Malaysia | - | 29,000 | - | 211 | [48] |
| Indonesia | 278 | 50,000 | - | 312 | [49] |
The regulatory framework enforces the set price and has incentivized investment growth and increased deployment of energy storage technologies. Policy and regulation enable the value and potential from energy storage by allowing access to ancillary and other markets, thereby acting as a powerful tool to build a storage-based smart grid network [
72].
The economic effect of the proposed technology for the use of biomass energy should be noted. This effect is clearly visible if we compare how much the commonly used technology of using alternative energy sources will cost with the technology proposed by the authors. This is important because the cost of implementing a technology is the basis for its application (
Table 4).
Table 4 shows that despite the relatively high investment, construction time, and production and operating costs, there are a number of economic advantages of using biomass in the energy sector. Compared to other types of alternative energy, biomass cogeneration plants provide an operating life of up to 314 days a year, which is 2 to 5 times longer than for the use of wind and sun. The service life is up to 40 years, which is up to 2 times higher than that of other alternative energy sources.
Thus, the review noted the use of smart grid technology and GIS as a model for sustainable energy. But one should be aware that this is not an alternative to the conversion and use of biomass. Further optimizations of biomass conversion technology are needed, such as combustion, co-combustion, gasification, and pyrolysis to generate electricity [
73,
74].
7. Net Metering Using Biomass Energy
Net metering refers to power policies allowing electricity service clients to offset some or all of their electricity use with a self-produced one. This is achieved by utilizing a single meter to record the bi-directional flow of energy. The wide spread of grid-interactive distributed energy generation is being implemented and supported globally through the promulgation of different types of tariff policies and incentive programs, such as feed-in-tariffs and quota systems. Despite the decreasing cost of renewable energy, especially biomass energy, the transition had been prolonged mainly due to the absence of attractive policies and tax incentives for investors. The most probable sufficient policy incentive is known as net metering systems. Net metering systems accelerated installations of distributed energy generation by allowing the grid-connected consumer generation to offset their electricity consumption through grid feeds and compensate for any excesses. With net metering, customers are paid on surplus generation at a retail price. This encourages the extensive participation of consumers and prosumers. This is simply done through state utilities buying back surplus electricity from customers who are interconnected to the grid by net metering systems. In that sense, net metering is regarded as a favorable policy to help overcome the financial barriers faced by distributed generators. Globally, net metering has been implemented and in operation for the last two decades only because renewable energy resources are reaching grid parity. This is a sign that technologies are entering a competitive stage with conventional generation. The net metering policy promotes various least-cost technologies and brings cost structure down. Net metering is an integral part of policy formulation to adopt large scale renewable energy installations.
8. Commercialization of Biomass Technologies
Biomass can be commercialized for energy use in three main ways:
- -
Direct combustion in boilers (straw, firewood, pellets, wood chips);
- -
Co-combustion with traditional energy sources (fuel oil, coal, gas);
- -
Combustion of biomass processing products during fermentation or esterification (biogas, biodiesel, methanol, ethanol).
Energy resources of biomass can be divided into two groups: solid-phase energy carriers suitable for combustion; pyrolysis and steam-oxygen gasification into a mixture of carbon oxide and dioxide, hydrogen, and methane. This gas can be converted into electricity and heat using appropriate technologies. Biomass components are converted into liquid fuel and biogas, which is a mixture of 60% vol. methane and 40% CO
2 [
26].
Commercial biomass processing technologies:
1. Pyrolysis is the most common method of producing energy from biomass (90% of the world’s commercial energy production from biomass is due to the use of this technology), which is used for both heat and electricity. Combustion boiler plants are suitable for the processing of various types of biomass; mainly wood, wood chips, sawdust, and straw. The process is carried out at temperatures above 600 C and without access to air, the output of which is liquid biofuel. The best raw material for the pyrolysis process is wood, but, since this technology is only at the beginning of its development, it can be assumed that any type of biomass can be converted in the pyrolysis process [
29].
2. Gasification is a thermochemical transformation process, which differs from combustion in that the product of the process is not heat, but gas, which, after combustion, provides the desired heat energy. The gas can also be used in special turbines to generate electricity. The advantage of gasification is the high commercial efficiency of the process, reaching 50% [
75].
3. Cogeneration is the process of generating heat and electricity at the same time. In cogeneration systems, lower emissions of pollutants are achieved [
76].
4. Biochemical processes—some forms of biomass containing large amounts of water are used in the fermentation process, where the decomposition product of the biomass is the alcohol used to make biofuels. Methane fermentation processes are also used, the product of which is biogas (a mixture of methane and carbon dioxide). For commercial energy purposes, the fermentation process uses animal manure, food waste, and household waste in landfills and sewage [
30].
9. Applicability of the Review to the Whole World
Biomass utilization is a global problem. All over the world, millions of tons of waste of various vital activities are present and accumulate, in particular, in sewers, in agricultural areas, in forests. A particular danger is caused by the avalanche-like accumulation of urban waste, which has to be removed to the constantly expanding waste disposal sites. With unreasonable waste management, huge areas are taken out of circulation, which, moreover, turn out to be contaminated for many tens of years. Although this review was based only on the results of South-East Asia, it is easy to trace these trends and extend them to the rest of the world. The efficient use of biomass energy will help not only in an effective global waste management strategy, but will also make it possible to make a tangible contribution to the green energy of the population of planet Earth.
Upcoming challenges include technology optimization for the following uses of biomass energy: direct combustion of woody biomass; pyrolysis and gasification of biomass; anaerobic digestion of organic waste to produce biogas; landfill gas production direct incineration of organic waste. The barriers in this technology are emissions of carbon and nitrogen oxides, unpleasant odors, as well as the uncontrolled harvesting of biomass, which can harm nature.
10. Conclusions
The presented review attempted to investigate the possibility of using biomass energy on a global scale using the example of the countries of South-East Asia. Because of a comprehensive analysis of modern literature, the following main conclusions were made:
1. Utilization of biomass over the past two decades has made a huge leap forward. In particular, in Thailand, since 2000, the amount of energy produced from these sources has increased several dozen times, and in Laos, Vietnam, the Philippines, Myanmar and other countries, the use of biomass energy has started from scratch.
2. The review highlighted biomass sources, governance, and bioenergy potential in SACs to ensure that biomass sources and their energy use are applicable to non-governmental organizations, policymakers, and scientists who view biomass energy as a critical part of the renewable energy sector of the future in South-East Asia.
3. It is estimated that in the countries of South-East Asia, the total volume of waste from the forestry and agricultural sectors per year is approximately more than 0.5 billion tons. In addition, the energy potential of the total biomass in these countries exceeds 8 billion gigajoules.
4. The use of biomass is promising for use in smart energy systems, which will contribute to maximum energy savings.
5. Regulatory adjustments are needed to ensure price compliance and stimulate investment growth and wider adoption of energy storage technologies. Policy and regulation leverage the value and potential of energy storage by opening access to ancillary and other markets, thereby acting as a powerful tool for building a grid of storage-based smart grids.
6. Net metering refers to an electricity policy that allows customers providing electricity services to offset part or all of their electricity consumption from their own electricity. This is achieved by using a single meter to record bi-directional energy flow.
7. The use of biomass is a global problem. Although this review was based only on findings from South-East Asia, these trends are easy to trace and replicate to the rest of the world. The efficient use of biomass energy will not only help in an effective global waste management strategy, but will also make a tangible contribution to the green energy of the people of planet Earth.
8. Upcoming challenges include technology optimization for the following uses of biomass energy: direct combustion of woody biomass; pyrolysis and gasification of biomass; anaerobic digestion of organic waste to produce biogas; landfill gas production direct incineration of organic waste. The barriers in this technology are emissions of carbon and nitrogen oxides, unpleasant odors, as well as the uncontrolled harvesting of biomass, which can harm nature.
Author Contributions
Conceptualization, N.M., R.F. and M.A.; Data curation, M.A., R.F., M.S.A.-A. and K.P. (Karol Pralat); Formal analysis, D.N., N.M., R.F. and M.A.; Funding acquisition, M.A., R.F., M.S.A.-A. and K.P. (Kirill Petropavlovskii); Investigation, M.S.A.-A. and T.N.; Methodology, M.S., M.S.A.-A. and V.P.; Project administration, M.A.; Resources, M.A., R.F., M.S.A.-A. and D.N.; Supervision, R.F.; Validation, D.N., M.A., R.F. and N.M.; Visualization, N.M.; Writing—original draft, N.M., R.F., K.P. (Kirill Petropavlovskii), T.N., V.P., M.S. and M.A.; Writing—review & editing, D.N., M.A., R.F., N.M. and K.P. (Karol Pralat). All authors have read and agreed to the published version of the manuscript.
Funding
The research was supported by Russian Science Foundation (project No. 21-79-30004).
Institutional Review Board Statement
Not applicable.
Informed Consent Statement
Not applicable.
Data Availability Statement
Not applicable.
Conflicts of Interest
The authors declare no conflict of interest.
References
- Bhatt, G.; Affljulla, S. Analysis of large-scale PV penetration impact on the IEEE 39-Bus power system. In Power and Electrical Engineering of Riga Technical University (RTUCON), Proceedings of the 2017 IEEE 58th International Scientific Conference, Riga, Latvia, 12–13 October 2017; IEEE: Riga, Latvia, 2017; pp. 1–6. [Google Scholar]
- Fischer, G.; Schrattenholzer, L. Global bioenergy potentials through 2050. Biomass Bioenergy 2001, 20, 151–159. [Google Scholar] [CrossRef] [Green Version]
- Tun, M.M.; Juchelkova, D.; Win, M.M.; Thu, A.M.; Puchor, T. Biomass Energy: An Overview of Biomass Sources, Energy Potential, and Management in Southeast Asian Countries. Resources 2019, 8, 81. [Google Scholar] [CrossRef] [Green Version]
- Flum, D.; Abele, E.; Reidel, O. Model-based Planning of Energy Flexible Technical Building Services in Production Plants to Integrate Variable Renewable Energies. Procedia CIRP 2018, 69, 354–359. [Google Scholar] [CrossRef]
- Kimuras, S. Energy Efficiency and Conservation in Southeast Asia. In Proceedings of the IEA/ERIA/EMA Joint Workshop, Singapore, 15 July 2020. [Google Scholar]
- International Energy Agency. Southeast Asia Energy Outlook; IEA: Bangkok, Thailand, 2019. [Google Scholar]
- Asian Development Bank. The Economics of Climate Change in Southeast Asia: A Regional Review; ADB: Manila, Philippines, 2009. [Google Scholar]
- Fediuk, R.S.; Ibragimov, R.A.; Lesovik, V.S.; Pak, A.A.; Krylov, V.V.; Poleschuk, M.M.; Stoyushko, N.Y.; Gladkova, N.A. Processing equipment for grinding of building powders. In IOP Conference Series: Materials Science and Engineering; IOP Publishing: Bristol, UK, 2018; Volume 327. [Google Scholar]
- Lee, S.; Qian, X.; Garcia, S. An analysis of integrated ventilation systems with desiccant wheels for energy conservation and IAQ improvement in commercial buildings. Int. J. Bio-Urban. 2013, 1–2, 105–124. [Google Scholar]
- Lesovik, V.; Voronov, V.; Glagolev, E.; Fediuk, R.; Alaskhanov, A.; Amran, Y.H.M.; Murali, G.; Baranov, A. Improving the behaviors of foam concrete through the use of composite binder. J. Build. Eng. 2020. [Google Scholar] [CrossRef]
- Sovacool, B.K. A Comparative Analysis of Renewable Electricity Support Mechanisms for Southeast Asia. Energy 2010, 35, 1779–1793. [Google Scholar] [CrossRef]
- Carlos, R.M.; Khang, D.B. Characterization of Biomass Energy Projects in Southeast Asia. Biomass Bioenergy 2008, 32, 525–532. [Google Scholar] [CrossRef]
- Zafar, S. Biomass Energy in Indonesia. Available online: https://www.bioenergyconsult.com/biomass-energy-resources-in-indonesia/ (accessed on 5 July 2021).
- Bakhtyar, B.; Sopian, K.; Sulaiman, M.Y.; Ahmad, S.A. Renewable Energy in Five South East Asian Countries: Review on Electricity Consumption and Economic Growth. Renew. Sustain. Energy Rev. 2013, 26, 506–514. [Google Scholar] [CrossRef]
- Renewable Energy Outlook for ASEAN: A REmap Analysis; International Renewable Energy Agency (IRENA), Abu Dhabi and ASEAN Centre for Energy (ACE): Jakarta, Indonesia, 2016.
- The World Bank. CO2 Emissions per Capita in ASEAN. Available online: https://data.worldbank.org/indicator/EN.ATM.CO2E.PC (accessed on 15 June 2021).
- Purchasing Power Parity Per Capita. Available online: https://tradingeconomics.com/indonesia/gdp-per-capita-ppp (accessed on 10 June 2021).
- The World Bank. Electricity Consumption per Capita. Available online: https://data.worldbank.org/indicator/EG.USE.ELEC.KH.PC?locations=IE&year_low_desc=false (accessed on 10 June 2021).
- Energy Consumption in Laos. Available online: https://www.worlddata.info/asia/laos/energy-consumption.php (accessed on 15 June 2021).
- Klimowicz, G. Southeast Asia Set for Biomass Boom. Available online: https://www.eco-business.com/news/southeast-asia-set-biomass-boom/ (accessed on 15 June 2021).
- Bakar, M.H.; Ahmad, N.; Islam, M.N.; Ani, F.N. Characterization of Biomass Solid Wastes of Brunei Darussalam for Their Pyrolytic Conversion into Liquid Oil. In Proceedings of the 5th Brunei International Conference on Engineering and Technology (BICET 2014), Bandar Seri Begawan, Brunei, 1–3 November 2014. [Google Scholar]
- Hoornweg, D.; Bhada-Tata, P. Urban Development Series Knowledge Papers. In The World Bank Group; WBG: Washington, DC, USA, 2012; pp. 1–98. [Google Scholar]
- Laemsak, N.; Haruthaithanasan, M. Potential of Biomass Utilization in ACMECS (Laos, Myanmar, Cambodia, Vietnam and Thailand). Kasetsart University, Thailand. Available online: https://www.oeaw.ac.at/forebiom/WS2lectures/02-02-NLAEMSAK.pdf (accessed on 16 June 2021).
- GEMCO. Biomass Fuel in Vietnam. 2019. Available online: http://www.gemcopelletmills.com/biomass-energy-in-vietnam.html (accessed on 10 March 2019).
- Tun, M.M. An Overview of Renewable Energy Sources and Their Energy Potential for Sustainable Development in Myanmar. Eur. J. Sustain. Dev. Res. 2019, 1, em0071. [Google Scholar] [CrossRef] [Green Version]
- Liu, L.; Wang, J.; Wang, F.; Yang, X. The impact of the planting of forest biomass energy plants under the embedded Internet of Things technology on the biodiversity of the local environmental ecology. Environ. Technol. Innov. 2021, 24, 101894. [Google Scholar] [CrossRef]
- Akgun, O.; Korkeakoski, M.; Mustonen, S.; Luukkanen, J. Theoretical Bioenergy Potential in Cambodia and Laos. In Proceedings of the World Renewable Energy Congress, Linköping, Sweden, 8–13 May 2011. [Google Scholar]
- ISO. Environmental Management—Life Cycle Assessement—Requirements and Guidelines; ISO 14044:2006; ISO: Geneva, Switzerland, 2006. [Google Scholar] [CrossRef]
- Bui, Q.; Wang, Z.; Zhang, B.; Le, H.P.; Vu, K.D. Revisiting the biomass energy-economic growth linkage of BRICS countries: A panel quantile regression with fixed effects approach. J. Clean. Prod. 2021, 316, 128382. [Google Scholar] [CrossRef]
- Destek, M.A.; Sarkodie, S.A.; Asamoah, E.F. Does biomass energy drive environmental sustainability? An SDG perspective for top five biomass consuming countries. Biomass Bioenergy 2021, 149, 106076. [Google Scholar] [CrossRef]
- Viet, Z.S. Biomass Energy in Vietnam. 2019. Available online: https://www.bioenergyconsult.com/biomass-energy-vietnam/ (accessed on 10 March 2019).
- Zafar, M.W.; Sinha, A.; Ahmed, Z.; Qin, Q.; Zaidi, S.A.H. Effects of biomass energy consumption on environmental quality: The role of education and technology in Asia-Pacific Economic Cooperation countries. Renew. Sustain. Energy Rev. 2021, 142, 110868. [Google Scholar] [CrossRef]
- Drożdż, W.; Bilan, Y.; Rabe, M.; Streimikiene, D.; Pilecki, B. Optimizing biomass energy production at the municipal level to move to low-carbon energy. Sustain. Cities Soc. 2021, 76, 103417. [Google Scholar] [CrossRef]
- Department of Alternative Energy Development and Efficiency, Ministry of Energy. Biomass Database Potential in Thailand; Executive Summary Report; Developing of Biomass Database Potential in Thailand; 2012; pp. 1–45. Available online: http://weben.dede.go (accessed on 4 October 2021).
- Magazzino, C.; Mele, M.; Schneider, N.; Shahbaz, M. Can biomass energy curtail environmental pollution? A quantum model approach to Germany. J. Environ. Manag. 2021, 287, 112293. [Google Scholar] [CrossRef] [PubMed]
- Prastowo, B. Biomass Resource in Indonesia: Indonesia’s Solid Biomass Energy Potential. In Proceedings of the Indonesia-German Workshop and Seminar; Institute Technology of Bandung: Kota Bandung, Indonesia, 2021; pp. 1–15. [Google Scholar]
- Wang, C.; Zhang, L.; Chang, Y.; Pang, M. Energy return on investment (EROI) of biomass conversion systems in China: Meta-analysis focused on system boundary unification. Renew. Sustain. Energy Rev. 2021, 137, 110652. [Google Scholar] [CrossRef]
- Energy Market Authority. 2017—Singapore Energy Statistics. 2017. Available online: http://www.ema.gov.sg/Singapore_Energy_Statistics.aspx (accessed on 5 March 2019).
- Asian Development Bank. Renewable Energy Developments and Potential in the Greater Mekong Subregion; Asian Development Bank: Mandaluyong City, Philippines, 2015. [Google Scholar]
- Shead, B. Biomass Industry in the Philippines. ASEAN BRIEFING. 2017. Available online: https://www.aseanbriefing.com/news/2017/05/19/biomass-industry-philippines.html (accessed on 15 March 2019).
- Sheng, C.; Azevedo, J.L.T. Estimating the higher heating value of biomass fuels from basic analysis data. Biomass Bioenergy 2005, 28, 499–507. [Google Scholar] [CrossRef]
- Murali, G.; Fediuk, R. A Taguchi approach for study on impact response of ultra-high-performance polypropylene fibrous cementitious composite. J. Build. Eng. 2020. [Google Scholar] [CrossRef]
- Qian, X.; Lee, S.; Soto, A.M.; Chen, G. Regression model to predict the higher heating value of poultry waste from proximate analysis. Resources 2018, 7, 39. [Google Scholar] [CrossRef] [Green Version]
- Svintsov, A.P.; Shchesnyak, E.L.; Galishnikova, V.V.; Fediuk, R.S.; Stashevskaya, N.A. Effect of nano-modified additives on properties of concrete mixtures during winter season. Constr. Build. Mater. 2020, 237, 117527. [Google Scholar] [CrossRef]
- Semenov, P.; Uzunian, A.; Davidenko, A.; Derevschikov, A.A.; Goncharenko, Y.M.; Kachanov, V.A.; Khodyrev, V.Y.; Meschanin, A.P.; Minaev, N.G.; Mochalov, V.V.; et al. First study of radiation hardness of lead tungstate crystals at low temperatures. Nucl. Instrum. Methods Phys. Res. Sect. A Accel. Spectrometers Detect. Assoc. Equip. 2007, 582, 575–580. [Google Scholar] [CrossRef] [Green Version]
- Fediuk, R.S. Mechanical Activation of Construction Binder Materials by Various Mills. Proc. IOP Conf. Ser. Mater. Sci. Eng. 2016, 125, 012019. [Google Scholar]
- Elistratkin, M.Y.; Lesovik, V.S.; Zagorodnjuk, L.H.; Pospelova, E.A.; Shatalova, S.V. New point of view on materials development. Proc. IOP Conf. Ser. Mater. Sci. Eng. 2018, 327, 032020. [Google Scholar]
- Volodchenko, A.A.; Lesovik, V.S.; Cherepanova, I.A.; Volodchenko, A.N.; Zagorodnjuk, L.H.; Elistratkin, M.Y. Peculiarities of non-autoclaved lime wall materials production using clays. Proc. IOP Conf. Ser. Mater. Sci. Eng. 2018, 327, 022021. [Google Scholar]
- Volodchenko, A.A.; Lesovik, V.S. Effective Composites Employing Fast-Hardening Gypsum Cement Binders for Additive Manufacturing. In Proceedings of the International Conference “Actual Issues of Mechanical Engineering” (AIME), Tomsk, Russia, 27–29 July 2017. [Google Scholar]
- Lesovik, V.S.; Zagorodnyuk, L.K.; Babaev, Z.K.; Dzhumaniyazov, Z.B. Analysis of the Causes of Brickwork Efflorescence in the Aral Sea Region. Glas. Ceram. (English Transl. Steklo I Keramika) 2020, 77, 277–279. [Google Scholar] [CrossRef]
- Pode, R. Potential applications of rice husk ash waste from rice husk biomass power plant. Renew. Sustain. Energy Rev. 2016, 53, 1468–1485. [Google Scholar] [CrossRef]
- Roman, K.; Barwicki, J.; Hryniewicz, M.; Szadkowska, D.; Szadkowski, J. Production of Electricity and Heat from Biomass Wastes Using a Converted Aircraft Turbine AI-20. Processes 2021, 9, 364. [Google Scholar] [CrossRef]
- Ong, H.C.; Mahlia, T.M.I.; Masjuki, H.H. A review on energy scenario and sustainable energy in Malaysia. Renew. Sustain. Energy Rev. 2011, 15, 639–647. [Google Scholar] [CrossRef]
- Titus, B.D.; Brown, K.; Helmisaari, H.S.; Vanguelova, E.; Stupak, I.; Evans, A.; Reece, P. Sustainable forest biomass: A review of current residue harvesting guidelines. Energy. Sustain. Soc. 2021, 11, 1–32. [Google Scholar]
- Bessaad, A.; Bilger, I.; Korboulewsky, N. Assessing Biomass Removal and Woody Debris in Whole-Tree Harvesting System: Are the Recommended Levels of Residues Ensured? Forests 2021, 12, 807. [Google Scholar] [CrossRef]
- Schiavoni, S.; D’Alessandro, F.; Bianchi, F.; Asdrubali, F. Insulation materials for the building sector: A review and comparative analysis. Renew. Sustain. Energy Rev. 2016, 62, 988–1011. [Google Scholar] [CrossRef]
- The World Bank. Access to Electricity (% of Population). Available online: https://data.worldbank.org/indicator/eg.elc.accs.zs (accessed on 15 March 2019).
- Zagubień, A.; Wolniewicz, K. The impact of supporting tower on wind turbine noise emission. Appl. Acoust. 2019. [Google Scholar] [CrossRef]
- Photocatalysts—Applications and Attributes; PAA: Bangkok, Thailand, 2019.
- Rothbaum, H.P.; Rohde, A.G. Kinetics of silica polymerization and deposition from dilute solutions between 5 and 180 °C. J. Colloid Interface Sci. 1979. [Google Scholar] [CrossRef]
- Sukiran, M.A.; Abnisa, F.; Wan Daud, W.M.A.; Abu Bakar, N.; Loh, S.K. A review of torrefaction of oil palm solid wastes for biofuel production. Energy Convers. Manag. 2017, 149, 101–120. [Google Scholar] [CrossRef]
- Borovkov, V.M.; Zysin, L.V.; Sergeev, V.V. The totals and technological problems of usage of vegetative biomass and organic waste in power engineering. Izv. Akad. Nauk. Energ. 2002, 6, 13–24. [Google Scholar]
- Novais, R.M.; Ascensão, G.; Tobaldi, D.M.; Seabra, M.P.; Labrincha, J.A. Biomass fly ash geopolymer monoliths for effective methylene blue removal from wastewaters. J. Clean. Prod. 2018. [Google Scholar] [CrossRef]
- Saari, J.; Sermyagina, E.; Kaikko, J.; Vakkilainen, E.; Sergeev, V. Integration of hydrothermal carbonization and a CHP plant: Part 2–Operational and economic analysis. Energy 2016, 113, 574–585. [Google Scholar] [CrossRef]
- Burkeev, D.O.; Romanova, A.I.; Murafa, A.A.; Maksimchuk, O.V.; Voronin, A.V. Improving the efficiency and mobility of urban housing maintenance services. Proc. IOP Conf. Ser. Mater. Sci. Eng. 2020, 786, 012028. [Google Scholar]
- Koppejan, J.; Van Loo, S. The Handbook of Biomass Combustion and Co-Firing; Earthscan: Sterling, VA, USA, 2008. [Google Scholar]
- Poudenx, P. The effect of transportation policies on energy consumption and greenhouse gas emission from urban passenger transportation. Transp. Res. Part A Policy Pract. 2008, 42, 901–909. [Google Scholar] [CrossRef]
- NL Agency; Ministry of Foreign Affairs. Biomass Opportunities in Vietnam. 2013. Available online: https://english.rvo.nl/sites/default/files/2013/12/Factsheet%20Biomass%20opportunities%20in%20Vietnam.pdf (accessed on 1 March 2019).
- Guo, M.Z.; Maury-Ramirez, A.; Poon, C.S. Self-cleaning ability of titanium dioxide clear paint coated architectural mortar and its potential in field application. J. Clean. Prod. 2016. [Google Scholar] [CrossRef]
- Dulal, H.B.; Shah, K.U.; Sapkota, C.; Uma, G.; Kandel, B.R. Renewable Energy Diffusion in Asia: Can it Happen without Government Support? Energy Policy 2013, 59, 301–311. [Google Scholar] [CrossRef]
- Nicolas, M.F.; Vlasova, M.; Aguilar, P.A.M.; Kakazey, M.; Cano, M.M.C.; Matus, R.A.; Puig, T.P. Development of an energy-saving technology for sintering of bricks from high-siliceous clay by the plastic molding method. Constr. Build. Mater. 2020. [Google Scholar] [CrossRef]
- Asia Biomass Office. One of the World’s Largest Power Plants Using Biomass Now under Construction in Singapore. Available online: https://www.asiabiomass.jp/english/topics/1111_03.html (accessed on 1 March 2019).
- Adams, P.; Bridgwater, T.; Lea-Langton, A.; Ross, A.; Watson, I. Biomass conversion technologies. In Greenhouse Gas Balances of Bioenergy Systems; Academic Press: Cambridge, MA, USA, 2018; pp. 107–139. [Google Scholar]
- Qian, X. Statistical Analysis and Evaluation of the Advanced Biomass and Natural Gas Co-Combustion Performance. Morgan State University: Baltimore, MD, USA, 2019. [Google Scholar]
- Konuk, F.; Zeren, F.; Akpınar, S.; Yıldız, Ş. Biomass energy consumption and economic growth: Further evidence from NEXT-11 countries. Energy Rep. 2021, 7, 4825–4832. [Google Scholar] [CrossRef]
- Hajinajaf, N.; Mehrabadi, A.; Tavakoli, O. Practical strategies to improve harvestable biomass energy yield in microalgal culture: A review. Biomass Bioenergy 2021, 145, 105941. [Google Scholar] [CrossRef]
| Publisher’s Note: MDPI stays neutral with regard to jurisdictional claims in published maps and institutional affiliations. |
© 2021 by the authors. Licensee MDPI, Basel, Switzerland. This article is an open access article distributed under the terms and conditions of the Creative Commons Attribution (CC BY) license (https://creativecommons.org/licenses/by/4.0/).

 ,
, 


