
Mechanical Properties and Microstructure of TIG and ATIG Welded 316L Austenitic Stainless Steel with Multi-Components Flux Optimization Using Mixing Design Method and Particle Swarm Optimization (PSO)

 ,
,  and
and 
Abstract
:1. Introduction
2. Materials and Methods
2.1. Material
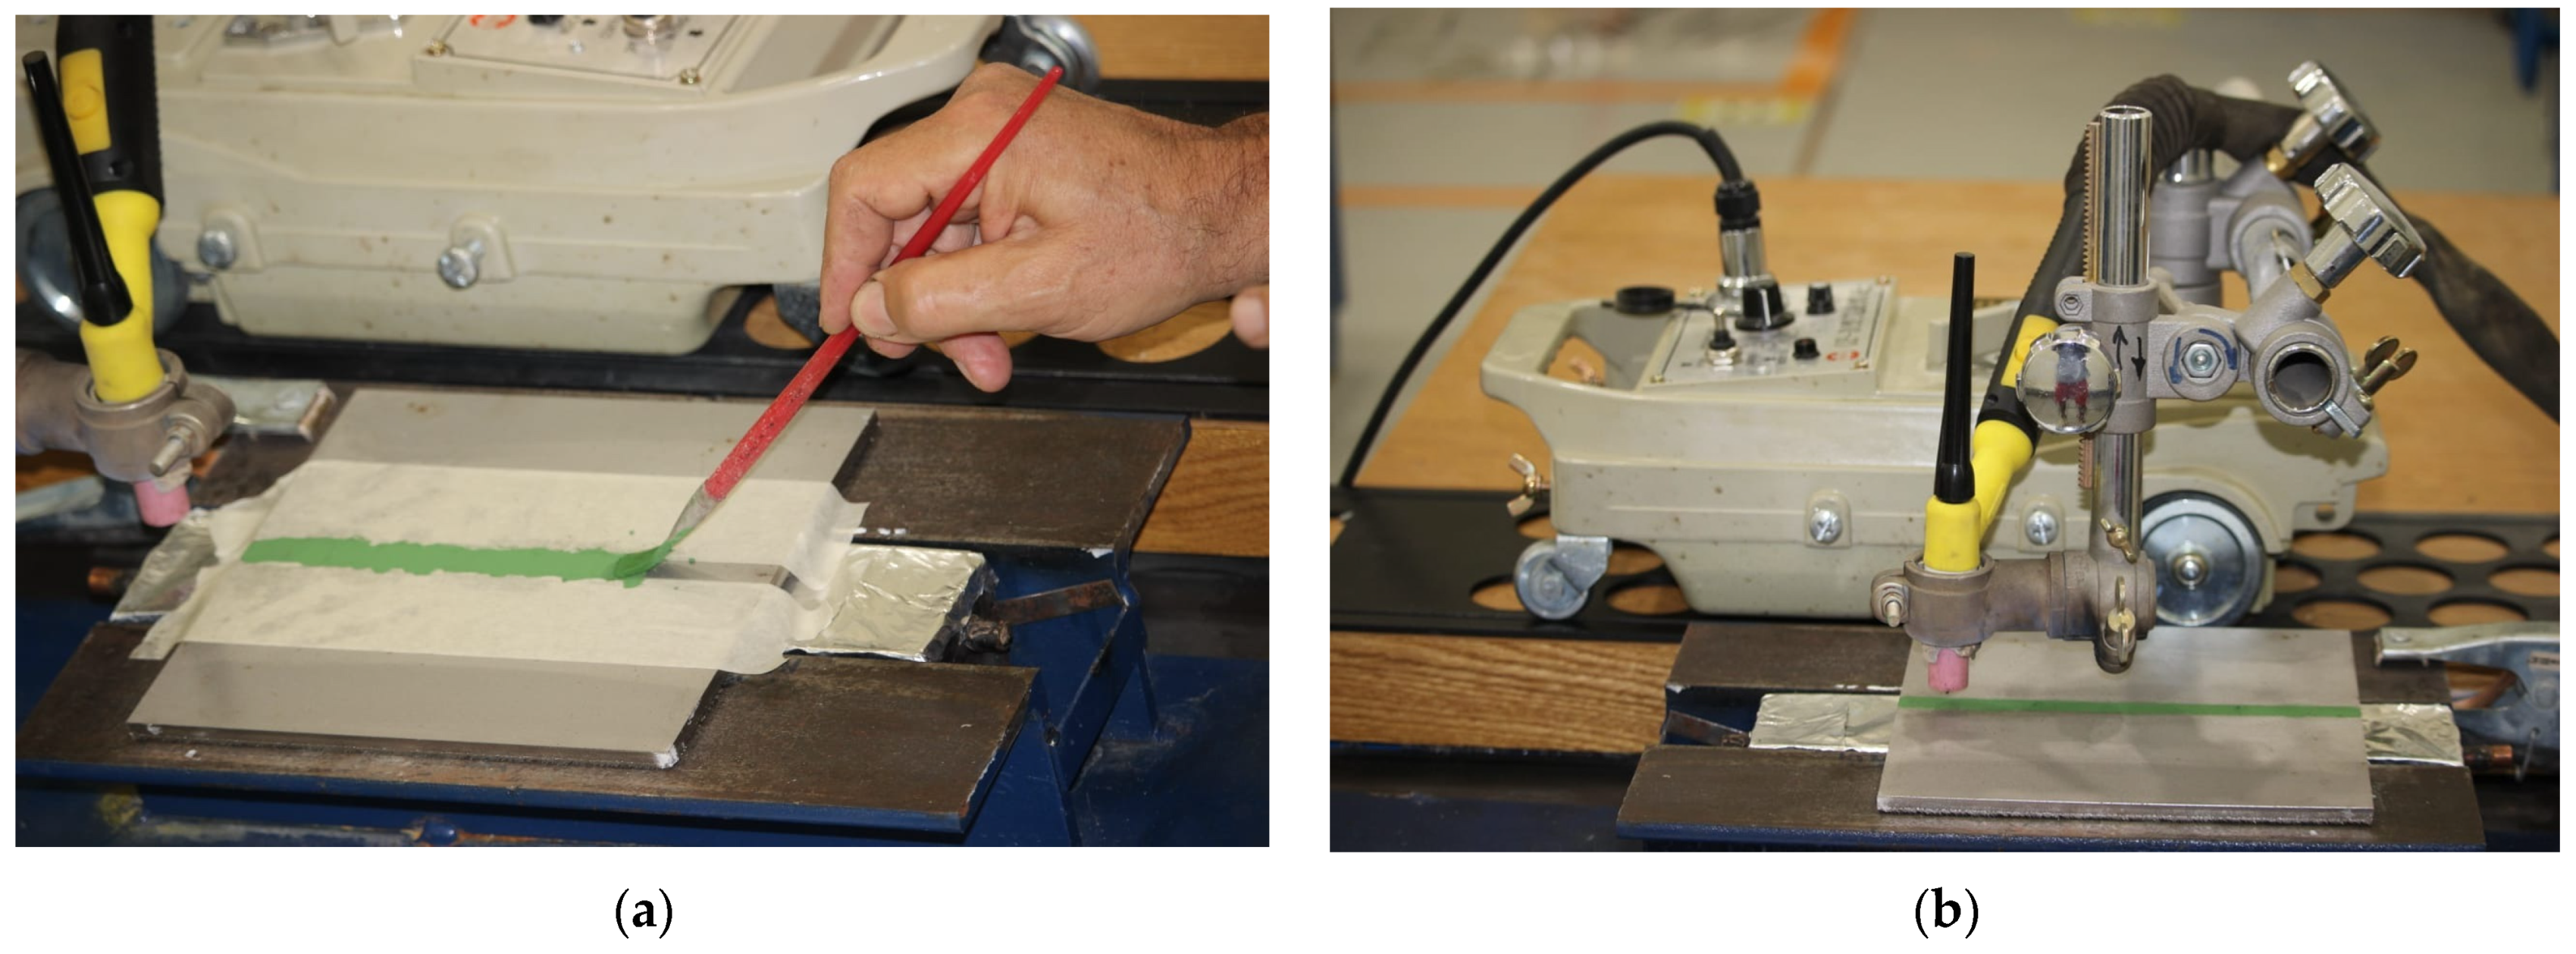
2.2. TIG-ATIG Welding Platform
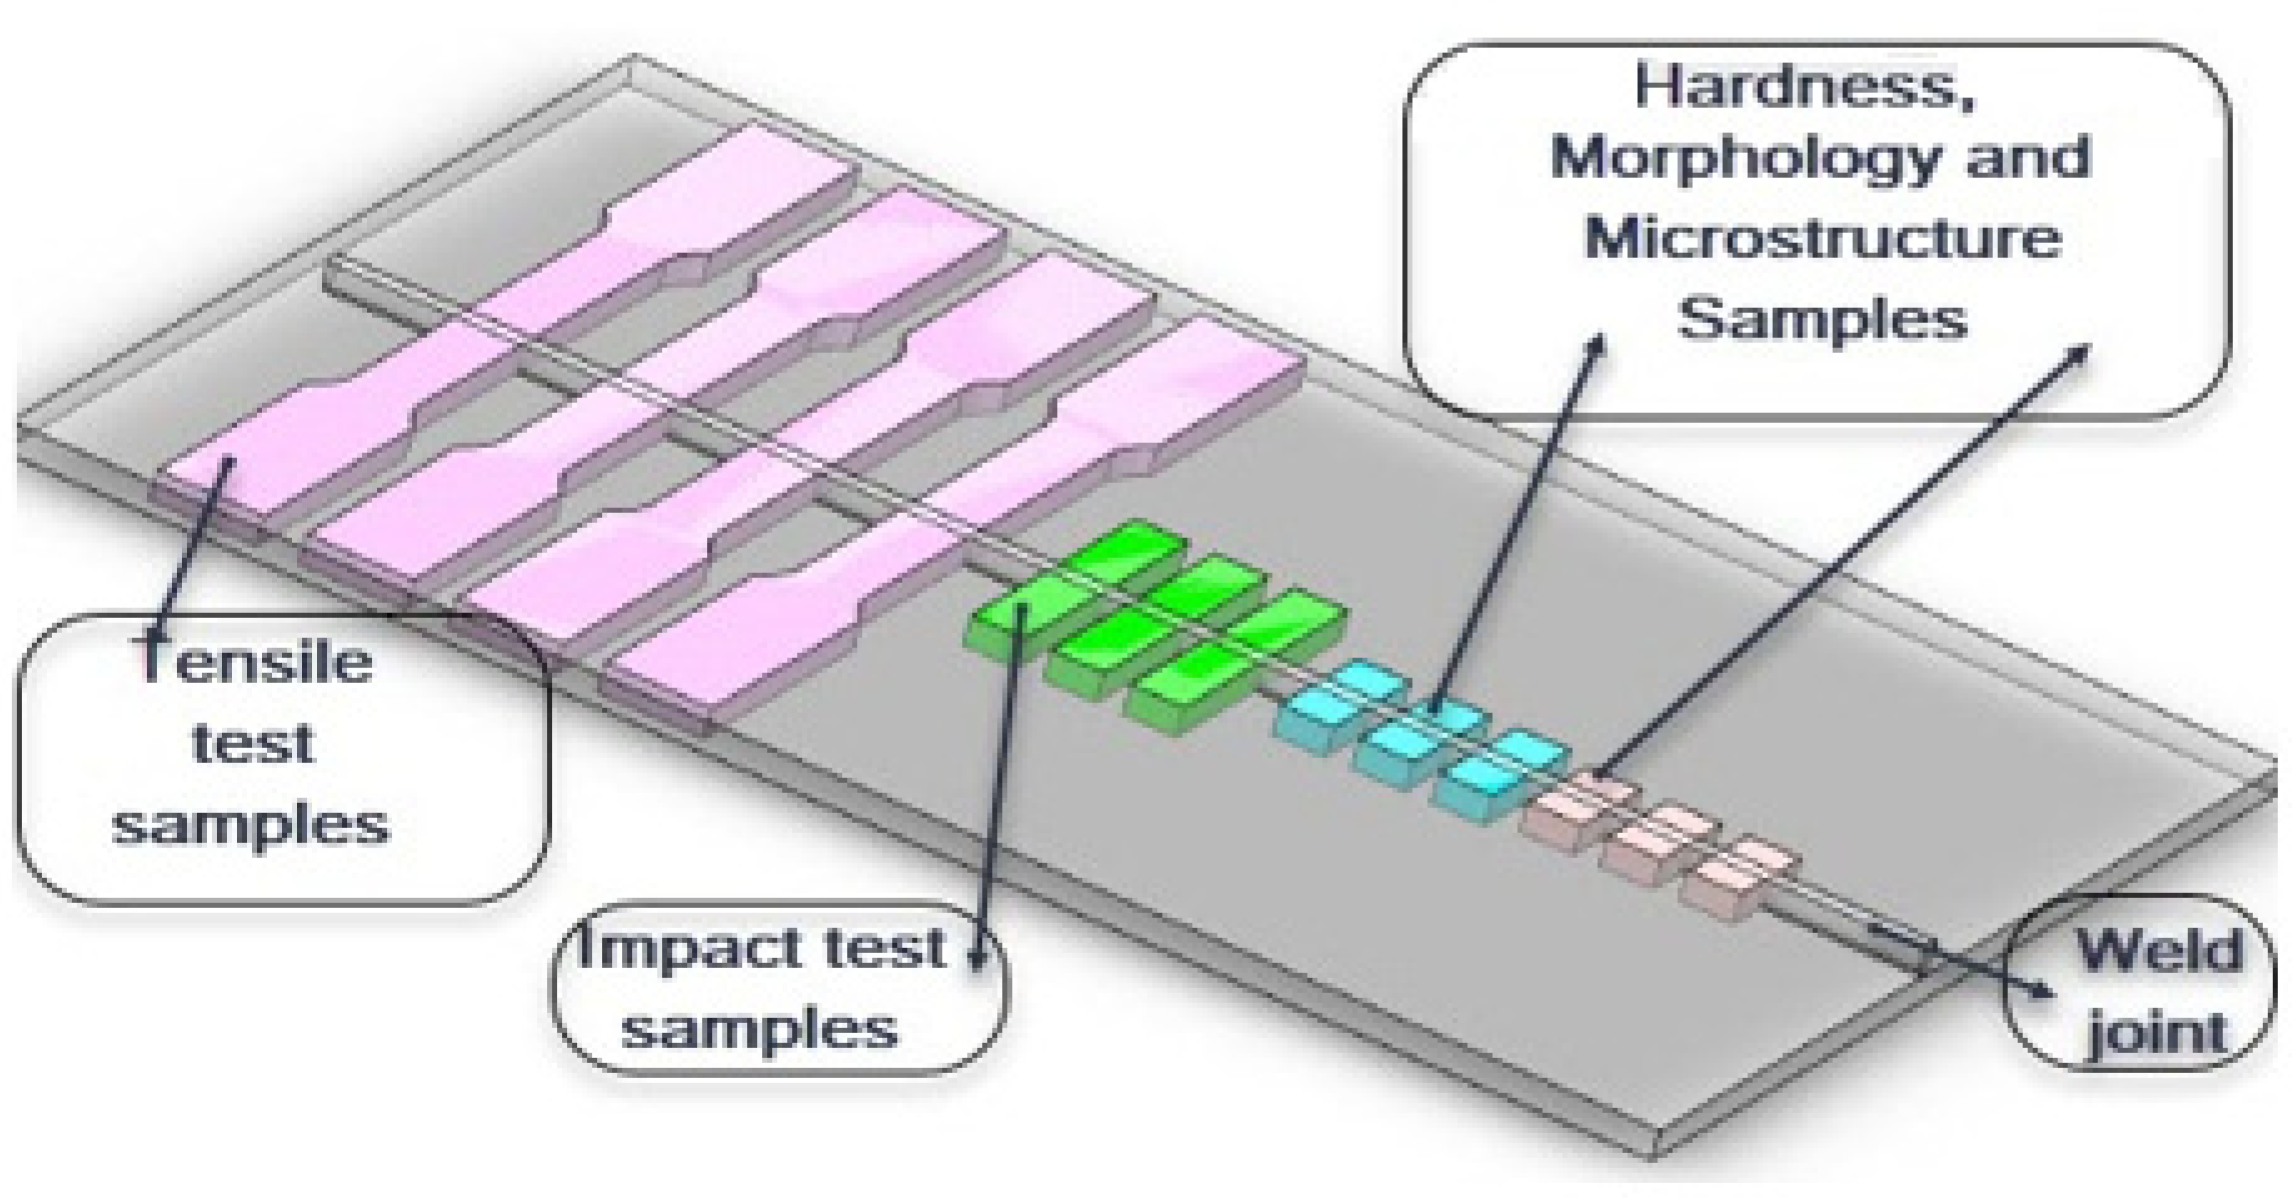
2.3. Tensile Test
2.4. Weld Bead Aspect
2.5. Microstructure Assessment
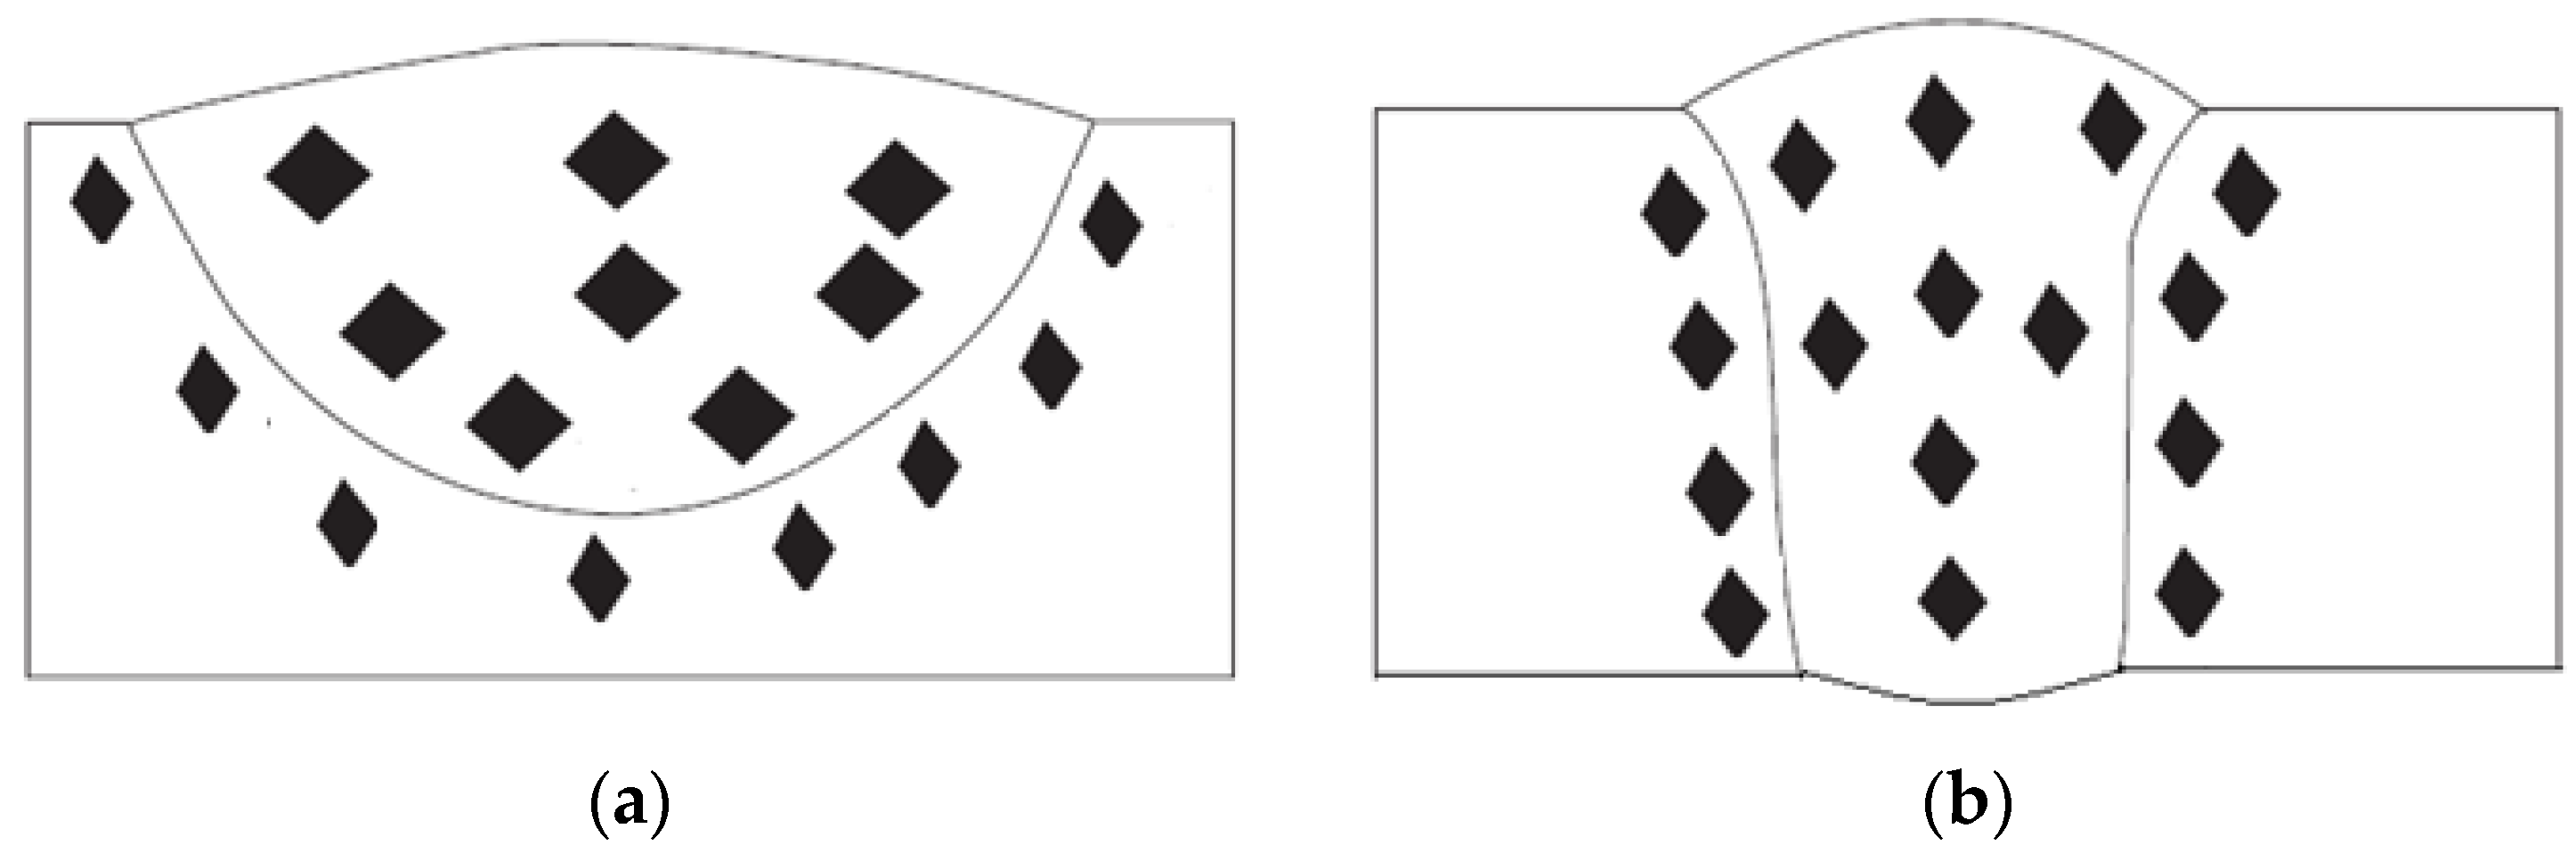
2.6. Hardness Test
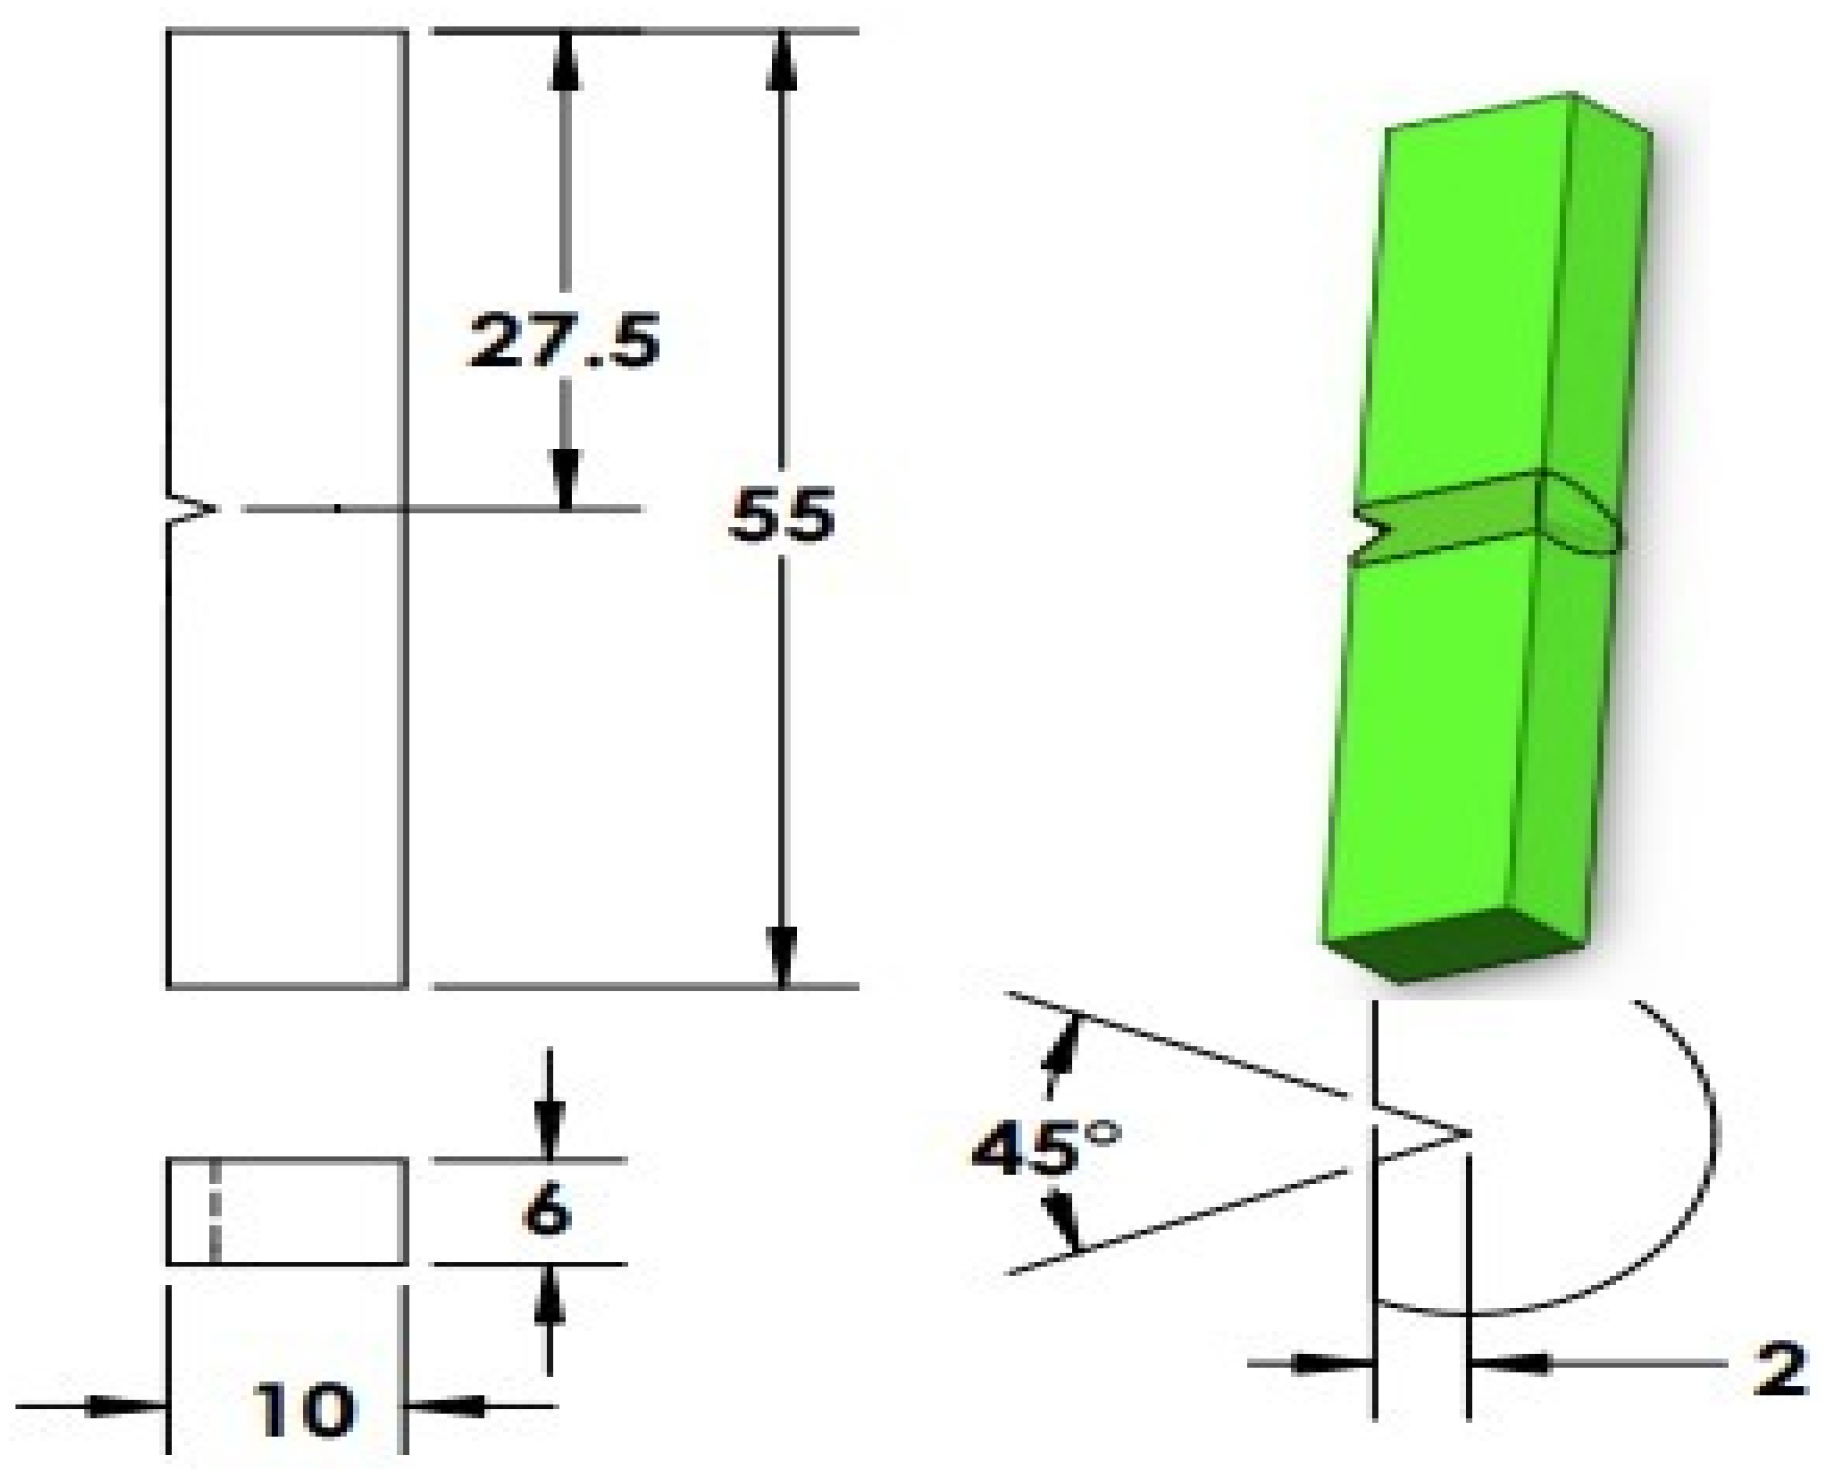
2.7. Impact Test
2.8. Design of Experiment Methodology
2.9. Mathematical Modelling
3. Results and Discussion
3.1. Tensile Test
3.1.1. Selection of Candidate Oxides
3.1.2. Mixture Design Combinations and UTS Response Values
3.1.3. Mathematical Model
3.1.4. Optimization Process Details
- Coefficient of determination (R2 (%))
- Root Mean Square Error (RMSE (MPa))With N2 = 19 (number of measurements)
3.1.5. Experimental Validation
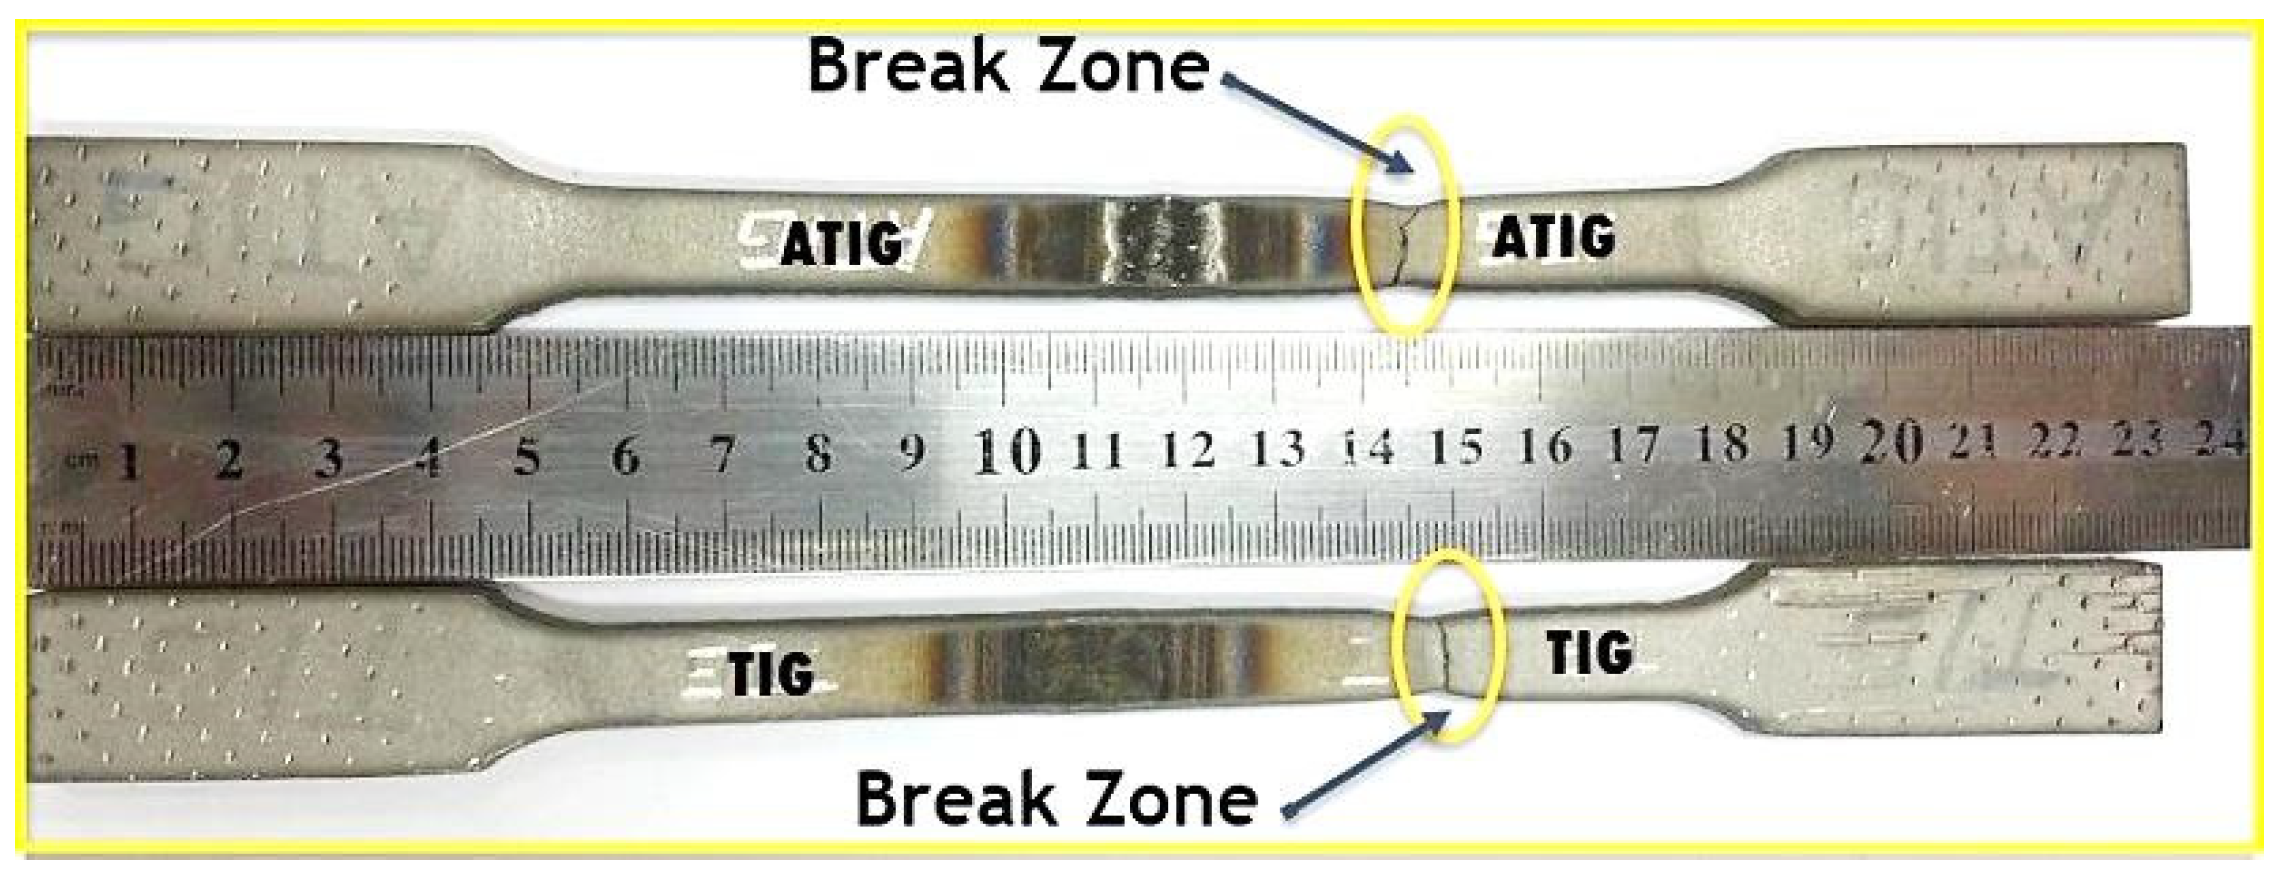
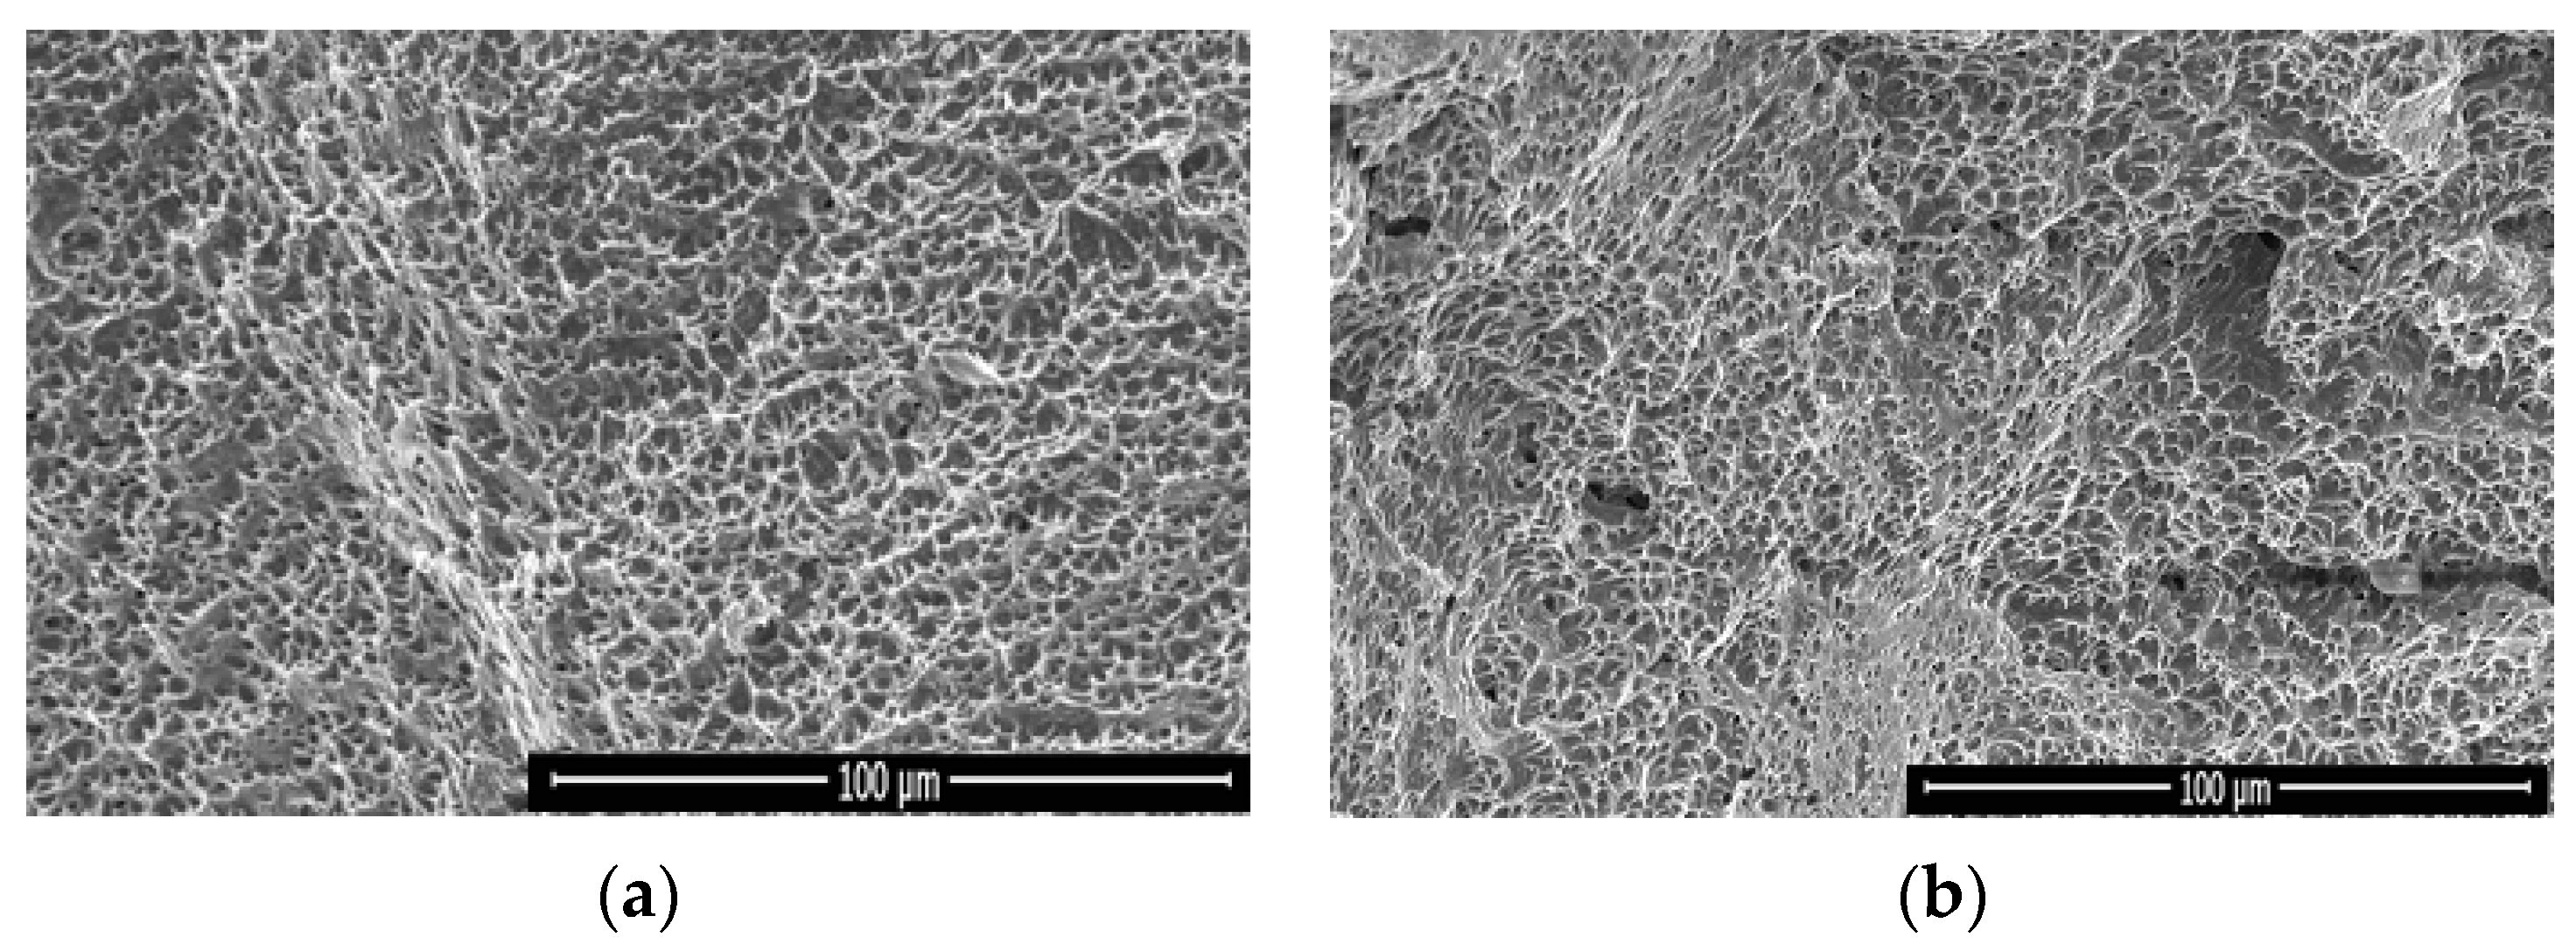
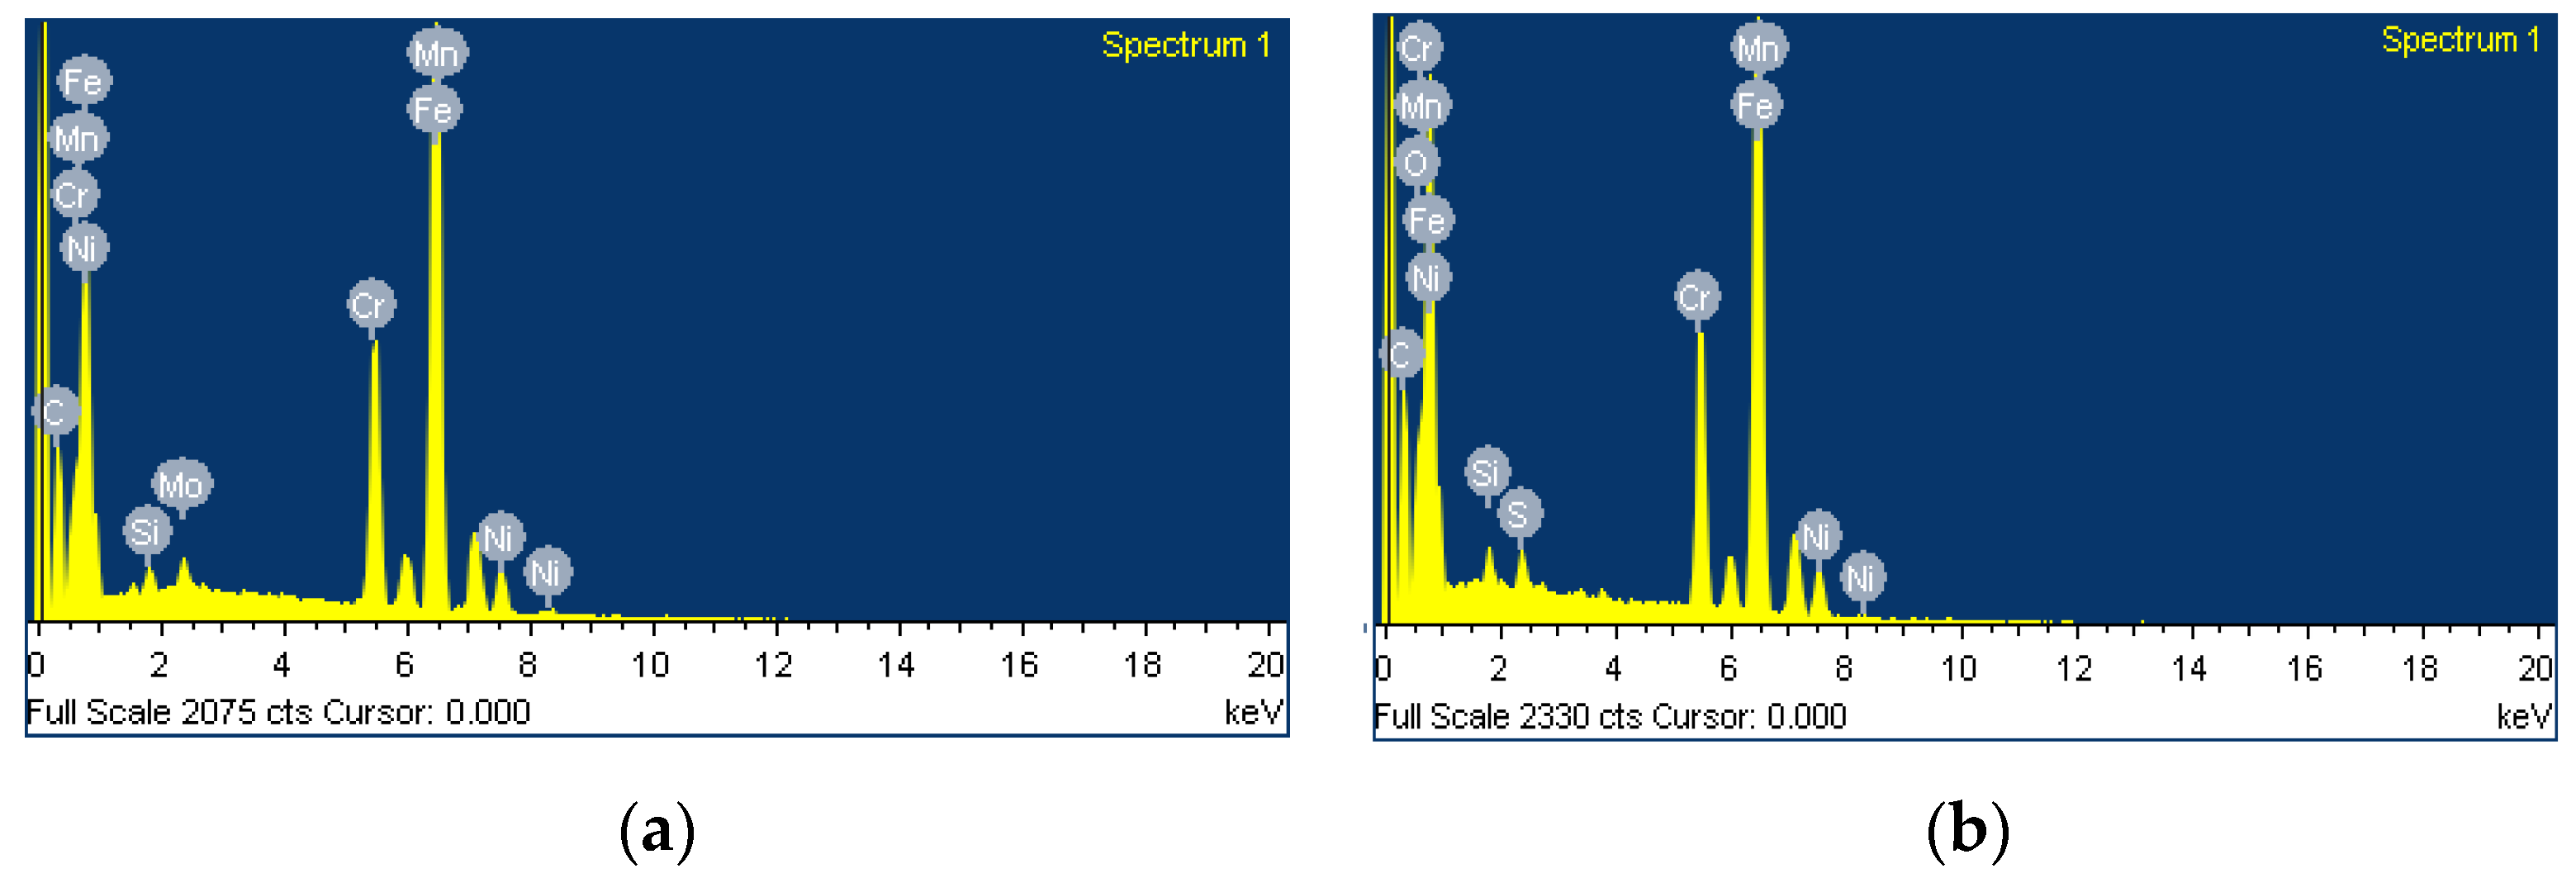
3.1.6. Tensile Break Zone Investigation
3.2. Weld Bead Morphology
- -
- -
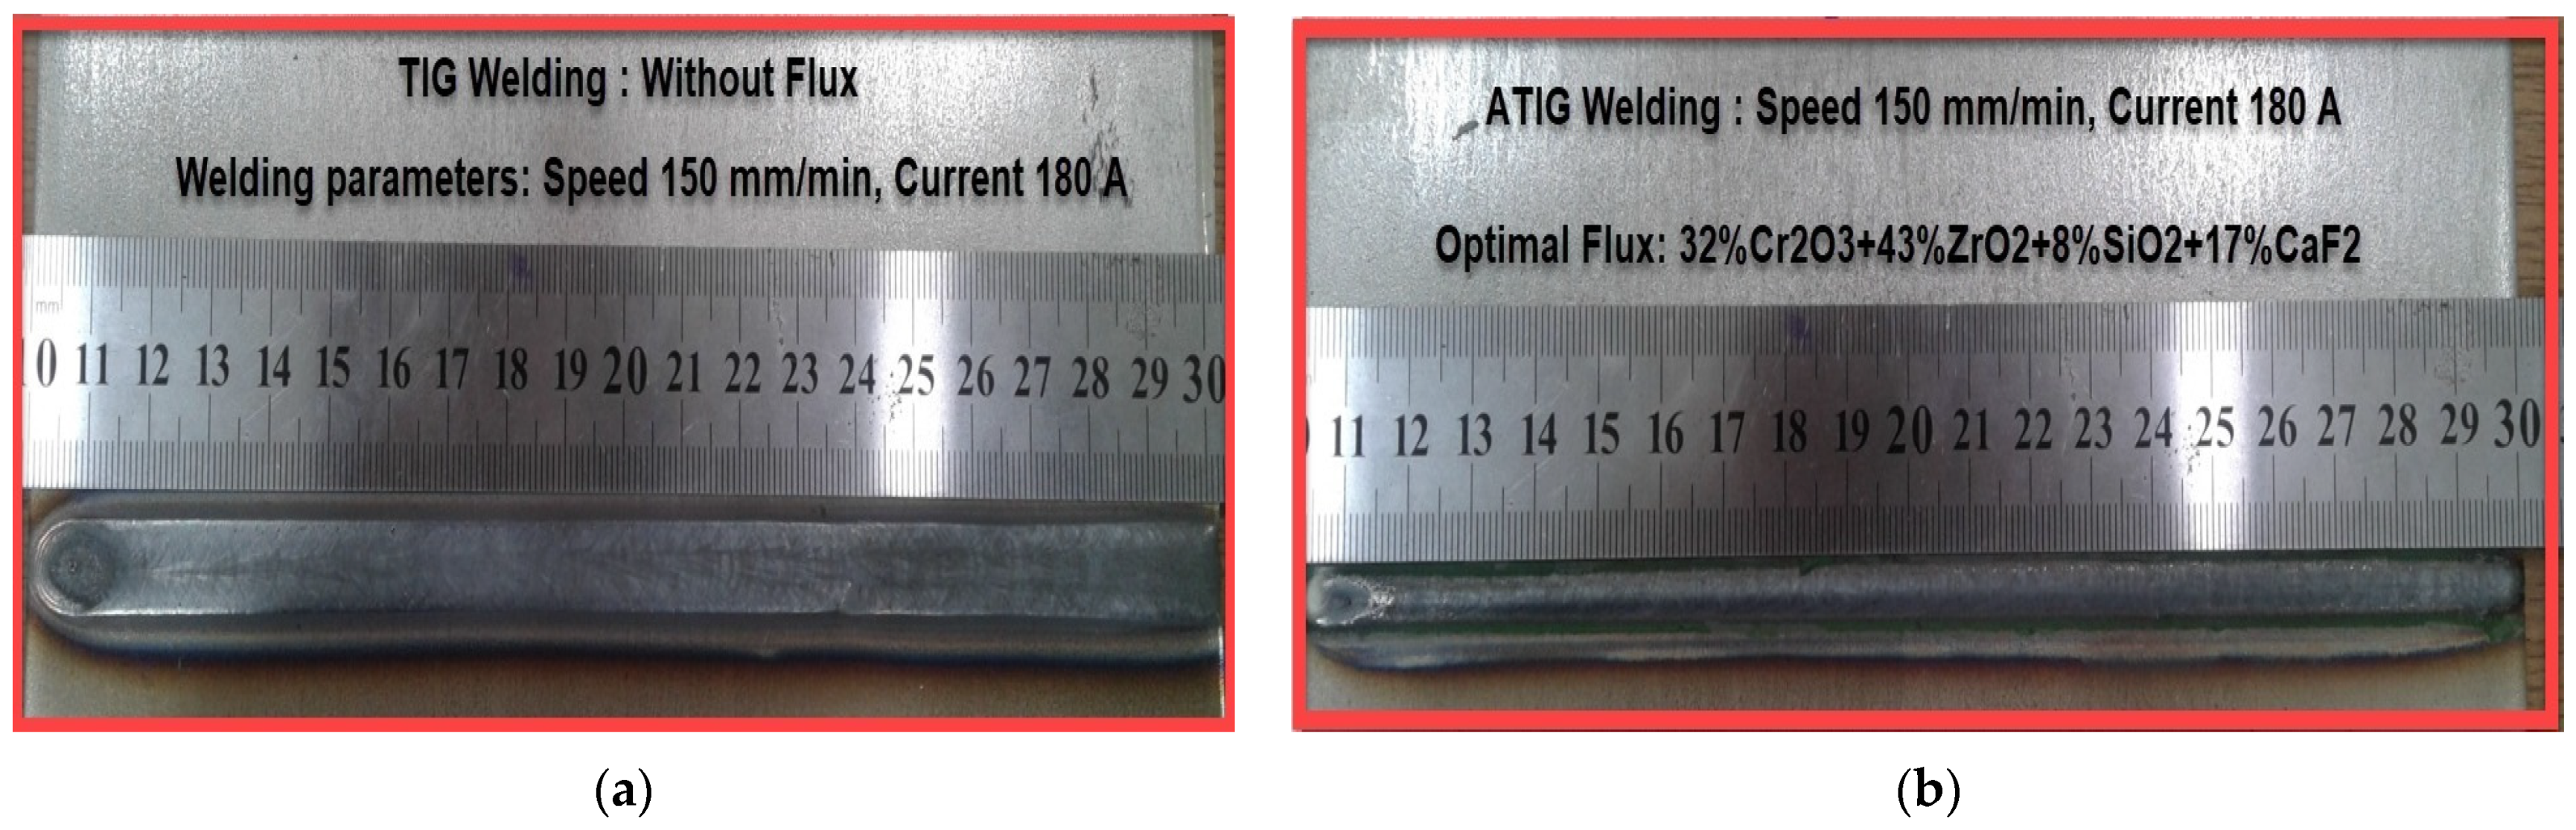
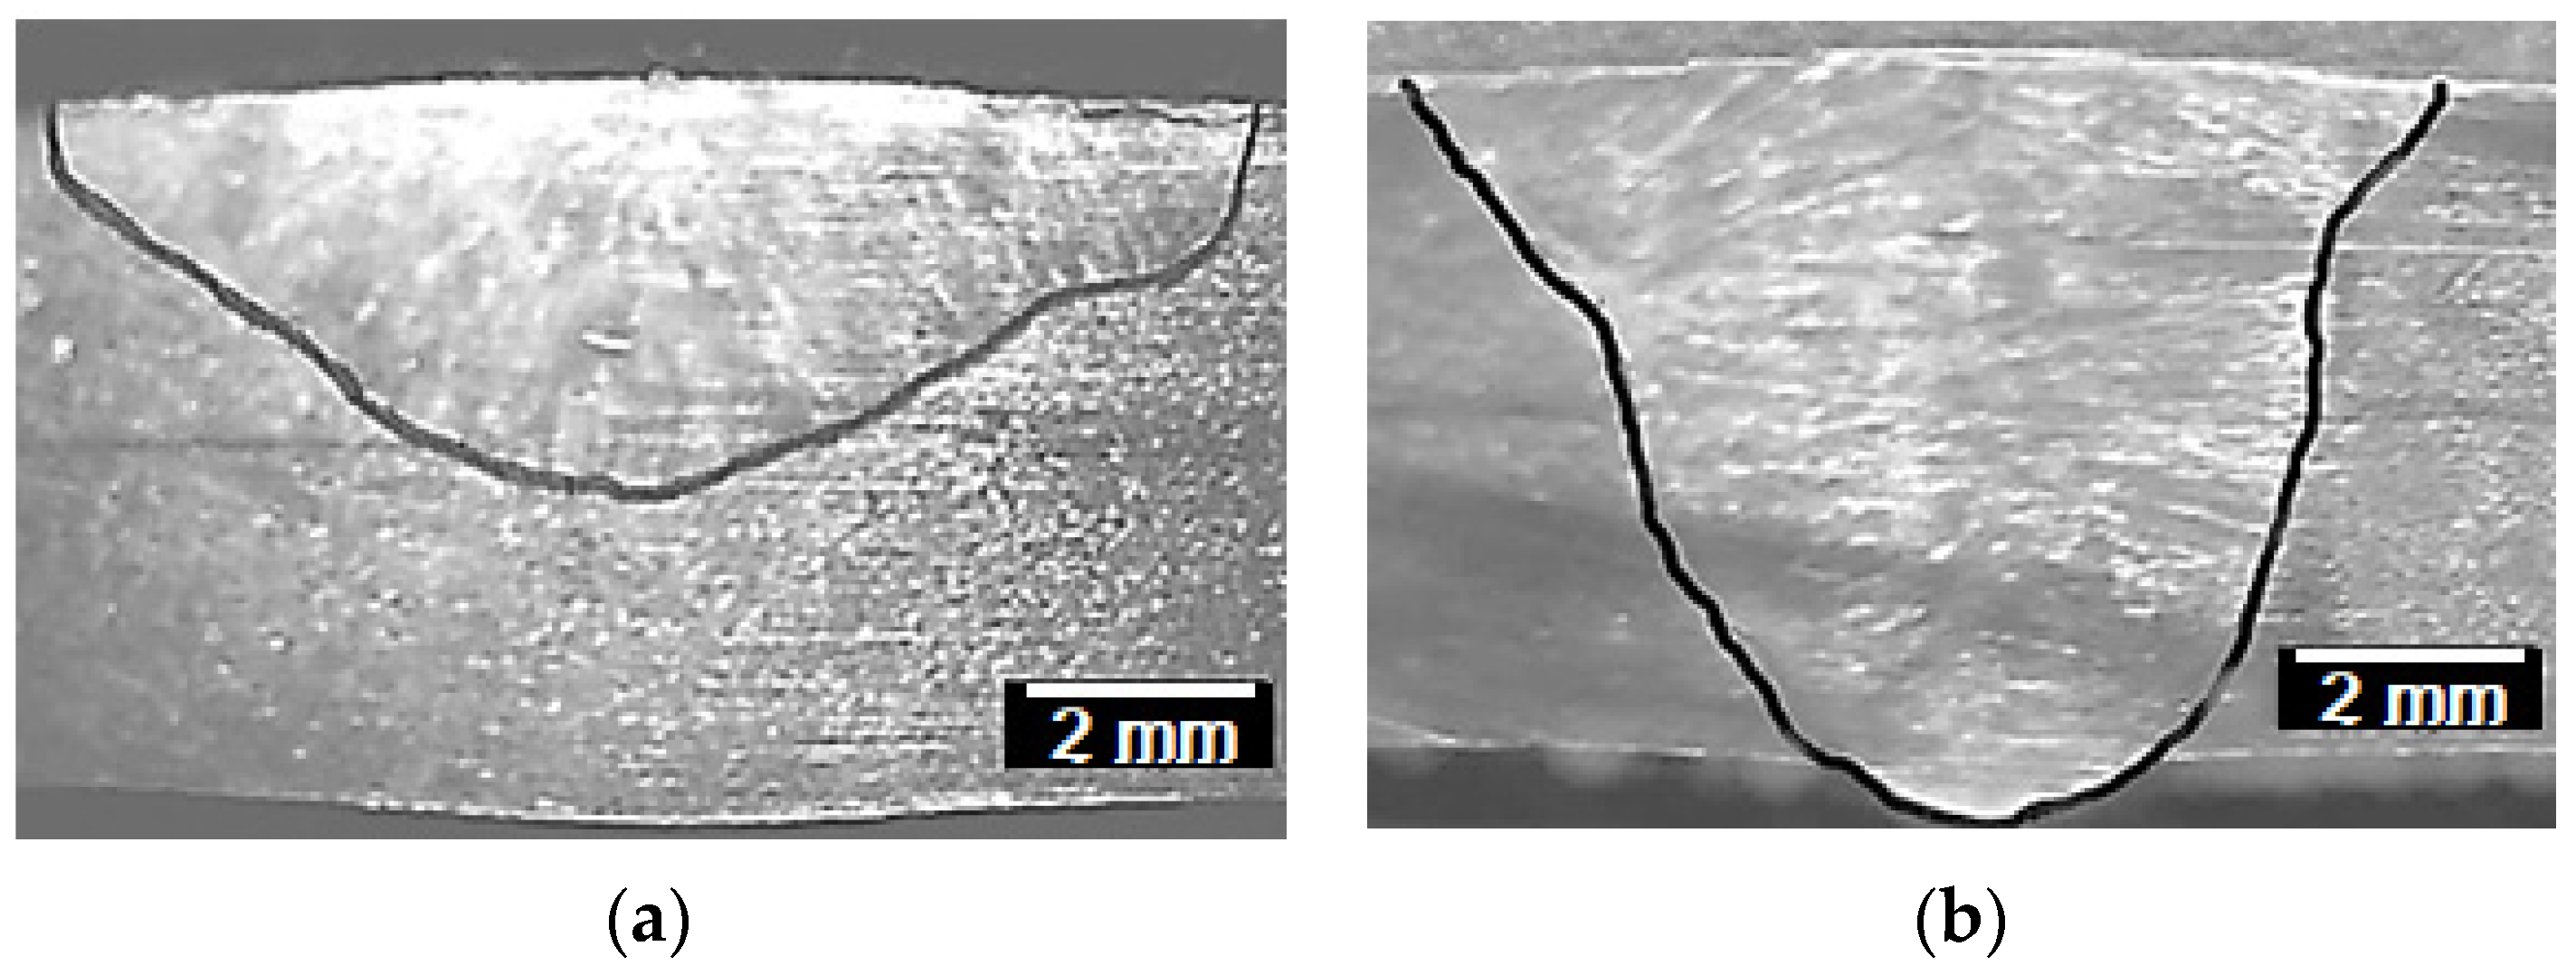
- Oxygen liberated from oxides as surfactant element affects the surface tension of the molten metal resulting in a centripetal movement, the metal moves from the edges to the center as cited in related works [29,30]. A full penetration weld is performed in a single pass without edge preparation or the use of filler metal, which meets the needs of industries as shown in Figure 8b.
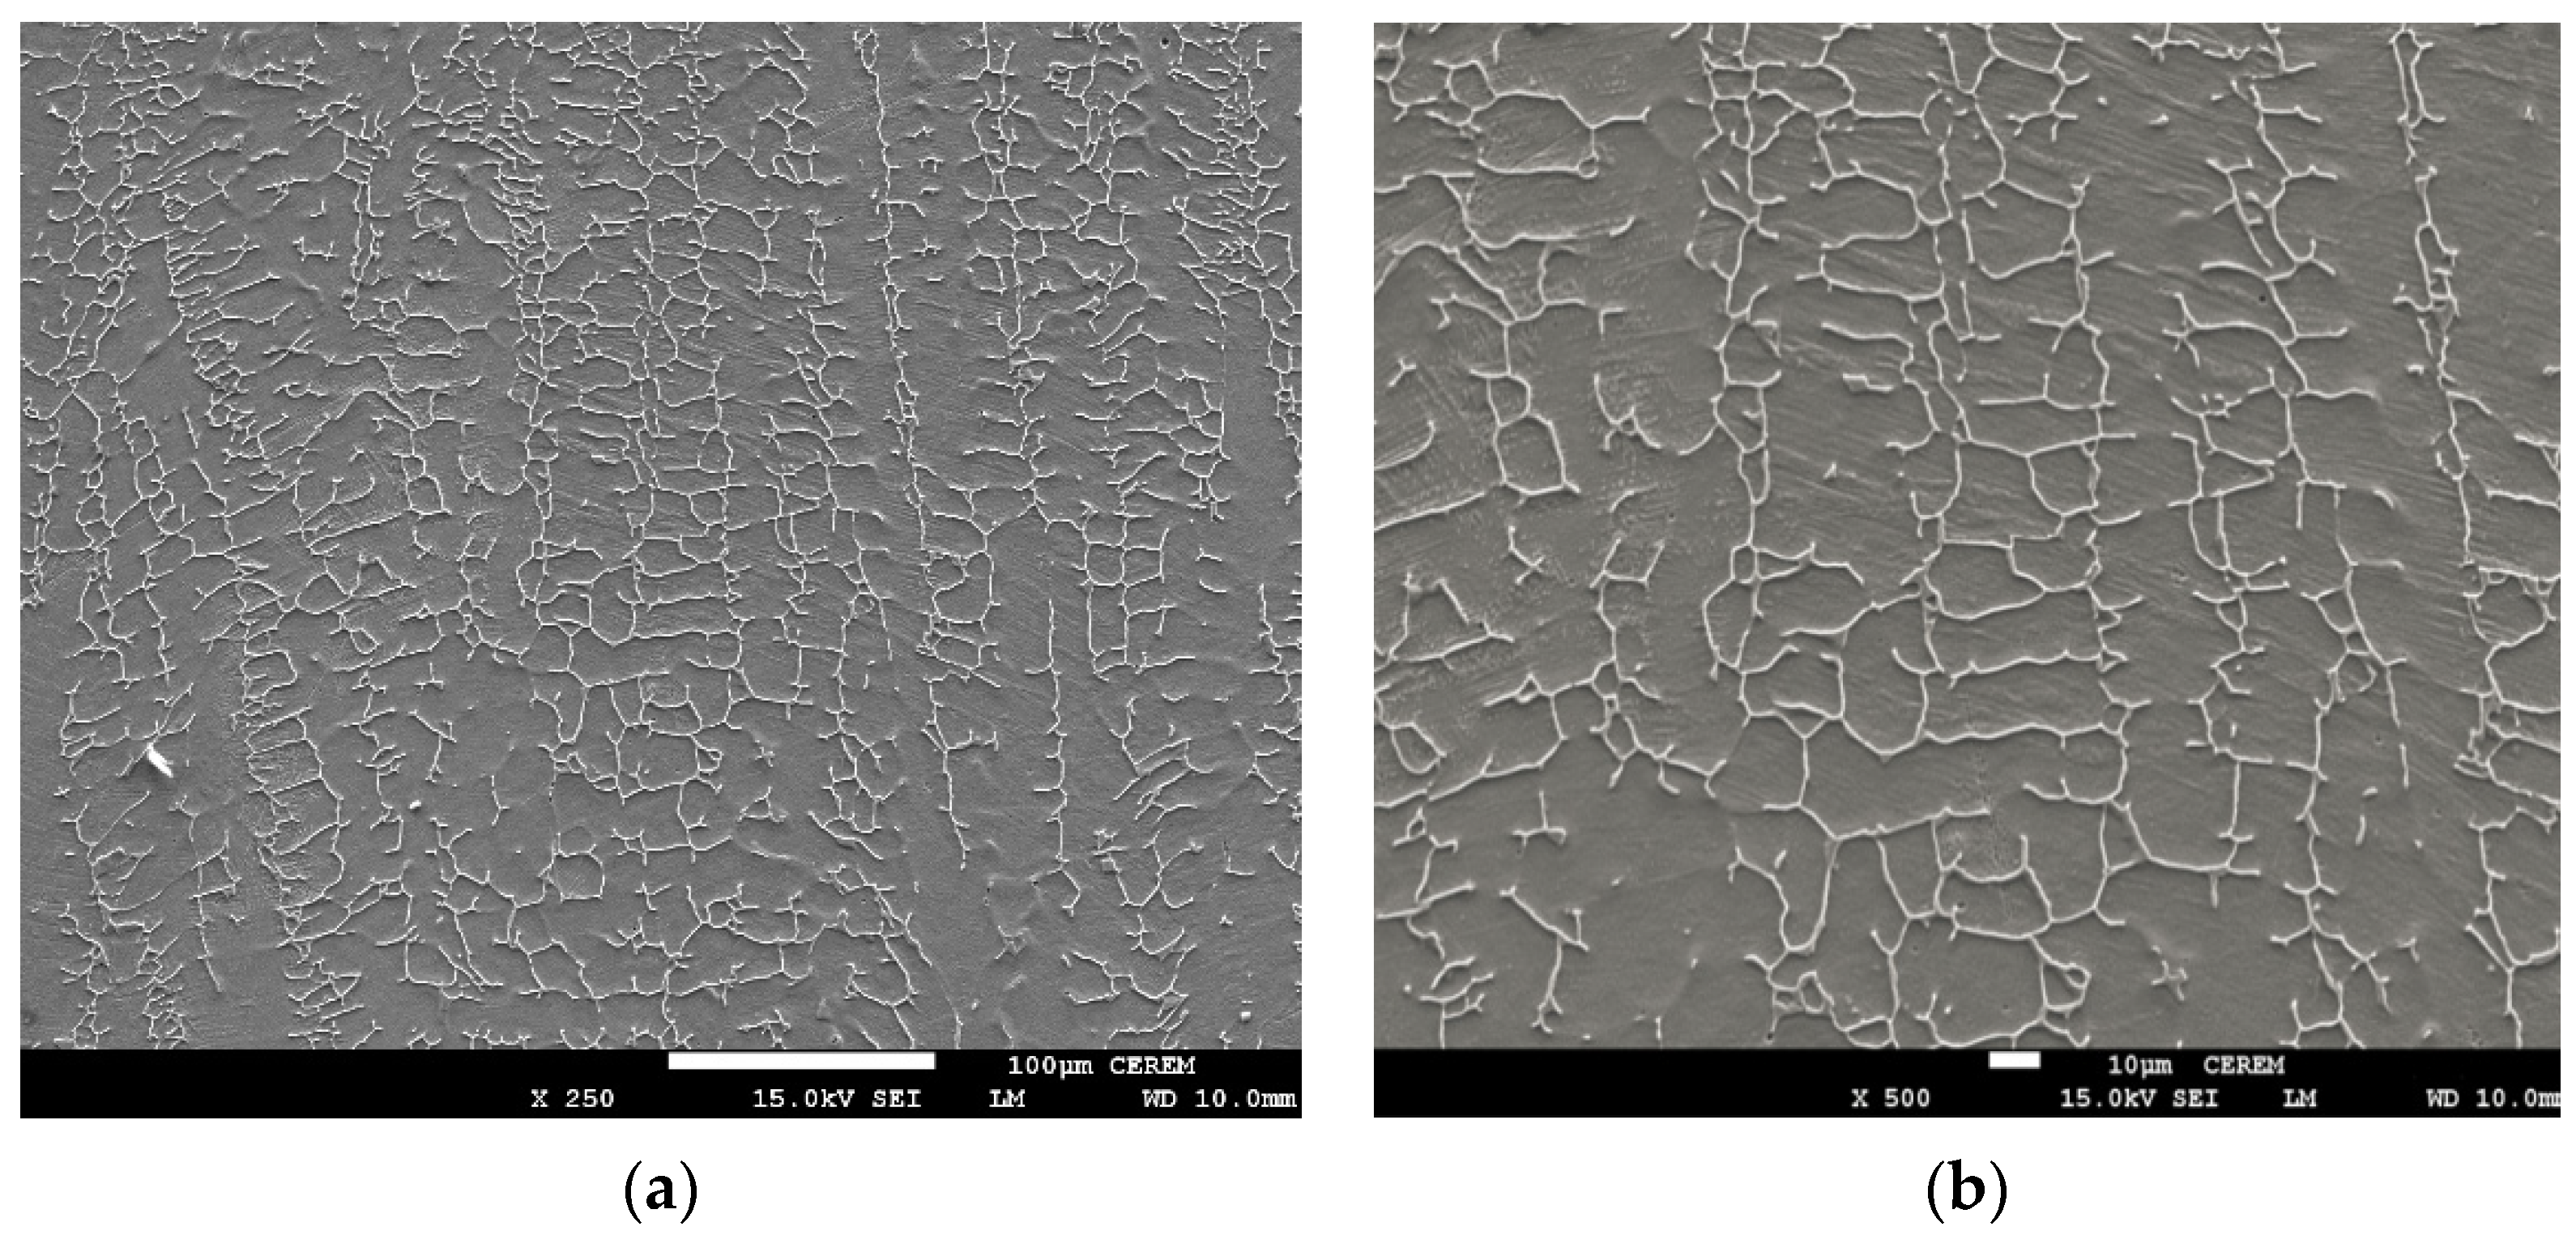
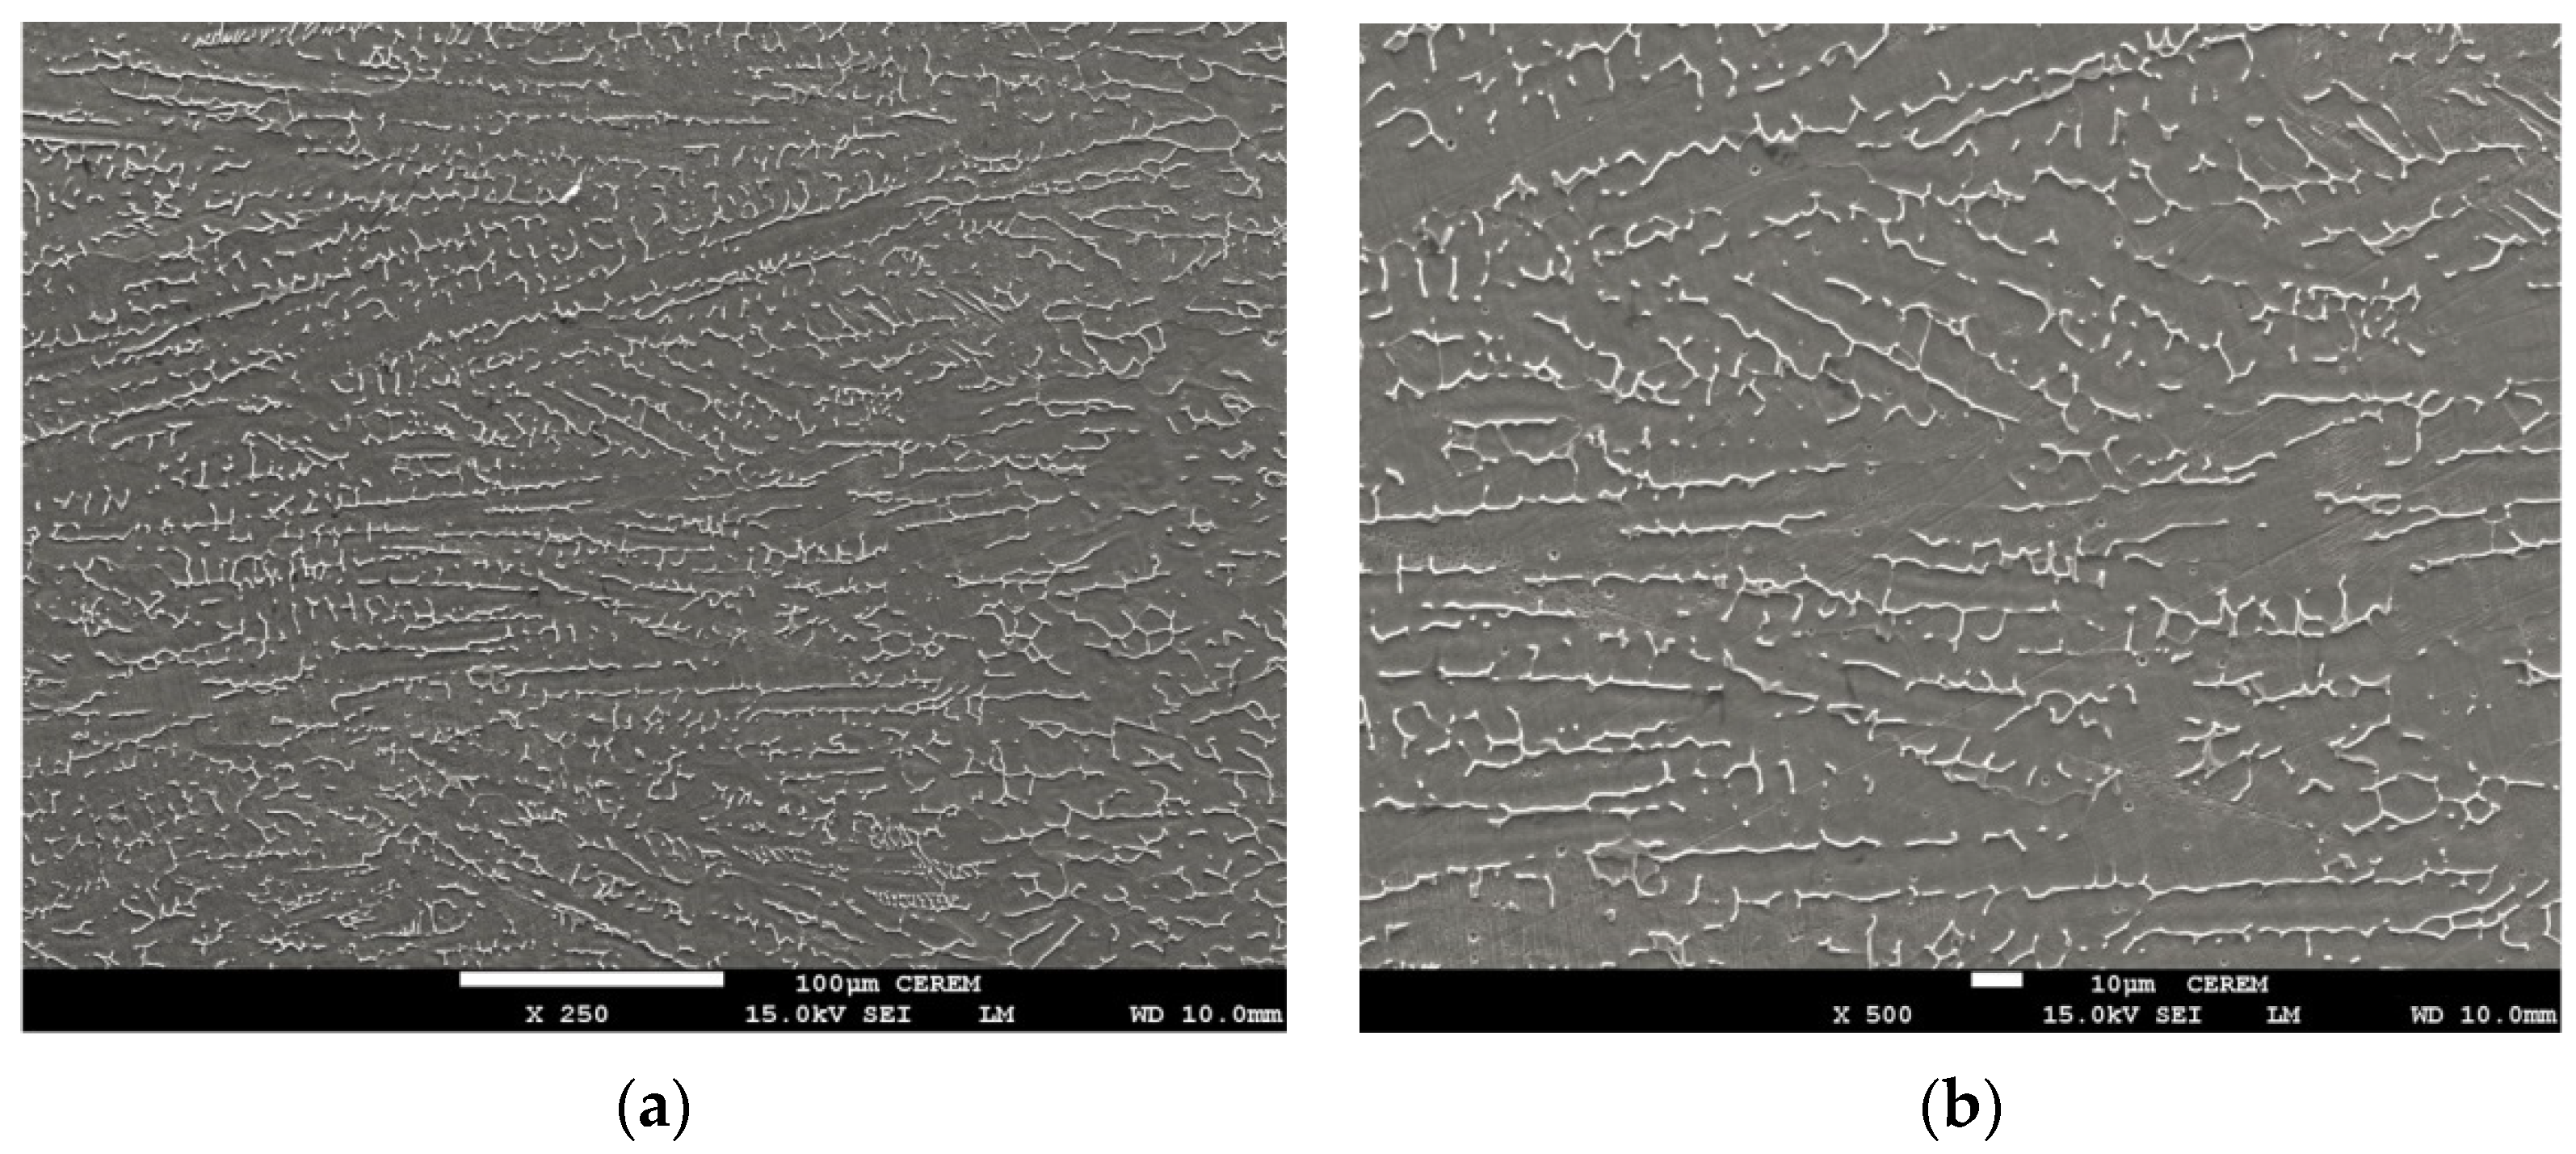
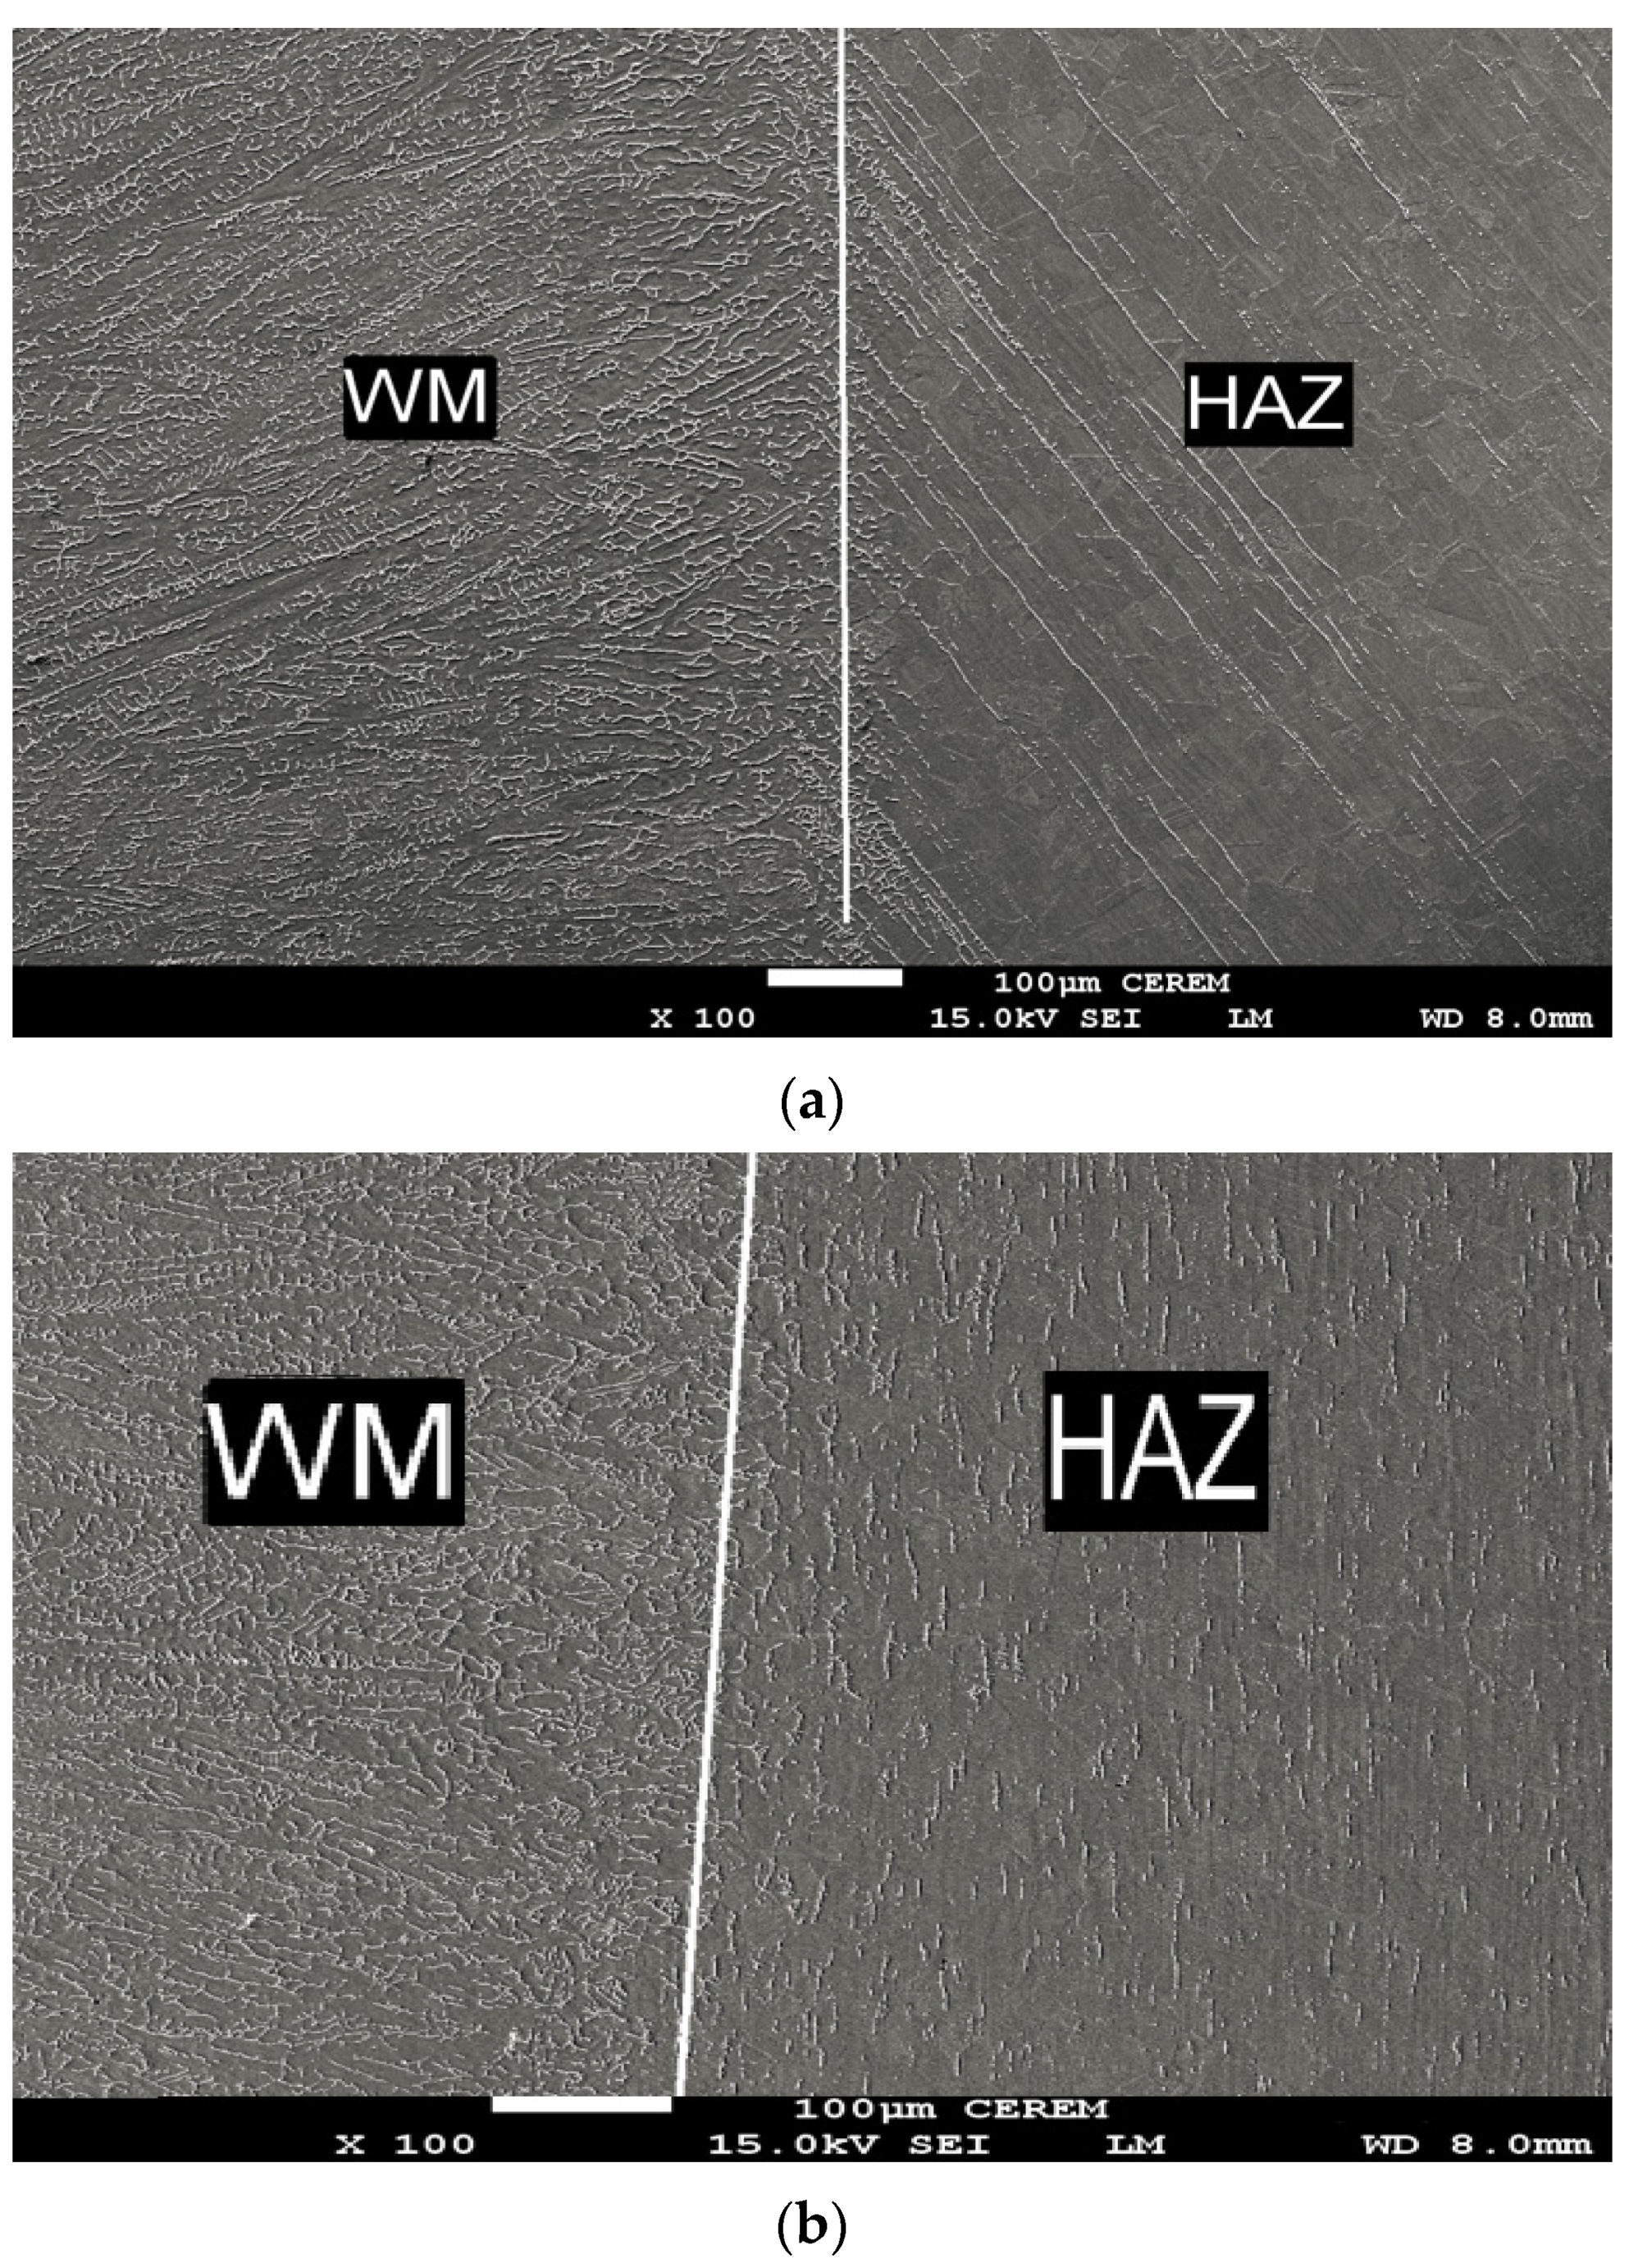
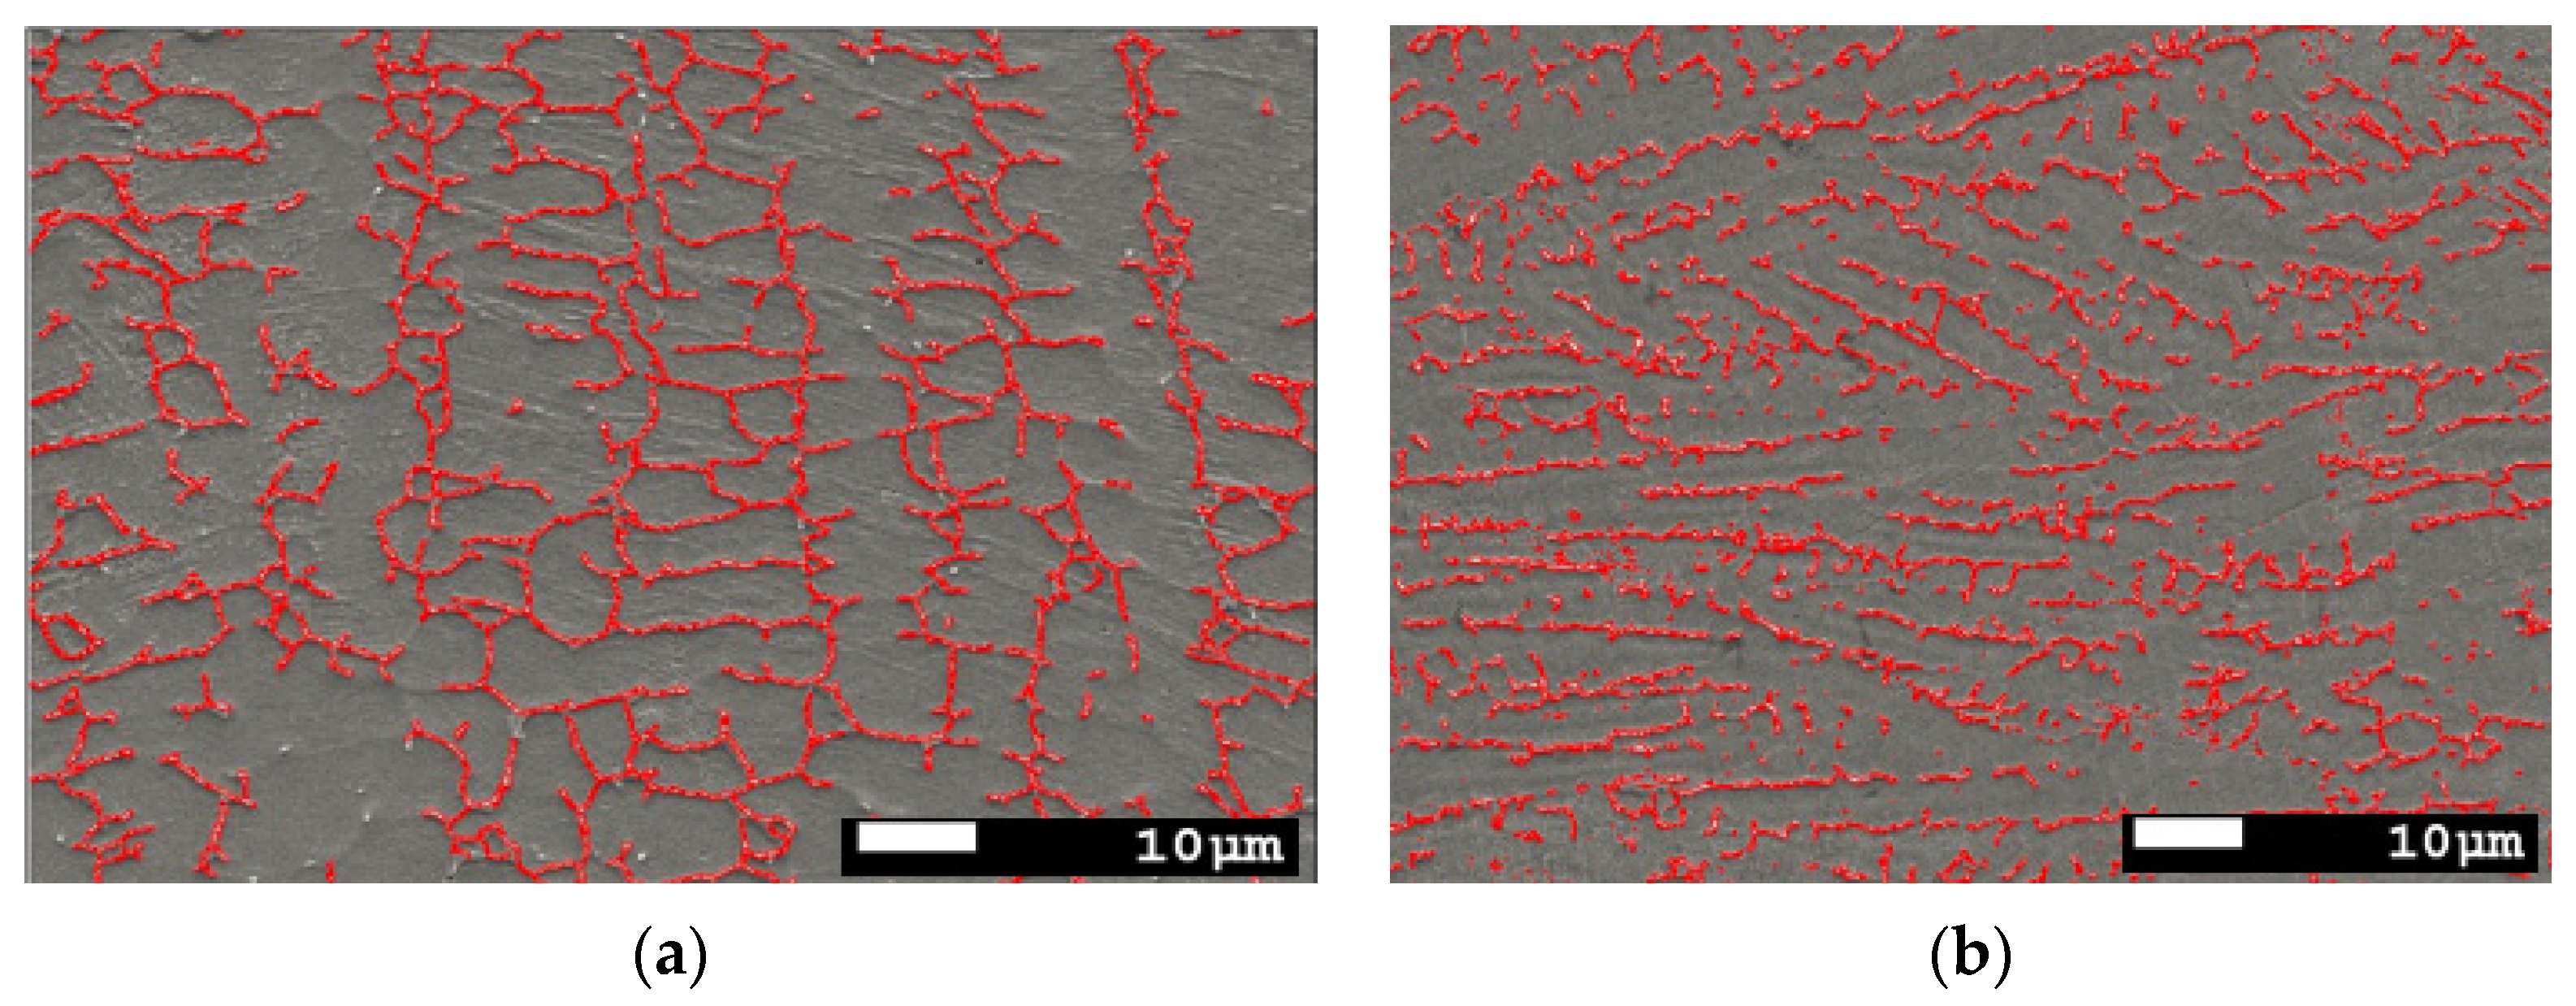
3.3. Microstructural Assessment
3.4. Hardness Test
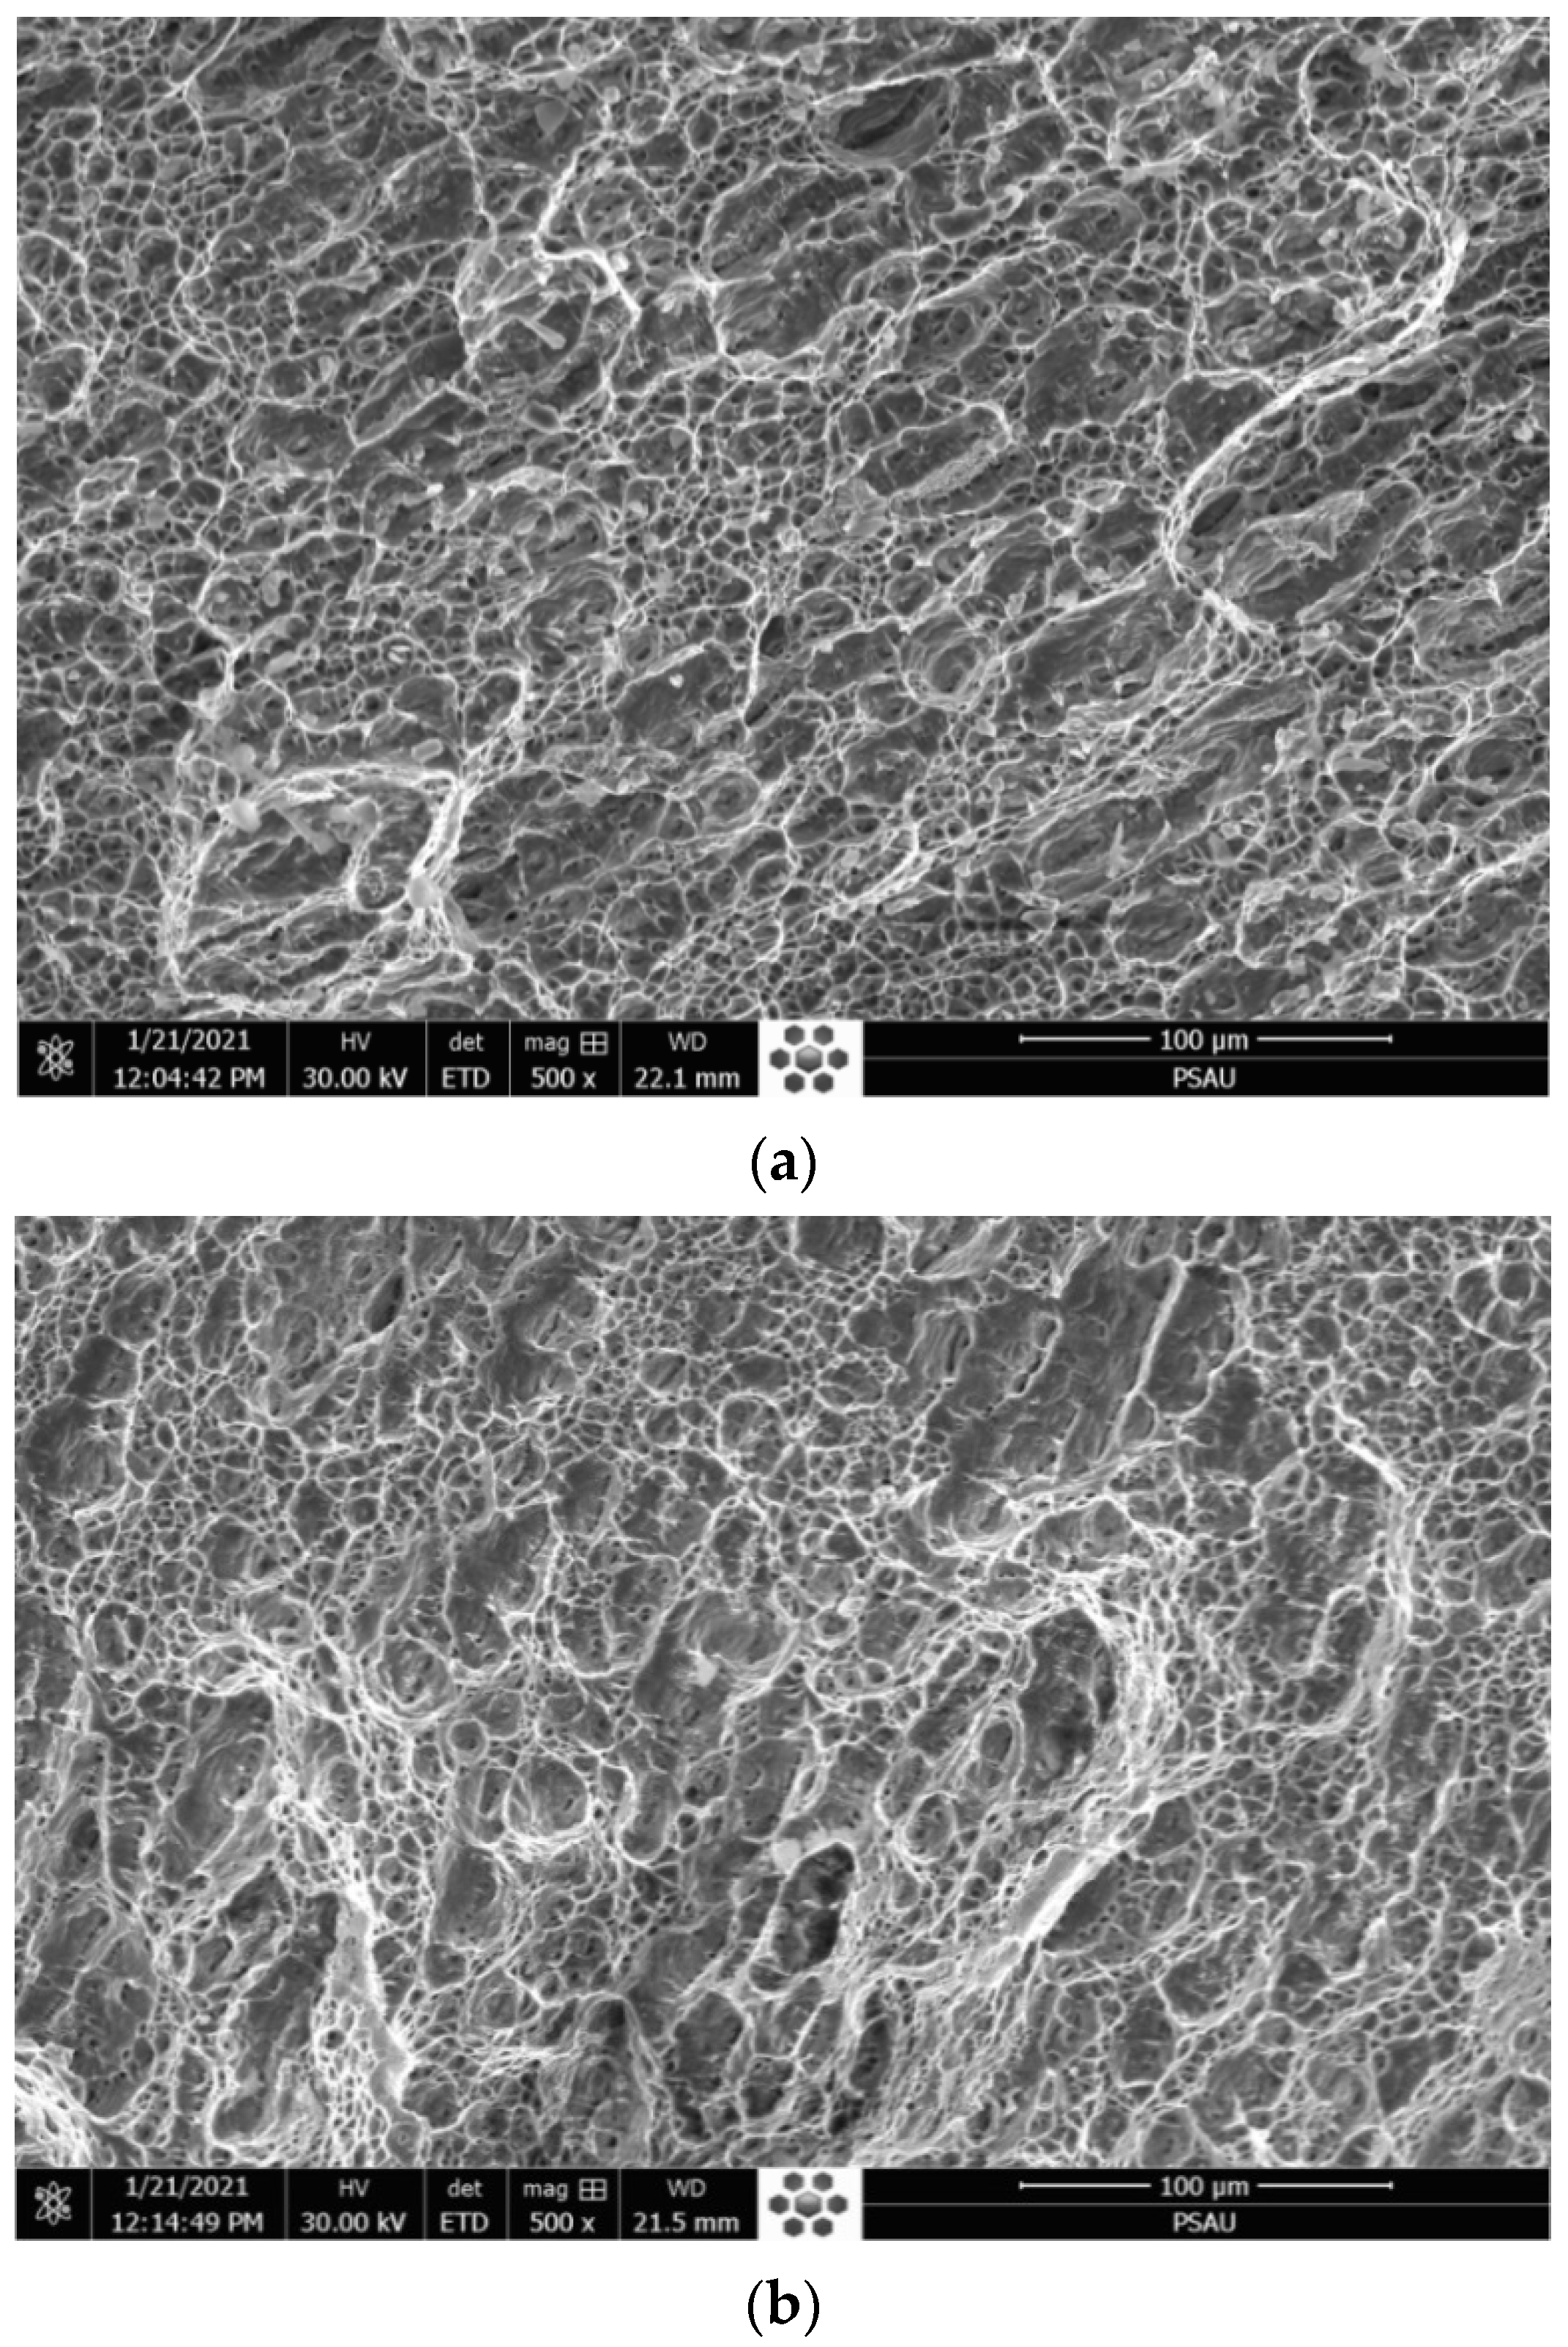
3.5. Impact Test
4. Conclusions
- -
- Mixing design of the experiment combined to the particle swarm optimization (PSO) method is among the novelties of this work. Optimal flux was composed by 32% Cr2O3, 43% ZrO2, 8% SiO2, and 17% CaF2. The optimal flux raised from this method improves the mechanical properties in comparison to conventional TIG weld bead. Transversal tensile testing of the produced ATIG weld has a UTS value (600 MPa) close to parent metal (624 MPa). On the other hand, the UTS of TIG weld fell to 571 MPa. ATIG welding is more resistant than conventional TIG welding to sudden impact loads. The ATIG weld hardness results were close to those of conventional TIG weld.
- -
- The ATIG depth weld bead reached 6.80 mm and the weld aspect ratio increased 3.13. The ATIG depth weld was increased by two times in comparison to the conventional TIG weld bead. The fully penetrated ATIG weld is ascribed to two mechanisms cited earlier. The reversal Marangoni mechanism owing to oxygen liberated from flux and the constriction of ATIG arc weld related to the migration of fluorine from the flux to the arc.
- -
- The microstructure of welds in both welds is composed of matrix austenite interspersed by skeleton δ-ferrite. The ferrite volume proportions in ATIG weld around 8.63% and decreased to 5.56% in conventional TIG welding. The δ-ferrite in TIG weld is coarser comparatively to that of ATIG δ-ferrite.
Author Contributions
Funding
Institutional Review Board Statement
Informed Consent Statement
Data Availability Statement
Acknowledgments
Conflicts of Interest
References
- Tathgir, S.; Bhattacharya, A. Activated-TIG Welding of Different Steels: Influence of Various Flux and Shielding Gas. Mater. Manuf. Process. 2016, 31, 235–342. [Google Scholar] [CrossRef]
- Klobčar, D.; Tušek, J.; Bizjak, M.; Simončič, S.; Lešer, V. Active flux tungsten inert gas welding of austenitic stainless steel AISI 304. Metalurgija 2016, 55, 617–620. [Google Scholar]
- Modenesi, P.J.; Neto, C.P.; Apolinario, E.R.; Dias, B.K. Effect of flux density and the presence of additives in ATIG welding of austenitic stainless steel. Weld. Int. 2015, 29, 425–432. [Google Scholar] [CrossRef]
- Kumar, R.; Sundara Bharathi, S.R. A Review Study on A-TIG Welding of 316(L) Austenitic Stainless Steel. Int. J. Emerg. Trends Sci. Technol. (IJETS) 2015, 2, 2066–2072. [Google Scholar]
- Howse, D.S.; Lucas, W. An investigation in to arc construction by active flux for TIG welding. Sci. Technol. Weld. Join. 2000, 5, 189–193. [Google Scholar] [CrossRef]
- Kurtulmuş, M. Activated flux TIG welding of austenitic stainless steels. Emerg. Mater. Res. 2020, 9, 1041–1055. [Google Scholar] [CrossRef]
- Sire, S.; Marya, S. On the development of a new flux bounded TIG process (FBTIG) to enhance weld penetrations in aluminium, 5086. Int. J. Form. Process. 2002, 5, 39–51. [Google Scholar] [CrossRef]
- Jayakrishnan, S.; Chakravarthy, P.; Muhammed Rijas, A. Effect of Flux Gap and Particle Size on the Depth of Penetration in FBTIG Welding of Aluminium. Trans. Indian Inst. Met. 2017, 70, 1329–1335. [Google Scholar] [CrossRef]
- Ambekar, S.D.; Wadhokar, S.R. Parametric Optimization of Gas metal arc welding process by using Taguchi method on stainless steel AISI 410. Int. J. Res. Mod. Eng. Emerg. Technol. 2015, 3, 1–9. [Google Scholar]
- Srirangan, A.K.; Paulraj, S. Multi-response optimization of process parameters for TIG welding of Incoloy 800HT by Taguchi grey relational analysis. Eng. Sci. Technol. Int. J. 2016, 19, 811–817. [Google Scholar] [CrossRef] [Green Version]
- Ramadan, N.; Boghdadi, A. Parametric Optimization of TIG Welding Influence On Tensile Strength of Dissimilar Metals SS-304 And Low Carbon Steel by Using Taguchi Approach. Am. J. Eng. Res. 2020, 9, 7–14. [Google Scholar]
- Chaudhari, V.; Bodkhe, V.; Deokate, S.; Mali, B.; Mahale, R. Parametric optimization of TIG welding on SS 304 and MS using Taguchi approach. Int. Res. J. Eng. Technol. 2019, 6, 880–885. [Google Scholar]
- Albaijan, I.; Hedhibi, A.C.; Touileb, K.; Djoudjou, R.; Ouis, A.; Alrobei, H. Effect of Binary Oxide Flux on Weld Shape, Mechanical Properties and Corrosion Resistance of 2205 Duplex Stainless Steel Welds. Adv. Mater. Sci. Eng. 2020, 2020, 5842741. [Google Scholar] [CrossRef]
- Touileb, K.; Ouis, A.; Djoudjou, R.; Hedhibi, A.C.; Alrobei, H.; Albaijan, I.; Alzahrani, B.; Sherif, M.E.; Abdo, H.S. Effects of ATIG Welding on Weld Shape, Mechanical Properties, and Corrosion Resistance of 430 Ferritic Stainless Steel Alloy. Metals 2020, 10, 404. [Google Scholar] [CrossRef] [Green Version]
- Ran, L.; Manshu, D.; Hongming, G. Prediction of Bead Geometry with Changing Welding Speed Using Artificial Neural Network. Materials 2021, 14, 1494. [Google Scholar]
- Kshirsagar, R.; Jones, S.; Lawrence, J.; Tabor, J. Prediction of Bead Geometry Using a Two-Stage SVM–ANN Algorithm for Automated Tungsten Inert Gas (TIG) Welds. J. Manuf. Mater. Process. 2019, 3, 39. [Google Scholar] [CrossRef] [Green Version]
- Las-Casas, M.S.; De Ávila, T.L.D.; Bracarense, A.Q.; Lima, E.J. Weld parameter prediction using artificial neural network: FN and geometric parameter prediction of austenitic stainless steel welds. J. Braz. Soc. Mech. Sci. Eng. 2018, 40, 26–35. [Google Scholar] [CrossRef]
- Tseng, K.H.; Chen, K.L. Comparisons between TiO2- and SiO2-Flux Assisted TIG Welding Processes. J. Nanosci. Nanotechnol. 2012, 12, 6359–6367. [Google Scholar] [CrossRef]
- Leconte, S.; Paillard, P.; Chapelle, P.; Henrion, G.; Saindrenan, J. Effects of flux containing fluorides on TIG welding process. Sci. Technol. Weld. Join. 2013, 12, 120–126. [Google Scholar] [CrossRef]
- Neethu, N.; Togita, R.G.; Neelima, P.; Chakravarthy, P.; Narayana, M.S.V.S.; Nair, M.T. Effect of Nature of Flux and Flux Gap on the Depth-to-Width Ratio in Flux-Bounded TIG Welding of AA6061: Experiments and Numerical Simulations. Trans. Indian Inst. Met. 2019, 72, 1585–1588. [Google Scholar] [CrossRef]
- Babbar, A.; Kumar, A.; Jain, V.; Gupta, D. Enhancement of Activated Tungsten Inert Gas (A-TIG) Welding Using Multi-component TiO2-SiO2-Al2O3 Hybrid Flux. Measurement 2019, 148, 106912. [Google Scholar] [CrossRef]
- Ahmed, A.N.; Noor, C.W.M.; Allawi, M.F.; El-Shafie, A. RBF-NN-based model for prediction of weld bead geometry in Shielded Metal Arc Welding (SMAW). Neural Comput. Appl. 2018, 29, 889–899. [Google Scholar] [CrossRef]
- Kumar, R.; Saurav, S.K. Modeling of TIG welding process by regression analysis and neural network technique. Int. J. Mech. Eng. Technol. (IJMET) 2015, 6, 10–27. [Google Scholar]
- Kshirsagar, R.; Jones, S.; Lawrence, J.; Tabor, J. Optimization of TIG Welding Parameters Using a Hybrid Nelder Mead-Evolutionary Algorithms Method. J. Manuf. Mater. Process. 2020, 4, 10. [Google Scholar] [CrossRef] [Green Version]
- Boubaker, S.; Kamel, S.; Kolsi, L.; Kahouli, O. Forecasting of One-Day-Ahead Global Horizontal Irradiation Using Block-Oriented Models Combined with a Swarm Intelligence Approach. Nat. Resour. Res. 2020, 30, 1–26. [Google Scholar] [CrossRef]
- Patel, N.P.; Badheka, V.J.; Vora, J.J.; Upadhyay, G.H. Effect of Oxide Fluxes in Activated TIG Welding of Stainless Steel 316LN to Low Activation Ferritic/Martensitic Steel (LAFM) Dissimilar Combination. Trans. Indian Inst. Met. 2019, 72, 2753–2761. [Google Scholar] [CrossRef]
- Goodwin, G.M.; Cole, N.C.; Slaughtera, D.G.M. Study of Ferrite Morphology in Austenitic Stainless Steel Weldments. Weld. Res. Suppl. 1972, 12, 425–429. [Google Scholar]
- Ming, L.Q.; Hong, W.X.; Da, Z.Z.; Jun, W. Effect of activating flux on arc shape and arc voltage in tungsten inert gas welding. Trans. Nonferrous Met. Soc. China 2007, 17, 486–490. [Google Scholar]
- Kulkarni, A.; Dwivedi, D.K.; Vasudevan, M. Study of Mechanism, Microstructure and Mechanical Properties of Activated Flux TIG Welded P91 Steel-P22 Steel Dissimilar Metal Joint. Mater. Sci. Eng. A 2018, 50, 309–323. [Google Scholar] [CrossRef]
- Vora, J.J.; Badheka, V.J. Experimental Investigation on Mechanism and Weld Morphology of Activated TIG Welded Bead-on-plate Weldments of Reduced Activation Ferritic/martensitic Steel Using Oxide Fluxes. J. Manuf. Process. 2015, 20, 224–233. [Google Scholar] [CrossRef]
- Kujanpaa, V.P.; Suutala, V.P.; Takalo, N.J.; Moisio, T.J.I. Solidification Cracking—Estimation of the Susceptibility of Austenitic and Austenitic-Ferritic Stainless Steel Welds. Met. Constr. 1980, 12, 282–285. [Google Scholar]
- Kou, S. Welding Metallurgy, 2nd ed.; John Wiley & Sons: Hoboken, NJ, USA, 2003. [Google Scholar]
- Dixit, P.; Suketu, J. Techniques to weld similar and dissimilar materials by ATIG welding—An overview. Mater. Manuf. Process. 2021, 36, 1–16. [Google Scholar]
- Roy, S.; Samaddar, S.; Uddin, M.N.; Hoque, A.; Mishra, S.; Das, S. Effect of Activating Flux on Penetration in ATIG Welding of 316 Stainless Steel. Indian Weld. J. 2017, 50, 72–80. [Google Scholar] [CrossRef]
- Vasudevan, M. Effect of A-TIG Welding Process on the Weld Attributes of Type 304LN and 316LN Stainless Steels. J. Mater. Eng. Perform. 2017, 26, 1325–1336. [Google Scholar] [CrossRef]
- Suman, S.; Santanu, D. Effect of Polarity and Oxide Fluxes on Weld-bead Geometry in Activated Tungsten Inert Gas (A-TIG) Welding. J. Weld. Join. 2020, 38, 380–388. [Google Scholar]
- Lippold, J.C.; Savage, W.F. Solidification of Austenitic Stainless Steel Weldments: Part 2-The Effect of Alloy Composition on Ferrite Morphology. Weld. J. 1980, 59, 48–58. [Google Scholar]
- Jebaraj, A.V.; Kumar, T.S.; Manikandan, M. Investigation of Structure Property Relationship of the Dissimilar Weld Between Austenitic Stainless Steel 316L and Duplex Stainless Steel 2205. Trans. Indian Inst. Met. 2018, 71, 2593–2604. [Google Scholar] [CrossRef]
- Charles, J. Composition and properties of duplex stainless steels. Weld. World 1995, 36, 43–54. [Google Scholar]
- Harish, K.D.; Somi, R.A. Study of Mechanical Behavior in Austenitic Stainless Steel 316 LN Welded Joints. Int. J. Mech. Eng. Rob. Res. 2013, 61, 37–56. [Google Scholar]


| Elements | C | Mn | Si | P | S | Cr | Ni | Mo | N | Cu | Fe |
|---|---|---|---|---|---|---|---|---|---|---|---|
| Weight % | 0.026 | 1.47 | 0.42 | 0.034 | 0.0016 | 16.60 | 10.08 | 2.14 | 0.044 | 0.50 | Balance |
| Parameters | Range |
|---|---|
| Welding speed | 150 mm/min |
| Welding current | 180 A |
| Arc length | 2 mm |
| Electrode tip angle | 45° |
| Shielding gas on the workpiece | Argon with flow rate 10 L/min |
| Shielding gas on the backside | Argon with flow rate 5 L/min |
| Polarity | DCEN |
| Oxide | SiO2 | TiO2 | Fe2O3 | MnO2 | Cr2O3 | ZrO2 | CaO | Mn2O3 | V2O5 | MoO3 | SrO | Co2O3 | MgO |
|---|---|---|---|---|---|---|---|---|---|---|---|---|---|
| UTS | 529 | 542 | 538 | 539 | 559 | 565 | 536 | 534 | 481 | 491 | 338 | 506 | 523 |
| Exp. No. | Cr2O3 [Weight %] | TiO2 [Weight %] | ZrO2 [Weight %] | SiO2 + CaF2 [Weight %] |
|---|---|---|---|---|
| 1 | 56.25 | 18.75 | 0.00 | 25 |
| 2 | 56.25 | 0.00 | 18.75 | 25 |
| 3 | 37.50 | 18.75 | 18.75 | 25 |
| 4 | 37.50 | 0.00 | 37.50 | 25 |
| 5 | 37.50 | 37.50 | 0.00 | 25 |
| 6 | 18.75 | 56.25 | 0.00 | 25 |
| 7 | 18.75 | 37.50 | 18.75 | 25 |
| 8 | 18.75 | 18.75 | 37.50 | 25 |
| 9 | 0.00 | 56.25 | 18.75 | 25 |
| 10 | 0.00 | 37.50 | 37.50 | 25 |
| 11 | 0.00 | 18.75 | 56.25 | 25 |
| 12 | 25.00 | 25.00 | 25.00 | 25 |
| 13 | 50.00 | 12.50 | 12.50 | 25 |
| 14 | 12.50 | 50.00 | 12.50 | 25 |
| 15 | 12.50 | 12.50 | 50.00 | 25 |
| 16 | 75.00 | 0.00 | 0.00 | 25 |
| 17 | 0.00 | 75.00 | 0.00 | 25 |
| 18 | 0.00 | 0.00 | 75.00 | 25 |
| 19 | 18.75 | 0.00 | 56.25 | 25 |
| Exp. No. | Number of Tests | Max. UTS [MPa] | Min. UTS [MPa] | Average UTS [MPa] | σ Standard Deviation |
|---|---|---|---|---|---|
| 1 | 3 | 577 | 552 | 564 | 12.58 |
| 2 | 3 | 592 | 587 | 590 | 2.51 |
| 3 | 3 | 595 | 575 | 578 | 16.16 |
| 4 | 3 | 590 | 557 | 579 | 19.05 |
| 5 | 3 | 570 | 538 | 551 | 16.82 |
| 6 | 3 | 577 | 541 | 558 | 18.14 |
| 7 | 3 | 594 | 560 | 582 | 19.34 |
| 8 | 3 | 590 | 556 | 579 | 19.62 |
| 9 | 3 | 585 | 557 | 575 | 15.88 |
| 10 | 3 | 600 | 563 | 587 | 20.55 |
| 11 | 3 | 594 | 561 | 581 | 17.78 |
| 12 | 3 | 594 | 558 | 582 | 20.78 |
| 13 | 3 | 592 | 558 | 579 | 18.35 |
| 14 | 3 | 596 | 560 | 582 | 19.50 |
| 15 | 3 | 593 | 562 | 582 | 17.61 |
| 16 | 3 | 570 | 558 | 563 | 6.02 |
| 17 | 3 | 555 | 542 | 550 | 6.80 |
| 18 | 3 | 585 | 565 | 580 | 11.54 |
| 19 | 3 | 593 | 591 | 592 | 1.15 |
| Variables | Cr2O3 | TiO2 | ZrO2 | SiO2 | CaF2 |
|---|---|---|---|---|---|
| Single Percentages | 32% | 0% | 43% | 8% | 17% |
| Combined Percentages | 75% (Cr2O3 + ZrO2) | 25% (SiO2 + CaF2) | |||
| Response | Predicted Response (MPa) |
|---|---|
| UTS | 588.27 |
| Sample | Number of Tests | UTS Max. | UTS Min. | UTS Mean | Standards Deviation (σ) |
|---|---|---|---|---|---|
| TIG | 4 | 578 | 568 | 571 | 4.57 |
| ATIG | 4 | 602 | 596 | 600 | 2.1 |
| Sample | UTS (MPa) |
|---|---|
| Expected value by mathematical model | 588 |
| Optimal combination (ATIG) | 600 |
| TIG | 571 |
| Base metal (SS316L) | 624 |
| TIG | ATIG | ||||
|---|---|---|---|---|---|
| D (mm) | W (mm) | D/W | D (mm) | W (mm) | D/W |
| 3.26 | 14.44 | 0.23 | 6.80 | 9.5 | 0.72 |
| Sample | Number of Measurements | Max. δ-Ferrite % | Min. δ-Ferrite % | Mean δ-Ferrite % | Standards Deviation σ |
|---|---|---|---|---|---|
| TIG | 7 | 6.2 | 4.8 | 5.56 | 0.35 |
| ATIG | 7 | 9 | 8.1 | 8.63 | 0.31 |
| Sample | Number of Tests | HV Max. | HV Min. | HV Mean | Standards Deviation σ |
|---|---|---|---|---|---|
| ATIG FZ | 8 | 188 | 176 | 183 | 4.93 |
| TIG FZ | 8 | 199 | 175 | 185 | 8.98 |
| ATIG HAZ | 8 | 177 | 167 | 171 | 3.41 |
| TIG HAZ | 8 | 180 | 164 | 172 | 5.03 |
| Sample | Number of Tests | Absorbed Energy Min. | Absorbed Energy Max. | Absorbed Energy Mean | Standards Deviation (σ) |
|---|---|---|---|---|---|
| TIG | 3 | 241 | 269 | 256 | 14.05 |
| ATIG | 3 | 254 | 281 | 267 | 13.58 |
| Sample | C % | Si % | Cr % | Mn % | Fe % | Ni % | Mo % | O % | S % | |
|---|---|---|---|---|---|---|---|---|---|---|
| ATIG weld | Weight % Atomic % | 16.26 47.29 | 0.43 0.54 | 14.80 9.94 | 1.75 1.11 | 58.10 36.34 | 7.09 4.22 | 1.57 0.54 | ||
| TIG weld | Weight % Atomic % | 17.898 47.49 | 0.68 0.77 | 14.86 9.11 | 1.39 0.81 | 54.67 31.21 | 6.73 3.65 | 3.20 6.38 | 0.58 0.58 |
Publisher’s Note: MDPI stays neutral with regard to jurisdictional claims in published maps and institutional affiliations. |
© 2021 by the authors. Licensee MDPI, Basel, Switzerland. This article is an open access article distributed under the terms and conditions of the Creative Commons Attribution (CC BY) license (https://creativecommons.org/licenses/by/4.0/).
Share and Cite
Hedhibi, A.C.; Touileb, K.; Djoudjou, R.; Ouis, A.; Alrobei, H.; Ahmed, M.M.Z. Mechanical Properties and Microstructure of TIG and ATIG Welded 316L Austenitic Stainless Steel with Multi-Components Flux Optimization Using Mixing Design Method and Particle Swarm Optimization (PSO). Materials 2021, 14, 7139. https://0-doi-org.brum.beds.ac.uk/10.3390/ma14237139
Hedhibi AC, Touileb K, Djoudjou R, Ouis A, Alrobei H, Ahmed MMZ. Mechanical Properties and Microstructure of TIG and ATIG Welded 316L Austenitic Stainless Steel with Multi-Components Flux Optimization Using Mixing Design Method and Particle Swarm Optimization (PSO). Materials. 2021; 14(23):7139. https://0-doi-org.brum.beds.ac.uk/10.3390/ma14237139
Chicago/Turabian StyleHedhibi, Abdeljlil Chihaoui, Kamel Touileb, Rachid Djoudjou, Abousoufiane Ouis, Hussein Alrobei, and Mohamed M. Z. Ahmed. 2021. "Mechanical Properties and Microstructure of TIG and ATIG Welded 316L Austenitic Stainless Steel with Multi-Components Flux Optimization Using Mixing Design Method and Particle Swarm Optimization (PSO)" Materials 14, no. 23: 7139. https://0-doi-org.brum.beds.ac.uk/10.3390/ma14237139