
Parametric Effects of Single Point Incremental Forming on Hardness of AA1100 Aluminium Alloy Sheets

 , , , and
Abstract
:1. Introduction
2. Material and Methods
2.1. Workpiece Material
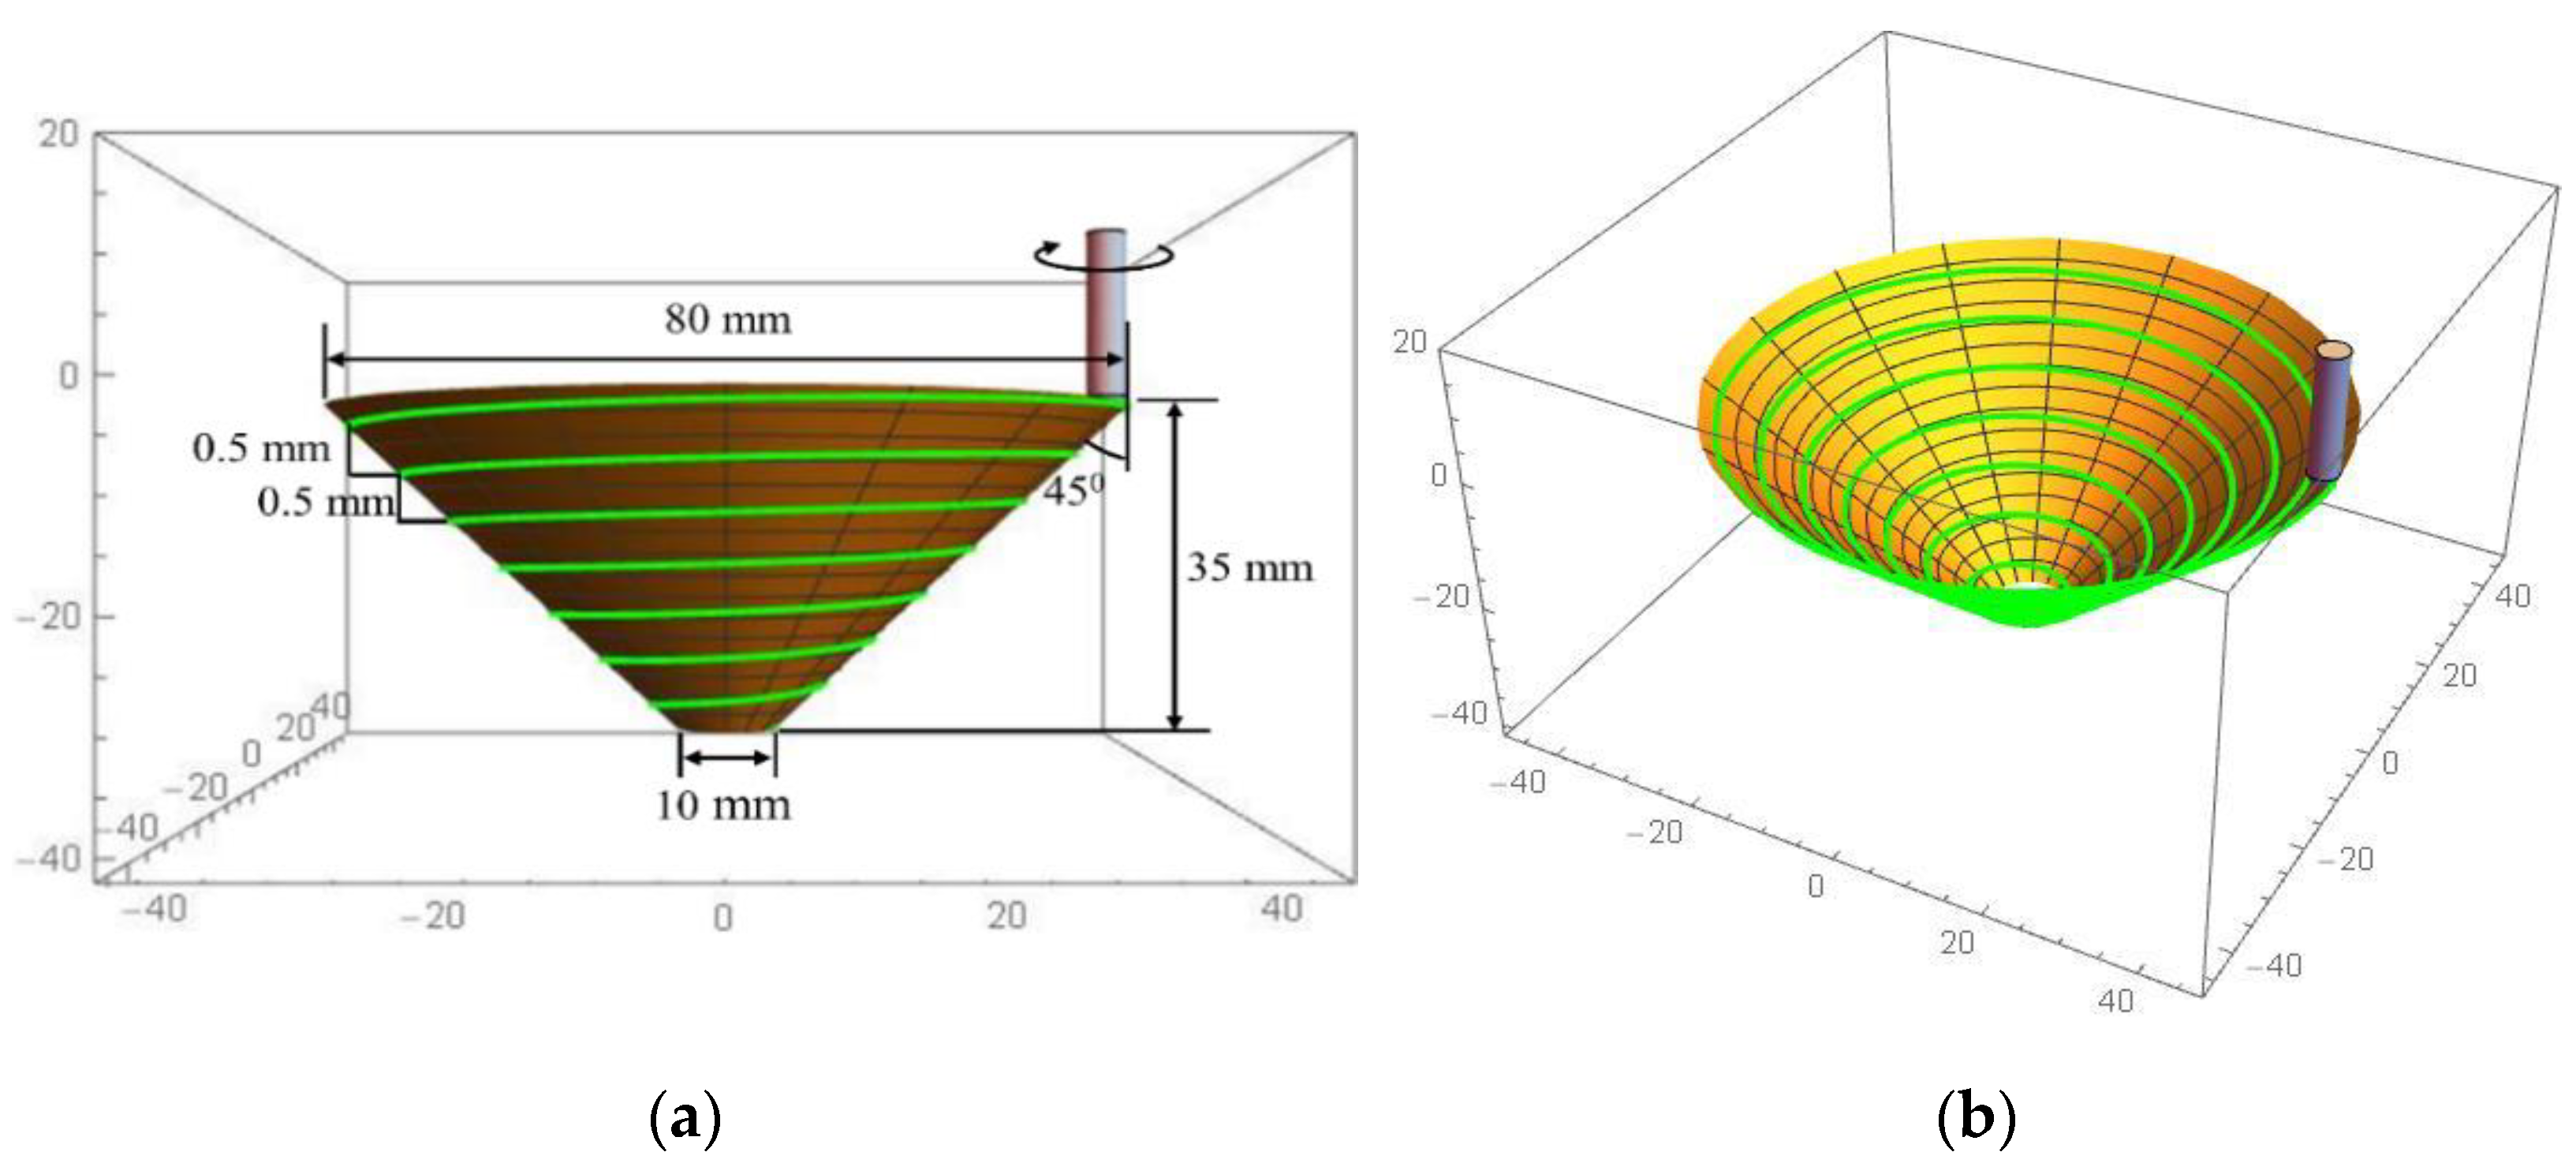
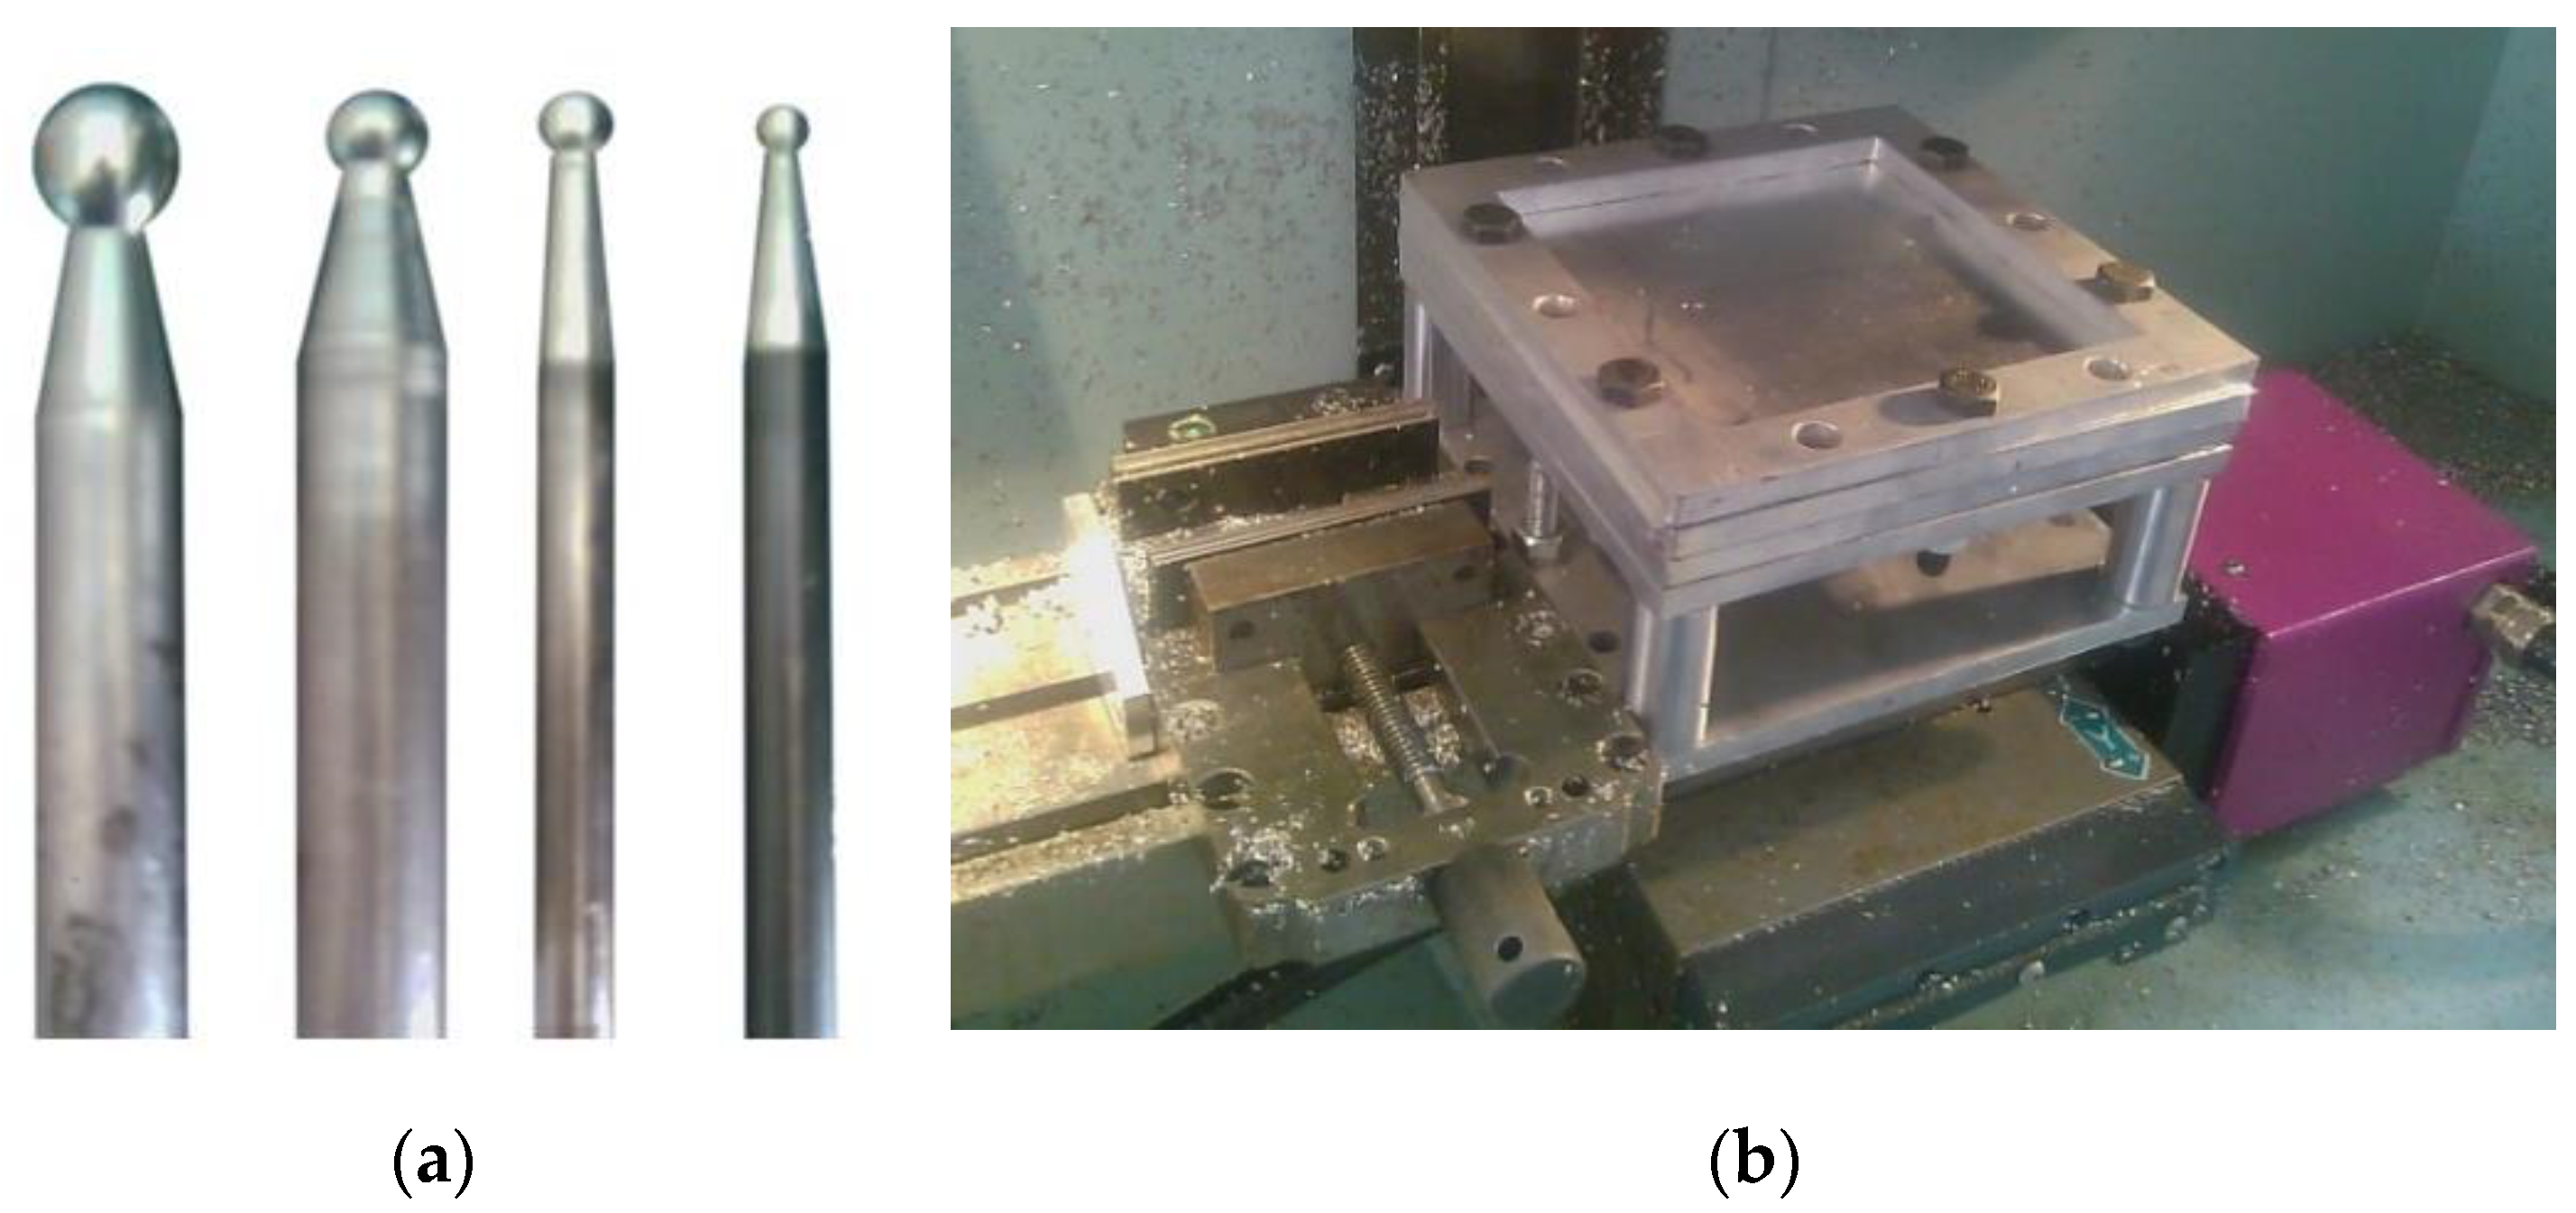
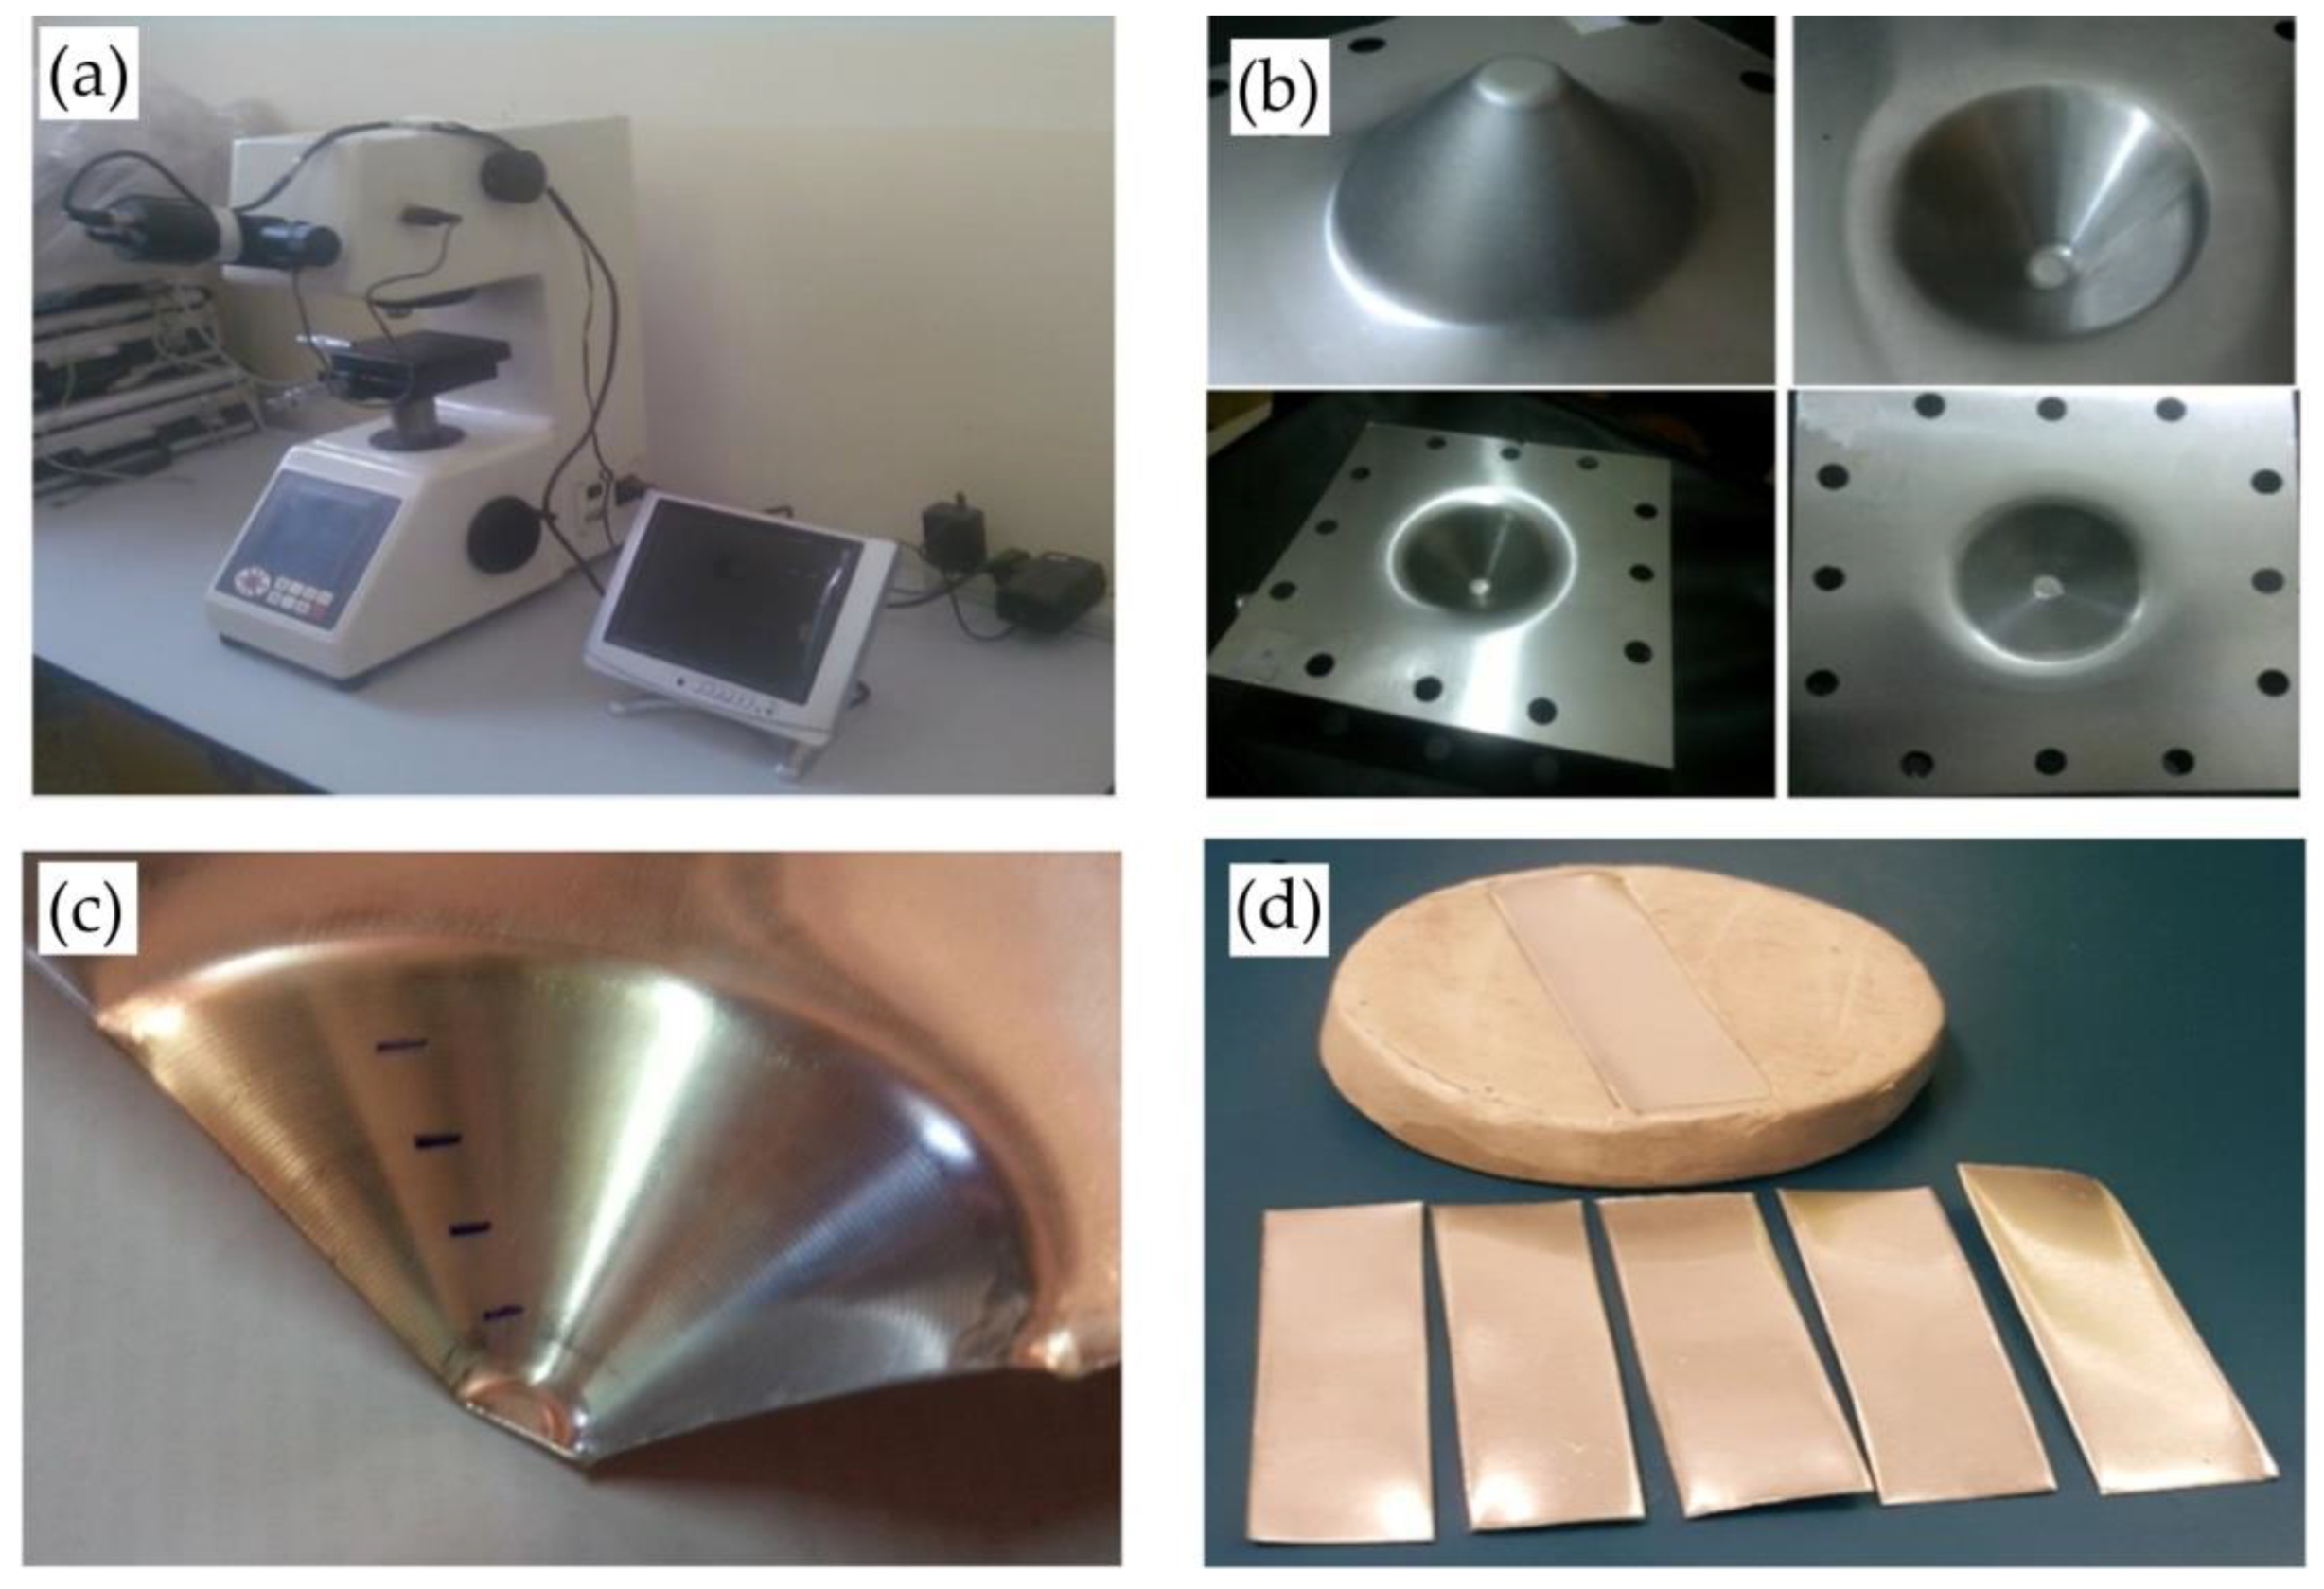
2.2. Experimental Setup
3. Results and Discussion
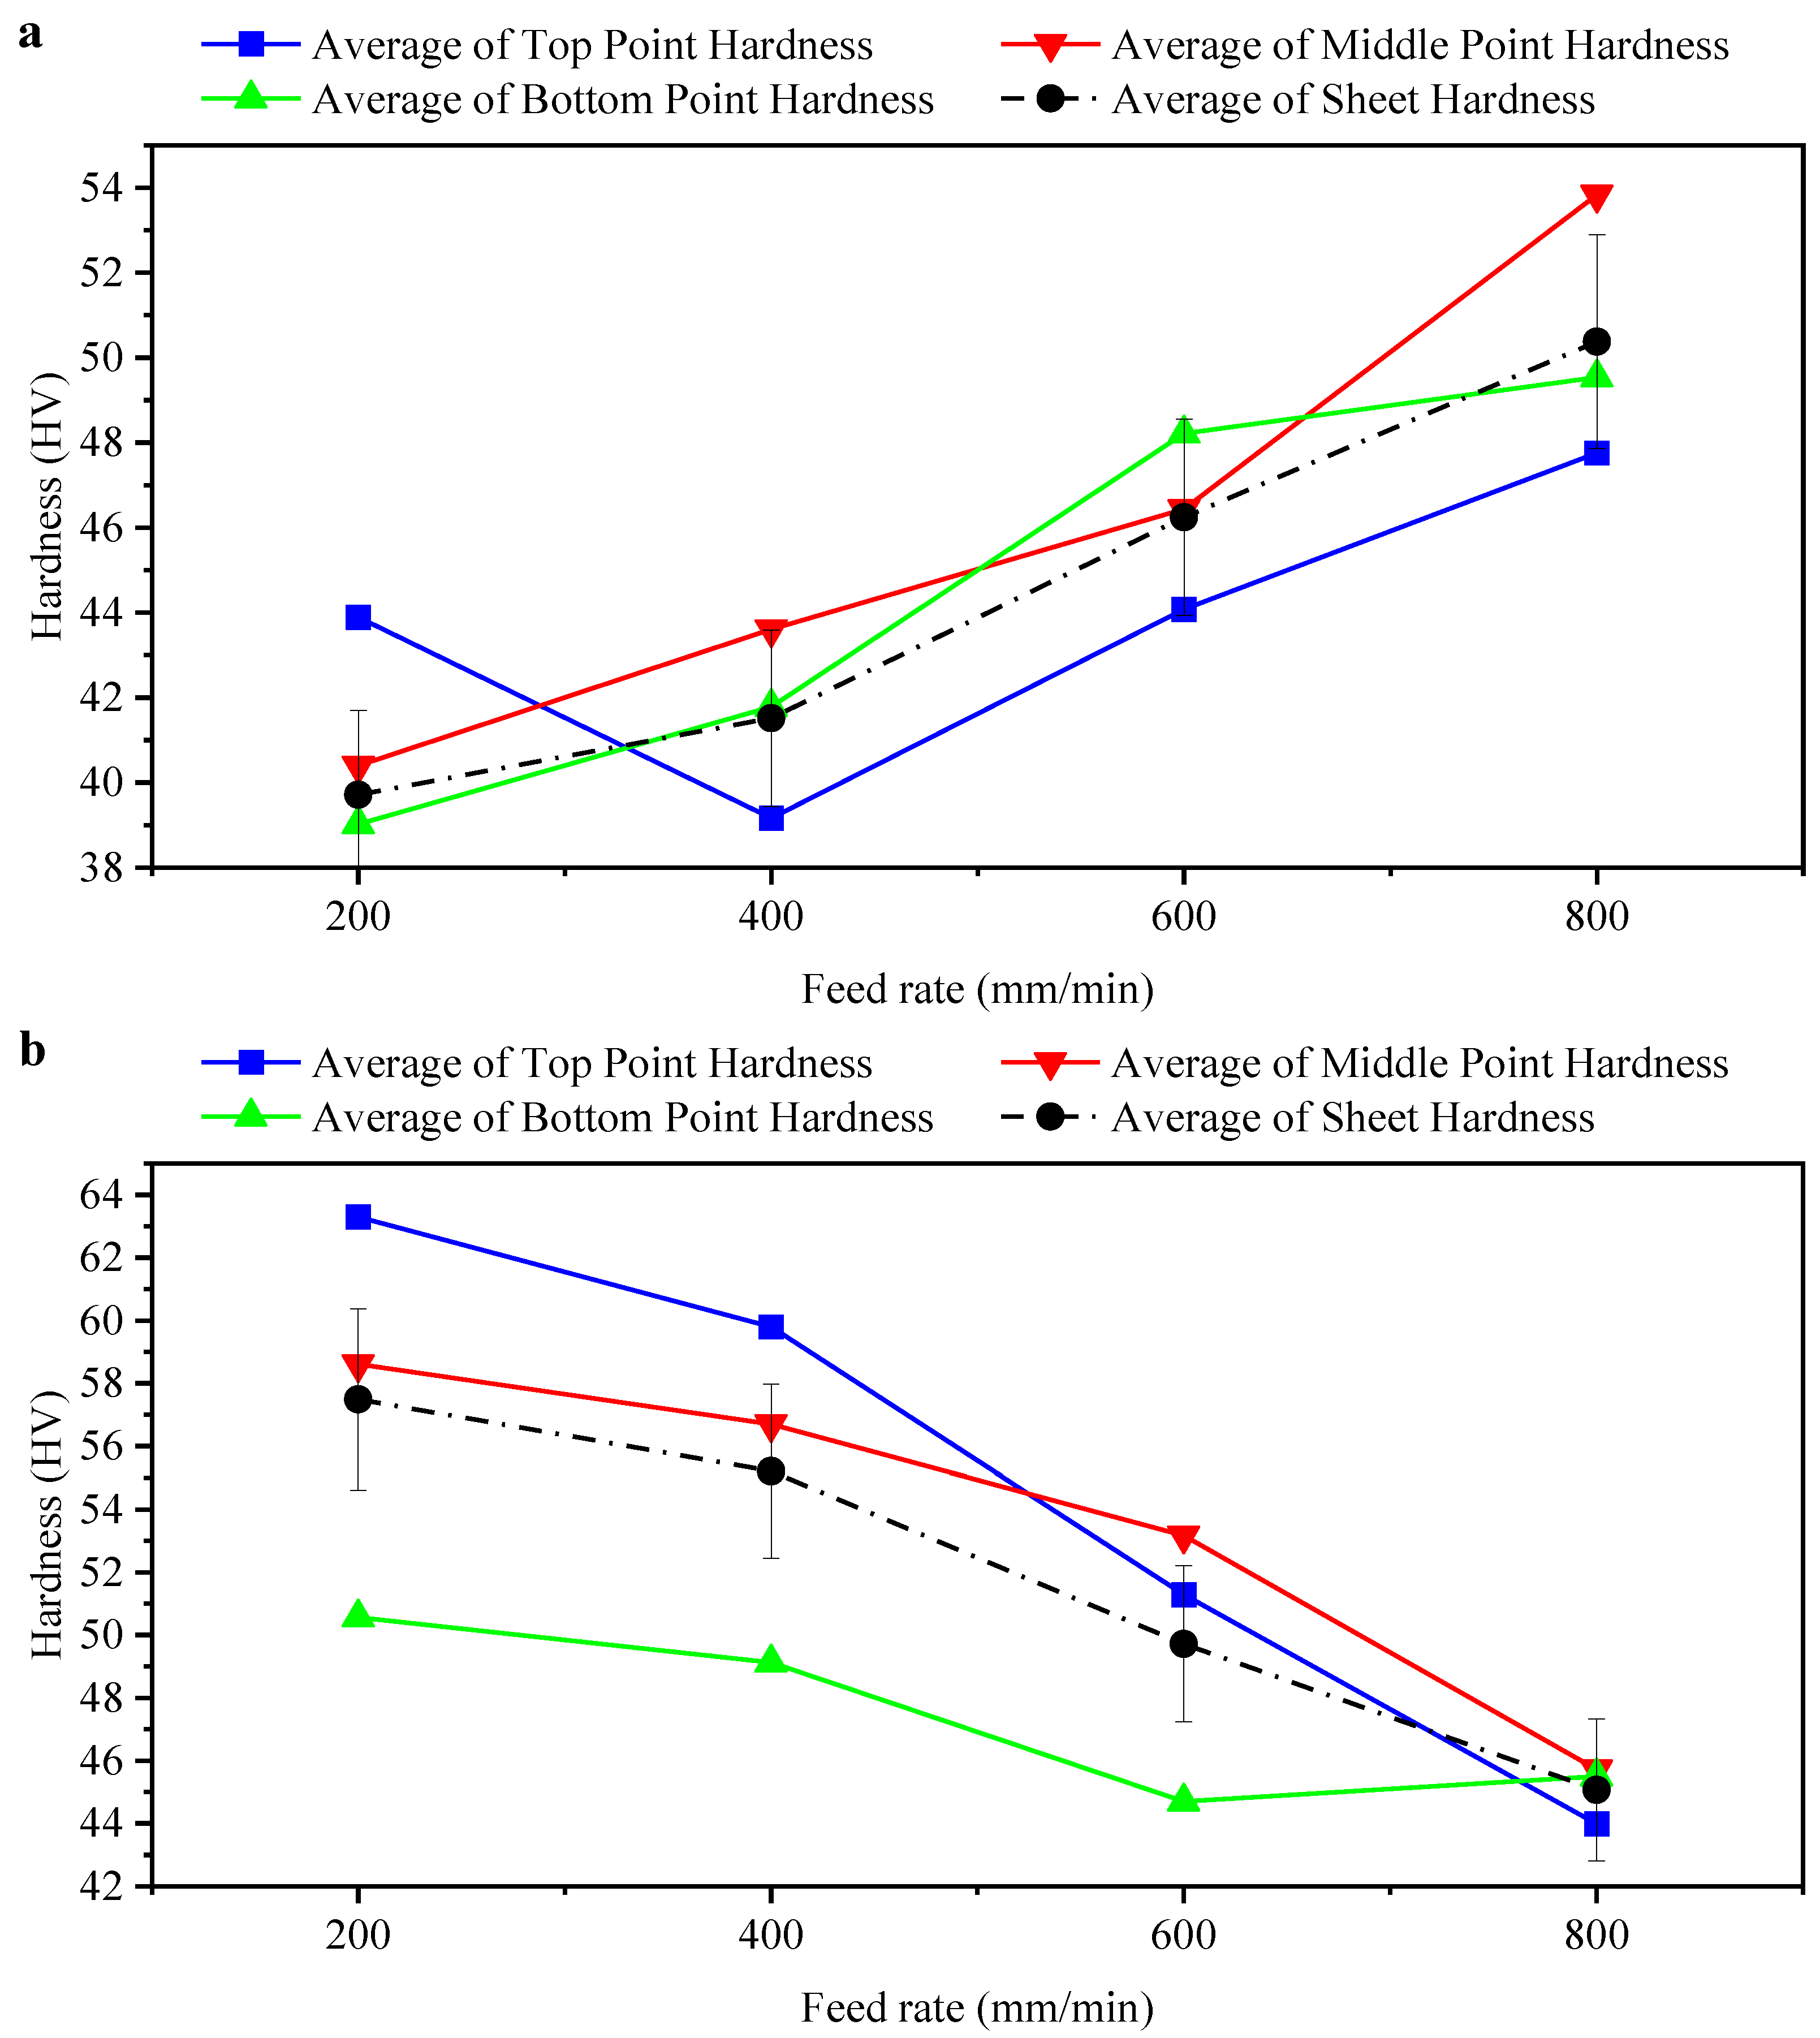
3.1. Feed Rate
3.2. Tool Speed
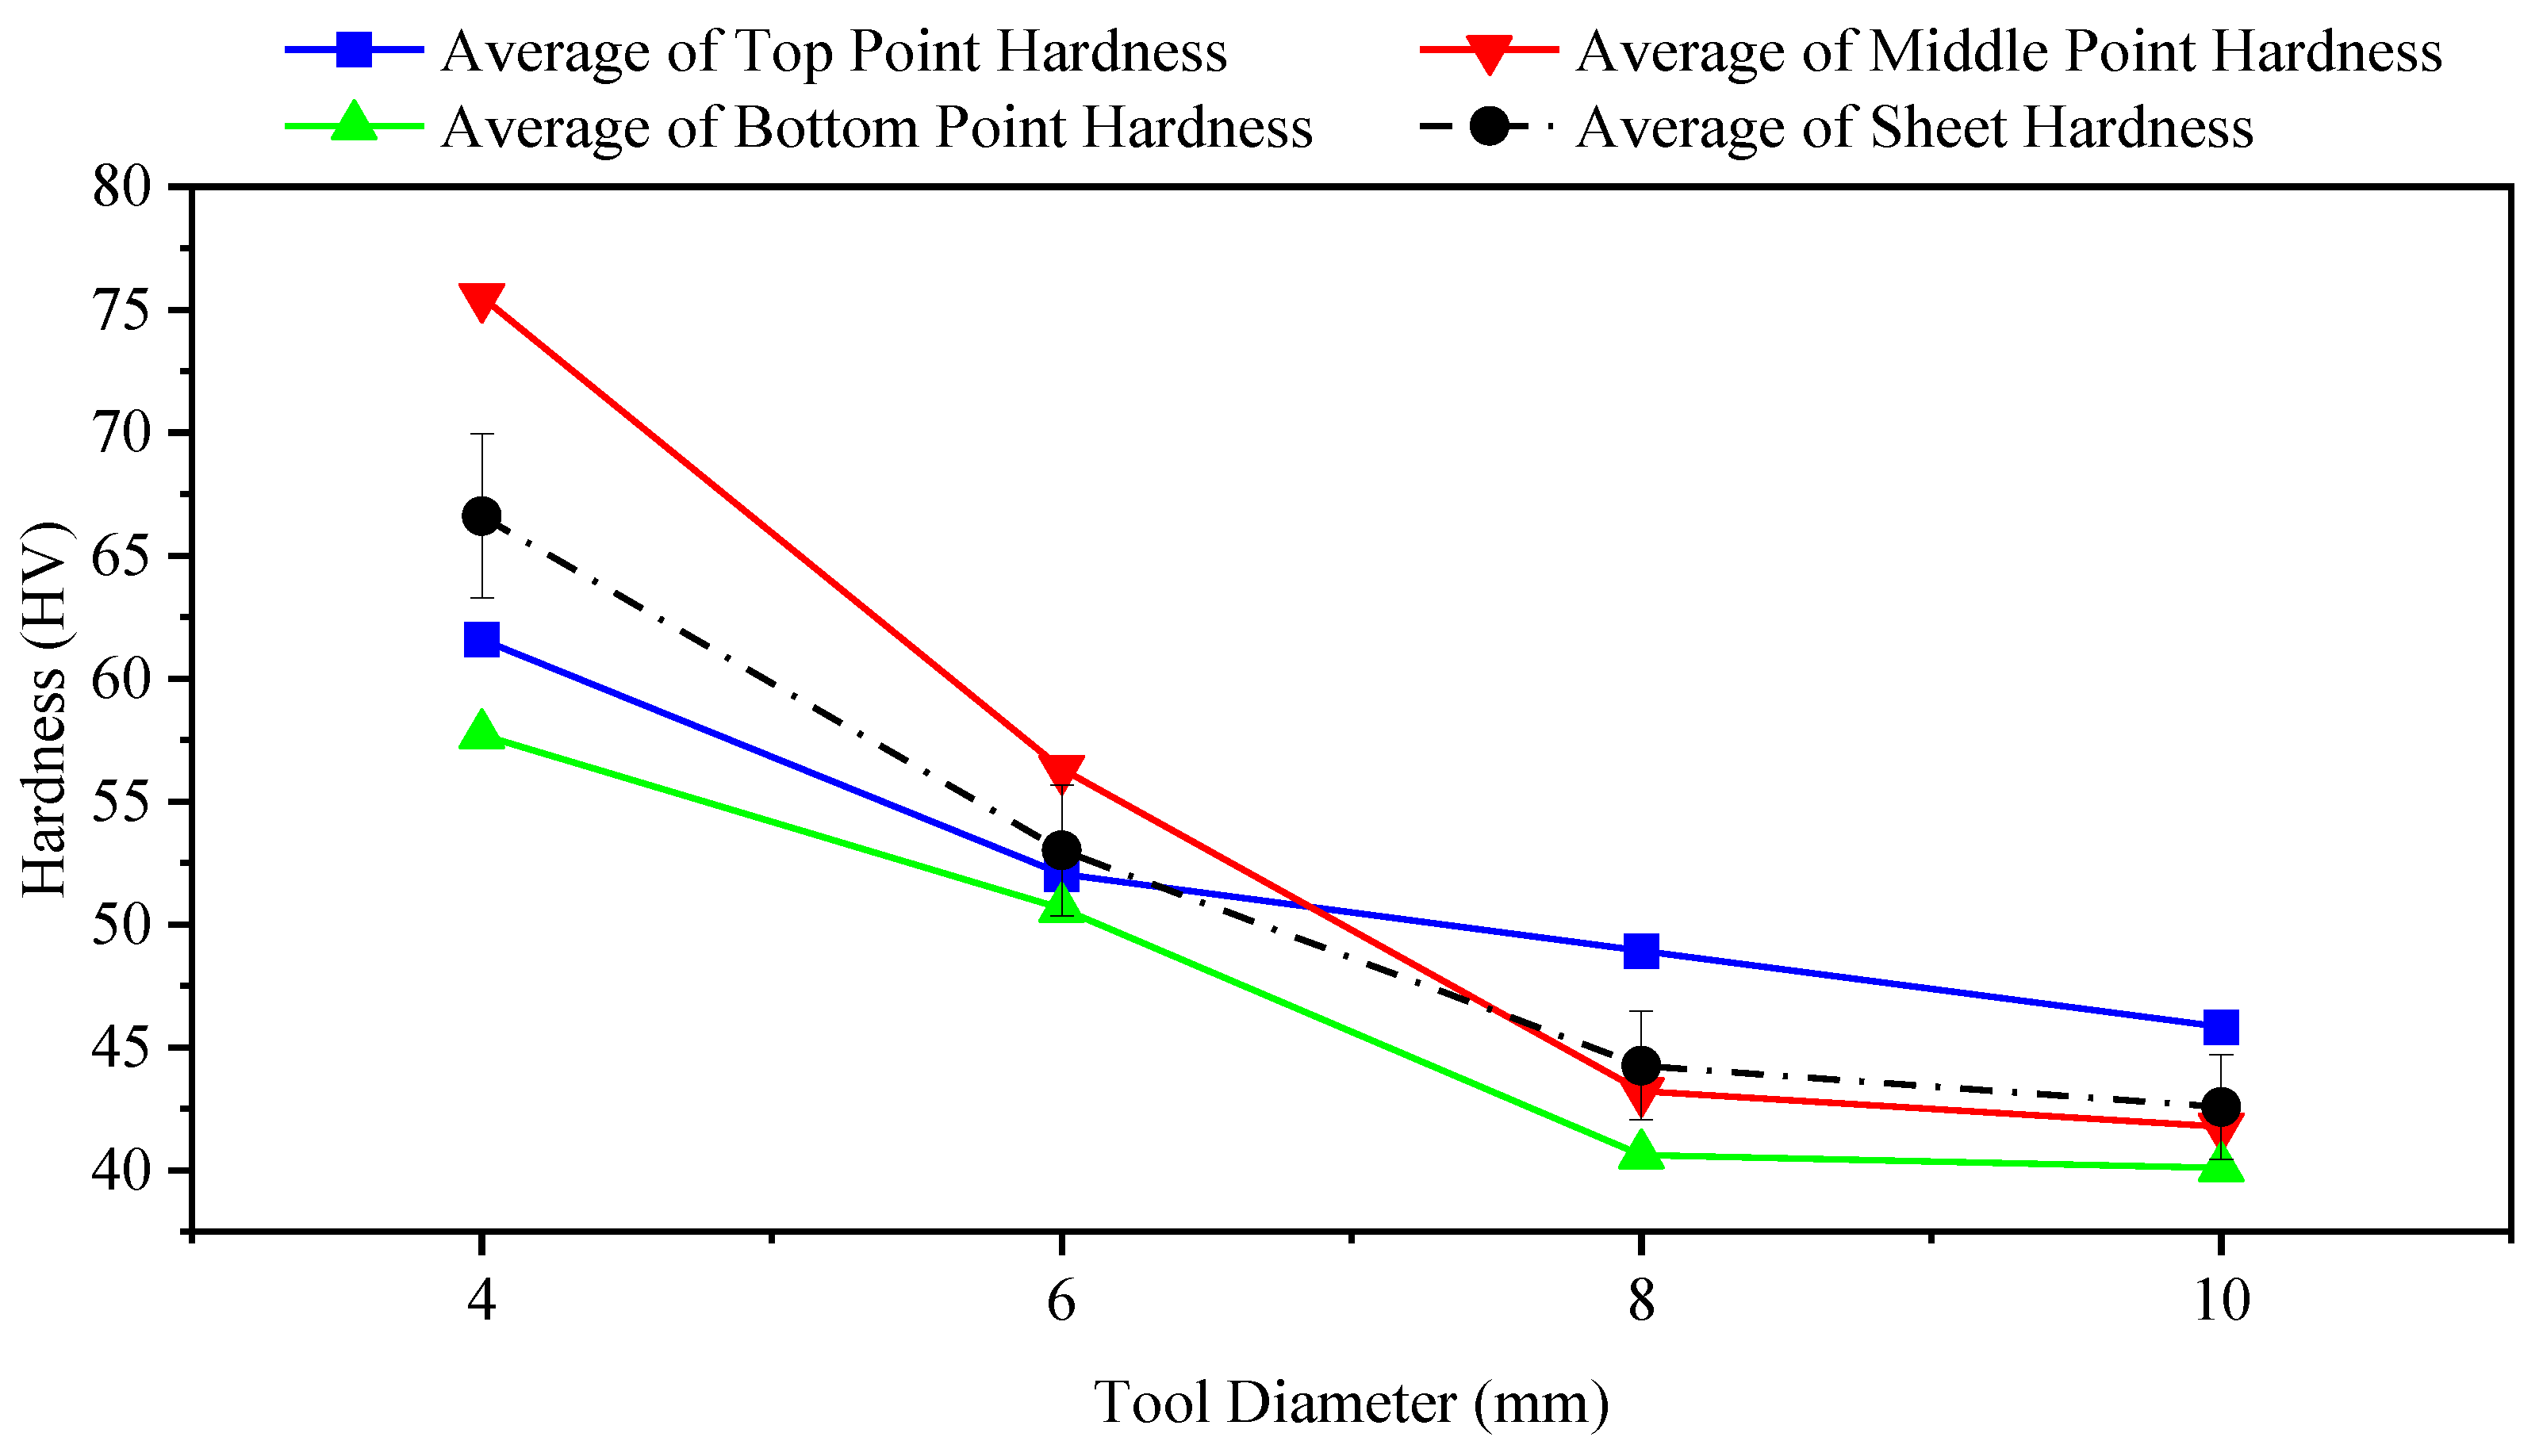
3.3. Tool Diameter
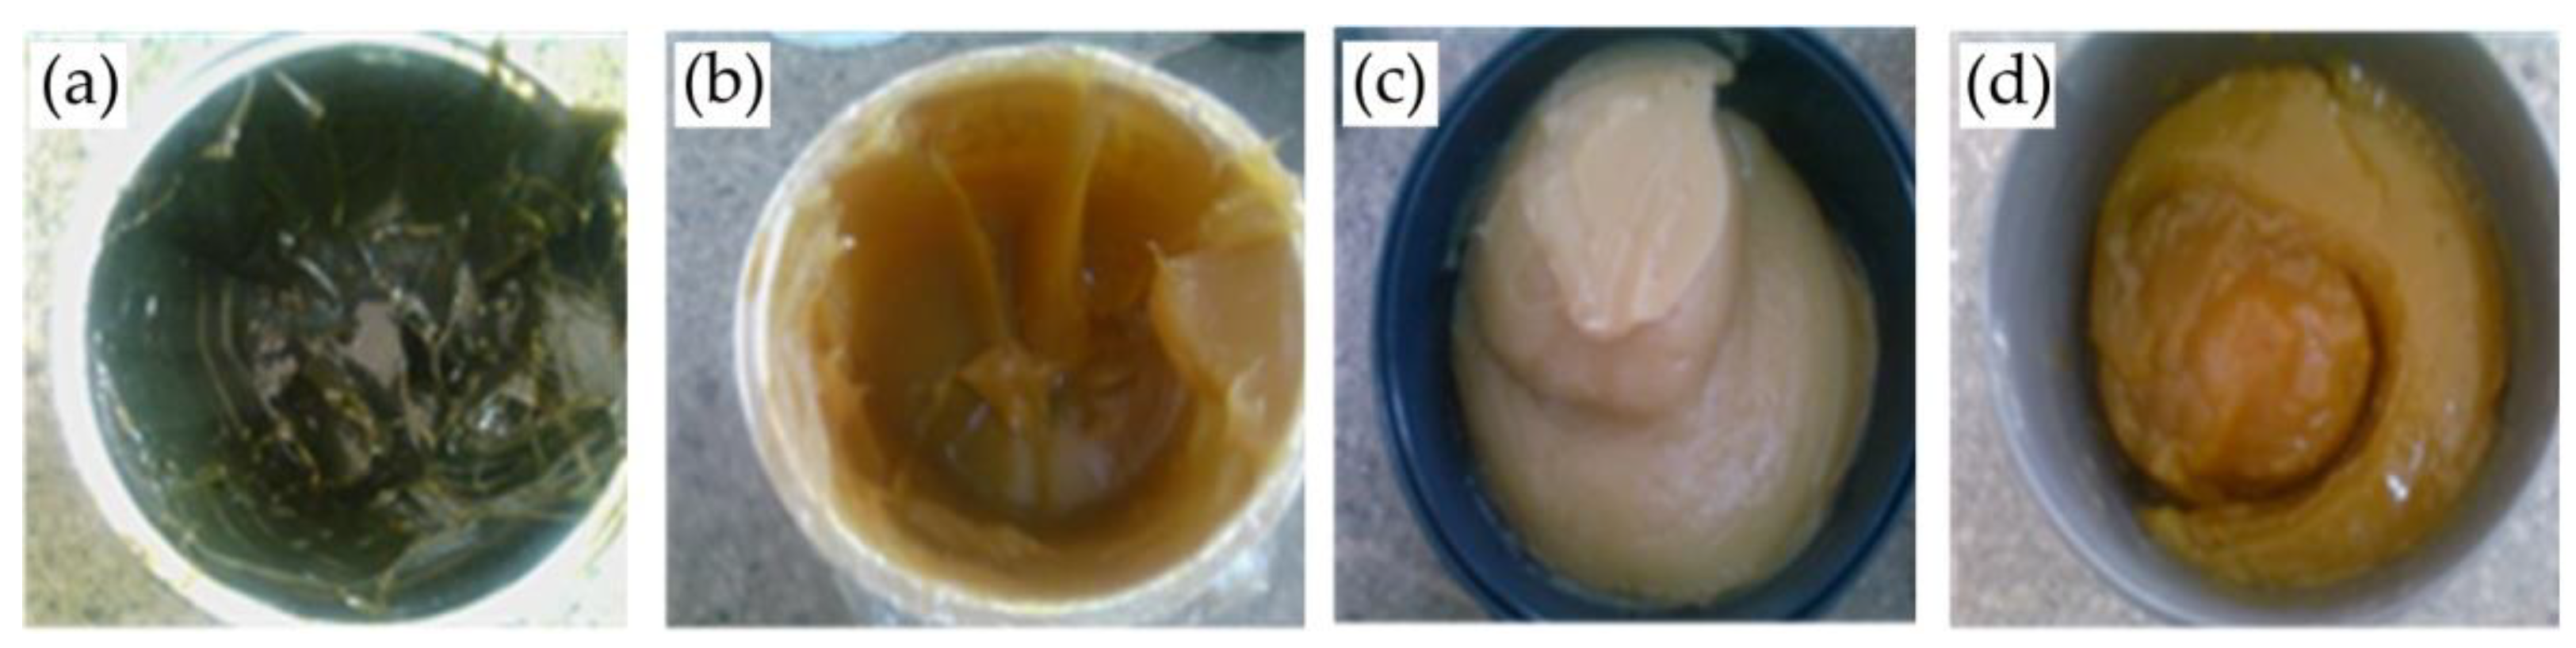
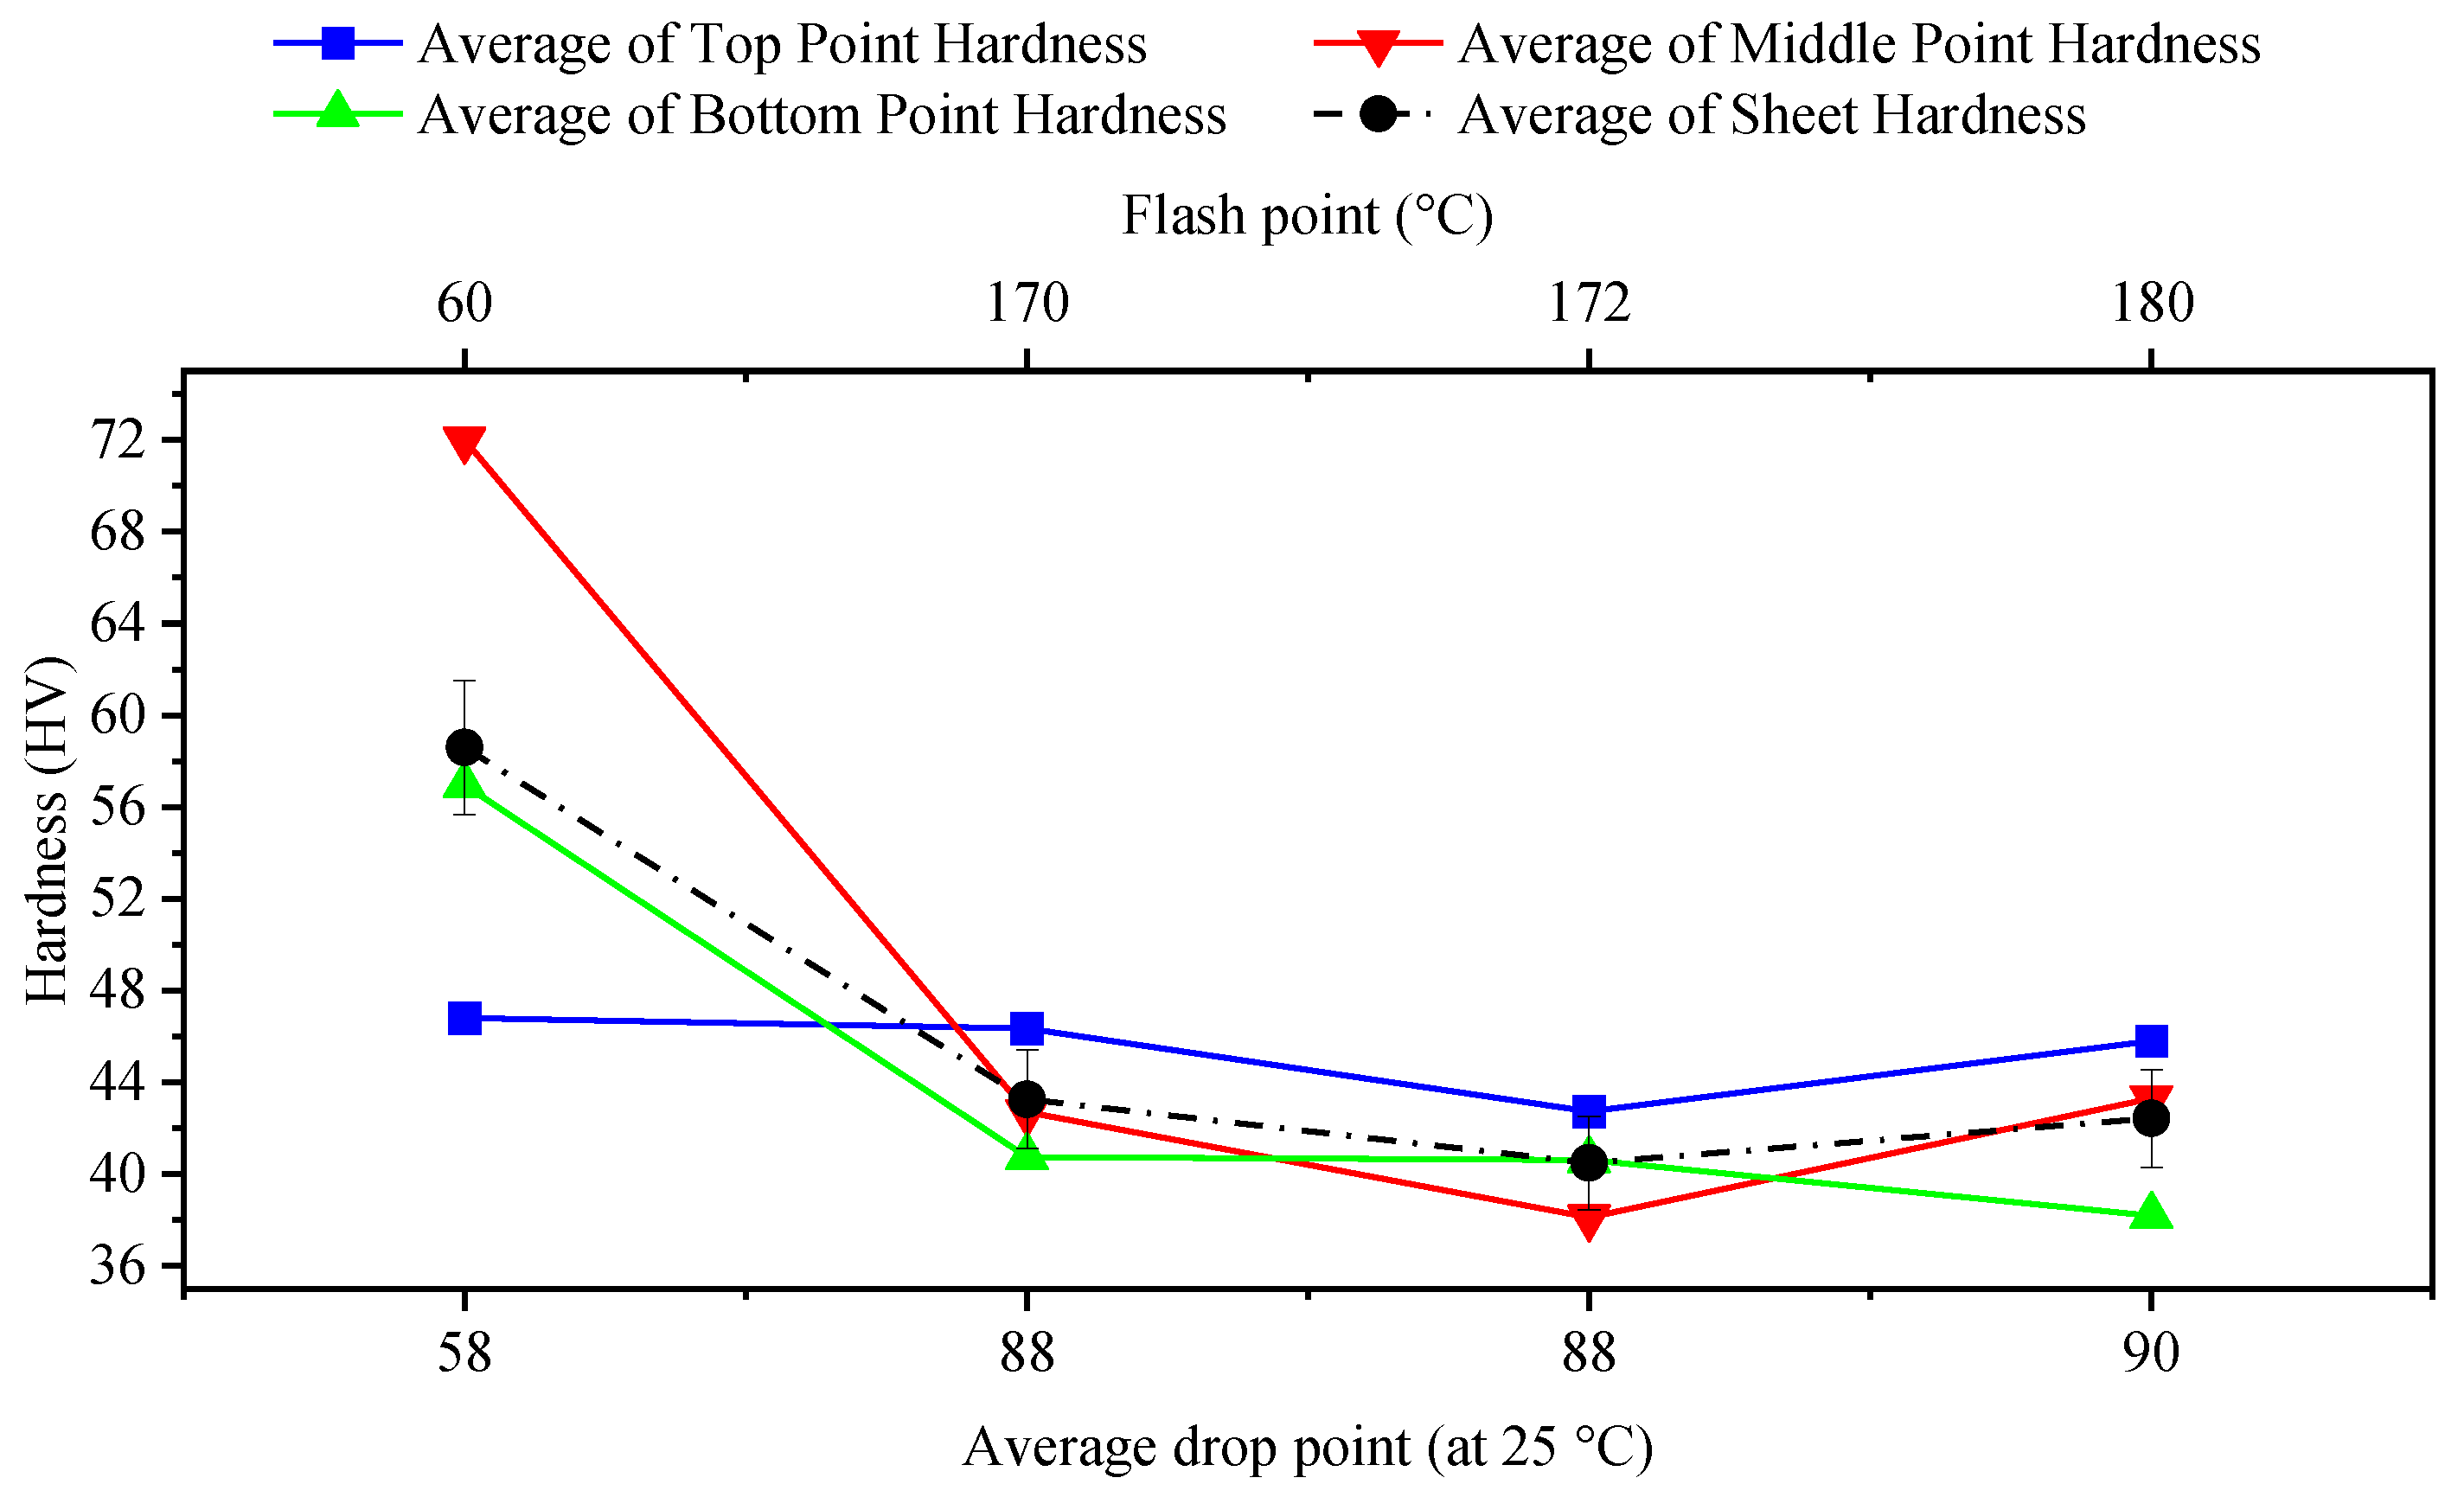
3.4. Grease Grade
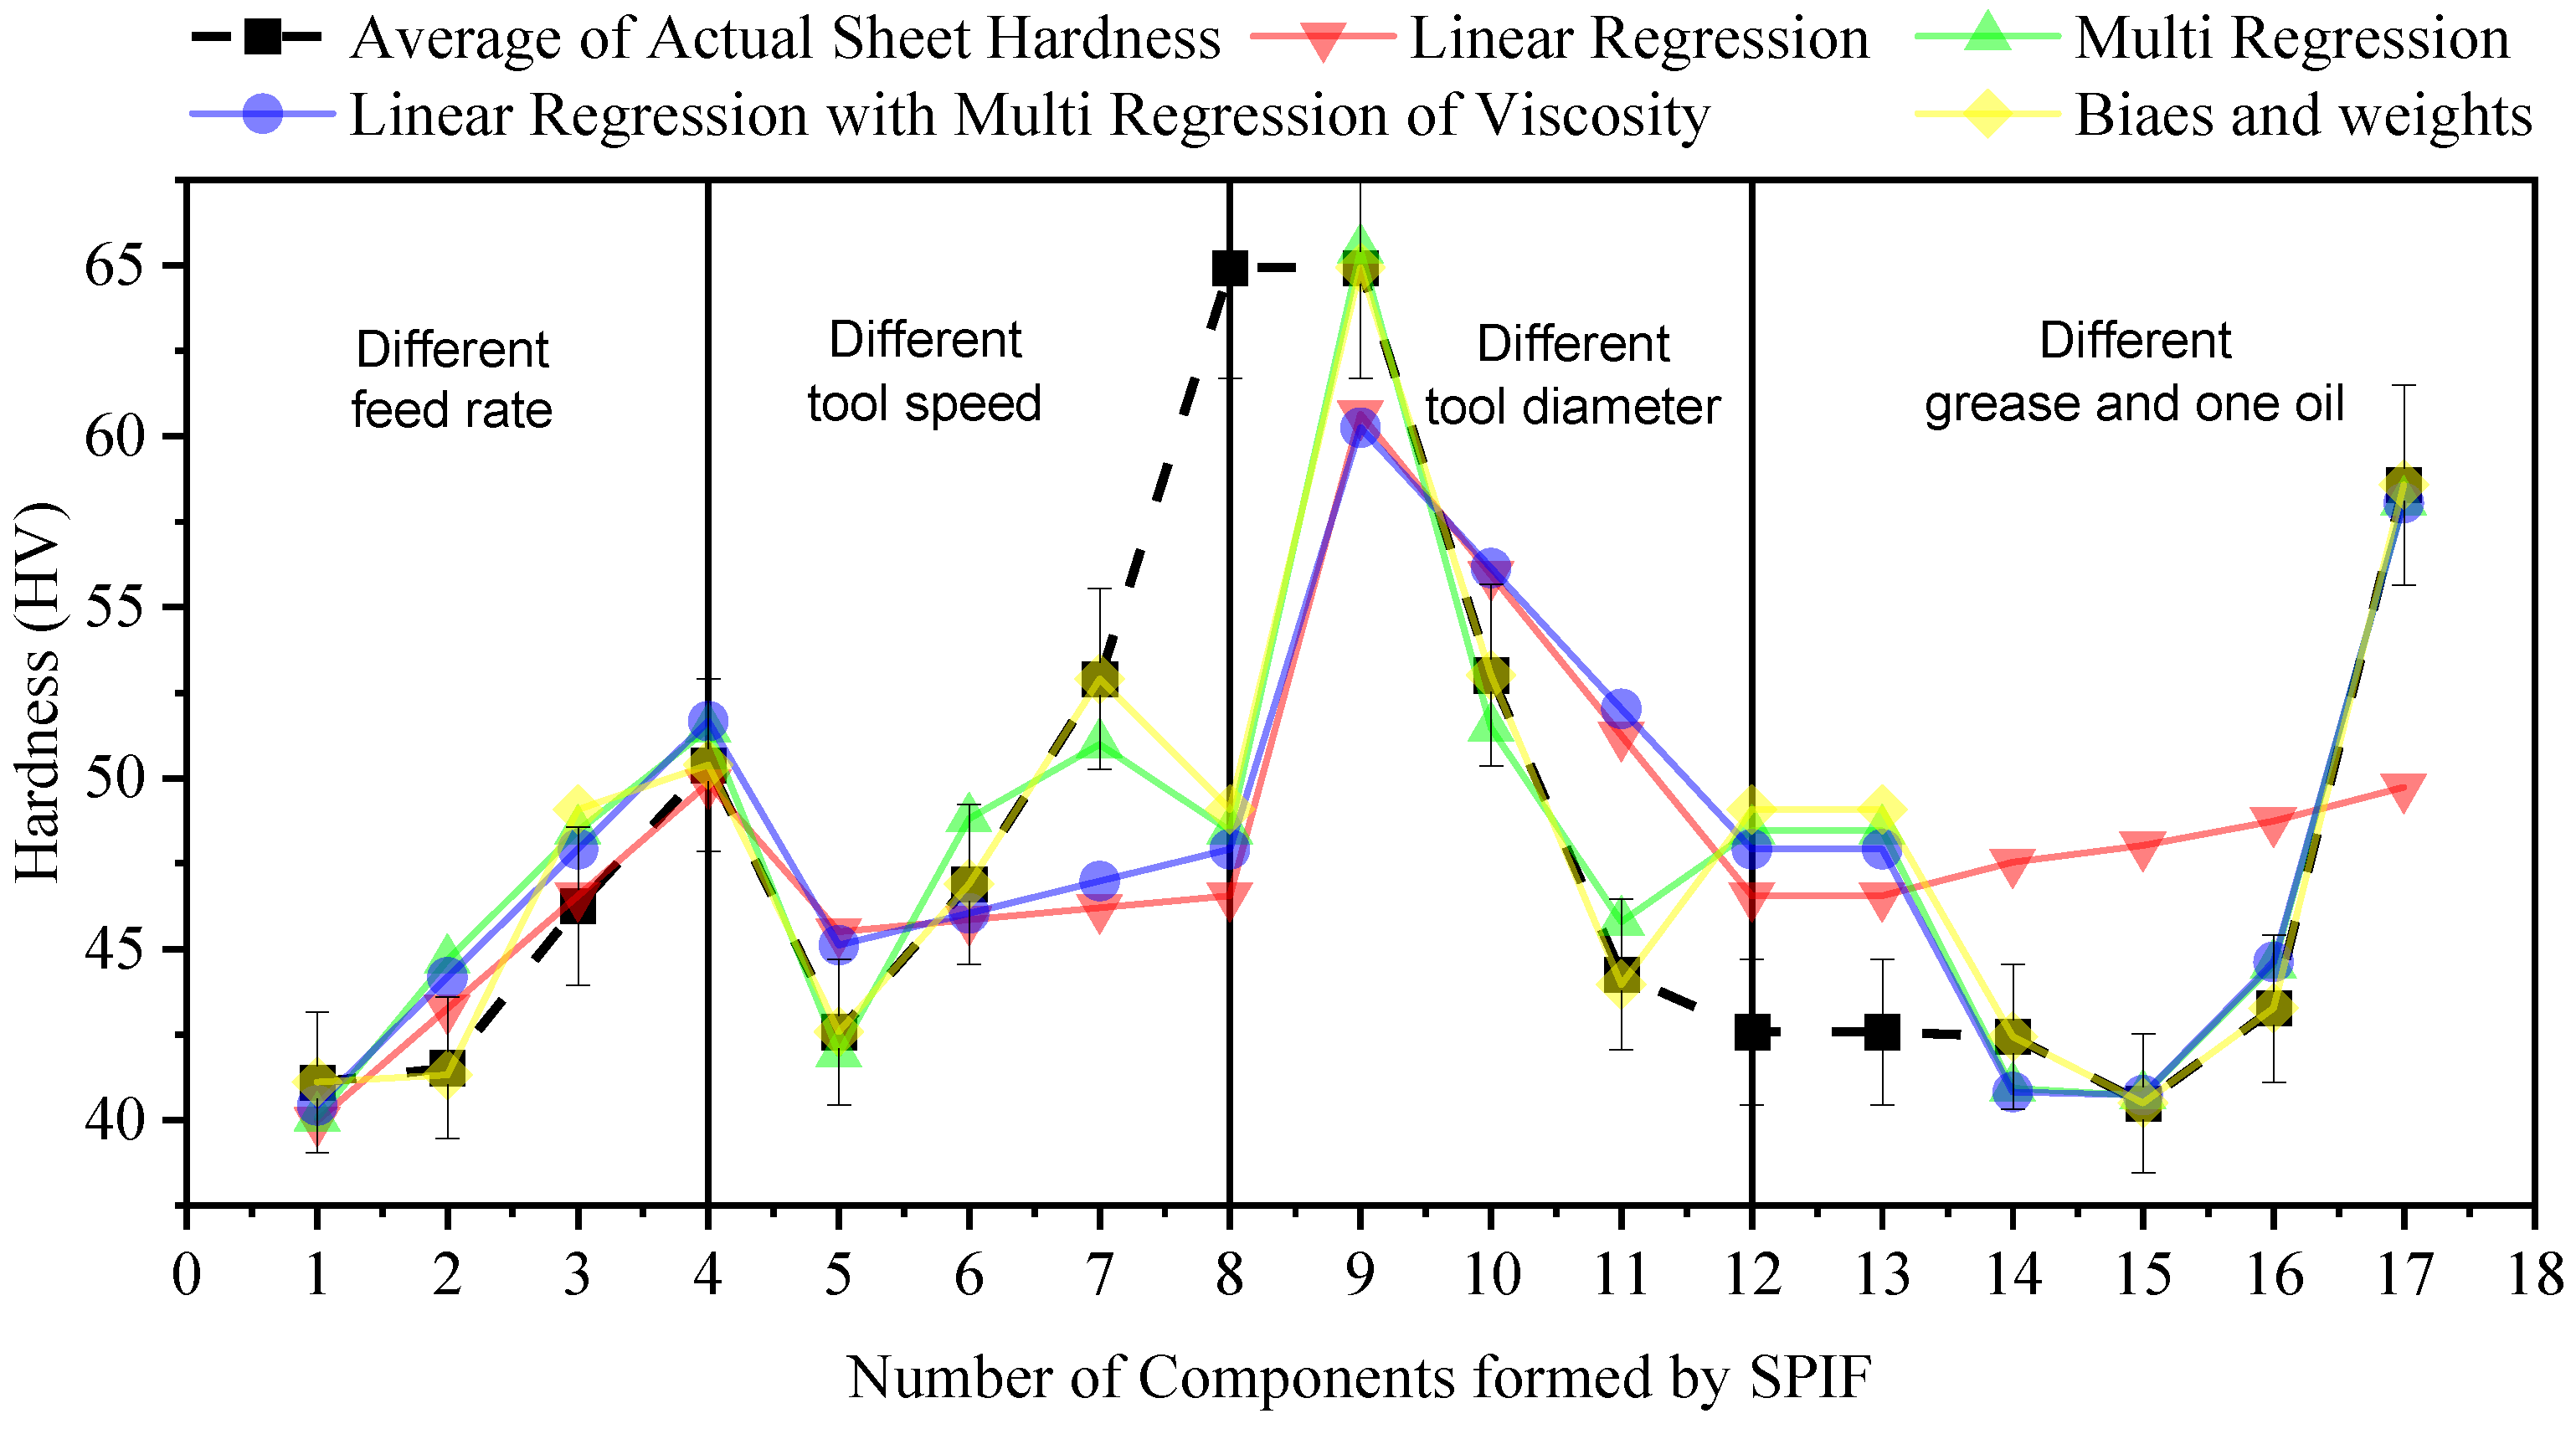
3.5. Regression Equations to Calculate the Hardness of SPIF Components
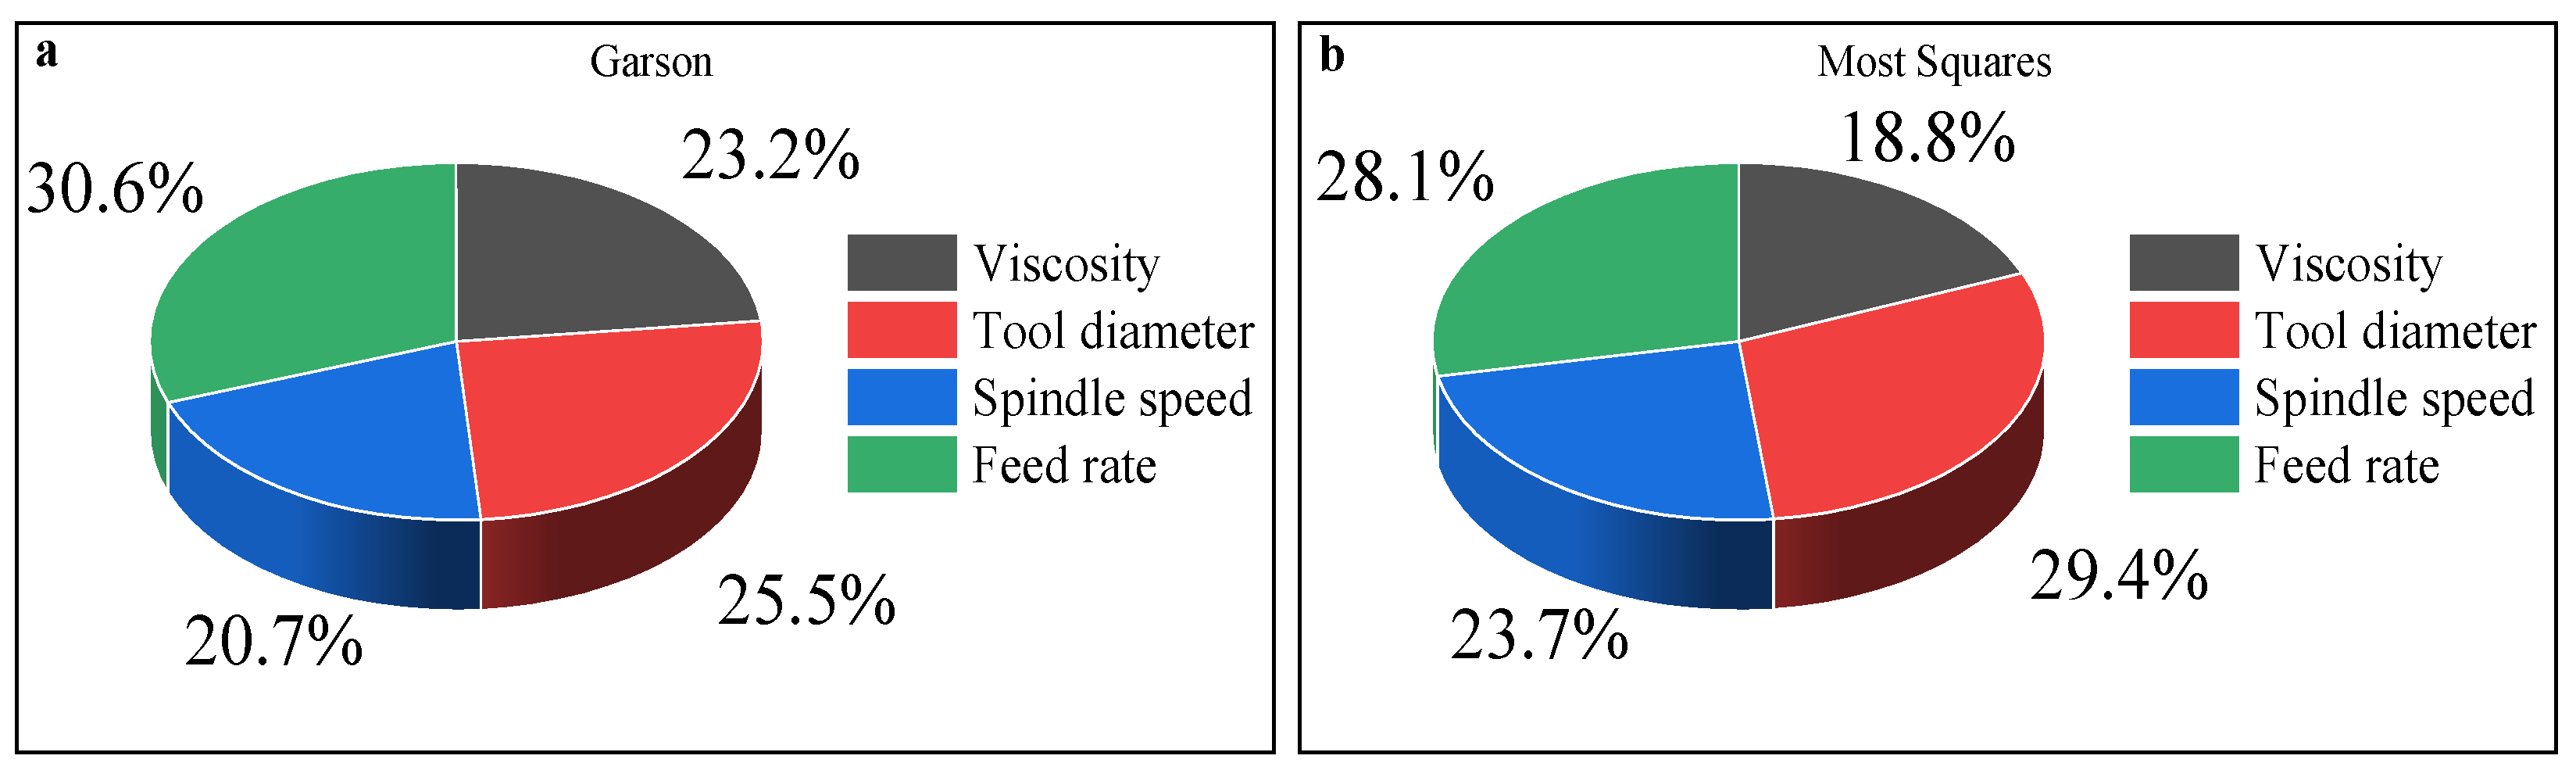
3.6. Contribution Analysis of Input Variables
4. Conclusions
- An increase in the feed rate increases hardness when coolant oil is used. Hardness decreases when grease is used (which happens by way of filling the grooves between asperities with debris carried by the grease).
- The hardness of the component increases when tool speed increases.
- Increases in tool diameter result in a decrease in the hardness of components.
- Grease properties are certain to affect hardness values.
- The use of grease instead of coolant oil generates homogeneous hardness values at different points of the same formed sheet.
5. Recommendations for Further Research
Author Contributions
Funding
Institutional Review Board Statement
Informed Consent Statement
Data Availability Statement
Acknowledgments
Conflicts of Interest
References
- Trzepieciński, T.; Oleksik, V.; Pepelnjak, T.; Najm, S.M.; Paniti, I.; Maji, K. Emerging Trends in Single Point Incremental Sheet Forming of Lightweight Metals. Metals 2021, 11, 1188. [Google Scholar] [CrossRef]
- Szpunar, M.; Ostrowski, R.; Trzepieciński, T.; Kaščák, Ľ. Central Composite Design Optimisation in Single Point Incremental Forming of Truncated Cones from Commercially Pure Titanium Grade 2 Sheet Metals. Materials 2021, 14, 3634. [Google Scholar] [CrossRef]
- Trzepieciński, T.; Najm, S.M.; Sbayti, M.; Belhadjsalah, H.; Szpunar, M.; Lemu, H.G. New Advances and Future Possibilities in Forming Technology of Hybrid Metal–Polymer Composites Used in Aerospace Applications. J. Compos. Sci. 2021, 5, 217. [Google Scholar] [CrossRef]
- Cooper, D.R.; Gutowski, T.G. Prospective Environmental Analyses of Emerging Technology: A Critique, a Proposed Methodology, and a Case Study on Incremental Sheet Forming. J. Ind. Ecol. 2020, 24, 38–51. [Google Scholar] [CrossRef]
- Dittrich, M.A.; Cao, J.; Roth, J.T.; Xia, Z.C.; Kiridena, V.; Ren, F.; Henning, H.; Gutowski, T.G. Exergy analysis of incremental sheet forming. Prod. Eng. 2012, 6, 169–177. [Google Scholar] [CrossRef] [Green Version]
- Ingarao, G.; Ambrogio, G.; Gagliardi, F.; Di Lorenzo, R. A sustainability point of view on sheet metal forming operations: Material wasting and energy consumption in incremental forming and stamping processes. J. Clean. Prod. 2012, 29–30, 255–268. [Google Scholar] [CrossRef]
- Emmens, W.C.; Sebastiani, G.; van den Boogaard, A.H. The technology of Incremental Sheet Forming—A brief review of the history. J. Mater. Process. Technol. 2010, 210, 981–997. [Google Scholar] [CrossRef] [Green Version]
- Li, Y.; Chen, X.; Liu, Z.; Sun, J.; Li, F.; Li, J.; Zhao, G. A review on the recent development of incremental sheet-forming process. Int. J. Adv. Manuf. Technol. 2017, 92, 2439–2462. [Google Scholar] [CrossRef]
- Behera, A.K.; de Sousa, R.A.; Ingarao, G.; Oleksik, O. Single point incremental forming: An assessment of the progress and technology trends from 2005 to 2015. J. Manuf. Process. 2017, 27, 37–62. [Google Scholar] [CrossRef] [Green Version]
- Raju, C.; Sathiya Narayanan, C. Application of a hybrid optimization technique in a multiple sheet single point incremental forming process. Measurement 2016, 78, 296–308. [Google Scholar] [CrossRef]
- Kumar, A.; Gulati, V.; Kumar, P.; Singh, V.; Kumar, B.; Singh, H. Parametric effects on formability of AA2024-O aluminum alloy sheets in single point incremental forming. J. Mater. Res. Technol. 2019, 8, 1461–1469. [Google Scholar] [CrossRef]
- Zavala, J.M.D.; Martínez-Romero, O.; Elías-Zúñiga, A.; Gutiérrez, H.M.L.; la Vega, A.E.; Taha-Tijerina, J. Study of Friction and Wear Effects in Aluminum Parts Manufactured via Single Point Incremental Forming Process Using Petroleum and Vegetable Oil-Based Lubricants. Materials 2021, 14, 3973. [Google Scholar] [CrossRef]
- Najm, S.M.; Paniti, I. Study on Effecting Parameters of Flat and Hemispherical end Tools in SPIF of Aluminium Foils. Teh. Vjesn.-Tech. Gaz. 2020, 27, 1844–1849. [Google Scholar] [CrossRef]
- Najm, S.M.; Paniti, I. Experimental Investigation on the Single Point Incremental Forming of AlMn1Mg1 Foils using Flat End Tools. IOP Conf. Ser. Mater. Sci. Eng. 2018, 448, 012032. [Google Scholar] [CrossRef]
- Paniti, I. Adaptation of Incremental Sheet Forming into cloud manufacturing. CIRP J. Manuf. Sci. Technol. 2014, 7, 185–190. [Google Scholar] [CrossRef] [Green Version]
- Fratini, L.; Ambrogio, G.; Di Lorenzo, R.; Filice, L.; Micari, F. Influence of mechanical properties of the sheet material on formability in single point incremental forming. CIRP Ann. 2004, 53, 207–210. [Google Scholar] [CrossRef]
- Zhang, S.; Tang, G.H.; Wang, W.; Jiang, X. Evaluation and optimization on the formability of an AZ31B Mg alloy during warm incremental sheet forming assisted with oil bath heating. Measurement 2020, 157, 107673. [Google Scholar] [CrossRef]
- Liu, Z.; Li, Y.; Meehan, P.A. Experimental investigation of mechanical properties, formability and force measurement for AA7075-O aluminum alloy sheets formed by incremental forming. Int. J. Precis. Eng. Manuf. 2013, 14, 1891–1899. [Google Scholar] [CrossRef]
- Li, Y.; Chen, X.; Zhai, W.; Wang, L.; Li, J.; Guoqun, Z. Effects of process parameters on thickness thinning and mechanical properties of the formed parts in incremental sheet forming. Int. J. Adv. Manuf. Technol. 2018, 98, 3071–3080. [Google Scholar] [CrossRef]
- Manco, L.; Filice, L.; Ambrogio, G. Analysis of the thickness distribution varying tool trajectory in single-point incremental forming. Proc. Inst. Mech. Eng. Part B J. Eng. Manuf. 2011, 225, 348–356. [Google Scholar] [CrossRef]
- Krasowski, B.; Kubit, A.; Trzepieciński, T.; Slota, J. Experimental Analysis of Single Point Incremental Forming of Truncated Cones in DC04 Steel Sheet. Adv. Mater. Sci. 2020, 20, 5–15. [Google Scholar] [CrossRef]
- Zain, A.M.; Haron, H.; Sharif, S. Prediction of surface roughness in the end milling machining using Artificial Neural Network. Expert Syst. Appl. 2010, 37, 1755–1768. [Google Scholar] [CrossRef]
- Amirjan, M.; Khorsand, H.; Siadati, M.H.; Eslami Farsani, R. Artificial Neural Network prediction of Cu–Al2O3 composite properties prepared by powder metallurgy method. J. Mater. Res. Technol. 2013, 2, 351–355. [Google Scholar] [CrossRef] [Green Version]
- Ezugwu, E.O.; Fadare, D.A.; Bonney, J.; Da Silva, R.B.; Sales, W.F. Modelling the correlation between cutting and process parameters in high-speed machining of Inconel 718 alloy using an artificial neural network. Int. J. Mach. Tools Manuf. 2005, 45, 1375–1385. [Google Scholar] [CrossRef]
- Li, E. Reduction of springback by intelligent sampling-based LSSVR metamodel-based optimization. Int. J. Mater. Form. 2013, 6, 103–114. [Google Scholar] [CrossRef]
- Marouani, H.; Aguir, H. Identification of material parameters of the Gurson–Tvergaard–Needleman damage law by combined experimental, numerical sheet metal blanking techniques and artificial neural networks approach. Int. J. Mater. Form. 2012, 5, 147–155. [Google Scholar] [CrossRef]
- Lela, B.; Bajić, D.; Jozić, S. Regression analysis, support vector machines, and Bayesian neural network approaches to modeling surface roughness in face milling. Int. J. Adv. Manuf. Technol. 2009, 42, 1082–1088. [Google Scholar] [CrossRef]
- Hussaini, S.M.; Singh, S.K.; Gupta, A.K. Experimental and numerical investigation of formability for austenitic stainless steel 316 at elevated temperatures. J. Mater. Res. Technol. 2014, 3, 17–24. [Google Scholar] [CrossRef] [Green Version]
- Kondayya, D.; Gopala Krishna, A. An integrated evolutionary approach for modelling and optimization of laser beam cutting process. Int. J. Adv. Manuf. Technol. 2013, 65, 259–274. [Google Scholar] [CrossRef]
- Trzepieciński, T.; Kubit, A.; Dzierwa, A.; Krasowski, B.; Jurczak, W. Surface Finish Analysis in Single Point Incremental Sheet Forming of Rib-Stiffened 2024-T3 and 7075-T6 Alclad Aluminium Alloy Panels. Materials 2021, 14, 1640. [Google Scholar] [CrossRef] [PubMed]
- Najm, S.M.; Paniti, I. Artificial neural network for modeling and investigating the effects of forming tool characteristics on the accuracy and formability of thin aluminum alloy blanks when using SPIF. Int. J. Adv. Manuf. Technol. 2021, 114, 2591–2615. [Google Scholar] [CrossRef]
- Najm, S.M.; Paniti, I. Predict the Effects of Forming Tool Characteristics on Surface Roughness of Aluminum Foil Components Formed by SPIF Using ANN and SVR. Int. J. Precis. Eng. Manuf. 2021, 22, 13–26. [Google Scholar] [CrossRef]
- Baruah, A.; Pandivelan, C.; Jeevanantham, A.K. Optimization of AA5052 in incremental sheet forming using grey relational analysis. Measurement 2017, 106, 95–100. [Google Scholar] [CrossRef]
- Kumar, A.; Gulati, V. Experimental investigations and optimization of forming force in incremental sheet forming. Sādhanā 2018, 43, 159. [Google Scholar] [CrossRef] [Green Version]
- Kumar, A.; Gulati, V. Experimental investigation and optimization of surface roughness in negative incremental forming. Measurement 2019, 131, 419–430. [Google Scholar] [CrossRef]
- Al-Attaby, Q.M.D.; Abaas, T.F.; Bedan, A.S. The Effect of Tool Path Strategy on Mechanical Properties of Brass (65–35) in Single Point Incremental Sheet Metal Forming (SPIF). J. Eng. 2013, 19, 629–637. [Google Scholar]
- Mostafanezhad, H.; Menghari, H.G.; Esmaeili, S.; Shirkharkolaee, E.M. Optimization of two-point incremental forming process of AA1050 through response surface methodology. Measurement 2018, 127, 21–28. [Google Scholar] [CrossRef]
- Premkumar, R.; Vignesh, R.V.; Padmanaban, R.; Govindaraju, M.; Santhi, R. Investigation on the microstructure, microhardness, and tribological behavior of AA1100-hBN surface composite. Koroze A Ochr. Mater. 2021, 65, 1–11. [Google Scholar] [CrossRef]
- Song, X.; Zhang, J.; Zhai, W.; Taureza, M.; Castagne, S.; Danno, A. Numerical and experimental investigation on the deformation mechanism of micro single point incremental forming process. J. Manuf. Process. 2018, 36, 248–254. [Google Scholar] [CrossRef]
- Kaufman, J.G. Applications for aluminum alloys and tempers. In Introduction to Aluminum Alloys and Tempers; ASM International: Materials Park, OH, USA, 2000; Volume 1100, p. 242. [Google Scholar]
- Alcotec.com. Understanding the Alloys of Aluminum. 2021. Available online: http://www.alcotec.com/us/en/education/knowledge/techknowledge/understanding-the-alloys-of-aluminum.cfm (accessed on 19 November 2021).
- Training, A.; Maintenance, B.; Schools, A.; Books, A.; Jar, T.; Repair, A. Aluminum Alloys. Flight-Mechanic.com. 2021. Available online: https://www.flight-mechanic.com/aluminum-alloys/ (accessed on 19 November 2021).
- Davis, J.R. Aluminum and Aluminum Alloys; ASM Int.: Materials Park, OH, USA, 2001; pp. 351–416. [Google Scholar] [CrossRef] [Green Version]
- Committee, A.I.H. ASM Handbook Volume 2: Properties and Selection: Nonferrous Alloys and Special-Purpose Materials; ASM International: Materials Park, OH, USA, 1990. [Google Scholar]
- Kumar, A.; Gulati, V. Optimization and investigation of process parameters in single point incremental forming. Indian J. Eng. Mater. Sci. 2020, 27, 246–255. [Google Scholar]
- Skjoedt, M.; Hancock, M.H.; Bay, N. Creating Helical Tool Paths for Single Point Incremental Forming. Key Eng. Mater. 2007, 344, 583–590. [Google Scholar] [CrossRef]
- United States Environmental Protection Agency; Office of Wastewater Management Washington. Environmentally Acceptable Lubricants. In Encyclopedia of Lubricants and Lubrication; Springer: Berlin/Heidelberg, Germany, 2014; p. 526. [Google Scholar]
- IS0 3448:1992(E). Industrial Liquid Lubricants—IS0 Viscosity Classification; International Organization for Standardization: Geneva, Switzerland, 1992. [Google Scholar]
- Syahrullail, S.; Kamitani, S.; Shakirin, A. Performance of Vegetable Oil as Lubricant in Extreme Pressure Condition. Procedia Eng. 2013, 68, 172–177. [Google Scholar] [CrossRef]
- Diabb, J.; Rodríguez, C.A.; Mamidi, N.; Sandoval, J.A.; Taha-Tijerina, J.; Martínez-Romero, O.; Elías-Zúñiga, A. Study of lubrication and wear in single point incremental sheet forming (SPIF) process using vegetable oil nanolubricants. Wear 2017, 376–377, 777–785. [Google Scholar] [CrossRef]
- Nama, S.A.; Namer, N.S.M.; Najm, S.M. The Effect of using Grease on the Surface Roughness of Aluminum 1100 Sheet during the Single Point Incremental Forming Process. J. Trends Mach. Des. 2014, 1, 53–56. [Google Scholar]
- Kim, Y.; Park, J. Effect of process parameters on formability in incremental forming of sheet metal. J. Mater. Process. Technol. 2002, 130, 42–46. [Google Scholar] [CrossRef]
- Hol, J.; Meinders, V.T.; Geijselaers, H.J.M.; Van Den Boogaard, A.H. Multi-scale friction modeling for sheet metal forming: The mixed lubrication regime. Tribol. Int. 2015, 85, 10–25. [Google Scholar] [CrossRef]
- McAnulty, T.; Jeswiet, J.; Doolan, M. Formability in single point incremental forming: A comparative analysis of the state of the art. CIRP J. Manuf. Sci. Technol. 2017, 16, 43–54. [Google Scholar] [CrossRef]
- Asgari, A.; Sedighi, M.; Riahi, M. Investigation of Punching Parameters Effect on Mechanical Properties of Al-1100-O in Incremental Sheet Metal Hammering Process. Strength Mater. 2015, 47, 882–889. [Google Scholar] [CrossRef]
- Shrivastava, P.; Tandon, P. Investigation of the Effect of Grain Size on Forming Forces in Single Point Incremental Sheet Forming. Procedia Manuf. 2015, 2, 41–45. [Google Scholar] [CrossRef] [Green Version]
- Misra, S.; He, J. Stacked neural network architecture to model the multifrequency conductivity/permittivity responses of subsurface shale formations. In Machine Learning for Subsurface Characterization, 1st ed.; Misra, S., Li, H., He, J., Eds.; Elsevier Inc.: Amsterdam, The Netherlands, 2020; pp. 103–127. [Google Scholar]
- Garson, G.D. Interpreting Neural-Network Connection Weights. AI Expert 1991, 6, 46–51. [Google Scholar]
- Ibrahim, O.M. A comparison of methods for assessing the relative importance of input variables in artificial neural networks. J. Appl. Sci. Res. 2013, 9, 5692–5700. [Google Scholar]
- Beale, M.H.; Hagan, M.; Demuth, H. Deep Learning Toolbox Getting Started Guide. In Deep Learn. Toolbox; The MathWorks Inc.: Natick, MA, USA, 2019. [Google Scholar] [CrossRef]
- Riedmiller, P.M. Machine Learning: Multi Layer Perceptrons. Albert-Ludwigs-University Freibg. AG Maschinelles Lernen. Available online: http://ml.informatik.uni-freiburg.de/_media/documents/teaching/ss09/ml/mlps.pdf (accessed on 10 October 2021).
- Zarei, M.J.; Ansari, H.R.; Keshavarz, P.; Zerafat, M.M. Prediction of pool boiling heat transfer coefficient for various nano-refrigerants utilizing artificial neural networks. J. Therm. Anal. Calorim. 2020, 139, 3757–3768. [Google Scholar] [CrossRef]
- Ding, H.; Luo, W.; Yu, Y.; Chen, B. Construction of a Robust Cofactor Self-Sufficient Bienzyme Biocatalytic System for Dye Decolorization and its Mathematical Modeling. Int. J. Mol. Sci. 2019, 20, 6104. [Google Scholar] [CrossRef] [PubMed] [Green Version]
- Zhou, B.; Vogt, R.D.; Lu, X.; Xu, C.; Zhu, L.; Shao, X.; Liu, H.; Xing, M. Relative Importance Analysis of a Refined Multi-parameter Phosphorus Index Employed in a Strongly Agriculturally Influenced Watershed. Water Air Soil Pollut. 2015, 226, 25. [Google Scholar] [CrossRef]
- Shabanzadeh, P.; Yusof, R.; Shameli, K. Artificial neural network for modeling the size of silver nanoparticles’ prepared in montmorillonite/starch bionanocomposites. J. Ind. Eng. Chem. 2015, 24, 42–50. [Google Scholar] [CrossRef]
- Vatankhah, E.; Semnani, D.; Prabhakaran, M.P.; Tadayon, M.; Razavi, S.; Ramakrishna, S. Artificial neural network for modeling the elastic modulus of electrospun polycaprolactone/gelatin scaffolds. Acta Biomater. 2014, 10, 709–721. [Google Scholar] [CrossRef]
- Rezakazemi, M.; Razavi, S.; Mohammadi, T.; Nazari, A.G. Simulation and determination of optimum conditions of pervaporative dehydration of isopropanol process using synthesized PVA–APTEOS/TEOS nanocomposite membranes by means of expert systems. J. Memb. Sci. 2011, 379, 224–232. [Google Scholar] [CrossRef]
- Goh, A.T.C. Back-propagation neural networks for modeling complex systems. Artif. Intell. Eng. 1995, 9, 143–151. [Google Scholar] [CrossRef]
- Nabipour, M.; Keshavarz, P. Modeling surface tension of pure refrigerants using feed-forward back-propagation neural networks. Int. J. Refrig. 2017, 75, 217–227. [Google Scholar] [CrossRef]


| Property | Ultimate Tensile Stress, MPa | Yield Strength, MPa | Elongation, % |
|---|---|---|---|
| Actual | 110 | 95 | 20 |
| Nominal | 110 | 103 | 25 |
| Standard Deviation, σ | 0 | 4 | 2.5 |
| Element | Si | Fe | Cu | Mn | Mg | Cr | Ni | Zn | Ti | Pb | B | Sn | V | Al |
|---|---|---|---|---|---|---|---|---|---|---|---|---|---|---|
| Actual | 0.110 | 0.482 | 0.004 | 0.005 | 0.001 | 0.0005 | 0.004 | 0.021 | 0.021 | 0.0005 | 0.003 | 0.001 | 0.014 | balance |
| Nominal | 0.5 | 0.5 | 0.2 | 0.04 | 0.01 | Other 0.15 max | balance | |||||||
| Grease Type | ISO Viscosity Grade | Average Dropping Point, °C (at 25 °C) | Flash Point, °C | Viscosity at 40 °C, mm2/s |
|---|---|---|---|---|
| EP2 | ISO VG 15 | 90 | 180 | 15 |
| Kaucuklu | ISO VG 22 | 88 | 172 | 22 |
| Zinol | ISO VG 32 | 88 | 170 | 32 |
| Gp Grease Calcium | ISO VG 46 | 58 | 60 | 46 |
| Acidity, pH | Kinematic Viscosity at 29 °C, mm2/s | Boiling Point, °C |
|---|---|---|
| 1.086 | 1.086 | 95 |
| Feed Rate, mm/min | Hardness HV | |||||||
|---|---|---|---|---|---|---|---|---|
| Coolant Oil | Grease | |||||||
| Top | Middle | Bottom | Standard Deviation, σ | Top | Middle | Bottom | Standard Deviation, σ | |
| 200 | 43.89 | 40.40 | 39.02 | 2.0494 | 63.30 | 58.61 | 50.56 | 5.2610 |
| 400 | 39.16 | 43.61 | 41.78 | 1.8262 | 59.80 | 56.70 | 49.13 | 4.4816 |
| 600 | 44.08 | 46.44 | 48.22 | 1.6957 | 51.29 | 53.17 | 44.70 | 3.6317 |
| 800 | 47.76 | 53.84 | 49.54 | 2.5522 | 43.99 | 45.72 | 45.50 | 0.7689 |
| Tool Speed, rpm | Hardness HV | |||
|---|---|---|---|---|
| Top | Middle | Bottom | Standard Deviation, σ | |
| 500 | 45.83 | 41.78 | 40.10 | 2.4050 |
| 1000 | 50.50 | 47.48 | 42.75 | 3.1895 |
| 1500 | 56.83 | 55.96 | 45.90 | 4.9601 |
| 2000 | 61.58 | 75.51 | 57.71 | 7.6439 |
| Tool Diameter, mm | Hardness HV | |||
|---|---|---|---|---|
| Top | Middle | Bottom | Standard Deviation, σ | |
| 4 | 75.51 | 57.71 | 66.61 | 7.2668 |
| 6 | 56.33 | 50.65 | 53.01 | 2.3299 |
| 8 | 43.22 | 40.62 | 44.26 | 1.5308 |
| 10 | 41.78 | 40.10 | 42.57 | 1.0300 |
| Grease Type | ISO Viscosity Grade | Average Dropping Point (at 25 °C) | Flash Point, °C | Hardness HV | |||
|---|---|---|---|---|---|---|---|
| Top | Middle | Bottom | Standard Deviation, σ | ||||
| Gp Grease Calcium | ISO VG 15 | 58 | 60 | 46.81 | 72.00 | 56.95 | 10.3487 |
| Zinol | ISO VG 22 | 88 | 170 | 46.34 | 42.70 | 40.74 | 2.3202 |
| Kaucuklu | ISO VG 32 | 88 | 172 | 42.73 | 38.12 | 40.62 | 1.8843 |
| EP2 | ISO VG 46 | 90 | 180 | 45.81 | 43.30 | 38.18 | 3.1751 |
| Validation Metric | Linear Cross-Validation Regression | Linear Cross-Validation with Multiple Regression of Viscosity | Multiple Regression | Equation Based on Biases and Weights |
|---|---|---|---|---|
| Mean Error | 0.0000 | 0.0000 | −0.0002 | −0.0306 |
| Mean Absolute Error | 4.8183 | 3.6826 | 2.7811 | 1.8954 |
| Mean Square Error | 40.9419 | 29.2784 | 22.0436 | 20.2431 |
| Root Mean Square Error | 6.3986 | 5.4110 | 4.6951 | 4.4992 |
| Mean Relative Error | 0.0963 | 0.0727 | 0.0555 | 0.0367 |
| Standard Deviation, σ | 6.5955 | 5.5775 | 4.8396 | 4.6376 |
| Standard Error of Mean | 1.5996 | 1.3527 | 1.1738 | 1.1248 |
Publisher’s Note: MDPI stays neutral with regard to jurisdictional claims in published maps and institutional affiliations. |
© 2021 by the authors. Licensee MDPI, Basel, Switzerland. This article is an open access article distributed under the terms and conditions of the Creative Commons Attribution (CC BY) license (https://creativecommons.org/licenses/by/4.0/).
Share and Cite
Najm, S.M.; Paniti, I.; Trzepieciński, T.; Nama, S.A.; Viharos, Z.J.; Jacso, A. Parametric Effects of Single Point Incremental Forming on Hardness of AA1100 Aluminium Alloy Sheets. Materials 2021, 14, 7263. https://0-doi-org.brum.beds.ac.uk/10.3390/ma14237263
Najm SM, Paniti I, Trzepieciński T, Nama SA, Viharos ZJ, Jacso A. Parametric Effects of Single Point Incremental Forming on Hardness of AA1100 Aluminium Alloy Sheets. Materials. 2021; 14(23):7263. https://0-doi-org.brum.beds.ac.uk/10.3390/ma14237263
Chicago/Turabian StyleNajm, Sherwan Mohammed, Imre Paniti, Tomasz Trzepieciński, Sami Ali Nama, Zsolt János Viharos, and Adam Jacso. 2021. "Parametric Effects of Single Point Incremental Forming on Hardness of AA1100 Aluminium Alloy Sheets" Materials 14, no. 23: 7263. https://0-doi-org.brum.beds.ac.uk/10.3390/ma14237263