
Kinetic Analysis of Pyrolysis and Thermo-Oxidative Decomposition of Tennis String Nylon Wastes


1
Department of Physical Education, Tianjin University of Commerce, Tianjin 300134, China
2
Department of Packaging Engineering, Tianjin University of Commerce, Tianjin 300134, China
*
Author to whom correspondence should be addressed.
Materials 2021, 14(24), 7564; https://0-doi-org.brum.beds.ac.uk/10.3390/ma14247564
Submission received: 10 November 2021
/
Revised: 2 December 2021
/
Accepted: 5 December 2021
/
Published: 9 December 2021
(This article belongs to the Section Polymeric Materials)
Abstract
:Thermal degradation of nylon-6 tennis string nylon wastes in inert nitrogen and air atmospheres was investigated by means of multiple heating-rate thermogravimetric analyses. The results obtained under the heating rates of 5–20 K/min are compared in terms of degradation feature and specific temperature for two atmospheres. Using nonisothermal data, kinetic analysis was thoroughly conducted using various isoconversional model-free methods, including Starink, Madhusudanan–Krishnan–Ninan, Tang, Coats–Redfern, and Flynn–Wall–Ozawa methods. With these kinetic analysis methods, the activation energy over the entire degradation process was successfully calculated. By means of the model-fitting master-plots method, the first-order chemical reaction model was determined to be the most appropriate mechanism function for describing pyrolysis and oxidative thermal degradation of nylon-6 waste. Using kinetic parameters, satisfactory matching against experimental data resulted using the Coats–Redfern method for both cases. Furthermore, thermodynamic parameters such as changes in entropy, enthalpy, and Gibbs free energy during thermal degradation processes were evaluated.
1. Introduction
Today, tennis is a very popular sport all around the world and tennis balls, rackets, and strings along with other auxiliary supplies are drastically consumed. However, tennis produces various wastes such as tennis balls, rackets, and strings in considerable amounts as they are readily worn out under high energy and high-speed shots during tennis. Among various tennis string materials, nylon-6 is the most commonly used polymer in order to achieve the best performance in tennis playing. Nylon-6 is one kind of polyamide characterized by the amide group (–NHCO–) and it is one of the most widely used engineering plastic in many industrial fields including building, home textile, automotive and electrical industries since it possesses good chemical stability, high mechanical strength, and elasticity. Furthermore, it is extensively used to fabricate tennis string because of its excellent wear resistance meeting the requirements of tennis sport to a great extent.
In the present work, nylon-6 tennis string wastes in Tianjin, China, were collected for inert and oxidative thermal degradation considerations. It is well-known that pyrolysis and combustion are two effective methods to chemically converse plastic wastes into valuable substances for sustainable energy development [1,2]. To date, a number of attempts have been made to study pyrolysis and oxidative thermal degradations of nylon-6 and its wastes [3,4,5,6,7,8,9,10,11,12]. Principally, nylon-6 has been reported to thermally degrade into ε-caprolactam monomer through a chain end backbiting process or a ring transition state formed within polymer chains [3,4,5] and a yield as high as 83–85 wt.% of ε-caprolactam could be obtained [6,7]. Such recovery of high ε-caprolactam yield may become worse when dealing with nylon-6 wastes [8,9]. Chaihad et al. [8] studied the catalytic effect of calcined scallop shell (CSS) on pyrolysis of nylon-6 fishing net waste and found that the decomposition temperature can be decreased by 40–60 K in the presence of catalysts but the yield of ε-caprolactam has reduced to be 66 wt.%. Likewise, Kim et al. [9] performed a pyrolysis study of teabag waste at 400 and 700 °C and reported that the highest caprolactam yield has turned to be 59.2 wt.%. In contrast, the pyrolysis product composition may become diverse when changing pyrolysis conditions [10,11]. Bozi and Blazsó [10] studied the effect of acidic Y zeolite catalyst on nylon-6 pyrolysis and reported that the pyrolysis product may become mainly dihydro-azepine isomers instead of ɛ-caprolactam via cis-elimination or intramolecular rearrangement of amide groups and more aromatics and light unsaturated hydrocarbons will be yielded when using greater amounts of zeolite. Interestingly, Pannase et al. [11] reported that the condensed pyrolytic oil of fresh nylon-6 ropes, obtained at 823 K under 5 K/min and 873 K under 10 K/min and analyzed via Fourier transform infrared spectroscopy (FTIR), shows a high resemblance with conventional fuel such as diesel.
Apart from the study of degradation product compositions, kinetic analysis of thermal degradation of nylon-6 has also been attempted in terms of kinetic triplet parameters of as apparent activation energy Ea, pre-exponential factor A and reaction mechanism model function f(α) using isothermal thermogravimetric (TG) data or dynamic non-isothermal TG data [4,5,7,11,12]. Holland and Hay [4] studied the pyrolysis of nylon-6 and reported an Ea calculated at 190 kJ/mol along with the first-order reaction for pyrolysis of fresh nylon. Similarly, Bockhorn et al. [12] thoroughly investigated the thermal degradation kinetics of nylon-6 in helium with/without catalyst under dynamic and isothermal conditions. Their works showed an Ea of 211 kJ/mol, logA of 15.0 min−1 and a reaction order of 0.81 for nylon-6 over the dynamic degradation process while in the case of isothermal condition nylon-6 had a lower Ea of 205 kJ/mol, lower logA of 14.5 min−1, and higher reaction order of around 1.0. As a comparison, the Ea was greatly reduced to 113 kJ/mol using a basic catalyst of NaOH/KOH eutectic mixture, along with log A = 8.7 min−1 and a reaction order of n = 1.06. However, with an acid catalyst of H3PO4, the Ea was also reduced to Ea = 164 kJ/mol, together with log A = 14.0 min−1 and a reaction order of n = 1.9. A rather similar Ea value of 205 kJ/mol has also been reported in the work of Pannase et al. [11], where nylon-6 pyrolysis was performed via model-free Coats–on redmine Redfern (CR), Flynn–Wall–Ozawa (FWO), and Starink (SK). However, quite distinctly, they reported that the degradation reaction is controlled by a contracting sphere R3 model other than the chemical order model identified by using the master-plot method [11].
Furthermore, kinetic analysis studies for pyrolysis of nylon-6 wastes have also been conducted and can be referred to in two works [5,7]. Kim et al. [5] studied pyrolysis of nylon-6 fresh and waste fishing nets and differentially obtained an average Ea of 266 and 220 kJ/mol for fresh fishing nets and waste fishing nets, respectively. They also reported the reaction order of 0 or 1 for fresh nylon and waste nylon, respectively. Likewise, Eimontas et al. [7] reported that through isoconversional model-free kinetics analysis, the overall averaged activation energies were estimated at 112 kJ/mol for waste fishing nets and 158, 230, 197, 201, and 220 kJ/mol for waste fishing nets added with 2.5, 5, 10, 20, and 50 wt% ZSM-5 zeolite, respectively. At the same time, they also attempted the distributed activation energy model (DAEM) to plot thermogravimetry and differential thermogravimetry (TG/DTG) curves, leading to a high prediction to experimentally obtain multiple heating-rate TG and DTG curves [7]. However, more studies are needed to carry out about pyrolysis of nylon-6 wastes considering the extensive consumption of nylon-6 in various industrial fields. Once thermal degradation characteristics and kinetic parameters are available, not only would thermal degradation processes be predicted over the entire temperature range, but also thermal degradation reactors might be designed for processing massively accumulated nylon-6 wastes.
The objectives of the present work are: (1) thermal characteristics and degradation kinetics of nylon-6 string wastes under inert nitrogen and oxidative air atmospheres are compared by means of thermogravimetric analysis. (2) The non-isothermal mass loss data obtained are kinetically analyzed to determine the kinetic parameters of Ea, lnA, and f(α) with a number of isoconversional kinetic analysis methods and the calculation results with these methods are discussed in detail. The variation in activation energy with conversion can be used to reveal the complex nature of the thermal degradation reaction. (3) The model-fitting master-plots method has been attempted to scan the most appropriate mechanism model for describing oxidative or inert thermal degradation processes of nylon-6 tennis string wastes and the first-order chemical reaction model is found to be obeyed during thermal degradation processes. With these kinetic parameters, rebuilding the mass conversion curves has been performed, consequently resulting in satisfactory predictions against experimental results. (4) Finally, thermodynamic functions such as changes in entropy, enthalpy, and Gibbs free energy during pyrolysis degradation have also been quantified by assuming the transition state theory. The current work provides detailed information about thermal degradation behaviors and kinetic triplet parameters necessary for designing a chemical reactor to thermally dispose of nylon-6 wastes.
2. Materials and Analysis Methods
2.1. Materials
Tennis string waste, from the same brand (®Taan of Shenzhen Taiang Industrial CO., Ltd., Shenzhen, China) was collected locally in Tianjin, China. The collected filaments were washed using distilled water and sun-dried in open air. Then, the dried sample after cutting was milled with a grinder and meshed to less than 100 um powder. The resultant powder was dried at 400 K in a controlled oven for 20 h to remove moisture residual and finally kept in an airtight container for subsequent measurements.
2.2. TG Analysis
The powdery waste sample of 3–4 mg for each run was subjected to a thermogravimetric analyzer (DTG-60, Shimadzu, Japan) for thermal degradation measurements and differential thermal analysis (DTA) under a constant heating rate mode. The purging gas used was air or N2 at a flow rate of 30 cm3/min. The temperature range programmed was spanned. Non-isothermal TGA data were yielded from ambient up to 850 K under 5, 10, 15, and 20 K/min and the DTG data were automatically obtained with the analyzer software.
Fourier transform infrared (FTIR) analysis was performed on nylon-6 tennis filament waste samples via a Bruker Alpha-H infrared spectrophotometer and FTIR data acquired varied in the wavelength range of 400–4000 cm−1. FTIR results obtained with 32 scans for each run can be used to identify the chemical structure of real-world nylon-6 waste samples. The powder waste sample after being further milled with a mortar and pestle was mixed with KBr at a mass ratio of 5:95 and then pressed into a transparent sample disc for subsequent FTIR measurements.
2.3. Kinetic Analysis
Deep analysis of thermal degradation kinetics is a very useful tool for securing the thermal degradation process and explore degradation reaction mechanisms. Theoretical kinetics analysis has been commonly performed using isoconversional model-free and model fitting methods and the thermal degradation of various solids can be accurately characterized by using kinetic triplets of the activation energy (Ea), the pre-exponential factor (A), and the reaction mechanism function (f(α)) [13,14]. With the isoconversional method, the Ea values are calculated as a function of the degree of mass conversion (α). Using the model-fitting method, the most appropriate reaction mechanism function (f(α)) can be properly found based on the Ea values, and the third kinetic parameter A can be readily determined thereafter. With these kinetic parameters, thermal degradation TG and DTG curves can be predicted and necessary information for subsequent industrial applications can be provided. Therefore, model-free and model-fitting methods are both attempted for analyzing thermal degradation of tennis string waste.
Generally, thermal reaction process of plastic solids may be described by the progress of degradation (dα/dt) as a function of time and temperature given below:
where k(T) is the rate constant of thermal degradation reaction and is usually written as the Arrhenius equation k(T) = A·exp(-Ea/RT), in which Ea(J/mol) is the activation energy to satisfy degradation reaction. A (min−1) is the pre-exponential factor, T (K) is the absolute temperature and R is the universal gas constant (8.314 J/mol K). Furthermore, f(α) stands for a reaction mechanism function for describing the kinetic thermal degradation, and α is set to be the extent of mass conversion defined as:
where m0, mt, and m∞ are the initial sample mass, the sample mass at degradation time t, and the final sample mass, respectively. So far, the isoconversional analysis method has been the most commonly used for thermal degradation kinetics and then non-isothermal temperature program is conducted at a constant heating rate mode with β defined as β = dT/dt. Subsequently, Equation (1) can be transformed as:
Readily, an integral form of reaction mechanism function, g(α), can be deduced from Equation (3) by rearrangement and integration, given as:
As for describing the thermal degradation mechanism, a number of reaction model functions in differential form of f(α) and integral form of g(α) are available [14] and some of them are presented in Table 1 in the present work.
2.3.1. Model-free method
In Equation (4), a well-known temperature integral function is involved and can be further transformed by setting x = Ea/RT and as:
However, there is no analytical answer to solve p(x), and thus numerous approximate solutions or numerical regressions have been proposed such as Starink (SK) [15], Tang et al. (Tang) [16], Madhusudanan–Krishnan–Ninan (MKN) [17], Coats–Redfern (CR) [18], and Flynn–Wall–Ozawa (FWO) [19,20]. They are detailed as given below:
Currently, these integral methods have been extensively used to analyze non-isothermal TG data and then isoconversionally calculate activation energy at any arbitrary mass conversion level [11,21,22,23,24,25]. Using these methods, the left term is conveniently plotted against 1/T and a straight line will result for each conversion level, from whose slope the activation energy Ea can be easily evaluated over the whole conversion range. As such, these methods are thought of as model-free methods since they do not consider any specific chemical reaction model.
2.3.2. Model-Fitting Method
As we can see, the above-given model-free methods can rather conveniently result in mass conversion dependent Ea but they are not directly related to the identification of the thermal degradation model. On the contrary, the model-fitting method has been frequently applied for such an aim. Among various model-fitting methods, one of the most frequently reported is the master-plots method given by Gotor et al. [26] to approximate the reaction model to the maximum extent. To apply this method, a reference has been introduced by defining an integral function g(α) at α = 0.5:
where x0.5 equals Ea/RT0.5 and T0.5 is a specific temperature set at α = 0.5. Based on Equations (5) and (11), a mathematical expression to represent the most common master-plots method [11,21,22,26], named the G-master-plots method for simplicity, can be deduced as follows:
where the right and left terms are experimental and theoretical plots, respectively. Clearly, all g(α)/g(0.5) and p(x)/p(x0.5) curves are condensed to 1 at α = 0.5. By respectively drawing experimental p(x)/p(x0.5) values versus α and theoretical g(α)/g(0.5) values versus α of various reaction models listed in Table 1, the matching degree of the considered reaction model against experimental data can be evaluated, and the reaction model with the best fitting among all the models in Table 1 can be determined as the kinetic reaction model of thermal degradation of nylon-6 tennis string waste. To make Equation (12) work, a fourth-order expression given by Senum and Yang [27] has been applied to evaluate the reaction model and such a high-precision approximation is shown below.
2.3.3. Thermodynamic Analysis
Thermodynamic quantities for pyrolysis and oxidative thermal degradation of tennis string nylon-6 waste, including activation energy (Ea), changes in enthalpy (ΔH), changes in entropy (ΔS), and changes in Gibbs free energy (ΔG), were calculated based on transition-state theory using the following expressions [24,28]:
where e is the Neper number (2.7183), h and kB represent the Plank constant (6.626 × 10⁻³⁴ J/s) and Boltzmann constant (1.381 × 10⁻²³ J/K), respectively. Herein, A is the pre-exponential factor determined as above and Ea the activation energy from the SK method.
ΔH = Ea − RT
ΔG = ΔH − TΔS
3. Results and Discussion
3.1. FTIR Analysis of Nylon-6 Sample
Figure 1 shows the FTIR identification of chemical groups involved for nylon-6 tennis filament waste, and these FTIR results for nylon-6 are almost the same as those documented in the literature [29,30]. The absorption band peaked at 3413 cm−1 can be attributed to the stretching vibrations of hydrogen-bonded NH groups while the adsorption bands centered at 3072, 2912, and 2843 cm−1 can be assigned to the stretching vibration of aliphatic CH groups for the nylon-6 waste sample. Meanwhile, the absorption peak at 1623 cm−1 can be accounted for as the stretching vibration of amide II and CN groups of nylon-6 and the one at 1539 cm−1 may be due to the vibrations of amide I [30]. The results indicate that the collected filament sample is primarily made of nylon-6 polymer.
3.2. Thermal Degradation Characteristics of Nylon String Wastes
Figure 2 presents multi-heating-rate TG curves of tennis nylon-6 string waste samples determined in two different atmospheres of oxidative air and inert N2 and programmed from ambient to 850 K under four ramping rates of β = 5, 10, 15, and 20 K/min. Clearly, as found from the TG results, the mass-T curve has moved to higher temperature ranges upon enlarging the heating rate β and the temperature movement is applied to both cases. This result may be attributed to a combined effect of different heat transfer and distinct kinetic rates, which in turn, lead to the reduced gasification rate of the reaction product with the rise in heating rate and subsequently a temperature-shift compensation.
A careful examination of Figure 2 shows that nylon-6 waste retains relatively stronger thermal stability in inert N2 than in oxidative air, but in both cases, the waste sample has completely burned out without any visible solid residual. As can be seen, nylon-6 begins to degrade in oxidative air when heated upwards to 581 or 622 K upon employing different heating rates, and its complete degradation may be accomplished when heating the sample up to 737 K under 5 K/min or 770 K for the case of 20 K/min. In contrast, the pyrolysis in inert N2 for nylon-6 string wastes is seen to undergo in-between 606 to 742 K or from 643 to 772 K when augmenting β from 5 K/min to 20 K/min. With these TG data, kinetics analysis can be performed for inert and oxidative thermal degradation processes and will be discussed later. Similarly, Pannase et al. [11] recently reported that for fresh nylon ropes, major degradation occurred in the temperature range of 673 to 793 K, and such observations can be also found in the other studies [9,10].
Figure 2 also shows DTG results of nylon-6 string wastes obtained under multiple heating rates for both N2 and air atmospheres, and one can see that all DTG curves have displayed only one peak for every heating rate, at which the sample has reached a maximum mass loss rate (dα/dt) and the temperature at the peak is normally defined as Tp. Like those shown for the TG results, the DTG results are also significantly affected by the variation in β and DTG curves moving rightwards to high-temperature domains as β rises as reflected by Figure 2. Meanwhile, the Tp value is ascended and the peak turns wide and intense as β rises up from 5 to 20 K/min. These observations are the same for both cases of N2 and air. As seen from Figure 2, the Tp values are unsurprisingly lower in air than in N2. Furthermore, one can deduce from these one-peak DTG results that the nylon-6 string wastes may have undergone one reaction stage during thermal degradation processes and thus a single-reaction model assumption may be somewhat reasonable for describing kinetic degradations according to ICTAC Kinetics Committee recommendations [13]. Such an assumption is useful for the purpose of later finding the mechanism function for pyrolysis and oxidative thermal degradation of nylon-6 tennis string wastes.
Looking at Figure 3 where some specific temperatures directly abstracted from TG data are plotted, one can see how the heating rate affects the thermal degradation of nylon-6 string waste. The temperatures randomly selected here include T5, T15, and T60, and they are defined as the temperatures, respectively, at 5% mass conversion (T5), 15% mass conversion (T15), and 60% mass conversion (T60). For both cases of inert and oxidative atmospheres, each of these specific temperatures is linearly promoted with the increase in the heating rate and a linear expression may be derived for quantitatively describing the heating-rate dependence of each specific temperature. As can be seen from Figure 3, under the same heating rate, these specific temperatures are all higher in inert nitrogen than in oxidative air. Similar observations have also been reported in our earlier work where an ionic liquid of [bmim]PF6 demonstrated rather better thermal stability in N2 than in air [25].
During pyrolysis, the nylon-6 tennis string waste sample experienced two heat response stages—endothermic melting and exothermic decomposition, respectively. Figure 4 presents the endothermic melting involved DTA curves under four different hearing rates for the nylon-6 waste. It can be seen that the nylon-6 possesses a crystalline structure and these crystalline properties are strongly impacted by the heating rate as evidenced by the variation in the melting point with the heating rate shown in Figure 4. In N2, the crystal in the nylon-5 waste sample melts at 498, 500, 502, and 504 K when heated at 5, 10, 15, and 20 K/min. In the case of air atmosphere, the melting points become relatively lower as compared to the inert case, similar to those TG data discussed above. These melting point values are consistent with those in the literature [31,32] and can be attributed to the presence of a thermodynamically stable α-form crystal of nylon-6, which is formed with hydrogen-bonded chains packed in an anti-parallel manner [31,32].
3.3. Kinetics Analysis of Thermal Degradation
3.3.1. Results Obtained by the SK Method
With the SK method, the plots of ln(β/T1.92) against 1000/T for the nylon-6 degradation in both air and N2 are presented in Figure 5, while the α-dependent Ea values calculated from the slope of each Arrhenius plot are listed in Table 2. The R2 values are also listed in Table 2, and as can be seen, they are close to 1.00, revealing a linear dependence of ln(β/T1.92) on 1/T for each conversion level.
The Ea in N2 is found from Table 2 to intensely rely on α and it varies within 142.79–207.97 kJ/mol as α rises up from 0.05 to 0.95, and the averaged Ea value is 188.95 kJ/mol over the whole conversional range. The difference between the largest Ea at α = 0.95 and smallest Ea at α = 0.05 or the second smallest Ea at α = 0.10 is about 34.49% or 22.34% of the averaged Ea. Thus, the disparity between the averaged Ea and Ea of 0.10 < α < 0.95 can be roughly taken constantly over all conversion levels and a one-step degradation model can be approximately assumed. However, the gradual increase in Ea with α turns to indicate that thermal degradation may become a little more complex with the progress of mass conversion. In terms of the Ea, very similar or higher results have been reported in the literature [4,11,12]. In the study of Holland and Hay [4], an averaged Ea of 190 kJ/mol, rather close to our work, was obtained for pyrolysis of fresh nylon-6. Likewise, a higher Ea of 205 kJ/mol was resulted for nylon-6 pyrolysis by means of model-free SK, CR, and FWO methods [11]. Moreover, the averaged Ea of 205 or 211 kJ/mol was calculated for isothermal or non-isothermal conditions, respectively, for pyrolysis of nylon-6 in helium [12]. Moreover, Kim et al. [5] found that the Ea of nylon-6 fishing net wastes was considerably lower by 46 kJ/mol than that of fresh net samples, indicative of the possible environmental effect on pyrolysis degradation of nylon-6. From this aspect, one may deduce from relatively lower Ea values that the nylon-6 tennis string waste, investigated here, may have experienced mechanical degradation upon stroking high-speed shots during tennis.
On the other hand, the Ea values for oxidative thermal degradation are relatively lower than those for the N2 case, and these values span from 90.45 to 178.16 kJ/mol. Such a result tends to suggest that the chemical reaction of varying degrees of complexity might be involved during oxidative degradation. The gap between the α-dependent Ea and the averaged Ea is relatively larger as compared to the inert N2 case. However, for the purpose of comparing two different thermal gases the one-step degradation model assumption has been taken. In this way, the model-fitting methodology with kinetic SK method and the other methods such as Tang, MKN, CR, or FWO methods shown later may be plausible for elaborating kinetic thermal degradation according to the ICTAC Kinetics Committee suggestions [13].
3.3.2. Results Obtained by the Tang Method
The isoconversional Tang method is considered for analyzing thermal degradation kinetics of string wastes in both N2 and air atmospheres. According to the Tang method, the Arrhenius plots of ln(β/T1.896441) vs. 1000/T over 0.05 < α < 0.95 are given in Figure S1 for oxidative thermal degradation and N2 pyrolysis processes. Similar to the SK method, a very good linear relationship can be observed between ln(β/T1.896441) and 1/T, and the R2 values can be referred to in Table S1. From the slope of each Arrhenius line, the Ea values can be estimated using Equation (7) and the calculated results for all α values are presented in Table S1. Compared to the Ea data in Table 2, one can see that the Ea value computed by using the Tang method shows the same trend as that resulted from the SK method. For the case of oxidative degradation, the activation energy Ea value shows relatively large deviations and it varies from 90.53 to 178.20 kJ/mol for 0.05 < α < 0.95. In contrast, the Ea value for N2 pyrolysis varies within from 142.84–207.99 kJ/mol. The averaged Ea values are 151.09 and 188.98 kJmol−1 for air and N2 cases, respectively. Unsurprisingly, the deviation of the α-dependent Ea from the averaged Ea for both air and N2 cases exhibited a similar result to that observed for the SK method. Hence, the Tang method could be used for describing pyrolysis in N2 or oxidative thermal degradation regardless of relatively large activation energy fluctuations.
3.3.3. Results Obtained by the MKN Method
Similar to the SK and Tang methods, the isoconversional MKN method has been employed to determine the Ea value following Equation (8). Accordingly, the Arrhenius plots of ln(β/T1.884318) vs. 1000/T over 0.05 < α < 0.95 are also shown in Figure S2 and the Ea values thus obtained are tabulated in Table S2 for the nylon-6 waste sample. These results show that the Ea values alter with the conversional extent in N2 with a relatively larger deviation than in air. In the case of N2, the Ea value gains momentum from 142.82 to 188.95 kJ/mol as α increases and it varies within 90.54–178.17 kJ/mol for oxidative thermal degradation. The averaged Ea over the entire mass loss range is 188.95 for N2 and 151.08 for air.
3.3.4. Results Obtained by the CR Method
Attempting the CR method for analyzing kinetics, the Arrhenius plots of ln(β/T2) versus 1000/T over 0.05 < α < 0.95 for thermal degradation in air or N2 pyrolysis processes are presented in Figure S3, and the Ea calculated from the slope of each plotted line according to Equation (9) and resultant R2 values are given in Table S3. As can be observed from Figure S3, the linear relationship between ln(β/T2) and 1/T is very well as is also reflected by the R2 values listed in Table S3. As also shown in Table S3, the Ea value relies intensely on mass conversion α and it spans from 90.10 to 177.83 kJ/mol for N2 pyrolysis while from 142.46 to 207.64 kJ/mol for oxidative thermal degradation. On average, the Ea values thus obtained are 150.69 and 188.63 kJ/mol for air and N2 cases, respectively.
3.3.5. Results Obtained by the FWO Method
Following the FWO method, the Arrhenius plots of log(β) against 1000/T are depicted in Figure S4 as well for the nylon-6 waste sample in both air and N2, and the Ea and R2 values thus calculated for each α are given in Table S4. The R2 values over the entire conversion range are found to closely approximate 1.00, showing a linear dependence of log(β) on 1/T for every conversion level. The Ea values via the FWO method are known to be readily estimated from the line slopes of all Arrhenius plots shown in Figure S4. From Table S4, one can see that the Ea values for either N2 or air are strongly dependent on α and they vary from 95.82 to 180.42 kJ/mol for pyrolysis or from 145.91 to 209.15 kJ/mol for oxidative thermal degradation as α varies from 0.05–0.95. If averaged over the entire conversion range, the Ea values thus calculated are 190.61 and 154.38 kJ/mol, respectively.
A comparison made among all five integral methods shows that both SK and CR methods have almost the same conversion-dependent Ea curves, and the SK method led to 0.32 kJ/mol higher Ea values in N2 than the CR method or 0.35 kJ/mol higher in air at all conversional levels. As for the other three methods, they all resulted in very similar Ea versus α curves to the SK and CR methods. Of all five methods, the Ea values at all α values increased, following the sequence: CR < SK < MKN < Tang < FWO for both cases of N2 and air atmospheres. A further examination shows that for the inert N2 pyrolysis process, the Ea values calculated from the CR method are 0.33, 0.35, and 1.98 kJ/mol lower on average than those, respectively, from the MKN, Tang, and FWO methods, while in the case of oxidative thermal degradation, the Ea values from the CR method are on average 0.38, 0.39, and 3.69 kJ/mol smaller than those from the MKN, Tang, and FWO methods, respectively. In other words, the SK, CR, MKN, and Tang methods have generally comparable calculation performances even though they involve different approximations. The FWO method seems to always give relatively large Ea results [23,24,25].
3.4. Model-Fitting Analysis
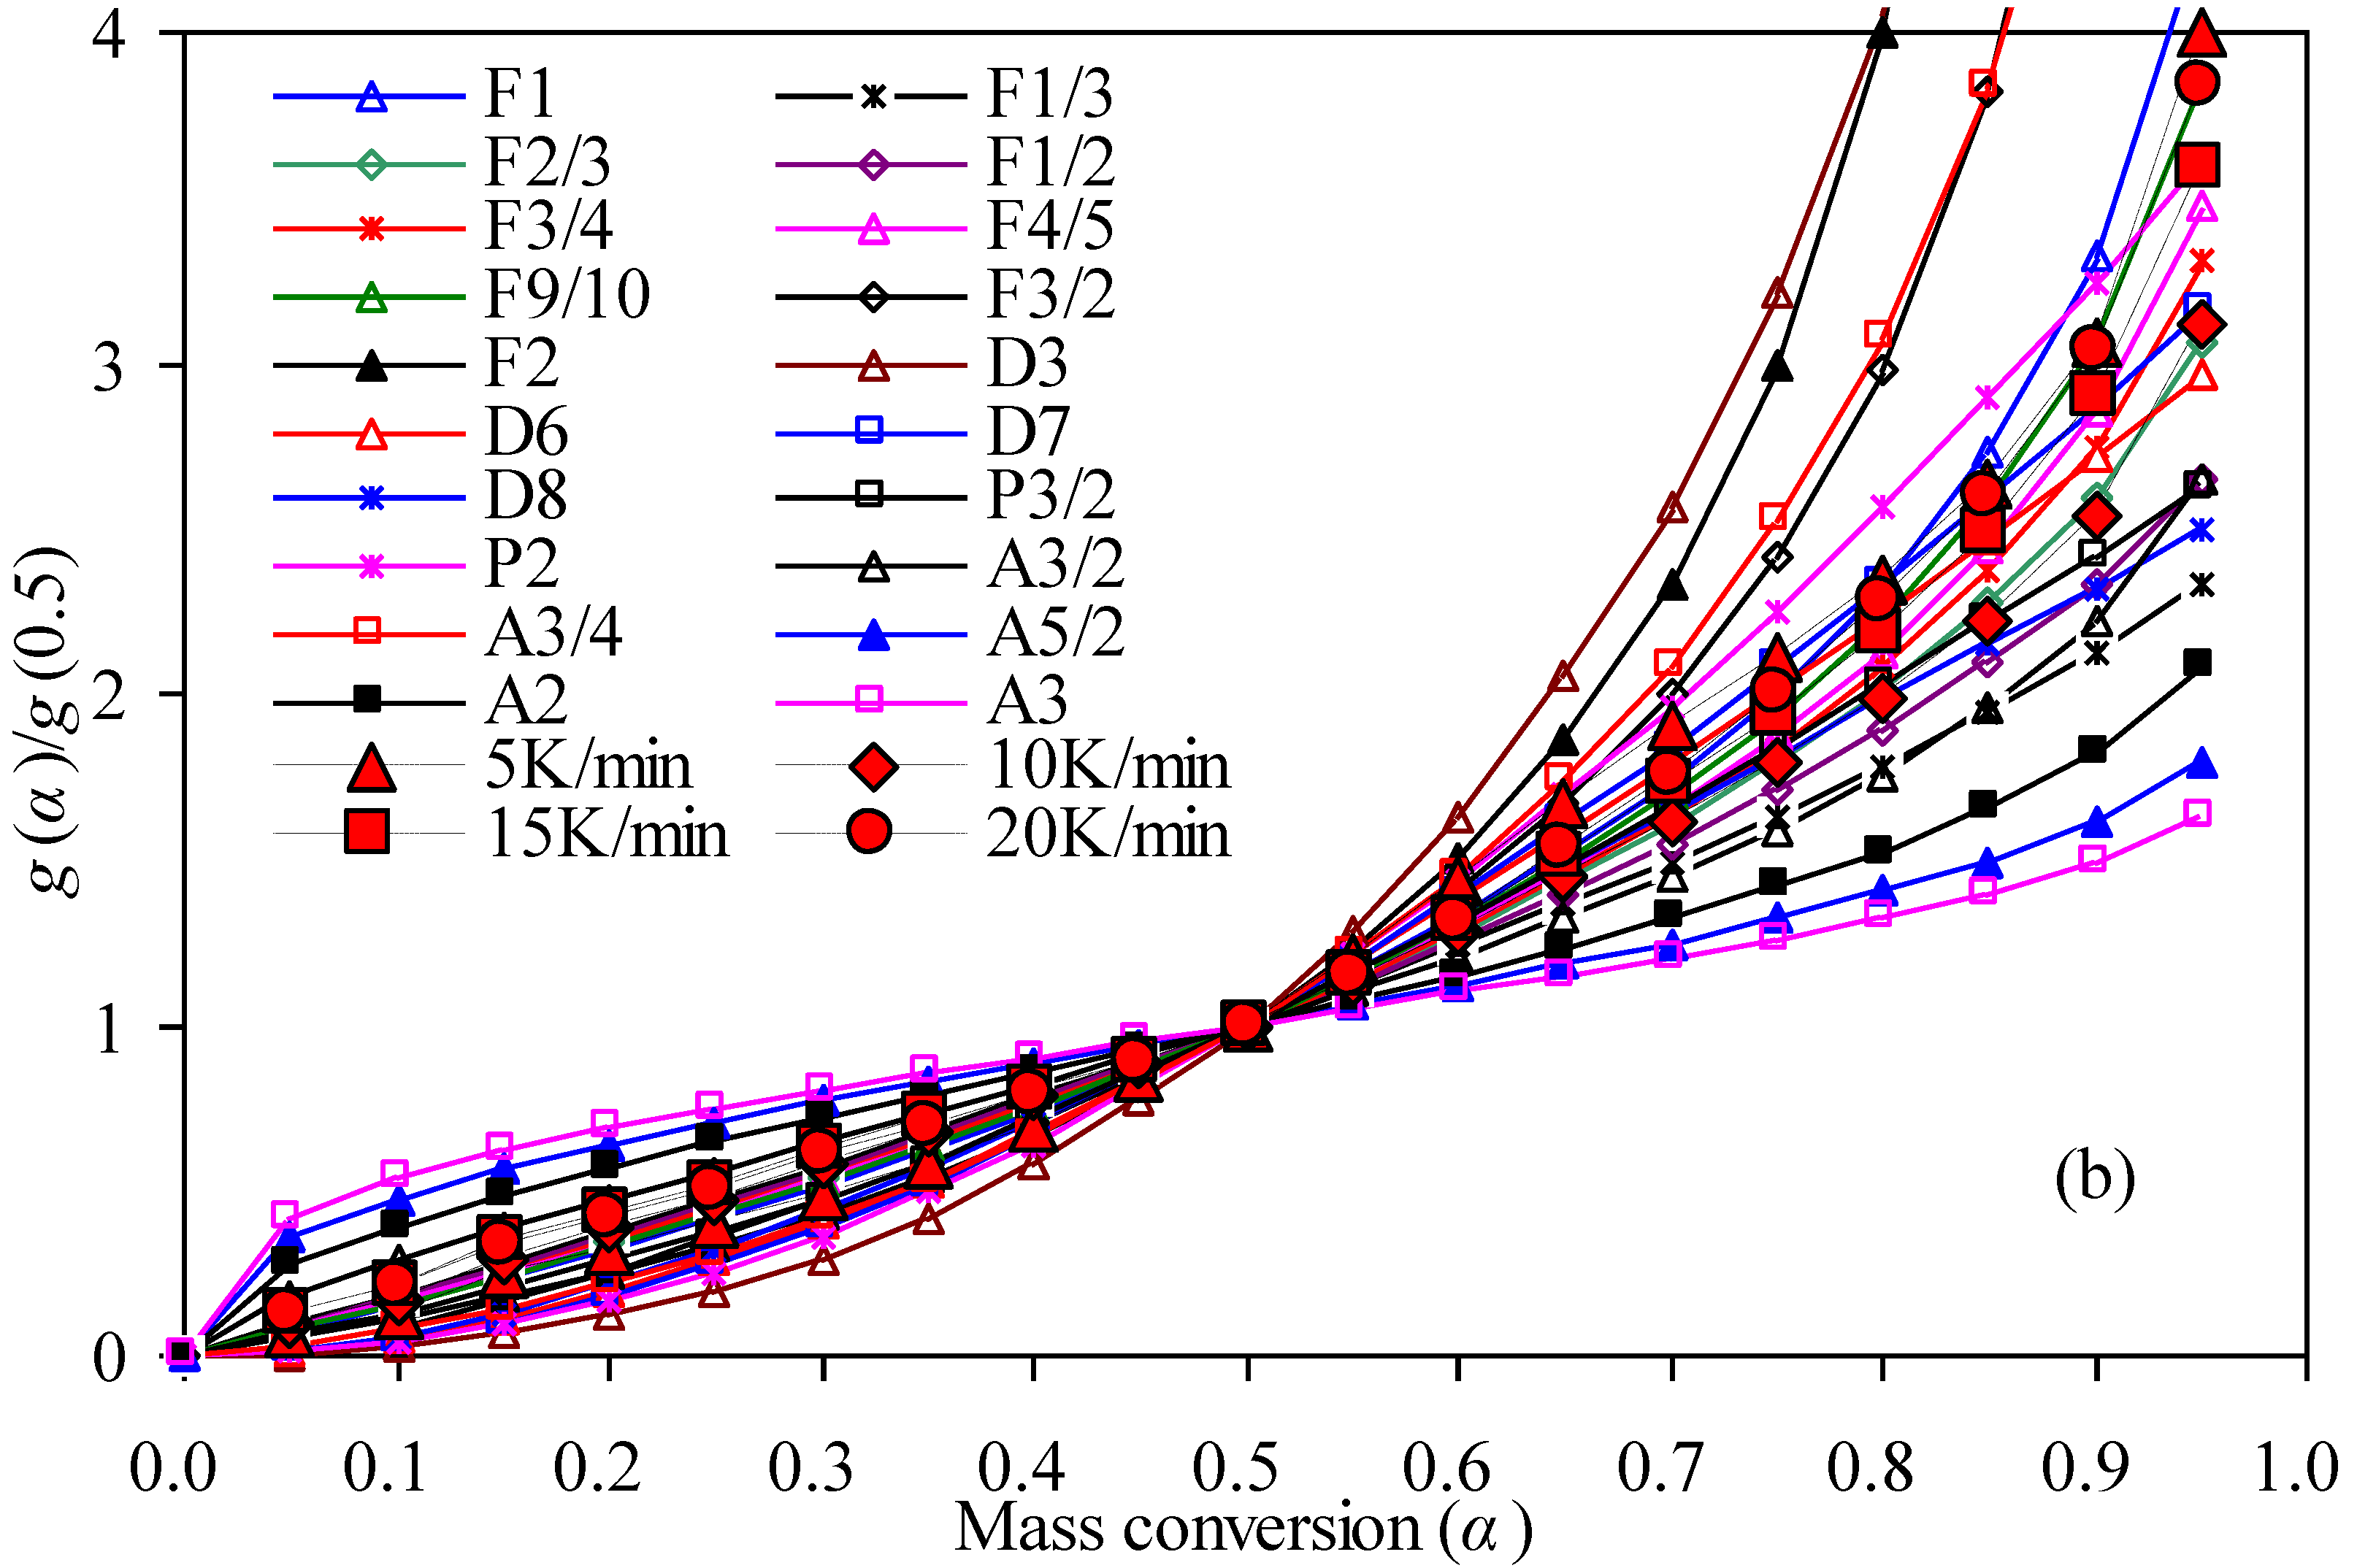
Apart from obtaining the α-dependent Ea from TG data with five model-free methods, the kinetic model f (α) of nylon-6 waste has been identified by using the model fitting method. Thus, the G-master plots method has been applied here for this purpose [11,21,22,26] and Figure 6 shows theoretical master plots of g(α)/g(0.5) vs. α against experimental plots of 5, 10, 15, and 20 K/min for both air and N2 cases. All the reaction functions presented in Table 1 are considered here to result in a number of theoretical master plots based on Equation (12). It may be noted that among these reaction models considered, four types of chemical reaction order equation, acceleratory nucleation equation, sigmoidal Avrami–Erofeev equation, and deceleratory three-dimensional diffusion equation have been compared against experimental curves by their matching extents. For the N2 case, only seven chemical reaction equations of F1/3, F1/2, F2/3, F3/4, F4/5, F9/10, and F1 have given rather better condensations on experimental plots for 0.05 < α < 0.50 whereas the other reaction models are observed to be further away from the experimental values. While for 0.50 < α < 0.95, five Avrami–Erofeev mechanism functions, D3, D7, F2, F3/2, F1/3, and P2 models are observed to lead to very large deviations against the experimental data, and D6, D8, F1/2, and P3/2 models are seen to result in certain deviations as compared to experimental values, the remaining five chemical order mechanism functions of F2/3, F3/4, F4/5, F9/10, and F1 are found to very well condense on experimental plots.
In the case of oxidative thermal degradation, the same finding for the N2 case is applied as α varies in the range of 0.05–0.50 as shown in Figure 6. On the other hand, the fittings seem relatively different for 0. 50 < α <0.95, the Avrami–Erofeev mechanism functions including A3/4, A3/2, A2, A5/2, and A3, along with D3, P2, F3/2, F2, F1/2, and F1/3 models, resulted in very large deviations against experimental curves while P3/2, D6, D7, and D8 models also led to minorly poor performance. Promisingly, the left F2/3, F3/4, F4/5, F9/10, and F1 reaction models are seen to very well approximate experimental plots. Due to the assumption of the one-stage reaction for the entire oxidative and pyrolysis thermal degradation processes, the F2/3, F3/4, F4/5, F9/10, and F1 reaction models can then be considered further as they perform very well over 0.05 < α <0.95, and their simulated results will be compared so as to identify the most suitable reaction models for thermal degradation of nylon-6 string waste. In the literature, the first-order reaction function for pyrolysis of nylon-6 and its waste has already been reported [4,5,7], while a degradation mechanism model with a chemical reaction order of 0.81–1.9 has been documented for catalytic pyrolysis of nylon-6 by Bockhorn et al. [12]. Furthermore, the work of Pannase et al. [11] showed a very different contracting sphere R3 model other than the chemical order model for pyrolysis degradation of nylon-6.
The comparison of the above-mentioned five models was conducted by fitting them against experimental data by the very commonly CR method in terms of the absolute average relative deviation (AARD) defined as:
where αexp and acal are, respectively, the mass conversion experimentally obtained and calculated with the reaction model, and N is the total number of mass conversion considered here. Figure 7 presents the AARD results from five reaction models, and it can be seen that the F1 model led to the lowest AARD values among the five models for both air and N2 cases. In this sense, the F1 model can be readily thought of as the most appropriate reaction model for pyrolysis and oxidative thermal degradation of nylon-6 tennis string wastes. With the Ea and F1 model, the pre-exponential factor lnA values were then calculated according to Equation (8) and the results thus obtained—as a function of α—are listed in Table 3 for both inert and oxidative atmospheres. The calculated lnA results presented in Table 3 show that the lnA value varies from 12.50 to 29.03 for the air case, and from 22.13 to 34.11 for the N2 case, respectively. Accordingly, the A value ranges from 2.68 × 10⁵ to 4.03 × 10¹² min−1 and 4.08 × 10⁹ to 6.51 × 10¹⁴ min−1 for the air and N2 cases, respectively.
A further examination shows that there is a kinetic compensation effect between the Ea and lnA, indicative of a compensatory increase in lnA with an increase in Ea [23]. Such a compensation effect is graphically presented in Figure 8 and can be linearly expressed as the following:
where the units of Ea and lnA are kJ/mol and min−1, respectively.
N2: lnA = 0.1818 Ea − 3.6882 (R2 = 0.9998)
Air: lnA = 0.1855 Ea − 3.7944 (R2 = 0.9990)
With fully obtained kinetic parameters, the theoretical predictions to thermal degradation processes can be made, and Figure 9 presents the matching results against experimental values using the CR method. It can be observed that the F1 model coupled with the Ea and lnA parameters over the entire range of 0.05–0.95 performed satisfactorily to recast the temperature-dependent mass-conversion curves for nylon-6 waste samples since all the experimental data points selected are mostly condensed on their respective α-T curves.
3.5. Thermodynamic Analysis
Thermodynamic analysis of pyrolysis and oxidative thermal degradation processes for nylon-6 tennis string wastes can be accomplished based on the assumption of transition state theory [11,24,28]. Accordingly, thermodynamic parameters in terms of ΔG, ΔH, and ΔS have been evaluated with the aid of the Ea values resulting from the CR method and lnA from the F1 model, and the calculation results are listed in Table 3. As can be seen, nylon-6 tennis string waste has a lower ΔH value in oxidative air than in nitrogen over the entire conversion range, requiring less energy to degrade at any conversion level. All the ΔH values are positive in either air or N2, and such endothermic features mean oxidative and inert thermal degradations are all heat absorbed. As seen from Table 3, the ΔG values are almost kept constant at 186.51 and 185.85 kJ/mol over 0.05 < α < 0.95 for nitrogen and air cases, respectively. Thermodynamically, all positive ΔG means non-spontaneous degradation processes in both atmospheres, and therefore, heat must be introduced to undergo thermal degradation. The higher the ΔG, the less favorable to undertake the degradation process. Finally, most ΔS values are negative during the degradation process as observed from Table 3, confirming the production of a more structurally ordered activated complex based on the transition state theory. However, such a transition from a disordered state to an ordered state is questionable since polymer macromolecular chains will certainly collapse into small molecules during high-temperature degradation. Further investigation should be conducted to deeply comprehend the thermodynamics of thermal degradation processes. Overall, the ΔH and ΔG values span from 84.71–171.85 kJ/mol and 185.40–186.41 kJ/mol for oxidative degradation, and 136.97–201.48 kJ/mol and 184.59–187.44 kJ/mol for N2 pyrolysis, respectively. Meanwhile, the ΔS values vary from −75.85 to 22.79 J/mol·K for pyrolysis or from −155.76 to −19.23 J/mol·K for oxidative thermal degradation. Similarly, Pannase et al. [11] also reported thermodynamic quantities for nylon-6 pyrolysis and ΔH, ΔG, and ΔS values—198.89 kJ/mol, 199.72 kJ/mol, and −1.09 J/mol·K, respectively.
4. Conclusions
In the present study, non-isothermal features and degradation kinetics of nylon-6 tennis string waste were studied under N2 and oxidative air atmospheres with TG measurements at a ramping rate of 5–20 K/min. Five integral methods—SK, Tang, MKN, CR, and FWO—were carried out to calculate activation energies over the entire conversion range. The master-plot method was used to search the most appropriate degradation model for describing pyrolysis and oxidative thermal degradation of nylon-6 waste. Some concluding remarks may be drawn from the present work:
- (1)
- Nylon-6 waste is more thermally stable in N2 than in air, meanwhile, the degradation thermal temperatures were found to linearly rise with the heating rate.
- (2)
- For kinetically analyzing thermal degradation of nylon-6 waste, a one-stage reaction model is assumed for elaborating both non-isothermal thermo-oxidative degradation and N2 pyrolysis.
- (3)
- The Ea values over 0.05 < α < 0.95, calculated by using the isoconversional SK method, vary from 95.82 to 180.42 kJ/mol for N2 pyrolysis or from 145.91 to 209.15 kJ/mol for oxidative thermal degradation, respectively. The variation in Ea with respect to α suggests that the chemical reaction of varying extents of complexity may have occurred during pyrolysis or oxidative degradation.
- (4)
- Among five model-free methods, the FWO method yielded the highest Ea values while the lowest Ea values were obtained by using the CR method, and the Ea value over the entire conversion range follows the sequence: CR < SK < MKN < Tang < FWO for both atmospheres.
- (5)
- By means of the model-fitting G-master-plots method, many reaction models were evaluated with the most common CR method and the first-order reaction model was found to be the most suitable mechanism function for describing pyrolysis and oxidative degradation of nylon-6 waste—as proven by the lowest calculation deviations. The CR method together with kinetic triplet parameters rebuilt multiple α-T curves with satisfactory performances.
- (6)
- Thermodynamically, ΔH, ΔS, and ΔG were estimated according to the transition state theory, and over the entire degradation process, the ΔH, ΔG, and ΔS values thus calculated varied from 137 to 201 kJ/mol, 185 to 187 kJ/mol, and −76 to 23 J/mol·K for N2 pyrolysis, or from 85 to 172 kJ/mol, 185 to 186 kJ/mol, and −156 to −19 J/mol·K for oxidative degradation, respectively. These results suggest that it is unfavorable for nylon-6 tennis string wastes to undergo thermal degradation and more energy is required for conducting pyrolysis than utilizing oxidative thermal degradation.
Supplementary Materials
The following are available online at https://0-www-mdpi-com.brum.beds.ac.uk/article/10.3390/ma14247564/s1, Figure S1: Linear Tang plots of ln (β/T 1.884318) vs. 1000/T obtained for tennis nylon waste in inert N2 (a) and air (b), Figure S2: Linear MKM plots of ln (β/T1.884318) vs. 1000/T obtained for tennis nylon waste in inert N2 (a) and air (b), Figure S3: Linear CR plots of ln (β/T 2) vs. 1000/T obtained for tennis nylon waste in inert N2 (a) and air (b), Figure S4: Linear FWO plots of logβ vs. 1000/T obtained for tennis nylon waste in inert N2 (a) and air (b), Table S1: Activation energies calculated using kinetic Tang method for nylon-6 string wastes thermal degradation, Table S2: Activation energies calculated using kinetic MKN method for nylon-6 string wastes thermal degradation, Table S3: Activation energies calculated using kinetic CR method for nylon-6 string wastes thermal degradation, Table S4: Activation energies calculated using kinetic FWO method for nylon-6 string wastes thermal degradation.
Author Contributions
All authors contributed to the conceptualization and accomplishment of the manuscript. The sample collection and preparation, running experiments, data analysis and first draft were carried out by H.W., Z.H. has contributed to experiment design, data analysis, manuscript writing and finalization of the manuscript. All authors critically reviewed the manuscript and approved the final version. All authors have read and agreed to the published version of the manuscript.
Funding
Not applicable.
Institutional Review Board Statement
Not applicable.
Informed Consent Statement
Not applicable.
Data Availability Statement
Here, we declare that the data presented in this study are available on request from the corresponding author.
Acknowledgments
The authors would like to thank Key Project of Philosophy and Social Science Planning of Tianjin in China (TJJX18-009) for kindly supporting this project.
Conflicts of Interest
The authors declare no conflict of interest.
References
- Xu, F.F.; Wang, B.; Yang, D.; Hao, J.H.; Qiao, Y.Y.; Tian, Y.Y. Thermal degradation of typical plastics under high heating rate conditions by TG-FTIR: Pyrolysis behaviors and kinetic analysis. Energy Convers. Manag. 2018, 171, 1106–1115. [Google Scholar] [CrossRef]
- Till, Z.; Varga, T.; Soja, J.; Miskolczi, N.; Chovan, T. Kinetic identification of plastic waste pyrolysis on zeolite-based catalysts. Energy Convers. Manag. 2018, 173, 320–330. [Google Scholar] [CrossRef]
- Lehrle, R.S.; Parsons, I.W.; Rollinson, M. Thermal degradation mechanisms of nylon 6 deduced from kinetic studies by pyrolysis-g.c. Polym. Degrad. Stab. 2000, 67, 21–33. [Google Scholar] [CrossRef]
- Holland, B.J.; Hay, J.N. Thermal degradation of nylon polymers. Polym. Int. 2000, 49, 943–948. [Google Scholar] [CrossRef]
- Kim, S.-S.; Jeon, J.-K.; Park, Y.-K.; Kim, S. Thermal pyrolysis of fresh and waste fishing nets. Waste Manag. 2005, 25, 811–817. [Google Scholar] [CrossRef] [PubMed]
- Czernik, S.; Elam, C.C.; Evans, R.J.; Meglen, R.R.; Moens, L.; Tatsumoto, K. Catalytic pyrolysis of nylon-6 to recover caprolactam. J. Anal. Appl. Pyrolysis 1998, 46, 51–64. [Google Scholar] [CrossRef]
- Eimontas, J.; Yousef, S.; Striūgas, N.; Abdelnaby, M.A. Catalytic pyrolysis kinetic behaviour and TG-FTIR-GC–MS analysis of waste fishing nets over ZSM-5 zeolite catalyst for caprolactam recovery. Renew. Energy 2021, 179, 1385–1403. [Google Scholar] [CrossRef]
- Chaihad, N.; Kurnia, I.; Yoshida, A.; Watanabe, C.; Tei, K.; Reubroycharoen, P.; Kasai, Y.; Abudula, A.; Guan, G.Q. Catalytic pyrolysis of wasted fishing net over calcined scallop shells: Analytical Py-GC/MS study. J. Anal. Appl. Pyrolysis 2020, 146, 104750. [Google Scholar] [CrossRef]
- Kim, S.; Lee, N.; Lee, J. Pyrolysis for nylon 6 monomer recovery from teabag waste. Polymers 2020, 12, 2695. [Google Scholar] [CrossRef]
- Bozi, J.; Blazsó, M. Catalytic thermal decomposition of polyamides and polyurethanes mixed with acidic zeolites. J. Anal. Appl. Pyrolysis 2012, 97, 189–197. [Google Scholar] [CrossRef]
- Pannase, A.M.; Singh, R.K.; Ruj, B.; Gupta, P. Decomposition of polyamide via slow pyrolysis: Effect of heating rate and operating temperature on product yield and composition. J. Anal. Appl. Pyrolysis 2020, 151, 104886. [Google Scholar] [CrossRef]
- Bockhorn, H.; Donner, S.; Gernsbeck, M.; Hornung, A.; Hornung, U. Pyrolysis of polyamide 6 under catalytic conditions and its application to reutilization of carpets. J. Anal. Appl. Pyrolysis 2001, 58–59, 79–94. [Google Scholar] [CrossRef]
- Vyazovkin, S.; Burnham, A.K.; Criado, J.M.; Pérez-Maqueda, L.A.; Popescud, C.; Sbirrazzuoli, N. ICTAC Kinetics Committee recommendations for performing kinetic computations on thermal analysis data. Thermochim. Acta 2011, 520, 1–19. [Google Scholar] [CrossRef]
- Trache, D.; Abdelaziz, A.; Siouani, B. A simple and linear isoconversional method to determine the pre-exponential factors and the mathematical reaction mechanism functions. J. Thermal Anal Calorim. 2017, 128, 335–348. [Google Scholar] [CrossRef]
- Starink, M.J. The determination of activation energy from linear heating rate experiments: A comparison of the accuracy of isoconversion methods. Thermochim. Acta 2003, 404, 163–176. [Google Scholar] [CrossRef] [Green Version]
- Tang, W.; Liu, Y.; Zhang, H.; Wang, C. New approximate formula for Arrhenius temperature integral. Thermochim. Acta 2003, 408, 39–43. [Google Scholar] [CrossRef]
- Madhysudanan, P.M.; Krishnan, K.; Ninan, K.N. New equations for kinetic analysis of non-isothermal reactions. Thermochim. Acta 1993, 221, 13–21. [Google Scholar] [CrossRef]
- Coats, A.W.; Redfern, J.P. Kinetic parameters from thermogravimetric data. Nature 1964, 201, 68–69. [Google Scholar] [CrossRef]
- Flynn, J.H.; Wall, L.A. General treatment of thermogravimetry of polymers. J. Res. Natl. Bur. Stand. Sect. A 1966, 70A, 487–523. [Google Scholar] [CrossRef]
- Ozawa, T. A new method of analyzing thermogravimetric data. Bull. Chem. Soc. Jpn. 1965, 38, 1881–1886. [Google Scholar] [CrossRef] [Green Version]
- Dubdub, I.; Al-Yaari, M. Pyrolysis of mixed plastic waste: I. Kinetic study. Materials 2020, 13, 4912. [Google Scholar] [CrossRef]
- Li, A.; Zhang, W.L.; Zhang, J.; Ding, Y.M.; Zhou, R. Pyrolysis kinetic properties of thermal insulation waste extruded polystyrene by multiple thermal analysis methods. Materials 2020, 13, 5595. [Google Scholar] [CrossRef] [PubMed]
- Wang, X.J.; Huang, Z.; Wei, M.Y.; Lu, T.; Nong, D.D.; Gao, X.Y.; Zhao, J.X.; Teng, L.J. Catalytic effect of nanosized ZnO and TiO2 on thermal degradation of poly(lactic acid) and isoconversional kinetic analysis. Thermochim. Acta 2019, 672, 14–24. [Google Scholar] [CrossRef]
- Hao, Y.H.; Huang, Z.; Ye, Q.Q.; Wang, J.W.; Yang, X.Y.; Fan, X.Y.; Li, Y.; Peng, Y.W. A comparison study on non-isothermal decomposition kinetics of chitosan with different analysis methods. J. Therm. Anal. Calorim. 2017, 128, 1077–1091. [Google Scholar] [CrossRef]
- Huang, Z.; Wang, X.J.; Lu, T.; Nong, D.D.; Gao, X.Y.; Zhao, J.X.; Wei, M.Y.; Teng, L.J. Isoconversional kinetic analysis of thermal decomposition of 1-butyl-3-methylimidazolium hexafluorophosphate under inert nitrogen and oxidative air atmospheres. J. Thermal Anal. Calorim. 2020, 140, 695–712. [Google Scholar] [CrossRef]
- Gotor, F.J.; Criado, J.M.; Malek, J.; Koga, N. Kinetic analysis of solid-state reactions: The universality of master plots for analyzing isothermal and nonisothermal experiments. J. Phys. Chem. A 2000, 104, 10777–10782. [Google Scholar] [CrossRef]
- Senum, G.I.; Yang, R.T. Rational approximations of the integral of the Arrhenius function. J. Thermal Anal. 1977, 11, 445–447. [Google Scholar] [CrossRef]
- Eyring, H. The activated complex in chemical reactions. J. Chem. Phys. 1935, 3, 107–115. [Google Scholar] [CrossRef]
- Nair, S.S.; Ramesh, C. Studies on the crystallization behavior of nylon-6 in the presence of layered silicates using variable temperature WAXS and FTIR. Macromolecules 2005, 38, 454–462. [Google Scholar] [CrossRef]
- Porubskα, M.; Szöllős, O.; Kóňovα, A.; Janigovα, I.; Jaškovα, M.; Jomovα, K.; Chodαk, I. FTIR spectroscopy study of polyamide-6 irradiated by electron and proton beams. Polym. Degrad. Stab. 2012, 97, 523–531. [Google Scholar] [CrossRef]
- Jose, M.V.; Steinert, B.W.; Thomas, V.; Dean, D.R.; Abdalla, M.A.; Price, G.; Janowski, G.M. Morphology and mechanical properties of nylon 6/MWNT nanofibers. Polymer 2007, 48, 1096–1104. [Google Scholar] [CrossRef]
- Yu, J.C.; Gröbner, G.; Tonpheng, B.; Andersson, O. Microstructure, nucleation and thermal properties of high-pressure crystallized MWCNT/nylon-6 composites. Polymer 2011, 52, 5521–5527. [Google Scholar] [CrossRef] [Green Version]
Figure 1.
FTIR analysis spectra determined for nylon-6 tennis string waste samples.

Figure 2.
TG (a,b) and DTG (c,d) results of tennis string nylon samples measured in the atmosphere of inert N2 (a,c) and oxidative air (b,d).
Figure 2.
TG (a,b) and DTG (c,d) results of tennis string nylon samples measured in the atmosphere of inert N2 (a,c) and oxidative air (b,d).


Figure 3.
Effect of heating rate β on specific degradation temperatures of the nylon-6 string waste sample in oxidative air and inert N2.
Figure 3.
Effect of heating rate β on specific degradation temperatures of the nylon-6 string waste sample in oxidative air and inert N2.

Figure 4.
DTA results of nylon-6 tennis string waste measured in N2 (a) and air (b).

Figure 5.
Linear SK plots of ln (β/T1.92) vs. 1000/T obtained for tennis nylon waste in inert N2 (a) and air (b).
Figure 5.
Linear SK plots of ln (β/T1.92) vs. 1000/T obtained for tennis nylon waste in inert N2 (a) and air (b).

Figure 6.
Theoretical and experimental G-master plots for nylon-6 string waste samples: (a) in N2 and (b) in air.
Figure 6.
Theoretical and experimental G-master plots for nylon-6 string waste samples: (a) in N2 and (b) in air.


Figure 7.
The AARD results under different β values for some reaction models with the CR method: (a) in nitrogen and (b) in air.
Figure 7.
The AARD results under different β values for some reaction models with the CR method: (a) in nitrogen and (b) in air.

Figure 8.
Compensation effect observed between lnA and Ea for nylon-6 tennis string waste.

Figure 9.
Recast α ~ T curves of for thermal degradation of nylon-6 wastes in (a) N2 and (b) air.


Table 1.
Selected reaction models used for describing thermal degradation of nylon-6 tennis string waste.
Table 1.
Selected reaction models used for describing thermal degradation of nylon-6 tennis string waste.
| Model | g(α) | f(α) | Rate-Determining Mechanism |
|---|---|---|---|
| Chemical process equation | |||
| F1/3 | 1-(1 − α)2/3 | (3/2)(1 − α)1/3 | Chemical reaction |
| F1/2 | 1-(1 − α)1/2 | 2(1 − α)1/2 | |
| F2/3 | 1-(1 − α)1/3 | 3(1 − α)2/3 | |
| F3/4 | 1-(1 − α)1/4 | 4 (1 − α)3/4 | |
| F4/5 | 1-(1 − α)1/5 | 5 (1 − α)4/5 | |
| F9/10 | 1-(1 − α)1/10 | 10 (1 − α)9/10 | |
| F1 | −ln(1 − α) | 1 − α | |
| F3/2 | (1 − α)−1/2 − 1 | 2(1 − α)3/2 | |
| F2 | (1 − α)−1 − 1 | (1 − α)2 | |
| Fn (n ≠ 1) | [(1 − α)1-n − 1]/(n − 1) | (1 − α)n | |
| Acceleratory rate equation | |||
| P3/2 | α3/2 | (2/3)α−1/2 | Nucleation (power law) |
| P2 | α2 | (1/2)α−1 | |
| Sigmoidal rate equation | |||
| A3/4 | [−ln(1 − α) ]4/3 | (3/4)(1 − α)[−ln(1 − α)]−1/3 | Random nucleation (Avrami–Erofeev) |
| A3/2 | [−ln(1 − α) ]2/3 | (3/2)(1 − α)[−ln(1 − α)]1/3 | |
| A2 | [−ln(1 − α) ]1/2 | 2(1 − α)[−ln(1 − α)]1/2 | |
| A5/2 | [−ln(1 − α) ]2/5 | (5/2)(1 − α)[−ln(1 − α)]3/5 | |
| A3 | [−ln(1 − α)]1/3 | 3(1 − α)[−ln(1 − α)]2/3 | |
| An (n ≠ 1) | [−ln(1 − α) ]1/n | n(1 − α)[−ln(1 − α)](1−1/n) | |
| Deceleratory rate equation | |||
| D3 | [1 − (1 − α)1/3]2 | (3/2)(1 − α)2/3[1 − (1 − α)1/3]−1 | Three-dimensional diffusion |
| D6 | [(1 + α)1/3 − 1]2 | (3/2)(1 + α)2/3[(1 + α)1/3 − 1]−1 | |
| D7 | 1 + (2/3)α − (1 + α)2/3 | (3/2)[(1 + α)−1/3 − 1]−1 | |
| D8 | [(1 + α)−1/3 − 1]2 | (3/2)(1 + α)4/3[(1 + α)−1/3 − 1]−1 | |
Table 2.
Activation energies calculated using the SK method for thermal degradation of nylon-6 tennis string wastes.
Table 2.
Activation energies calculated using the SK method for thermal degradation of nylon-6 tennis string wastes.
| α | N2 | Air | ||
|---|---|---|---|---|
| Ea (kJ/mol) | R2 | Ea (kJ/mol) | R2 | |
| 0.05 | 142.79 | 0.9697 | 90.45 | 0.9818 |
| 0.10 | 165.74 | 0.9430 | 104.37 | 0.9901 |
| 0.15 | 174.02 | 0.9419 | 123.21 | 0.9917 |
| 0.20 | 175.52 | 0.9541 | 126.07 | 0.9732 |
| 0.25 | 177.48 | 0.9662 | 131.51 | 0.9713 |
| 0.30 | 178.96 | 0.9670 | 132.43 | 0.9688 |
| 0.35 | 181.75 | 0.9714 | 139.18 | 0.9681 |
| 0.40 | 184.68 | 0.9793 | 146.79 | 0.9641 |
| 0.45 | 188.37 | 0.9845 | 156.03 | 0.9664 |
| 0.50 | 192.12 | 0.9878 | 164.13 | 0.9715 |
| 0.55 | 195.74 | 0.9900 | 171.30 | 0.9770 |
| 0.60 | 199.45 | 0.9910 | 176.24 | 0.9819 |
| 0.65 | 201.73 | 0.9921 | 178.16 | 0.9851 |
| 0.70 | 203.08 | 0.9924 | 177.28 | 0.9870 |
| 0.75 | 204.21 | 0.9928 | 173.68 | 0.9880 |
| 0.80 | 204.81 | 0.9925 | 170.48 | 0.9888 |
| 0.85 | 205.73 | 0.9923 | 168.62 | 0.9898 |
| 0.90 | 205.94 | 0.9912 | 168.00 | 0.9908 |
| 0.95 | 207.97 | 0.9901 | 171.80 | 0.9860 |
| Average | 188.95 ± 16.73 | 151.04 ± 25.87 | ||
Table 3.
Thermodynamic parameters of ΔH, ΔS, and ΔG calculated for thermal degradation of nylon-6 tennis string wastes.
Table 3.
Thermodynamic parameters of ΔH, ΔS, and ΔG calculated for thermal degradation of nylon-6 tennis string wastes.
| α | N2 | Air | ||||||
|---|---|---|---|---|---|---|---|---|
| lnA | ΔH | ΔS | ΔG | lnA | ΔH | ΔS | ΔG | |
| (min−1) | (kJ/mol) | (J/mol K) | (kJ/mol) | (min−1) | (kJ/mol) | (J/mol K) | (kJ/mol) | |
| 0.05 | 22.13 | 136.97 | −75.85 | 187.10 | 12.50 | 84.71 | −155.76 | 185.72 |
| 0.10 | 26.42 | 159.80 | −40.37 | 187.12 | 15.45 | 98.50 | −131.41 | 185.74 |
| 0.15 | 27.92 | 167.99 | −28.06 | 187.26 | 19.11 | 117.27 | −101.14 | 185.41 |
| 0.20 | 28.19 | 169.44 | −25.90 | 187.40 | 19.69 | 120.06 | −96.40 | 185.74 |
| 0.25 | 28.54 | 171.35 | −23.04 | 187.44 | 20.70 | 125.44 | −88.09 | 186.04 |
| 0.30 | 28.81 | 172.79 | −20.80 | 187.41 | 20.88 | 126.31 | −86.66 | 186.41 |
| 0.35 | 29.32 | 175.55 | −16.64 | 187.31 | 22.11 | 133.03 | −76.45 | 186.41 |
| 0.40 | 29.84 | 178.45 | −12.32 | 187.20 | 23.49 | 140.60 | −65.05 | 186.29 |
| 0.45 | 30.50 | 182.12 | −6.91 | 187.05 | 25.14 | 149.82 | −51.37 | 186.09 |
| 0.50 | 31.16 | 185.85 | −1.41 | 186.86 | 26.58 | 157.89 | −39.47 | 185.89 |
| 0.55 | 31.81 | 189.45 | 3.89 | 186.65 | 27.83 | 165.04 | −29.06 | 185.75 |
| 0.60 | 32.46 | 193.13 | 9.29 | 186.43 | 28.69 | 169.96 | −21.94 | 185.67 |
| 0.65 | 32.87 | 195.40 | 12.69 | 186.22 | 29.03 | 171.85 | −19.23 | 185.68 |
| 0.70 | 33.12 | 196.72 | 14.75 | 186.02 | 28.88 | 170.95 | −20.47 | 185.73 |
| 0.75 | 33.34 | 197.84 | 16.54 | 185.79 | 28.27 | 167.32 | −25.53 | 185.83 |
| 0.80 | 33.47 | 198.42 | 17.59 | 185.56 | 27.75 | 164.08 | −29.95 | 185.88 |
| 0.85 | 33.66 | 199.31 | 19.12 | 185.29 | 27.46 | 162.19 | −32.36 | 185.85 |
| 0.90 | 33.73 | 199.49 | 19.67 | 185.00 | 27.40 | 161.54 | −32.92 | 185.73 |
| 0.95 | 34.11 | 201.48 | 22.79 | 184.59 | 28.10 | 165.30 | −27.17 | 185.40 |
Publisher’s Note: MDPI stays neutral with regard to jurisdictional claims in published maps and institutional affiliations. |
© 2021 by the authors. Licensee MDPI, Basel, Switzerland. This article is an open access article distributed under the terms and conditions of the Creative Commons Attribution (CC BY) license (https://creativecommons.org/licenses/by/4.0/).
Share and Cite
MDPI and ACS Style
Wan, H.; Huang, Z. Kinetic Analysis of Pyrolysis and Thermo-Oxidative Decomposition of Tennis String Nylon Wastes. Materials 2021, 14, 7564. https://0-doi-org.brum.beds.ac.uk/10.3390/ma14247564
AMA Style
Wan H, Huang Z. Kinetic Analysis of Pyrolysis and Thermo-Oxidative Decomposition of Tennis String Nylon Wastes. Materials. 2021; 14(24):7564. https://0-doi-org.brum.beds.ac.uk/10.3390/ma14247564
Chicago/Turabian StyleWan, Haibo, and Zhen Huang. 2021. "Kinetic Analysis of Pyrolysis and Thermo-Oxidative Decomposition of Tennis String Nylon Wastes" Materials 14, no. 24: 7564. https://0-doi-org.brum.beds.ac.uk/10.3390/ma14247564
Note that from the first issue of 2016, this journal uses article numbers instead of page numbers. See further details here.