
Prediction of Material Failure Time for a Bucket Wheel Excavator Boom Using Computer Simulation

 ,
,  , ,
, ,  ,
,
Abstract
:1. Introduction
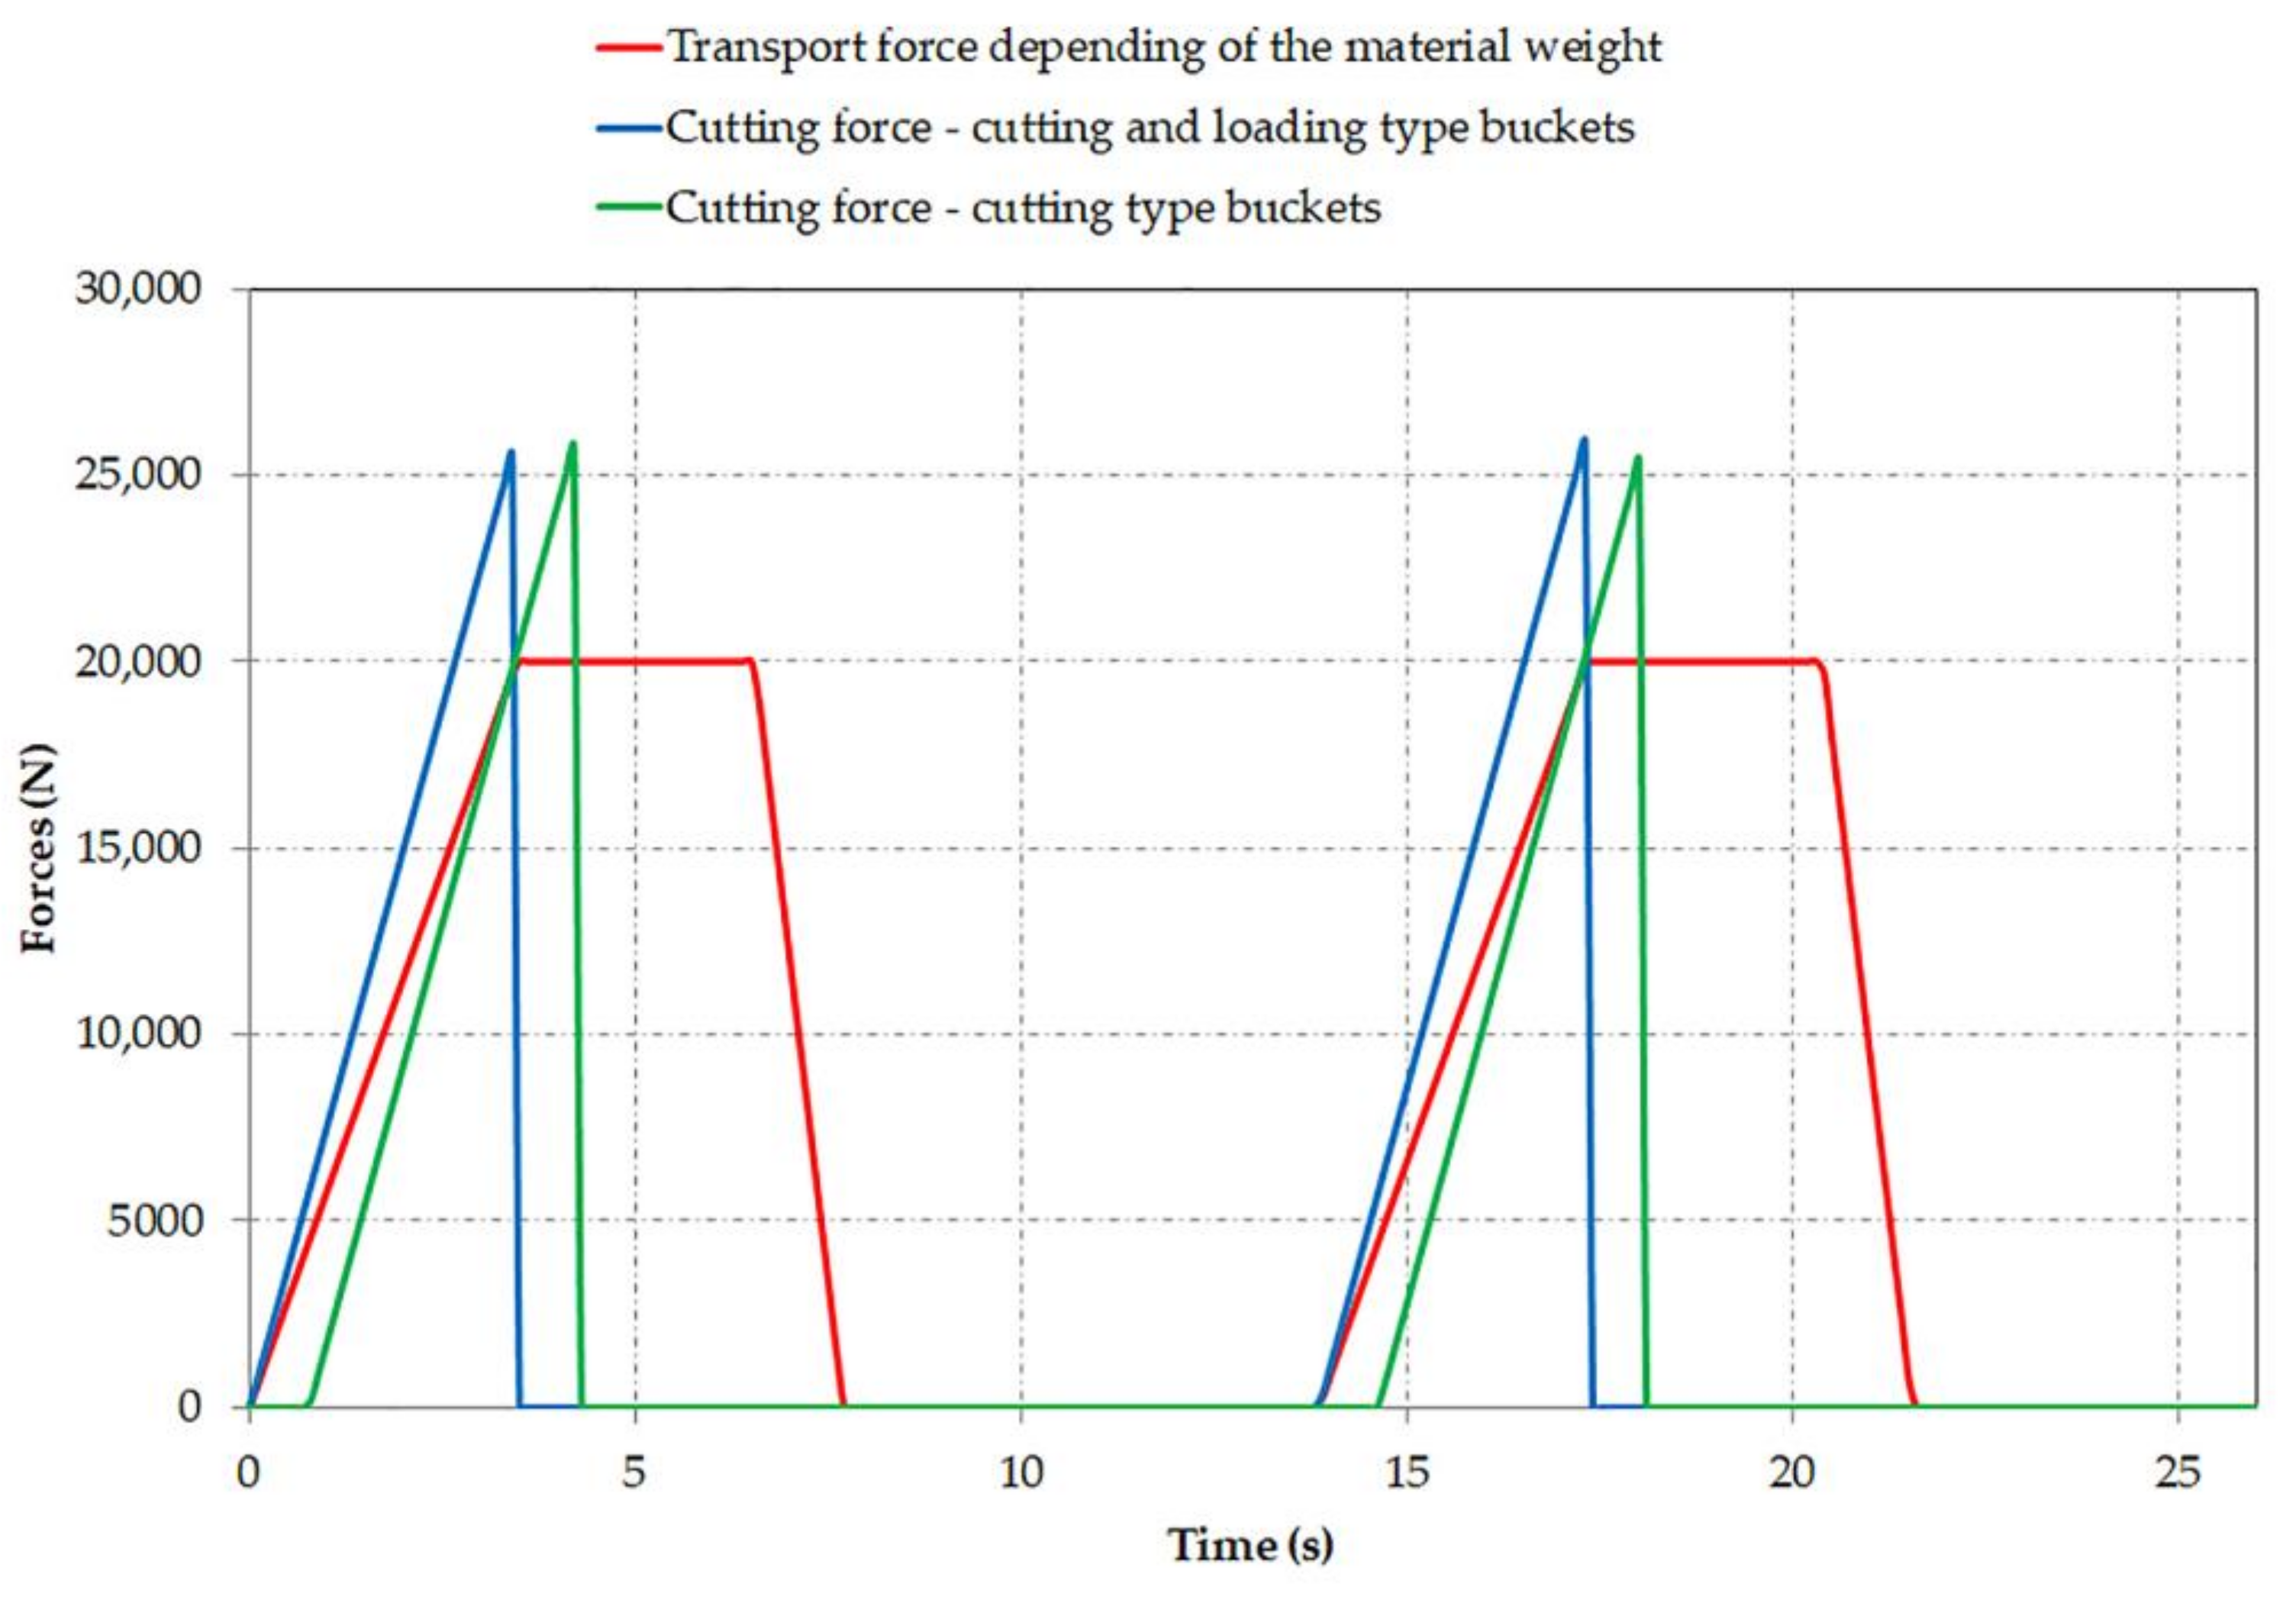
- The excavation forces are determined and imposed on the model in the case of a bucket wheel fitted with cutter-loader buckets;
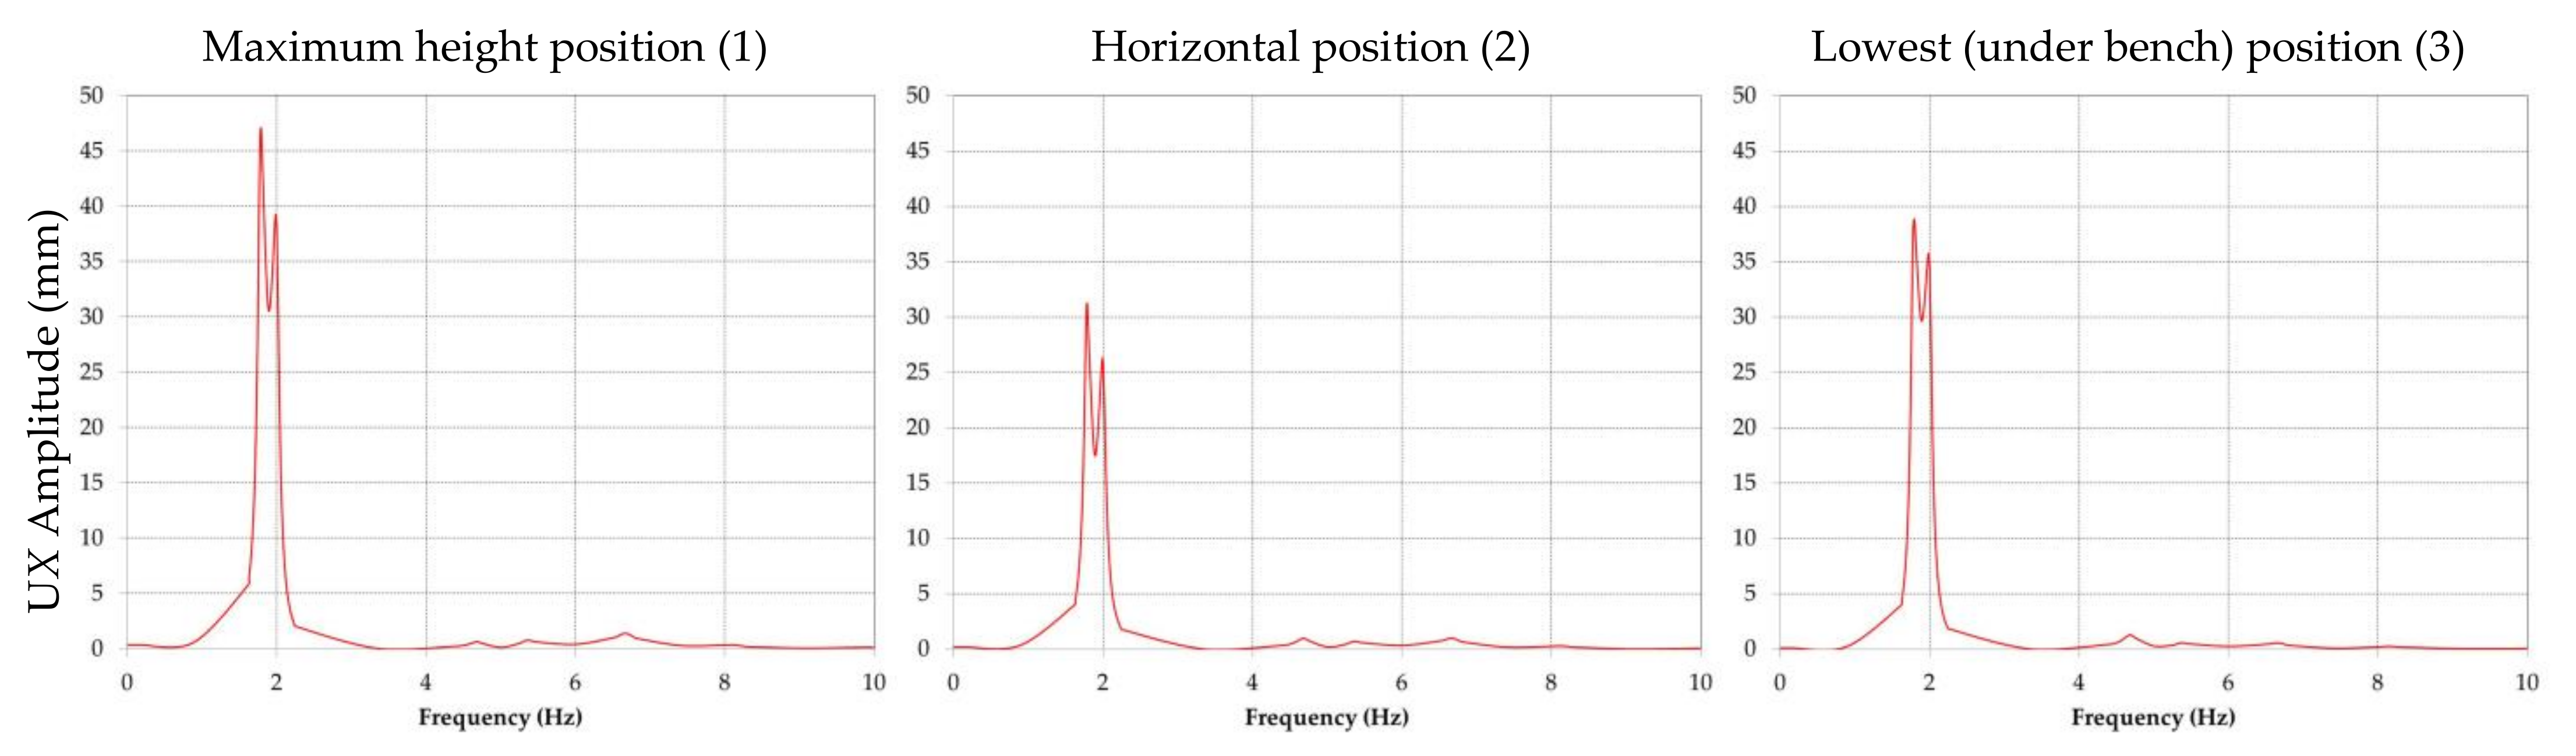
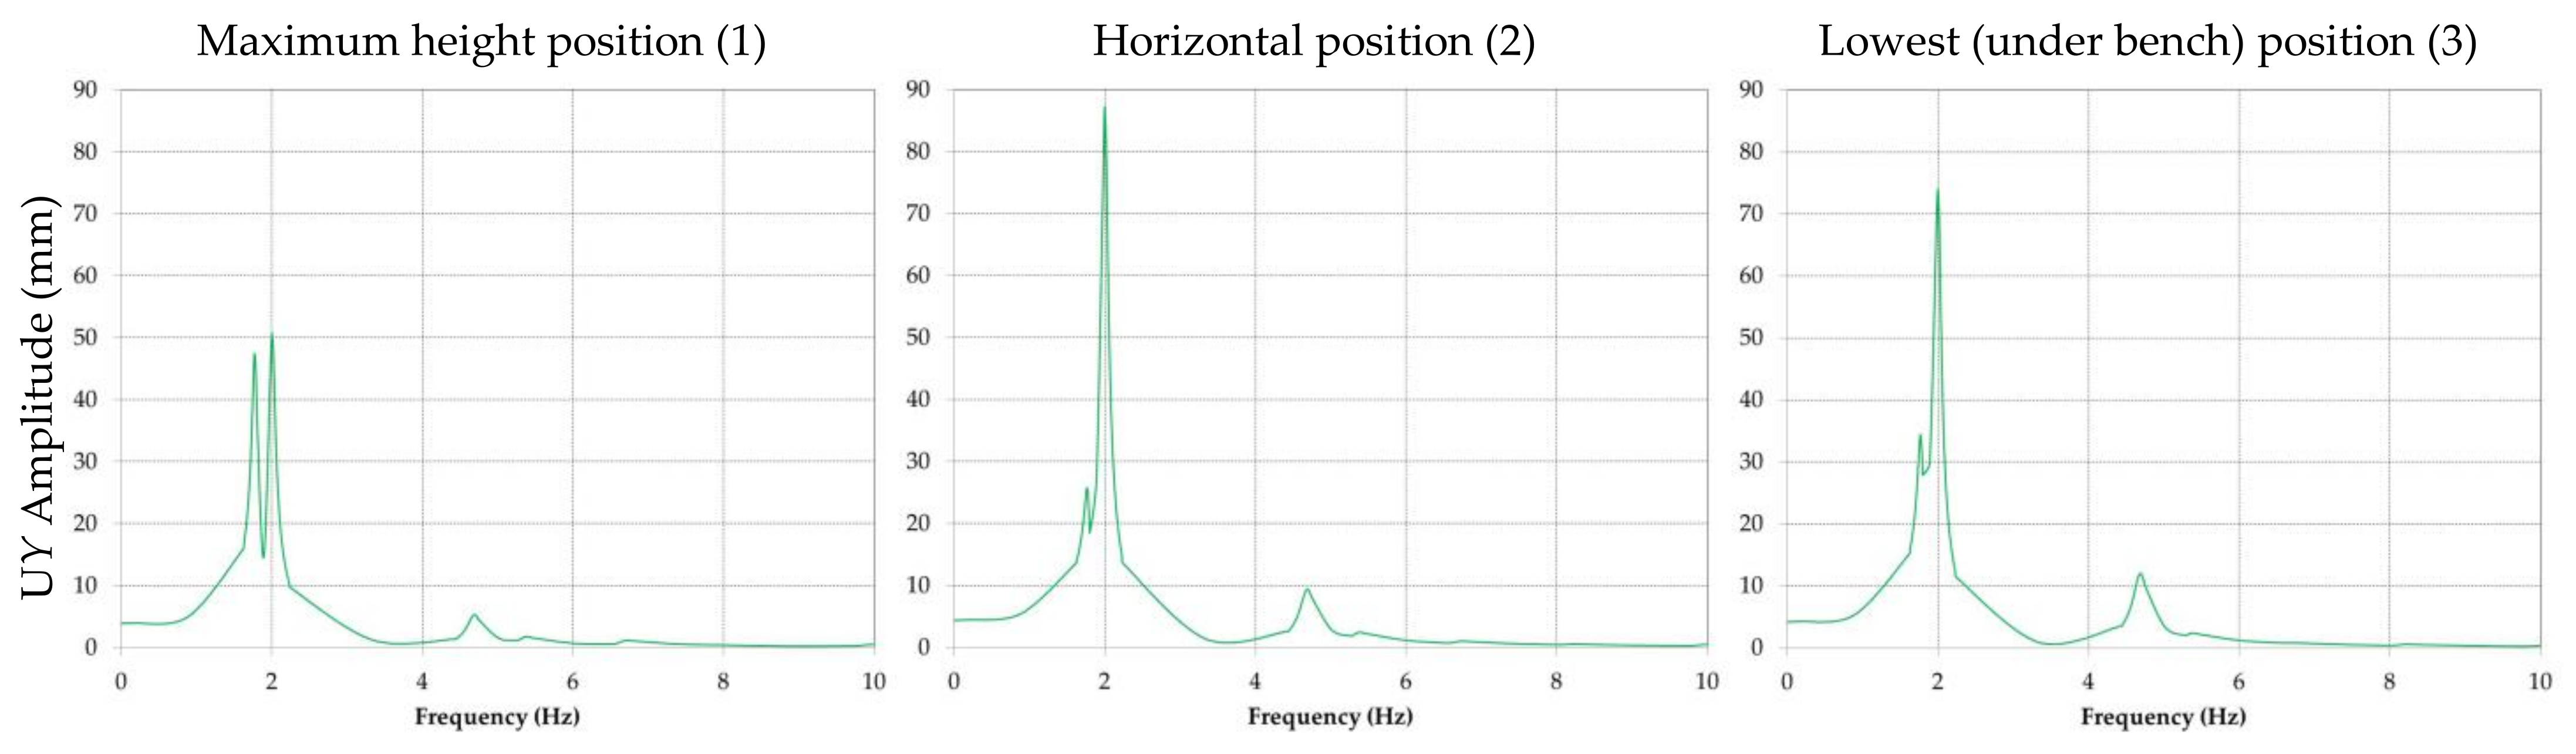
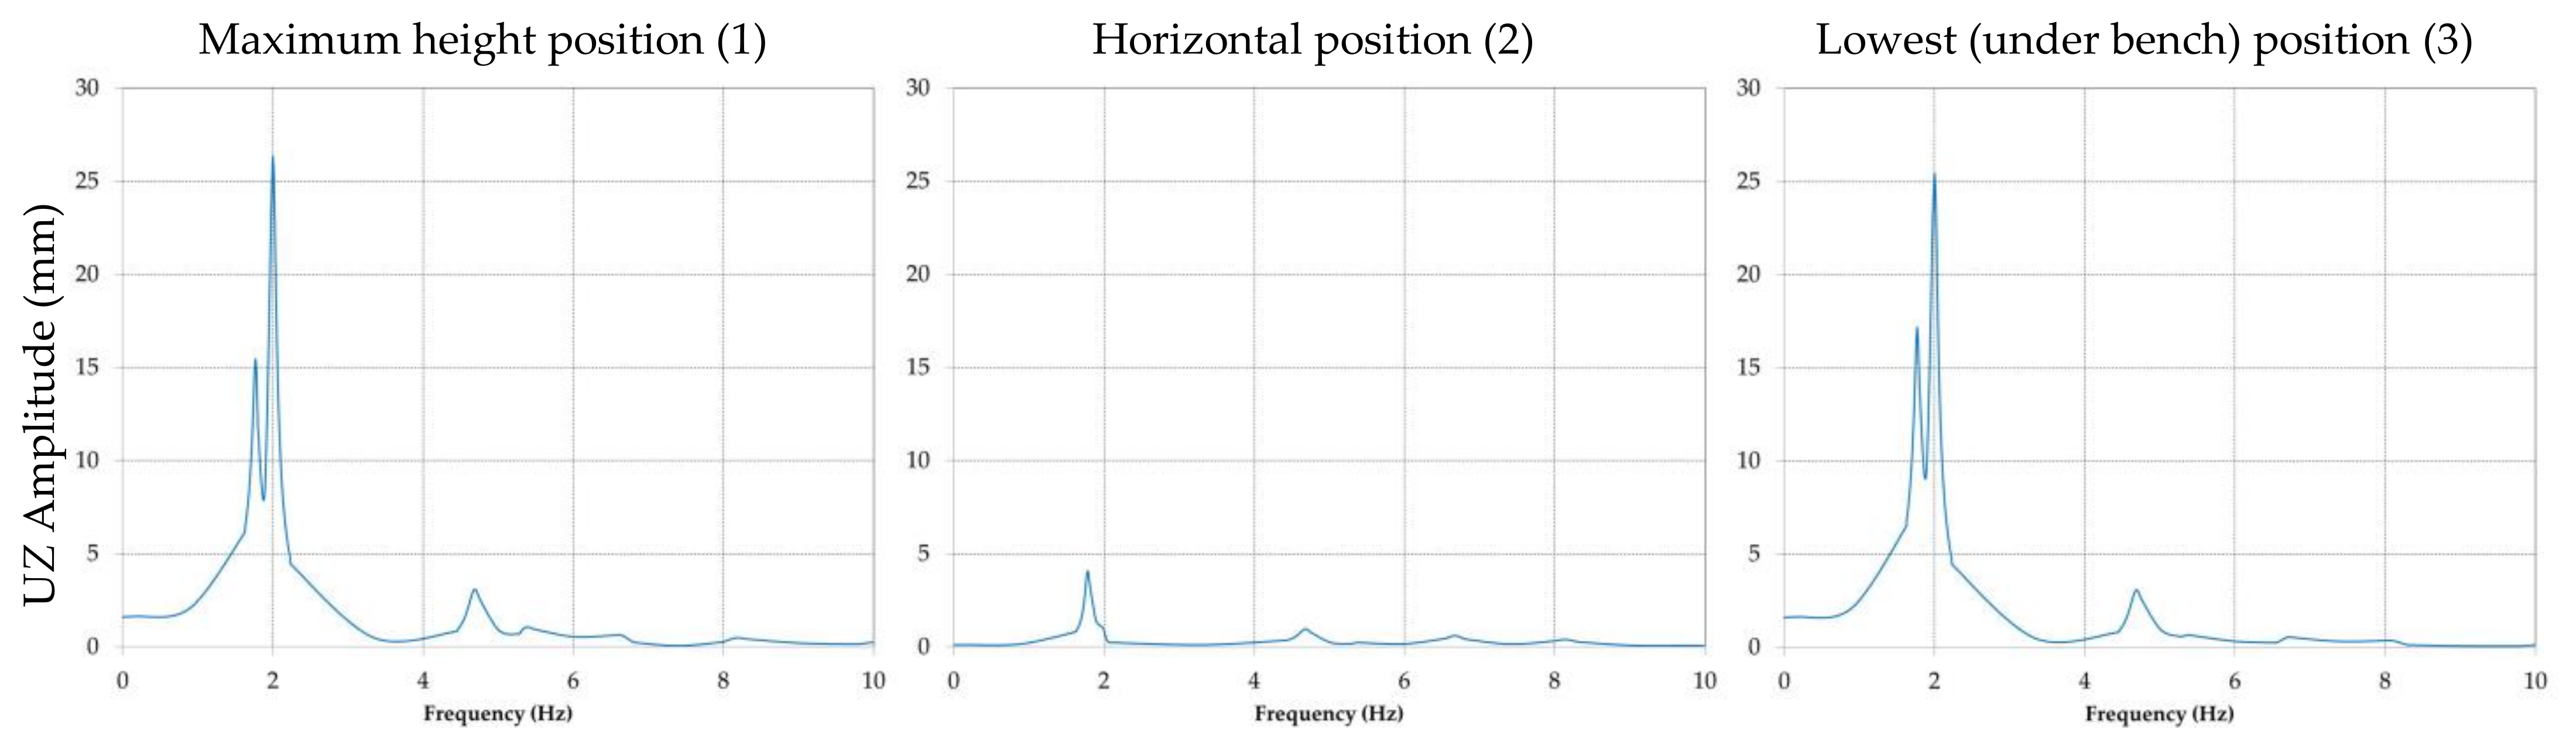
- Based on the estimated forces of excavation, we analyze the frequency response, considering a 2% global damping, in three positions of the BWE boom: maximum height excavation position, horizontal position and lowest possible excavation position under the bench;
- For the horizontal position of the boom the simulations show the maximum amplitude response, so for this position we will perform the dynamic analysis of the time response with a 2% global damping;
- As the time response results show the element with the biggest displacement for each modal frequency, we can conduct a fatigue study.
2. Materials and Methods
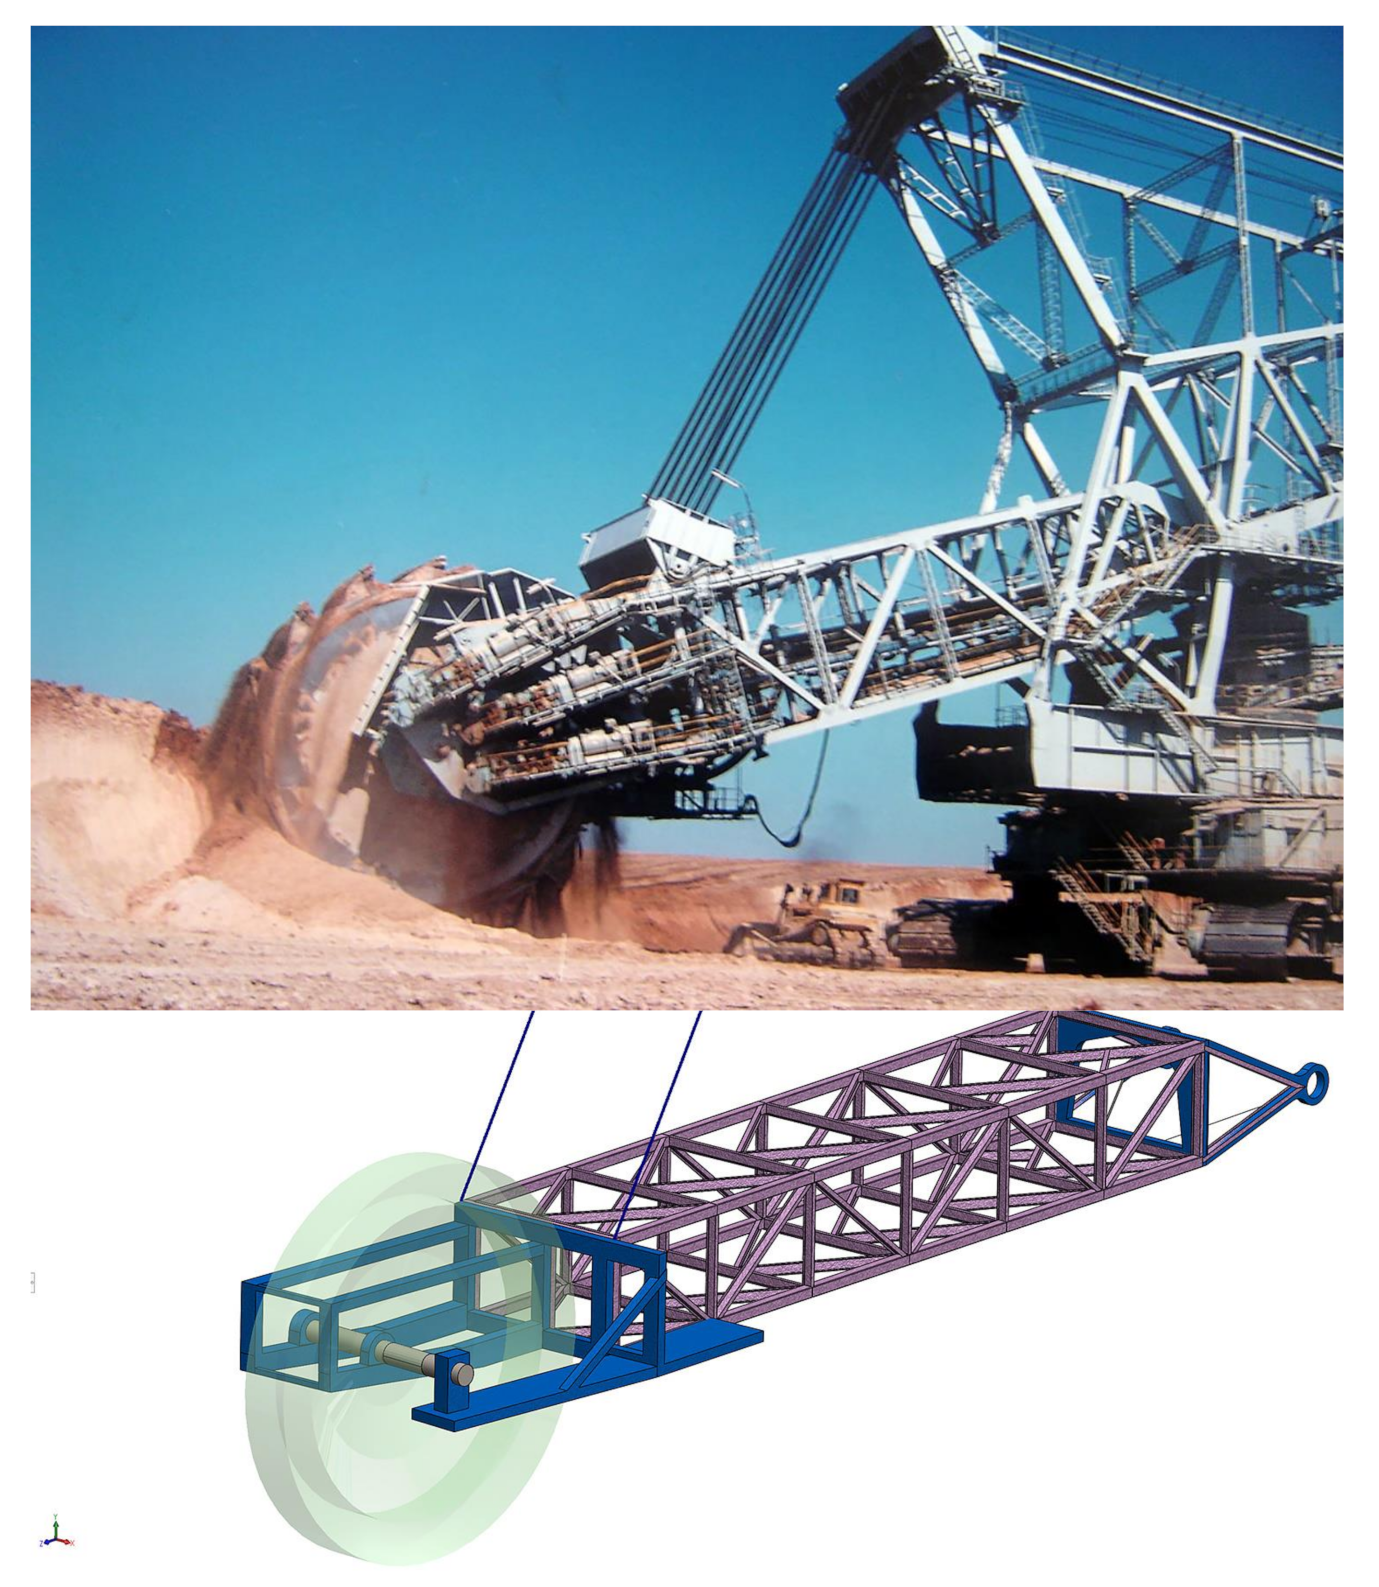
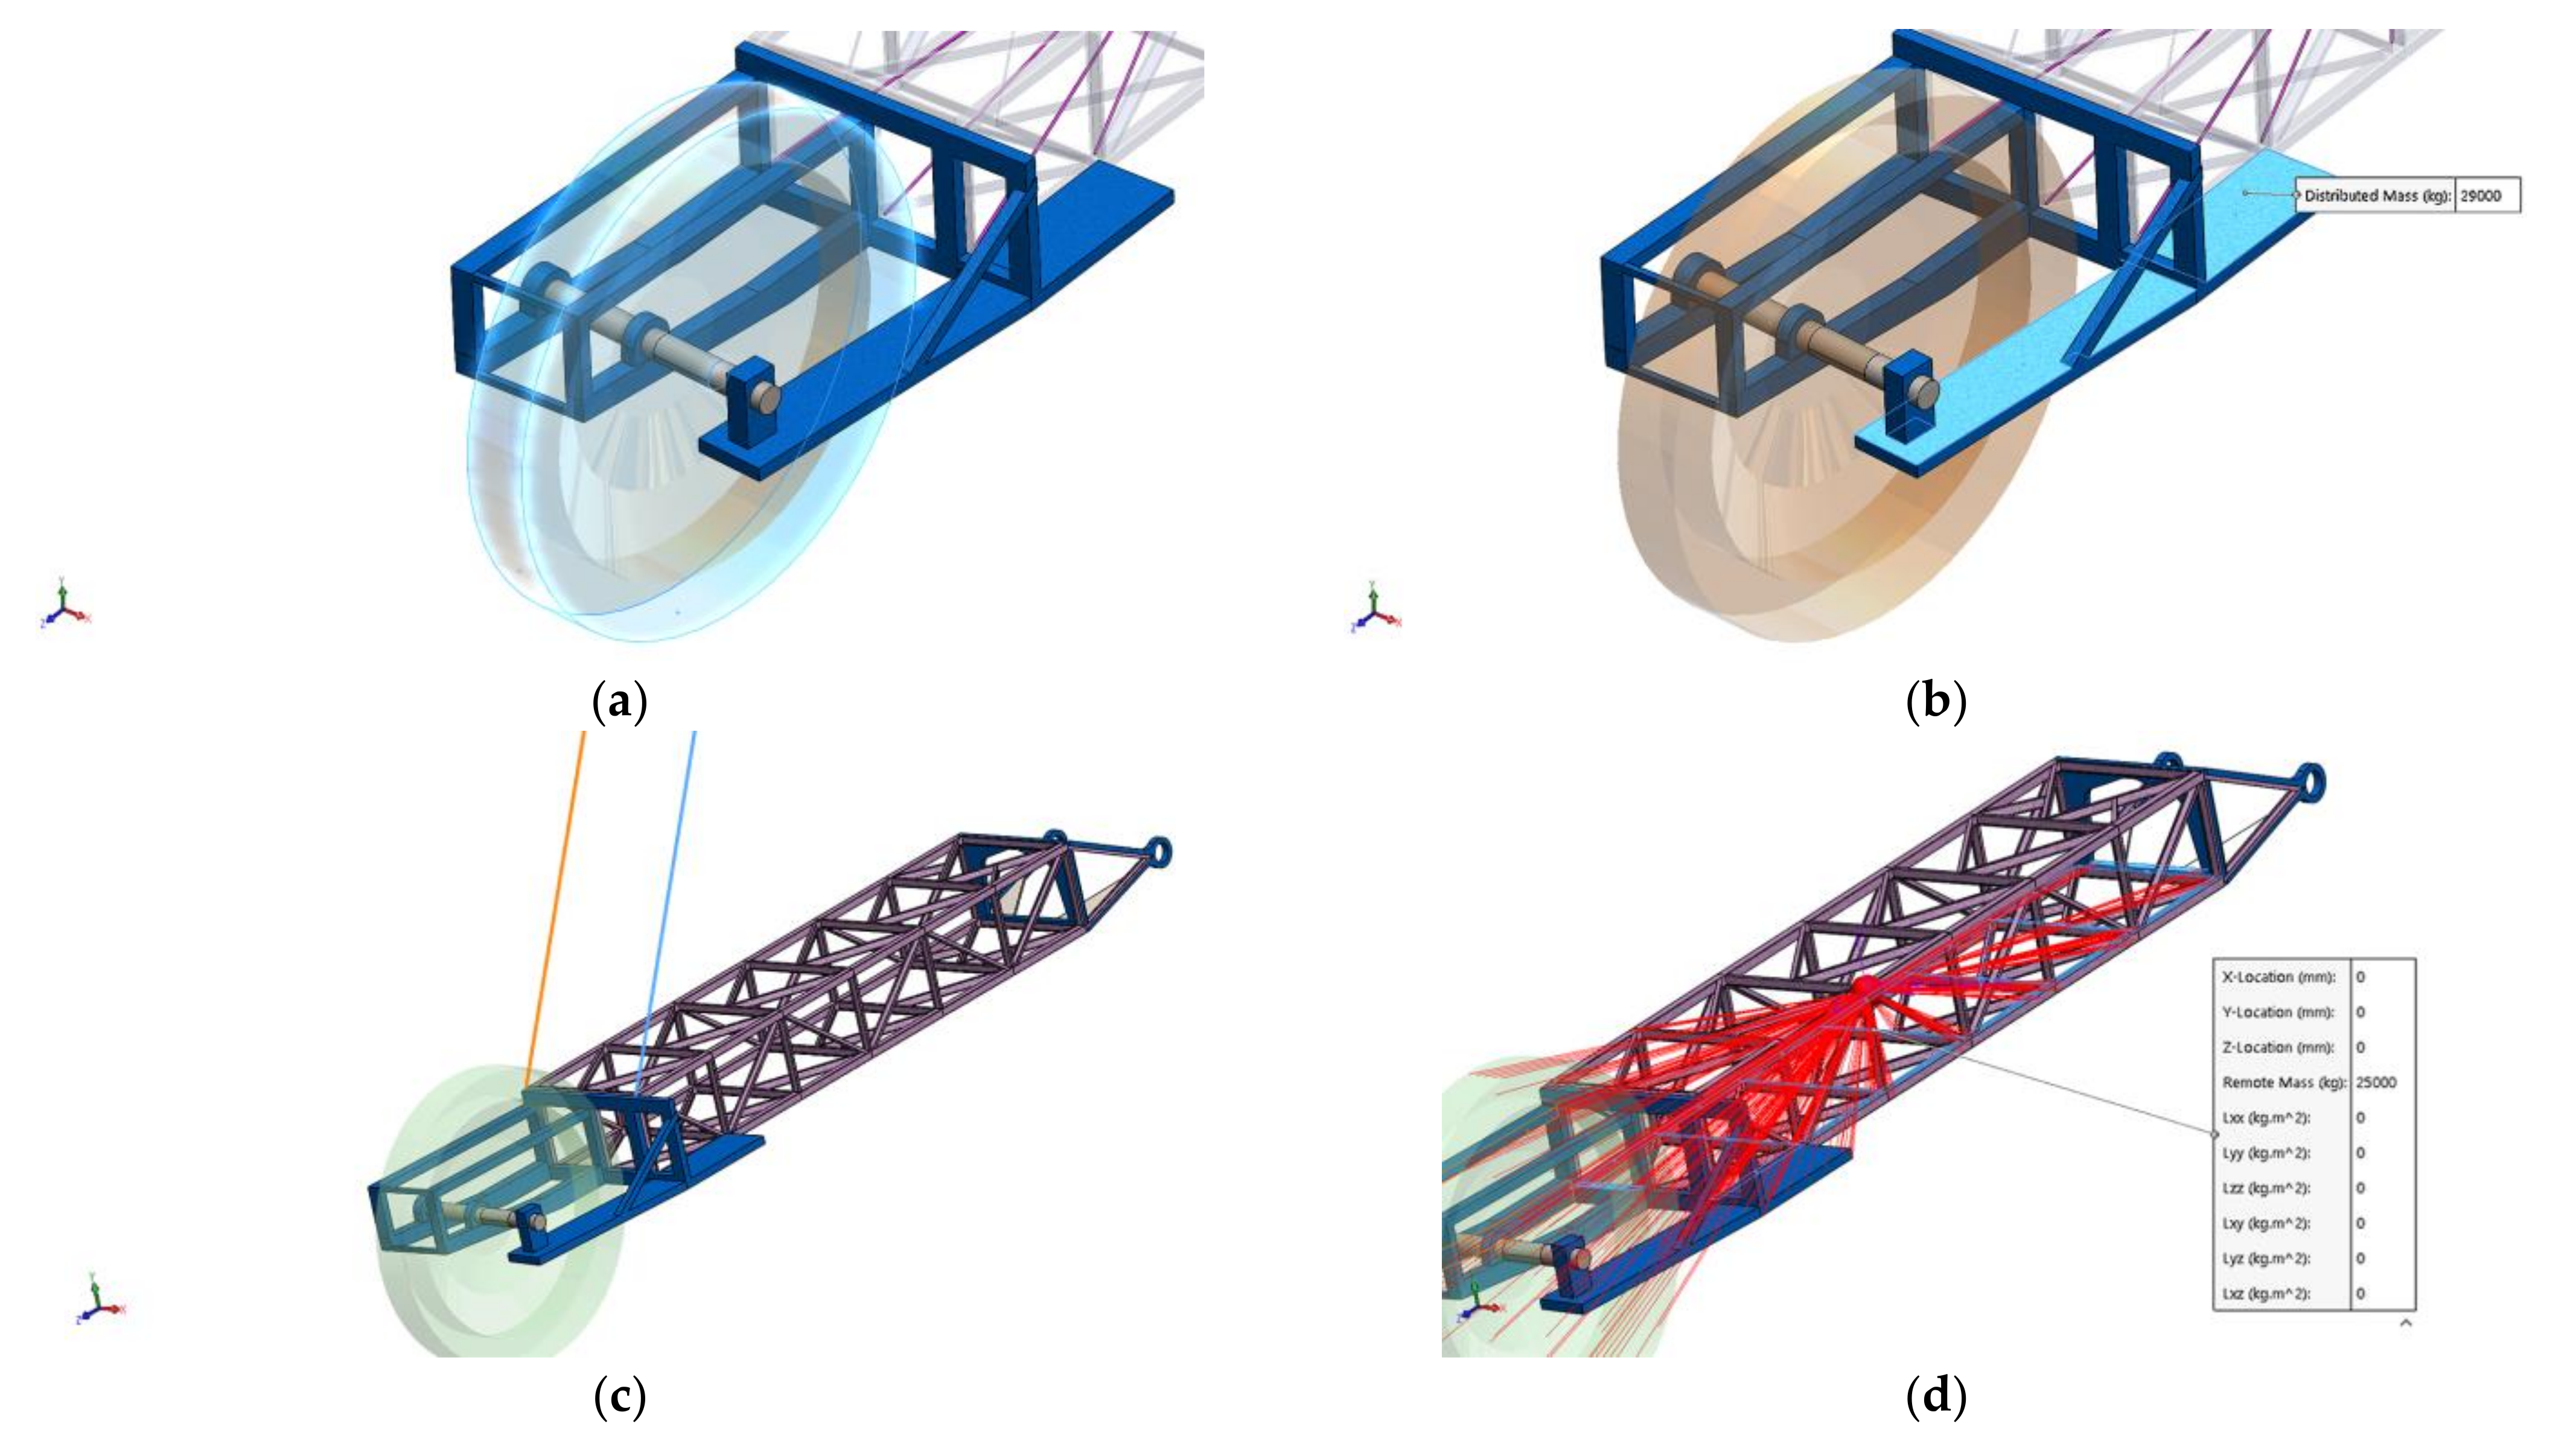
2.1. Description of the BWE Boom Model
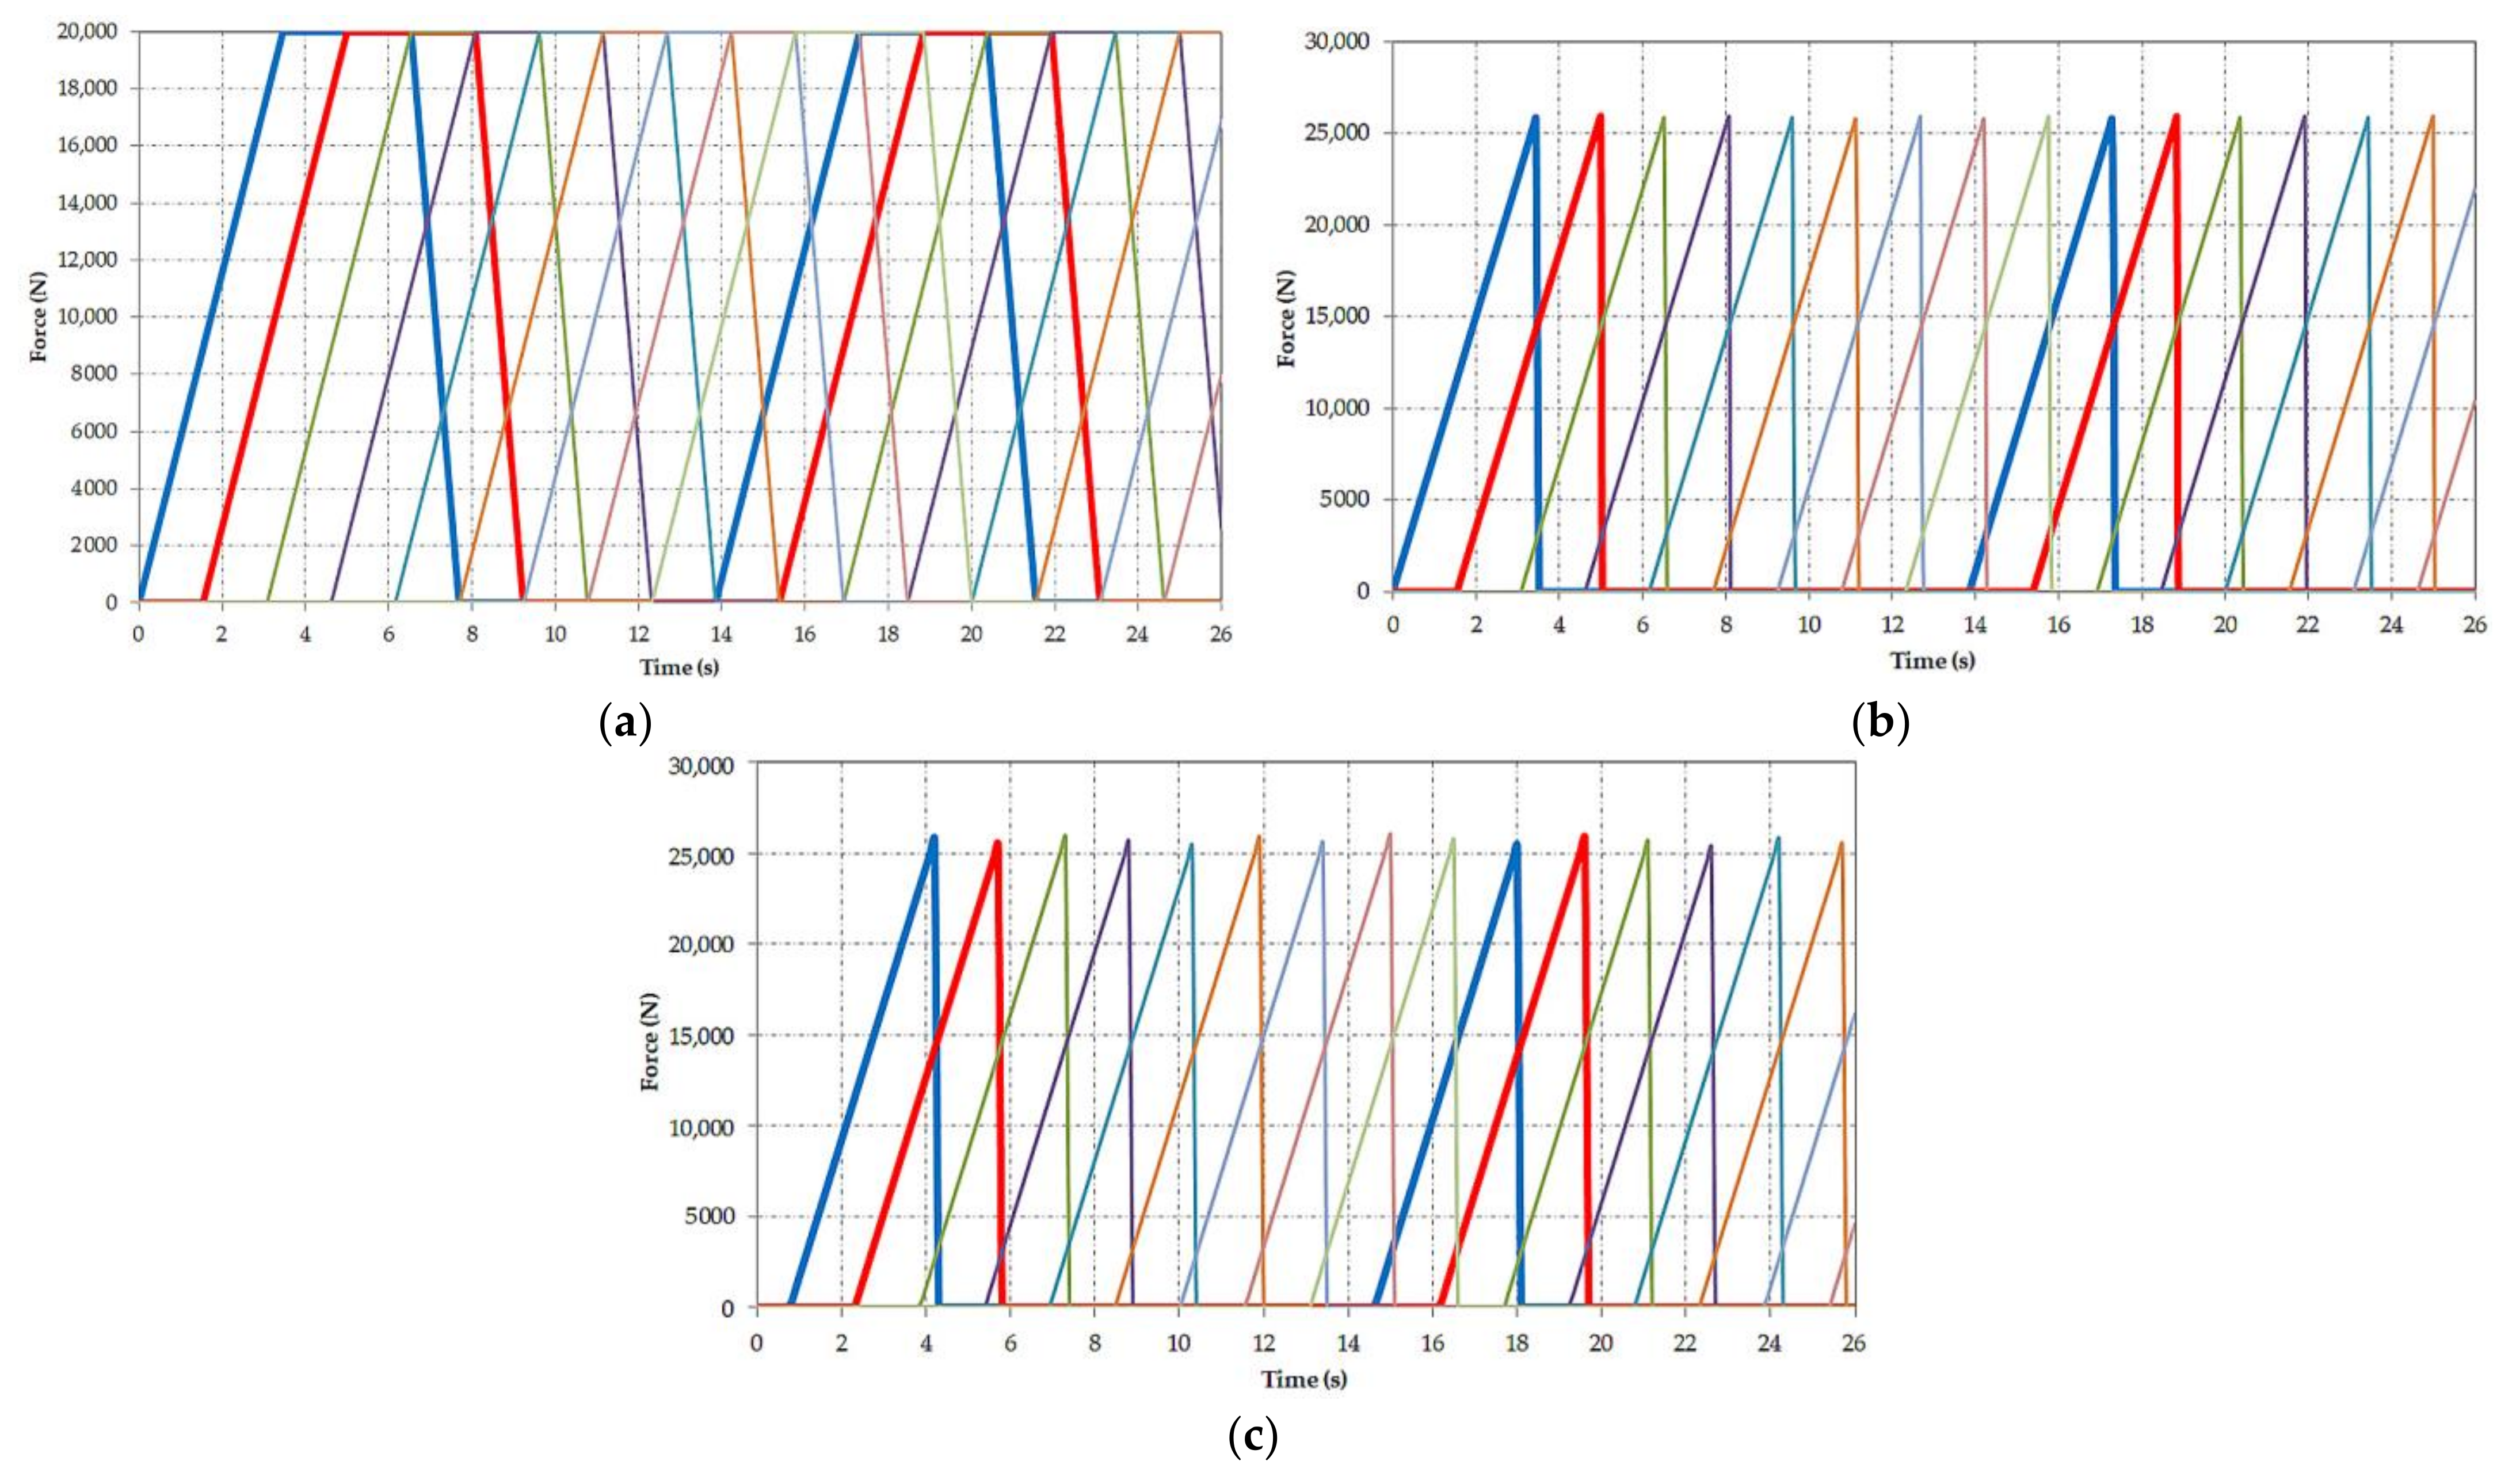
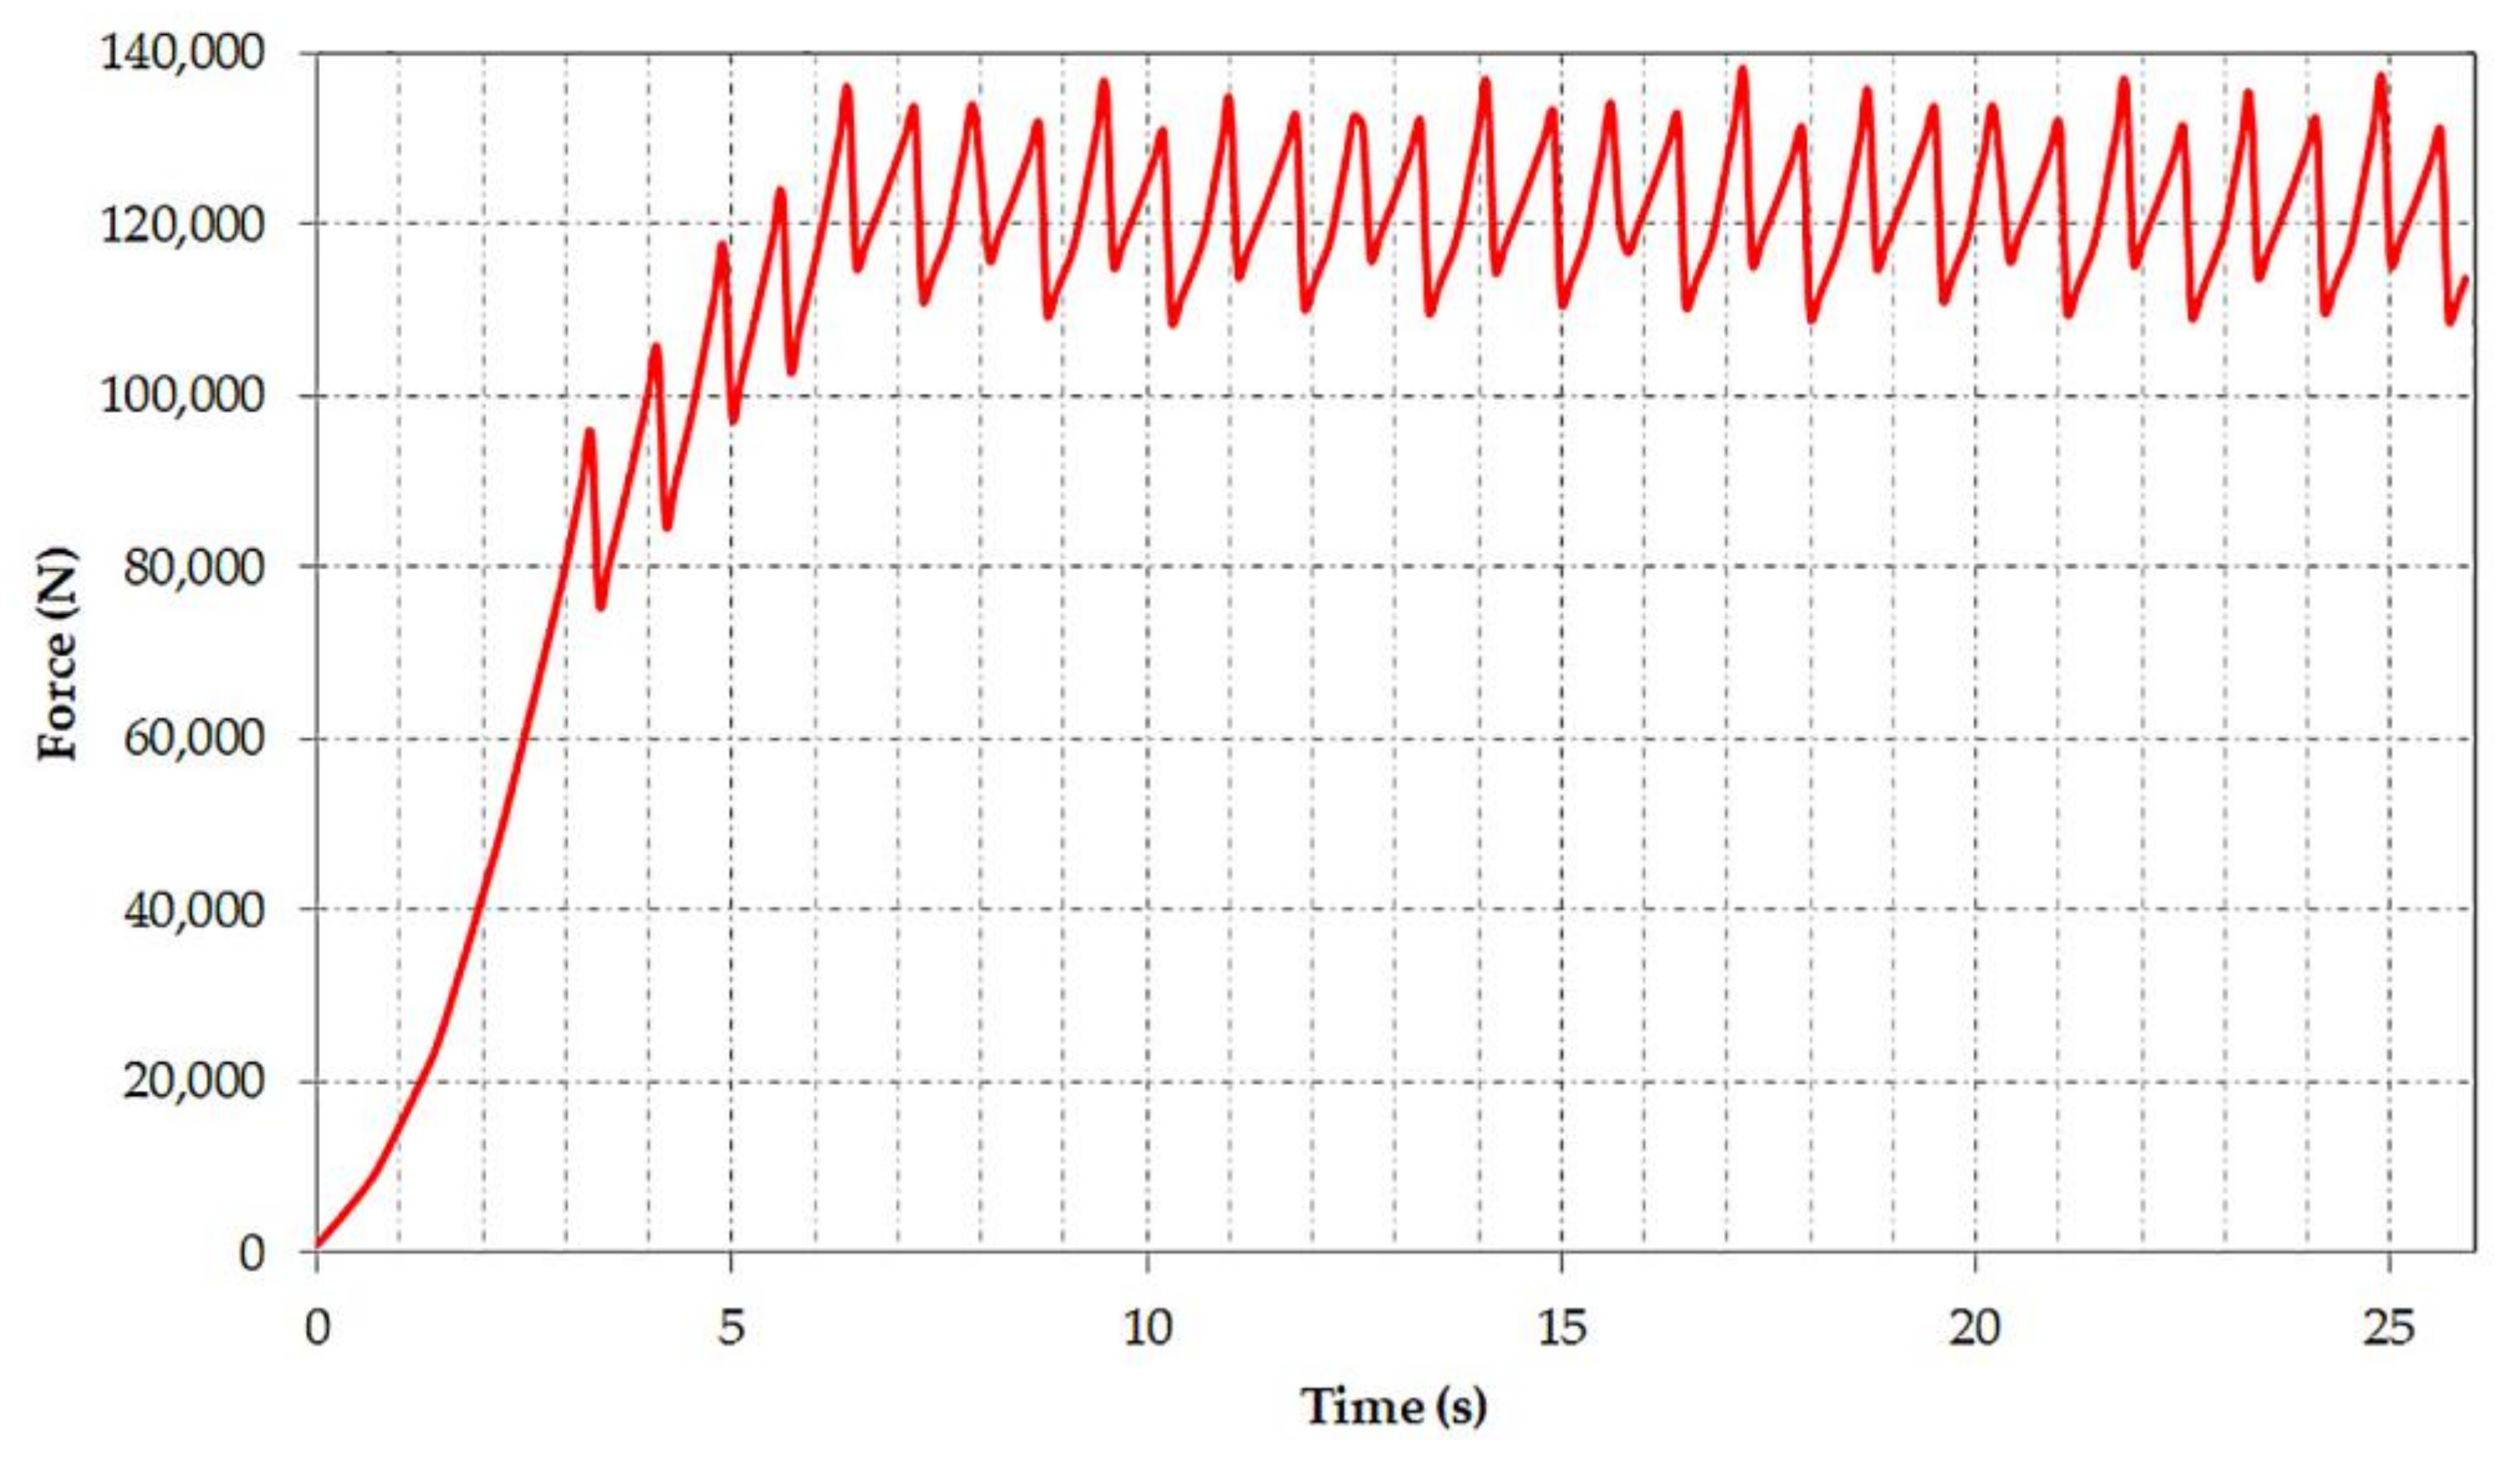
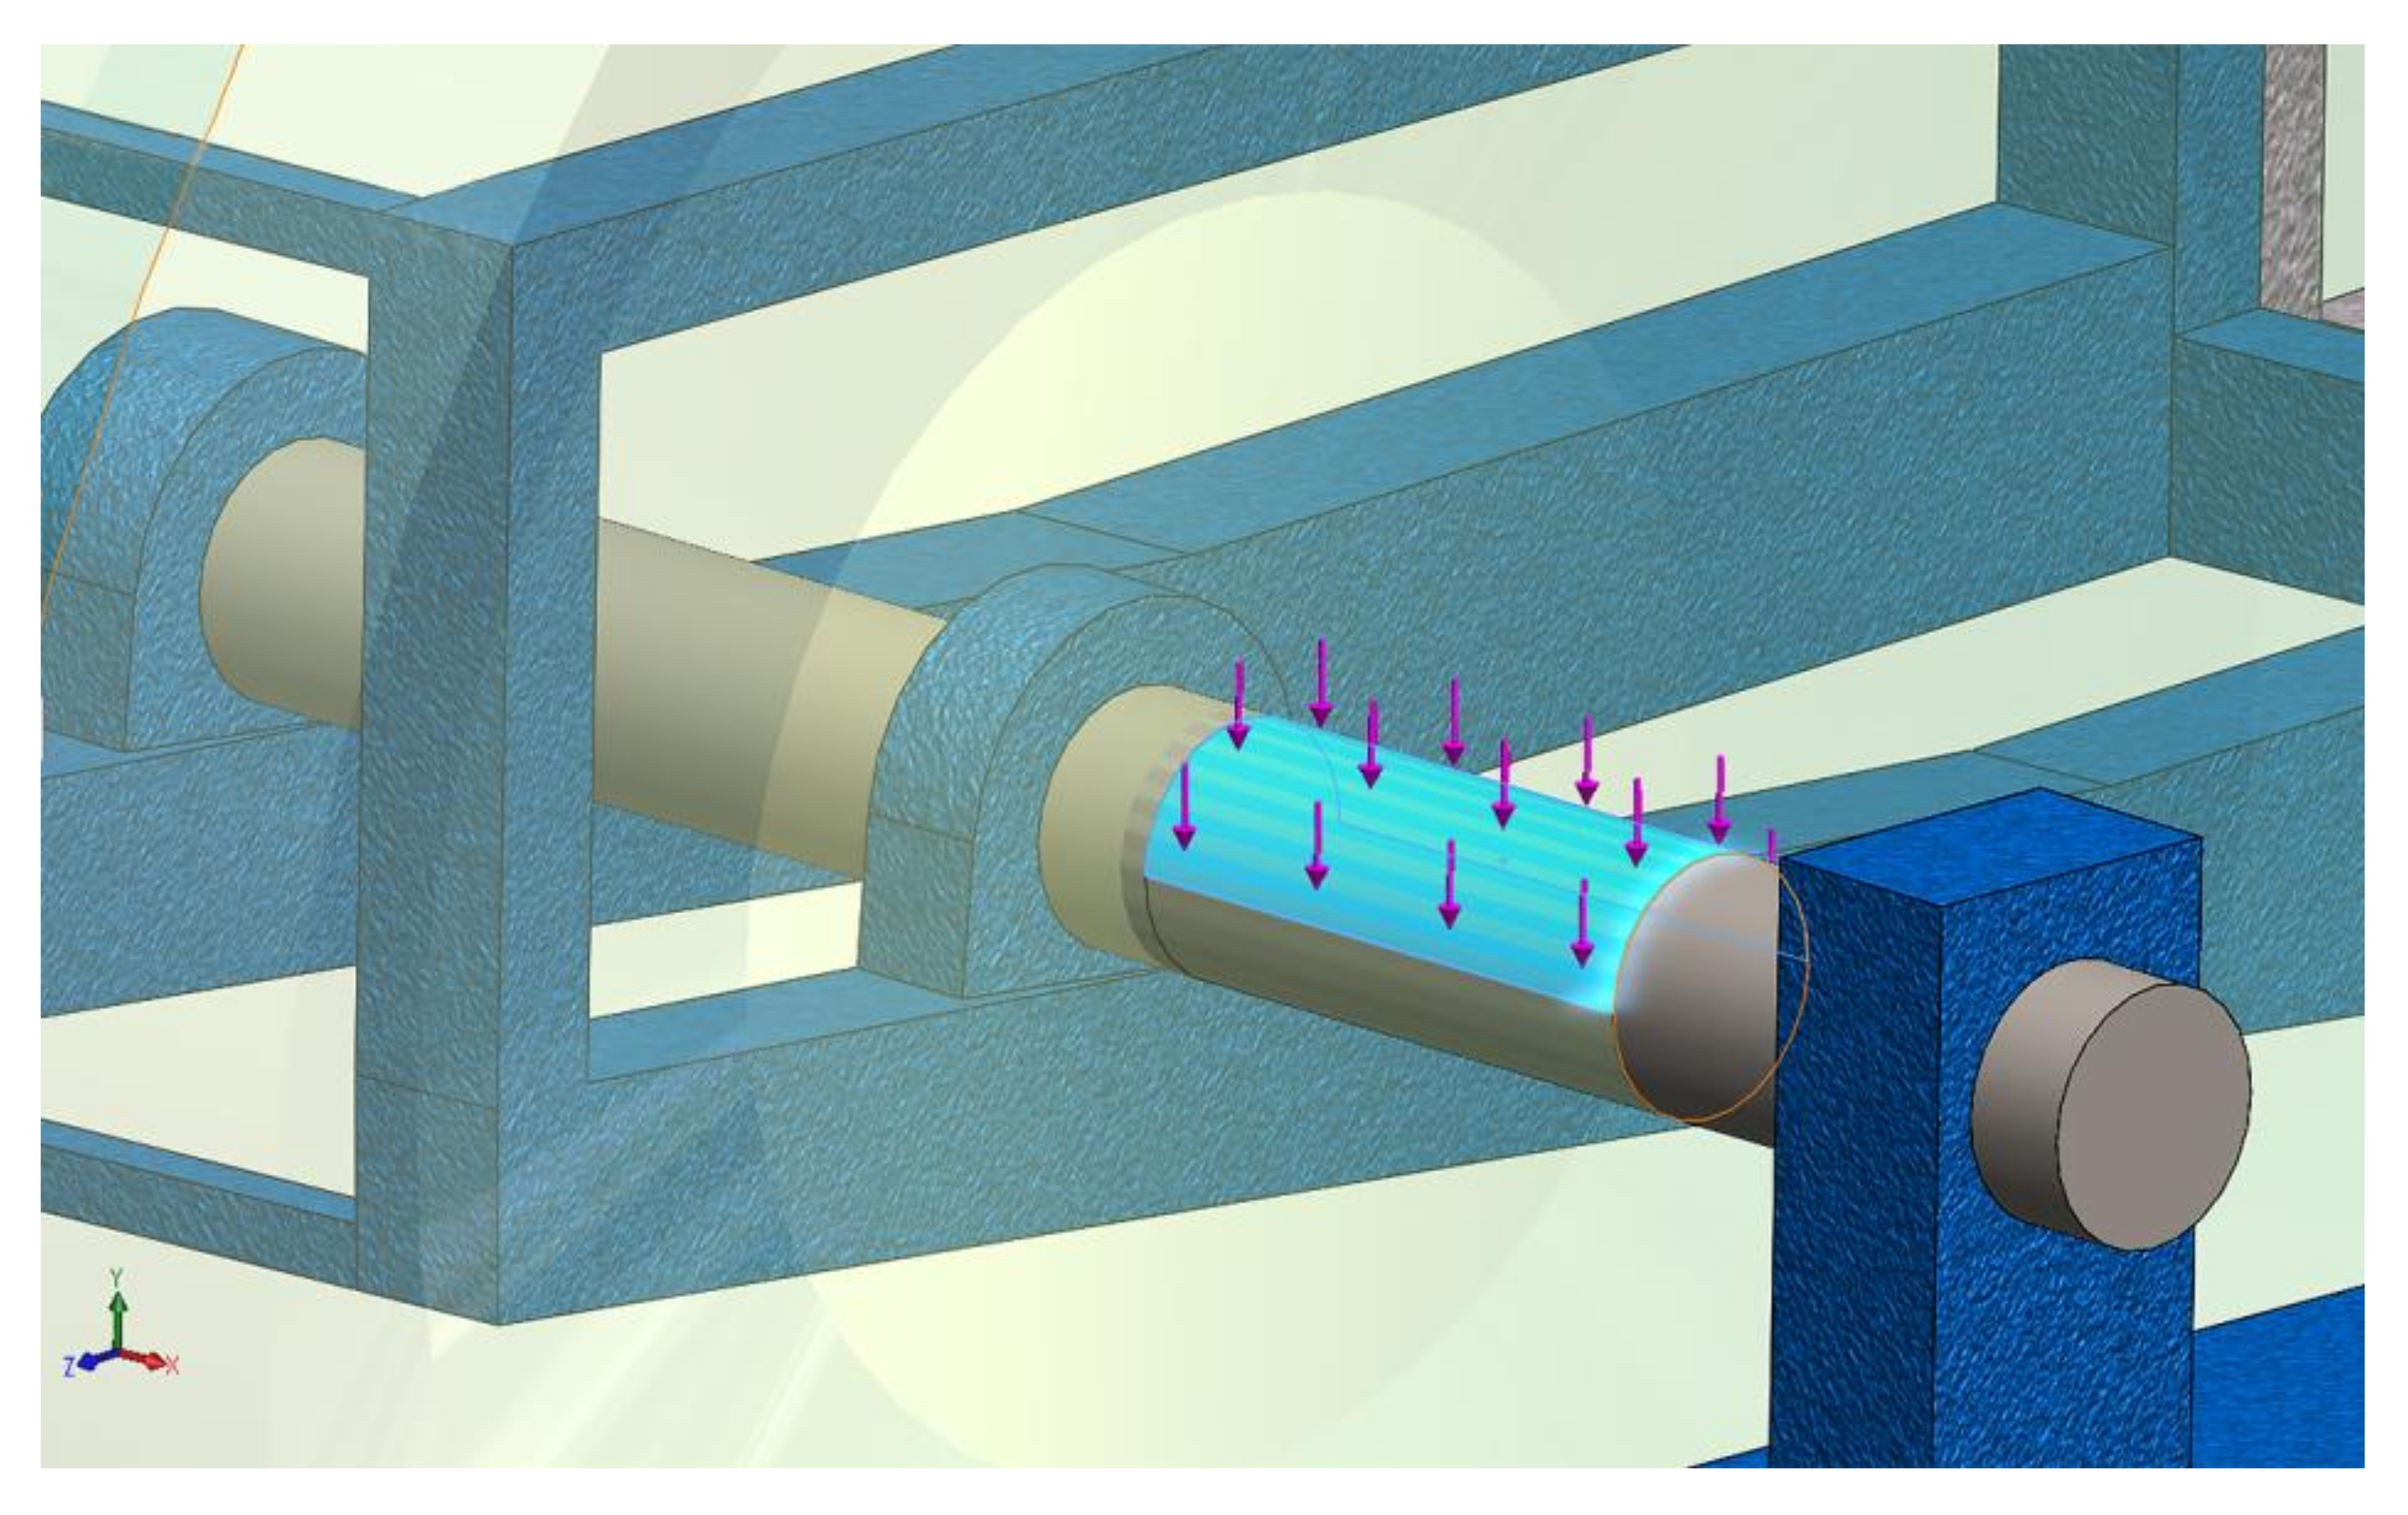
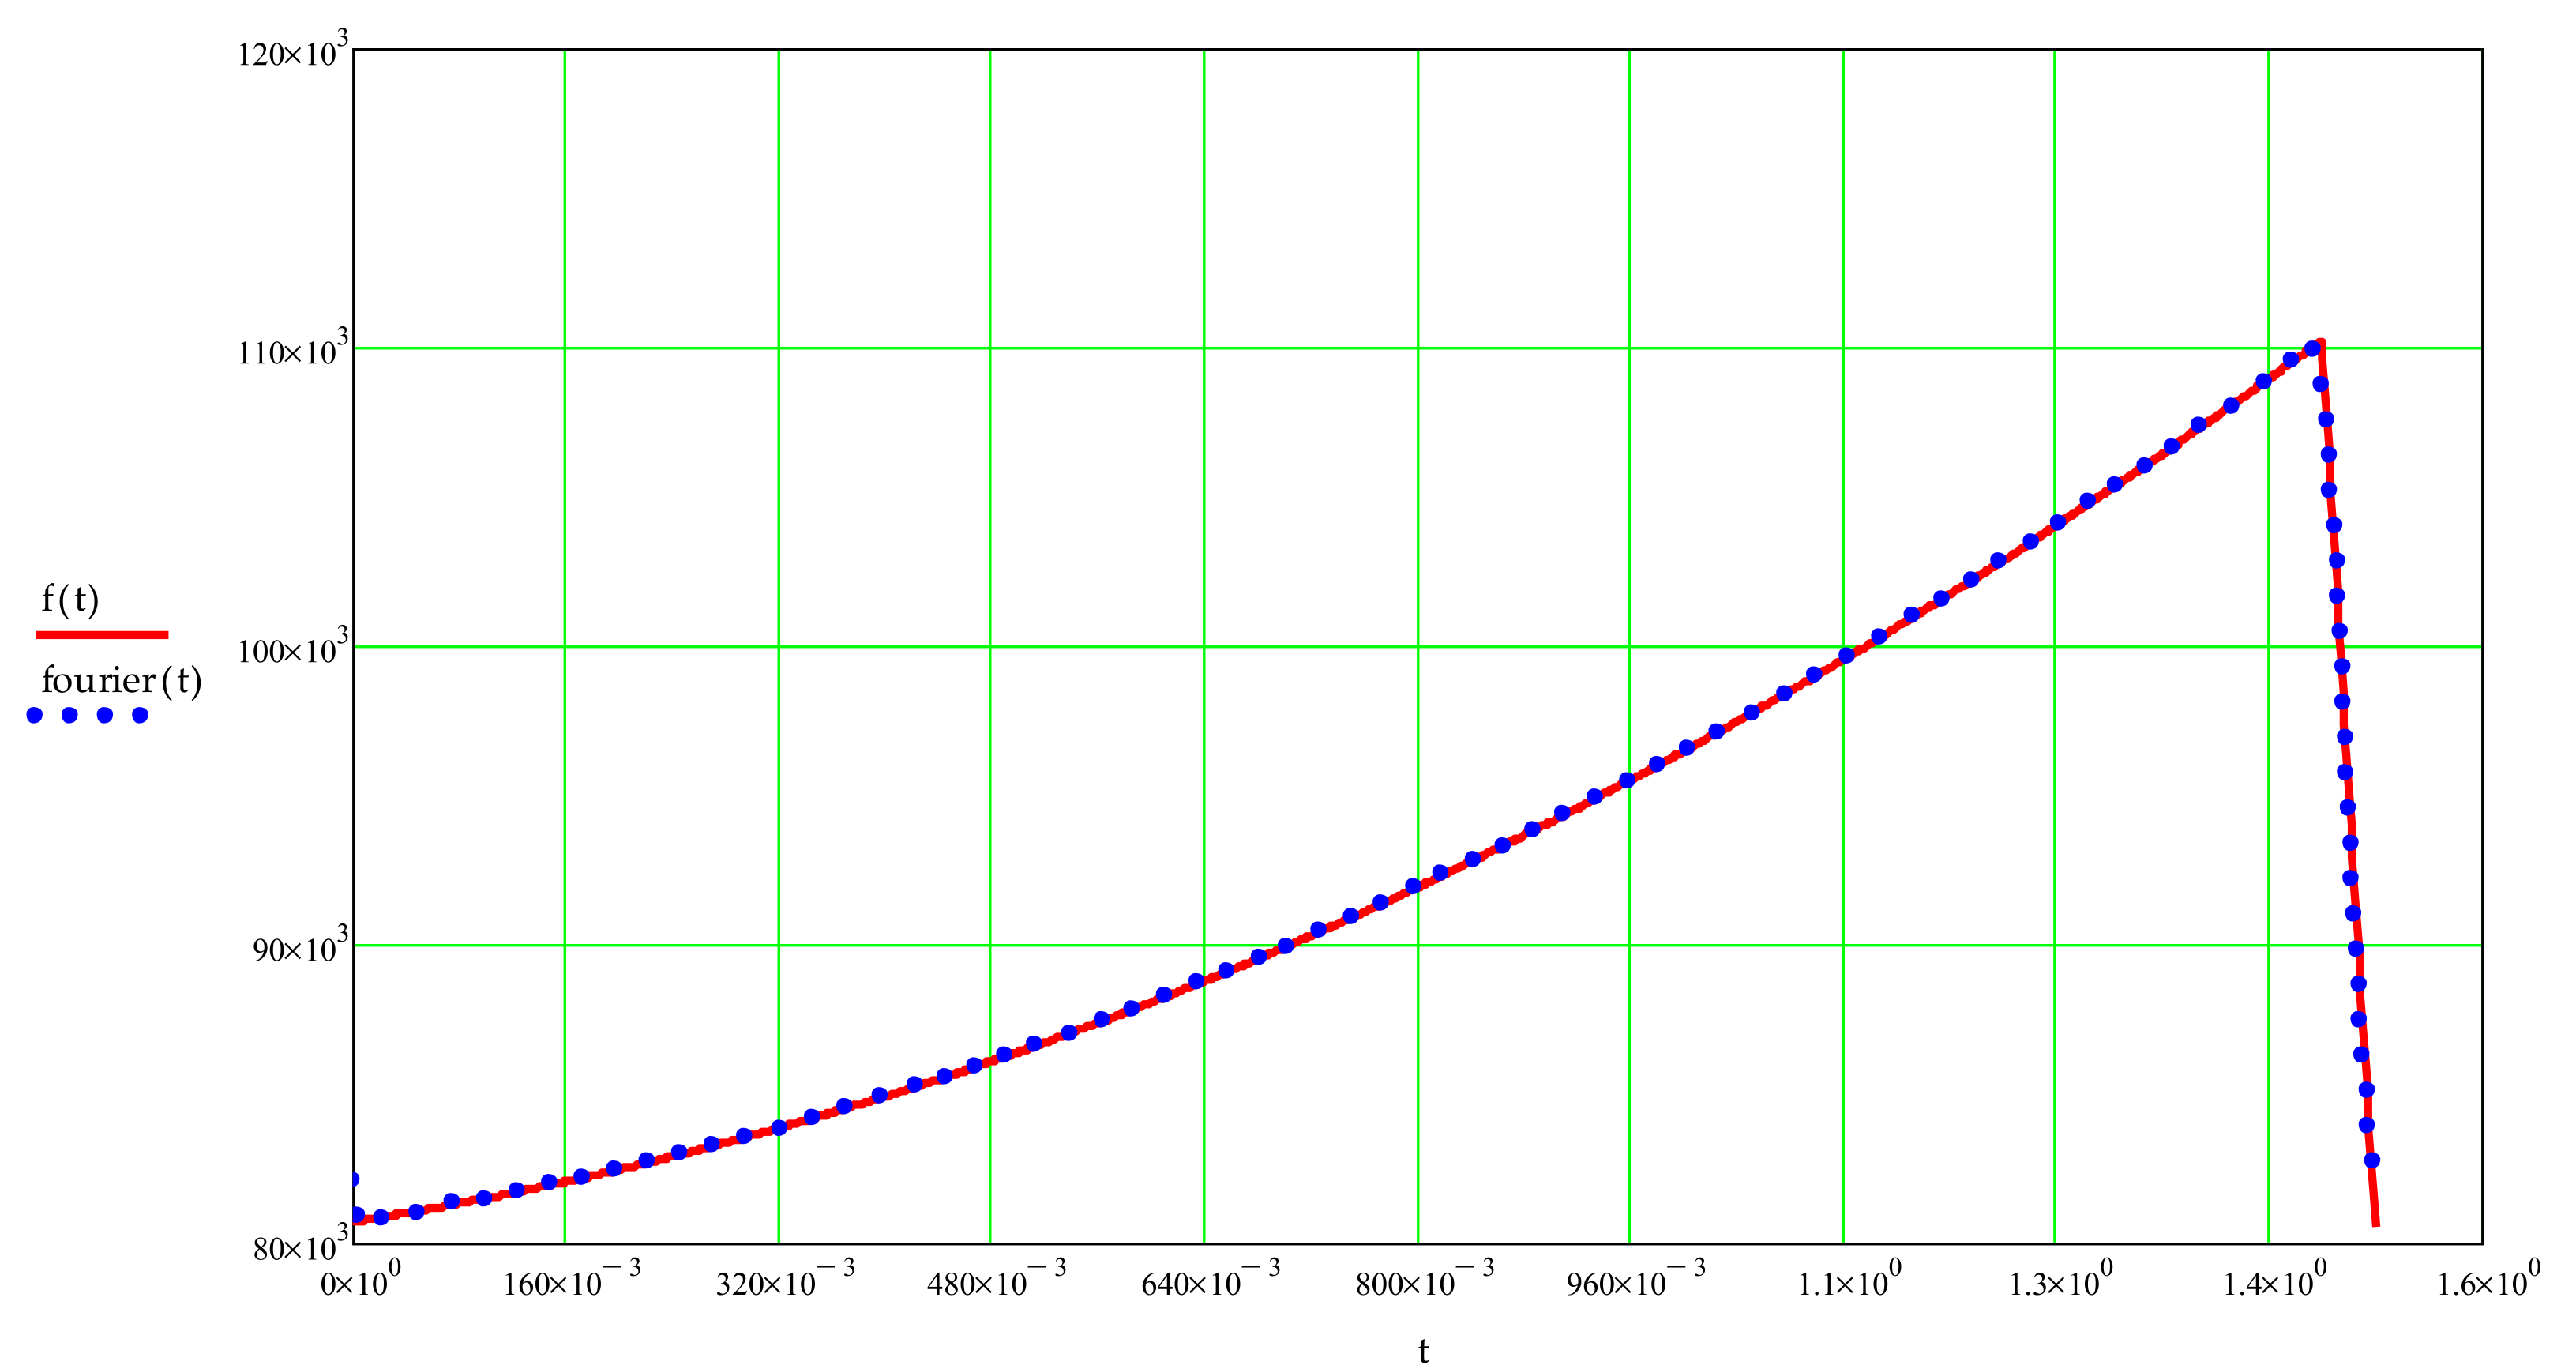
2.2. Excavation Forces Acting on the Bucket Wheel-Boom Assembly
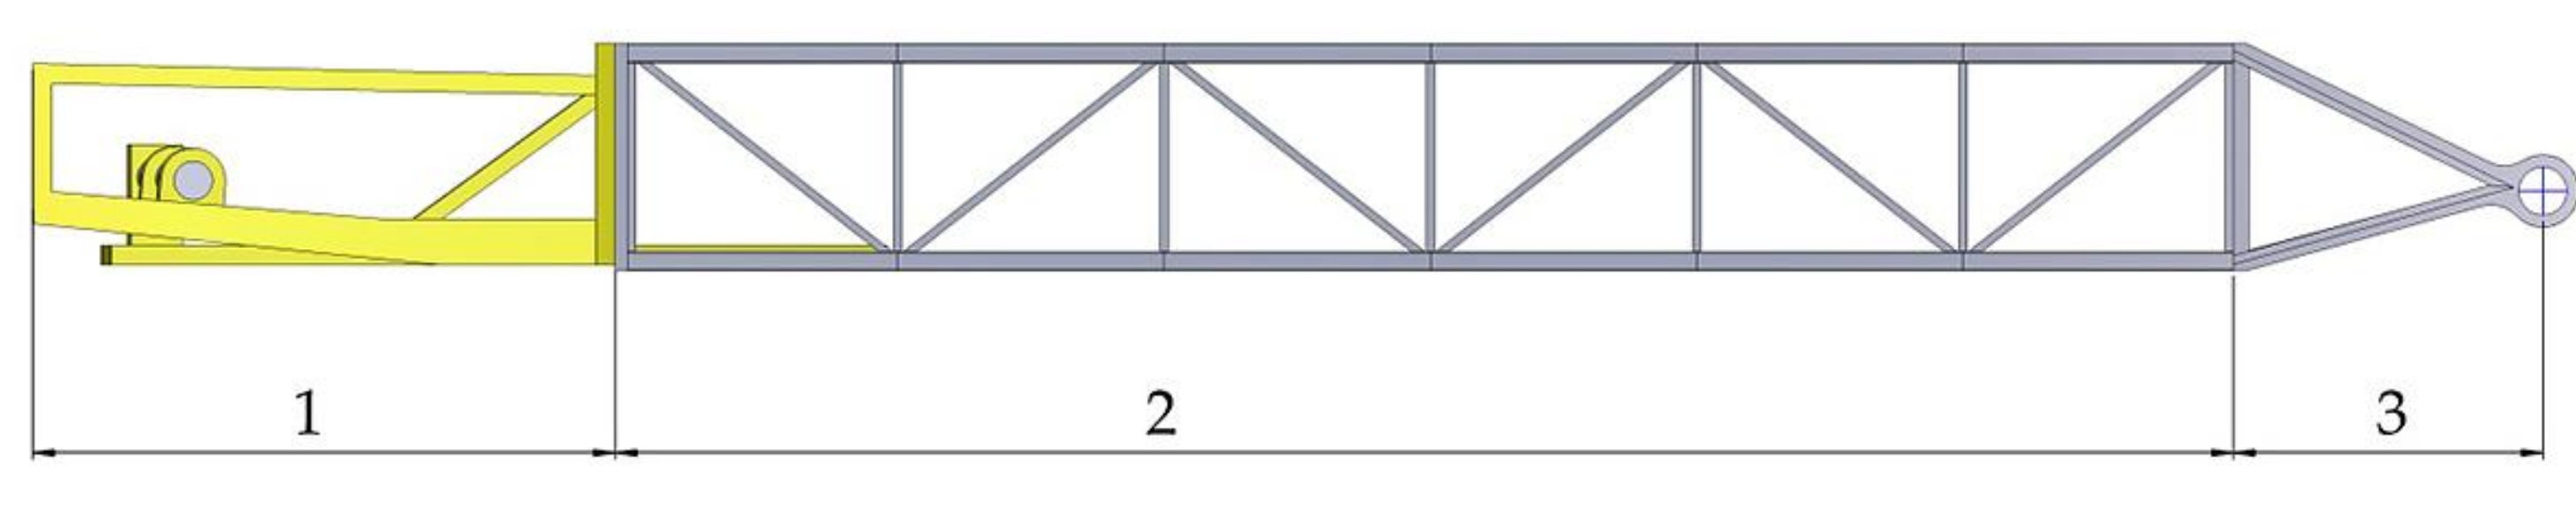
- Section 1 is the bucket wheel support where also the hoist cable connections and the bucket wheel drive systems are mounted;
- Section 2 is the middle section with the discharge conveyor system;
- Section 3 is the joint section of the bucket wheel boom to the rest of the superstructure.
2.3. Static Loads Acting on the Bucket Wheel-Boom Assembly
2.4. Analyses Performed on the Model: Frequency Response Analysis, Time Response Analysis and Fatigue Study
3. Theoretical Aspects of Frequency Response
4. Computer Simulations, Results Obtained and Discussion
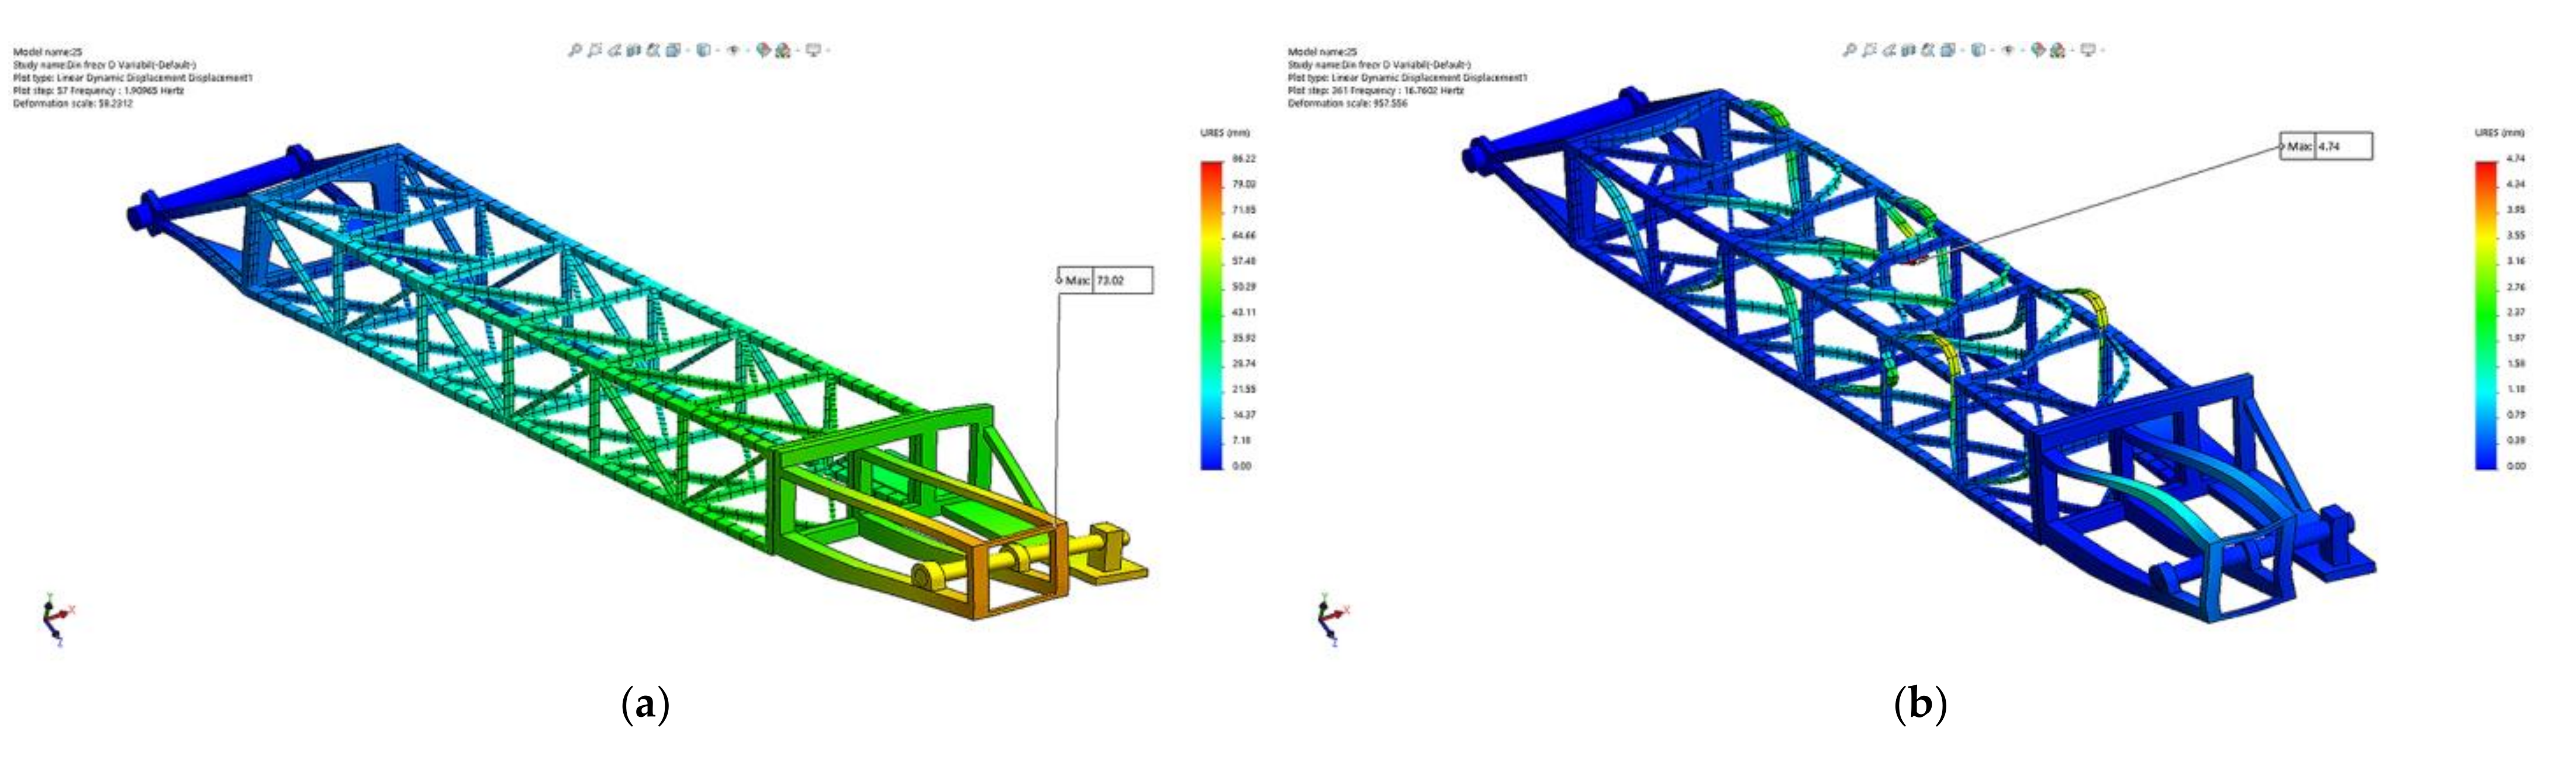
4.1. Frequency Response Analysis of the BWE Boom Model
- (1)
- the maximum height excavation position (25°);
- (2)
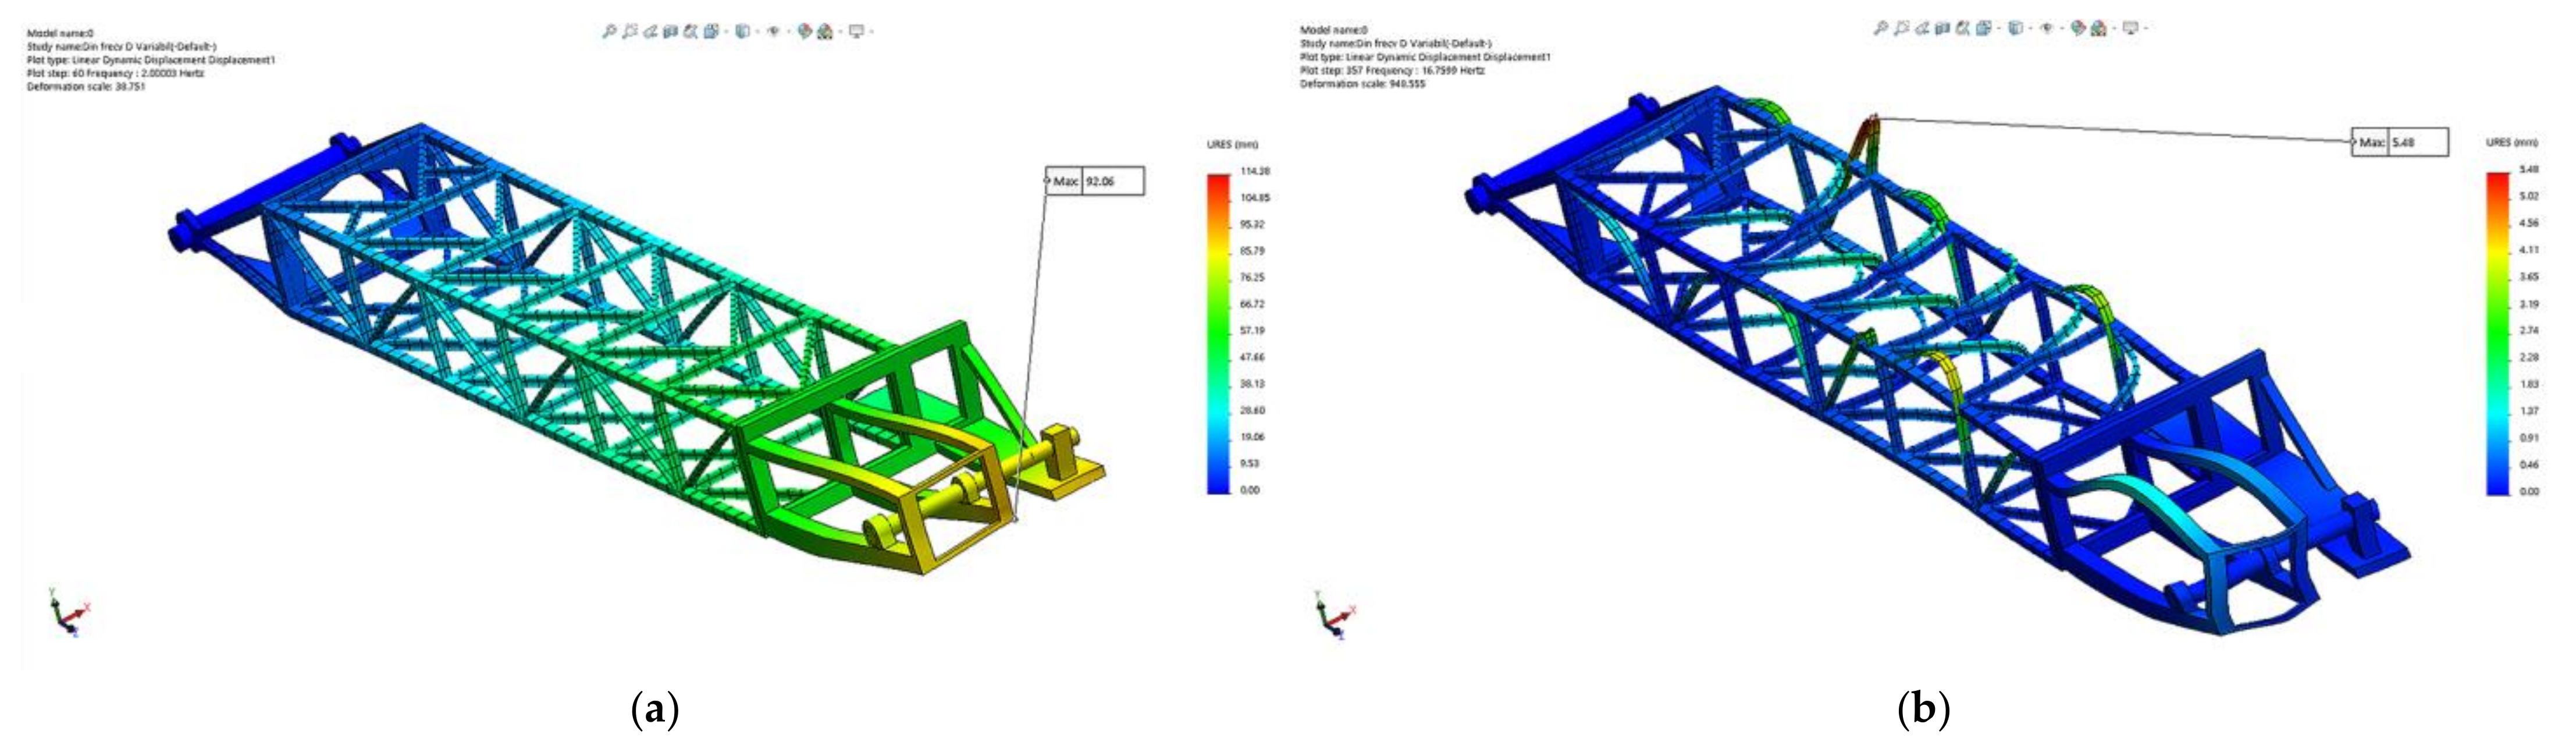
- the horizontal excavation position (0°), and
- (3)
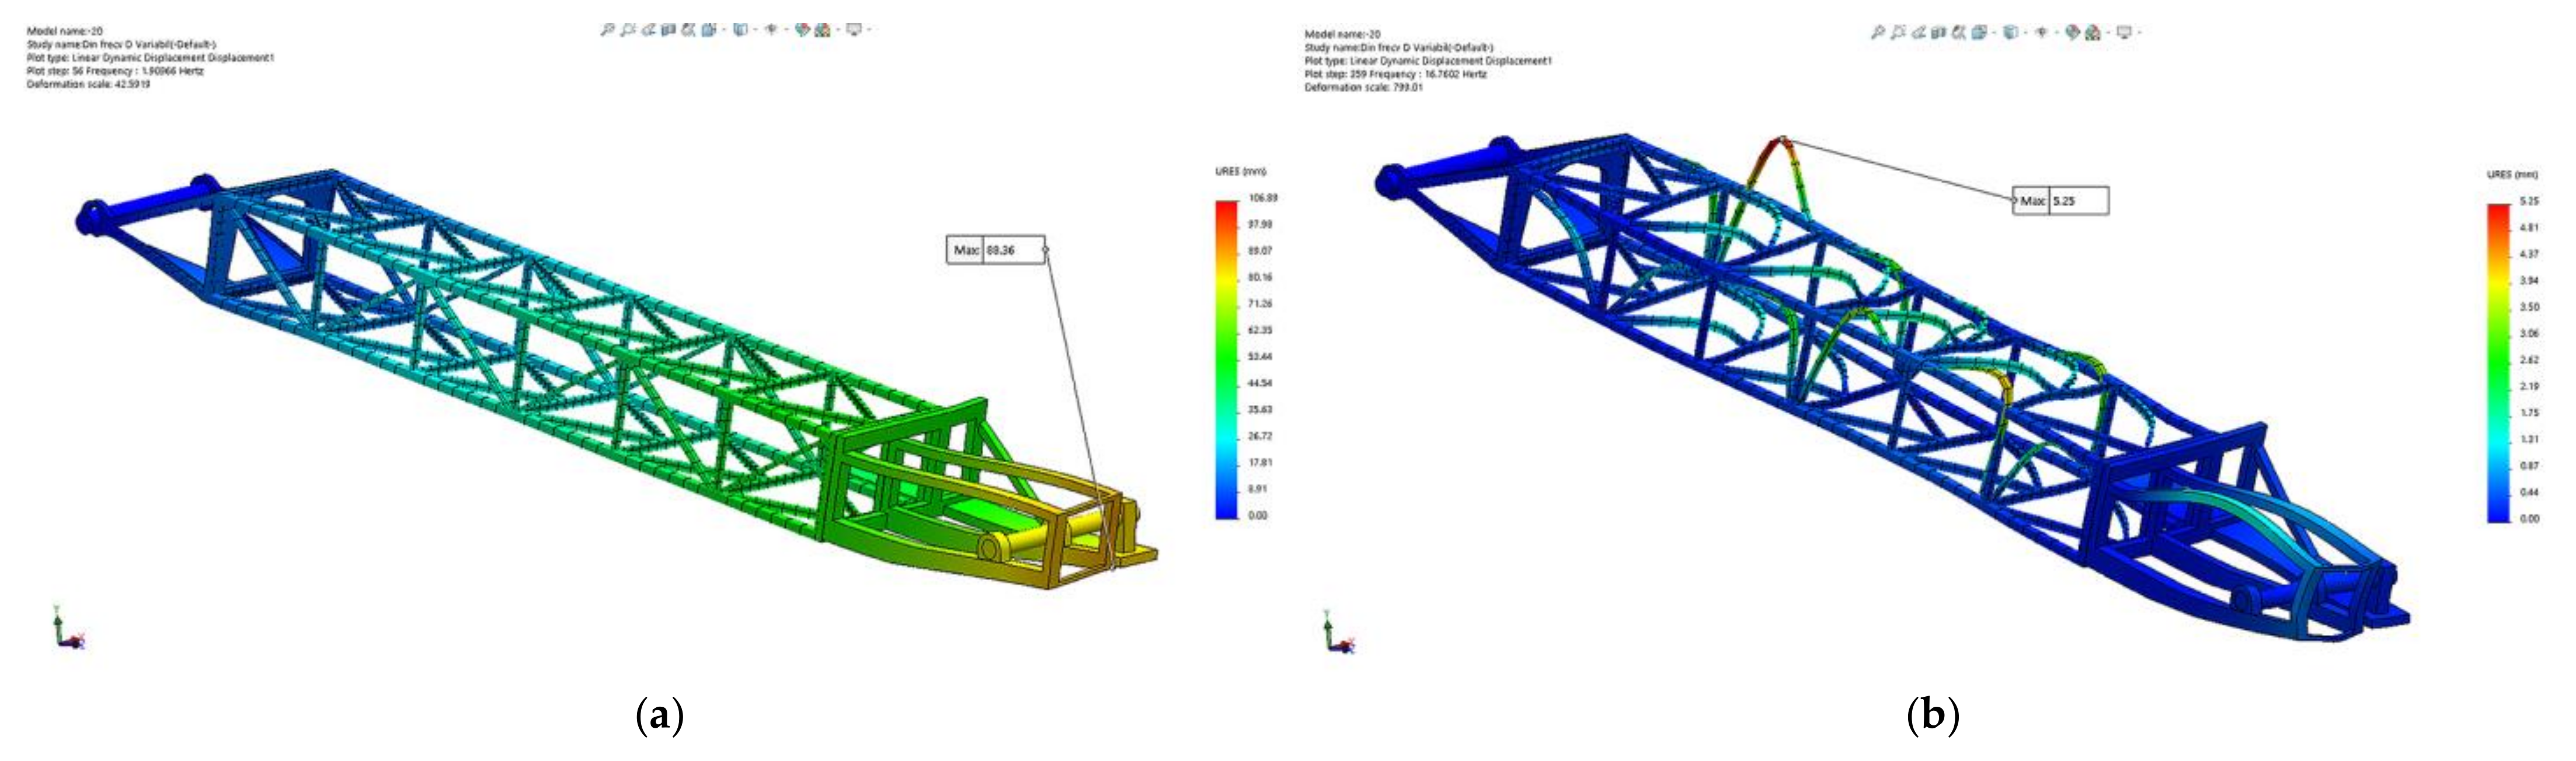
- the lowest possible excavation position, under the bench (−20°);
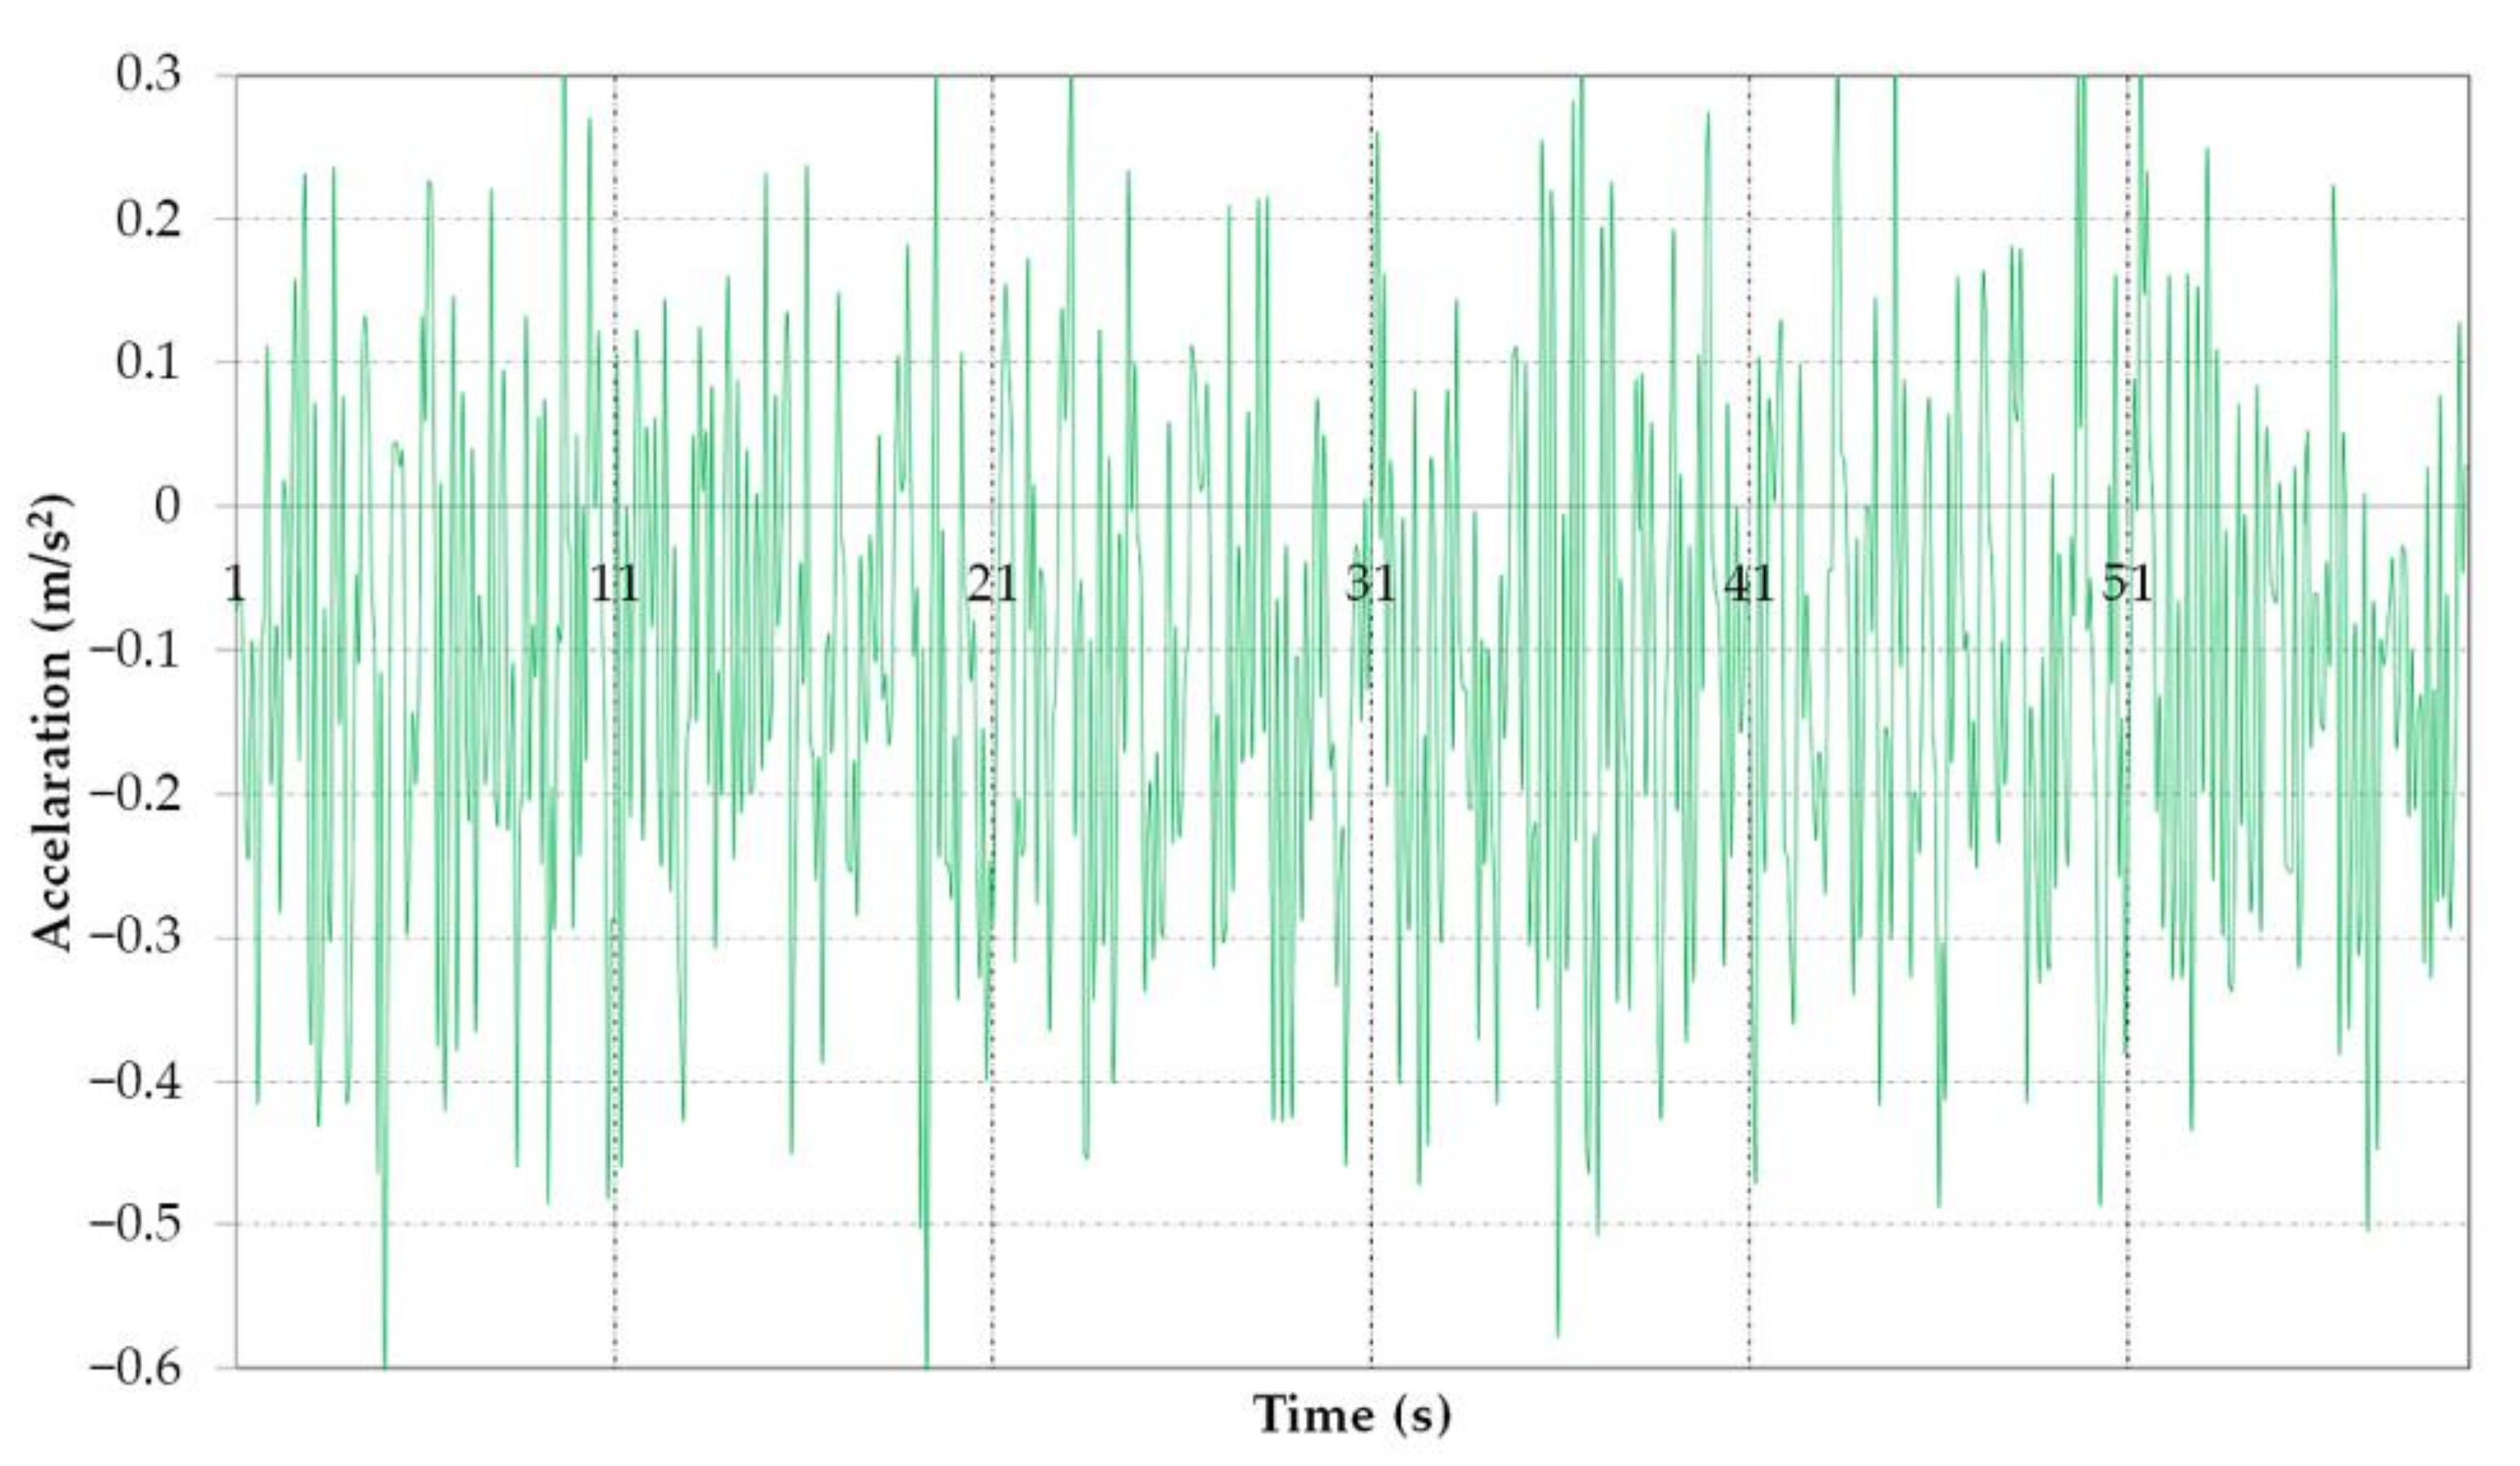
4.2. Time Response Analysis of the BWE Boom Model
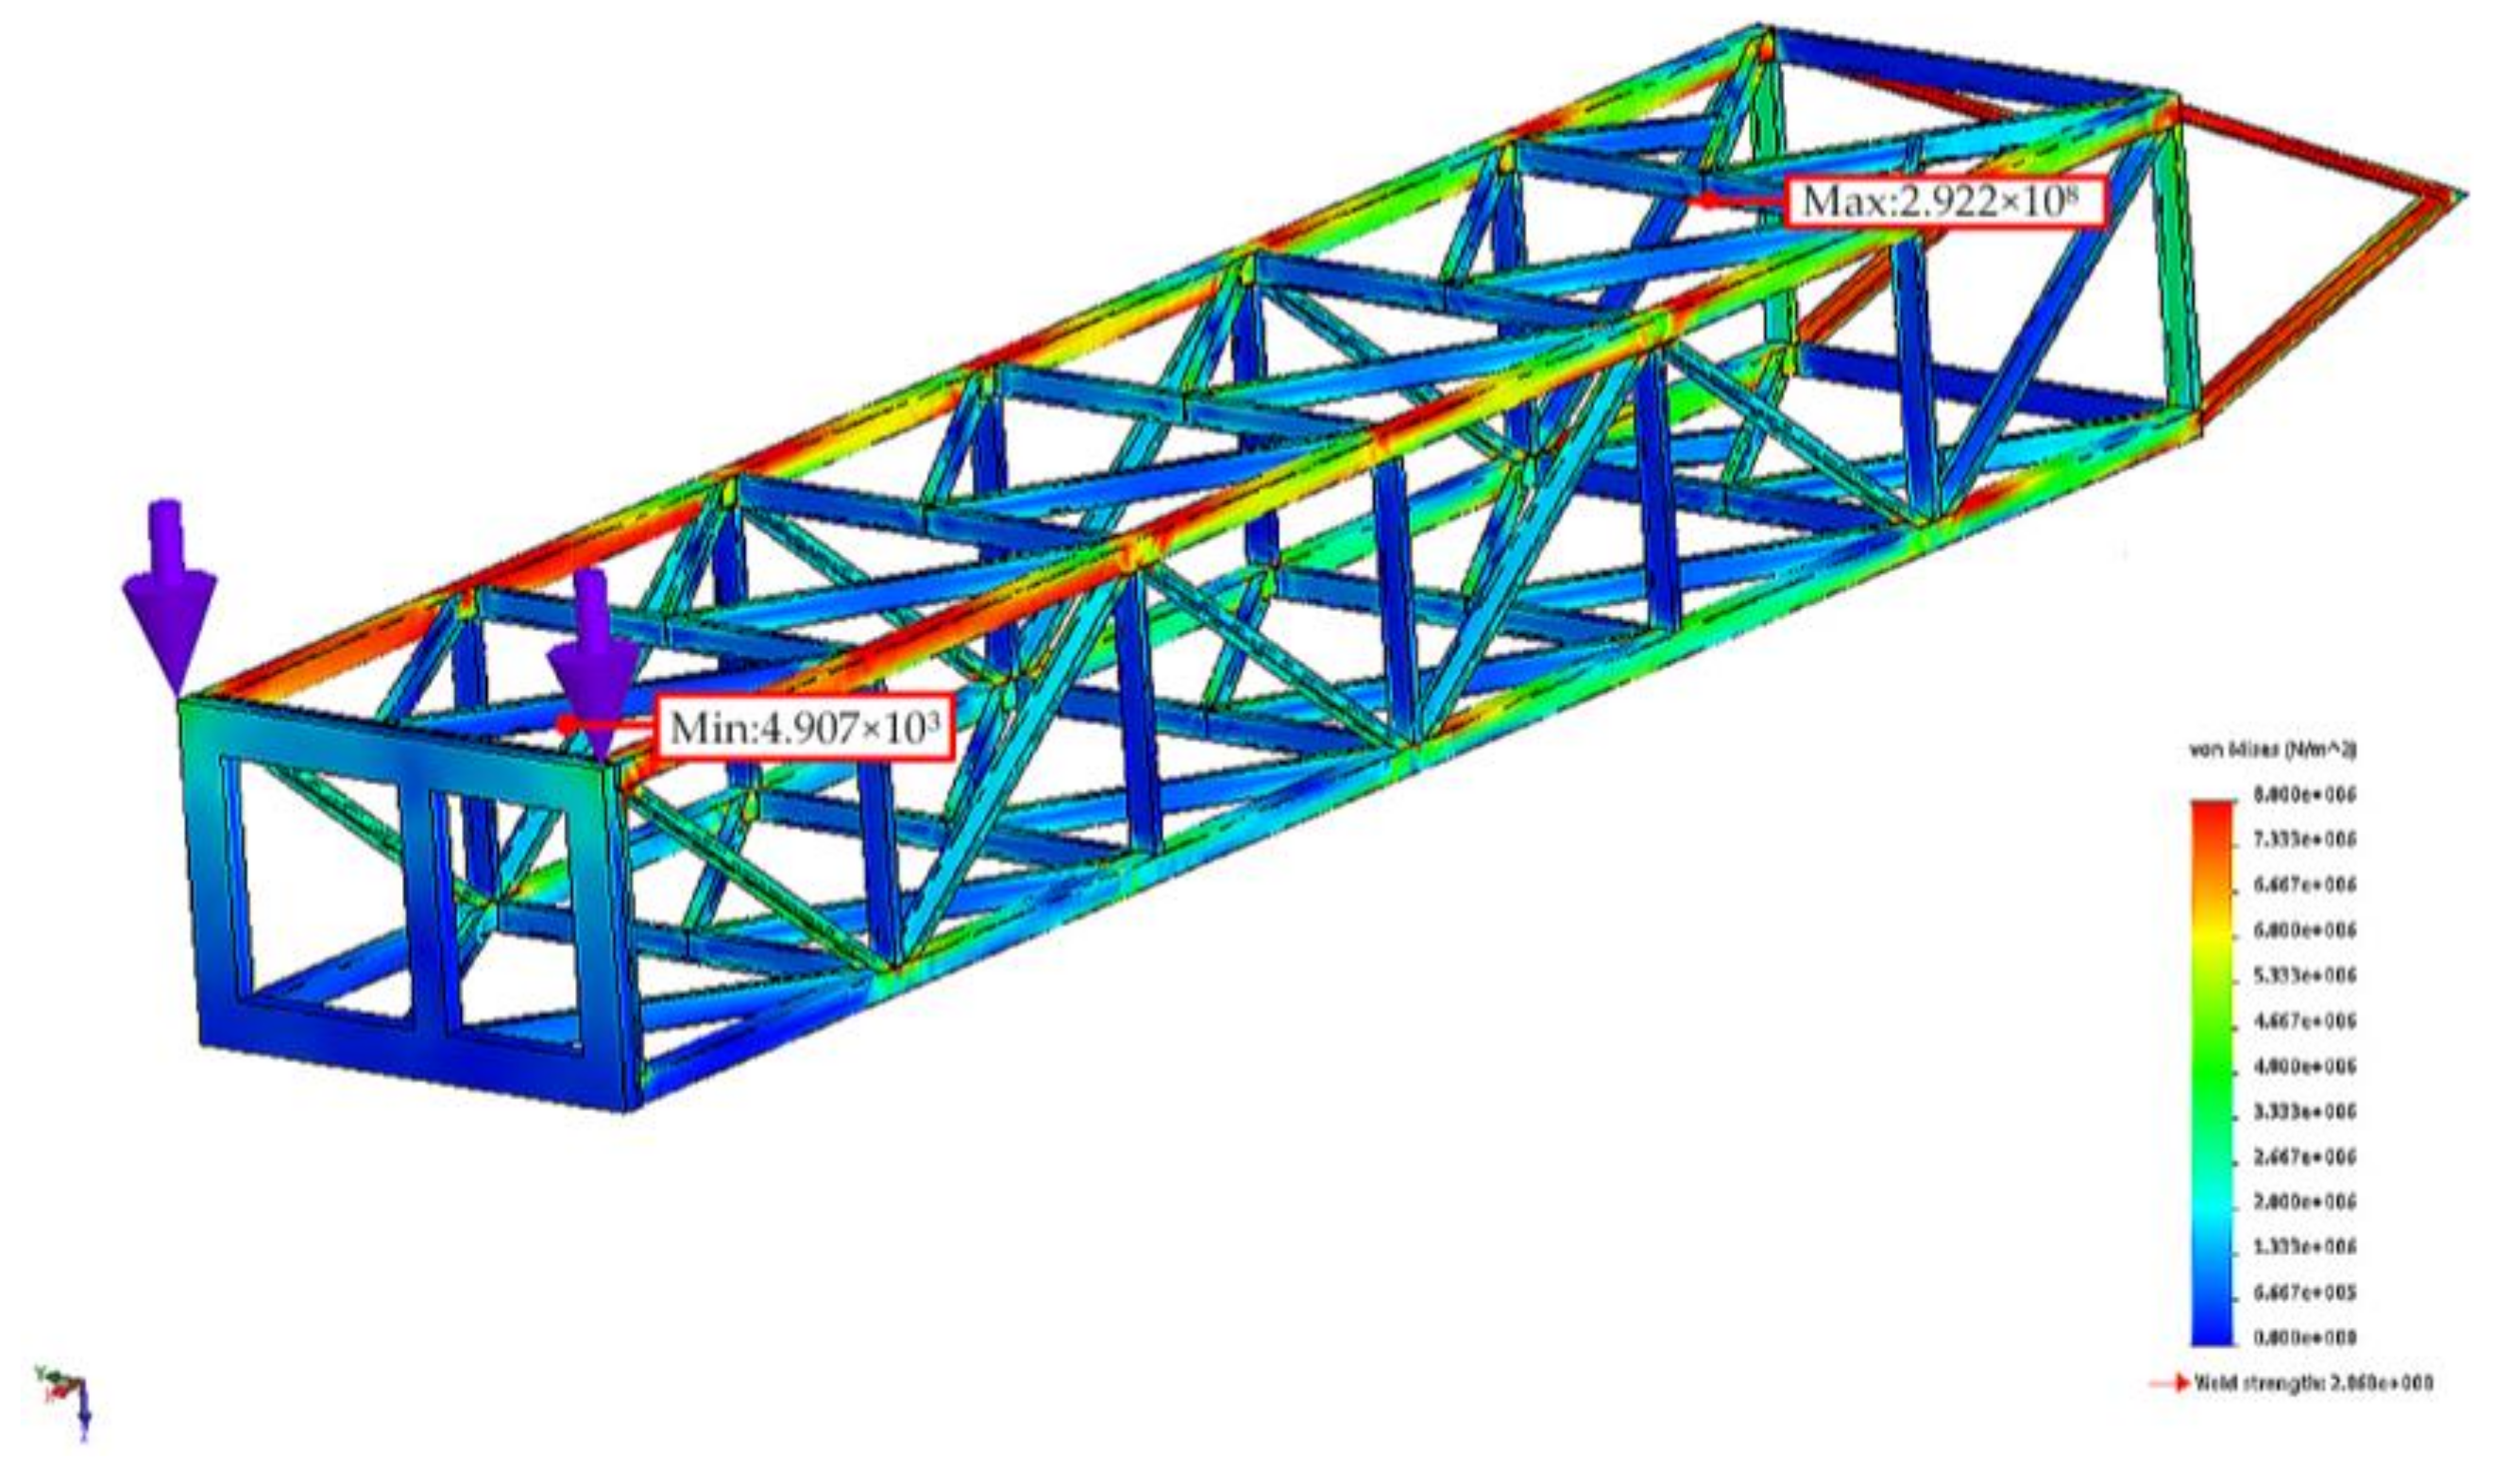
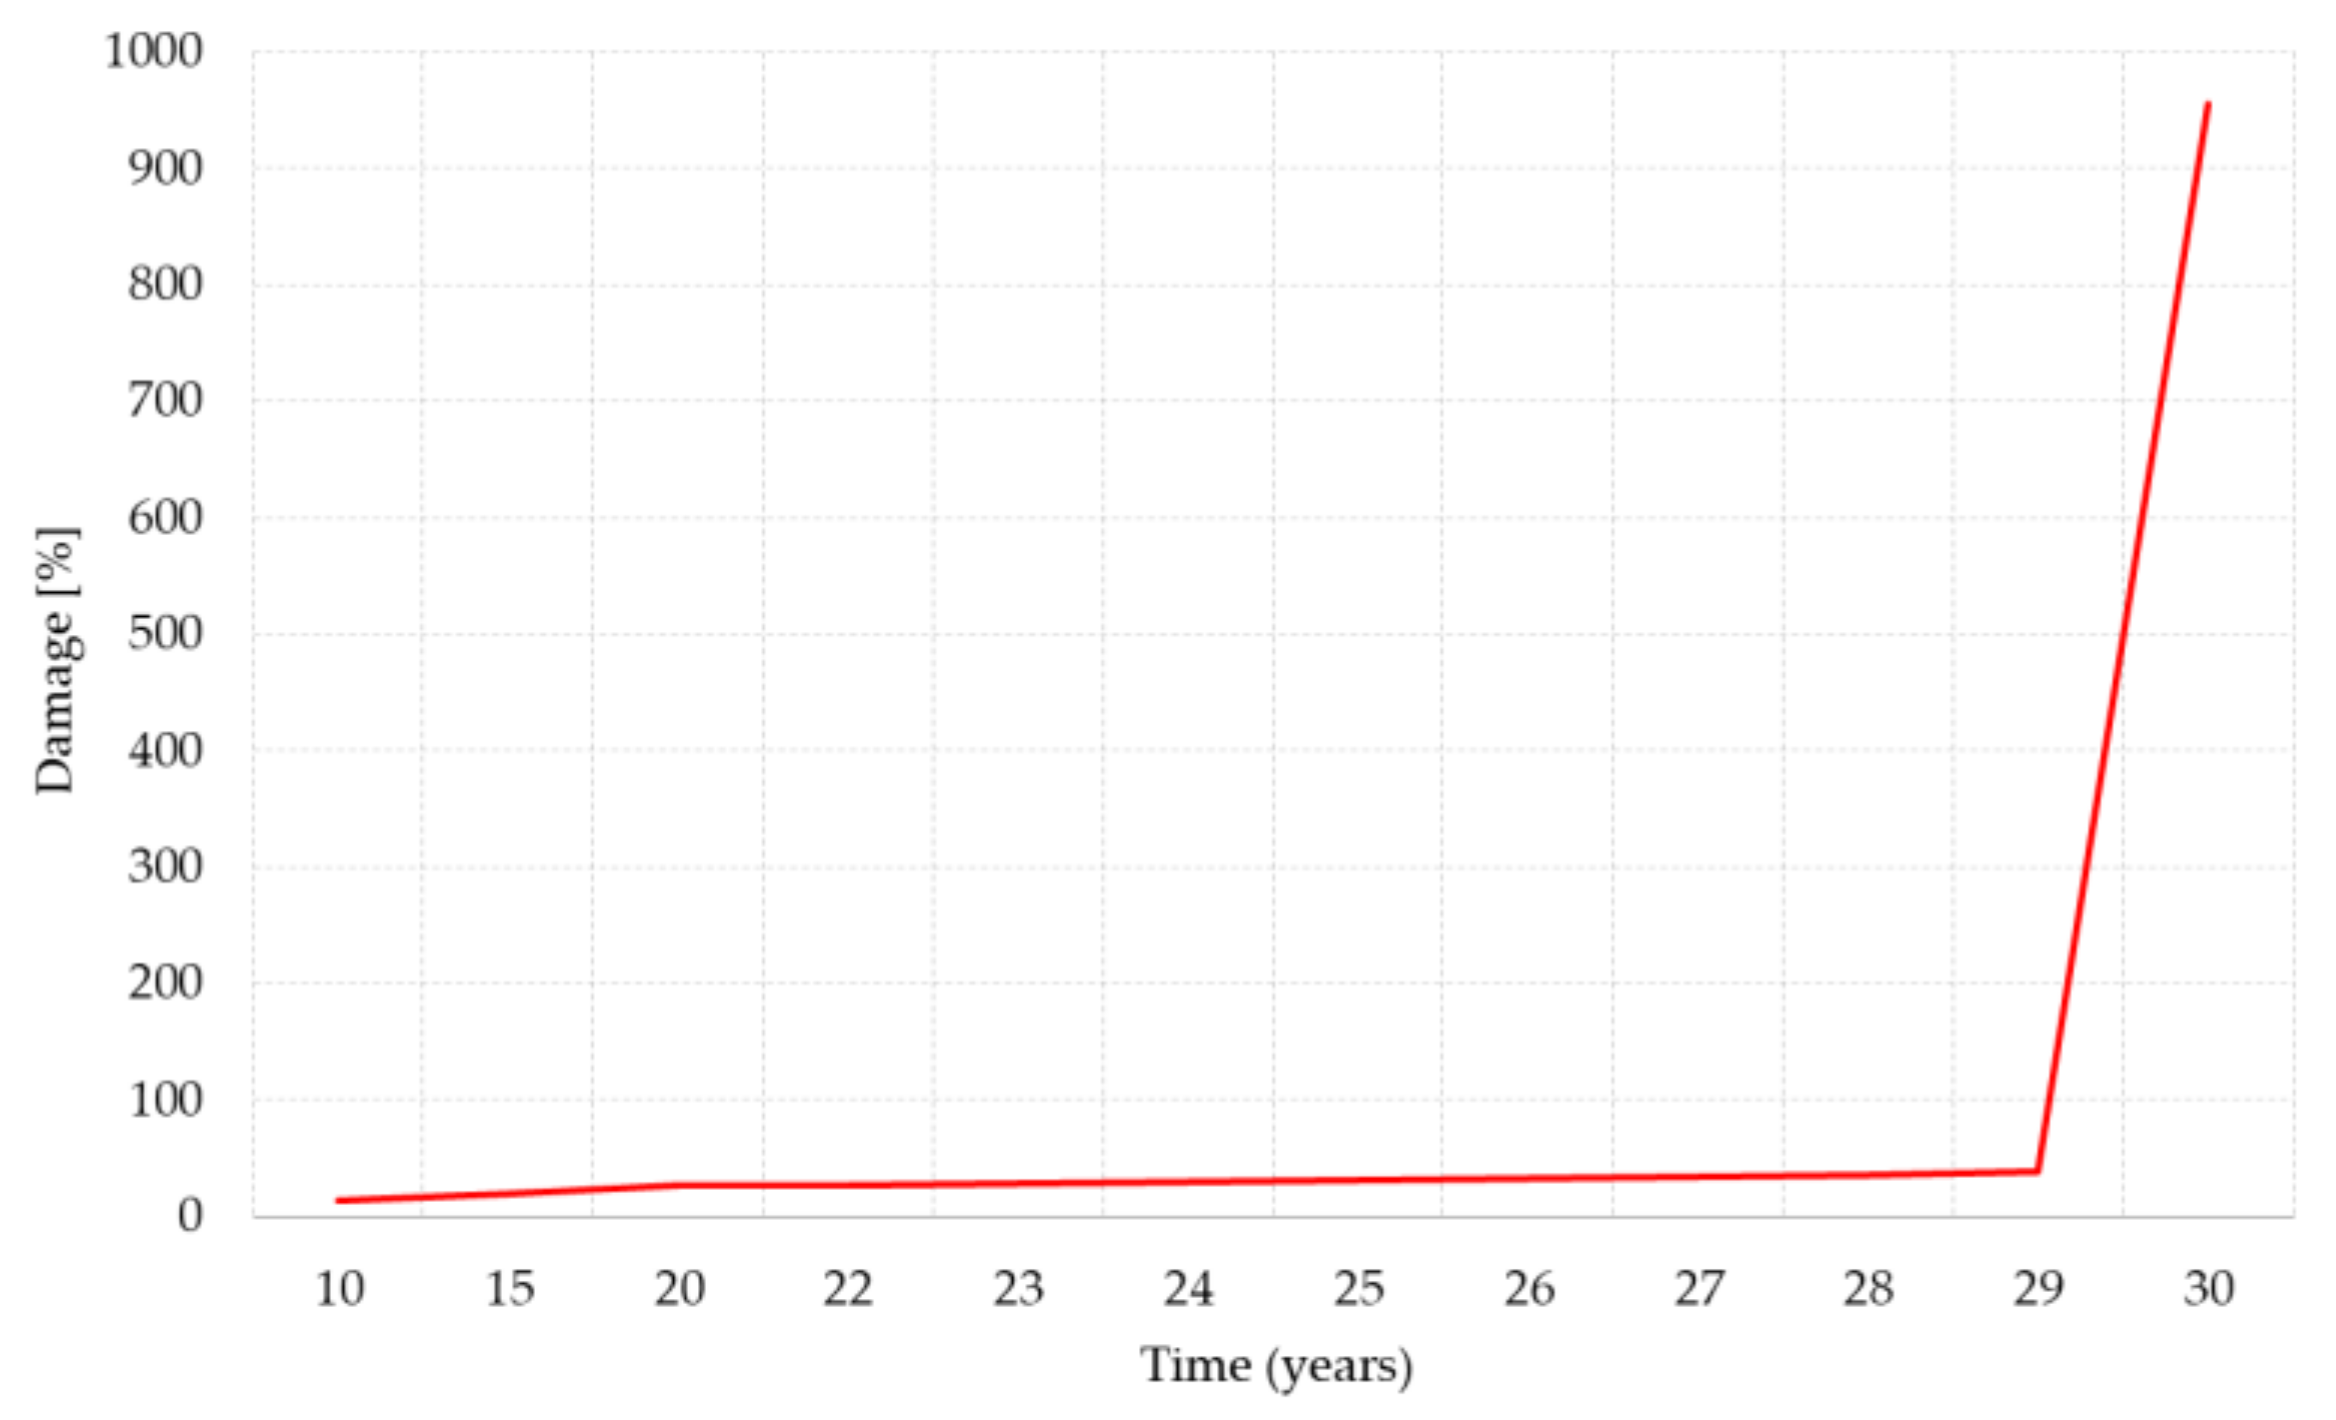
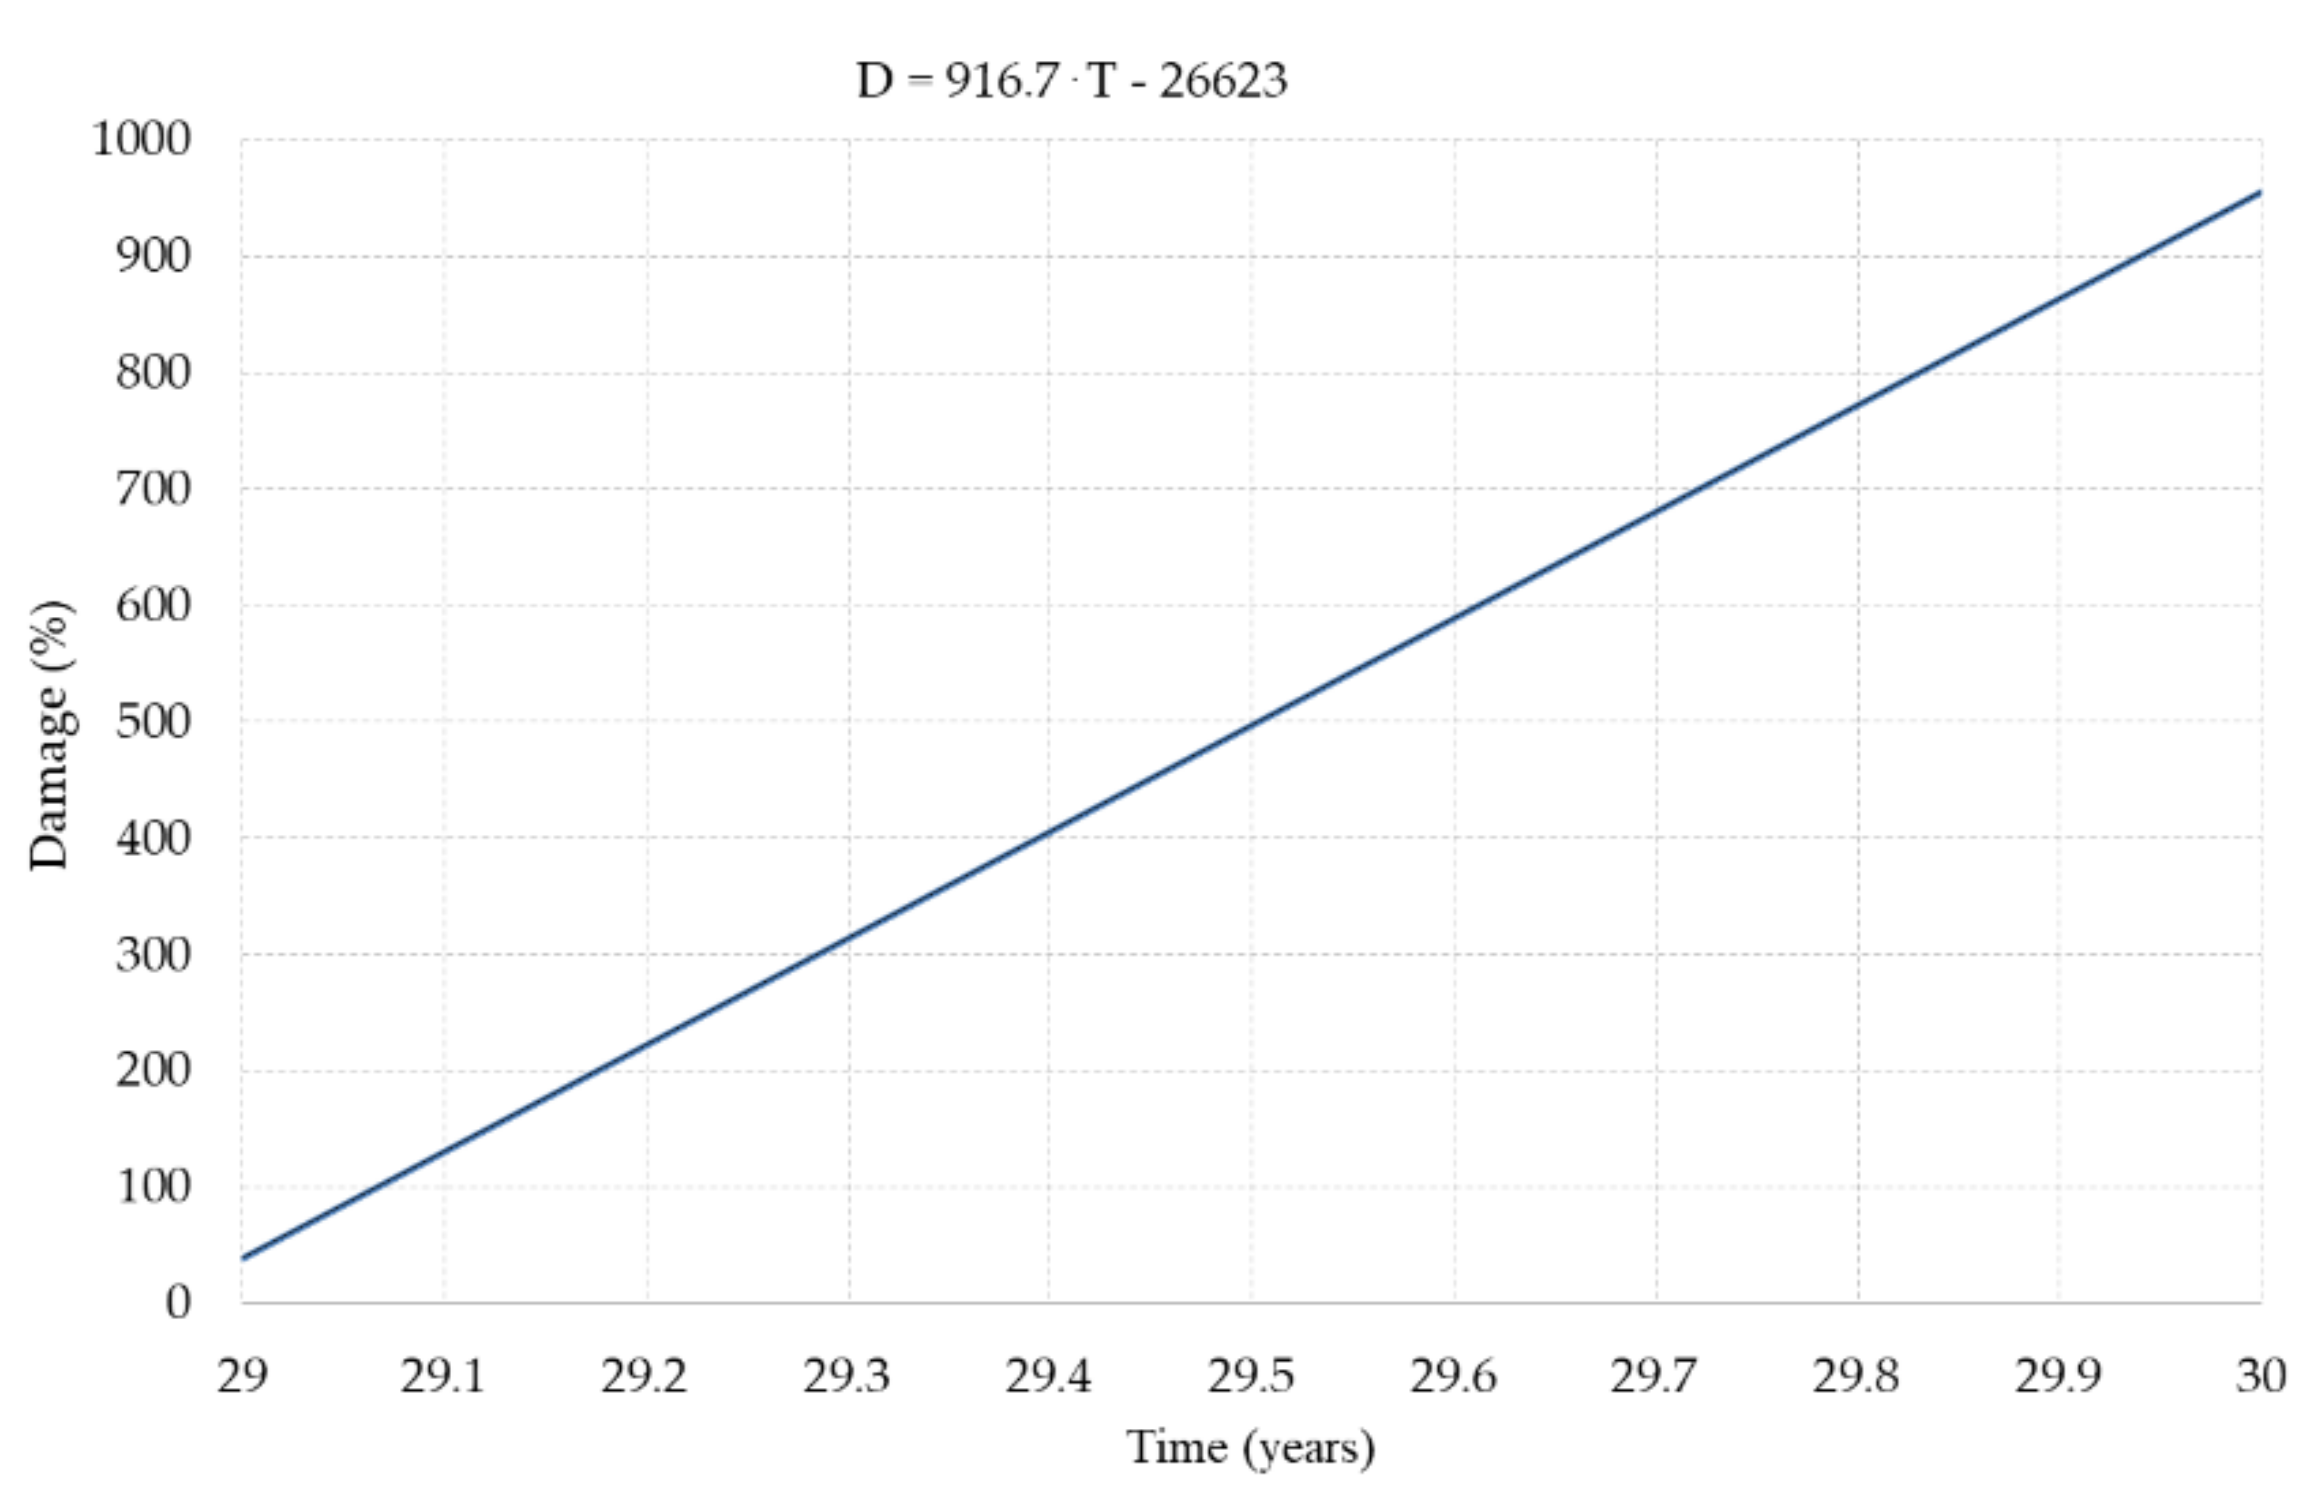
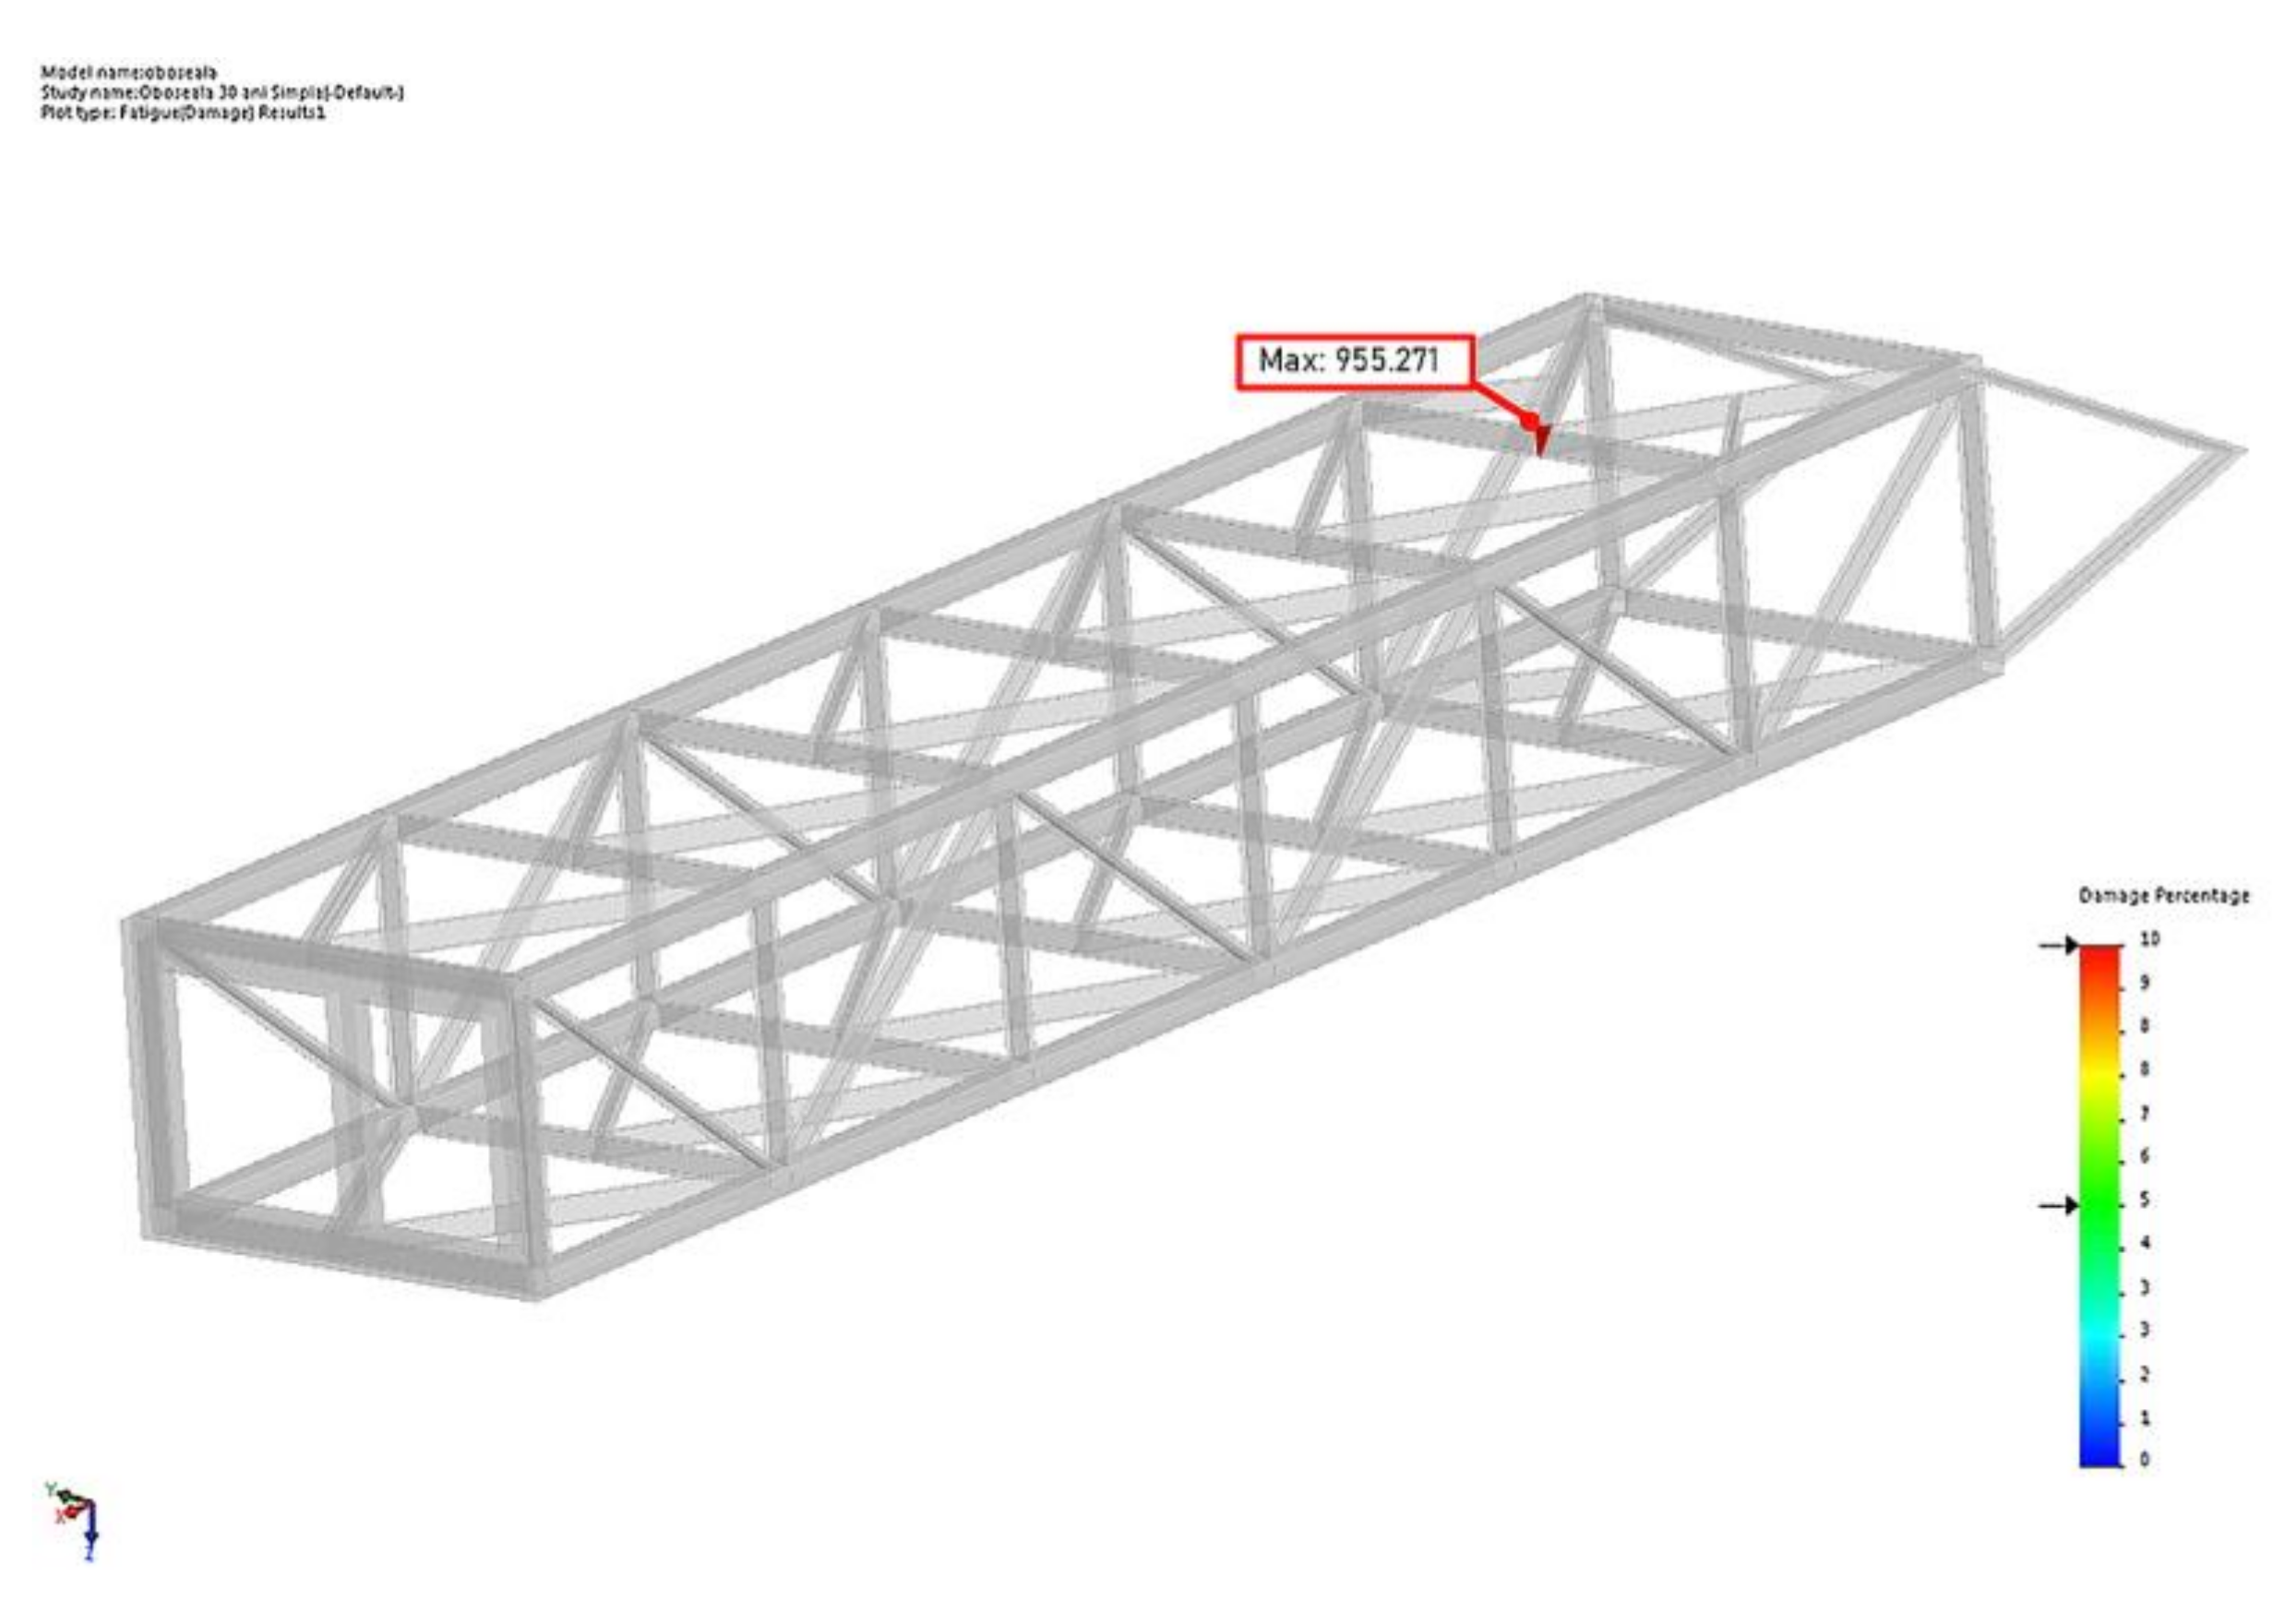
4.3. Fatigue Analysis
5. Conclusions
- The predominant response (displacement) is in direction Y, for the second modal frequency of 2.07 Hz, when the boom is in horizontal position;
- For direction X the maximum response corresponds to the first modal frequency and for direction Z the maximum response corresponds for the second modal frequency.
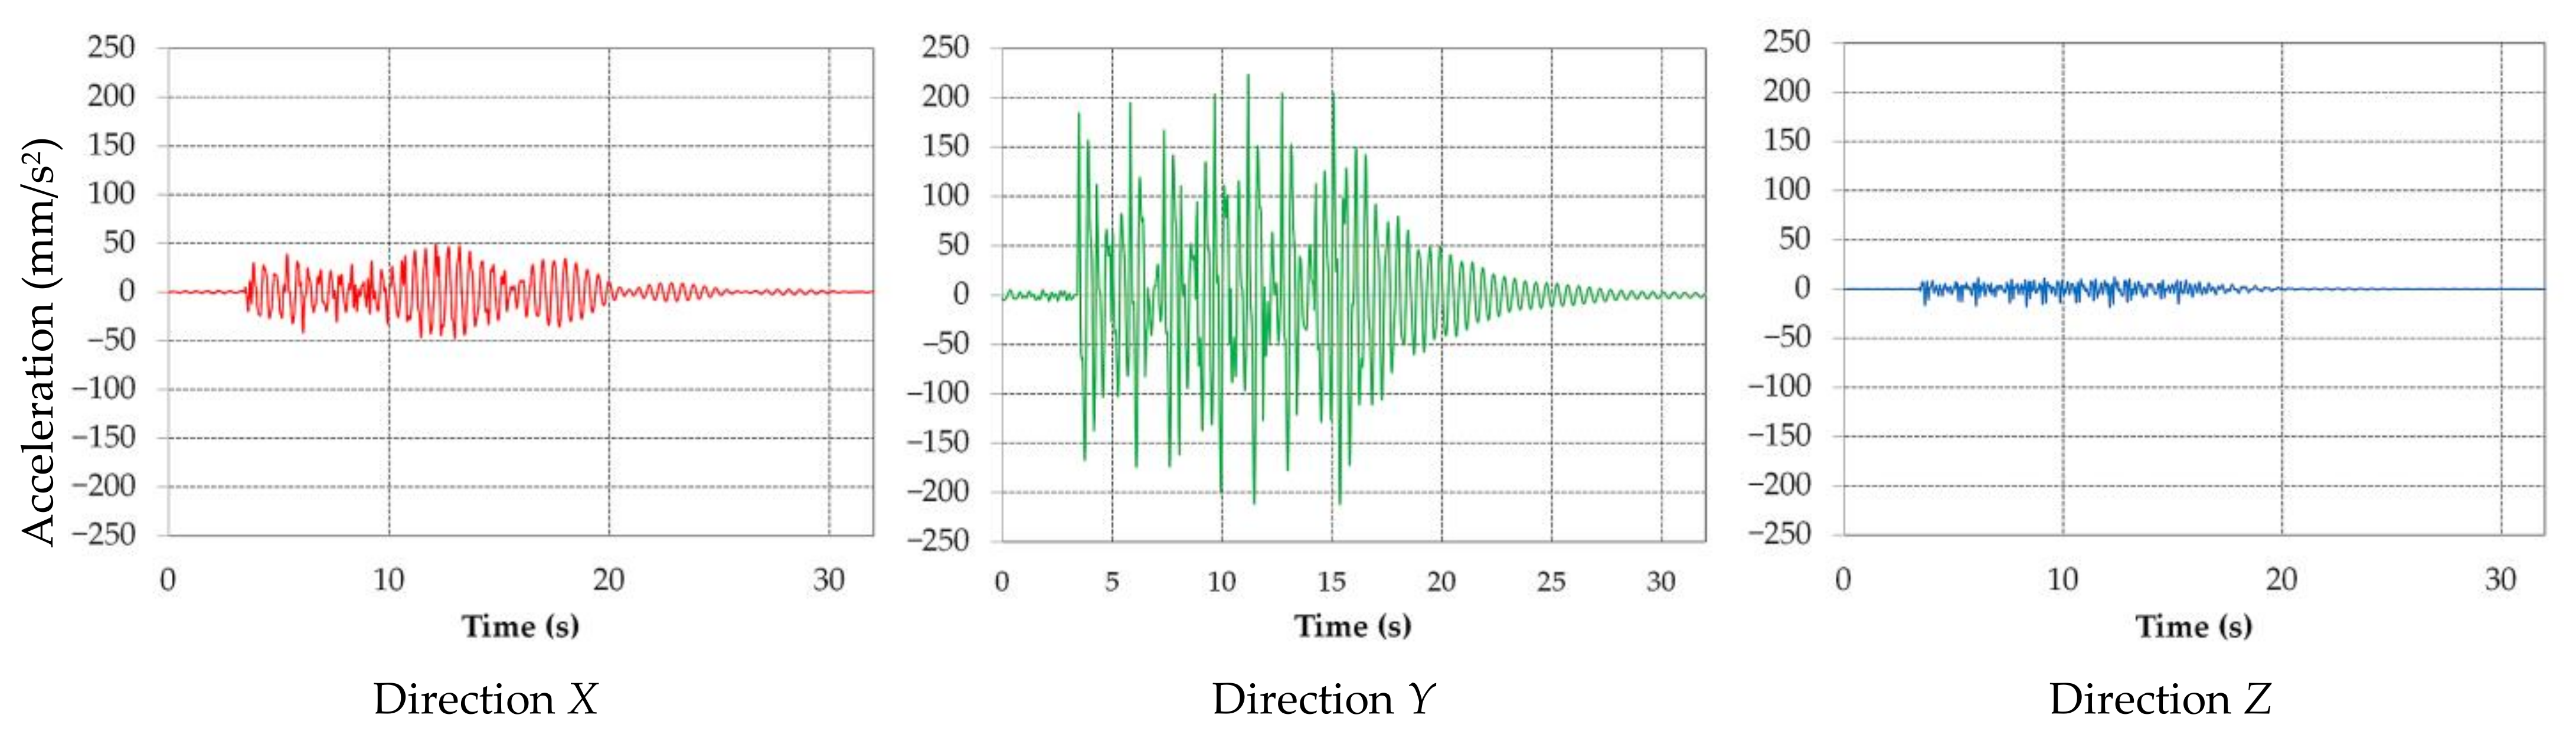
- All accelerations are variable in time and have an oscillating character;
- The greatest values of acceleration are obtained for direction Y;
- The acceleration for directions X and Y are symmetrical with respect to the time axis;
- The acceleration in direction Z is asymmetric with respect to the time axis.
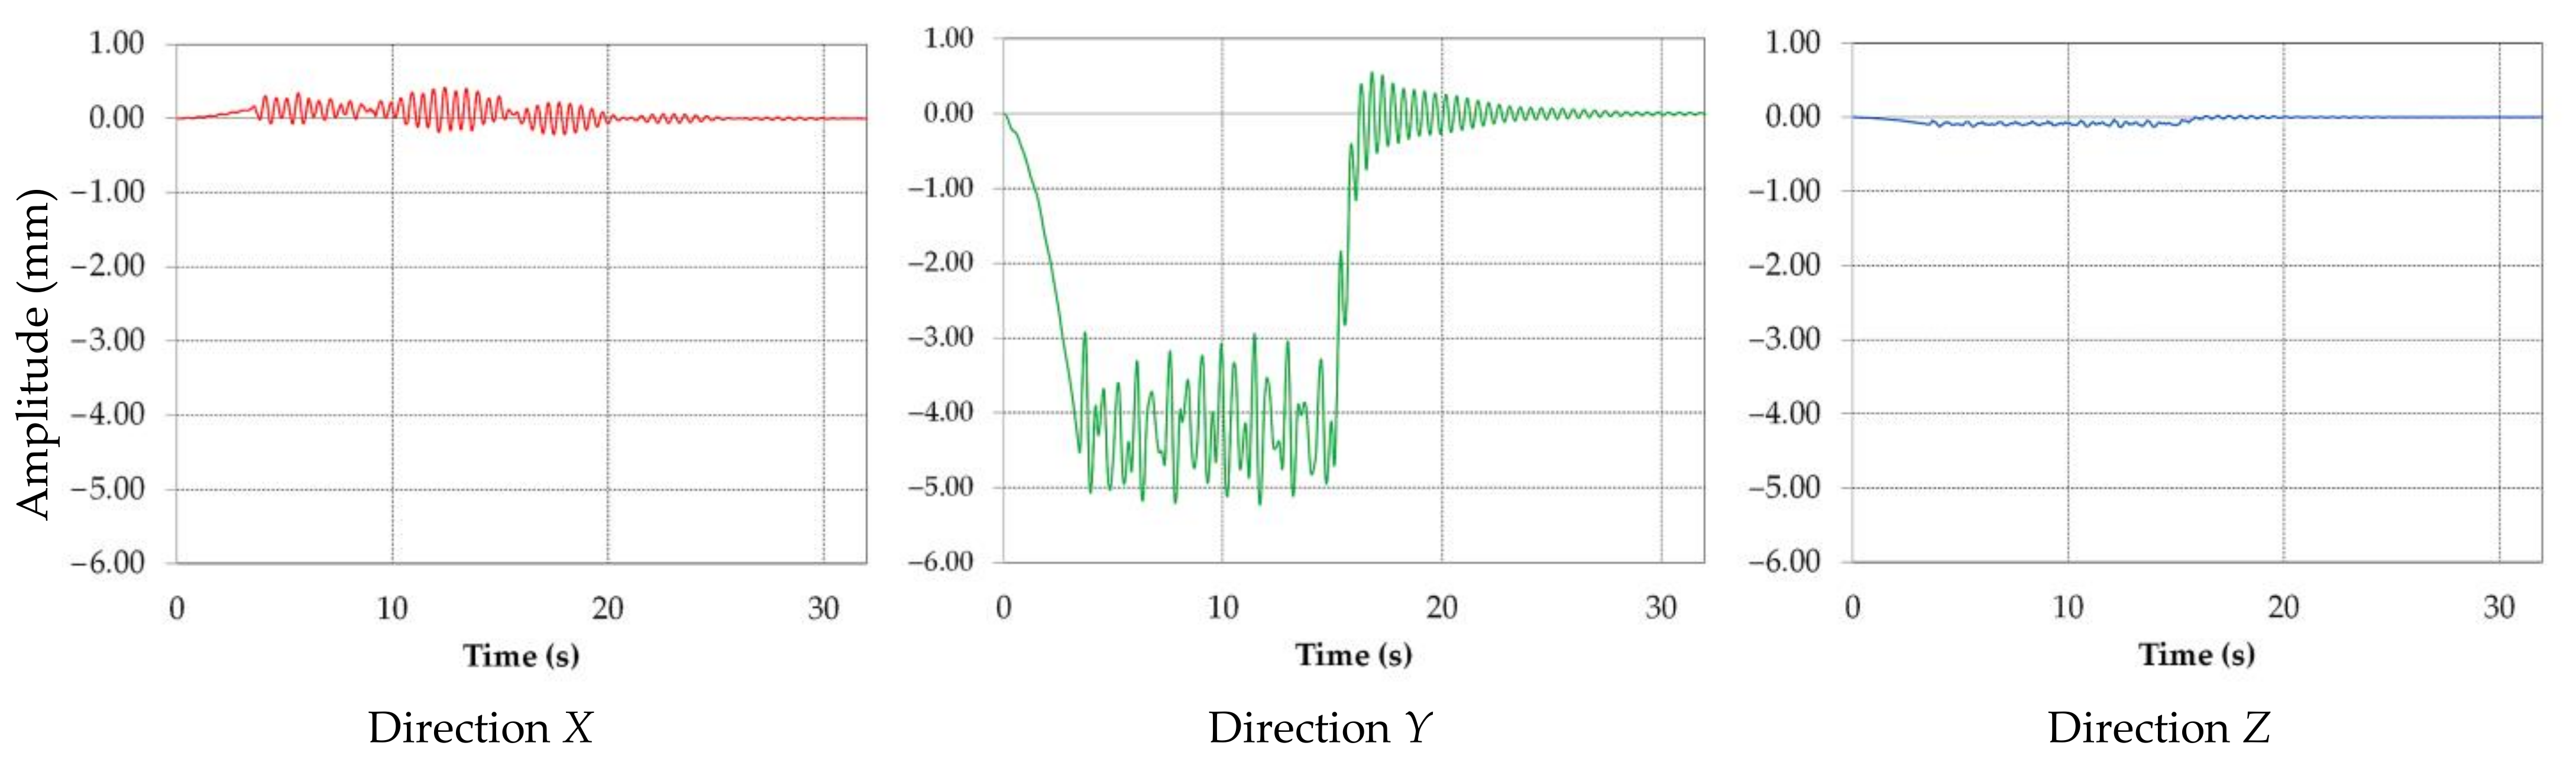
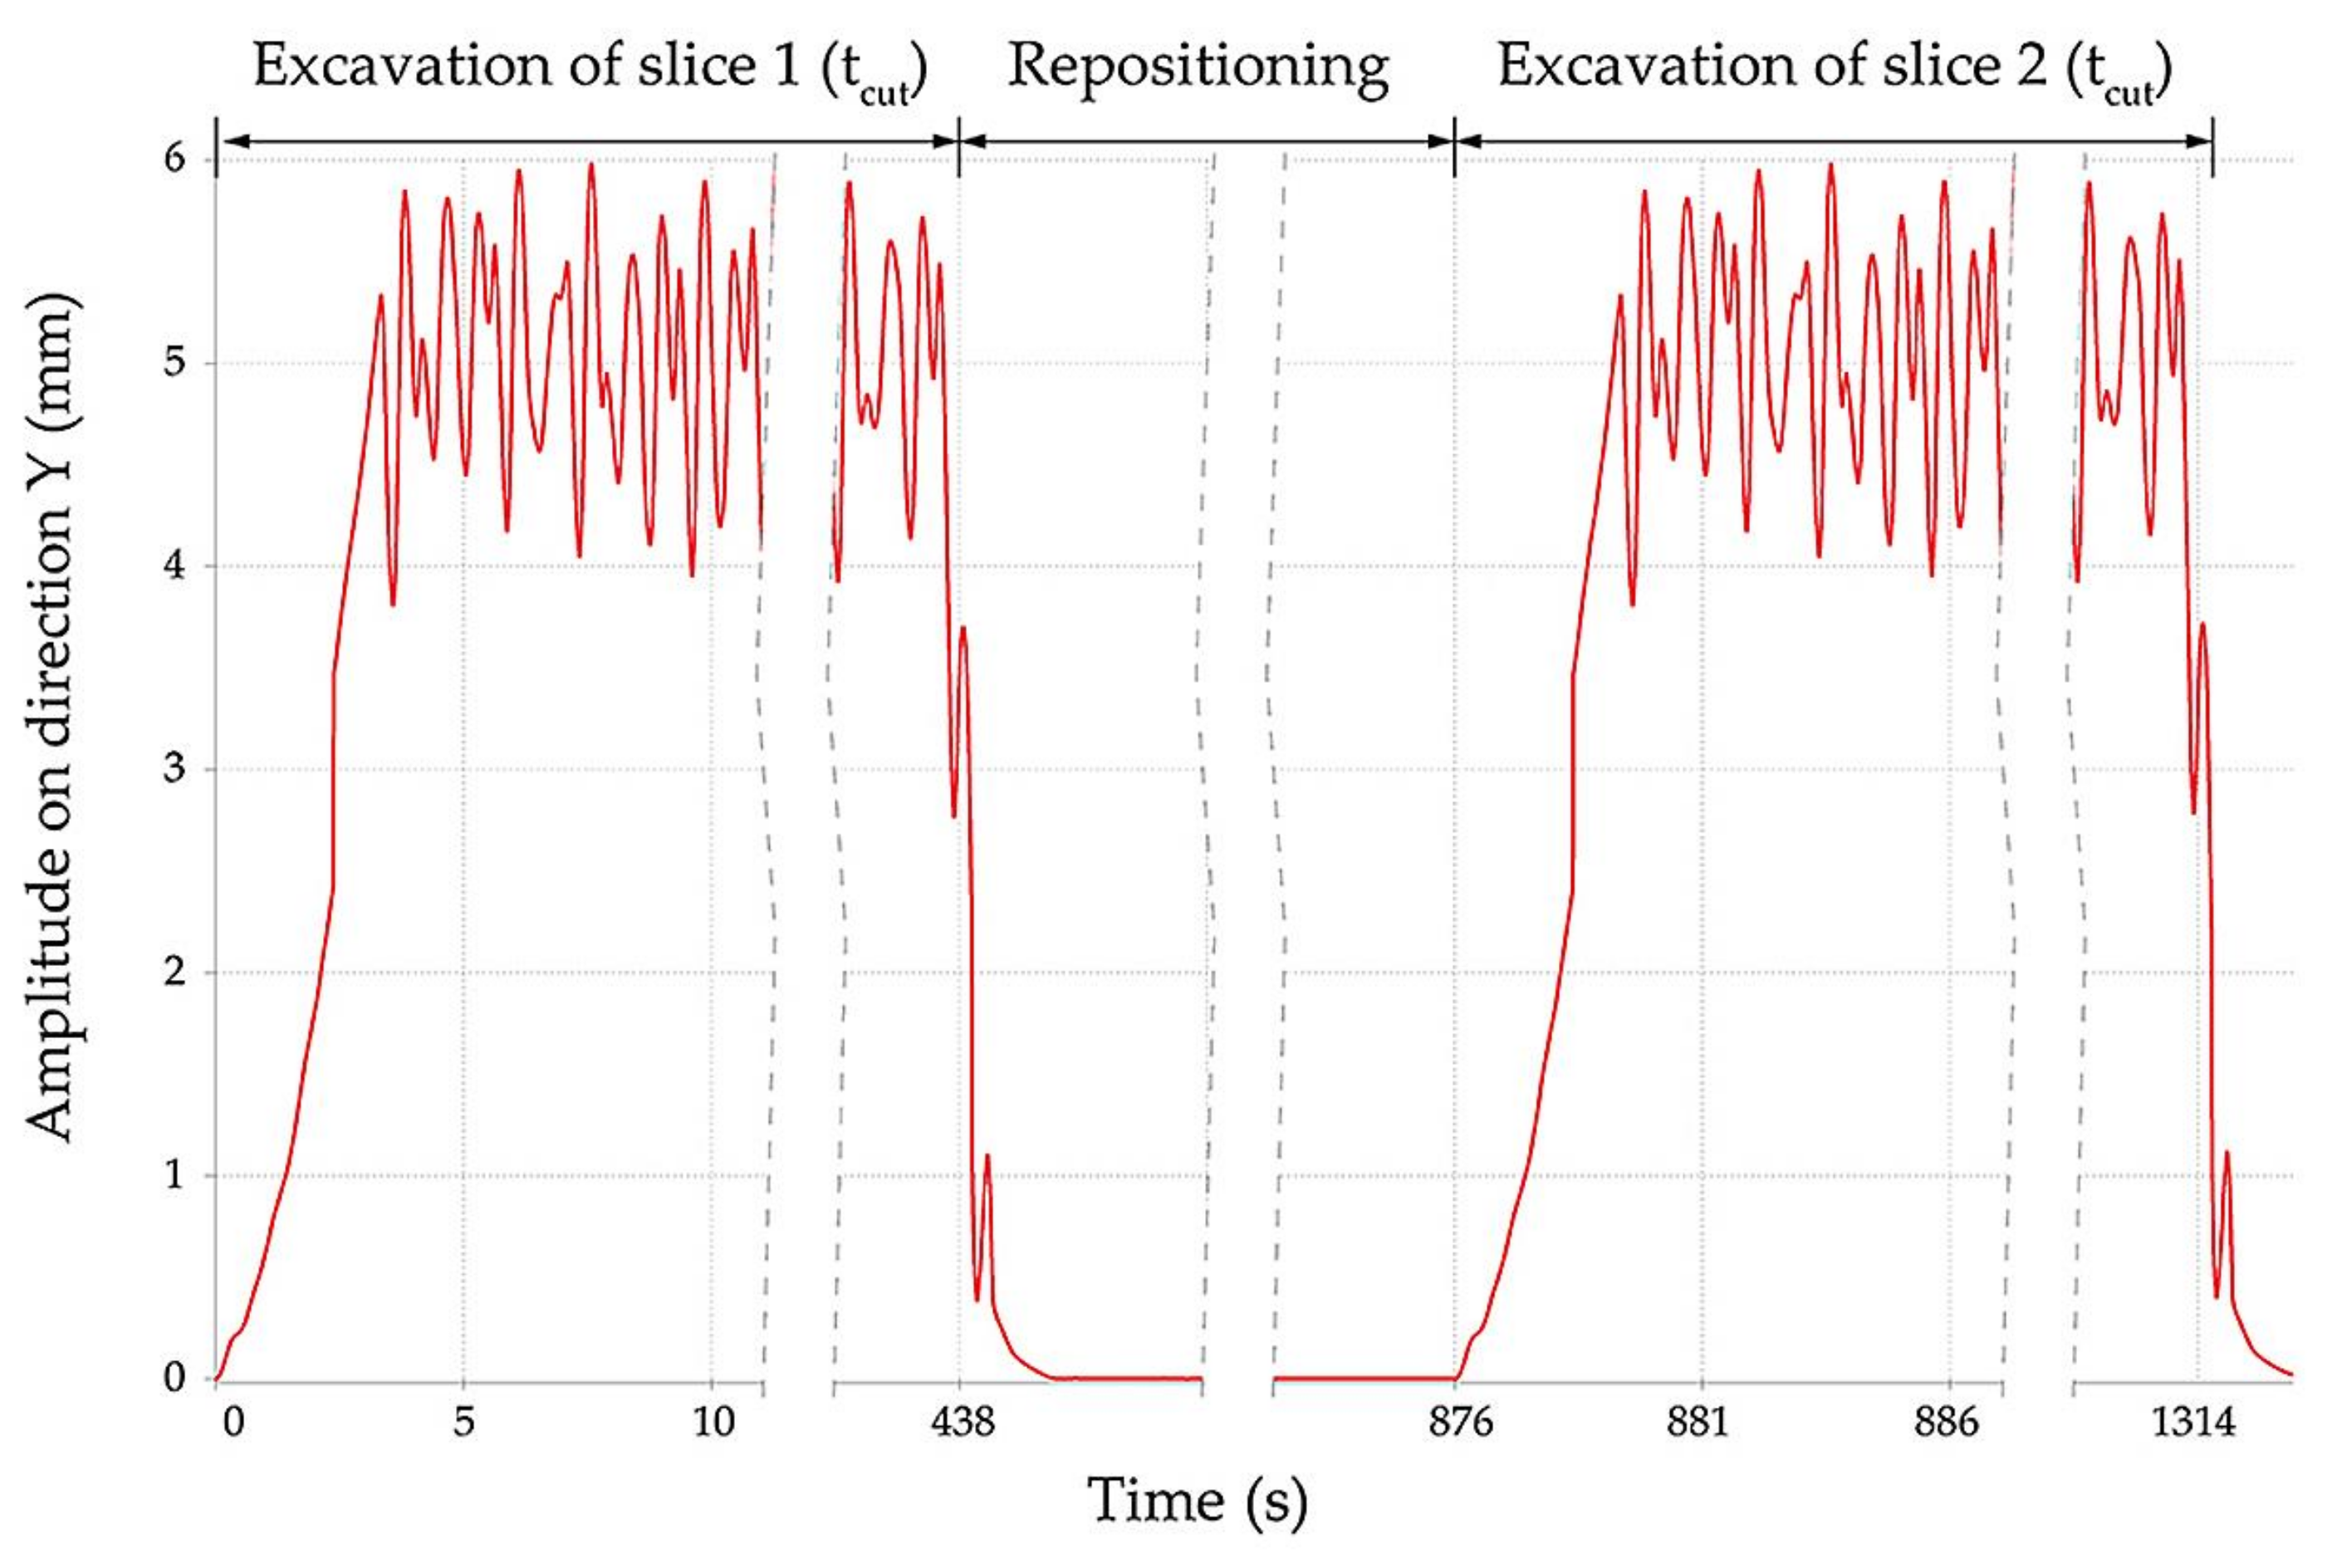
- All displacements are variable in time and have an oscillating character;
- The displacement has the highest amplitude in direction Y;
- Suppression of the excavation force determines a free vibration of the BWE boom that will be damped over time.
Author Contributions
Funding
Conflicts of Interest
References
- DIN 22261-1 and DIN 22261-2 Excavators, Spreaders and Auxiliary Equipment in Opencast Lignite Mines. Part 1: Construction, Commissioning and Monitoring, Part 2: Calculation Principles; German Institute for Standardization: Berlin, Germany, 2016.
- AS 4324.1: Mobile Equipment for Continuous Handling of Bulk Materials Part 1—General Requirements for the Design of Steel Structures; Standards Australia: Sydney, Australia, 1995.
- International Organization for Standardization. ISO 5049.1: Mobile Equipment for the Continuous Handling of Bulk Materials Part 1 Rules for the Design of Steel Structures; International Organization for Standardization: Geneva, Switzerland, 1994. [Google Scholar]
- EN 1993-1-9. Eurocode 3: Design of steel structures—Part 1–9: Fatigue. In Eurocode 4: Design of Composite Steel and Concrete Structures; John Wiley & Sons: Hoboken, NJ, USA, 2005. [Google Scholar]
- Arsić, M.; Bošnjak, S.; Zrnić, N.; Sedmak, A.; Gnjatović, N. Bucket wheel failure caused by residual stresses in welded joints. Eng. Fail. Anal. 2011, 18, 700–712. [Google Scholar] [CrossRef]
- Papanikolaou, S.; Fasnakis, D.; Maropoulos, A.; Giagopoulos, D.; Maropoulos, S.; Theodoulidis, T. Non-destructive testing of fatigue specimens of a welded bucket wheel excavator. In Proceedings of the 1st International Conference on Welding & NDT, Athens, Greece, 22–24 October 2018. [Google Scholar]
- Arsić, M.; Bošnjak, S.; Gnjatović, N.; Sedmak, S.A.; Arsić, D.; Savić, Z. Determination of residual fatigue life of welded structures at bucket-wheel excavators through the use of fracture mechanics. Procedia Struct. Integr. 2018, 13, 79–84. [Google Scholar] [CrossRef]
- Barcelos, B.L.; Palma, E.S. Fatigue analysis of a bucket wheel by using Linear Elastic Fracture Mechanics. Eng. Fail. Anal. 2020, 118, 104824. [Google Scholar] [CrossRef]
- Danicic, D.; Sedmak, S.; Ignjatovic, D.; Mitrovic, S. Bucket wheel excavator damage by fatigue fracture. Case Study. Proc. Mater. Sci. 2014, 3, 1723–1728. [Google Scholar] [CrossRef] [Green Version]
- Misiewicz, R.; Przybyłek, G.; Więckowski, J. Welding Procedure in Designing Carrying Structures of Machines. In Proceedings of the 14th International Scientific Conference: Computer Aided Engineering; Rusiński, E., Pietrusiak, D., Eds.; Springer: Cham, Switzerland, 2019; pp. 485–496. [Google Scholar] [CrossRef]
- Andruszko, J.; Moczko, P.; Pietrusiak, D.; Przybyłek, G.; Rusiński, E. Analysis of the Causes of Fatigue Cracks in the Carrying Structure of the Bucket Wheel in the SchRs4600 Excavator Using Experimental-Numerical Techniques. In Proceedings of the 14th International Scientific Conference: Computer Aided Engineering; Rusiński, E., Pietrusiak, D., Eds.; Springer: Cham, Switzerland, 2019; pp. 15–28. [Google Scholar] [CrossRef]
- Brkić, A.D.; Maneski, T.; Ignjatović, D.; Jovančić, P.D.; Spasojević Brkić, V.K. Diagnostics of bucket wheel excavator discharge boom dynamic performance and its reconstruction. Eksploat. Niezawodn. 2014, 16, 188–197. [Google Scholar]
- Bošnjak, S.M.; Arsić, M.; Zrnić, N.D.; Rakin, M.P.; Pantelić, M.P. Bucket wheel excavator integrity assessment of the bucket wheel boom tie-rod welded joint. Eng. Fail. Anal. 2011, 18, 212–222. [Google Scholar] [CrossRef]
- Savković, M.; Gašić, M.; Arsić, M.; Petrović, R. Analysis of the axle fracture of the bucket wheel excavator. Eng. Fail. Anal. 2011, 18, 433–441. [Google Scholar] [CrossRef]
- Petrović, A.; Maneski, T.; Trišović, N.; Ignjatović, D.; Dunjić, M. Identification of Crack Initiation Cause in Pylons Construction of the Excavator SchRs630. Teh. Vjesn. 2018, 25, 486–491. [Google Scholar] [CrossRef] [Green Version]
- Bošnjak, S.M.; Arsić, M.; Gnjatović, N.B.; Milenović, I.L.; Arsić, D. Failure of the bucket wheel excavator buckets. Eng. Fail. Anal. 2018, 84, 247–261. [Google Scholar] [CrossRef]
- Rusiński, E.; Czmochowski, J.; Iluk, A.; Kowalczyk, M. An analysis of the causes of a BWE counterweight boom support fracture. Eng. Fail. Anal. 2010, 17, 179–191. [Google Scholar] [CrossRef]
- Ghosal, S.; Misra, D.; Saha, T.K.; Chakravorty, D.; Chaudhuri, B. Failure Analysis of Stacker-cum-Reclaimer in Ore Handling Plant. J. Fail. Anal. Preven. 2008, 8, 564–571. [Google Scholar] [CrossRef]
- Arsić, D.; Nikolić, R.R.; Lazić, V.; Arsic, A.K.; Savić, Z.; Djačić, S.; Hadzima, B. Analysis of the cause of the girth gear tooth fracture occurrence at the bucket wheel excavator. Transp. Res. Proc. 2019, 40, 413–418. [Google Scholar] [CrossRef]
- Cernescu, A.; Marșavina, L.; Dumitru, I. Structural integrity assessment for a component of the bucket-wheel excavator. Int. J. Struct. Integr. 2014, 5, 129–140. [Google Scholar] [CrossRef]
- Arsić, M.; Savić, Z.; Sedmak, A.; Bosnjak, S.; Sedmak, S.A. Experimental examination of fatigue life of welded joint with stress concentration. Frattura Integr. Strutt. 2016, 10, 27–35. [Google Scholar] [CrossRef] [Green Version]
- Lazarević, Ž.; Aranđelović, I.; Kirin, S. The reliability of bucket wheel excavator-review of random mechanical failures. Teh. Vjesn. 2018, 25, 1259–1264. [Google Scholar]
- Bošnjak, S.M.; Momčilović, D.B.; Petković, Z.D.; Pantelic, M.; Gnjatović, N.B. Failure investigation of the bucket wheel excavator crawler chain link. Eng. Fail. Anal. 2013, 35, 462–469. [Google Scholar] [CrossRef]
- Djurdjevic, D.; Maneski, T.; Milosevic-Mitic, V.; Andjelic, N.; Ignjatovic, D. Failure investigation and reparation of a crack on the boom of the bucket wheel excavator ERS 1250 Gacko. Eng. Fail. Anal. 2018, 92, 210–316. [Google Scholar] [CrossRef]
- Moczko, P.; Pietrusiak, D.; Wieckowski, J. Investigation of the failure of the bucket wheel excavator bridge conveyor. Eng. Fail. Anal. 2019, 106, 104180. [Google Scholar] [CrossRef]
- Moczko, P.; Pietrusiak, D. Experimental—Numerical method for assessing the condition of opencast mining and material handling equipment. Aust. J. Struct. Eng. 2019, 20, 248–258. [Google Scholar] [CrossRef]
- Maslak, P.; Smolnicki, T.; Pietrusiak, D. Strain gauges measurements and FEM analysis of elements of chassis of open cast mining machines. Teh. Vjesn. 2013, 20, 655–658. [Google Scholar]
- Wannenburg, J.; Heyns, P.S.; Raath, A.D. Application of a fatigue equivalent static load methodology for the numerical durability assessment of heavy vehicle structures. Int. J. Fatigue 2009, 31, 1541–1549. [Google Scholar] [CrossRef] [Green Version]
- Misiewicz, R.; Więckowski, J.S. The Assessment of the Technical Condition of Complex Fatigued Load-Carrying Structures. Appl. Sci. 2021, 11, 2449. [Google Scholar] [CrossRef]
- Depale, B.; Bennebach, M. Residual life of steel structures and equipment: Problems and application to cranes. Mech. Ind. 2019, 20, 802. [Google Scholar] [CrossRef] [Green Version]
- Araújo, L.S.; Almeida, L.H.; Batista, E.D.; Landesmann, A. Failure of a Bucket-Wheel Stacker Reclaimer: Metallographic and Structural Analyses. J. Fail. Anal. Prev. 2012, 12, 402–407. [Google Scholar] [CrossRef]
- Kenno, S.Y.; Das, S.; Rogge, R.B.; Gharghouri, M.A. Changes in residual stresses caused by an interruption in the weld process of ships and offshore structures. Ships Offshore Struc. 2017, 12, 341–359. [Google Scholar] [CrossRef]
- Karthik, S.; Mahendramani, G. Fatigue failure analysis of fillet welded joints used in Offshore structures using numerical methods. Mater. Today-Proc. 2020, 45, 120–122. [Google Scholar] [CrossRef]
- Li, H.; Wu, G. Fatigue Evaluation of Steel Bridge Details Integrating Multi-Scale Dynamic Analysis of Coupled Train-Track-Bridge System and Fracture Mechanics. Appl. Sci. 2020, 10, 3261. [Google Scholar] [CrossRef]
- Alenowicz, J.; Huss, W. Fatigue Life Estimation in Bucket-Wheel Excavators Maintenance. In 1st Renewable Energy Sources-Research and Business (RESRB-2016), 22–24 June 2016, Wrocław, Poland; Rusiński, E., Pietrusiak, D., Eds.; Springer: Cham, Switzerland, 2016; pp. 9–17. [Google Scholar] [CrossRef]
- Vîlceanu, F.L.; Iancu, C. One method for life time estimation of a bucket wheel machine for coal moving. In IOP Conference Series: Materials Science and Engineering; IOP Publishing: Bristol, UK, 2016; Volume 147, p. 012064. [Google Scholar] [CrossRef]
- Grabowski, P.; Jankowiak, A.; Marowski, W. Fatigue lifetime correction of structural joints of opencast mining machinery. Eksploat. Niezawodn. 2021, 23, 530–539. [Google Scholar] [CrossRef]
- Kuhn, B.; Lukic, M.; Nussbaumer, A.; Günther, H.P.; Helmerich, R.; Herion, S.H.K.M.; Kolstein, M.H.; Walbridge, S.; Androic, B.; Dijkstra, O.; et al. Assessment of Existing Steel Structures: Recommendations for Estimation of Remaining Fatigue Life; JRC Scientific and Technical Reports; Joint Research Center: Huanggang, China, 2008. [Google Scholar]
- Arsić, D.; Gnjatović, N.; Sedmak, S.; Arsić, A.; Uhričik, M. Integrity assessment and determination of residual fatigue life of vital parts of bucket-wheel excavator operating under dynamic loads. Eng. Fail. Anal. 2019, 105, 182–195. [Google Scholar] [CrossRef]
- Marinković, Z.; Petrović, G. Processing the lifetime of bucket wheel excavator parts in strip mine technologies. Facta Univ. Ser. Mech. Eng. 2004, 2, 109–124. [Google Scholar]
- Polovina, D.; Ivkovic, S.; Ignjatovic, D.; Tanasijevic, M. Remaining operational capabilities evaluation of bucket wheel excavator by applying expert assessment method with empirical correction factor. Struct. Integr. Life 2010, 10, 31–41. [Google Scholar]
- Radu, S.M.; Popescu, F.D.; Andraș, A.; Andraș, I.; Brînaș, I.; Valceanu, F. Numerical analysis of fatigue for the assessment of remaining service life of the ERc 1400-30/7 bucket wheel excavator. Proc. Rom. Acad. Ser. A 2021, 22, 143–152. [Google Scholar]
- Popescu, F.D.; Radu, S.M.; Kotwica, K.; Andraș, A.; Kertesz (Brînaș), I. Simulation of the time response of the ERc 1400-30/7 bucket wheel excavator’s boom during the excavation process. Sustainability 2019, 11, 4357. [Google Scholar] [CrossRef] [Green Version]
- Kertesz, B.I. Contribuții la Studiul Echipamentelor Miniere de Excavare Prin Modelare și Simulare în Vederea Îmbunătățirii Performanțelor Funcționale ale Acestora. Ph.D. Thesis, University of Petroșani, Petroșani, Romania, 2019. (In Romanian). [Google Scholar]
- Brînaș, I.; Radu, S.M.; Popescu, F.D.; Andraș, A. Modelarea si Simularea Procesului de Dislocare Utilizand Excavatoare cu Rotor, 1st ed.; Editura Universitas: Petroșani, Romania, 2020. [Google Scholar]
- ROMINEX S.A. Excavatorul cu Roată Portcupe ERc 1400—30/7 Modernizat, Instrucţiuni de Exploatare, Întreţinere şi Reparaţii; ROMINEX S.A.: Timișoara, Romania, 2007. (In Romanian) [Google Scholar]
- ICSITUMMR TIMIŞOARA. Instrucţiuni de montaj, exploatare şi întreţinere Excavator cu roată cu cupe ERc 1400x30/7, Vol I şi II –parte mecanică; ICSITUMMR: Timișoara, Romania, 1988. (In Romanian) [Google Scholar]
- Rasper, L. The Bucket Wheel Excavator: Development—Design—Application; Trans Tech Publications: Clausthal, Germany, 1975. [Google Scholar]
- Bošnjak, S.M.; Gnjatović, N.B. The influence of geometric configuration on response of the bucket wheel excavator superstructure. FME Trans. 2016, 44, 313–323. [Google Scholar] [CrossRef]
- Popescu, F.; Radu, S.; Kotwica, K.; Andraș, A.; Kertesz Brînaș, I.; Dinescu, S. Vibration analysis of a bucket wheel excavator boom using Rayleigh’s damping model. New Tr. Prod. Eng. 2019, 2, 233–241. [Google Scholar] [CrossRef] [Green Version]
- Radu, S.M.; Popescu, F.D.; Andras, A.; Kertesz, I.; Tomus, O.B. Simulation and modelling of the forces acting on the rotor shaft of BWEs, in order to improve the quality of the cutting process. Ann. Univ. Petroşani Mech. Eng. 2018, 20, 63–72. [Google Scholar]
- Kurowski, P.M. Engineering Analysis with SOLIDWORKS® Simulation 2015; SDC Publications: Mission, KS, USA, 2015. [Google Scholar]
- Kurowski, P.M. Vibration Analysis with SOLIDWORKS® Simulation 2016; SDC Publications: Mission, KS, USA, 2016. [Google Scholar]
- Aggogeri, F.; Borboni, A.; Merlo, A.; Pellegrini, N.; Ricatto, R. Vibration Damping Analysis of Lightweight Structures in Machine Tools. Materials 2017, 10, 297. [Google Scholar] [CrossRef] [PubMed] [Green Version]
- Rea, D.; Clough, R.W.; Bouwkamp, J.G. Damping Capacity of a Model Steel Structure: A Report to American Iron and Steel Institute; CCFSS Library: Rolla, MO, USA, 1971; Volume 109. [Google Scholar]
- Pietrusiak, D.; Smolnicki, T.; Stańco, M. The influence of superstructure vibrations on operational loads in the undercarriage of bulk material handling machine. Arch. Civ. Mech. Eng. 2017, 17, 855–862. [Google Scholar] [CrossRef]
- Lazar, M.; Andras, I.; Risteiu, M.; Predoiu, I. In situ measurements regarding the BWE boom using accelerometers and strain gauges at BWEs operating in CEO open pits. Górnictwo Odkryw. 2018, 59, 86–93. [Google Scholar]
- Rusinski, E.; Moczko, P.; Pietrusiak, D. Low frequency vibrations of the surface mining machines caused by operational loads and its impact on durability. In Conference Proceedings, International Conference on Noise and Vibration Engineering ISMA; KU Leuven: Heverlee, Belgium, 2014; pp. 683–694. [Google Scholar]
- Jiang, Y.Z.; Liu, C.J.; Li, X.J.; He, K.F.; Xiao, D.M. Low-Frequency Vibration Testing of Huge Bucket Wheel Excavator Based on Step-Decay Signals. Shock. Vib. 2018, 2018, 6182156. [Google Scholar] [CrossRef]
- Więckowski, J.; Rafajłowicz, W.; Moczko, P.; Rafajłowicz, E. Data from vibration measurement in a bucket wheel excavator operator's cabin with the aim of vibrations damping. Data Brief 2021, 35, 106836. [Google Scholar] [CrossRef] [PubMed]
- Brînaș, I.; Andraș, A.; Radu, S.M.; Popescu, F.D.; Andraș, I.; Marc, B.I.; Cioclu, A.R. Determination of the Bucket Wheel Drive Power by Computer Modeling Based on Specific Energy Consumption and Cutting Geometry. Energies 2021, 14, 3892. [Google Scholar] [CrossRef]
- Vilceanu, V.F. Studiul Duratei de Viaţă Pentru Utilajele de Extragere şi Depunere în Depozite, Utilizate în Carierele din Bazinul Olteniei. Ph.D. Thesis, University of Petroșani, Petroșani, Romania, 2018. [Google Scholar]
- Radu, S.M.; Vîlceanu, F.; Banciu, R.; Rebedea, N.I. Analysis of load-bearing structures for quarry equipment by the method of resistive tensometry. Rev. Min. Min. Rev. 2020, 26, 10–15. [Google Scholar]


| Static Load (Name) | SOLIDWORKS Feature | Magnitude (Unit) |
|---|---|---|
| Bucket wheel | Assembly | 39.60 (tons) |
| Bucket wheel drive system | Mass (distributed) | 29.00 (tons) |
| Hoisting ropes | Spring | 35 × 106 × 2 (N/m) |
| Discharge conveyor belt | Mass (remote) | 25.00 (tons) |
| Mode | ||||||||||||||||
|---|---|---|---|---|---|---|---|---|---|---|---|---|---|---|---|---|
| Position | Result | 1 | 2 | 3 | 4 | 5 | 6 | 7 | 8 | 9 | 10 | 11 | 12 | 13 | 14 | 15 |
| (1) | f (Hz) | 1.74 | 1.91 | 4.63 | 5.32 | 6.66 | 8.15 | 9.92 | 12.51 | 12.80 | 13.64 | 16.49 | 16.76 | 16.87 | 17.08 | 17.15 |
| max (mm) | 68.43 | 73.02 | 6.12 | 2.38 | 3.01 | 4.03 | 3.23 | 2.41 | 1.67 | 2.54 | 4.05 | 4.74 | 4.49 | 3.71 | 3.51 | |
| (2) | f (Hz) | 1.77 | 2.00 | 4.68 | 5.33 | 6.66 | 8.14 | 9.94 | 12.53 | 12.79 | 13.66 | 16.49 | 16.76 | 16.87 | 17.08 | 17.16 |
| max (mm) | 39.83 | 92.6 | 9.45 | 2.42 | 2.16 | 4.00 | 2.48 | 1.71 | 1.30 | 4.32 | 4.70 | 5.48 | 5.19 | 4.08 | 3.75 | |
| (3) | f (Hz) | 1.76 | 1.91 | 4.64 | 5.32 | 6.65 | 8.14 | 9.93 | 12.52 | 12.78 | 13.65 | 16.49 | 16.76 | 16.87 | 17.08 | 17.16 |
| max (mm) | 52.15 | 88.36 | 12.47 | 2.44 | 1.21 | 3.49 | 1.40 | 1.34 | 1.56 | 5.20 | 4.48 | 5.25 | 4.95 | 3.78 | 3.41 | |
| Damage (%) | Period Analyzed (years) | Events (×106) | |
|---|---|---|---|
| Min | Max | ||
| 2 | 13.20 | 10 | 76 |
| 2 | 19.60 | 15 | 114 |
| 3 | 26.20 | 20 | 152 |
| 3 | 27.40 | 21 | 159.6 |
| 3 | 28.80 | 22 | 167.2 |
| 3 | 30.30 | 23 | 174.8 |
| 3 | 31.40 | 24 | 182.4 |
| 4 | 32.90 | 25 | 190 |
| 4 | 34.10 | 26 | 197.6 |
| 4 | 35.50 | 27 | 205.2 |
| 4 | 36.70 | 28 | 212.8 |
| 4 | 38.60 | 29 | 220.4 |
| 5 | 955.30 | 30 | 228 |
Publisher’s Note: MDPI stays neutral with regard to jurisdictional claims in published maps and institutional affiliations. |
© 2021 by the authors. Licensee MDPI, Basel, Switzerland. This article is an open access article distributed under the terms and conditions of the Creative Commons Attribution (CC BY) license (https://creativecommons.org/licenses/by/4.0/).
Share and Cite
Andraș, A.; Radu, S.M.; Brînaș, I.; Popescu, F.D.; Budilică, D.I.; Korozsi, E.B. Prediction of Material Failure Time for a Bucket Wheel Excavator Boom Using Computer Simulation. Materials 2021, 14, 7897. https://0-doi-org.brum.beds.ac.uk/10.3390/ma14247897
Andraș A, Radu SM, Brînaș I, Popescu FD, Budilică DI, Korozsi EB. Prediction of Material Failure Time for a Bucket Wheel Excavator Boom Using Computer Simulation. Materials. 2021; 14(24):7897. https://0-doi-org.brum.beds.ac.uk/10.3390/ma14247897
Chicago/Turabian StyleAndraș, Andrei, Sorin Mihai Radu, Ildiko Brînaș, Florin Dumitru Popescu, Daniela Ioana Budilică, and Eva Biro Korozsi. 2021. "Prediction of Material Failure Time for a Bucket Wheel Excavator Boom Using Computer Simulation" Materials 14, no. 24: 7897. https://0-doi-org.brum.beds.ac.uk/10.3390/ma14247897