
Prospects for Electrical Performance Tuning in Ca3Co4O9 Materials by Metallic Fe and Ni Particles Additions

 ,
,  , , , and
Abstract
:1. Introduction
2. Materials and Methods
3. Results and Discussions
3.1. The Samples Processed under the 1ST Route
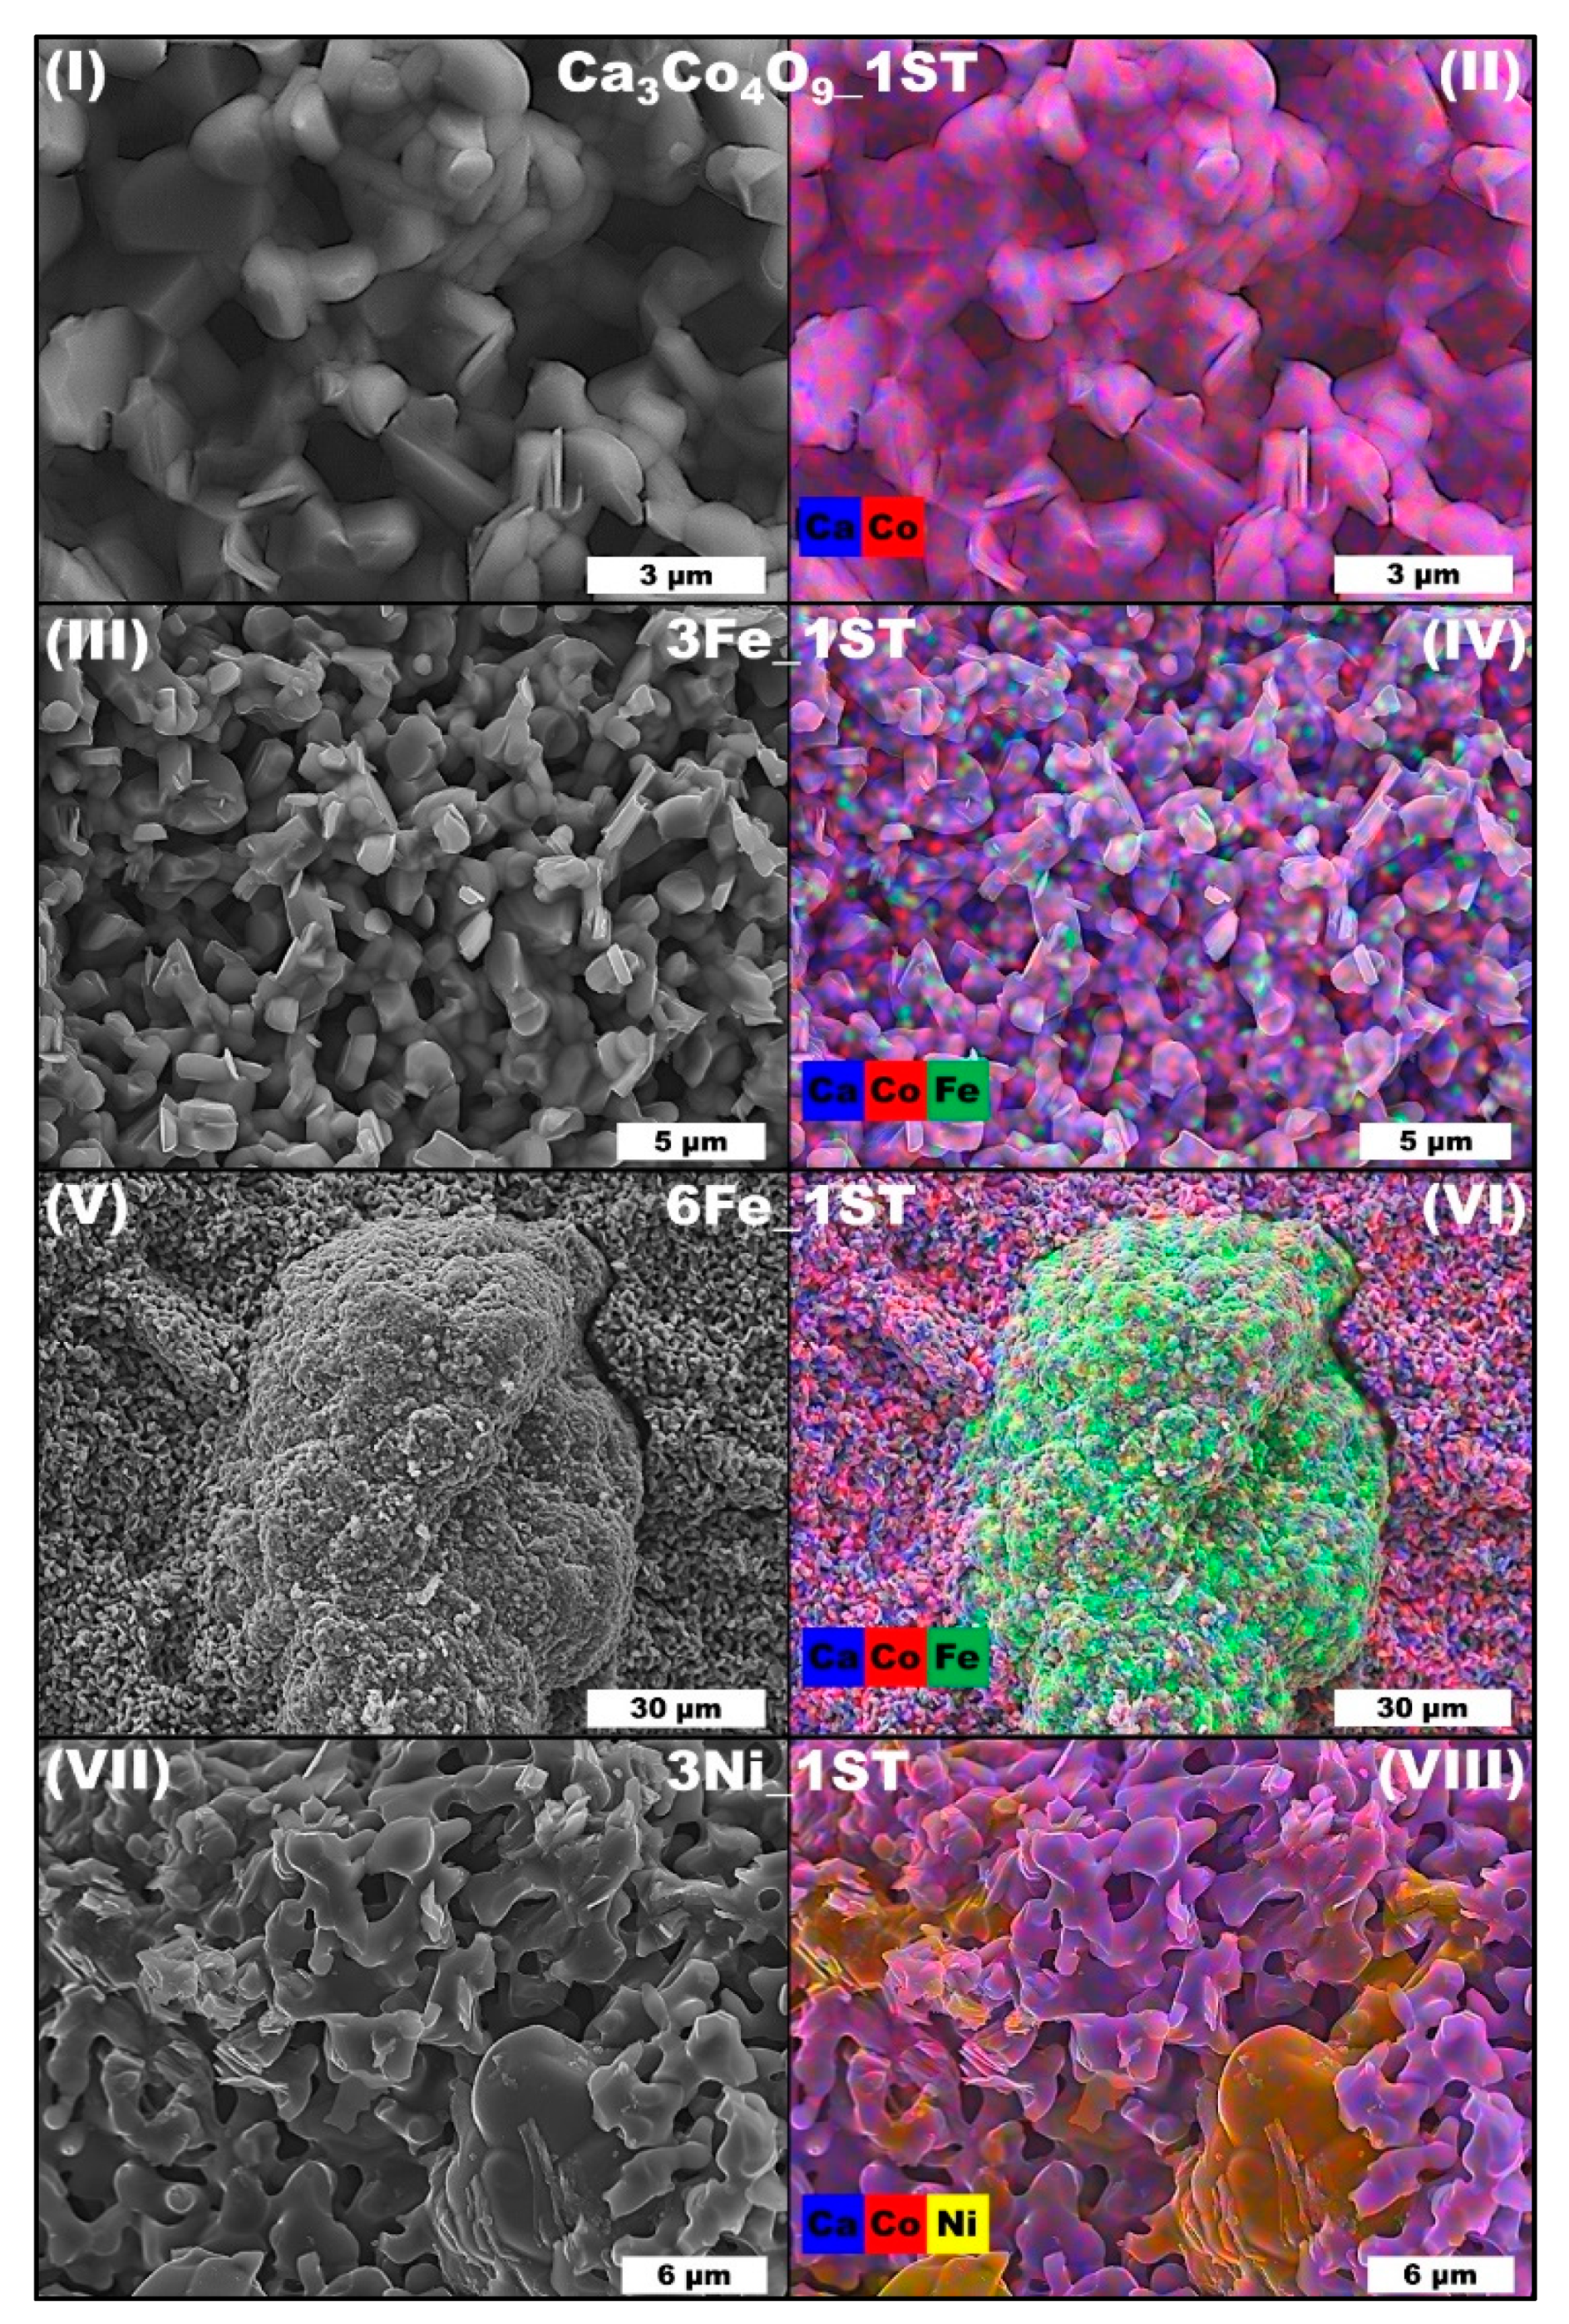
3.1.1. Compositional and Morpho-Structural Evolution
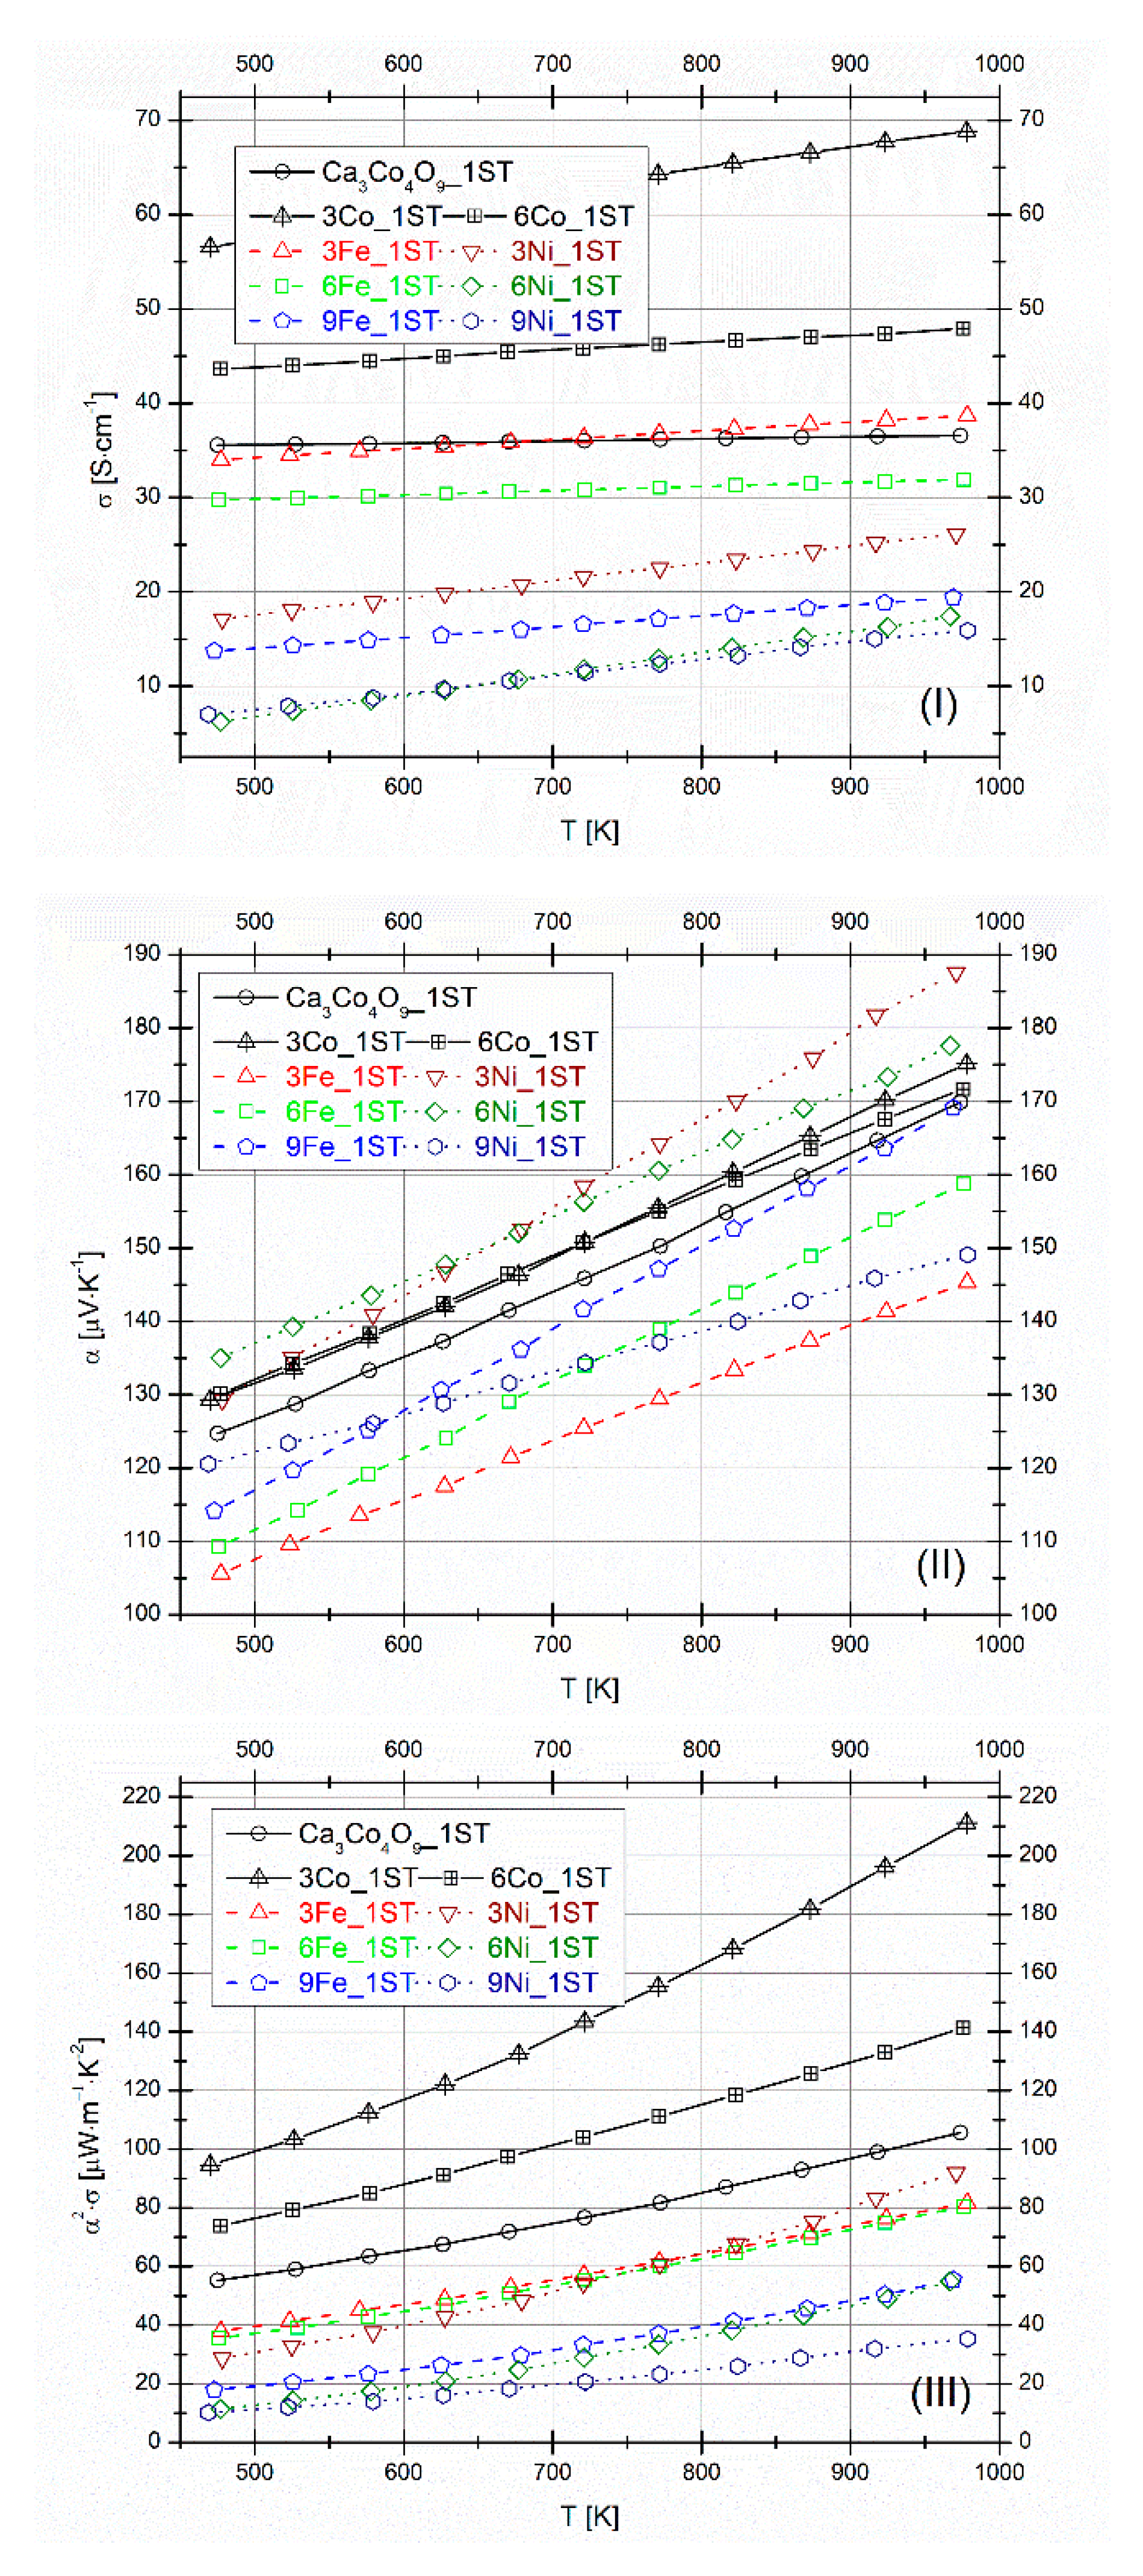
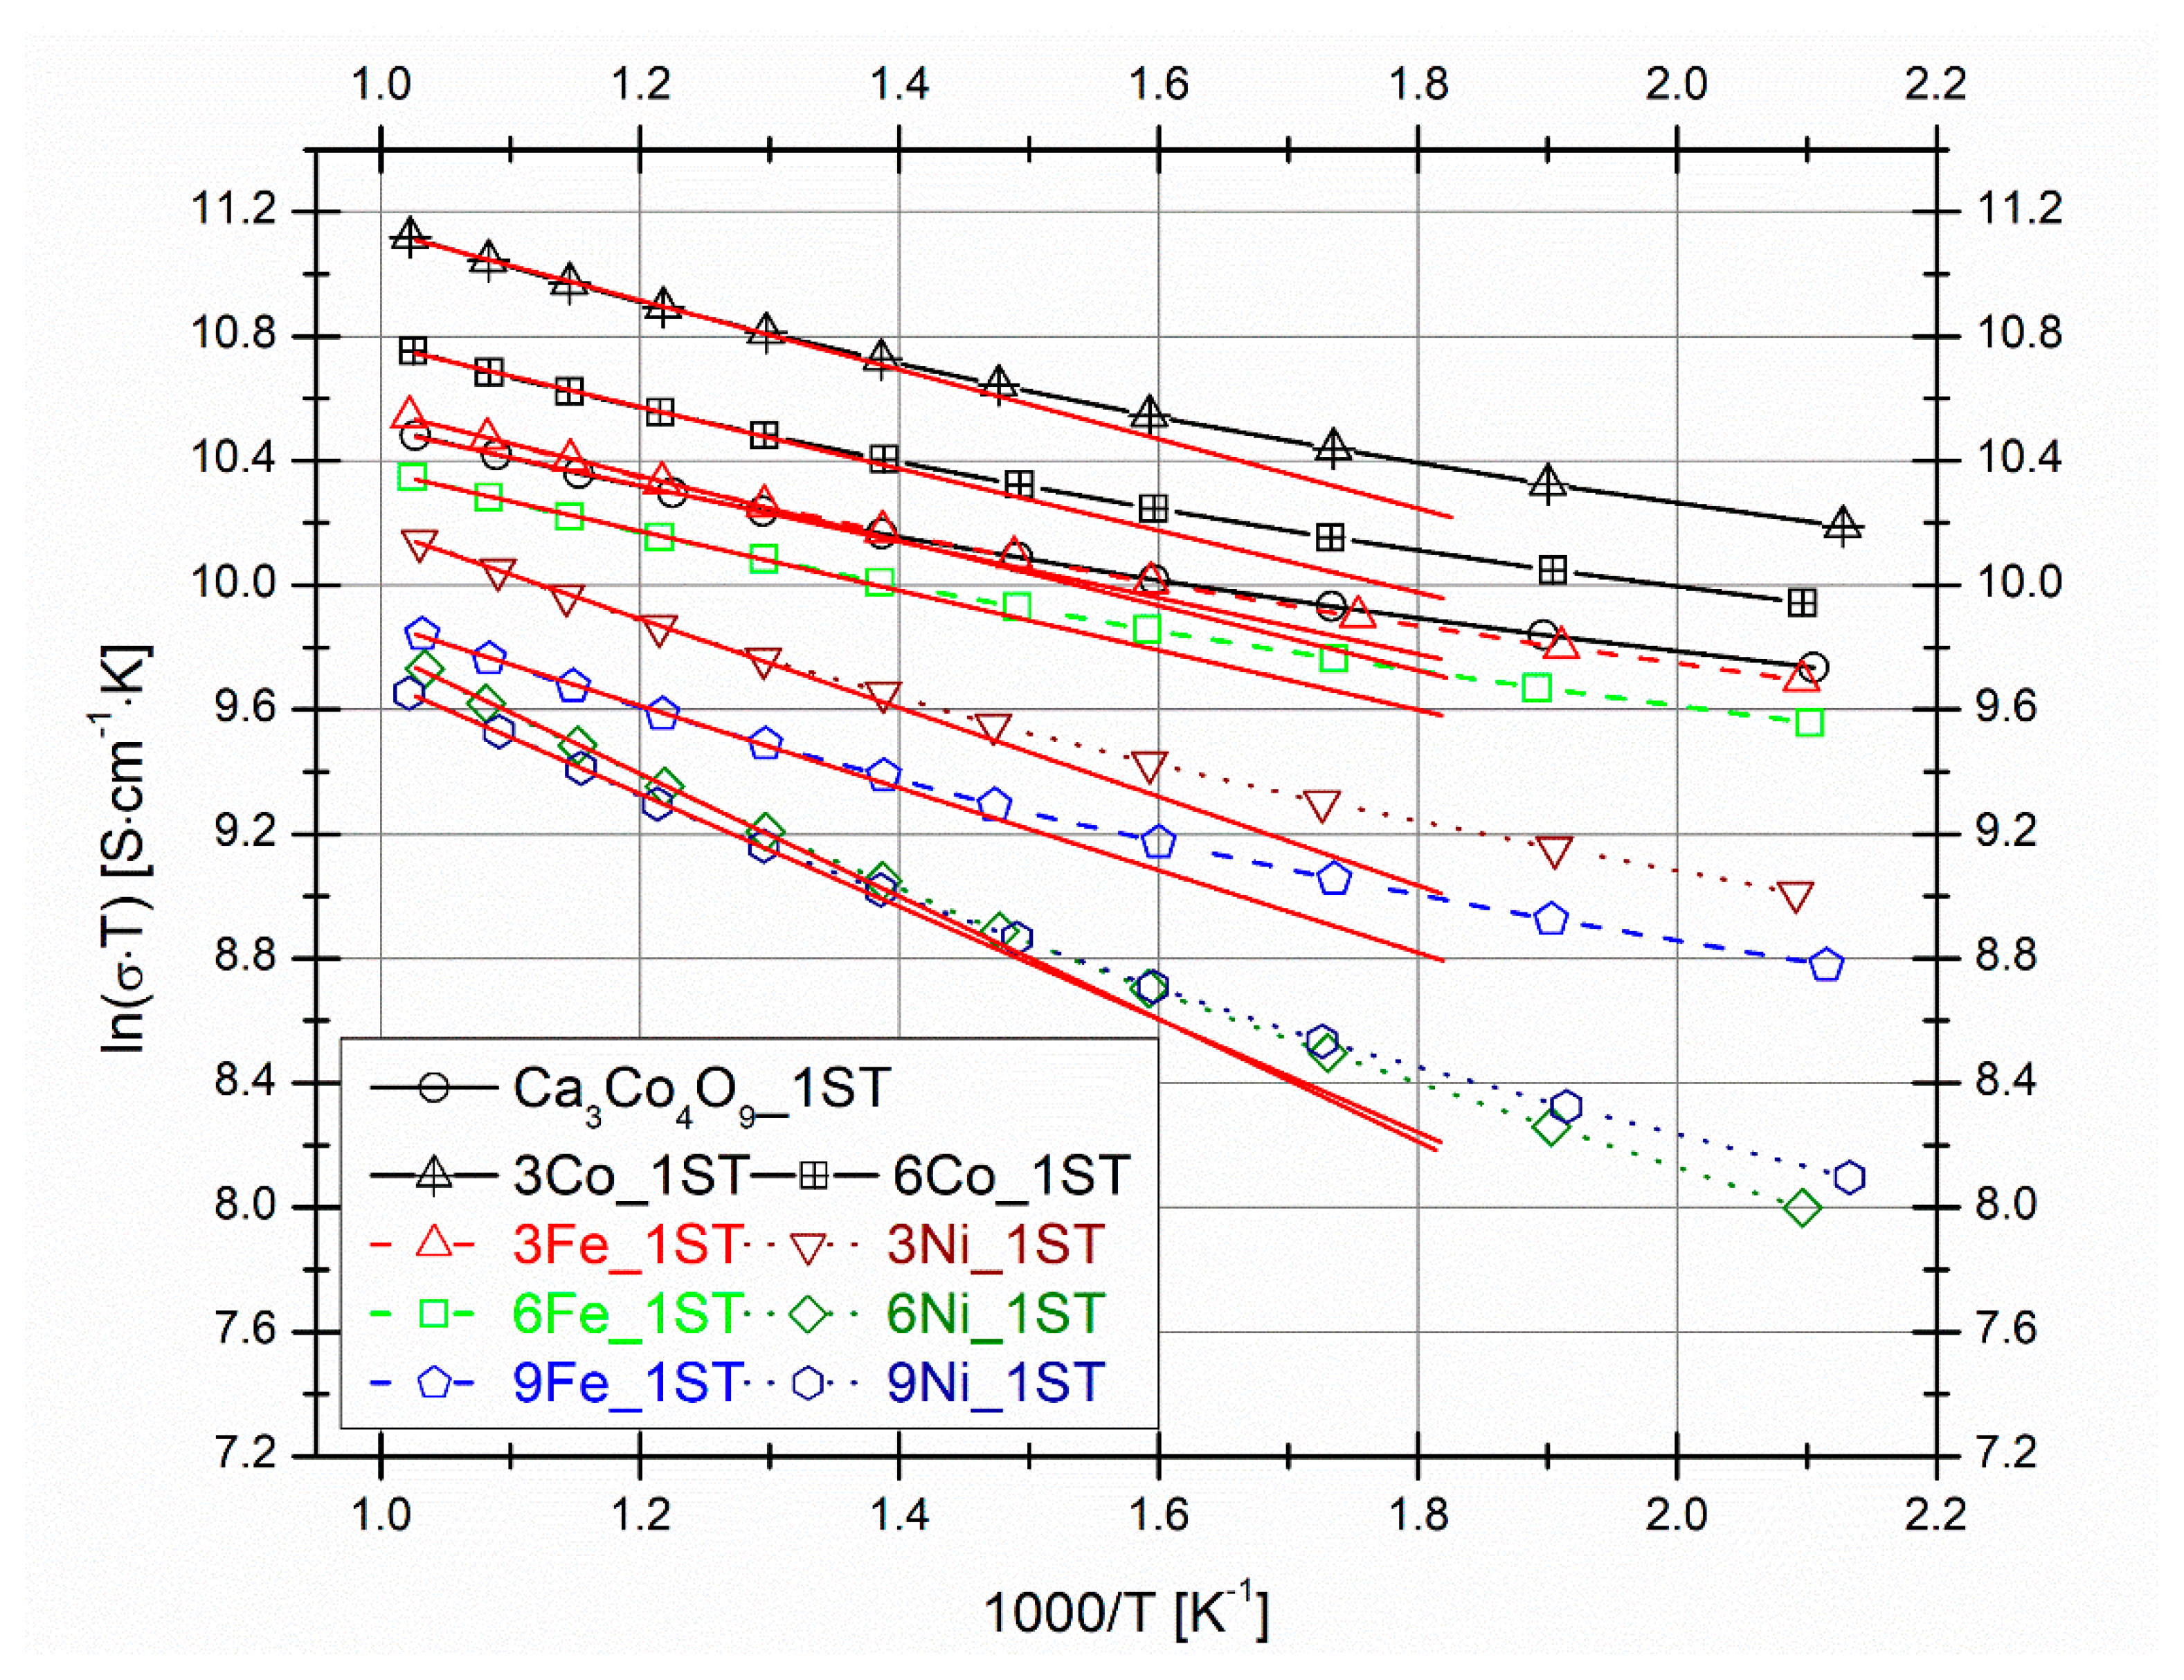
3.1.2. Electrical Performance
3.2. The Samples Processed under the 2ST Route
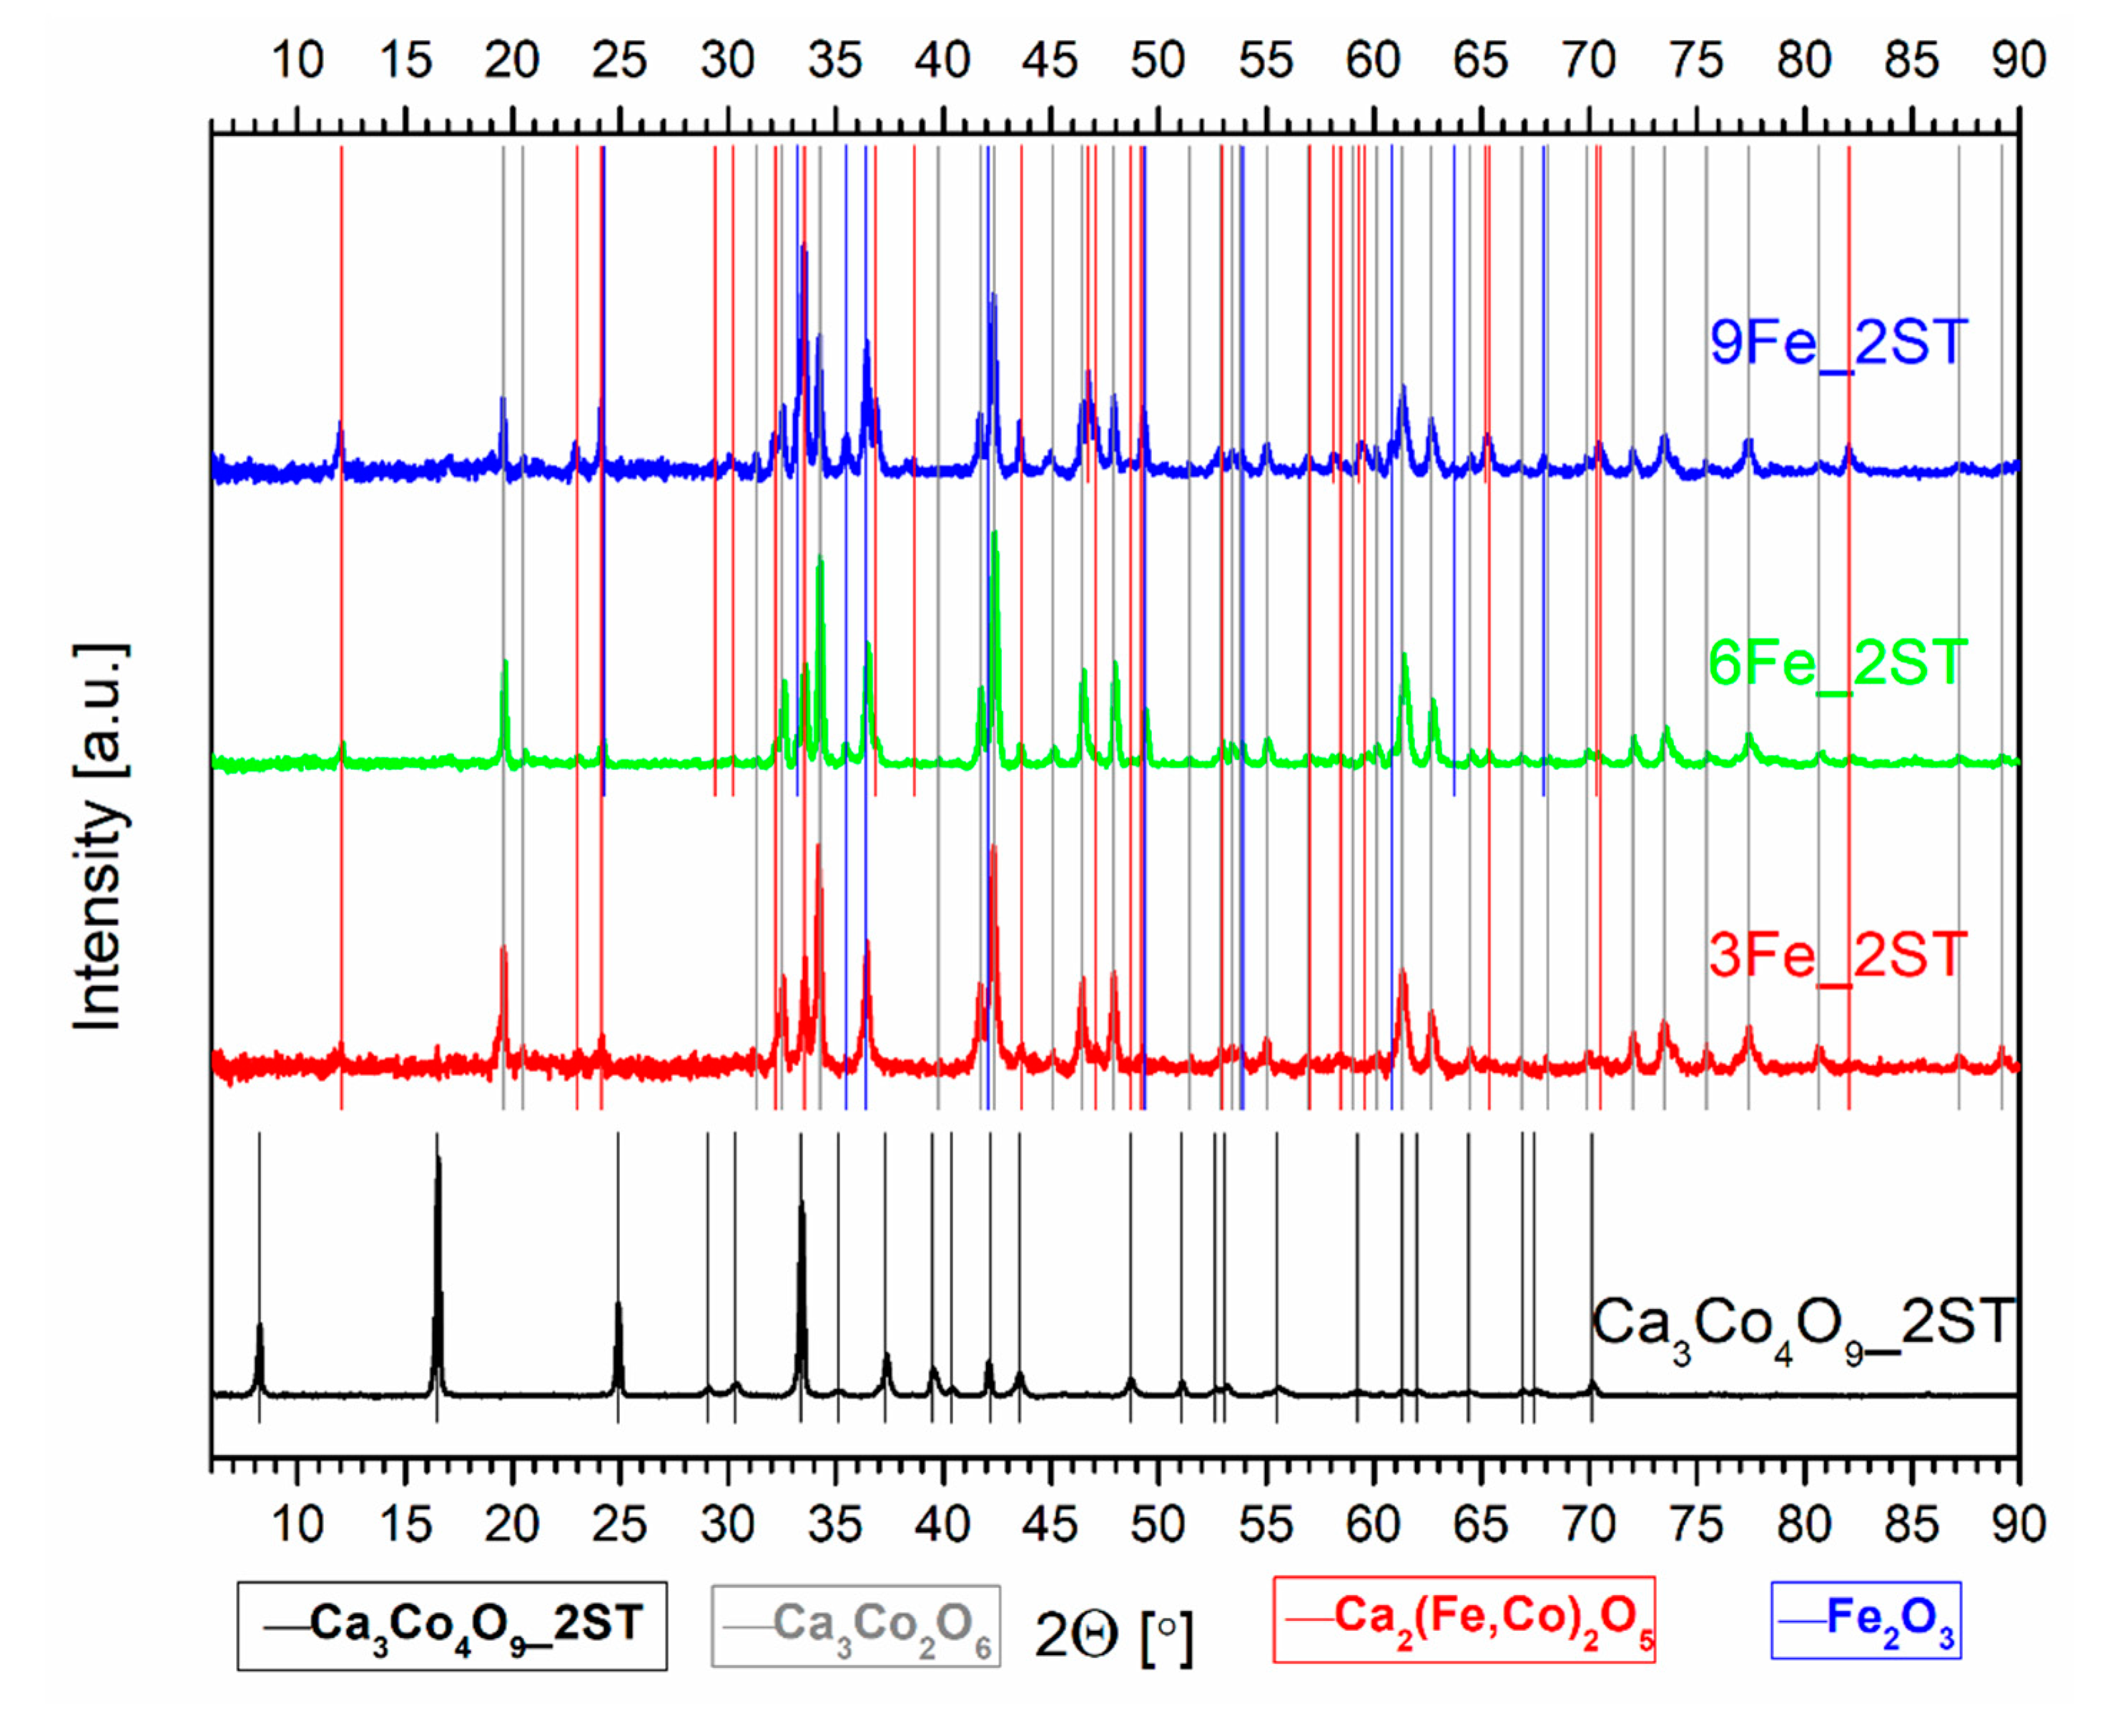
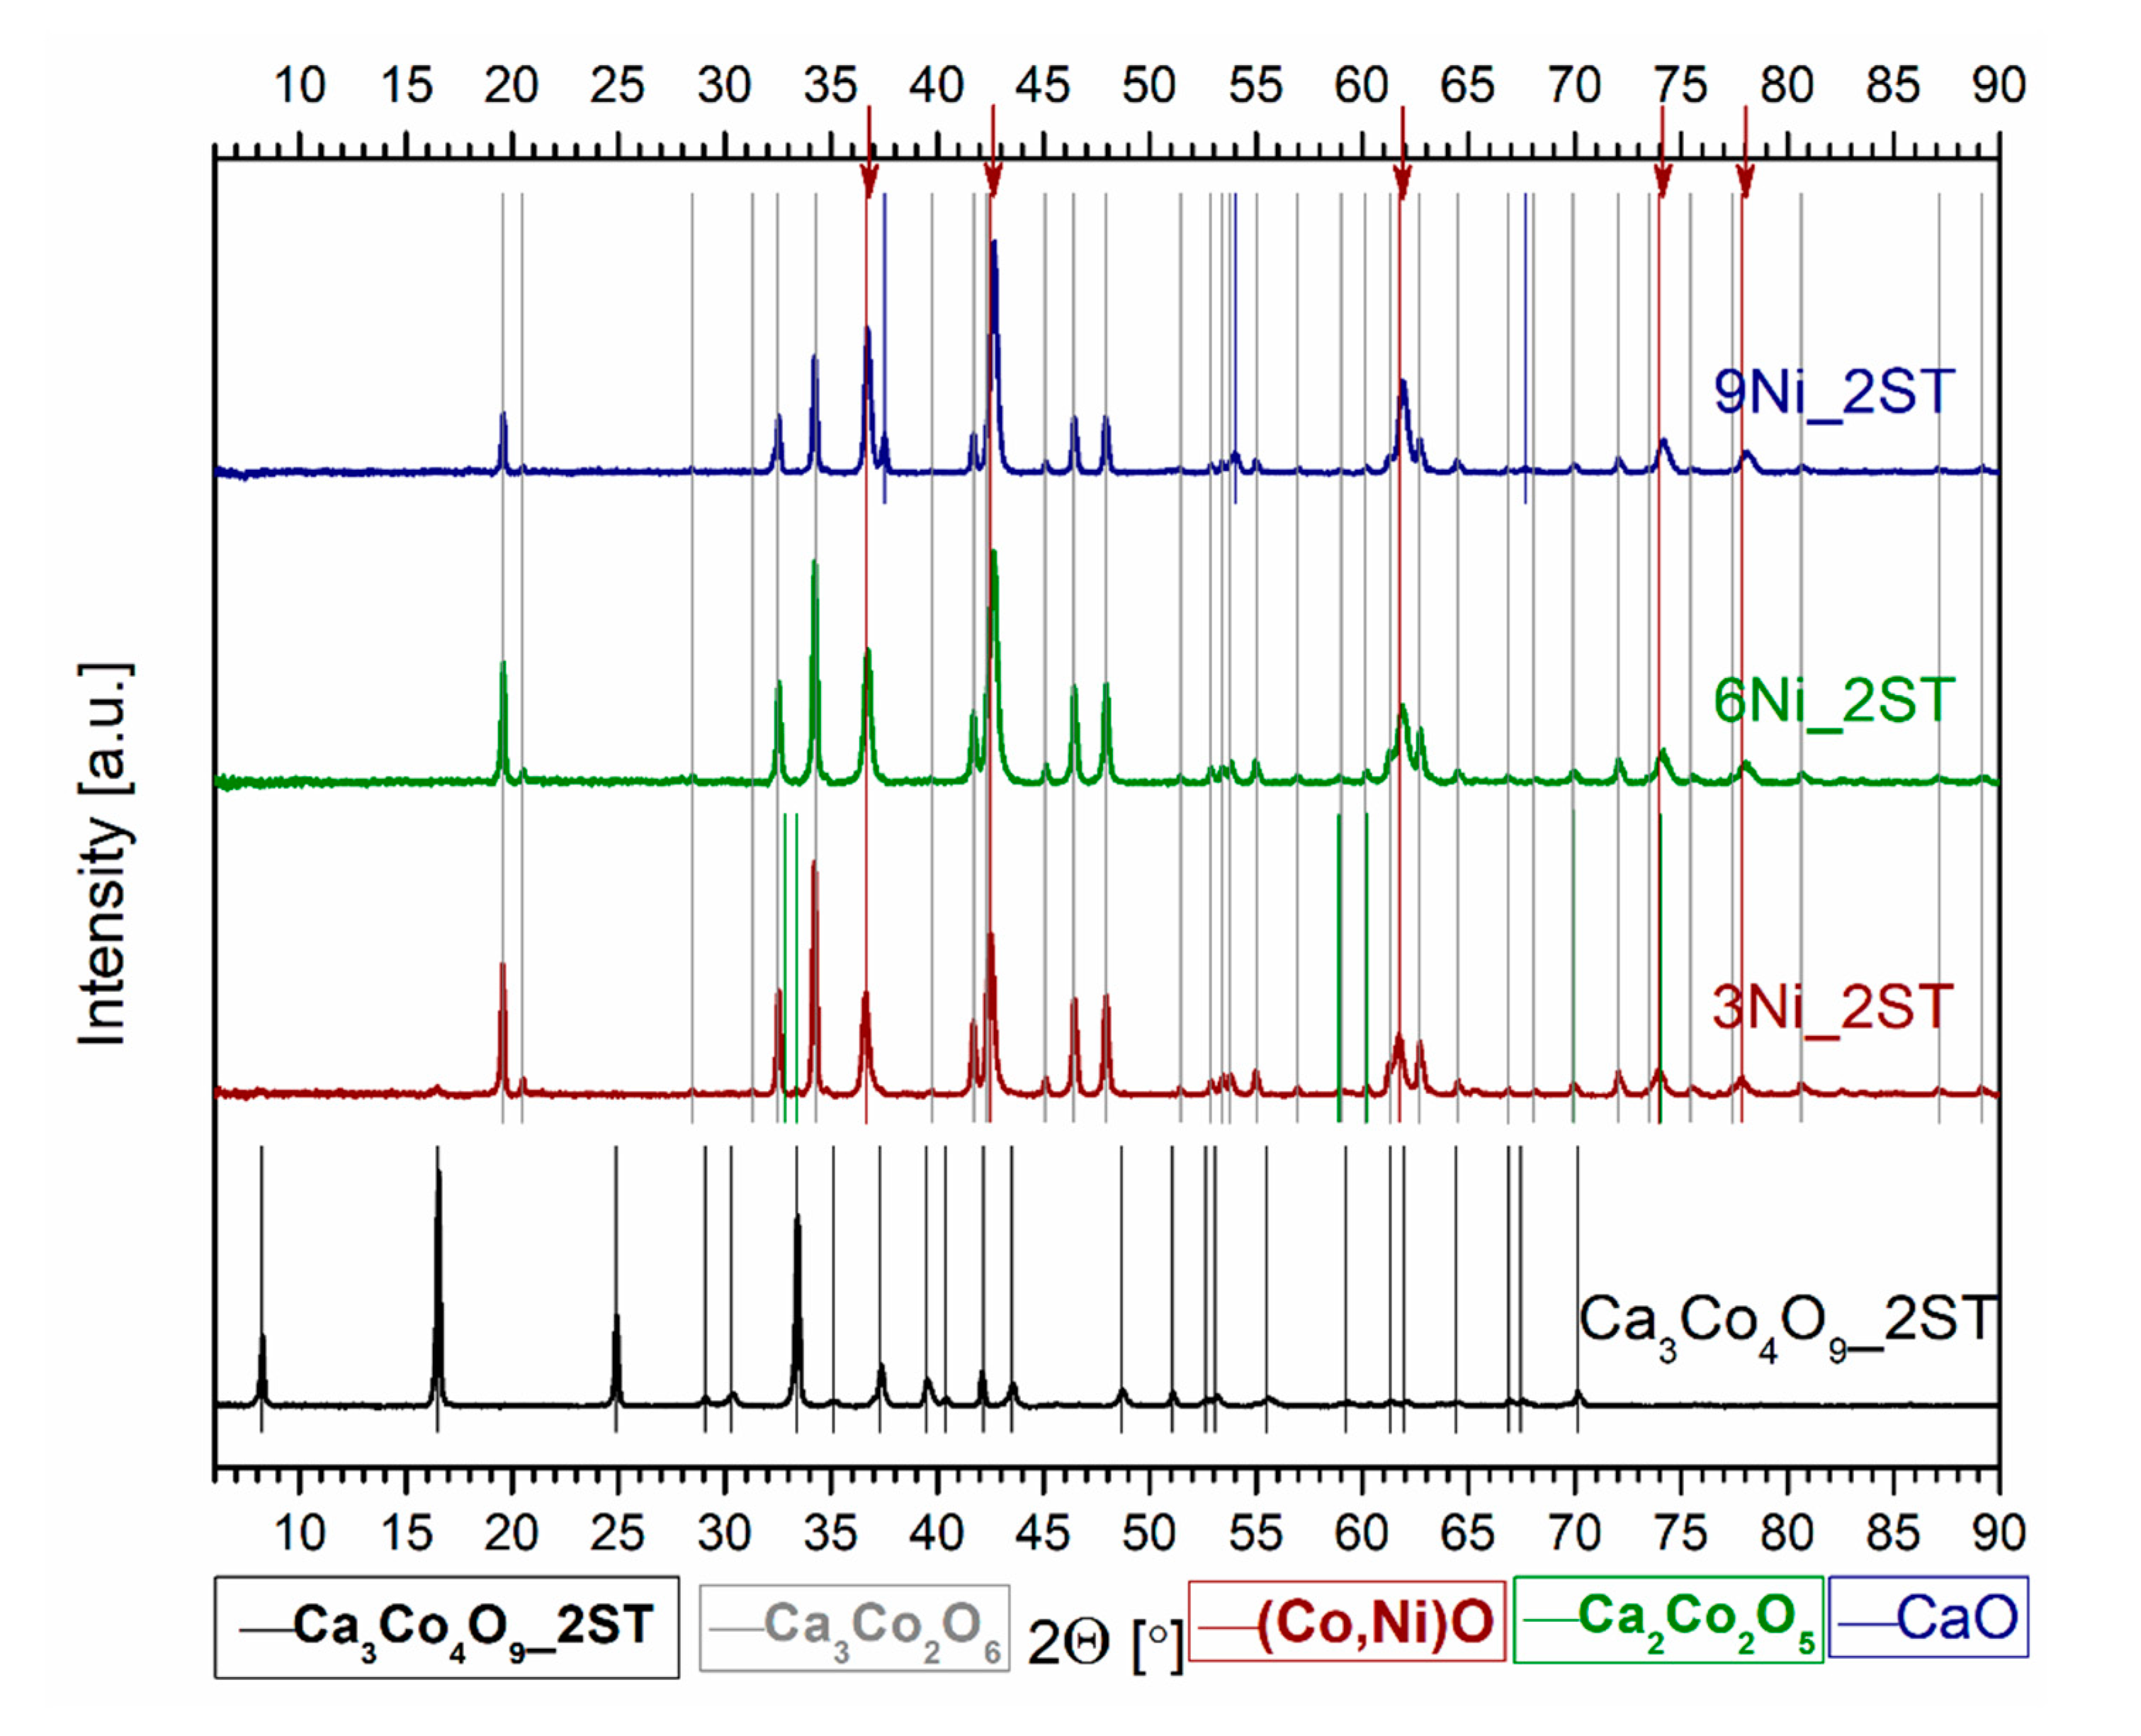
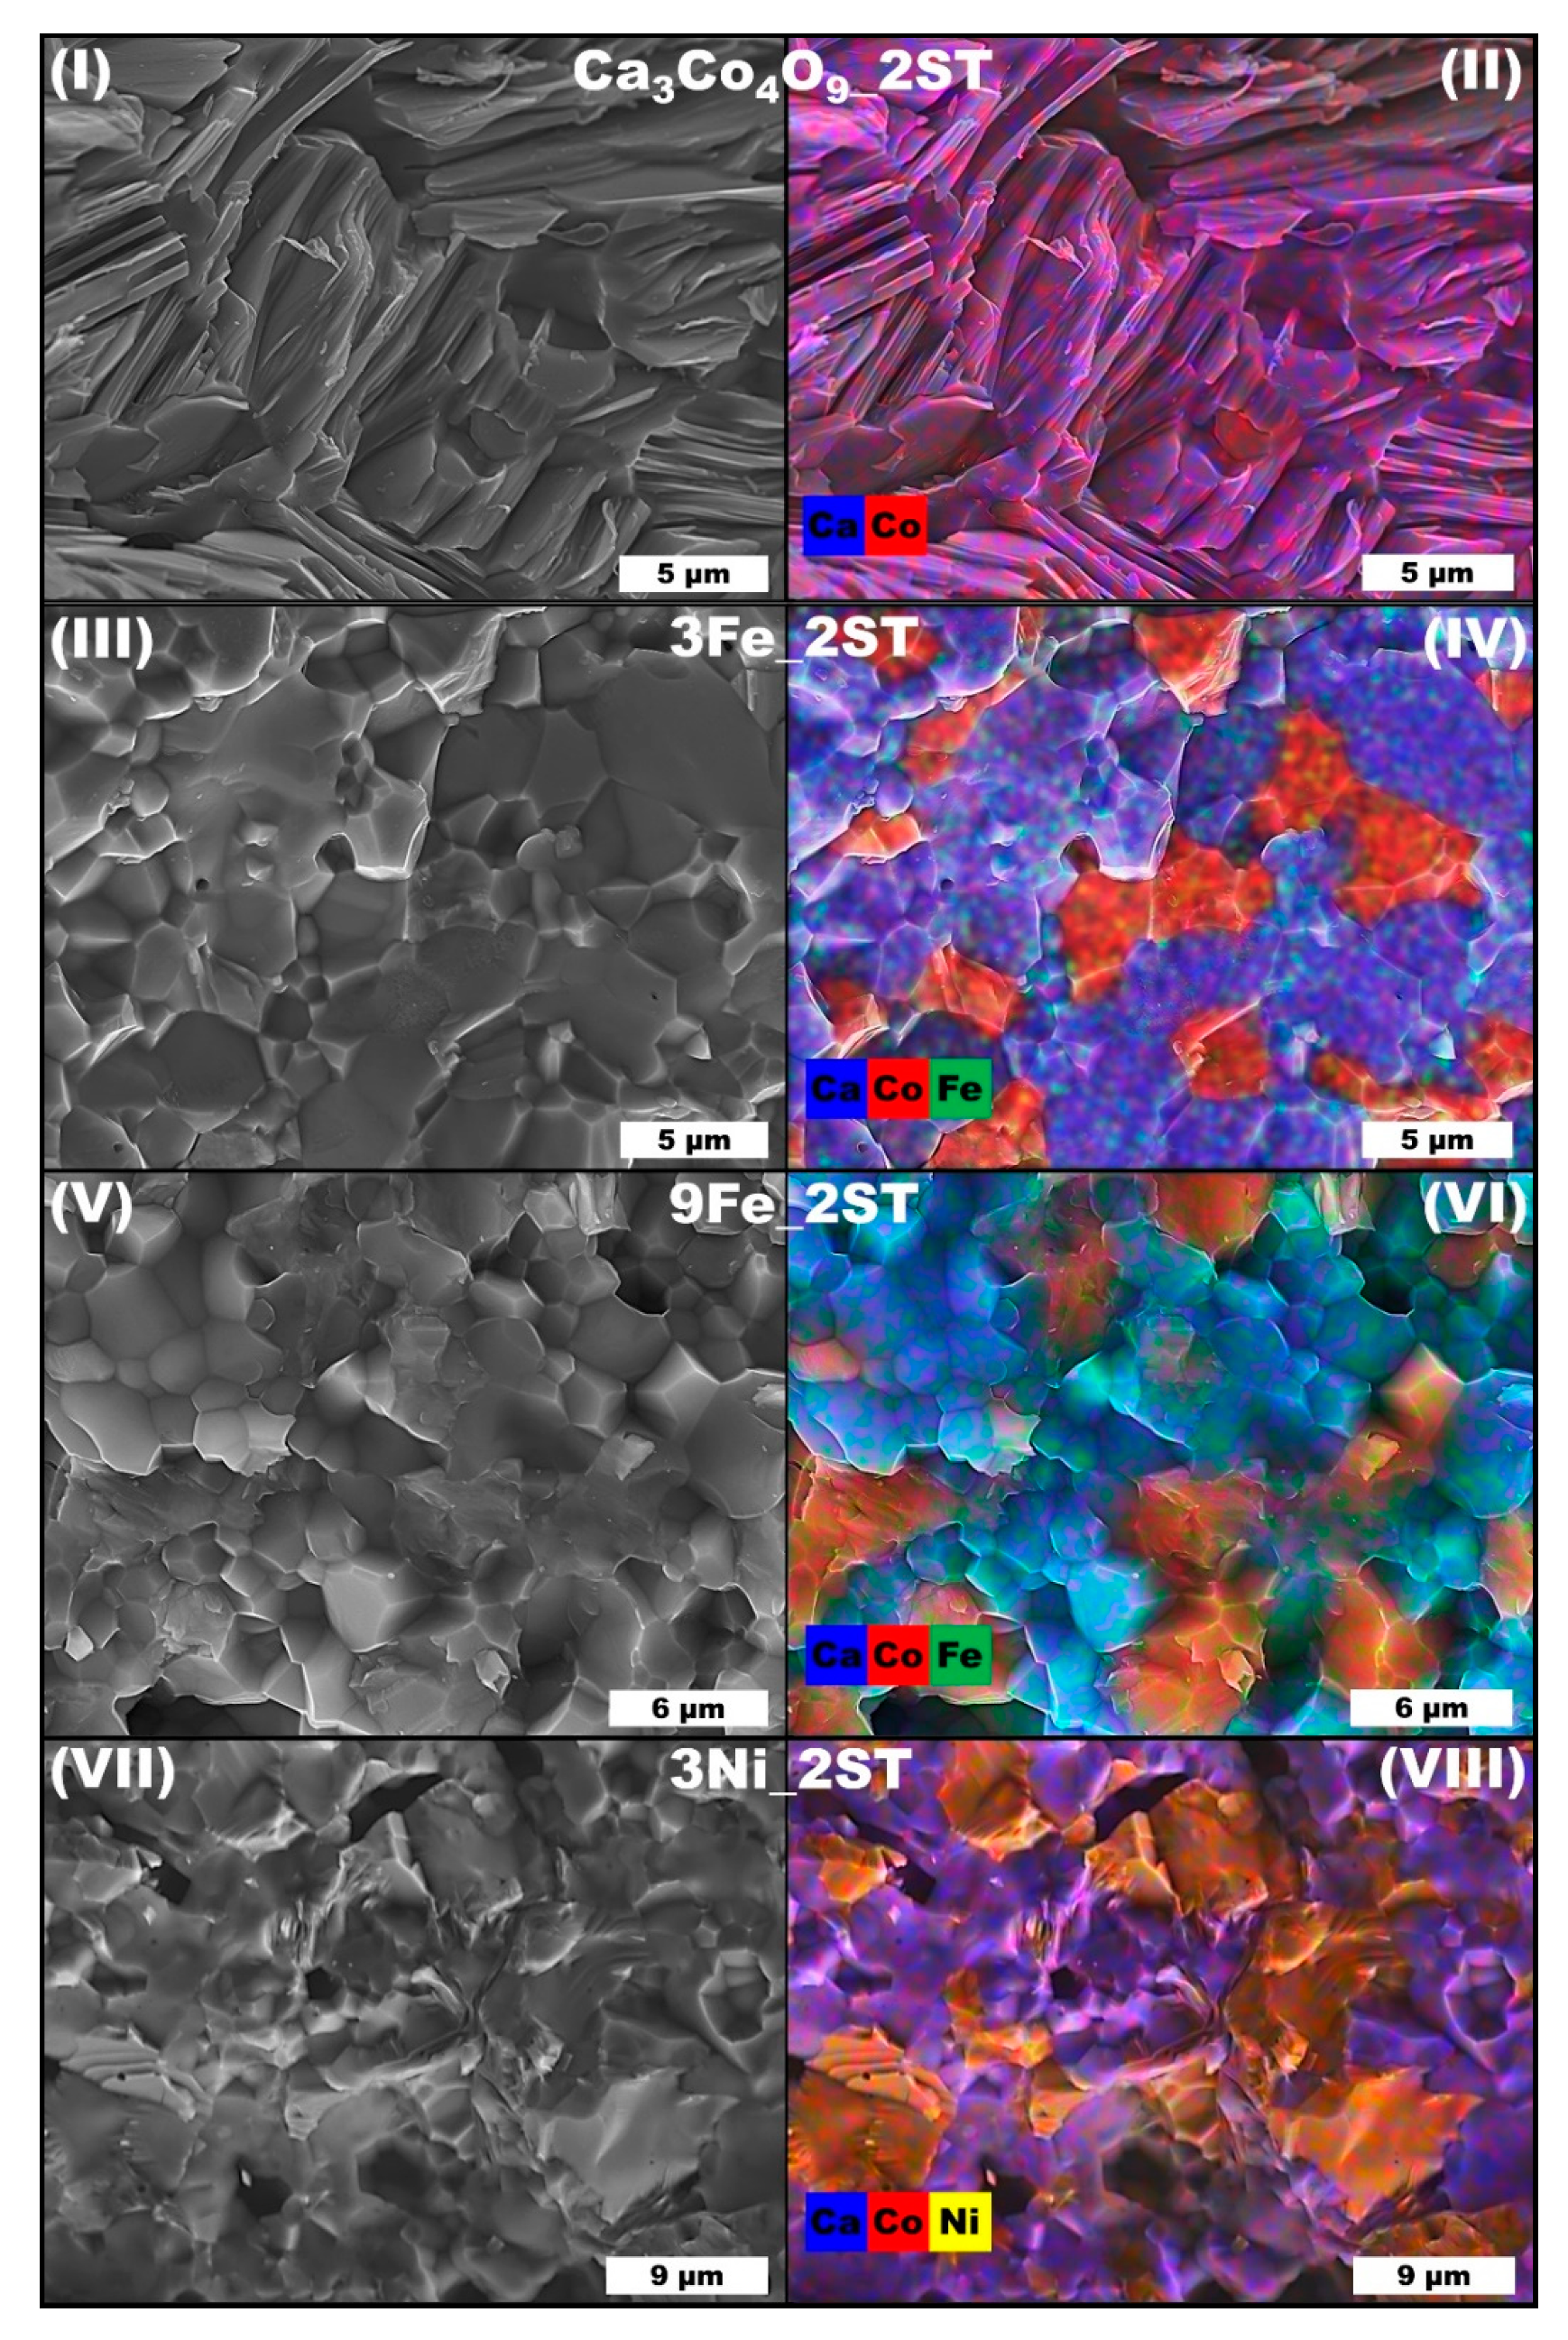
3.2.1. Compositional and Morpho-Structural Evolution
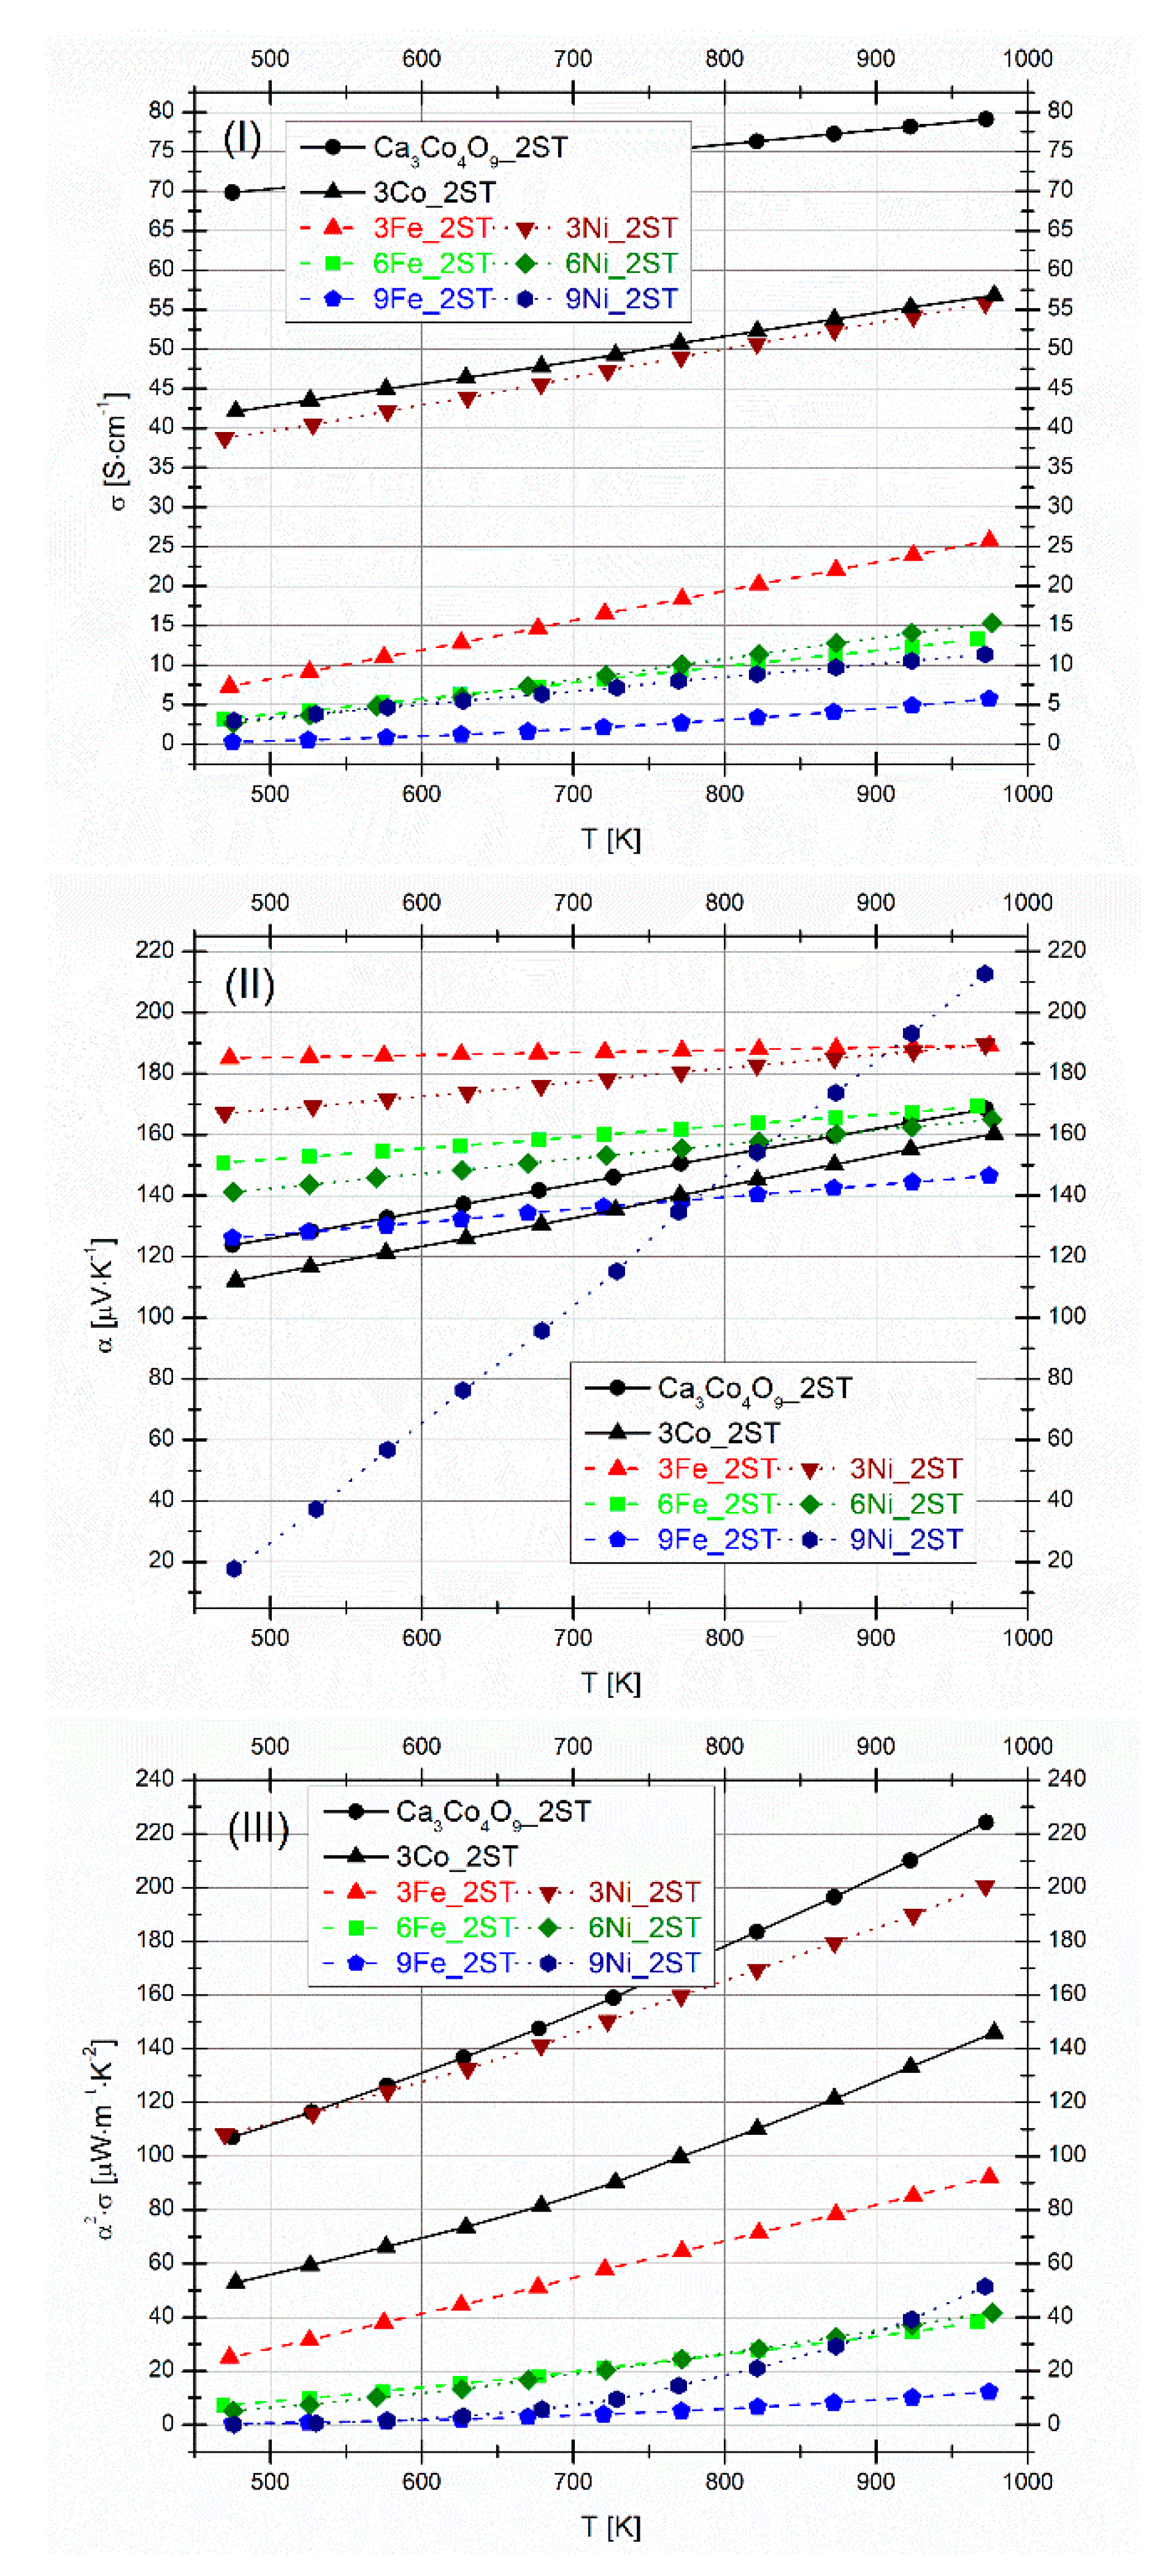
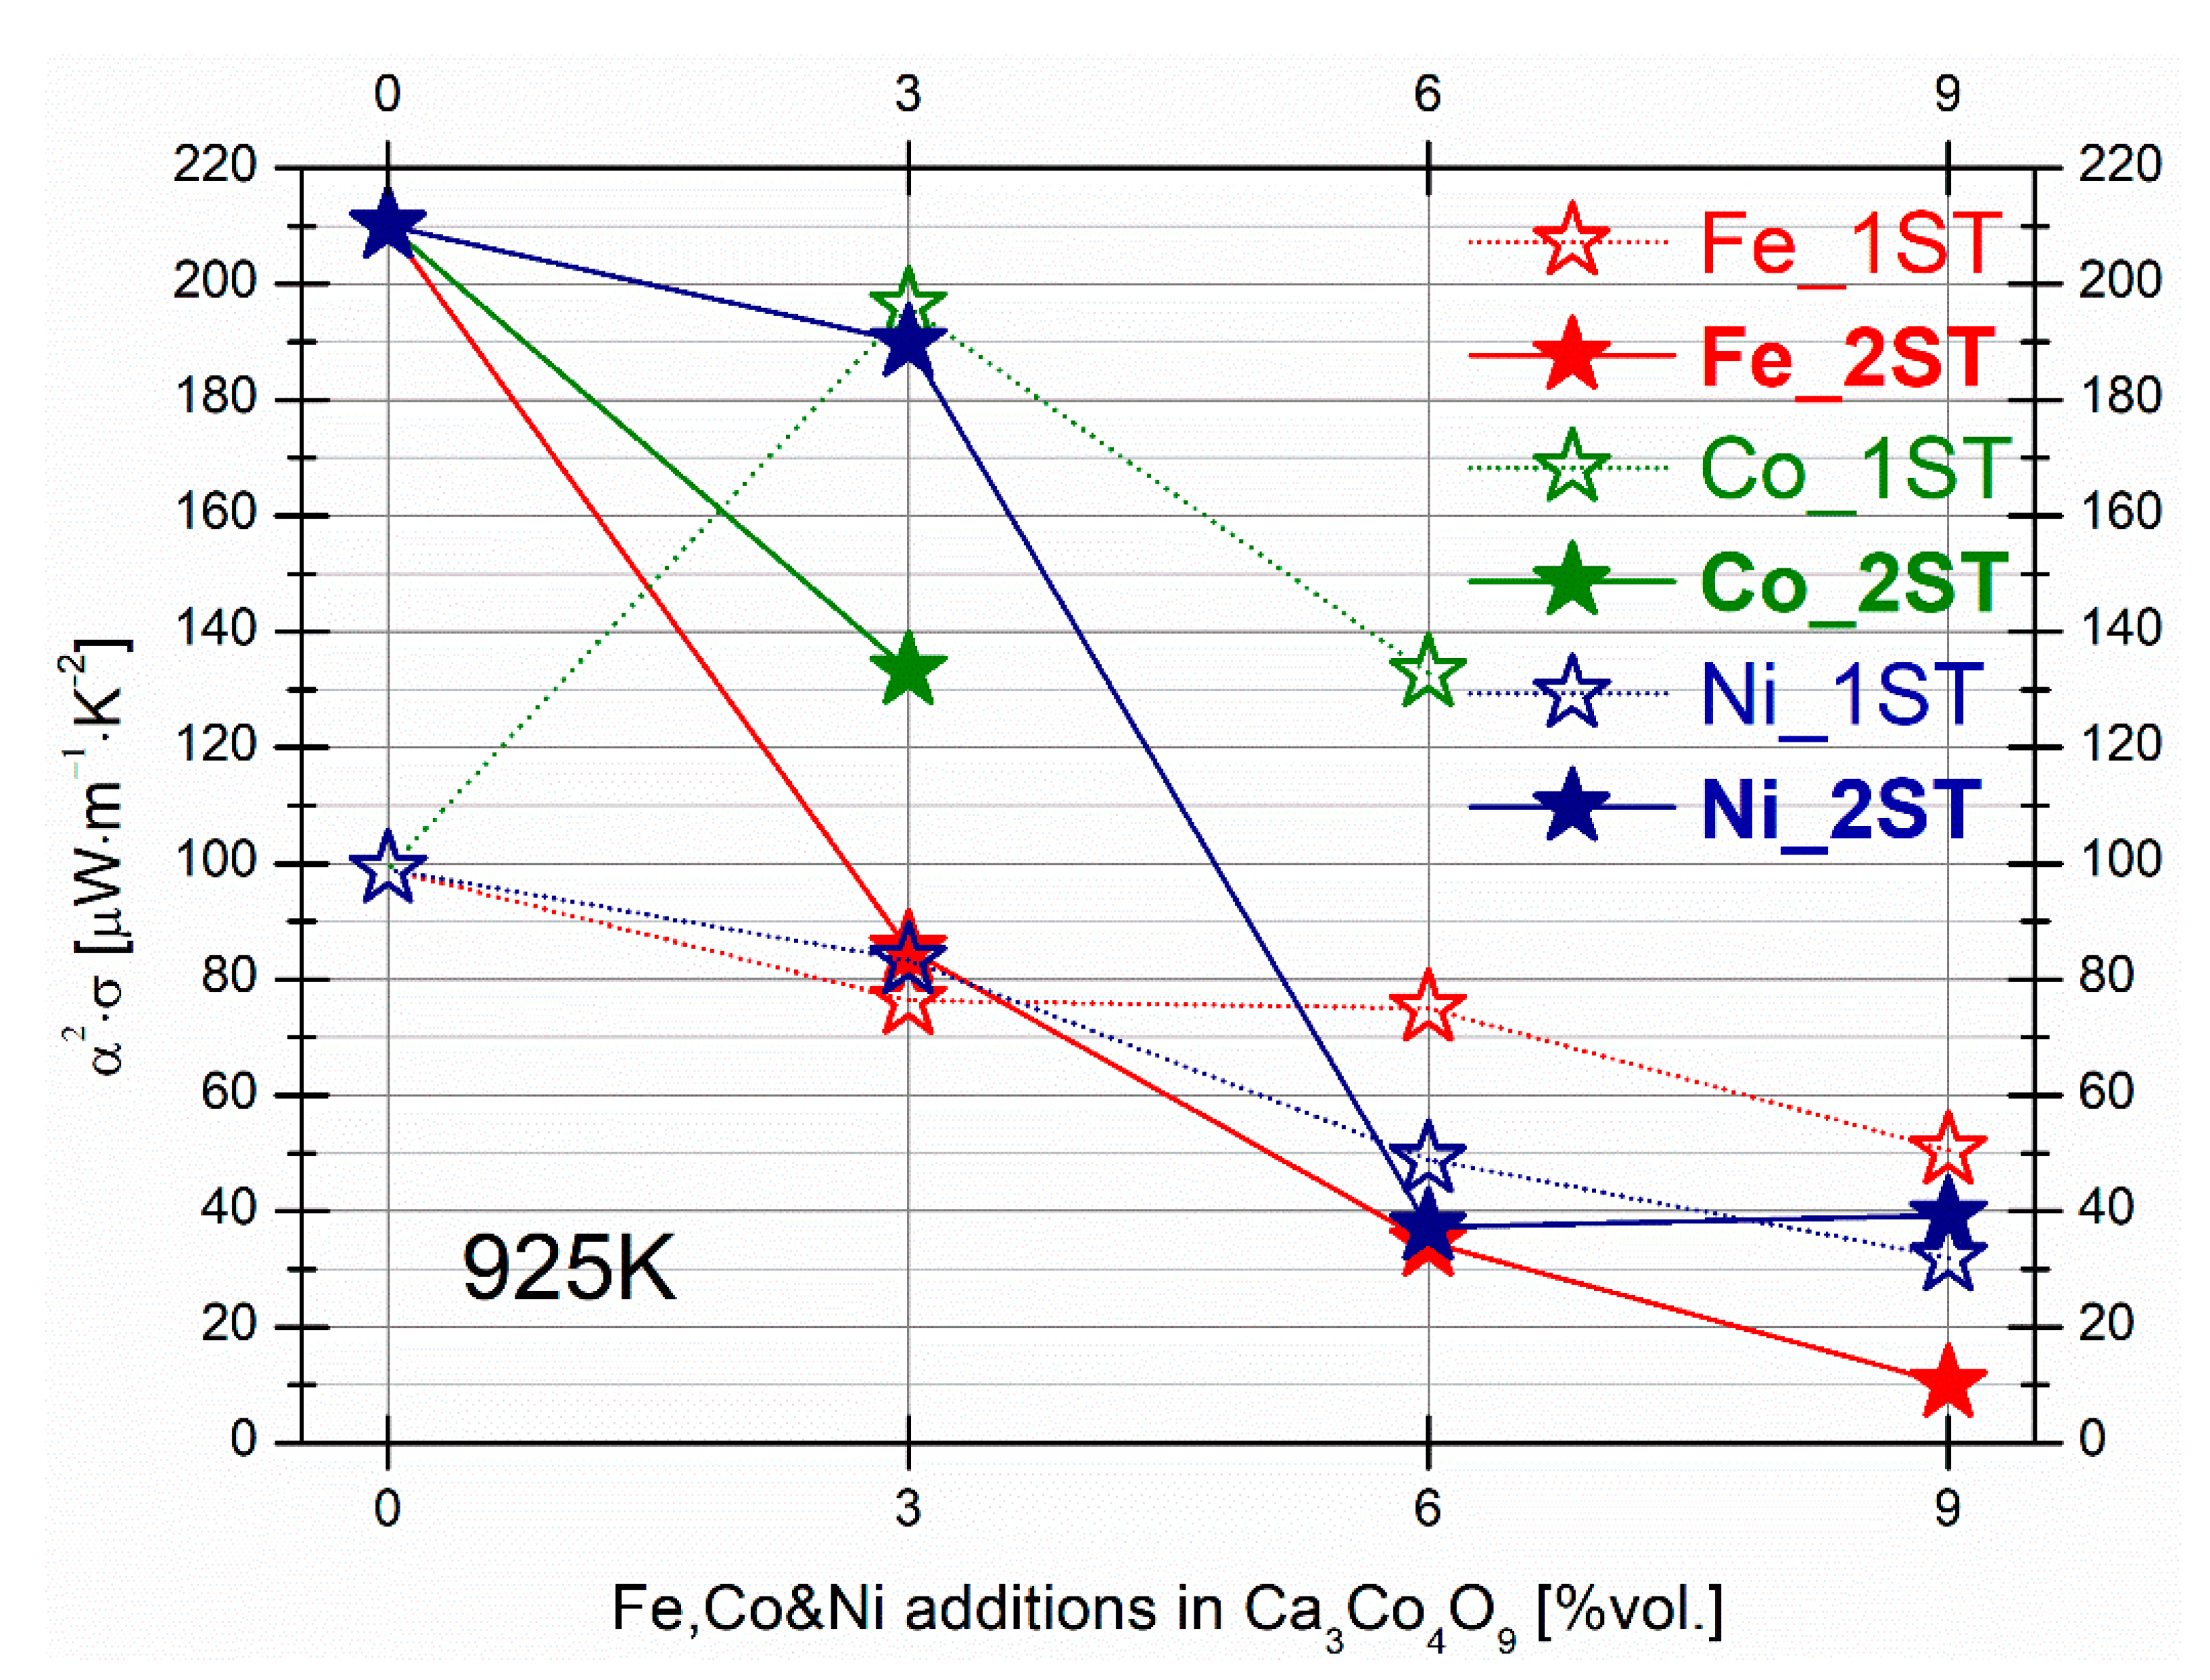
3.2.2. Electrical Performance
4. Conclusions
Author Contributions
Funding
 This project has received funding from the European Union’s Horizon 2020 research and innovation programme.
Institutional Review Board Statement
Informed Consent Statement
Data Availability Statement
Acknowledgments
Conflicts of Interest
References
- Freer, R.; Powell, A.V. Realising the potential of thermoelectric technology: A Roadmap. J. Mater. Chem. C 2020, 8, 441–463. [Google Scholar] [CrossRef]
- Bahrami, A.; Schierning, G.; Nielsch, K. Waste Recycling in Thermoelectric Materials. Adv. Energy Mater. 2020, 10. [Google Scholar] [CrossRef] [Green Version]
- Beretta, D.; Neophytou, N.; Hodges, J.M.; Kanatzidis, M.G.; Narducci, D.; Gonzalez, M.M.; Beekman, M.; Balke, B.; Cerretti, G.; Tremel, W.; et al. Thermoelectrics: From history, a window to the future. Mater. Sci. Eng. R Rep. 2019, 138. [Google Scholar] [CrossRef]
- Patil, D.S.; Arakerimath, R.R.; Walke, P.V. Thermoelectric materials and heat exchangers for power generation—A review. Renew. Sustain. Energy Rev. 2018, 95, 1–22. [Google Scholar] [CrossRef]
- Champier, D. Thermoelectric generators: A review of applications. Energy Convers. Manag. 2017, 140, 167–181. [Google Scholar] [CrossRef]
- Peng, W.; Su, D. Internet-based remote monitoring system of thermo-electric-generations with mobile communication technology. Int. J. Mater. Prod. Technol. 2016, 53, 154–170. [Google Scholar] [CrossRef]
- Vining, C.B. An inconvenient truth about thermoelectrics. Nat. Mater. 2009, 8, 83–85. [Google Scholar] [CrossRef]
- Urban, J.J.; Menon, A.K.; Tian, Z.; Jain, A.; Hippalgaonkar, K. New horizons in thermoelectric materials: Correlated electrons, organic transport, machine learning, and more. J. Appl. Phys. 2019, 125, 180902. [Google Scholar] [CrossRef]
- Karana, D.R.; Sahoo, R.R. Influence of geometric parameter on the performance of a new asymmetrical and segmented thermoelectric generator. Energy 2019, 179, 90–99. [Google Scholar] [CrossRef]
- Liu, W.; Lukas, K.C.; McEnaney, K.; Lee, S.; Zhang, Q.; Opeil, C.P.; Chen, G.; Ren, Z. Studies on the Bi2Te3-Bi2Se 3-Bi2S3 system for mid-temperature thermoelectric energy conversion. Energy Environ. Sci. 2013, 6, 552–560. [Google Scholar] [CrossRef]
- Artini, C.; Carlini, R.; Spotorno, R.; Failamani, F.; Mori, T.; Mele, P. Structural properties and thermoelectric performance of the double-filled skutterudite (Sm,Gd)y(FexNi1-x)4Sb12. Materials 2019, 12, 2451. [Google Scholar] [CrossRef] [PubMed] [Green Version]
- Qiu, Q.; Liu, Y.; Xia, K.; Fang, T.; Yu, J.; Zhao, X.; Zhu, T. Grain Boundary Scattering of Charge Transport in n-Type (Hf,Zr)CoSb Half-Heusler Thermoelectric Materials. Adv. Energy Mater. 2019, 9. [Google Scholar] [CrossRef]
- Guechi, N.; Bouhemadou, A.; Benaisti, I.; Omran, B.S.; Khenata, R.; Douri, A.Y. Temperature and doping effects on the transport properties of SrIn2P2 Zintl compound. J. Alloy. Compd. 2020, 815, 2384. [Google Scholar] [CrossRef]
- Wolf, M.; Hinterding, R.; Feldhoff, A. High power factor vs. high zT-A review of thermoelectric materials for high-temperature application. Entropy 2019, 21, 1058. [Google Scholar] [CrossRef] [Green Version]
- LeBlanc, S. Thermoelectric generators: Linking material properties and systems engineering for waste heat recovery applications. Sustain. Mater. Technol. 2014, 1, 26–35. [Google Scholar] [CrossRef] [Green Version]
- Ricoult, B.M.; Rustad, J.; Moore, L.; Smith, C.; Brown, J. Semiconducting Large Bandgap Oxides as Potential Thermoelectric Materials for High-Temperature Power Generation? Verlag: Berlin/Heidelberg, Germany, 2014; Volume 116, pp. 433–470. [Google Scholar]
- Terasaki, I.; Sasago, Y.; Uchinokura, K. Large thermoelectric power in single crystals. Phys. Rev. B Condens. Matter Mater. Phys. 1997, 56, R12685–R12687. [Google Scholar] [CrossRef]
- Ji, L. Metal oxide-based thermoelectric materials. In Metal Oxides in Energy Technologies; Elsevier: Amsterdam, The Netherlands, 2018; pp. 49–72. ISBN 978-0-12-811167-3. [Google Scholar]
- Fergus, J.W. Oxide materials for high temperature thermoelectric energy conversion. J. Eur. Ceram. Soc. 2012, 32, 525–540. [Google Scholar] [CrossRef]
- Kanas, N.; Bittner, M.; Desissa, T.D.; Singh, S.P.; Norby, T.; Feldhoff, A.; Grande, T.; Wiik, K.; Einarsrud, M.A. All-Oxide Thermoelectric Module with in situ Formed Non-Rectifying Complex p-p-n Junction and Transverse Thermoelectric Effect. ACS Omega 2018, 3, 9899–9906. [Google Scholar] [CrossRef]
- Funahashi, S.; Guo, H.; Guo, J.; Baker, A.L.; Wang, K.; Shiratsuyu, K.; Randall, C.A. Cold sintering and co-firing of a multilayer device with thermoelectric materials. J. Am. Ceram. Soc. 2017, 100, 3488–3496. [Google Scholar] [CrossRef]
- Azough, F.; Gholinia, A.; Ruiz, A.D.T.; Duran, E.; Kepaptsoglou, D.M.; Eggeman, A.S.; Ramasse, Q.M.; Freer, R. Self-Nanostructuring in SrTiO3: A Novel Strategy for Enhancement of Thermoelectric Response in Oxides. ACS Appl. Mater. Interfaces 2019, 11, 32833–32843. [Google Scholar] [CrossRef] [PubMed] [Green Version]
- Singh, S.P.; Kanas, N.; Desissa, T.D.; Einarsrud, M.A.; Norby, T.; Wiik, K. Thermoelectric properties of non-stoichiometric CaMnO3-δ composites formed by redox-activated exsolution. J. Eur. Ceram. Soc. 2020, 40, 1344–1351. [Google Scholar] [CrossRef]
- Nasani, N.; Rocha, O.C.M.; Kovalevsky, A.V.; Irurueta, O.G.; Populoh, S.; Thiel, P.; Weidenkaff, A.; Neto Da Silva, F.; Fagg, D.P. Exploring the Thermoelectric Performance of BaGd2NiO5 Haldane Gap Materials. Inorg. Chem. 2017, 56, 2354–2362. [Google Scholar] [CrossRef] [PubMed]
- Tato, M.; Shimonishi, R.; Hagiwara, M.; Fujihara, S. Reactive Templated Grain Growth and Thermoelectric Power Factor Enhancement of Textured CuFeO2 Ceramics; American Chemical Society: Washington, DC, USA, 2020; Volume 3, pp. 1979–1987. [Google Scholar]
- Sun, Q.; Li, G.; Tian, T.; Man, Z.; Zheng, L.; Barré, M.; Dittmer, J.; Goutenoire, F.; Kassiba, A.H. Controllable microstructure tailoring for regulating conductivity in Al-doped ZnO ceramics. J. Eur. Ceram. Soc. 2020, 40, 349–354. [Google Scholar] [CrossRef]
- Kieslich, G.; Cerretti, G.; Veremchuk, I.; Hermann, R.P.; Panthöfer, M.; Grin, J.; Tremel, W. A chemists view: Metal oxides with adaptive structures for thermoelectric applications. Phys. Status Solidi Appl. Mater. Sci. 2016, 213, 808–823. [Google Scholar] [CrossRef]
- Maignan, A.; Hébert, S.; Pi, L.; Pelloquin, D.; Martin, C.; Michel, C.; Hervieu, M.; Raveau, B. Perovskite manganites and layered cobaltites: Potential materials for thermoelectric applications. Cryst. Eng. 2002, 5, 365–382. [Google Scholar] [CrossRef]
- Masset, A.; Michel, C.; Maignan, A.; Hervieu, M.; Toulemonde, O.; Studer, F.; Raveau, B.; Hejtmanek, J. Misfit-layered cobaltite with an anisotropic giant magnetoresistance. Phys. Rev. B Condens. Matter Mater. Phys. 2000, 62, 166–175. [Google Scholar] [CrossRef]
- Miyazaki, Y.; Onoda, M.; Oku, T.; Kikuchi, M.; Ishii, Y.; Ono, Y.; Morii, Y.; Kajitani, T. Modulated Structure of the Thermoelectric Compound [Ca2CoO 3]0.62CoO2. J. Phys. Soc. Jpn. 2002, 71, 491–497. [Google Scholar] [CrossRef]
- Maignan, A.; Pelloquin, D.; Hebert, S.; Klein, Y.; Hervieu, M. Thermoelectric power in misfit cobaltites ceramics: Optimization by chemical substitutions. Bol. Soc. Esp. Ceram. V 2006, 45, 122–125. [Google Scholar] [CrossRef]
- Liang, L.; Romo-De-La-Cruz, C.-O.; Carvilo, P.; Jackson, B.; Gemmen, E.; Navia, P.S.A.; Prucz, J.; Chen, Y.; Song, X. Difference between transition metal cation substitution and Nonstoichiometric addition on nanostructure and thermoelectric performance of complex oxide ceramics. J. Solid State Chem. 2019, 277, 427–433. [Google Scholar] [CrossRef]
- Pinitsoontorn, S.; Lerssongkram, N.; Keawprak, N.; Amornkitbamrung, V. Thermoelectric properties of transition metals-doped Ca 3Co 3.8M 0.2O9δd (M 5 Co, Cr, Fe, Ni, Cu and Zn). J. Mater. Sci. Mater. Electron. 2012, 23, 1050–1056. [Google Scholar] [CrossRef]
- Song, M.E.; Lee, H.; Kang, M.G.; Li, W.; Maurya, D.; Poudel, B.; Wang, J.; Meeker, M.A.; Khodaparast, G.A.; Huxtable, S.T.; et al. Nanoscale Texturing and Interfaces in Compositionally Modified Ca3Co4O9 with Enhanced Thermoelectric Performance. ACS Omega 2018, 3, 10798–10810. [Google Scholar] [CrossRef] [PubMed]
- Torres, M.A.; Costa, F.M.; Flahaut, D.; Touati, K.; Rasekh, S.; Ferreira, N.M.; Allouche, J.; Depriester, M.; Madre, M.A.; Kovalevsky, A.V.; et al. Significant enhancement of the thermoelectric performance in Ca3Co4O9 thermoelectric materials through combined strontium substitution and hot-pressing process. J. Eur. Ceram. Soc. 2019, 39, 1186–1192. [Google Scholar] [CrossRef] [Green Version]
- Bergman, D.J.; Fel, L.G. Enhancement of thermoelectric power factor in composite thermoelectrics. J. Appl. Phys. 1999, 85, 8205–8216. [Google Scholar] [CrossRef]
- Wolf, M.; Menekse, K.; Mundstock, A.; Hinterding, R.; Nietschke, F.; Oeckler, O.; Feldhoff, A. Low Thermal Conductivity in Thermoelectric Oxide-Based Multiphase Composites. J. Electron. Mater. 2019, 48, 7551–7561. [Google Scholar] [CrossRef]
- Kenfaui, D.; Bonnefont, G.; Chateigner, D.; Fantozzi, G.; Gomina, M.; Noudem, J.G. Ca3Co4O9 ceramics consolidated by SPS process: Optimisation of mechanical and thermoelectric properties. Mater. Res. Bull. 2010, 45, 1240–1249. [Google Scholar] [CrossRef]
- Madre, M.A.; Costa, F.M.; Ferreira, N.M.; Sotelo, A.; Torres, M.A.; Constantinescu, G.; Rasekh, S.; Diez, J.C. Preparation of high-performance Ca3Co4O9 thermoelectric ceramics produced by a new two-step method. J. Eur. Ceram. Soc. 2013, 33, 1747–1754. [Google Scholar] [CrossRef] [Green Version]
- Sotelo, A.; Constantinescu, G.; Rasekh, S.; Torres, M.A.; Diez, J.C.; Madre, M.A. Improvement of thermoelectric properties of Ca 3Co 4O 9 using soft chemistry synthetic methods. J. Eur. Ceram. Soc. 2012, 32, 2415–2422. [Google Scholar] [CrossRef] [Green Version]
- Królicka, A.K.; Piersa, M.; Mirowska, A.; Michalska, M. Effect of sol-gel and solid-state synthesis techniques on structural, morphological and thermoelectric performance of Ca3Co4O9. Ceram. Int. 2018, 44, 13736–13743. [Google Scholar] [CrossRef]
- Schulz, T.; Töpfer, J. Thermoelectric properties of Ca3Co4O9 ceramics prepared by an alternative pressure-less sintering/annealing method. J. Alloy. Compd. 2016, 659, 122–126. [Google Scholar] [CrossRef]
- Kang, M.G.; Cho, K.H.; Kim, J.S.; Nahm, S.; Yoon, S.J.; Kang, C.Y. Post-Calcination, a Novel Method to Synthesize Cobalt Oxide-Based Thermoelectric Materials; Elsevier Ltd.: Amsterdam, The Netherlands, 2014; Volume 73, pp. 251–258. [Google Scholar]
- Woermann, E.; Muan, A. Phase equilibria in the system CaO-cobalt oxide in air. J. Inorg. Nucl. Chem. 1970, 32, 1455–1459. [Google Scholar] [CrossRef]
- Sedmidubský, D.; Jakeš, V.; Jankovský, O.; Leitner, J.; Sofer, Z.; Hejtmánek, J. Phase equilibria in Ca-Co-O system. J. Solid State Chem. 2012, 194, 199–205. [Google Scholar] [CrossRef]
- Klyndyuk, A.I.; Matsukevich, I.V. Synthesis, structure, and properties of Ca3Co3.85M0.15O9 + δ (M = Ti-Zn, Mo, W, Pb, Bi) layered thermoelectrics. Inorg. Mater. 2015, 51, 944–950. [Google Scholar] [CrossRef]
- Yao, Q.; Wang, D.L.; Chen, L.D.; Shi, X.; Zhou, M. Effects of partial substitution of transition metals for cobalt on the high-temperature thermoelectric properties of Ca 3Co 4O 9+δ. J. Appl. Phys. 2005, 97, 103905. [Google Scholar] [CrossRef]
- Xu, W.; Butt, S.; Zhu, Y.; Zhou, J.; Liu, Y.; Yu, M.; Marcelli, A.; Lan, J.; Lin, Y.H.; Nan, C.W. Nanoscale heterogeneity in thermoelectrics: The occurrence of phase separation in Fe-doped Ca3Co4O9. Phys. Chem. Chem. Phys. 2016, 18, 14580–14587. [Google Scholar] [CrossRef] [PubMed] [Green Version]
- Constantinescu, G.; Sarabando, A.R.; Rasekh, S.; Lopes, D.; Sergiienko, S.; Amirkhizi, P.; Frade, J.R.; Kovalevsky, A.V. Redox-Promoted Tailoring of the High-Temperature Electrical Performance in Ca3Co4O9 Thermoelectric Materials by Metallic Cobalt Addition; MDPI AG: Basel, Switzerland, 2020; Volume 13, p. 1060. [Google Scholar]
- Büttner, G.; Populoh, S.; Xie, W.; Trottmann, M.; Hertrampf, J.; Döbeli, M.; Karvonen, L.; Yoon, S.; Thiel, P.; Niewa, R.; et al. Thermoelectric properties of [Ca2CoO3-δ][CoO2]1,62 as a function of Co/Ca defects and Co3O4 inclusions. J. Appl. Phys. 2017, 121, 5101. [Google Scholar] [CrossRef] [Green Version]
- Bezdicka, P. Academy of Sciences of the Czech Republic, Inst. of Inorganic Chemistry, Rez u Prahy, Czech Republic. ICDD Grant-in-Aid 1999. Mater. Struct. 2001, 8, 3. [Google Scholar]
- Hubbard, C.R.; Snyder, R.L. RIR—Measurement and Use in Quantitative XRD. Powder Diffr. 1988, 3, 74–77. [Google Scholar] [CrossRef] [Green Version]
- Kovalevsky, A.V.; Yaremchenko, A.A.; Populoh, S.; Weidenkaff, A.; Frade, J.R. Enhancement of thermoelectric performance in strontium titanate by praseodymium substitution. J. Appl. Phys. 2013, 113, 53704. [Google Scholar] [CrossRef] [Green Version]
- Delorme, F.; Chao, D.P.; Giovannelli, F. Effect of Ca Substitution by Fe on the Thermoelectric Properties of Ca3Co4O9 Ceramics. Available online: https://0-link-springer-com.brum.beds.ac.uk/article/10.1007/s10832-018-0109-2 (accessed on 31 March 2020).
- Mansour, N.A.L. Equilibrium Relationships in the System Cu-U-O. Ber. Dtsch. Keram. Ges. eV 1979, 56, 261–265. [Google Scholar]
- Torres, M.A.; Sotelo, A.; Rasekh, S.; Serrano, I.; Constantinescu, G.; Madre, M.A.; Diez, J.C. Improvement of thermoelectric properties of Bi2Sr2Co1.8Ox through solution synthetic methods. Bol. Soc. Esp. Ceram. Vidr. 2012, 51, 1–6. [Google Scholar] [CrossRef] [Green Version]
- Kanas, N.; Singh, S.P.; Rotan, M.; Saleemi, M.; Bittner, M.; Feldhoff, A.; Norby, T.; Wiik, K.; Grande, T.; Einarsrud, M.A. Influence of processing on stability, microstructure and thermoelectric properties of Ca3Co4−xO9 + δ. J. Eur. Ceram. Soc. 2018, 38, 1592–1599. [Google Scholar] [CrossRef]
- Bittner, M.; Helmich, L.; Nietschke, F.; Geppert, B.; Oeckler, O.; Feldhoff, A. Porous Ca3Co4O9 with enhanced thermoelectric properties derived from Sol–Gel synthesis. J. Eur. Ceram. Soc. 2017, 37, 3909–3915. [Google Scholar] [CrossRef]
- Butt, S.; Liu, Y.C.; Lan, J.L.; Shehzad, K.; Zhan, B.; Lin, Y.; Nan, C.W. High-temperature thermoelectric properties of la and Fe co-doped Ca-Co-O misfit-layered cobaltites consolidated by spark plasma sintering. J. Alloys Compd. 2014, 588, 277–283. [Google Scholar] [CrossRef]
- Prasoetsopha, N.; Pinitsoontorn, S.; Bootchanont, A.; Kidkhunthod, P.; Srepusharawoot, P.; Kamwanna, T.; Amornkitbamrung, V.; Kurosaki, K.; Yamanaka, S. Local structure of Fe in Fe-doped misfit-layered calcium cobaltite: An X-ray absorption spectroscopy study. J. Solid State Chem. 2013, 204, 257–265. [Google Scholar] [CrossRef]
- Pinitsoontorn, S.; Prasoetsopha, N.; Srepusharawoot, P.; Bootchanont, A.; Kidkhunthod, P.; Kamwanna, T.; Amornkitbamrung, V.; Kurosaki, K.; Yamanaka, S. Local structure determination of substitutional elements in Ca 3Co4-xMxO9 (M = Fe, Cr, Ga) using X-ray absorption spectroscopy. Phys. Status Solidi Appl. Mater. Sci. 2014, 211, 1732–1739. [Google Scholar] [CrossRef]
- Snyder, G.J.; Toberer, E.S. Complex thermoelectric materials. Nat. Mater. 2008, 7, 105–114. [Google Scholar] [CrossRef]
- Wang, Y.; Sui, Y.; Wang, X.; Su, W.; Liu, X. Enhanced high temperature thermoelectric characteristics of transition metals doped Ca3 Co4 O9+δ by cold high-pressure fabrication. J. Appl. Phys. 2010, 107. [Google Scholar] [CrossRef]
- Liu, C.J.; Huang, L.C.; Wang, J.S. Improvement of the thermoelectric characteristics of Fe-doped misfit-layered Ca3 Co4-x Fex O9+δ (x = 0, 0.05, 0.1, and 0.2). Appl. Phys. Lett. 2006, 89, 204102. [Google Scholar] [CrossRef]
- Koshibae, W.; Tsutsui, K.; Maekawa, S. Thermopower in cobalt oxides. Phys. Rev. B Condens. Matter Mater. Phys. 2000, 62, 6869–6872. [Google Scholar] [CrossRef]
- Lin, Y.H.; Lan, J.; Shen, Z.; Liu, Y.; Nan, C.W.; Li, J.F. High-temperature electrical transport behaviors in textured Ca 3Co4O9-based polycrystalline ceramics. Appl. Phys. Lett. 2009, 94. [Google Scholar] [CrossRef]
- Zhang, J.; Zheng, H.; Malliakas, C.D.; Allred, J.M.; Ren, Y.; Li, Q.; Han, T.H.; Mitchell, J.F. Brownmillerite Ca2Co2O5: Synthesis, stability, and re-entrant single crystal to single crystal structural transitions. Chem. Mater. 2014, 26, 7172–7182. [Google Scholar] [CrossRef] [Green Version]
- Iwasaki, K.; Yamane, H.; Kubota, S.; Takahashi, J.; Shimada, M. Power factors of Ca3Co2O6 and Ca 3Co2O6-based solid solutions. J. Alloy. Compd. 2003, 358, 210–215. [Google Scholar] [CrossRef]
- Takahashi, J.; Yamane, H.; Shimada, M. Thermoelectric properties of Ca3Co2O6 single crystal. Jpn. J. Appl. Phys. Part 2 Lett. 2004, 43, L331–L333. [Google Scholar] [CrossRef]
- Cox, J.T.; Quinn, C.M. Conductivity measurements on cobalt and nickel oxides in highly-enriched oxygen atmospheres. J. Mater. Sci. 1969, 4, 33–38. [Google Scholar] [CrossRef]
- Li, S.; Funahashi, R.; Matsubara, I.; Ueno, K.; Sodeoka, S.; Yamada, H. Thermoelectric Properties of Oxides Ca2Co2O5 with Bi Substitution; Springer: Berlin/Heidelberg, Germany, 2000; Volume 19. [Google Scholar]


| Prepared Materials | Abbreviation | RIR-Estimated Phase Composition, wt.% | Experimental Density ρexp, g/cm3 | ρexp/ρth *, % | Ea **, meV |
|---|---|---|---|---|---|
| Ca3Co4O9 | Ca3Co4O9_1ST | Ca3Co4O9 (100) | 2.62 | 56 | 78 |
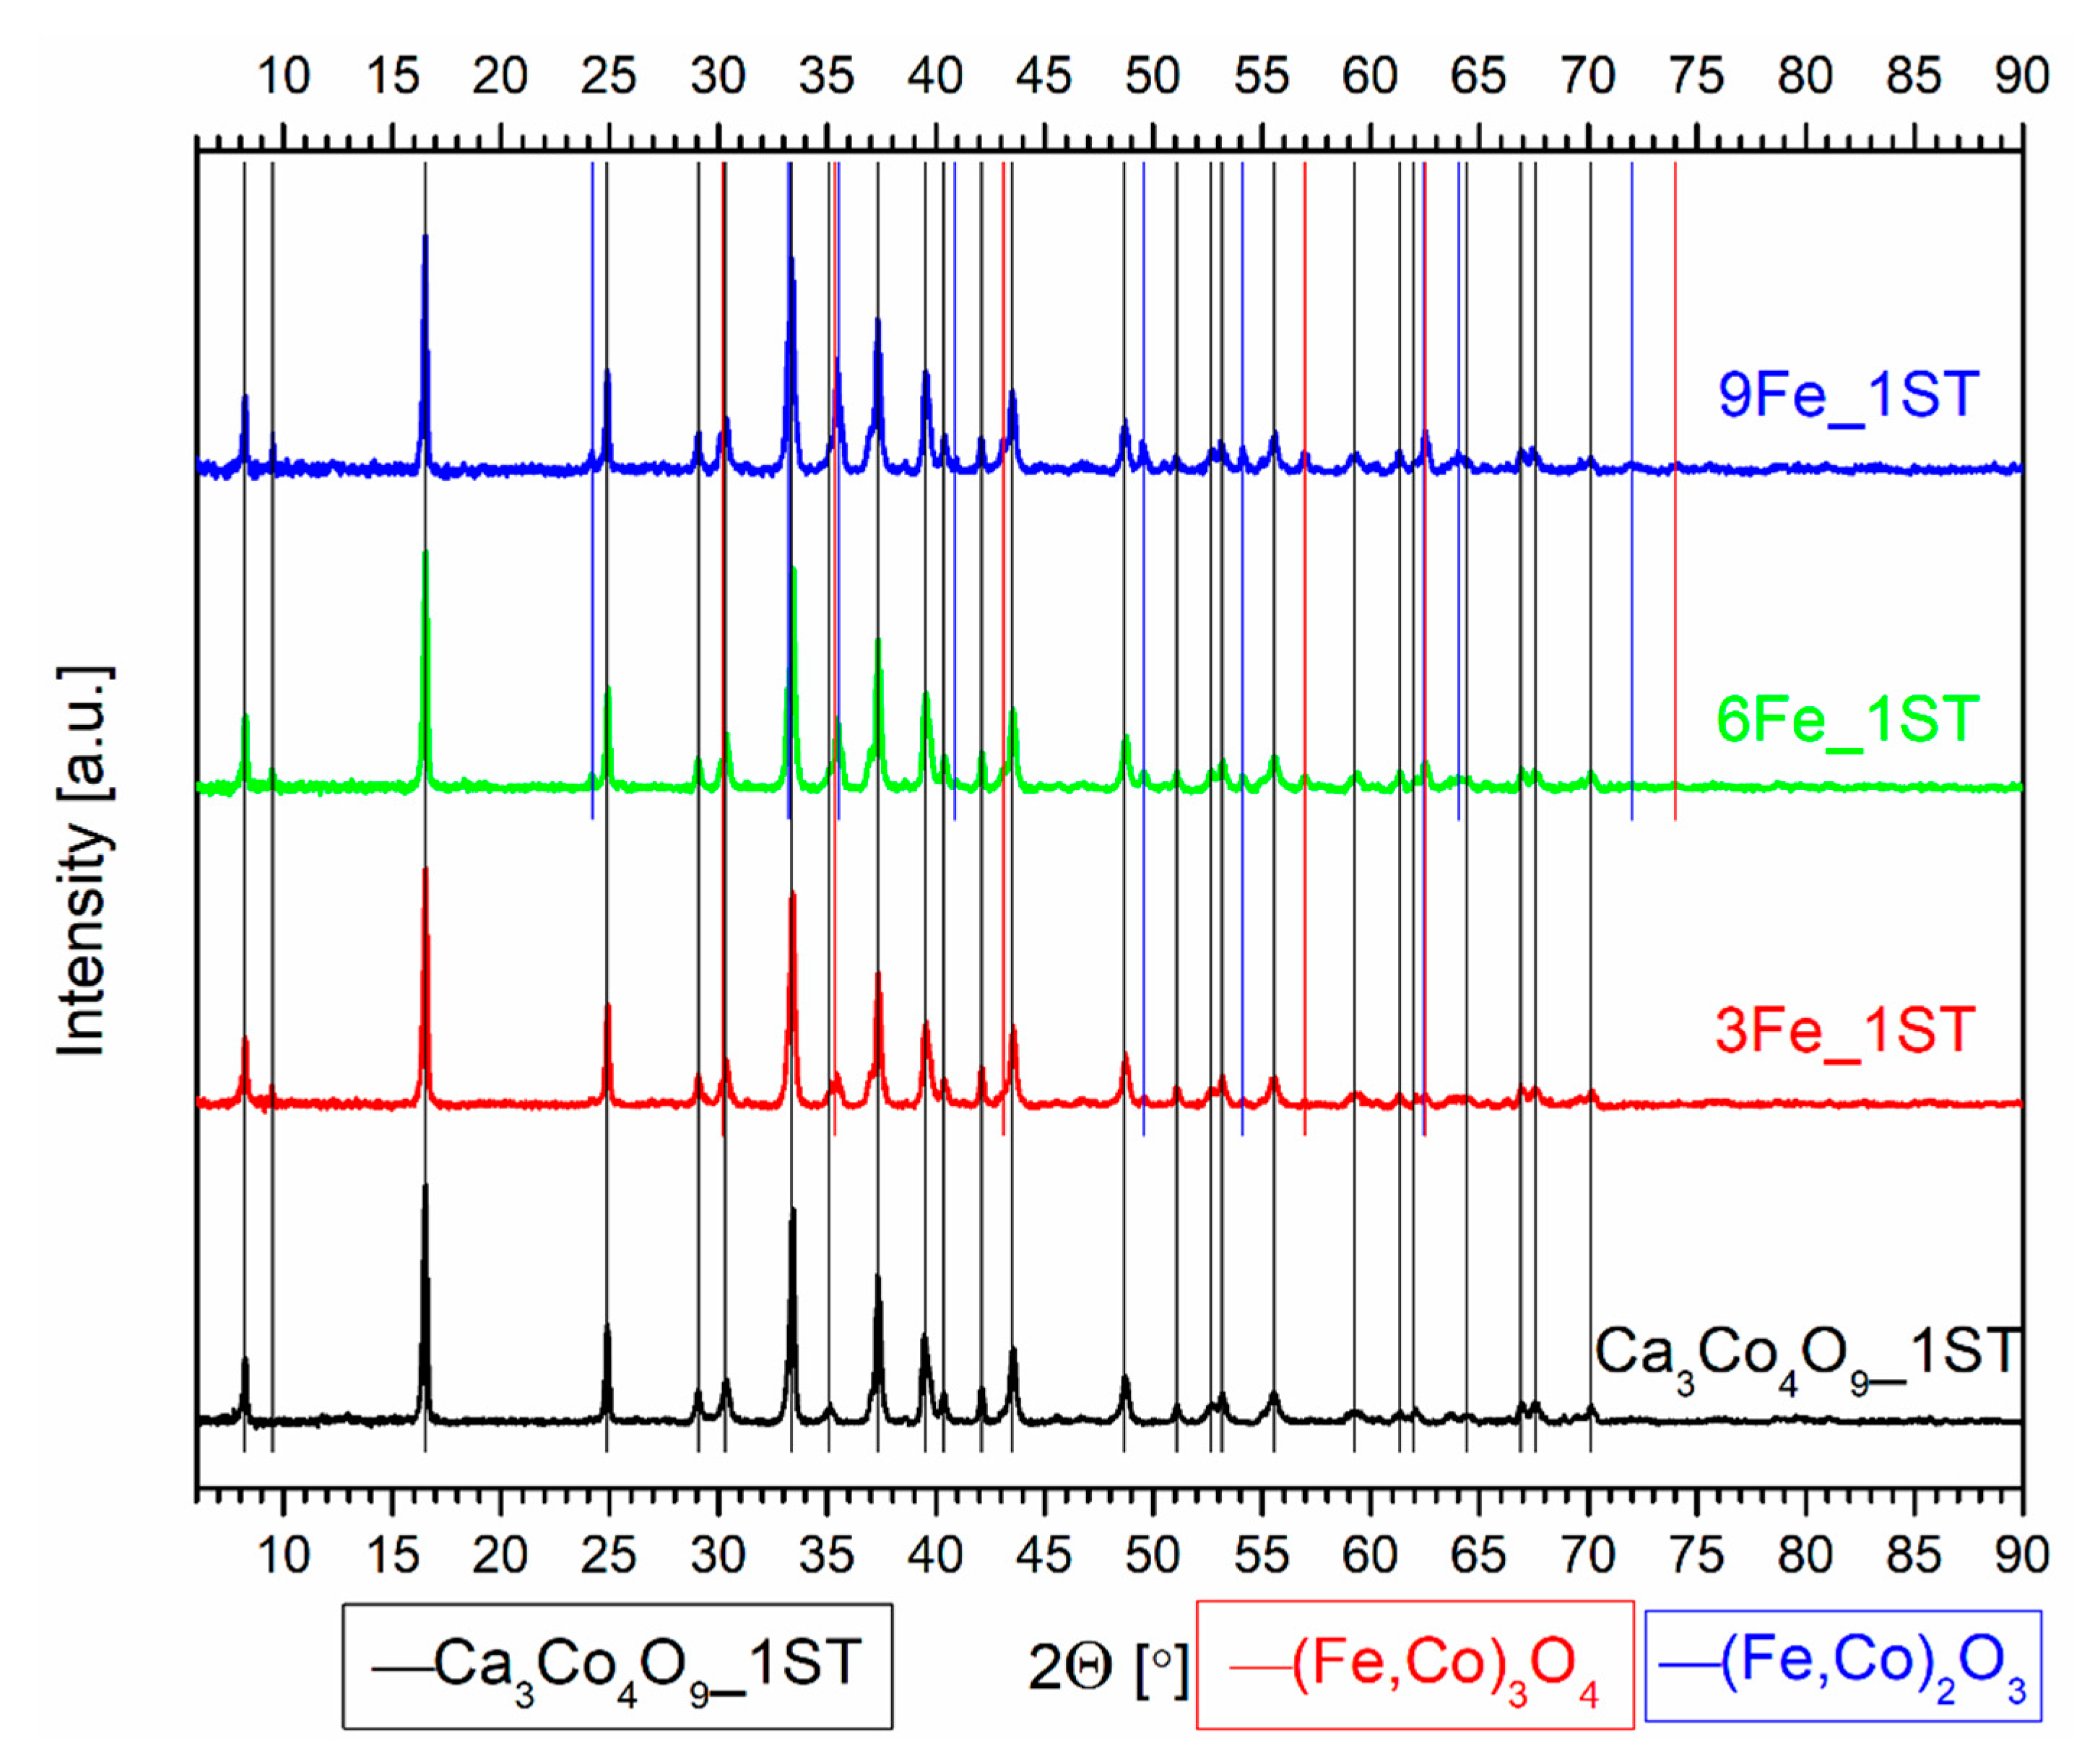
| Ca3Co4O9 + 3% vol. Fe | 3Fe_1ST | Ca3Co4O9 (95); (Fe,Co)3O4 (5) | 2.38 | – | 90 |
| Ca3Co4O9 + 6% vol. Fe | 6Fe_1ST | Ca3Co4O9 (83); (Fe,Co)3O4 (9); (Fe,Co)2O3 (8) | 1.68 | – | 83 |
| Ca3Co4O9 + 9% vol. Fe | 9Fe_1ST | Ca3Co4O9 (83); (Fe,Co)3O4 (7); (Fe,Co)2O3 (10) | 1.50 | – | 114 |
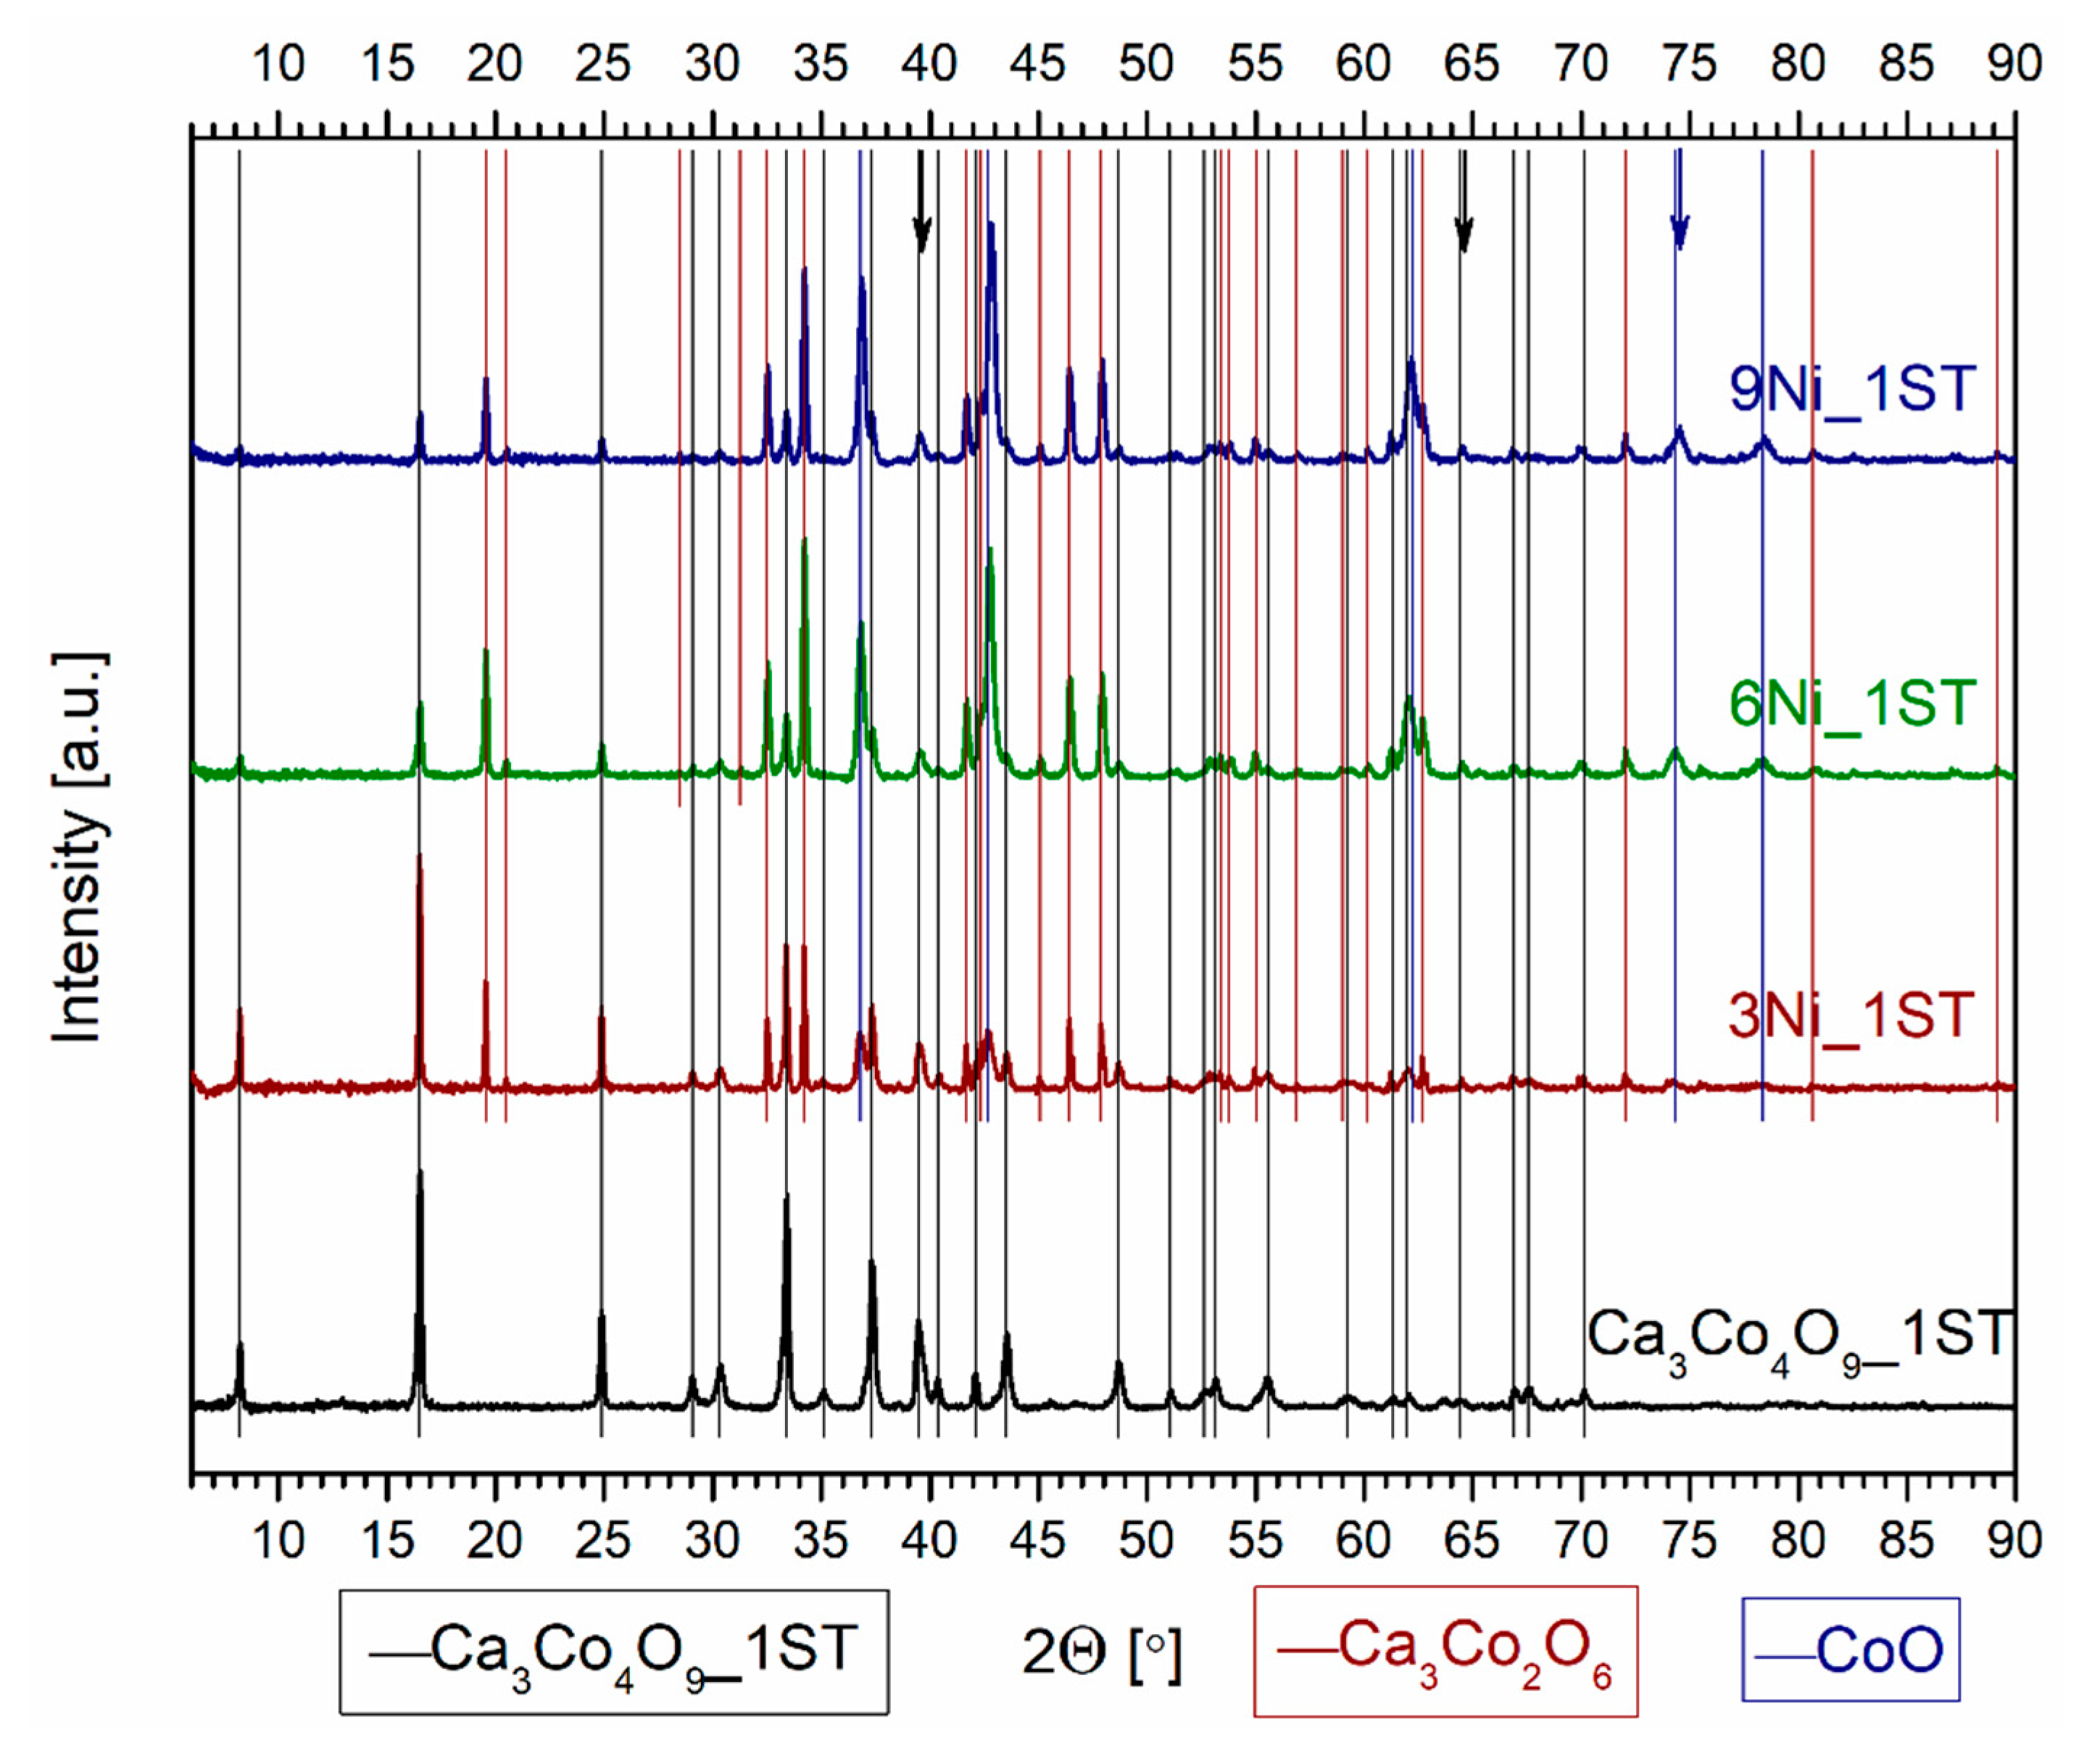
| Ca3Co4O9 + 3% vol. Ni | 3Ni_1ST | Ca3Co4O9 (67); Ca3Co2O6 (28); CoO (5); | 2.85 | 60 | 123 |
| Ca3Co4O9 + 6% vol. Ni | 6Ni_1ST | Ca3Co4O9 (39); Ca3Co2O6 (43); CoO (18) | 3.09 | 62 | 170 |
| Ca3Co4O9 + 9% vol. Ni | 9Ni_1ST | Ca3Co4O9 (35); Ca3Co2O6 (42); CoO (23) | 2.90 | 57 | 156 |
| Prepared Materials | Abbreviation | RIR-Estimated Phase Composition, wt.% | Experimental Density ρexp, g/cm3 |
|---|---|---|---|
| Ca3Co4O9 | Ca3Co4O9_2ST | Ca3Co4O9 (100) | 3.74 |
| Ca3Co4O9 + 3% vol. Fe | 3Fe_2ST | Ca3Co2O6 (74); Ca2(Fe,Co)2O5 (22); Fe2O3 (4) | 4.16 |
| Ca3Co4O9 + 6% vol. Fe | 6Fe_2ST | Ca3Co2O6 (62); Ca2(Fe,Co)2O5 (29); Fe2O3 (9) | 3.88 |
| Ca3Co4O9 + 9% vol. Fe | 9Fe_2ST | Ca3Co2O6 (32); Ca2(Fe,Co)2O5 (60); Fe2O3 (8) | 3.55 |
| Ca3Co4O9 + 3% vol. Ni | 3Ni_2ST | Ca3Co2O6 (73); Ca2Co2O5 (9); (Co,Ni)O (18) | 4.12 |
| Ca3Co4O9 + 6% vol. Ni | 6Ni_2ST | Ca3Co2O6 (48); (Co,Ni) O (52) | 4.63 |
| Ca3Co4O9 + 9% vol. Ni | 9Ni_2ST | Ca3Co2O6 (42); (Co,Ni)O (52); CaO (6) | 4.07 |
Publisher’s Note: MDPI stays neutral with regard to jurisdictional claims in published maps and institutional affiliations. |
© 2021 by the authors. Licensee MDPI, Basel, Switzerland. This article is an open access article distributed under the terms and conditions of the Creative Commons Attribution (CC BY) license (http://creativecommons.org/licenses/by/4.0/).
Share and Cite
Constantinescu, G.; Mikhalev, S.M.; Lisenkov, A.D.; Lopes, D.V.; Sarabando, A.R.; Ferro, M.C.; Silva, T.F.d.; Sergiienko, S.A.; Kovalevsky, A.V. Prospects for Electrical Performance Tuning in Ca3Co4O9 Materials by Metallic Fe and Ni Particles Additions. Materials 2021, 14, 980. https://0-doi-org.brum.beds.ac.uk/10.3390/ma14040980
Constantinescu G, Mikhalev SM, Lisenkov AD, Lopes DV, Sarabando AR, Ferro MC, Silva TFd, Sergiienko SA, Kovalevsky AV. Prospects for Electrical Performance Tuning in Ca3Co4O9 Materials by Metallic Fe and Ni Particles Additions. Materials. 2021; 14(4):980. https://0-doi-org.brum.beds.ac.uk/10.3390/ma14040980
Chicago/Turabian StyleConstantinescu, Gabriel, Sergey M. Mikhalev, Aleksey D. Lisenkov, Daniela V. Lopes, Artur R. Sarabando, Marta C. Ferro, Tiago F. da Silva, Sergii A. Sergiienko, and Andrei V. Kovalevsky. 2021. "Prospects for Electrical Performance Tuning in Ca3Co4O9 Materials by Metallic Fe and Ni Particles Additions" Materials 14, no. 4: 980. https://0-doi-org.brum.beds.ac.uk/10.3390/ma14040980