
The Effect of Size and Thermal Treatment on the Photoluminescent Properties of Europium-Doped SiO2 Nanoparticles Prepared in One Pot by Sol-Gel

 , and
, and
Abstract
:1. Introduction
2. Sample Preparation
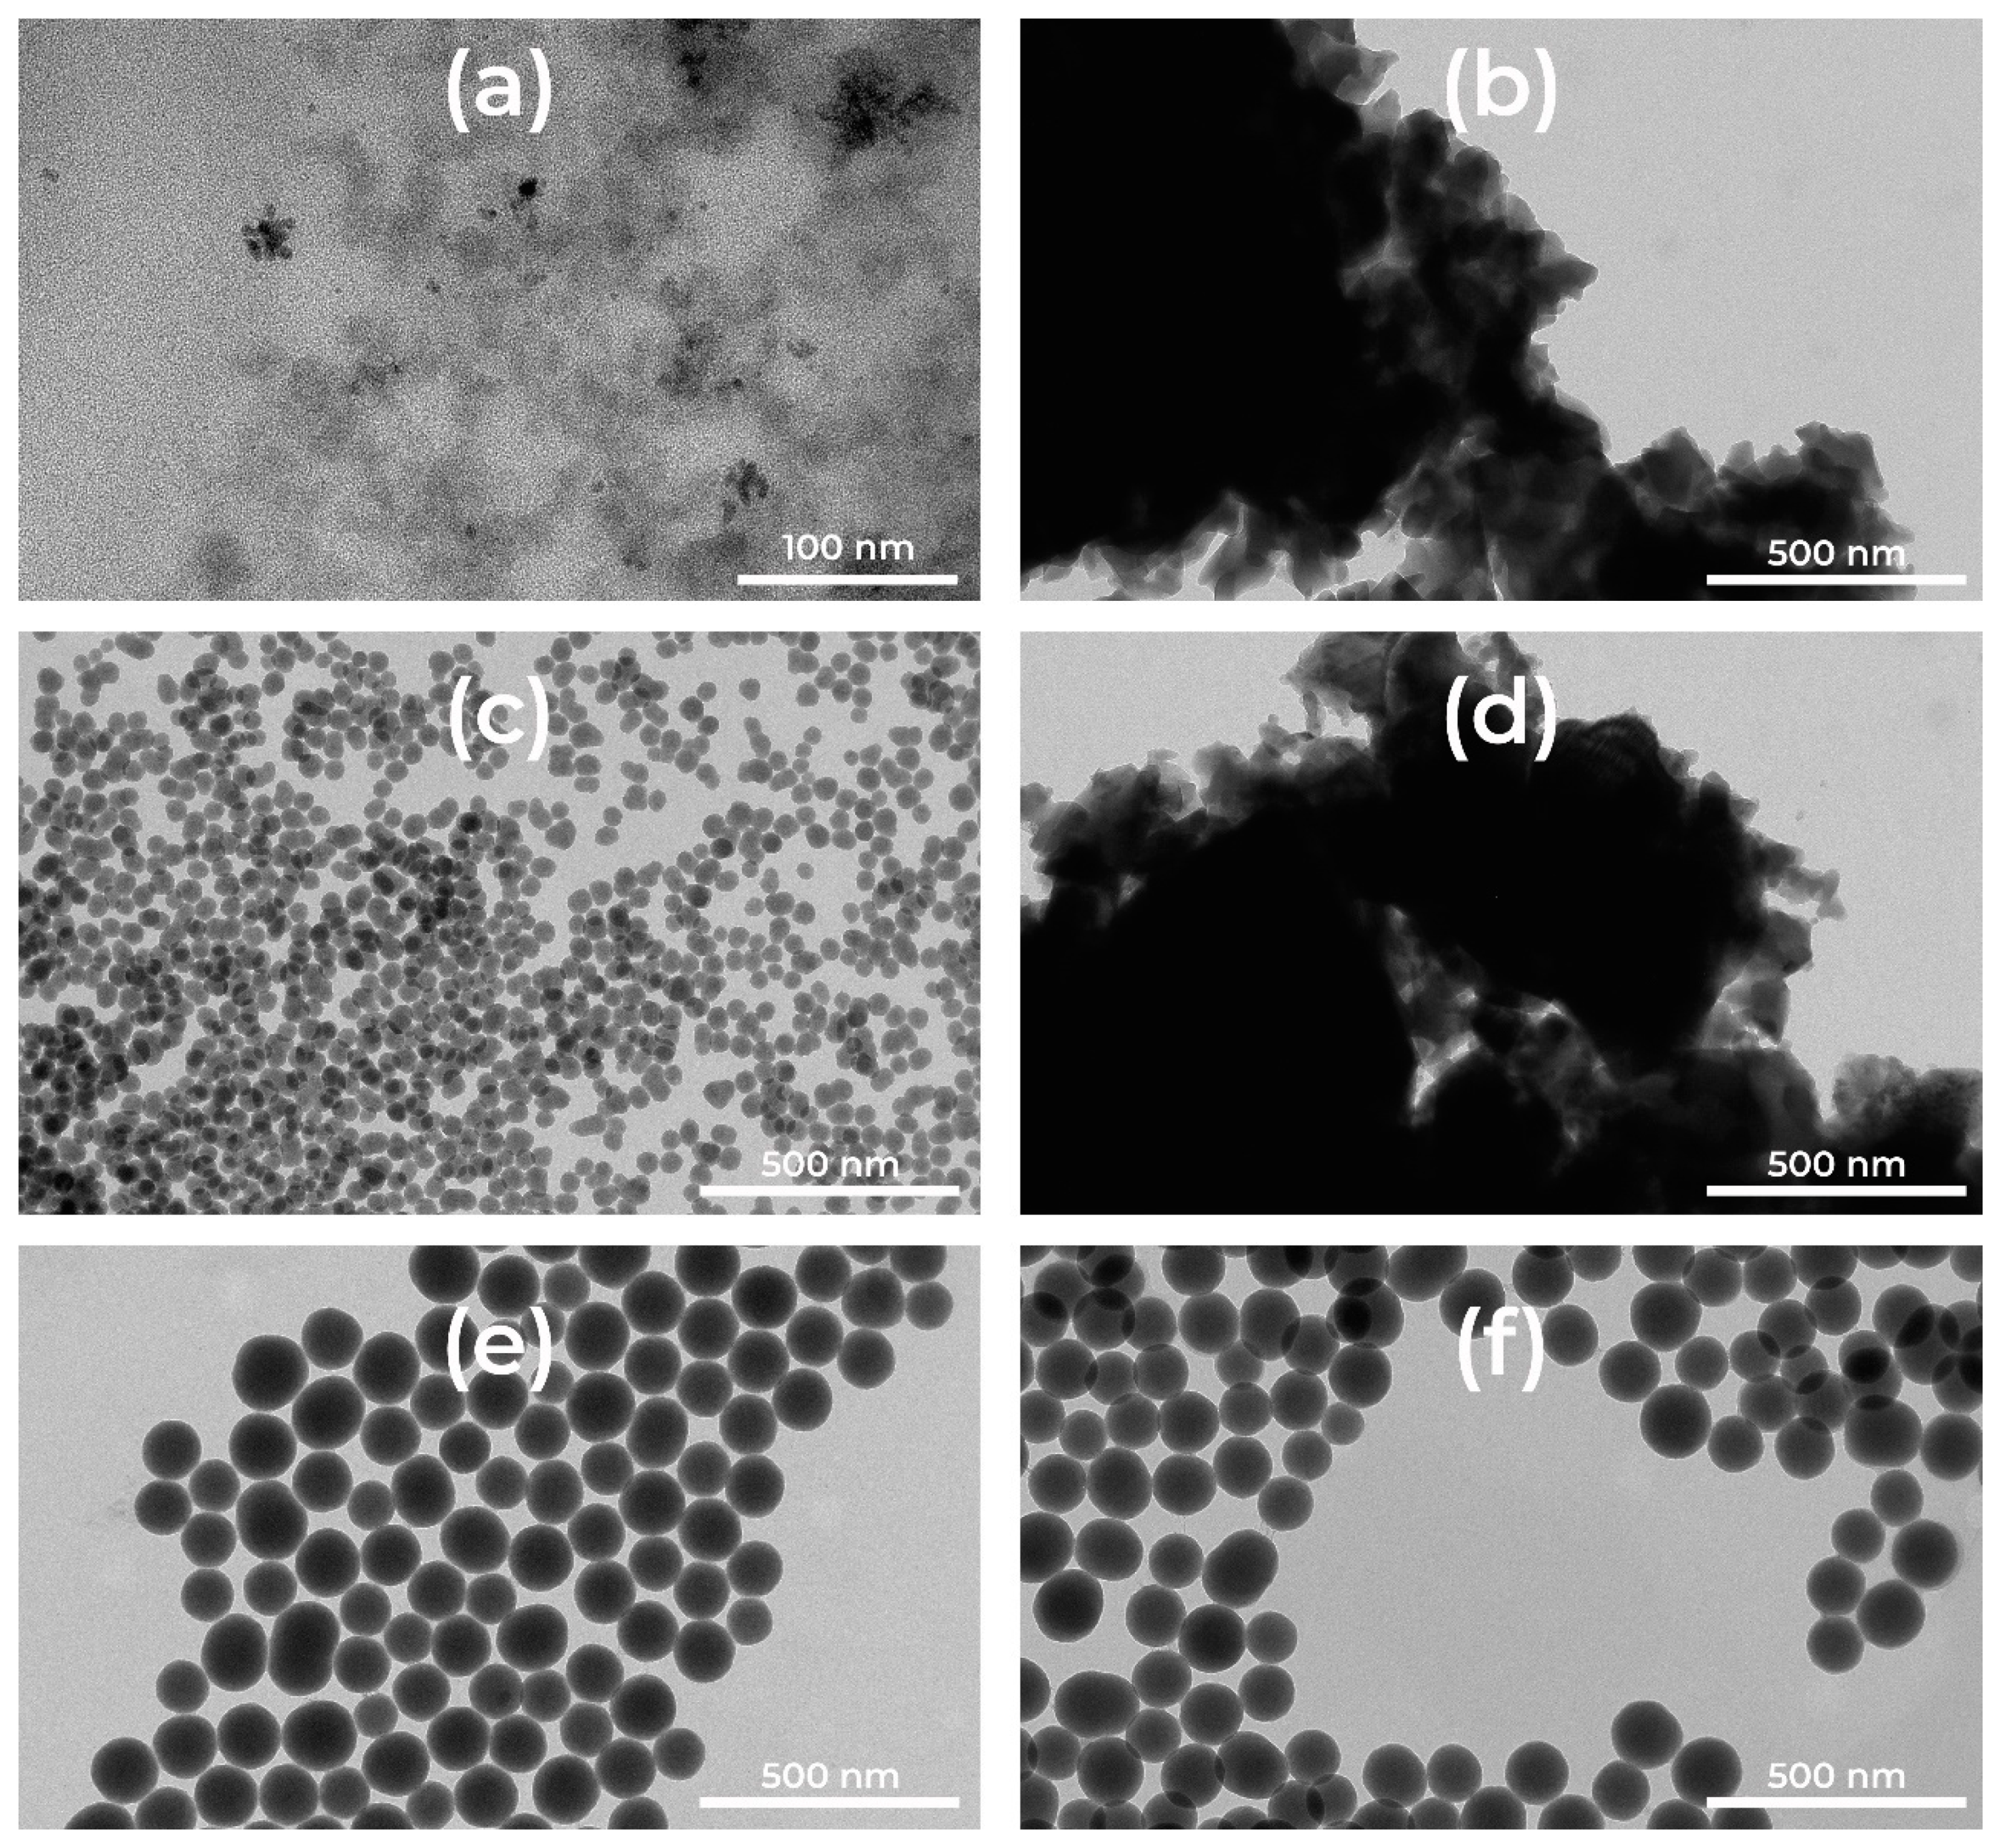
2.1. Synthesis of Europium-Doped 10 nm Silica Nanoparticles by Sol-Gel in Reverse Micro-emulsion
2.2. Synthesis of Europium-Doped 50 nm Silica Nanoparticles by Sol-Gel in Reverse Micro-emulsion
2.3. Synthesis of Europium-Doped 100 nm Silica Nanoparticles by Sol-Gel with Stöber Method
3. Characterization Techniques
4. Results and Discussion
5. Conclusions
Author Contributions
Funding
Institutional Review Board Statement
Informed Consent Statement
Data Availability Statement
Acknowledgments
Conflicts of Interest
References
- Henderson, B.; Imbush, G.F. Optical Spectroscopy of Inorganic Solids; Oxford University Press: Oxford, UK, 1989; p. 658. [Google Scholar]
- Blasse, G.; Grabmaier, B.C. Luminescent Materials; Springer: Berlin/Heidelberg, Germany, 1994; p. 242. [Google Scholar] [CrossRef]
- Binnemans, K. Lanthanide-based luminescent hybrid materials. Chem. Rev. 2009, 109, 4283–4374. [Google Scholar] [CrossRef] [PubMed] [Green Version]
- Dwivedi, Y.; Zilio, S.C. Advances in rare earth spectroscopy and applications. J. Nanosci. Nanotechnol. 2014, 14, 1578–1596. [Google Scholar] [CrossRef] [PubMed] [Green Version]
- Liu, G.; Jacquier, B. Spectroscopic Properties of Rare Earths in Optical Materials; Springer Science & Business Media: Berlin, Germany, 2005; Volume 83, p. 567. [Google Scholar]
- Digonnet, M.J.F. Rare-Earth-Doped Fiber Lasers and Amplifiers, 2nd ed.; CRC Press: New York, NY, USA, 2001; p. 795. [Google Scholar] [CrossRef]
- Ferrari, M.; Campostrini, R.; Carturan, G.; Montagna, M. Spectroscopy of trivalent europium in gel-derived silica glasses. Philos. Mag. B 1992, 65, 251–260. [Google Scholar] [CrossRef]
- Alombert-Goget, G.; Gaumer, N.; Obriot, J.; Rammal, A.; Chaussedent, S.; Monteil, A.; Portales, H.; Chiasera, A.; Ferrari, M. Aluminum effect on photoluminescence properties of sol-gel-derived Eu3+-activated silicate glasses. J. Non Cryst. Solids 2005, 351, 1754–1758. [Google Scholar] [CrossRef] [Green Version]
- Wang, Y.; Huang, L.; Tang, J.; Wang, Y.; Wang, W.; Belfiore, L.A.; Kipper, M.J. Melt spinning fibers of Isotactic polypropylene doped with long-lifetime luminescent inorganic-organic SiO2-Eu3+ hybrid nanoparticles. Mater. Lett. 2017, 204, 31–34. [Google Scholar] [CrossRef]
- Davies, G.-L.; O’Brien, J.; Gun’ko, Y.K. Rare Earth Doped Silica Nanoparticles via Thermolysis of a Single Source Metallasilsesquioxane Precursor. Sci. Rep. 2017, 7, 45862. [Google Scholar] [CrossRef] [Green Version]
- Shi, M.; Xia, L.; Chen, Z.; Lv, F.; Zhu, H.; Wei, F.; Han, S.; Chang, J.; Xiao, Y.; Wu, C. Europium-doped mesoporous silica nanosphere as an immune-modulating osteogenesis/angiogenesis agent. Biomaterials 2017, 144, 176–187. [Google Scholar] [CrossRef]
- Araichimani, P.; Prabu, K.M.; Kumar, G.S.; Karunakaran, G.; Minh, N.V.; Karthi, S.; Girija, E.K.; Kolesnikov, E. Rare-earth ions integrated silica nanoparticles derived from rice husk via microwave-assisted combustion method for bioimaging applications. Ceram. Int. 2020, 46, 18366–18372. [Google Scholar] [CrossRef]
- Hashimoto, T.; Tagaya, M.; Kataoka, T.; Chatani, S.; Inui, M.; Higa, Y.; Motozuka, S. Synthesis and photoluminescence properties of the Eu(III)-containing silica nanoparticles via a mechanochemical solid-state reaction between SiO2 and EuCl3·6H2O. Adv. Powder Technol. 2020, 31, 3650–3656. [Google Scholar] [CrossRef]
- Tagaya, M.; Ikoma, T.; Yoshioka, T.; Motozuka, S.; Xu, Z.; Minami, F.; Tanaka, J. Synthesis and luminescence properties of Eu(III)-doped nanoporous silica spheres. J. Colloid Interface Sci. 2011, 363, 456–464. [Google Scholar] [CrossRef]
- Borak, B.; Krzak, J.; Ptak, M.; Strek, W.; Lukowiak, A. Spherical nanoparticles of europium-doped silica–calcia glass and glass-ceramic: Spectroscopic characterization. J. Mol. Struct. 2018, 1166, 48–53. [Google Scholar] [CrossRef]
- Jia, T.; Ciccione, J.; Jacquet, T.; Maurel, M.; Montheil, T.; Mehdi, A.; Martinez, J.; Eymin, B.; Subra, G.; Coll, J.-L. The presence of PEG on nanoparticles presenting the c[RGDfK]- and/or ATWLPPR peptides deeply affects the RTKs-AKT-GSK3β-eNOS signaling pathway and endothelial cells survival. Int. J. Pharm. 2019, 568, 118507. [Google Scholar] [CrossRef] [PubMed]
- Lifshits, V.G.; Kaverina, I.G.; Korobtsov, V.V.; Saranin, A.A.; Zotov, A.V. Thermal annealing behaviour of Si/SiO2 structures. Thin Solid Film. 1986, 135, 99–105. [Google Scholar] [CrossRef]
- Deal, B.E. The Physics and Chemistry of SiO2 and the Si-SiO2 Interface, 1st ed.; Springer: New York, NY, USA, 1988; p. 570. [Google Scholar] [CrossRef]
- Garnica-Romo, M.G.; Yañez-Limón, J.M.; Villicaña, M.; Pérez-Robles, J.F.; Zamorano-Ulloa, R.; González-Hernandez, J. Structural evolution of sol–gel SiO2 heated glasses containing silver particles. J. Phys. Chem. Solids 2004, 65, 1045–1052. [Google Scholar] [CrossRef]
- Tahiri, N.; Khouchaf, L.; Elaatmani, M.; Louarn, G.; Zegzouti, A.; Daoud, M. Study of the thermal treatment of SiO2 aggregate. IOP Conf. Ser. Mater. Sci. Eng. 2014, 62, 012002. [Google Scholar] [CrossRef] [Green Version]
- Stöber, W.; Fink, A.; Bohn, E. Controlled growth of monodisperse silica spheres in the micron size range. J. Colloid Interface Sci. 1968, 26, 62–69. [Google Scholar] [CrossRef]
- Brinker, C.J.; Scherer, G.W. Sol-Gel Science: The Physics and Chemistry of Sol-Gel Processing; Academic Press: San Diego, CA, USA, 1990; p. 912. [Google Scholar]
- Yang, W.; Zhang, C.G.; Qu, H.Y.; Yang, H.H.; Xu, J.G. Novel fluorescent silica nanoparticle probe for ultrasensitive immunoassays. Anal. Chim. Acta 2004, 503, 163–169. [Google Scholar] [CrossRef]
- Touisni, N.; Kanfar, N.; Ulrich, S.; Dumy, P.; Supuran, C.T.; Mehdi, A.; Winum, J.-Y. Fluorescent Silica Nanoparticles with Multivalent Inhibitory Effects towards Carbonic Anhydrases. Chem. A Eur. J. 2015, 21, 10306–10309. [Google Scholar] [CrossRef]
- Fneich, H.; Gaumer, N.; Chaussedent, S.; Blanc, W.; Mehdi, A. Europium-Doped Sol-Gel SiO2-Based Glasses: Effect of the Europium Source and Content, Magnesium Addition and Thermal Treatment on Their Photoluminescence Properties. Molecules 2018, 23, 1768. [Google Scholar] [CrossRef] [PubMed] [Green Version]
- Tien, C. Introduction to Adsorption, 1st ed.; Tien, C., Ed.; Elsevier: Amsterdam, The Netherlands, 2018; p. 2016. [Google Scholar]
- Tański, T.; Matysiak, W.; Krzemiński, Ł.; Jarka, P.; Gołombek, K. Optical properties of thin fibrous PVP/SiO2 composite mats prepared via the sol-gel and electrospinning methods. Appl. Surf. Sci. 2017, 424, 184–189. [Google Scholar] [CrossRef]
- Zhu, Y.; Zhai, X.; Wang, L. Hydrothermal Synthesis of Ln(OH)3 Nanorods and the Conversion to Ln2O3 (Ln = Eu, Nd, Dy) Nanorods via Annealing Process. J. Nanomater. 2013, 2013, 7. [Google Scholar] [CrossRef]
- Viana, R.D.S.; Falcão, E.H.L.; Dutra, J.D.L.; Costa, N.B.D.; Freire, R.O.; Alves, S. New experimental and theoretical approach in Eu2O3 microspheres: From synthesis to a study of the energy transfer. J. Photochem. Photobiol. A Chem. 2014, 281, 1–7. [Google Scholar] [CrossRef]
- Larkin, P. Infrared and Raman Spectroscopy: Principles and Spectral Interpretation, 2nd ed.; Elsevier: New York, NY, USA, 2017; p. 286. [Google Scholar]
- Bansal, N.P. Sol-Gel Synthesis of Magnesium Oxide-Silicon Dioxide Glass Compositions. J. Am. Ceram. Soc. 1988, 71, 666–672. [Google Scholar] [CrossRef]
- Binnemans, K. Interpretation of Europium(III) spectra. Coord. Chem. Rev. 2015, 295, 1–45. [Google Scholar] [CrossRef] [Green Version]
- Binnemans, K.; Görller-Walrand, C. Application of the Eu3+ ion for site symmetry determination. J. Rare Earths 1996, 14, 173–180. [Google Scholar]
- Görller-Walrand, C.; Fluyt, L.; Ceulemans, A. Magnetic dipole transitions as standards for Judd-Ofelt parametrization in lanthanide spectra. J. Chem. Phys. 1991, 95, 3099–3106. [Google Scholar] [CrossRef]
- Monteil, A.; El-Jouad, M.; Alombert-Goget, G.; Chaussedent, S.; Gaumer, N.; Mahot, A.; Chiasera, A.; Jestin, Y.; Ferrari, M. Relationship between structure and optical properties in rare earth-doped hafnium and silicon oxides: Modeling and spectroscopic measurements. J. Non Cryst. Solids 2008, 354, 4719–4722. [Google Scholar] [CrossRef] [Green Version]
- Jørgensen, C.K.; Judd, B.R. Hypersensitive pseudoquadrupole transitions in lanthanides. Mol. Phys. 1964, 8, 281–290. [Google Scholar] [CrossRef]
- Campostrini, R.; Carturan, G.; Ferrari, M.; Montagna, M.; Pilla, O. Luminescence of Eu3+ ions during thermal densification of SiO2 gel. J. Mater. Res. 1992, 7, 745–753. [Google Scholar] [CrossRef]
- Monteil, A.; Chaussedent, S.; Alombert-Goget, G.; Gaumer, N.; Obriot, J.; Ribeiro, S.J.L.; Messaddeq, Y.; Chiasera, A.; Ferrari, M. Clustering of rare earth in glasses, aluminum effect: Experiments and modeling. J. Non Cryst. Solids 2004, 348, 44–50. [Google Scholar] [CrossRef] [Green Version]
- Chaussedent, S.; Monteil, A. Molecular dynamics simulation of trivalent europium in aqueous solution: A study on the hydration shell structure. J. Chem. Phys. 1996, 105, 6532–6537. [Google Scholar] [CrossRef] [Green Version]
- Nogami, M.; Hayakawa, T. Persistent spectral hole burning of sol-gel-derived Eu3+-doped SiO2 glass. Phys. Rev. B 1997, 56, R14235–R14238. [Google Scholar] [CrossRef]
- Lochhead, M.J.; Bray, K.L. Rare-earth clustering and aluminum codoping in Sol-Gel silica: Investigation using europium(III) fluorescence spectroscopy. Chem. Mater. 1995, 7, 572–577. [Google Scholar] [CrossRef]


| Sample | Size (nm) | Amount of EuCl3.6H2O (mol %) |
|---|---|---|
| SiNP10:0.2Eu | 10 | 0.2 |
| SiNP10:0.5Eu | ~10 | 0.5 |
| SiNP10:1Eu | 10 | 1 |
| SiNP50:0.2Eu | 50 | 0.2 |
| SiNP50:0.5Eu | ~50 | 0.5 |
| SiNP50:1Eu | 50 | 1 |
| SiNP100:0.2Eu | 100 | 0.2 |
| SiNP100:0.5Eu | ~100 | 0.5 |
| SiNP100:1Eu | 100 | 1 |
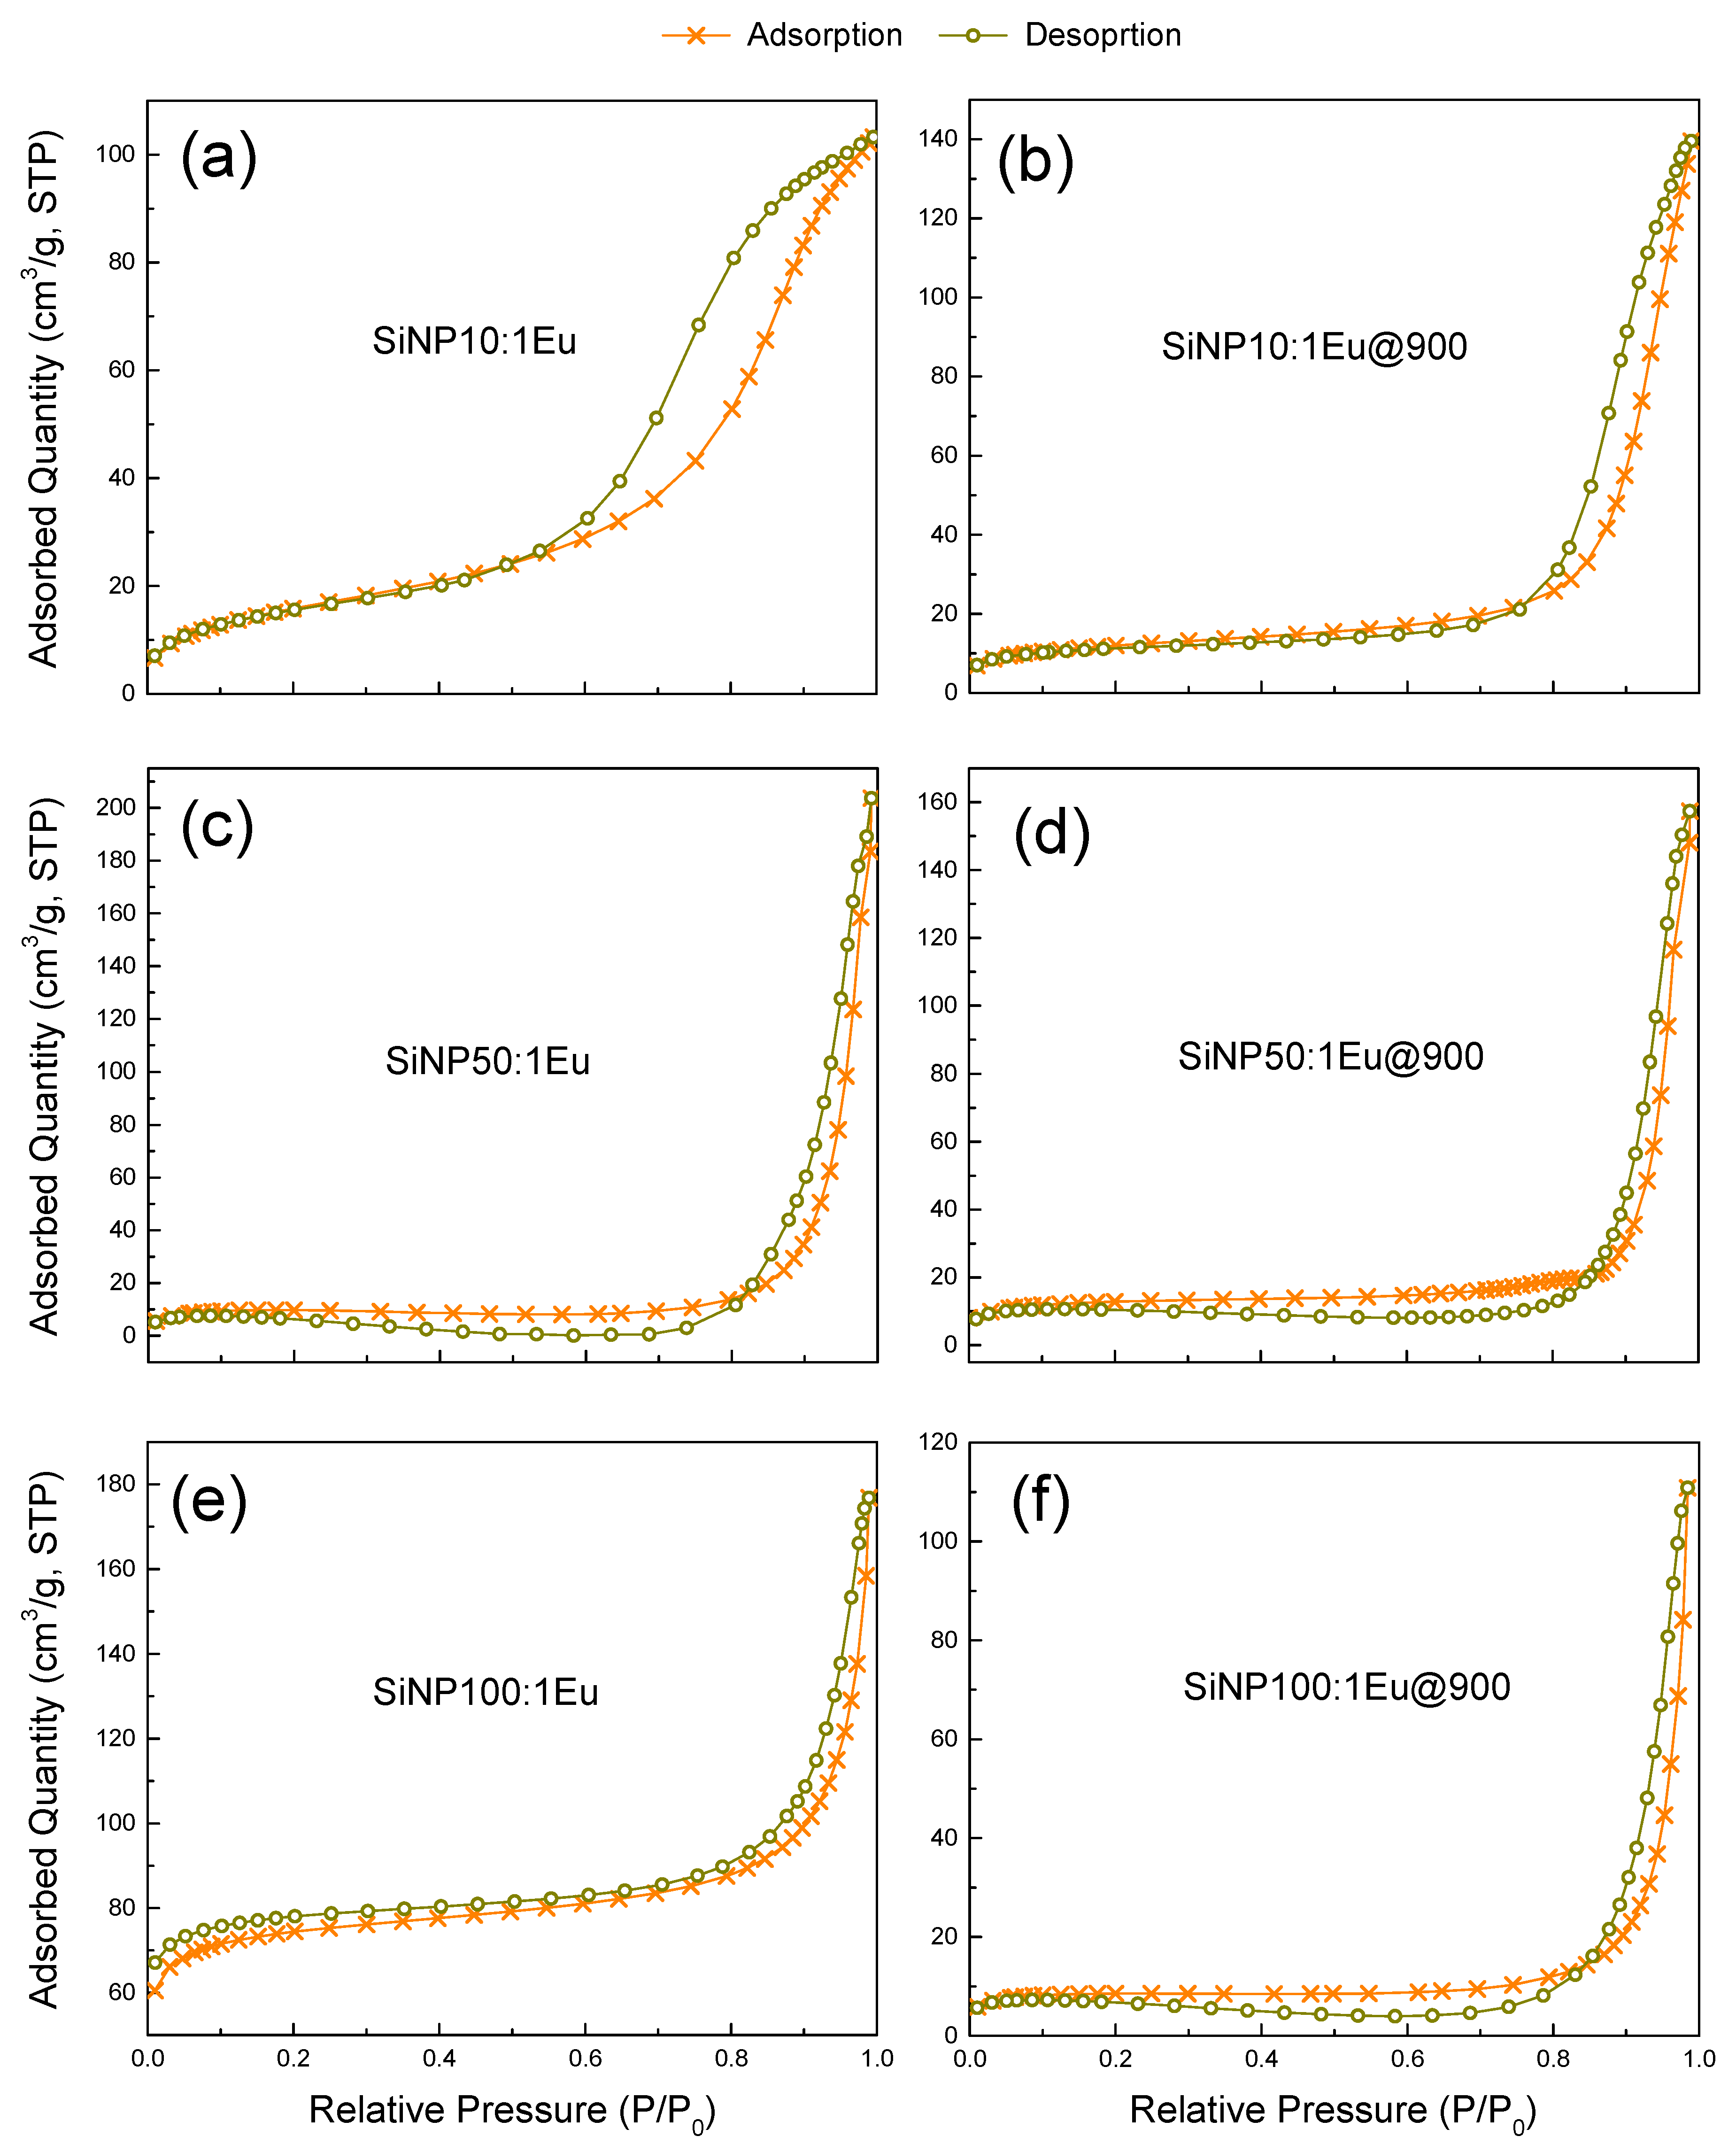
| Sample | BET Surface Area (m2/g) | Pore Volume (cm3/g) |
|---|---|---|
| SiNP10:1Eu | 58 | 0.16 |
| SiNP10:1Eu@900 | 41 | 0.22 |
| SiNP50:1Eu | 55 | 0.27 |
| SiNP50:1Eu@900 | 41 | 0.23 |
| SiNP100:1Eu | 232 | 0.18 |
| SiNP100:1Eu@900 | 26 | 0.16 |
| SiO2:1Eu | 334 | 0.32 |
| SiO2:1Eu@900 | 213 | 0.09 |
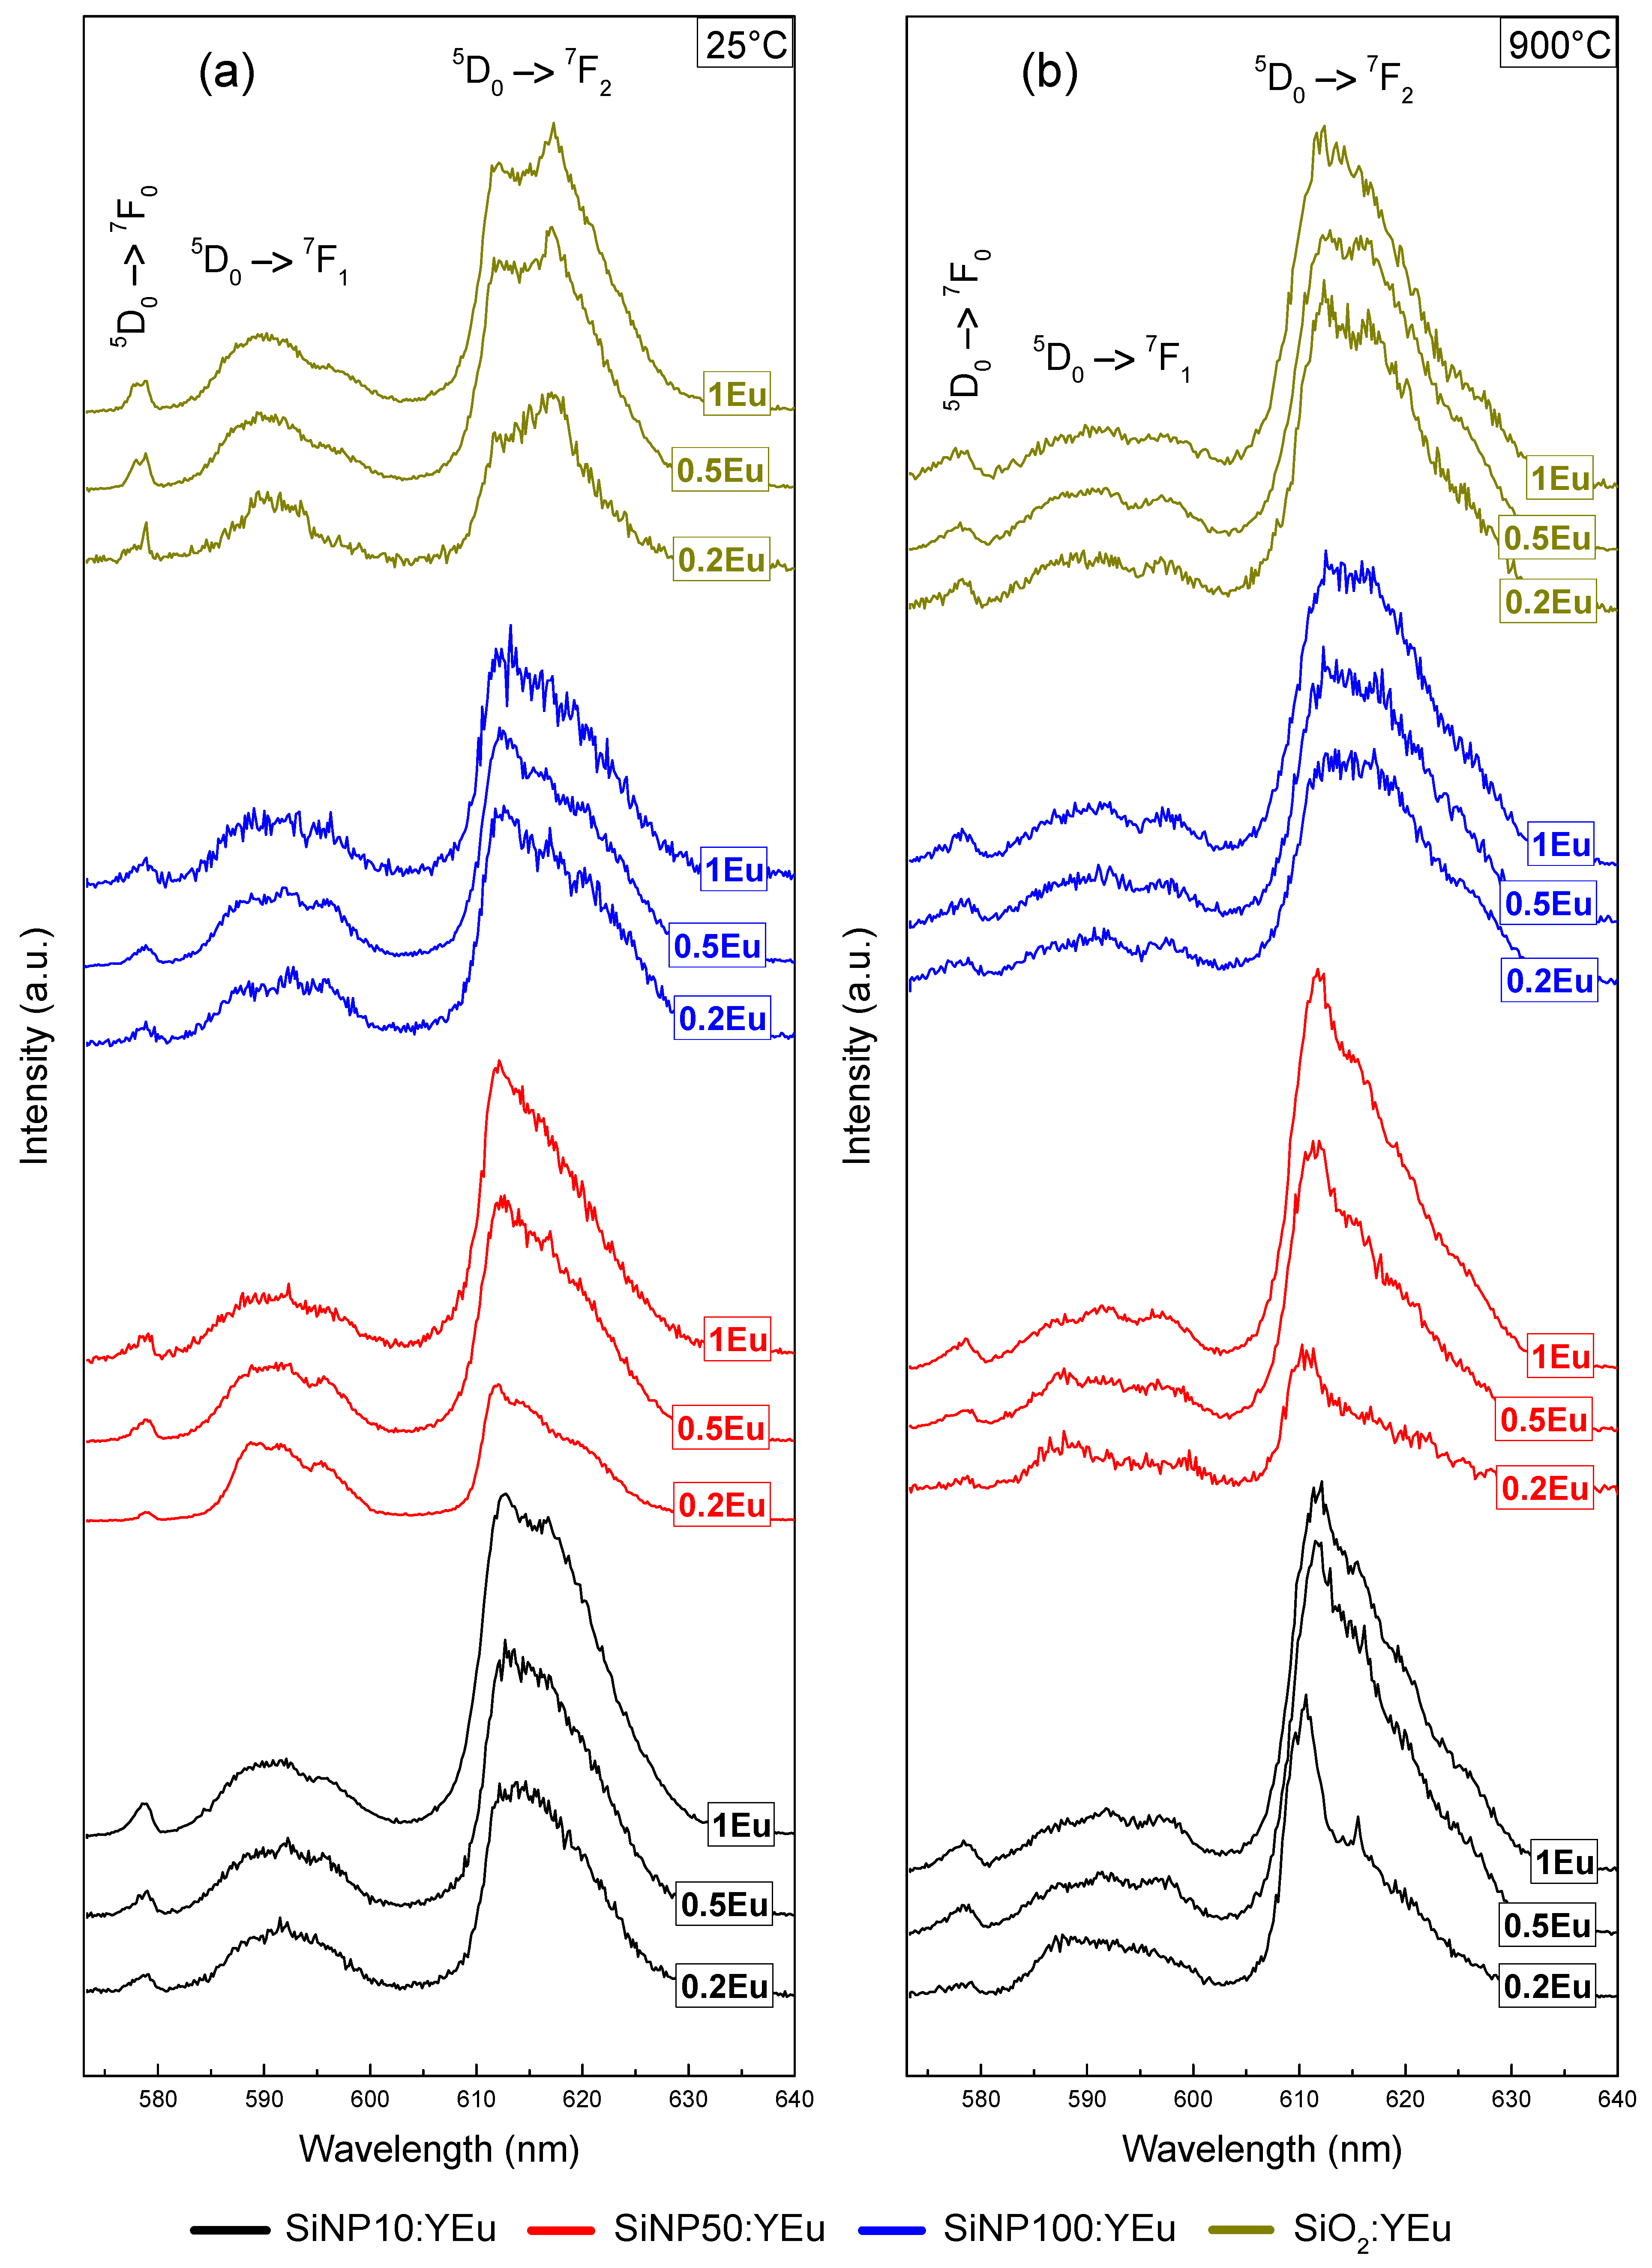
| Sample | Y (%Eu) | R before T.T. | R after T.T. |
|---|---|---|---|
| 0.2 | 2.72 | 4.81 | |
| SiNP10:YEu | 0.5 | 3.51 | 6.26 |
| 1 | 4.35 | 6.21 | |
| 0.2 | 1.73 | 2.38 | |
| SiNP50:YEu | 0.5 | 3.12 | 4.62 |
| 1 | 3.82 | 6.35 | |
| 0.2 | 3.03 | 3.84 | |
| SiNP100:YEu | 0.5 | 3.02 | 4.47 |
| 1 | 3.31 | 5.01 | |
| 0.2 | 2.25 | 5.31 | |
| SiO2:YEu | 0.5 | 3.34 | 5.09 |
| 1 | 3.66 | 5.76 |
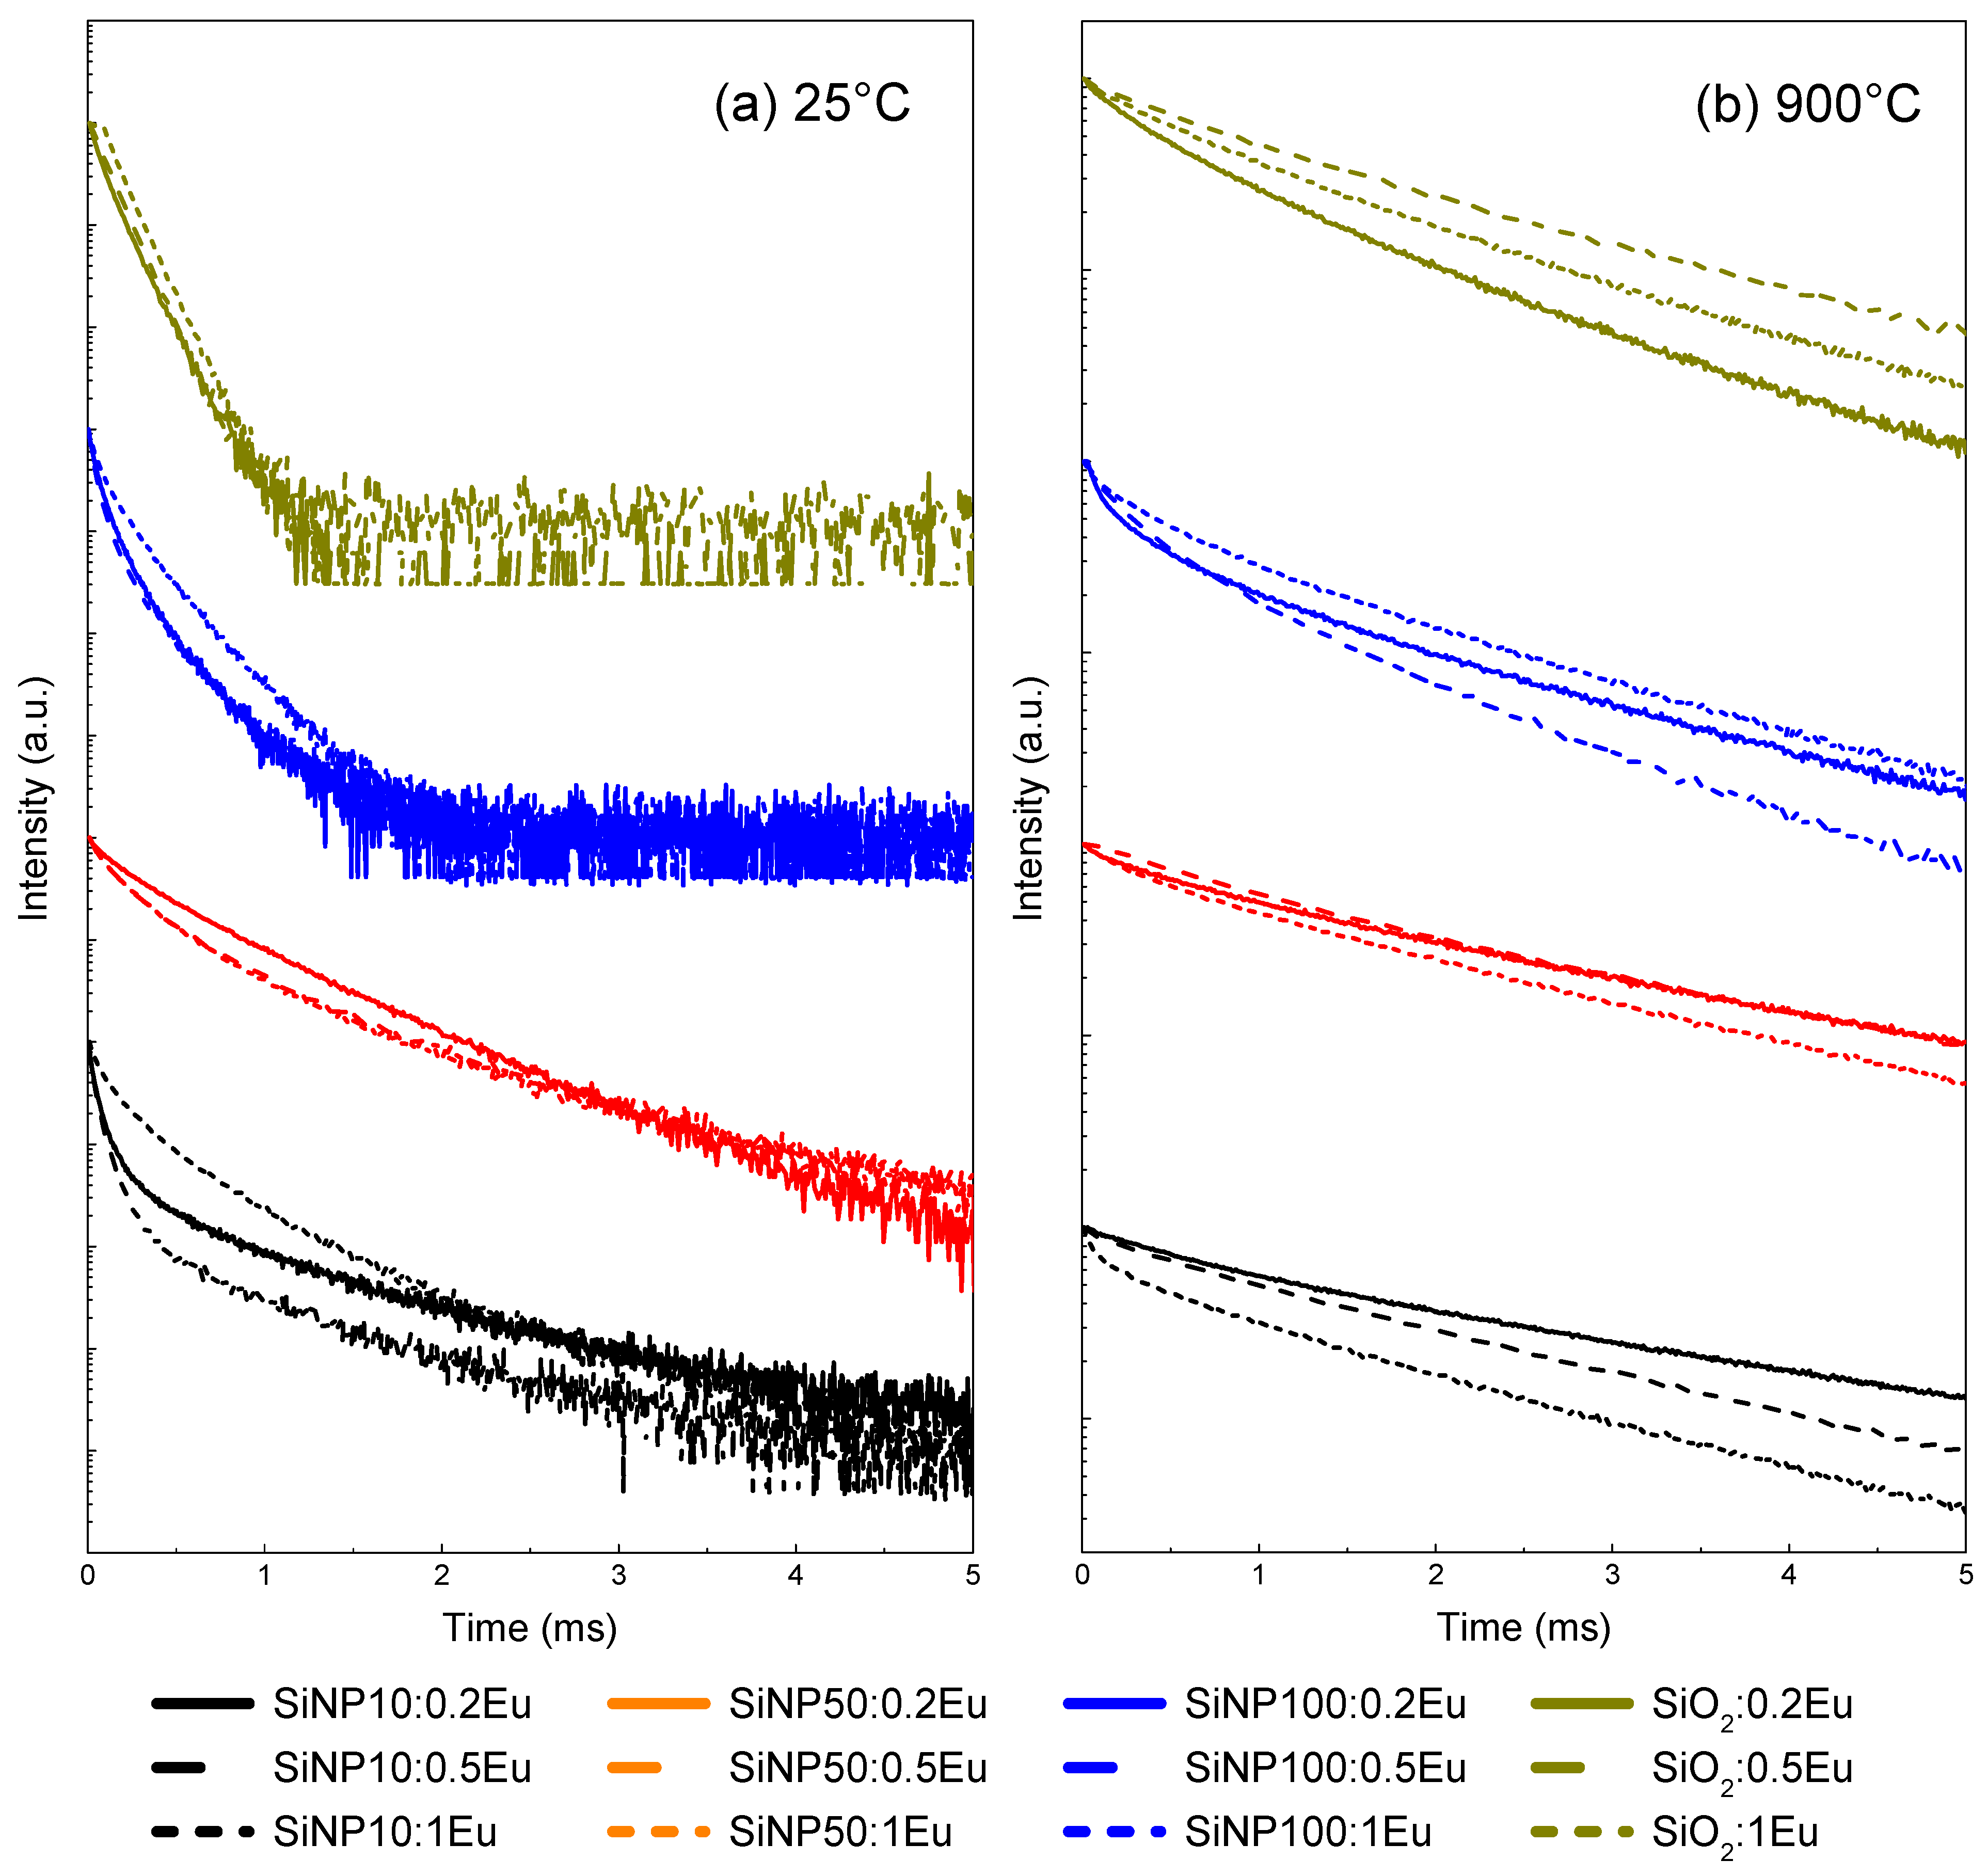
| Sample | Y (%Eu) | τ (ms) before T.T. | τ (ms) after T.T. |
|---|---|---|---|
| 0.2 | 0.26 | 4.81 | |
| SiNP10:YEu | 0.5 | 0.15 | 6.26 |
| 1 | 0.32 | 6.21 | |
| 0.2 | 0.45 | 2.38 | |
| SiNP50:YEu | 0.5 | 0.39 | 4.62 |
| 1 | 0.37 | 6.35 | |
| 0.2 | 0.11 | 3.84 | |
| SiNP100:YEu | 0.5 | 0.11 | 4.47 |
| 1 | 0.16 | 5.01 | |
| 0.2 | 0.11 | 5.31 | |
| SiO2:YEu | 0.5 | 0.12 | 5.09 |
| 1 | 0.13 | 5.76 |
Publisher’s Note: MDPI stays neutral with regard to jurisdictional claims in published maps and institutional affiliations. |
© 2021 by the authors. Licensee MDPI, Basel, Switzerland. This article is an open access article distributed under the terms and conditions of the Creative Commons Attribution (CC BY) license (http://creativecommons.org/licenses/by/4.0/).
Share and Cite
Fneich, H.; Gaumer, N.; Chaussedent, S.; Mehdi, A.; Blanc, W. The Effect of Size and Thermal Treatment on the Photoluminescent Properties of Europium-Doped SiO2 Nanoparticles Prepared in One Pot by Sol-Gel. Materials 2021, 14, 1607. https://0-doi-org.brum.beds.ac.uk/10.3390/ma14071607
Fneich H, Gaumer N, Chaussedent S, Mehdi A, Blanc W. The Effect of Size and Thermal Treatment on the Photoluminescent Properties of Europium-Doped SiO2 Nanoparticles Prepared in One Pot by Sol-Gel. Materials. 2021; 14(7):1607. https://0-doi-org.brum.beds.ac.uk/10.3390/ma14071607
Chicago/Turabian StyleFneich, Hussein, Nathalie Gaumer, Stéphane Chaussedent, Ahmad Mehdi, and Wilfried Blanc. 2021. "The Effect of Size and Thermal Treatment on the Photoluminescent Properties of Europium-Doped SiO2 Nanoparticles Prepared in One Pot by Sol-Gel" Materials 14, no. 7: 1607. https://0-doi-org.brum.beds.ac.uk/10.3390/ma14071607